
Comparison of Properties for Selected Experimental Set-Ups Dedicated to Measuring Thermal Parameters of Power LEDs †


1
Department of Marine Electronics, Gdynia Maritime University, ul.Morska 83, 81-225 Gdynia, Poland
2
Department of Microelectronics and Computer Science, Technical University of Łódź, Wólczańska 221, 93-005 Łódź, Poland
*
Author to whom correspondence should be addressed.
†
This paper is an extended version of our paper published in the Proceedings of 27th International Conference Mixed Design of Integrated Circuits and Systems MIXDES 2020, Łódź, Poland, 25–27 June 2020.
Energies 2021, 14(11), 3240; https://doi.org/10.3390/en14113240
Submission received: 29 April 2021
/
Revised: 28 May 2021
/
Accepted: 28 May 2021
/
Published: 1 June 2021
(This article belongs to the Special Issue Selected Papers from 27th International Conference on Mixed Design of Integrated Circuits and Systems – MIXDES 2020)
Abstract
:This article compares properties of two measurement set-ups dedicated to determining thermal parameters of power LEDs. The standard T3Ster set-up and the custom set-up developed in Gdynia Maritime University are considered. Both set-ups are described and the used measurement procedure is presented. The manner of measurement of optical power of the tested LEDs is also described. The method of measuring transfer transient thermal impedances between thermally coupled power LEDs using both set-ups is proposed. The measurement results of the mentioned parameters obtained with these set-ups for selected power LEDs are compared and discussed. Certain properties of software operating with both the considered measuring set-ups are also analyzed.
1. Introduction
Power LEDs (light emitting diodes) are a basic component of modern lighting systems [1,2]. LED operating parameters, such as the emitted luminous flux, strongly depend on temperature [3,4,5]. The internal temperature of semiconductor devices, including LEDs, is the sum of ambient temperature and an increase of this temperature caused by thermal phenomena [5,6]. The value of this increase depends on the power losses in the considered device, on the power dissipated in the other semiconductor devices situated on the common substrate with the tested device, and on the efficiency of generated heat removal in these devices. This efficiency is characterised by such thermal parameters as the steady state thermal resistance Rth, transient thermal impedance Zth(t), and transfer transient thermal impedances Ztht(t) between the tested device and other devices thermally coupled with the tested one [7,8,9,10,11].
The values of semiconductor device thermal parameters depend on cooling conditions of these devices, which change depending on the applied cooling system [12,13,14]. Therefore, in order to characterise thermal properties of semiconductor devices operating under certain cooling conditions it is indispensable to measure thermal parameters of such devices.
In the case of power LEDs the classical thermal resistance measurement method is described in the JEDEC norm [15]. This norm also contains a description of measurement set-ups rendering possible the implementation of this method. The T3Ster measurement system compliant with the norm [16] is used, among others, in the Department of Microelectronics and Computer Science (DMCS) at the Łódź University of Technology, Poland. However, such equipment is relatively expensive and is not commonly used in the academia. Therefore, in Gdynia Maritime University (GMU), Poland, a custom set-up for measurement of power LED thermal parameters was developed. The measurement results obtained employing this set-up have already been described in, e.g., [14,16,17]. However, in these papers the measurements were taken only in free cooling conditions. In turn, the T3Ster measurement set-up available at the DMCS does not have a function for measuring optical power of the emitted light, but knowledge of this power is indispensable to determining the thermal resistance of power LEDs. Therefore, in the standard version of this equipment only electric thermal resistance can be measured using this set-up. The dedicated software provided with the considered measurement set-ups also renders possible the estimation of compact thermal model parameters for the considered devices. Such models have already been described in [6,12,18].
Papers [14,17,19,20,21] present selected measurement results obtained using both considered set-ups. Paper [21] compares the results of measurements of transient thermal impedance of selected LEDs containing single semiconductor structures obtained with the use of both set-ups. However, LED light sources containing more semiconductor dies placed in a common housing [22] or on a common substrate [10,18,23] are often used. Thermal couplings characterized by mutual thermal impedances Ztht(t) occur between these dies.
Paper [23] presents the results of measurements illustrating a dependence of MCE diode assembly with and without a thermal pad on thermal and optical parameters of this device. However, the properties of only a single semiconductor die were considered. The results shown in the cited paper prove that the use of a thermal pad allows the increase in junction temperature of the tested device due to self-heating to be limited. On the other hand, an increase in ambient temperature causes a decrease in the emitted luminous flux by up to 30% when changing this temperature in the range from 10 to 90 °C.
In the current paper, which is an extended version of [21], a description of both considered measurement set-ups is provided. In comparison to the cited paper, in the current paper the method of transfer thermal impedance measurement between power LEDs situated in the common case is described. Additionally, the manner of measuring optical and electrical parameters of the tested devices using both set-ups is discussed. The results of measurements illustrating an influence of temperature on electrical and optical parameters are shown. The main part of the results describes thermal parameters of selected power LEDs. The obtained results of measurements are compared and the usefulness of both systems to perform measurements of thermal parameters of the considered class of semiconductor devices is evaluated. Some properties of the software dedicated for control of each of the considered set-ups are illustrated by computation results.
2. Measurement Set-Ups
According to the standard given in [5,15], optical and thermal parameters of power LEDs are measured simultaneously using the set-up described in Figure 1. The examined device is situated in the photometric sphere, on the heat-sink, with the use of the system of forced fluidic cooling of the examined LED. The main advantage of this method is a possibility of simultaneous measurements of junction temperature Tj, the value of luminous flux ΦV, forward current IF, and forward voltage VF. In turn, a disadvantage of the used method is a necessity of using expensive instrumentation, such as a photometric sphere and the forced cooling system of power LEDs.
2.1. T3Ster Set-Up
The measurement equipment available at the DMCS is a commercially available transient thermal tester T3Ster ® manufactured by Siemens EDA ®. This tester renders possible registration of electronic system dynamic temperature responses with sub-microsecond time resolution. Usually, the temperature-sensitive parameter is a voltage drop across a p-n junction or a thermistor measured for a constant current value forced by the tester [24]. According to the principles of the network identification by deconvolution (NID) method, temperature measurements are taken at the time instants equidistant on the logarithmic time scale, typically 20 samples per decade. The software implementing the NID method, together with the tester, offers the entire range of thermal analysis tools, such as thermal time constant spectra, cumulative structure functions, and Nyquist plots of transient thermal impedance.
The described method is dedicated to measuring thermal parameters of typical semiconductor devices, e.g., p-n diodes, and the standard version of this system is not equipped with instruments which make it possible to measure optical parameters of power LEDs. Therefore, one can measure with this system only electric thermal resistance defined in the JEDEC standard [16]. While this parameter is measured, the influence of optical power on the results of measurements is neglected. While measuring thermal resistance of the considered class of semiconductor devices, a thermal chamber which is light-tight and a radiometer are additionally used. This thermal resistance Rth is measured using the formula and the method of determining optical power described in the paper [19].
The results of measurements performed using the described set-up are input data for the MASTER software. This software makes it possible to analyze these results and estimate values of parameters describing a compact thermal model of the tested device.
The considered measuring set-up has a modular structure, which means that it can be expanded as required for measurements. In the variant used by the authors, two A/D converter modules were used, which enable simultaneous recording of voltage waveforms in two points of the measuring set-up. Owing to this, it was possible to measure transfer-transient thermal impedances between two LEDs placed in a common housing.
During these measurements, power is dissipated only in a diode called a heater and operating in the measurement set-up shown in Figure 1. The other diode—called the sensor—is forward biased by low current. The increase in sensor temperature is caused only by mutual thermal coupling with the heater. Voltage VS(t) at the sensor is registered synchronously with voltage VD(t) at the heater. Based on the recorded voltage waveform VS(t) and the previously measured thermometric characteristic, the waveform Ztht(t) is determined.
2.2. Custom Set-Up
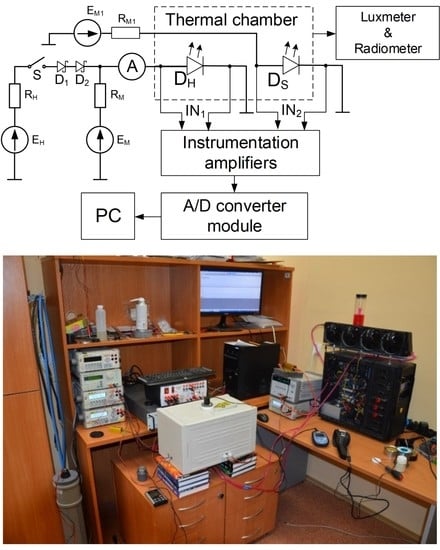
Measurements of thermal and optical parameters of power LEDs can be performed with the use of the custom measuring set-up developed at GMU. The diagram of this set-up is shown in Figure 2. This set-up makes it possible to measure self and transfer transient thermal impedances of the tested diodes, illuminance, and power density on the surface irradiated by the emitted light. During the measurements the tested diodes are situated in the light-tight and thermal chamber. A luxmeter is used to measure illuminance and a radiometer is used to measure power density of the emitted light.
The self-transient thermal impedance Zth(t) of diode DH is measured using the indirect electrical method described in [20]. In this method the voltage drop VD across diode DH for a fixed value IM of its forward current is used as the thermo-sensitive parameter. The fixed value of current IM is obtained using the voltage source EM with the resistor RM, whereas heating current IH flowing through the tested diode is produced by the voltage source EH with the resistor RH. The switch S is closed while heating the tested diodes, whereas it is opened while cooling them. Waveforms of the forward voltage of the tested LED are recorded using instrumentation amplifiers, the A/D converter module, and a PC, whereas an ammeter is used to measure the heating current.
The transfer transient thermal impedance Zth(t) between diodes DH and DS is measured simultaneously with the self-transient thermal impedance of diode DH. Diode DS is forward biased by current IM1 of a low and constant value. This power is supplied to the diode by the voltage source EM1 through the resistor RM1. The waveform of forward voltage of this diode is measured and recorded with the use of instrumentation amplifiers, the A/D converter module, and a PC.
Measurements of self and transfer transient thermal impedances are realised in four steps. At first, the thermometric characteristics of diodes DH and DS are measured. These characteristics describe the dependence of the diode forward voltage VD on temperature. In this step of measurements, the switch S is opened and current IM flows through diode DH, whereas current IM1 flows through diode DS. In the second step, the switch S is closed and current IH flows through diode DH causing an increase in the value of its junction temperature as the result of self-heating phenomena and an increase in junction temperature of diode DS due to mutual thermal couplings. Because of the temperature increase, the diodes’ forward voltages change and their values are measured by the computer containing an A/D converter and measuring-amplifiers. In the thermally steady-state the value of current IH, diode DH forward voltage VH, and power density of the emitted light Ie are measured. In the third step the switch S is opened at the time t = 0 and the cooling of diode DH begins. In this step the A/D converter measures the waveforms of diode DH forward voltage VL(t) at current IM and diode DS forward voltage VLS(t) until the steady state is obtained. Finally, the waveforms of self-transient thermal impedance Zth(t) of diode DH and transfer transient thermal impedance Ztht(t) between diodes DH and DS are calculated using the following formulae:
where αT and αTS denote a slope of the thermometric characteristic of DH and DS, respectively, and Pth denotes heating power of diode DH. Obviously, in the steady state the impedances, Zth(t) and Ztht(t) are equal to the respective thermal resistances Rth and Rtht.
For power LEDs the heating power is equal to the difference between electrical power Pe taken from the power grid and the optical power Popt emitted by the tested diode in the form of light. The method for determining the optical power Popt is described in the following subsection.
In the presented measurement set-up, it is possible to measure thermal parameters of LEDs both with free convection cooling and with forced liquid cooling. In the case of forced cooling, a special liquid cooling system, Alphacool [25], is used. It is equipped with heat exchangers, to which the tested diodes are attached [26]. This system made it possible to cool the power LED to room temperature, which did not exceed 25 °C during the measurements. The system contains the cooler, which has four fans. DDC310 pumps with the compensation reservoir pumped the cooling factor; its temperature was close to ambient temperature. Additionally, the temperature of the liquid influent and effluent from the heat exchanger were monitor using thermo-gauges installed on the input and the output of this heat exchanger. The flow of the cooling liquid was controlled using a sensor of the Flow 200. An Aquaero 6 driver is used to control this system. During the measurements a cold plate with the dimensions 58 mm × 58 mm was used.
2.3. Determination of Optical Power
In [19], the authors propose a simple method for determining the optical power emitted by tested LEDs. According to this method the optical power density Ie is measured by means of the radiometer situated within a distance r from the surface of the LED. Additionally, the spatial emission characteristics of a tested diode given by the manufacturer is needed. This characteristic presents the dependence of relative luminous intensity on the angle of observation α and is approximated with the use a square function. Using this characteristic the average value Iavg of luminous intensity is calculated in the range of the emission angle from −α to α. Finally, the optical power is determined using the below-presented formula. The usefulness of this method was demonstrated in [19,20] for selected types of power LEDs.
Table 1 summarises advantages and disadvantages of the custom set-up. The main advantage of this set-up are low measurement errors, low price, the possibility of measuring both self and transfer thermal parameters of tested diodes, and the possibility of measurements of optical power without a photometric sphere. The main disadvantages of this set-up are lack of software estimating structure functions and the continuous spectra of thermal time constants. The measurement procedure is different to that described in the JEDEC standard and time-consuming process of determining optical power.
3. Tested Power LEDs
Properties of the mentioned measurement set-ups were tested for different types of power LEDs. In [21] some examples of the results of investigations performed for three different diodes produced by Cree Co. are presented and results of measurements of properties of the MCE power LED, including four independent dies, are presented and discussed.
Values of selected parameters of the tested diodes are shown in Table 2 [22,27,28], whereas views of the tested diodes and the MCPCB for MCE diode are shown in Figure 3.
As can be seen, the admissible electric power of the tested LEDs was in the range from 2.8 to 10 W and the emitted luminous flux at forward current IF = 0.35 A changed from 100 to 341 lm. Such a big difference in the values of the mentioned parameters is a result of different area of these diodes. It is worth observing that for the diode MCE the values of the total power Ptot and the emitted luminous flux ΦV for four dies was lower than the product of the number f and values of these parameters for one die.
As ca be seen, all the considered LEDs were mounted on MCPCBs. During the measurements two types of cooling conditions of these diodes were taken into account. These measurements were performed for diodes situated on the heat-sink of dimensions 175 × 118 × 10 mm and without any heat-sink. The dimensions of the MCE diode housing were 7.5 × 7 × 4.5 mm, and the size of the thermal pad was 5.4 × 2.6 mm.
4. Results
The results illustrating the properties of both measurement set-ups for the selected LEDs are presented in [21]. This section additionally focuses on the investigations of mutual thermal couplings in the MCE diode containing four dies in a common housing. Using both measurement set-ups thermal parameters of the tested power LEDs were determined. The results of these measurements are presented in Figure 4, Figure 5, Figure 6, Figure 7, Figure 8, Figure 9, Figure 10, Figure 11, Figure 12 and Figure 13. In all these figures the results obtained with the T3Ster by Mentor Graphics are represented with solid lines, whereas the results obtained with the custom set-up are represented with dashed lines. The measurements were performed for all the considered diodes operating in both types of cooling conditions, i.e., operation of the tested device in free air and on a cold plate.
Table 3 and Table 4 shows the thermal power, optical power, and thermal resistance of the tested diodes operating in both considered types of cooling conditions. It can be seen that the optical power was comparable with the thermal power and neglecting this fact while determining waveforms of transient thermal impedance can cause measurement errors even up to 30%.
As it can be observed, in all the considered cases, the results of measurements obtained with the use of both set-ups were nearly the same. At the steady state, the values of Zth(t) measured with both set-ups were practically indistinguishable. Small differences were observed only in the range of low values of time. They did not exceeded 1 K/W. For diodes situated on the heat-sink, the higher values of Zth(t) were obtained with the use of the T3Ster set-up, whereas for diodes operating without any heat-sink the higher values of this parameter were obtained for the authors’ set-up.
Comparing the results of measurements obtained for both types of cooling conditions, it can be seen that using a big heat-sink reduced values of thermal resistance of all the diodes by 50% (for diode XPE) and even by 66% (for diode XML). It also increased the value of time indispensable to obtain the steady state.
In Figure 5 the structure functions of the tested LEDs operating in both types of cooling conditions are shown. These structure functions were obtained with the use of the MASTER software.
This function presents the dependence between the cumulated thermal resistance Rth and the cumulated thermal capacitance Cth. It could be observed that for the diodes situated on the heat-sink, the cumulated thermal resistance was smaller and the cumulated thermal capacitance was bigger than for the diodes operating without any heat-sink. For the results obtained with the use of the custom set-up more thermal capacitances were observed than for the T3Ster set-up.
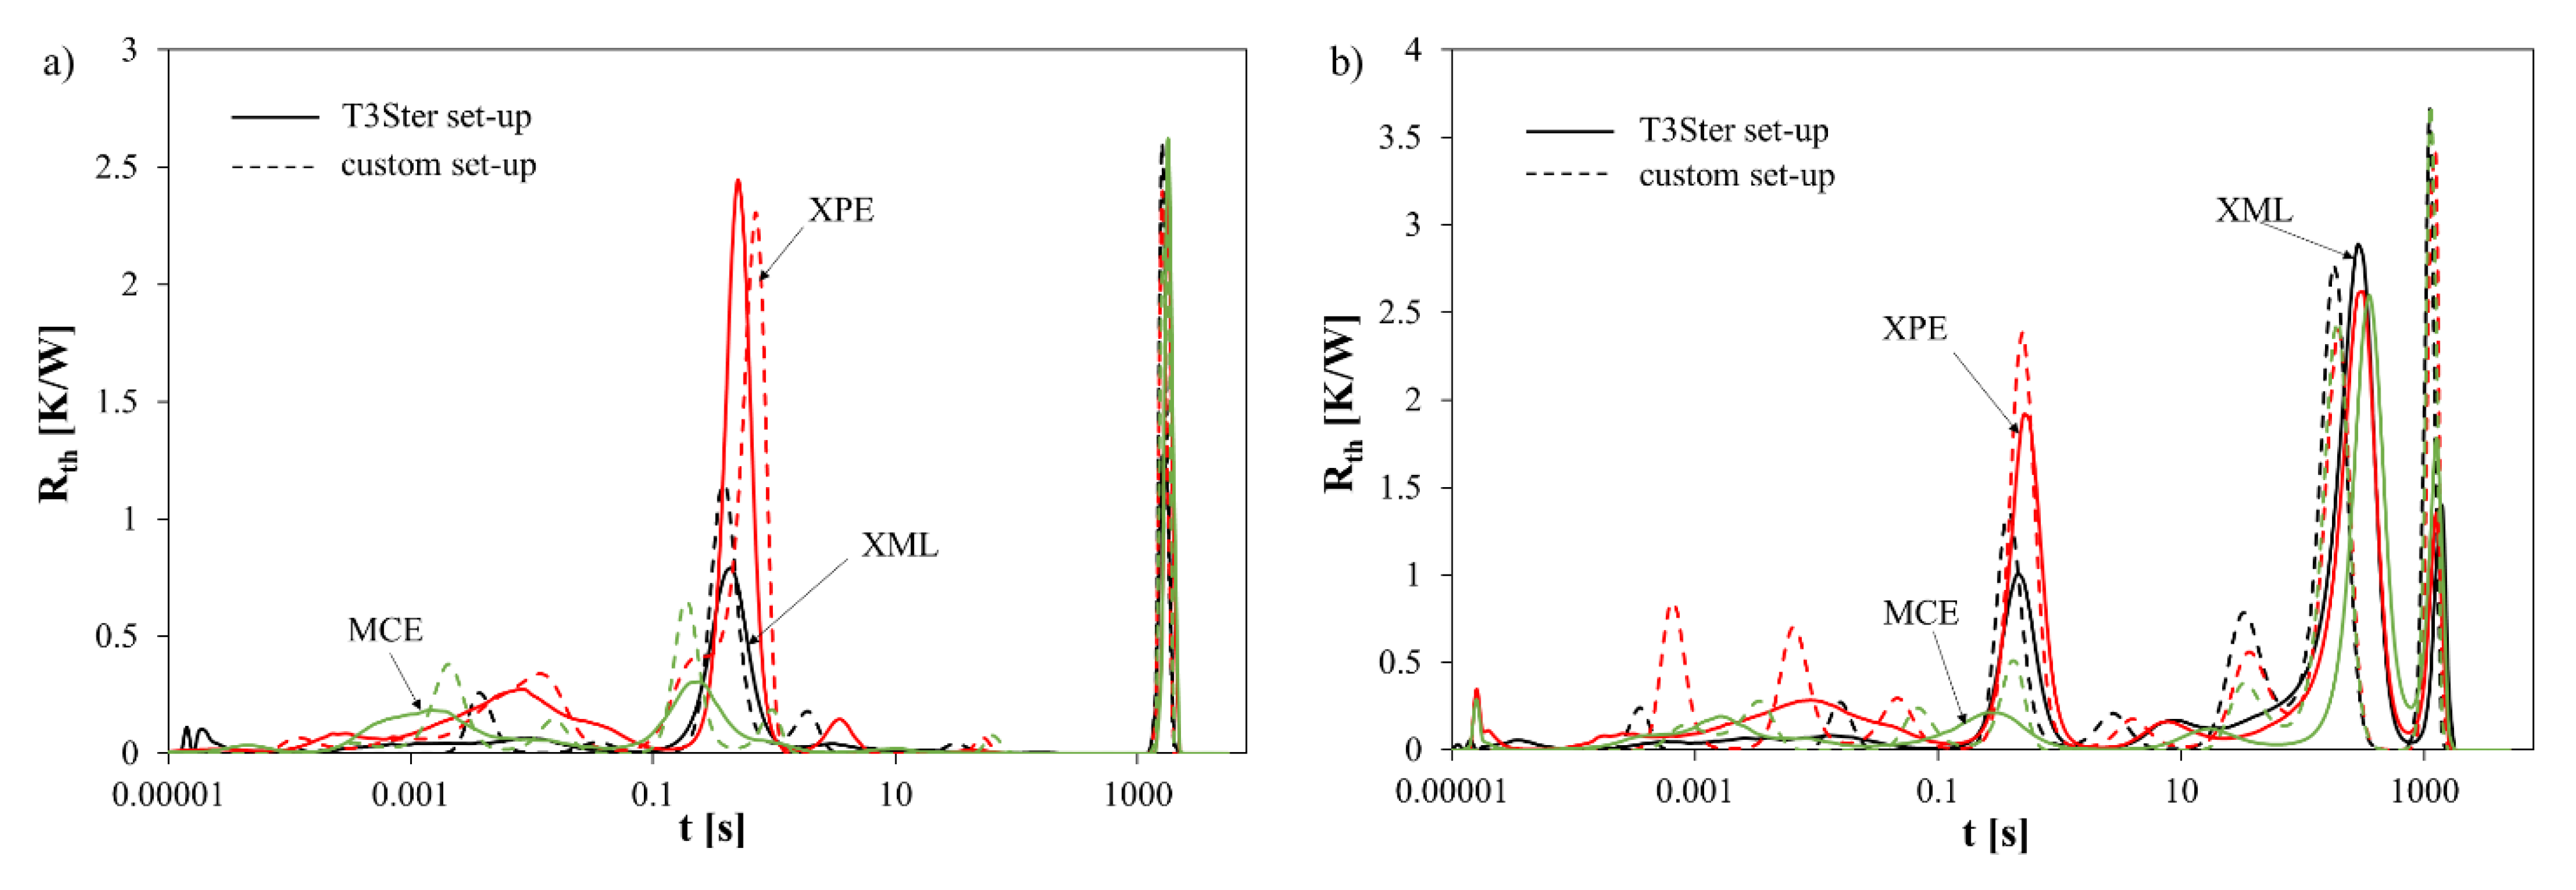
The mentioned, MASTER software also makes it possible to determine the spectrum of thermal time constants. Such spectra for the tested LEDs are shown in Figure 6.
It is easy to see that the longest thermal time constants obtained with the T3Step set-up were nearly the same as with the authors’ set-up. Differences were visible in the range of low values of thermal time constants below 1 s.
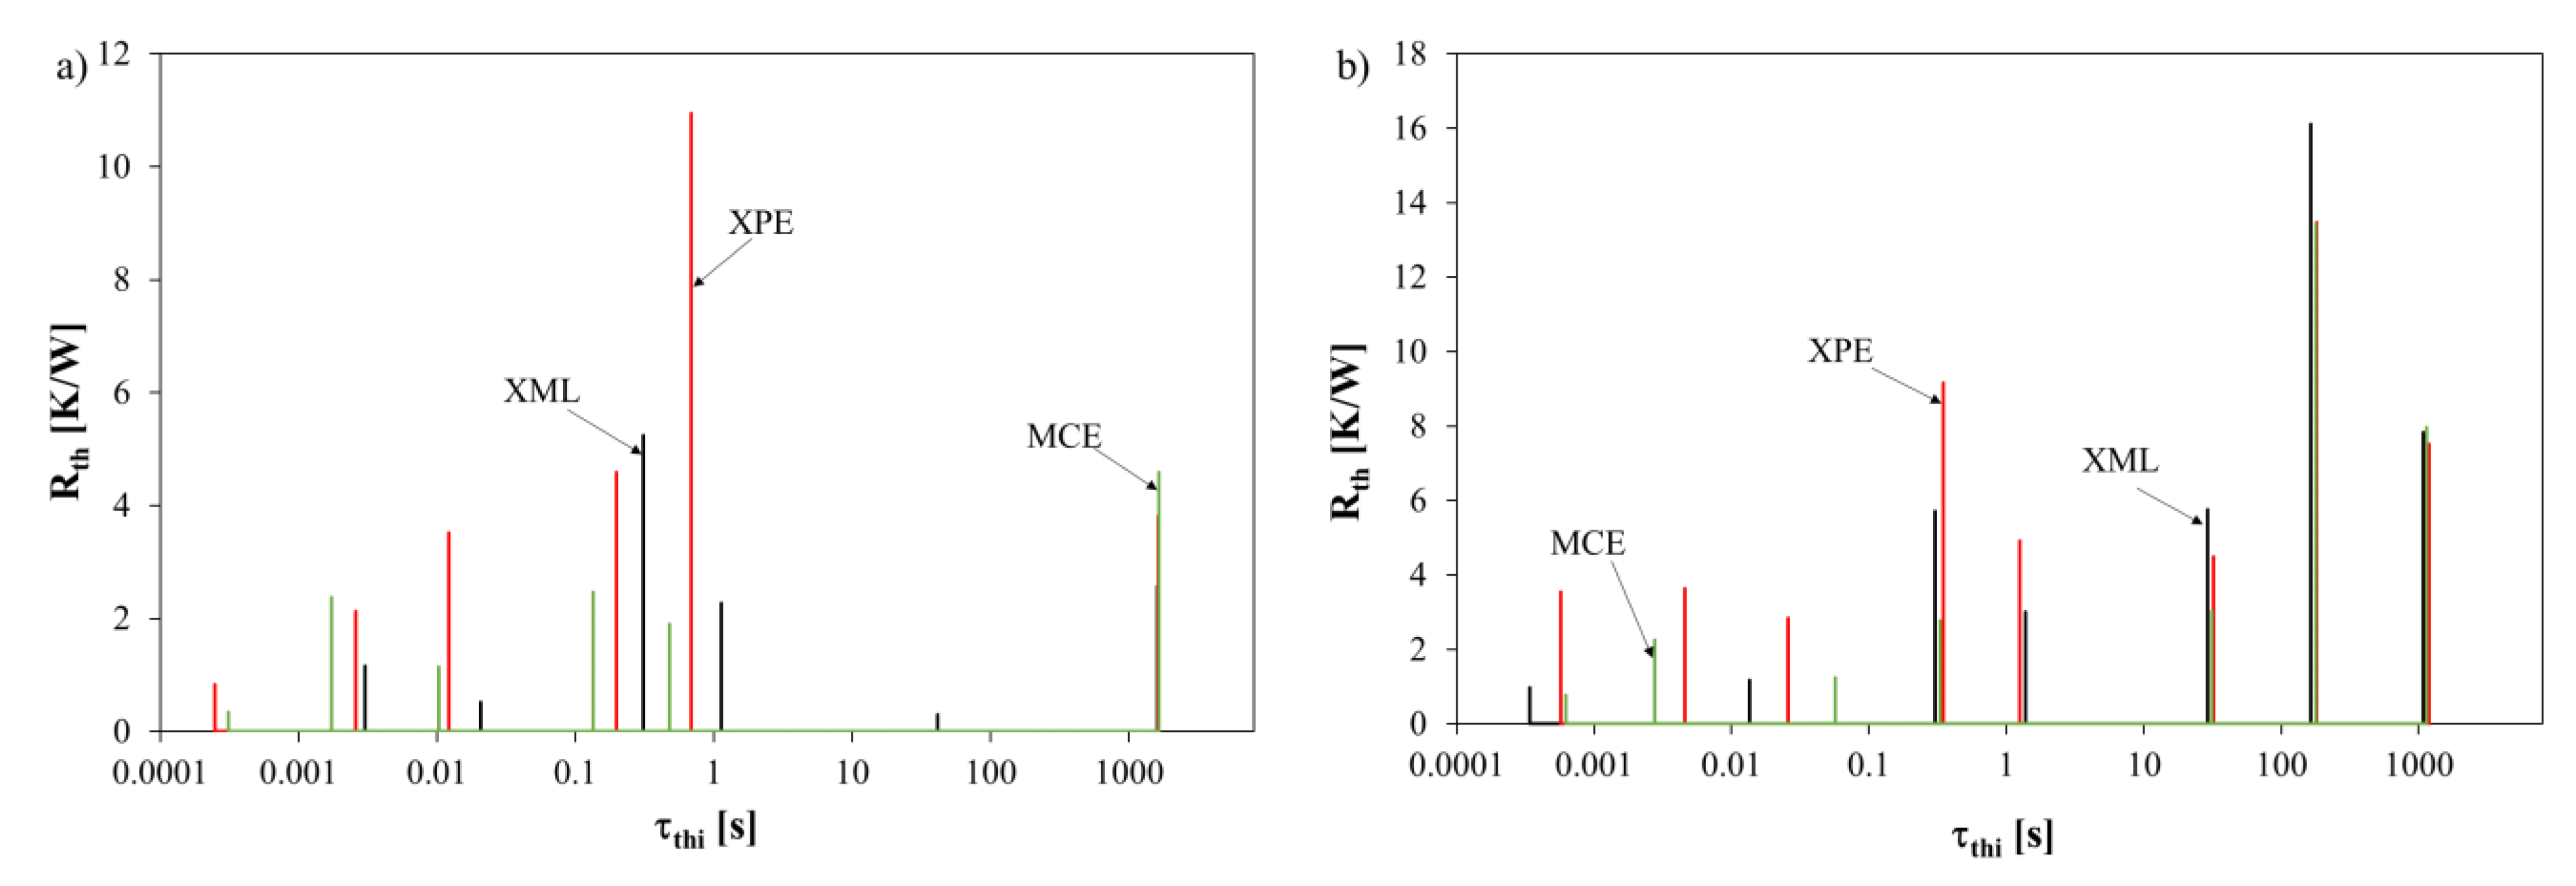
It is worth noticing that spectra presented in Figure 6 are continuous functions. However, in the classical description of transient thermal impedance of semiconductor devices, discrete values of thermal time constants τthi exist. Such a classical description of transient thermal impedance has the following form [12,29]
where N is the number of thermal time constants and ai are coefficients corresponding to thermal time constants τthi.
The values of parameters appearing in Equation (4) were estimated using the ESTYM software elaborated at GMU and described, e.g., in [12,30]. Input data for this software are the results of measurements performed with the use of the authors’ set-up. Spectra of thermal time constants obtained for the tested diodes using the ESTYM software are shown in Figure 7.
The obtained results of measurements and estimations show that in order to describe thermal properties of the tested diodes the use of five thermal time constants was indispensable for LEDs situated on a heat-sink, and even eight thermal time constants for LEDs operating without any heat-sink.
Figure 4, Figure 5, Figure 6 and Figure 7 illustrate thermal properties of single power LED dies. The further part of this section presents the results of investigations illustrating self-heating phenomena and mutual thermal couplings between the dies of the LEDs contained in a common housing with a common lens. The following figures show the measured waveforms of self and transfer transient thermal impedances for the considered MCE diode operating at various cooling conditions. In these figures, the red lines refer to the diodes operating at free convection air cooling, and the blue lines refer to the diodes located on the cold plate.
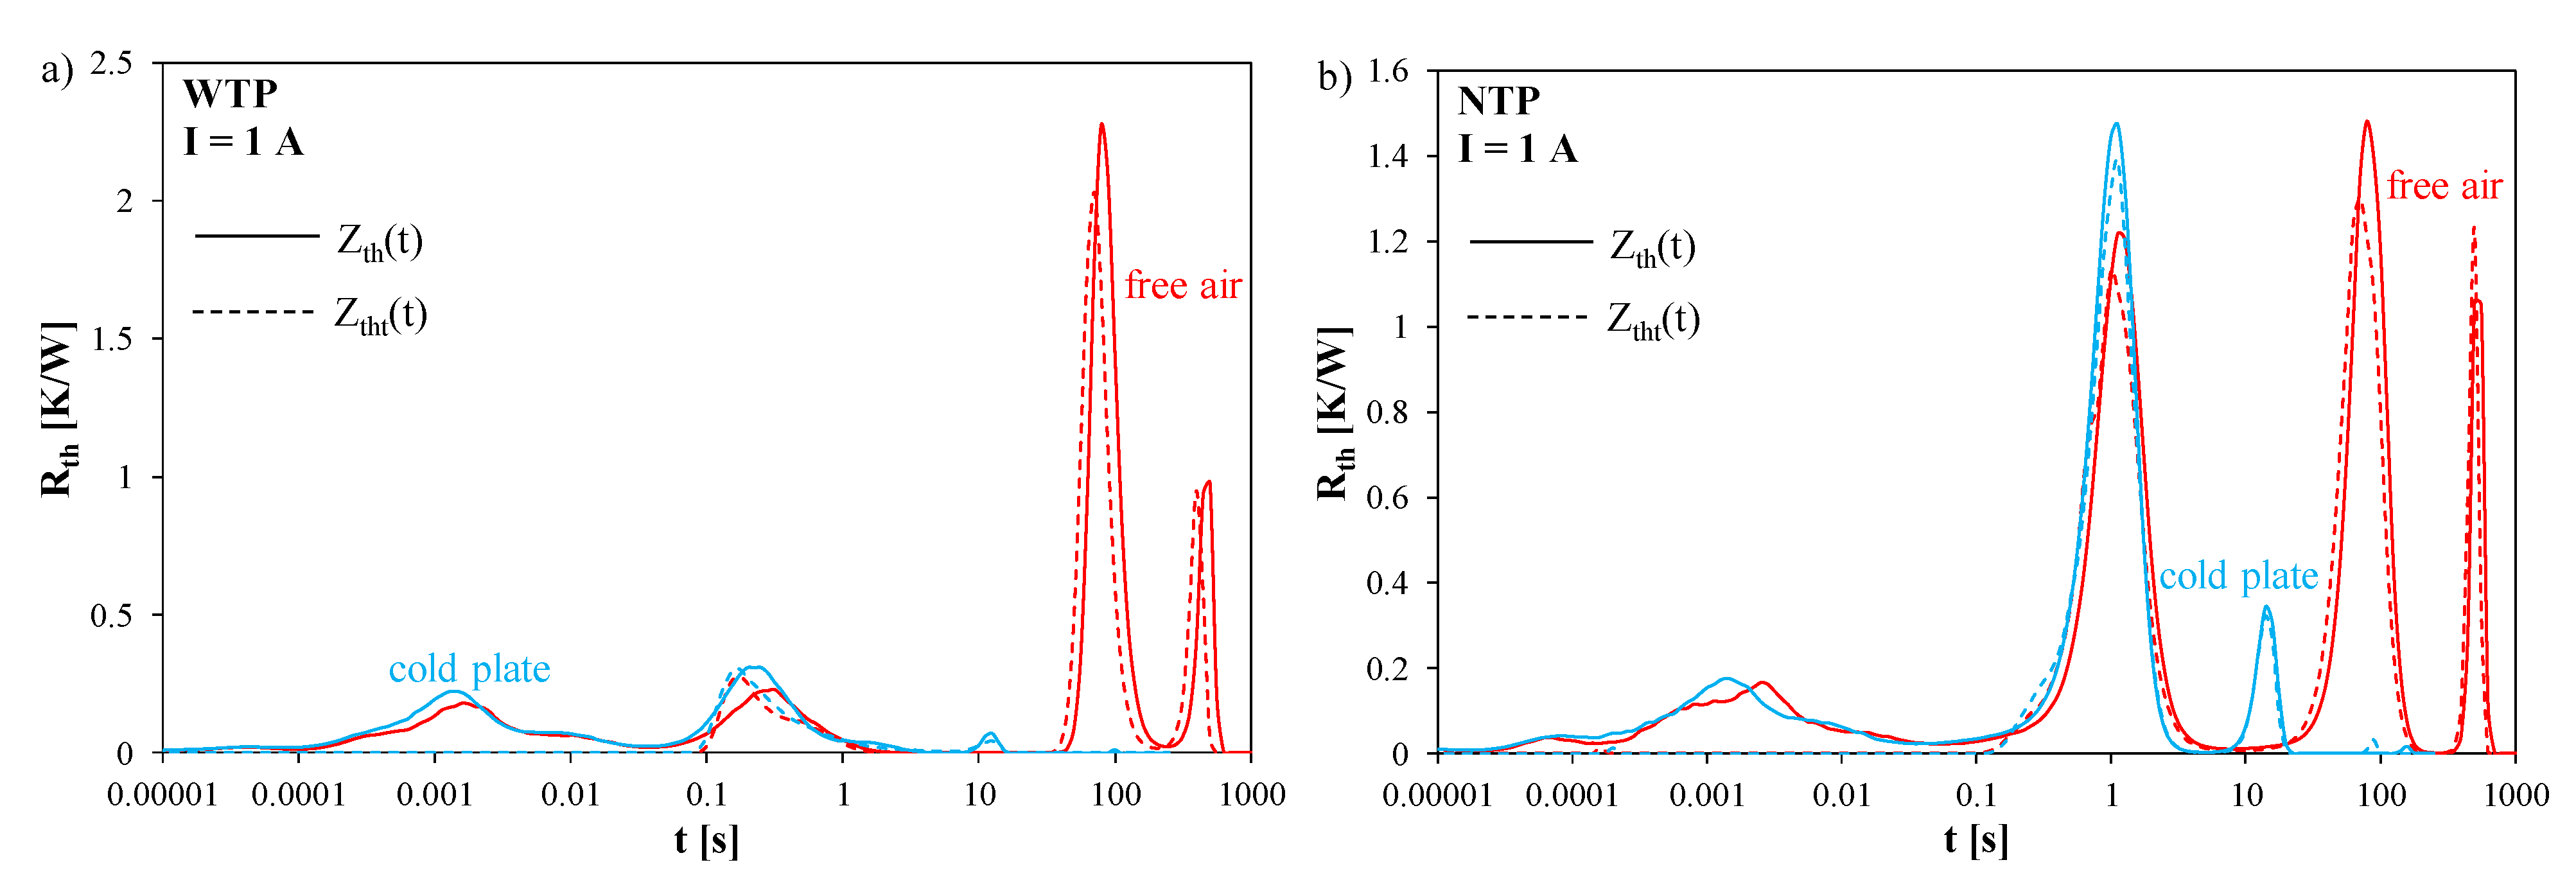
Figure 8 shows the measured waveforms of self and transfer transient thermal impedances of diode D1 and between diodes D1 and D3 contained in the MCE measured by the T3Ster set-up. Figure 8a shows the results obtained for the device with a soldered thermal pad (WTP), whereas Figure 8b shows the results without a thermal pad (NTP). The measurements were made for the tested device placed in free convection air cooling and on a cold plate.
When analyzing waveforms Zth(t) and Ztht(t), it can be seen that waveforms Ztht(t) had lower values at the thermal steady state, and these waveforms increased with a delay of about 10 ms. It is worth noting that for the device WTP the values of Zth(t) and Ztht(t) at the steady state were even more than 30% lower than for the device NTP. Comparing the results obtained for the diodes operating at free convection air cooling and on the cold plate, it is easy to notice that the values at the steady state for the diodes on the cold plate were much lower than at free convection air cooling, while the time necessary to obtain the steady state was over a hundred times shorter.
In turn, Figure 9 illustrates the measured waveforms of self and transfer transient thermal impedances of the investigated MCE devices obtained with the custom measurement set-up. It can be seen that the results obtained with the custom set-up were very close to the results obtained with the T3Ster set-up. Due to the fact that the tested semiconductor dies were placed in a common housing, the differences between the values of Zth(t) and Ztht(t) did not exceed 10%.
Figure 10 shows the spectra of thermal time constants obtained using the measured waveforms Zth(t) and Ztht(t) and determined with the MASTER software supplied with the T3Ster set-up. The influence of the thermal pad on the obtained measurement results is clearly visible. The spectral line corresponding to the time equal to 1 s for the diode NTP mounted on the cold plate is particularly distinct. For the diodes operating at free convection air cooling, the spectral lines in time range of 100 ÷ 500 s dominate. The dominant spectral lines have similar values for Zth(t) and Ztht(t).
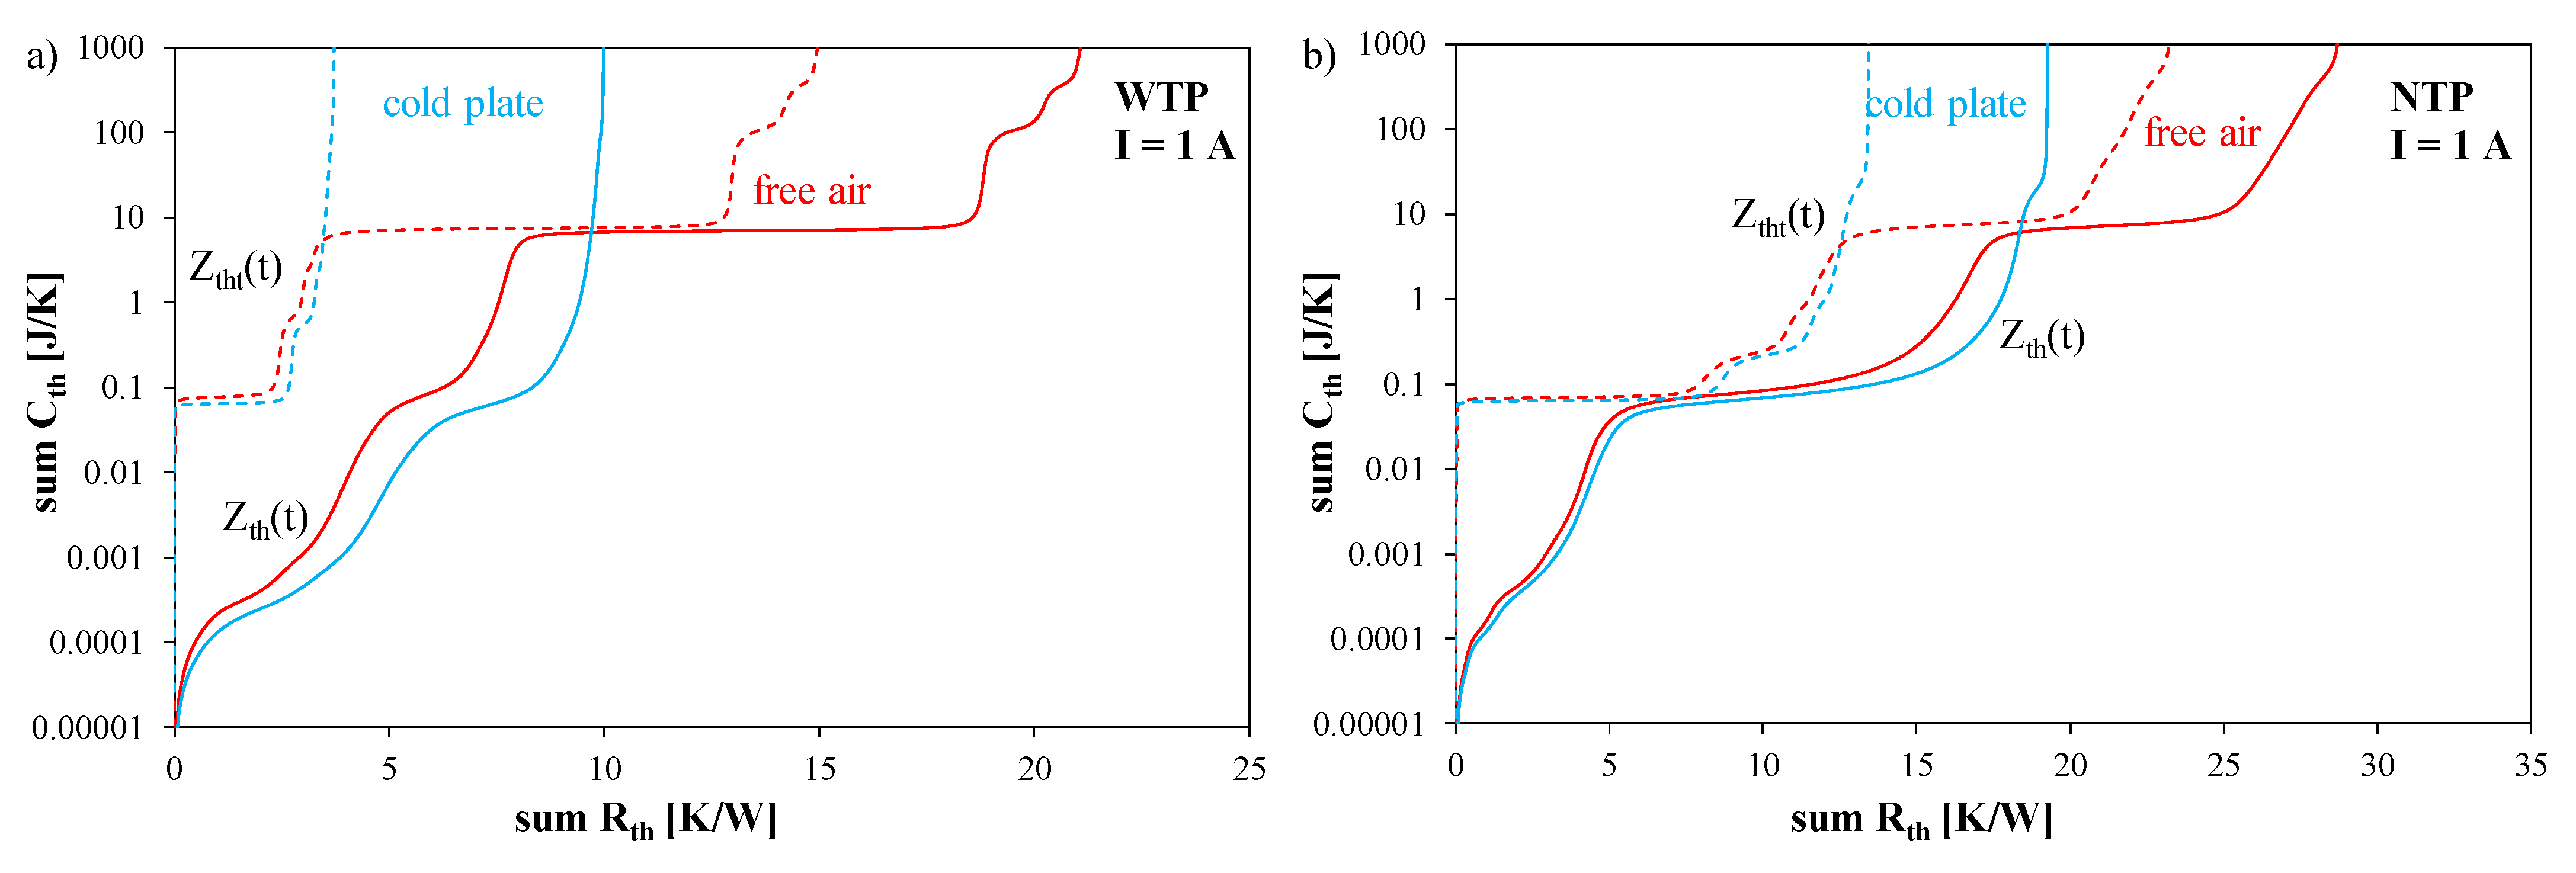
From the user’s point of view, thermal capacitances and resistances in the compact thermal model of power LEDs are important. Figure 11 shows the structure functions of the measured electric transient thermal impedances of the tested LEDs. As can be seen, the waveforms of the structure functions of Ztht(t) have a much steeper course than the functions determined on the basis of the measured waveforms of Zth(t). The thermal capacitances corresponding to Ztht(t) have higher values than for Zth(t).
Figure 12 shows the discrete spectrum of thermal time constants of the compact thermal model of the MCE diode obtained with the ESTYM program for the measurement results Zth(t) and Ztht(t) shown in Figure 9. As can be seen, both mounting methods (WTP or NTP) and the cooling conditions (free convection air cooling or cold plate) of the tested diode significantly affected the obtained spectrum of thermal time constants. The larger number of thermal time constants describes the Zth(t) waveforms, which is related to the effect of heat transfer between the semiconductor structures and the housing on Zth(t). In the case of Ztht(t) these shortest thermal time constants are not visible. For the diodes mounted on a cold plate, the longest values did not exceed 10 s. On the other hand, for a device operating at free convection air cooling, the values of thermal time constants even reached 500 s. The influence of a thermal pad was more visible for a diode operating on the cold plate. In the case of such a diode NTP, the value of the longest thermal time constant was shorter than for WTP.
Figure 13 presents measured dependences of self (solid lines) and transfer (dashed lines) thermal resistance of the diodes contained in the MCE WTP (Figure 13a) and NTP (Figure 13b) devices measured with the custom set-up. As can be seen, the dependences Rth(i) and Rtht(i) are monotonically decreasing functions. With the change of diode forward current from 0.35 to 1 A the values of Rth and Rtht decrease by 15% and the changes observed for Rth are larger than for Rtht. The changes are the smallest for the device mounted with thermal pad and operating on the cold plate.
5. Conclusions
This paper describes two measurement set-ups dedicated to measuring thermal parameters of semiconductor devices. The first of them is a commercially available set-up, whereas the second is the custom set-up. Both set-ups include the additional block making it possible to measure optical power of light emitted by the tested LEDs. Therefore, they make it possible to measure transient thermal impedance of the tested devices. A method of measuring self and transfer transient thermal impedances of LED dies contained in a common housing was also proposed.
The results of measurements performed for three types of power LEDs operating at different cooling conditions are shown. It was proved that with the use of both considered set-ups nearly the same results of measurements were obtained. Therefore, it could be stated that the simple measurement set-up, developed by the authors, operates properly. Additionally, the authors’ software ESTYM makes it possible to estimate parameters describing waveforms of Zth(t) and Ztht(t).
Using both considered set-ups it is possible to measure electric self and transfer transient thermal impedances of selected power LEDs containing single or multiple dies in the common case and operating at different cooling conditions. These results show that the custom measurement set-up makes it possible to obtain the accuracy of measurements similar to those of the T3Ster set-up. It was also shown that the mounting manner of the tested devices strongly influences waveforms of self and transfer transient thermal impedances. In particular, during the operation of the MCE diode with free convection air cooling, the value of thermal resistance was as much as three times higher than at operation on the cold plate. For this diode with the thermal pad thermal resistance is even 25% lower than without it. The transfer thermal resistance is even 3 K/W smaller than self thermal resistance. Additionally, it was shown that the mounting manner strongly influences the number and values of thermal time constants, both describing self and transfer transient thermal impedances.
Author Contributions
Conceptualization, K.G., P.P. and M.J.; methodology, K.G., P.P. and M.J.; investigation P.P.; resources P.P. and M.J.; writing—original draft preparation K.G., P.P. and M.J.; writing—review and editing K.G., P.P., M.J. and M.N.; visualization P.P. and K.G.; supervision K.G. and M.J.; funding acquisition K.G. All authors have read and agreed to the published version of the manuscript.
Funding
The project was financed within the program of the Ministry of Science and Higher Education called ”Regionalna Inicjatywa Doskonałości” in the years 2019–2022, the project number was 006/RID/2018/19 and the sum of financing was PLN 11,870,000.
Institutional Review Board Statement
Not applicable.
Informed Consent Statement
Not applicable.
Data Availability Statement
The presented experimental data can be made available on request.
Conflicts of Interest
The authors declare no conflict of interest.
Nomenclature
| ai | Weighting coefficient |
| Cth | Thermal capacitance |
| Ee | Surface power density of the emitted light |
| IF | Diode forward current |
| Pe | Electric power |
| Popt | Optical power |
| Rth | Thermal resistance |
| Rtht | Transfer thermal resistance between power LEDs |
| t | Time |
| Tj | Junction temperature |
| Ta | Ambient temperature |
| VF | Forward voltage |
| Zth(t) | Self transient thermal impedance of a power LED |
| Ztht(t) | Transfer transient thermal impedance between power LEDs |
| T | Slope of the thermometric characteristic |
| thi | Thermal time constant |
References
- Weir, B. Driving the 21st century’s lights. IEEE Spectr. 2012, 49, 42–47. [Google Scholar] [CrossRef]
- Martin, P.S. High power white LED Technology for Solid State Lighting. Lumileds 2005. Available online: https://www.ele.uva.es/~pedro/optoele/LEDs/LEDilumination.pdf (accessed on 30 May 2021).
- Górecki, K.; Ptak, P. Modelling LED lamps in SPICE with thermal phenomena taken into account. Microelectron. Reliab. 2017, 79, 440–447. [Google Scholar] [CrossRef]
- Schubert, E.F. Light Emitting Diodes, 2nd ed.; Cambridge University Press: New York, NY, USA, 2008. [Google Scholar]
- Lasance, C.J.M.; Poppe, A. Thermal Management for LED Applications; Springer Science + Business Media: New York, NY, USA, 2014. [Google Scholar]
- Górecki, K. Modelling mutual thermal interactions between power LEDs in SPICE. Microelectron. Reliab. 2015, 55, 389–395. [Google Scholar] [CrossRef]
- D’Alessandro, V.; Rinaldi, N. A critical review of thermal models for electro-thermal simulation. Solid-State Electron. 2002, 46, 487–496. [Google Scholar] [CrossRef]
- Blackburn, D. Temperature measurements of semiconductor devices—A review. In Twentieth Annual IEEE Semiconductor Thermal Measurement and Management Symposium (IEEE Cat. No.04CH37545); SEMI-THERM: San Jose, CA, USA, 2004; pp. 70–80. [Google Scholar]
- Janicki, M.; Torzewicz, T.; Ptak, P.; Raszkowski, T.; Samson, A.; Górecki, K. Parametric Compact Thermal Models of Power LEDs. Energies 2019, 12, 1724. [Google Scholar] [CrossRef] [Green Version]
- Górecki, K.; Ptak, P. Compact Modelling of Electrical, Optical and Thermal Properties of Multi-Colour Power LEDs Operating on a Common PCB. Energies 2021, 14, 1286. [Google Scholar] [CrossRef]
- Schweitzer, D.; Ender, F.; Hantos, G.; Szabó, P.G. Thermal transient characterization of semiconductor devices with multiple heat sources—Fundamentals for a new thermal standard. Microelectron. J. 2015, 46, 174–182. [Google Scholar] [CrossRef]
- Górecki, K.; Zarębski, J.; Górecki, P.; Ptak, P. Compact thermal models of semiconductor devices—A review. Int. J. Electron. Telecommun. 2019, 65, 151–158. [Google Scholar]
- Gorecki, K.; Gorecki, P. Nonlinear Compact Thermal Model of the IGBT Dedicated to SPICE. IEEE Trans. Power Electron. 2020, 35, 13420–13428. [Google Scholar] [CrossRef]
- Górecki, K.; Ptak, P.; Janicki, M.; Torzewicz, T. Influence of cooling conditions of power LEDs on their electrical, thermal and optical parameters. In Proceedings of the 25th International Conference Mixed Design of Integrated Circuits and Systems MIXDES 2018, Gdynia, Poland, 21–23 June 2018; pp. 237–242. [Google Scholar]
- JEDEC Standard JESD51-51: Implementation of the Electrical Test Method for the Measurement of Real Thermal Resistance and Impedance of Light-Emitting Diodes with Exposed Cooling. April 2012. Available online: https://www.jedec.org/sites/default/files/docs/JESD51-51.pdf (accessed on 30 May 2021).
- JEDEC Standard JESD51-52: Guidelines for Combining CIE 127-2007 Total Flux Measurements with Thermal Measurements of LEDs with Exposed Cooling Surface. April 2012. Available online: https://standards.globalspec.com/std/1519964/JEDEC%20JESD%2051-52 (accessed on 30 May 2021).
- Janicki, M.; Torzewicz, T.; Samson, A.; Raszkowski, T.; Napieralski, A. Experimental identification of LED compact thermal model element values. Microelectron. Reliab. 2018, 86, 20–26. [Google Scholar] [CrossRef]
- Dziurdzia, B.; Gorecki, K.; Ptak, P. Influence of a Soldering Process on Thermal Parameters of Large Power LED Modules. IEEE Trans. Compon. Packag. Manuf. Technol. 2019, 9, 2160–2167. [Google Scholar] [CrossRef]
- Górecki, K.; Ptak, P. New dynamic electro-thermo-optical model of power LEDs. Microelectron. Reliab. 2018, 91, 1–7. [Google Scholar] [CrossRef]
- Gorecki, K.; Ptak, P. New Method of Measurements Transient Thermal Impedance and Radial Power of Power LEDs. IEEE Trans. Instrum. Meas. 2019, 69, 212–220. [Google Scholar] [CrossRef]
- Gorecki, K.; Ptak, P.; Janicki, M. Comparison of Set-ups Dedicated to Measure Thermal Parameters of Power LEDs. In Proceedings of the 2020 27th International Conference on Mixed Design of Integrated Circuits and System (MIXDES), Łódź, Poland, 25–27 June 2020; pp. 127–132. [Google Scholar]
- Datasheet XLamp MC-E. Available online: https://cree-led.com/media/documents/XLampMCE.pdf (accessed on 30 May 2021).
- Górecki, K.; Ptak, P.; Torzewicz, T.; Janicki, M. Influence of a Thermal Pad on Selected Parameters of Power LEDs. Energies 2020, 13, 3732. [Google Scholar] [CrossRef]
- T3Ster Thermal Transient Tester, Technical Information, Mentor Graphics. Available online: https://www.flotrend.com.tw/files/f-pid/t3ster/2013/T3Ster_b.pdf (accessed on 30 May 2021).
- Alphacool Company Site. Available online: https://www.alphacool.com/ (accessed on 22 January 2020).
- Ptak, P.; Górecki, K.; Skwarek, A.; Witek, K.; Tarasiuk, J. The influence of soldering process parameters on the optical and thermal properties of power LEDs. Solder. Surf. Mt. Technol. 2020, 32, 191–199. [Google Scholar] [CrossRef]
- Datasheet XLamp XM-L2. Available online: www.farnell.com/datasheets/1755855.pdf (accessed on 30 May 2021).
- Datasheet XLamp XP-E. Available online: http://www.cree.com/led-components/media/documents/XLampXPE.pdf (accessed on 30 May 2021).
- Szekely, V. A New Evaluation Method of Thermal Transient Measurement Results. Microelectron. J. 1997, 28, 277–292. [Google Scholar] [CrossRef]
- Górecki, K.; Rogalska, M.; Zarębski, J. Parameter estimation of the electrothermal model of the ferromagnetic core. Microelectron. Reliab. 2014, 54, 978–984. [Google Scholar] [CrossRef]
Figure 1.
Diagram of a combined thermal and radiometric light emitting diodes (LED) testing station [15].
Figure 1.
Diagram of a combined thermal and radiometric light emitting diodes (LED) testing station [15].

Figure 2.
Diagram of the custom measurement set-up. Abbreviations: PC—personal computer, A/D—analog-digital.
Figure 2.
Diagram of the custom measurement set-up. Abbreviations: PC—personal computer, A/D—analog-digital.

Figure 3.
View of the cases of the investigated diodes XML (a), XPE (b), MCE (c), and the MCPCB used for MCE diode (d).
Figure 3.
View of the cases of the investigated diodes XML (a), XPE (b), MCE (c), and the MCPCB used for MCE diode (d).

Figure 4.
Transient thermal impedances of the tested light emitting diodes (LEDs) measured with the use of both measurement set-ups situated on the heat-sink (a) and operating without any heat-sink (b).
Figure 4.
Transient thermal impedances of the tested light emitting diodes (LEDs) measured with the use of both measurement set-ups situated on the heat-sink (a) and operating without any heat-sink (b).

Figure 5.
Structure functions of the tested light emitting diodes (LEDs) situated on the heat-sink (a) and operating without any heat-sink (b).
Figure 5.
Structure functions of the tested light emitting diodes (LEDs) situated on the heat-sink (a) and operating without any heat-sink (b).

Figure 6.
Spectra of thermal time constants of the tested light emitting diodes (LEDs) situated on the heat-sink (a) and operating without any heat-sink (b).
Figure 6.
Spectra of thermal time constants of the tested light emitting diodes (LEDs) situated on the heat-sink (a) and operating without any heat-sink (b).

Figure 7.
Spectra of thermal time constants of the tested light emitting diodes (LEDs) situated on the heat-sink (a) and operating without any heat-sink (b) obtained using the ESTYM software and the authors’ set-up.
Figure 7.
Spectra of thermal time constants of the tested light emitting diodes (LEDs) situated on the heat-sink (a) and operating without any heat-sink (b) obtained using the ESTYM software and the authors’ set-up.

Figure 8.
Measured waveforms of self (solid lines) and transfer (dashed lines) transient thermal impedances of the diodes contained in the MCE device WTP (a) and NTP (b) measured by the T3Ster set-up.
Figure 8.
Measured waveforms of self (solid lines) and transfer (dashed lines) transient thermal impedances of the diodes contained in the MCE device WTP (a) and NTP (b) measured by the T3Ster set-up.

Figure 9.
Measured waveforms of self (solid lines) and transfer (dashed lines) transient thermal impedances of the diodes contained in the MCE device WTP (a) and NTP (b) measured with the custom set-up.
Figure 9.
Measured waveforms of self (solid lines) and transfer (dashed lines) transient thermal impedances of the diodes contained in the MCE device WTP (a) and NTP (b) measured with the custom set-up.

Figure 10.
Spectra of thermal time constants determined using the MASTER software on the basis of the measured waveforms of self (solid lines) and transfer (dashed lines) transient thermal impedances of the dies contained in the MCE device WTP (a) and NTP (b) measured by the T3Ster set-up.
Figure 10.
Spectra of thermal time constants determined using the MASTER software on the basis of the measured waveforms of self (solid lines) and transfer (dashed lines) transient thermal impedances of the dies contained in the MCE device WTP (a) and NTP (b) measured by the T3Ster set-up.

Figure 11.
Structure functions determined using the MASTER program on the basis of the measured waveforms of self (solid lines) and transfer (dashed lines) transient thermal impedances of the diodes contained in the MCE device WTP (a) and NTP (b) measured with the T3Ster set-up.
Figure 11.
Structure functions determined using the MASTER program on the basis of the measured waveforms of self (solid lines) and transfer (dashed lines) transient thermal impedances of the diodes contained in the MCE device WTP (a) and NTP (b) measured with the T3Ster set-up.

Figure 12.
Spectra of thermal time constants of the diode MCE mounted with the use of a thermal pad (a) and without a thermal pad (b).
Figure 12.
Spectra of thermal time constants of the diode MCE mounted with the use of a thermal pad (a) and without a thermal pad (b).

Figure 13.
Dependences of self thermal resistance (solid lines) and transfer thermal resistance (dotted lines) between diodes contained in the MCE device on forward current for the device mounted with the use of a thermal pad (a) and without a thermal pad (b) obtained using the custom set-up.
Figure 13.
Dependences of self thermal resistance (solid lines) and transfer thermal resistance (dotted lines) between diodes contained in the MCE device on forward current for the device mounted with the use of a thermal pad (a) and without a thermal pad (b) obtained using the custom set-up.


Table 1.
Advantages and disadvantages of the custom set-up.
| Advantages | Low price | Measurements of self and transfer thermal parameters | Low measurement error | Measurements of optical power without photometric sphere |
| Disadvantages | Lack of software estimating a structure function | Lack of software estimating a continous spectra of thermal time constants | Measurement procedure different to that of JEDEC standard | Long process of determining optical power |
| Diode | Ptot (W) | IDmax (A) | ΦV (lm) | Viewing Angle (°) |
|---|---|---|---|---|
| XML | 10 | 3 | 341 @ IF = 0.35 A | 125 |
| XPE | 3 | 1 | 122 @ IF = 0.35 A | 115 |
| MCE (1 die) | 2.8 | 0.7 | 100 @ IF = 0.35 A | 110 |
| MCE (4 dies) | 9.52 | 0.7 | 320 @ IF = 0.35 A | 110 |
Table 3.
Thermal power, optical power, and thermal resistance of the tested power LEDs situated on the heat-sink.
Table 3.
Thermal power, optical power, and thermal resistance of the tested power LEDs situated on the heat-sink.
| Diode | Pth (W) | Popt (W) | Rth (K/W) |
|---|---|---|---|
| XML | 3.406 | 2.106 | 12.23 |
| XPE | 2.339 | 0.882 | 25.94 |
| MCE | 1.688 | 0.623 | 13.07 |
Table 4.
Thermal power, optical power, and thermal resistance of the tested power LEDs operating without any heat-sink.
Table 4.
Thermal power, optical power, and thermal resistance of the tested power LEDs operating without any heat-sink.
| Diode | Pth [W] | Popt [W] | Rth [K/W] |
|---|---|---|---|
| XML | 3.392 | 1.836 | 40.77 |
| XPE | 2.266 | 0.796 | 48.91 |
| MCE | 1.623 | 0.611 | 31.56 |
Publisher’s Note: MDPI stays neutral with regard to jurisdictional claims in published maps and institutional affiliations. |
© 2021 by the authors. Licensee MDPI, Basel, Switzerland. This article is an open access article distributed under the terms and conditions of the Creative Commons Attribution (CC BY) license (https://creativecommons.org/licenses/by/4.0/).
Share and Cite
MDPI and ACS Style
Górecki, K.; Ptak, P.; Janicki, M.; Napieralska, M. Comparison of Properties for Selected Experimental Set-Ups Dedicated to Measuring Thermal Parameters of Power LEDs. Energies 2021, 14, 3240. https://doi.org/10.3390/en14113240
AMA Style
Górecki K, Ptak P, Janicki M, Napieralska M. Comparison of Properties for Selected Experimental Set-Ups Dedicated to Measuring Thermal Parameters of Power LEDs. Energies. 2021; 14(11):3240. https://doi.org/10.3390/en14113240
Chicago/Turabian StyleGórecki, Krzysztof, Przemysław Ptak, Marcin Janicki, and Małgorzata Napieralska. 2021. "Comparison of Properties for Selected Experimental Set-Ups Dedicated to Measuring Thermal Parameters of Power LEDs" Energies 14, no. 11: 3240. https://doi.org/10.3390/en14113240
Note that from the first issue of 2016, this journal uses article numbers instead of page numbers. See further details here.