1. Introduction
The energy sector is one of the first fields in EU that have to reduce CO2 emissions in order to achieve the climate change targets for 2030 and 2050. Nowadays, the energy sector in different EU states is still confronted with high emissions, low efficiency, or even high energy losses. The new EU targets are very provocative. The net CO2 emission reduction target of 55% by 2030 and 100% by 2050, compared with that of 1990, represent the new green vision of EU. One main measure is to promote renewable energy. The higher promotion of renewable energy due to the climate change process and the need to reduce the amount of greenhouse gases and the related targets induces new challenges for energy systems. E-Mobility and the proliferation of electric heating are other trigger factors for the new energy systems. Therefore, the energy system has to improve its reliability and stability for higher energy consumption and even for intermittent and uncertain energy produced by renewable sources (e.g., wind or photovoltaic) and to optimize the relation between production and consumption of electricity in the grid, and as a result, to optimize the relation between energy producers and consumers. The classic rule that production is adopted for consumption is not feasible in the new market conditions.
One important instrument that contributes to the optimization of the relation between energy producers and consumers in order to increase the amount of renewable energy in the grid is demand response.
The European Union (EU) demand response is promoted by the Energy Efficiency Directive (2012/27/EU). According to Article 15.8 of the Energy Efficiency Directive, all member states shall encourage the implementation of DR in different energy markets.
The main actor that has a contribution to this optimization in this process is the aggregator.
Demand response is, together with energy efficiency, a part of demand-side management.
The goal of demand-side management is to optimize energy generation and consumption, and also to reduce energy waste. Demand-side management enables the promotion of renewable energy and the reduction of CO2 emissions generated by fossil fuels.
Due to the fact that demand response is voluntary in the case of demand, side management is important to motivate energy producers and consumers to take part in this program.
In this context, energy consumers should change their energy patterns. This change generally appears as a response to external signals. The consumers have to accept home automation and the consumption rules established by experts in order to adapt their consumption to price signals and other conditions defined by the aggregator.
Hence, new incentives for customers have to be introduced in order to change their energy consumption patterns and make them more open to the new requirements of the energy system and the new climate change targets. These may motivate the consumers to consume more electricity when the energy prices are low and to reduce their consumption when energy prices are high in order to optimize the stability of the grid [
1].
This article presents the main benefits of demand response and the role of aggregators for increasing the share of renewables in the grid.
The main objective of this research is to determine the acceptance level of demand response and its implementation on the energy consumer side. This acceptance should include a new actor, the aggregator, which assumes the role of optimization of the relation between energy producers and consumers and of monitoring the implementation and use of demand response.
The article has the following structure. The introduction presents the framework and the need for implementing demand response in the electricity market. In Chapter 2 are demand response and aggregators are presented, with an analysis of the main scientific sources. In Chapter 3 we describe the methodology based on semi-structured interviews and an online survey based on questionnaires. Chapter 4 presents the main results and has a special discussion section. The article ends with the main conclusions and the bibliographical references.
2. Review of Specialized Literature
2.1. Demand Response as a Part of Demand-Side Management
Demand-side management has two main parts to it: energy efficiency (EE) and demand response (DR). Both are energy-management innovations and represent cost-efficient strategies to reduce energy-related costs [
2,
3]. The main difference between DR and EE is based on the fact that DR requires only temporary changes in consumption (even minutes) and EE introduces permanent changes to the consumption, such as due to one-time purchasing of new equipment [
4,
5]. New DR programs require a bi-communication infrastructure [
6] and smart algorithms in order to analyse the energy data. Therefore, these are associated with smart metering devices, a smart grid [
7], or even artificial intelligence [
8]. It has to be mentioned that DR is also highly influenced by markets or meteorological conditions. However, the technologies for implementing demand response programs are mature, and from a technical perspective, the main barriers for this process can be reduced or even eliminated.
In the European Union (EU), DR is promoted by the Energy Efficiency Directive (2012/27/EU). According to Article 15.8 of the Energy Efficiency Directive, all member states shall encourage the implementation of DR in different energy markets.
From a classic consumer perspective, when there were not so many renewables in the grid, DR was defined by the shifting of consumption of electricity consumption from peak hours to off-peak hours (BEUC). A main advantage of DR programs is their potential to reduce stress for the distribution network during peak times with the existing capacity of power plants [
9,
10]). Consequently, the network assets are used more efficiently. These DR programs can shift loads from peak to off-peak times and reduce CO
2 emissions [
11]. In the new context generated by the proliferation of renewable energy power plants (wind or PV), DR contributes to the assurance of the stability of an energy system and its energy security at specific times [
12].
In this context, demand response is defined by the Federal Energy Regulatory Commission as “changes in electric usage by demand-side resources from their normal consumption patterns in response to changes in the price of electricity over time, or to incentive payments designed to induce lower electricity use at times of high wholesale market prices or when system reliability is jeopardized” [
13].
The new definition for demand response introduces the need for change in consumption patterns and even economic tools, such as the price of electricity or incentive payments, to promote the implementation of a demand response strategy. Therefore, new DR strategies have to also ensure the shift of consumer demand from periods when there is less production of energy from renewables to periods when there is a high production of energy from renewable sources.
The main characteristics of the new energy systems are: flexible generation, energy storage, and demand response. Today, the balancing of the electricity system is generally realized by big power-generation facilities which are less reliable. In this context, DR is considered as the most cost-effective method for improving flexibility in the electricity grid [
14,
15].
As a result of its higher flexibility, DR is a promoter for the integration of renewable energy in the electricity system.
From a technical point of view, the standard DR model based on shifting, which has higher levels of flexibility for the operators but where the customers have to use the electrical devices at a different time, is completed by another one based on curtailment, where the client reduces the energy consumption and has no other plan to use the electrical devices at another time-period [
16]. There are studies which are developing models for the estimation of the load curtailment for DR solutions [
17]. In this technical approach, DR is very important for the energy and ancillary services markets. On the ancillary services market, producers and consumers are monitored by a system operator, for example, in order to ensure the stability of the frequency in the grid [
18]
Therefore, in order to promote sustainability in the future energy sector dominated by renewables, demand response could play a more important role [
19,
20].
Besides the technical point of view which is detailed and analysed in the scientific literature and where the main benefits of implementing DR programs have been analysed, there are a few studies which have focused on DR and its social specificity.
From a social point of view, the new DR requires a closer relationship between DR companies and consumers compared with classical power plants, such as hydropower plants, which are responsible for the stability of the energy grid. These structures have a direct connection between the service provider and the electricity market.
In the new DR model, the consumer is integrated in the value creation and delivery processes of a business model [
21]. The benefits of the DR energy system also has benefits for consumers in the form of energy bill savings, but other incentives as well [
22].
Other benefits related to the DR business model are with regard to its created and captured value and its benefits for the energy system and for customers [
23] or which are focused on its economic value.
Most of the studies focused on demand response are based on the classical economic theory, where it is supposed that consumers are well-informed and are also rational economic actors [
14]. We can accept this idea in the case of energy systems which do not require any human intervention. In this case, DR requires no intervention when an equipment such as an electric boiler is automated, closed, and at the same time, activated as an instant gas boiler. This is an ideal example with no impact on consumer comfort. In reality, new DR programs are also introducing aggregator roles, and for better flexibility, consumers have to offer some control over their electric equipment [
24]. This acceptance is also influenced by their energy behavior [
25]. Therefore, consumer behavior may change this case and influence the cost-effectivity of the DR system.
In this new business model, new intermediaries also appear, like demand response providers, such as aggregators [
26].
2.2. Aggregators in Demand Response Programms
The implementation of demand response to small consumers is not enough for reducing the imbalances in the energy system produced by the uncertainty related to a higher share of renewable energy. Therefore, small consumers have to be connected and coordinated by aggregators in order to achieve a point up to which their effect on the stability of the electricity system is relevant.
From the demand response perspective, aggregators are defined as mediators between the end consumers of electricity which offer a demand response, and other stakeholders on the energy market which exploit their demand response [
26,
27].
Aggregators are intermediary organizations between customers and electricity providers, which gather together electric customers with the goal of maintaining grid stability based on a cost-effective strategy by negotiating the purchase of electric-generation services and monitoring customers’ patterns.
The implementation of a cost-effective strategy is based on the number of consumers that are implementing DR and are being monitored by an aggregator [
28]. The customers and their energy consumption contracted with an aggregator can be used as a single resource, analogized with a large conventional power facility [
28].
The monitoring can also include the notifying of customers to change their consumption patterns at different time-periods. The main activities of aggregators include: communication and registration of consumers who want to implement DR programs, analyzing their electricity consumption and estimating potential savings, real-time metering and forwarding of electricity consumption, and calculation of consumer participation in the DR program. The aggregator also has to provide consumers with data security, and perform implementation of standards according to local regulations and consumers’ compensations.
In general, aggregators are private organizations which have to work on profit. Therefore, the aggregator has to offer additional services [
29] and to sell the secondary reserve in the electricity market [
30]. The aggregator’s business model is based on the flexibility that they can achieve from the devices of their customers [
31,
32]. Therefore, aggregators can offer frequency regulation services or have a contract for solving electricity system congestions with the distributions system operator or with the transmission system operator. Another main revenue stream of their business model consists of balancing the retailer portfolio or other stakeholders in the grid. If the aggregator also plays the role of a retailer, their main stream of revenue comes from selling energy to their end customers.
There are studies which consider that the main goal of an aggregator related to the end consumer side is to maximize their satisfaction and to minimize their electricity cost [
33].
Based on the resources that are optimized, there are different types of resource aggregators (
Table 1): demand aggregators, load aggregators, and production aggregators [
34]. Demand aggregators have the role of integrating resources of all end customers and managing demand-side flexibility [
35,
36]. Load aggregators manage the load flexibility of all end customers. Studies indicate that not all consumer loads are flexible and that they can be controlled by demand response programs. From their controlled perspective, consumer loads are clustered into flexible loads, semi-flexible loads, and non-flexible loads [
27]. Flexible loads are the main loads which are efficient for the demand response for internal balancing of the electricity system and for the contractual arrangement with an aggregator. These loads (e.g., freezers, refrigerators, heap pumps, ventilation) have the characteristic of being easily shifted for a defined time-limit due to short notice, and their impact on consumers’ comfort is not significant, or not even relevant. Semi-flexible loads (e.g., dryers, washing machines or dish-washing machines) should only be shifted based on a planning term of one day ahead in order to have a reduced impact on the end customers. The last category of non-flexible loads (e.g., lighting, computers or television) can generate higher levels of discomfort to the customers if shifted. Production aggregators concentrate small generators of end customers as a virtual power plant. These active end consumers are known as prosumers. They can change their energy production at the request of an external signal.
Due to their flexibility, aggregators can be differentiated into: aggregators which consume resources, aggregators as producers of resources, and aggregators with bi-directional resources. Aggregators which consume resources cumulate different loads with different possibilities to be transferred or reduced, which define their flexibility [
37]. Due to their flexibility, these loads can be used for promoting ancillary services, such as frequency or voltage control or backup [
38].
Aggregators as producers of resources are focused on renewable energy sources (e.g., photovoltaic or wind energy) or even traditional generation units (e.g., small hydropower or combined heat and power generation) which are closed to end consumers. These could have the role of emergency power suppliers for high peak-demand cases ([
39,
40]).
Aggregators with bi-directional resources have static (e.g., electric batteries) and dynamic energy storage devices (e.g., electric vehicles), which can be easily transferred in time and space and used for increasing the flexibility and stability of an energy system [
41,
42,
43].
The benefits of an aggregator can also be generated by a bi-directional process using the price differences between buying the energy from the system and selling it to the end consumers [
44].
There are studies which analysed the type of relation between aggregators and energy consumers, which have been differentiated in
Table 1: direct load control, price-based control, incentive-based control and contractual matters [
45]. Direct load control means that the aggregator can control the client’s electric devices at any time. This type of relation was not accepted by the consumers, as they were not motivated for such a higher grade of implication of an aggregator in their consumption pattern for electricity. Price-based control defines the type of relation between the aggregator and its clients, which are rewarding for changing their consumption patterns.
Generally, in this price-based method, aggregators use a dynamic pricing mechanism and their clients receive the price of the real-time electricity market [
45]. Incentive-based control introduces social objectives, such as consumer satisfaction, as main factors that motivate the consumers to change their consumption patterns for electricity. Contractual matters are focused, in principle, on bilateral contracts, where the aggregator has to pay a sum of money if the consumer modifies their consumption (e.g., switch the load or begin generation if they are a prosumer) at specific aggregator signals.
3. Research Methodology
The main objective of this research is to determine the acceptance level of demand response and the role of an aggregator for its implementation on the energy consumer side.
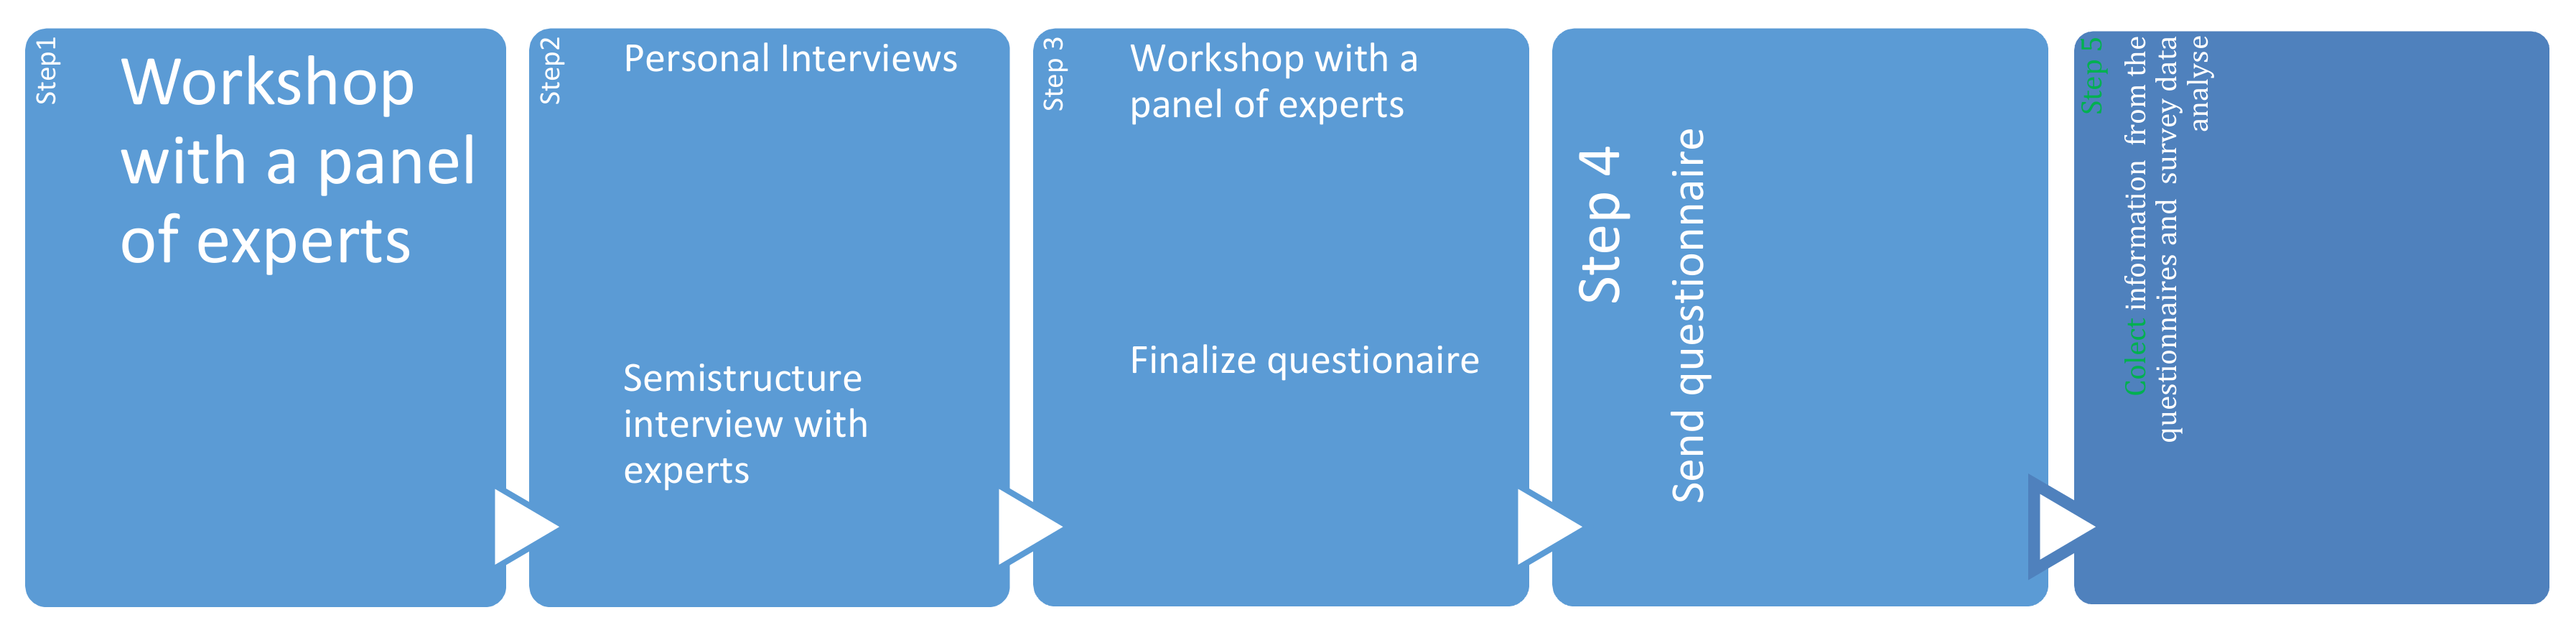
The main research methodology used in this paper is based on four steps. The general framework of the methodology is designed in
Figure 1.
In Step 1, we organized a workshop with a panel of experts in the energy field, and formulated the first hypothesis regarding the implementation of the demand response program and the role of aggregators in this process. The resulting hypothesis was that electricity consumers did not accept the implementation of demand response programs and working with the aggregators as intermediaries.
In Step 2, we organized personal interviews. Between September 2020 and October 2020, we conducted semi-structured interviews with 11 experts who had more than 10 years’ experience in the energy field. The interviews were organized with experts from Romania, Hungary and Serbia. The main goal of the interviews was to obtain information regarding the elaboration of the final questionnaire. The information was gathered in relation to the analysis of the demand response and the role of aggregators in implementing the demand response program.
In Step 3, we organized the second workshop with a panel of experts in the energy field in order to finalize the questionnaires. The questionnaires had three parts. The first part contained questions about the acceptance of demand response programs; the second about the acceptance of aggregators and services offered by them; and the third part focused on the consumer demographic data. For the formulation of the questionnaires, we used the Likert scale.
In Step 4, the questionnaires were sent to consumers for electrical energy that was located in Romania, Hungary and Serbia. During the selection, we chose subjects with experience in the field of energy, but also respondents without knowledge related to this field. The survey involved 195 respondents.
It has to be mentioned that the selected three countries Hungary, Romania and Serbia were selected because these had similarities when we analysed the general electricity market conditions. According to the Fourth Energy package, from June 2019, new electricity market rules were promoted in order to respond to the proliferation of renewable energy sources and to increase the investments in this field. The consumers were able to receive incentives, and new limits for power plants were introduced that enabled them to receive subsidies as capacity mechanisms. The package consisted of one directive and three regulations. As Romania and Hungary are part of EU and Serbia tends to enter, the acceptance and utilization of these programs were aligned to other developed countries within EU. According to that mentioned above, the regulatory authorities in these countries will have to support and create grounds and possibilities in the utilization of programs as a demand response. Because these three countries are neighbouring countries, they have common borders, and they are also linked through cross-border electricity capacities, which means the electricity can easily flow from one country to another. Because of this, the electricity prices on the wholesale market within these countries are more or less the same. Their retail markers according to Eurostat electricity prices (including taxes) for household consumers in the second half of 2020 were as follows: Romania 0.1449 Euro/kWh, Serbia 0.0737 Euro/kWh and Hungary 0.1009 Euro/kWh, versus the average price in EU 0.2134 Euro/kWh.
In Step 5, we collected answers from the consumers of electricity and analysed the survey data. The profiles of the consumers who answered the questionnaires are presented in
Table 2.
Regarding the subjects’ profiles, it can be affirmed that almost half of the respondents were female and half male, and regarding their age, they were mostly 31–40 years old, with the majority living in cities and in owned properties.
Through these questionnaires, it was important to find out and to research what the consumers’ level of knowledge and their attitudes were towards demand response programs and aggregators.
In this research, we analysed how much participation in demand response programs was supported in order to optimize their electricity consumption and decrease the value bill, because these would encourage the consumption and development of the renewable energy sector. It was additionally analysed whether participation in DR was supported by the fact that through these, end consumers could contribute to the reduction of carbon dioxide and global warming.
Further, we researched whether end consumers would be interested, during their participation in demand response programs, in receiving a device (e.g., tablet, mobile phone) from the electricity supplier (or aggregator), which could track the instantaneous electricity consumption of different appliances in the house. We also researched how much renewable electricity they consumed and how they contributed to carbon emissions reduction.
In addition, the consumers’ general demographic information was also important, especially their level of education and competencies in the energy sector. The subjects were asked about their annual household income, monthly average electricity consumption and what percentage of their total income was spent on electricity bills. Gender, age, place of living, as well as whether this accommodation was rented or owned was asked in the questionnaire.
Other data that were collected about the consumers were focused on the consumers’ profile regarding their level of education and their competencies in the energy sector. These data were interesting to find if there was a correlation between the consumer’s profile and their acceptance of the demand response and the aggregator.
The research methodology also included the model for the multiple linear regression. In this model for the regression equation, the acceptance of DR was the dependent variable, and the independent variables were: the decreased value of the energy bill, the level of competencies of consumers in the energy sector, the promotion of renewable energy, the reduction of CO2 emissions, and the percentage of total income which consumers spent on electricity. Data for the multiple linear regression were processed with MS Office Professional Plus 2016 and IBM SPSS Statistics for Windows, Version 27.0.1.0.
4. Results and Discussions
In this research, we firstly collected data regarding household income, electricity consumption, and household expenditure on electricity vs. total income (
Table 3).
Most of the consumers (54%) who answered this survey had a monthly average electricity consumption between 150 kWh and 300 kWh, which is correlated to the fact that they were living in a flat (69%).
In this research, the respondents were only paying a reduced amount of their income on electricity. Therefore, in this case, consumer expenditure on electricity for the majority of the respondents (39%) was less than 3%, and for 34% of the respondents, it was between 3–6%. As a result, 73% of the consumers were spending less than 6% of their income on electricity.
Regarding the consumers’ level of education, we can see that the majority of them (67%) completed a faculty program (36% Bachelor’s degree, and 31% Bachelor’s and also Master’s Program).
Regarding their competence in the energy sector, it has to be mentioned that 60% of respondents had no competencies in the energy sector, but there was 20% with a high level of experience in the field (more than 10 years). The detailed profile of respondents related to their experience in the energy sector and their level of education is presented in
Table 4.
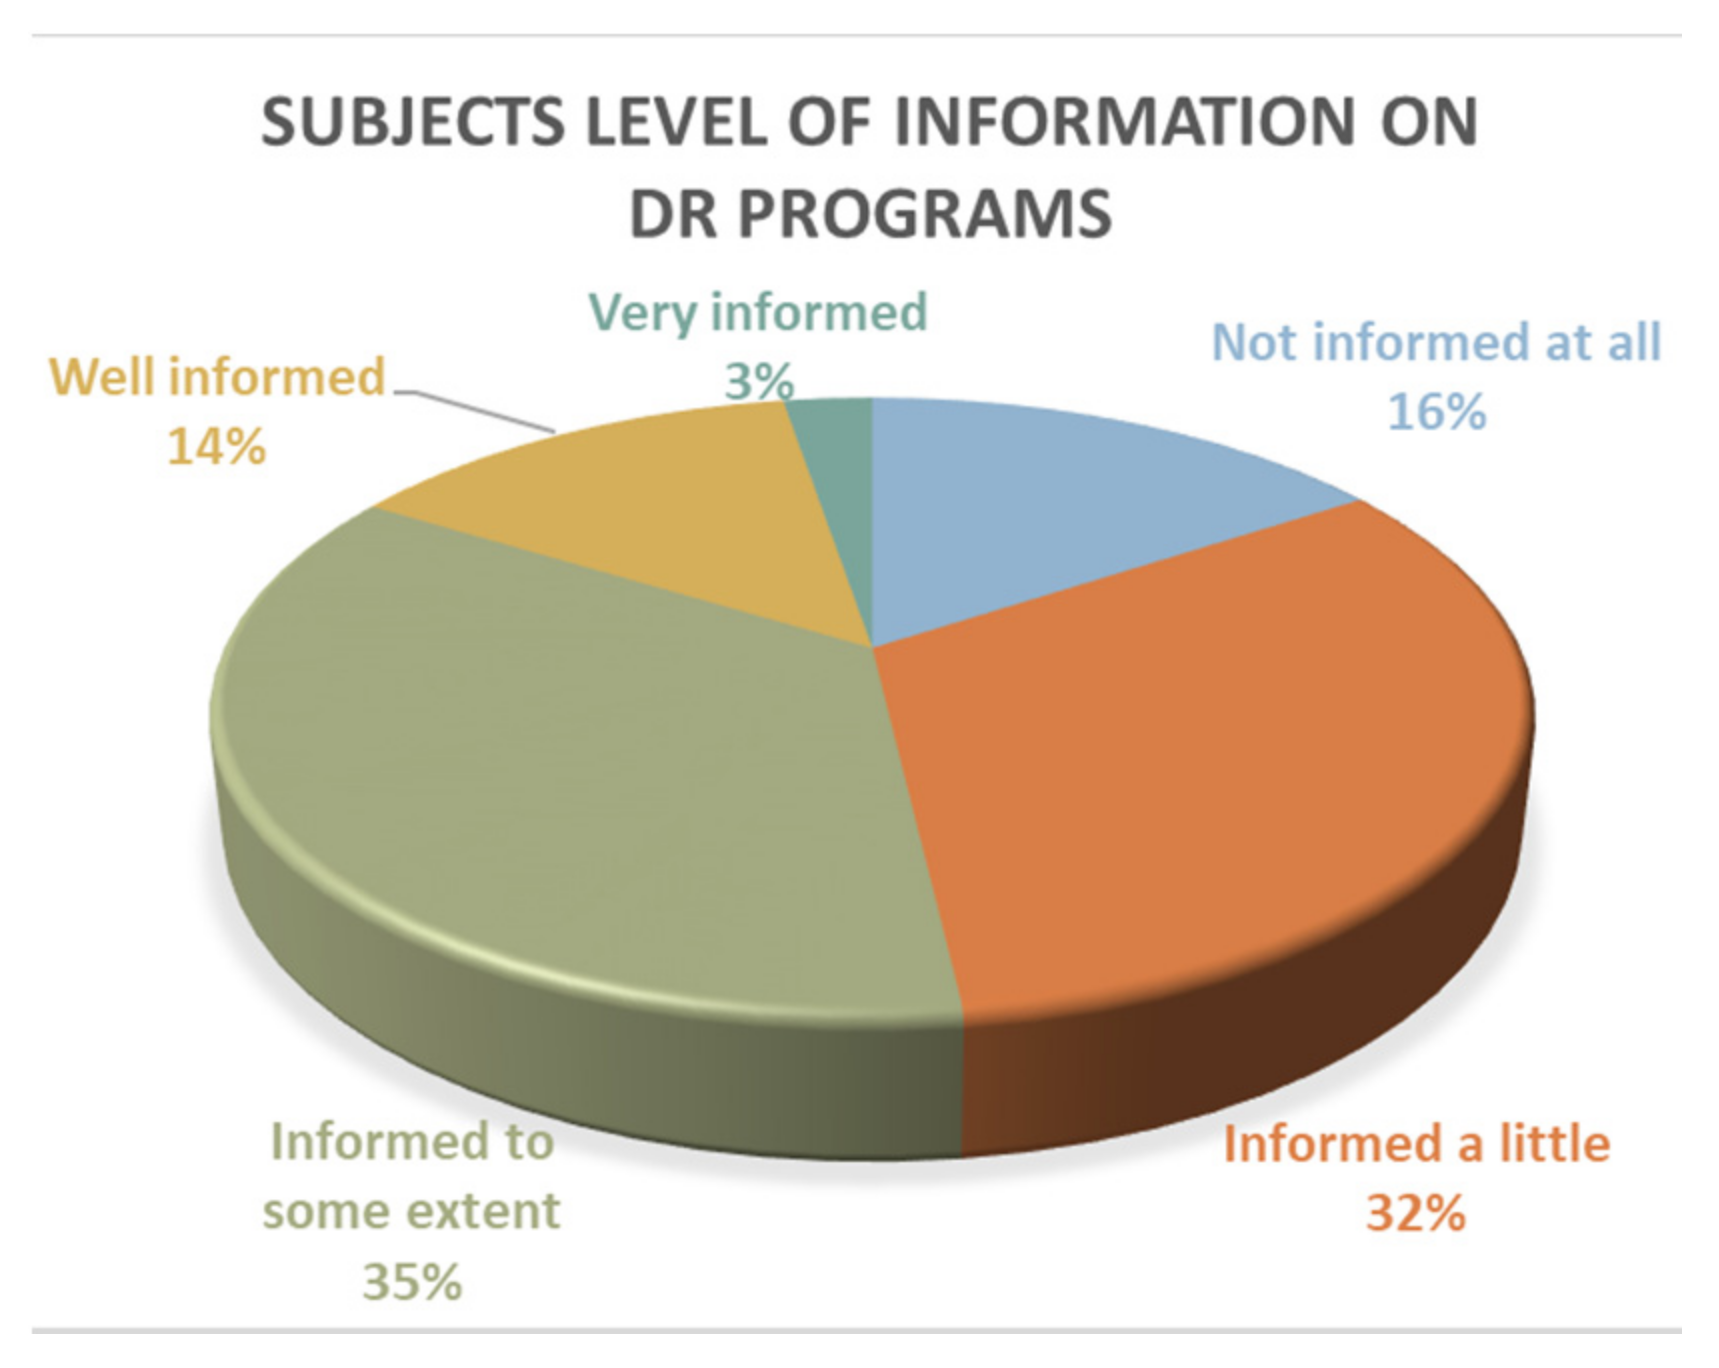
The questionnaire was at first intended to find out what the subjects’ level of information on DR programs was. The results indicated that only (17%) were really informed (3% very well-informed, and 14% well-informed). The percentage of well-informed consumers is low (17%); therefore, there is a need to improve the communication between energy providers and consumers. The detailed results related to the subject level of information on DR programs are presented in
Figure 2.
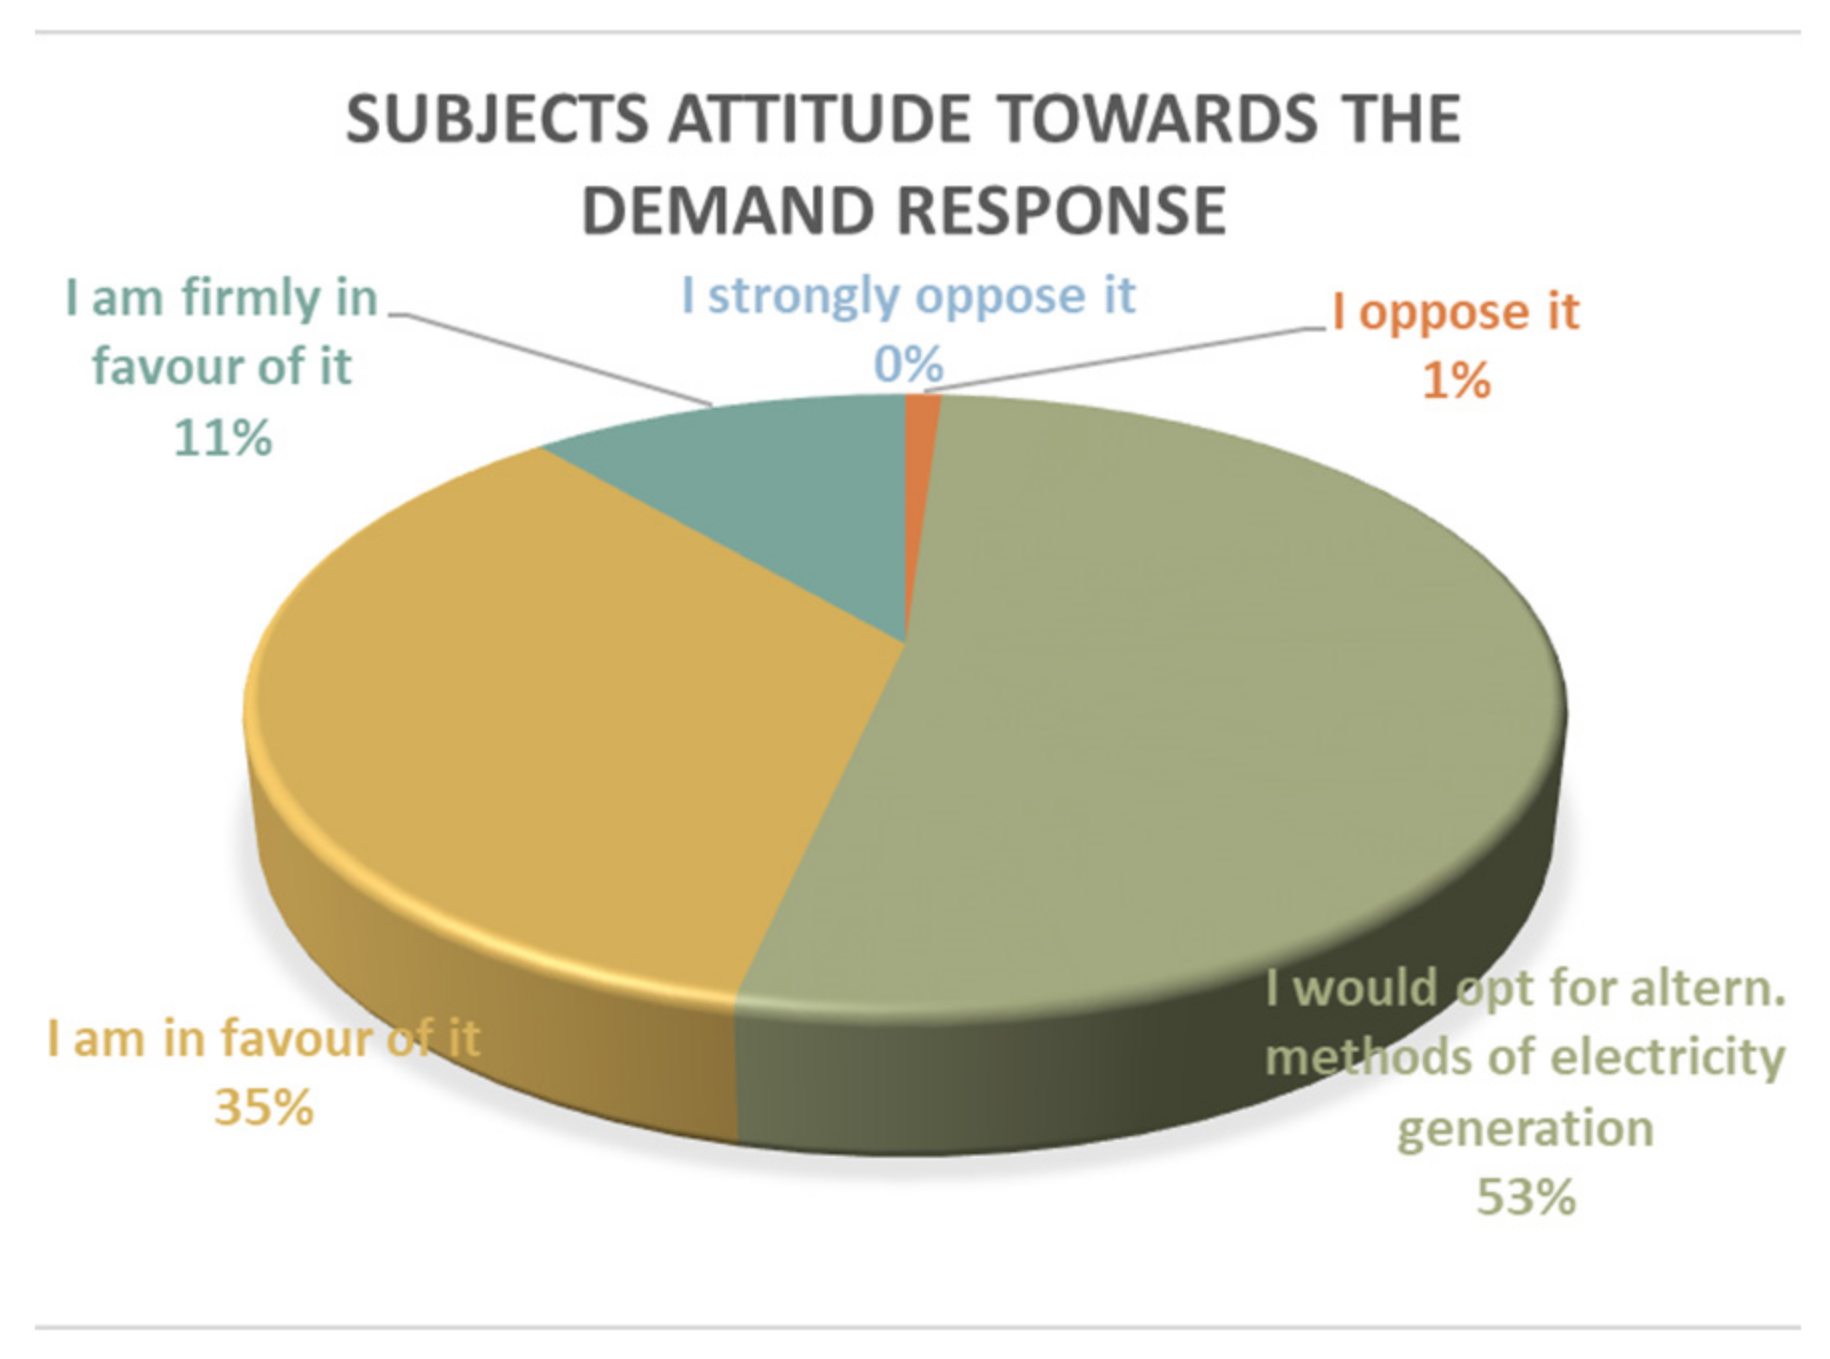
Current research started from the hypothesis that end consumers do not want to work with an aggregator to implement the demand response (Step 1 from the Methodology). In order to test if this hypothesis was right, subjects were asked about their attitude towards the DR program and toward the aggregator.
Analysing attitudes toward the DR program, the results indicate that the consumers have no real opposition against it. Only 1% of respondents declared that they were against DR, but nobody expressed strong opposition against DR. This attitude is a positive one for the future implementation program of DR. The subjects’ attitude toward the demand response is represented in
Figure 3.
Further, we researched the main reason for the customers to participate in demand response programs. The results indicate that most of the consumers (79%) agreed to participate in DR programs (60% agreed and 19% strongly agreed) in order to optimize their electricity consumption and decrease the value of the energy bill. Additionally, 87% agreed (58% agreed and 29% strongly agreed) when it came to encouraging the consumption and development of the renewable energy sector. Detailed results can be found in
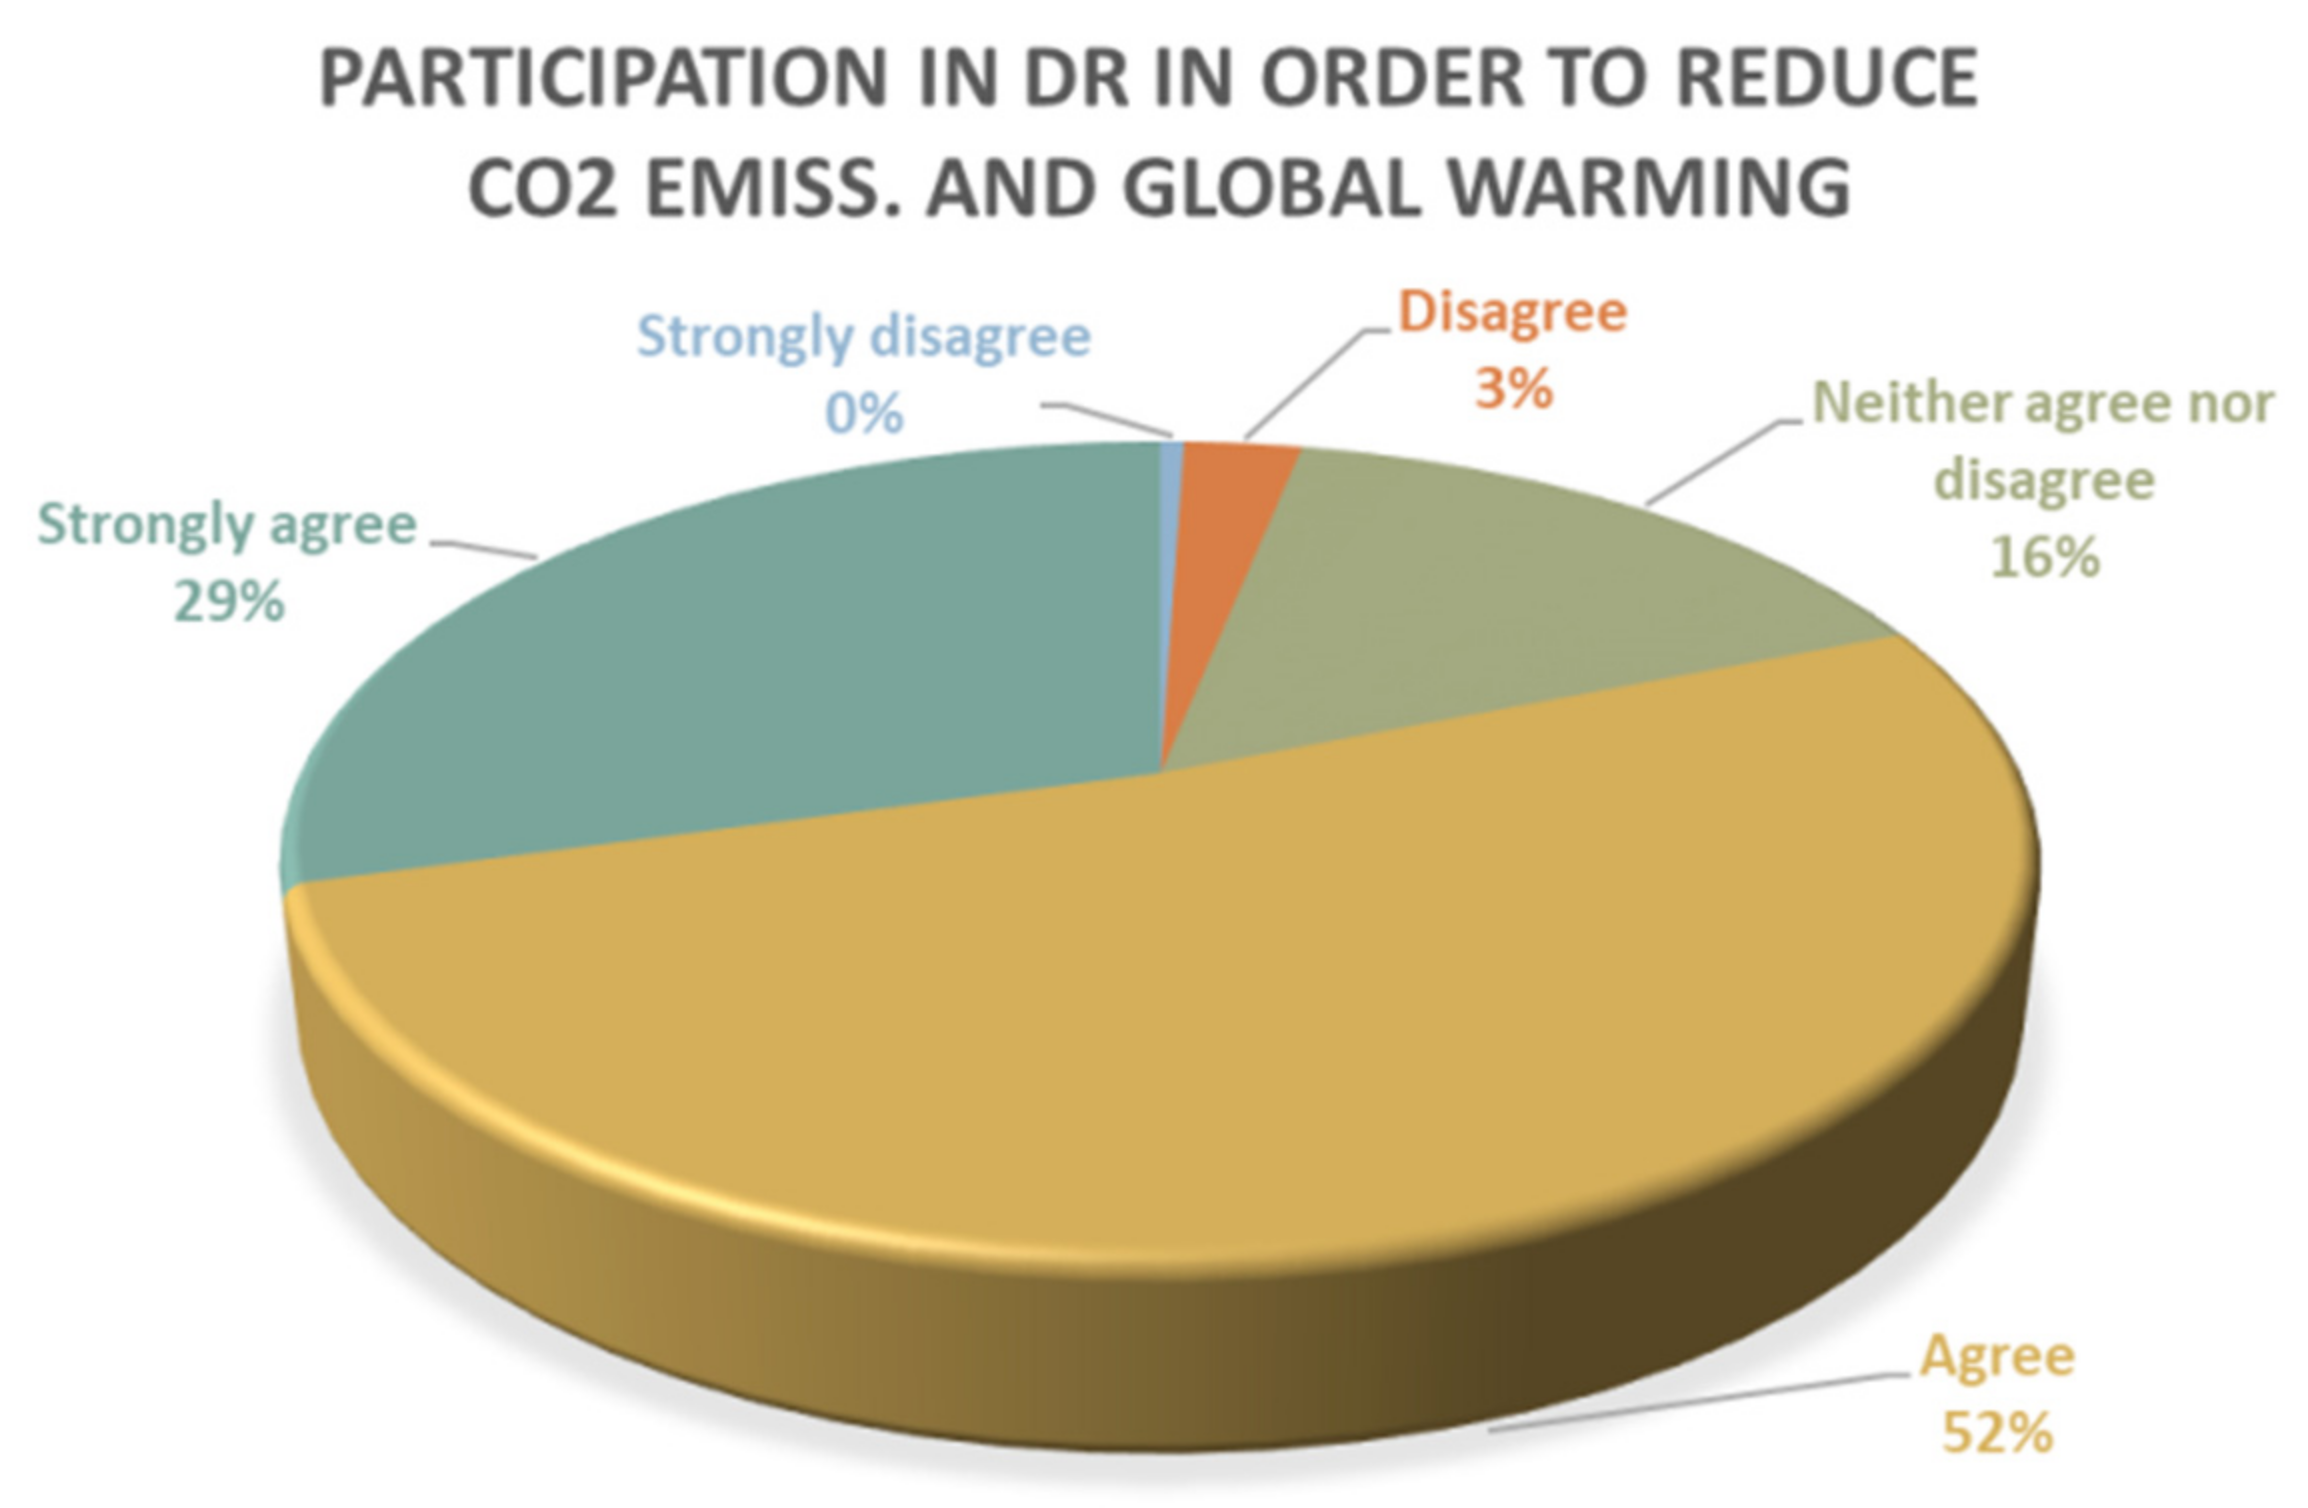
Figure 4. A special question was focused on the willingness of the subjects to participate in DR programs in order to reduce CO
2 emissions and to contribute to the reduction of global warming. From this point of view, the declarations are very provocative, due to the fact that a significant percentage of the respondents (81%) declared that they agreed to participate in DR programs (52% agreed and 29% strongly agreed to participate in DR programs). Detailed results related to the participation of consumers in DR in order to reduce CO
2 emissions are represented in
Figure 5.
An interesting result is conferred by the correlation between the level of income and the acceptance of consumers to participate in DR programs in order to reduce CO
2 emissions. The majority of the respondents agreed that they would participate in DR response programs in order to help in the reduction of CO
2 emissions and to contribute to the reduction of global warming (
Table 5).
Of the subjects with household incomes below 25,000 Euros, 83% agreed (55% agreed and 28% strongly agreed), and 73% of households with incomes over 25,000 Euros agreed (43% agreed and 30% strongly agreed) to participate in DR response programs. Most of them were motivated to reduce CO2 emissions.
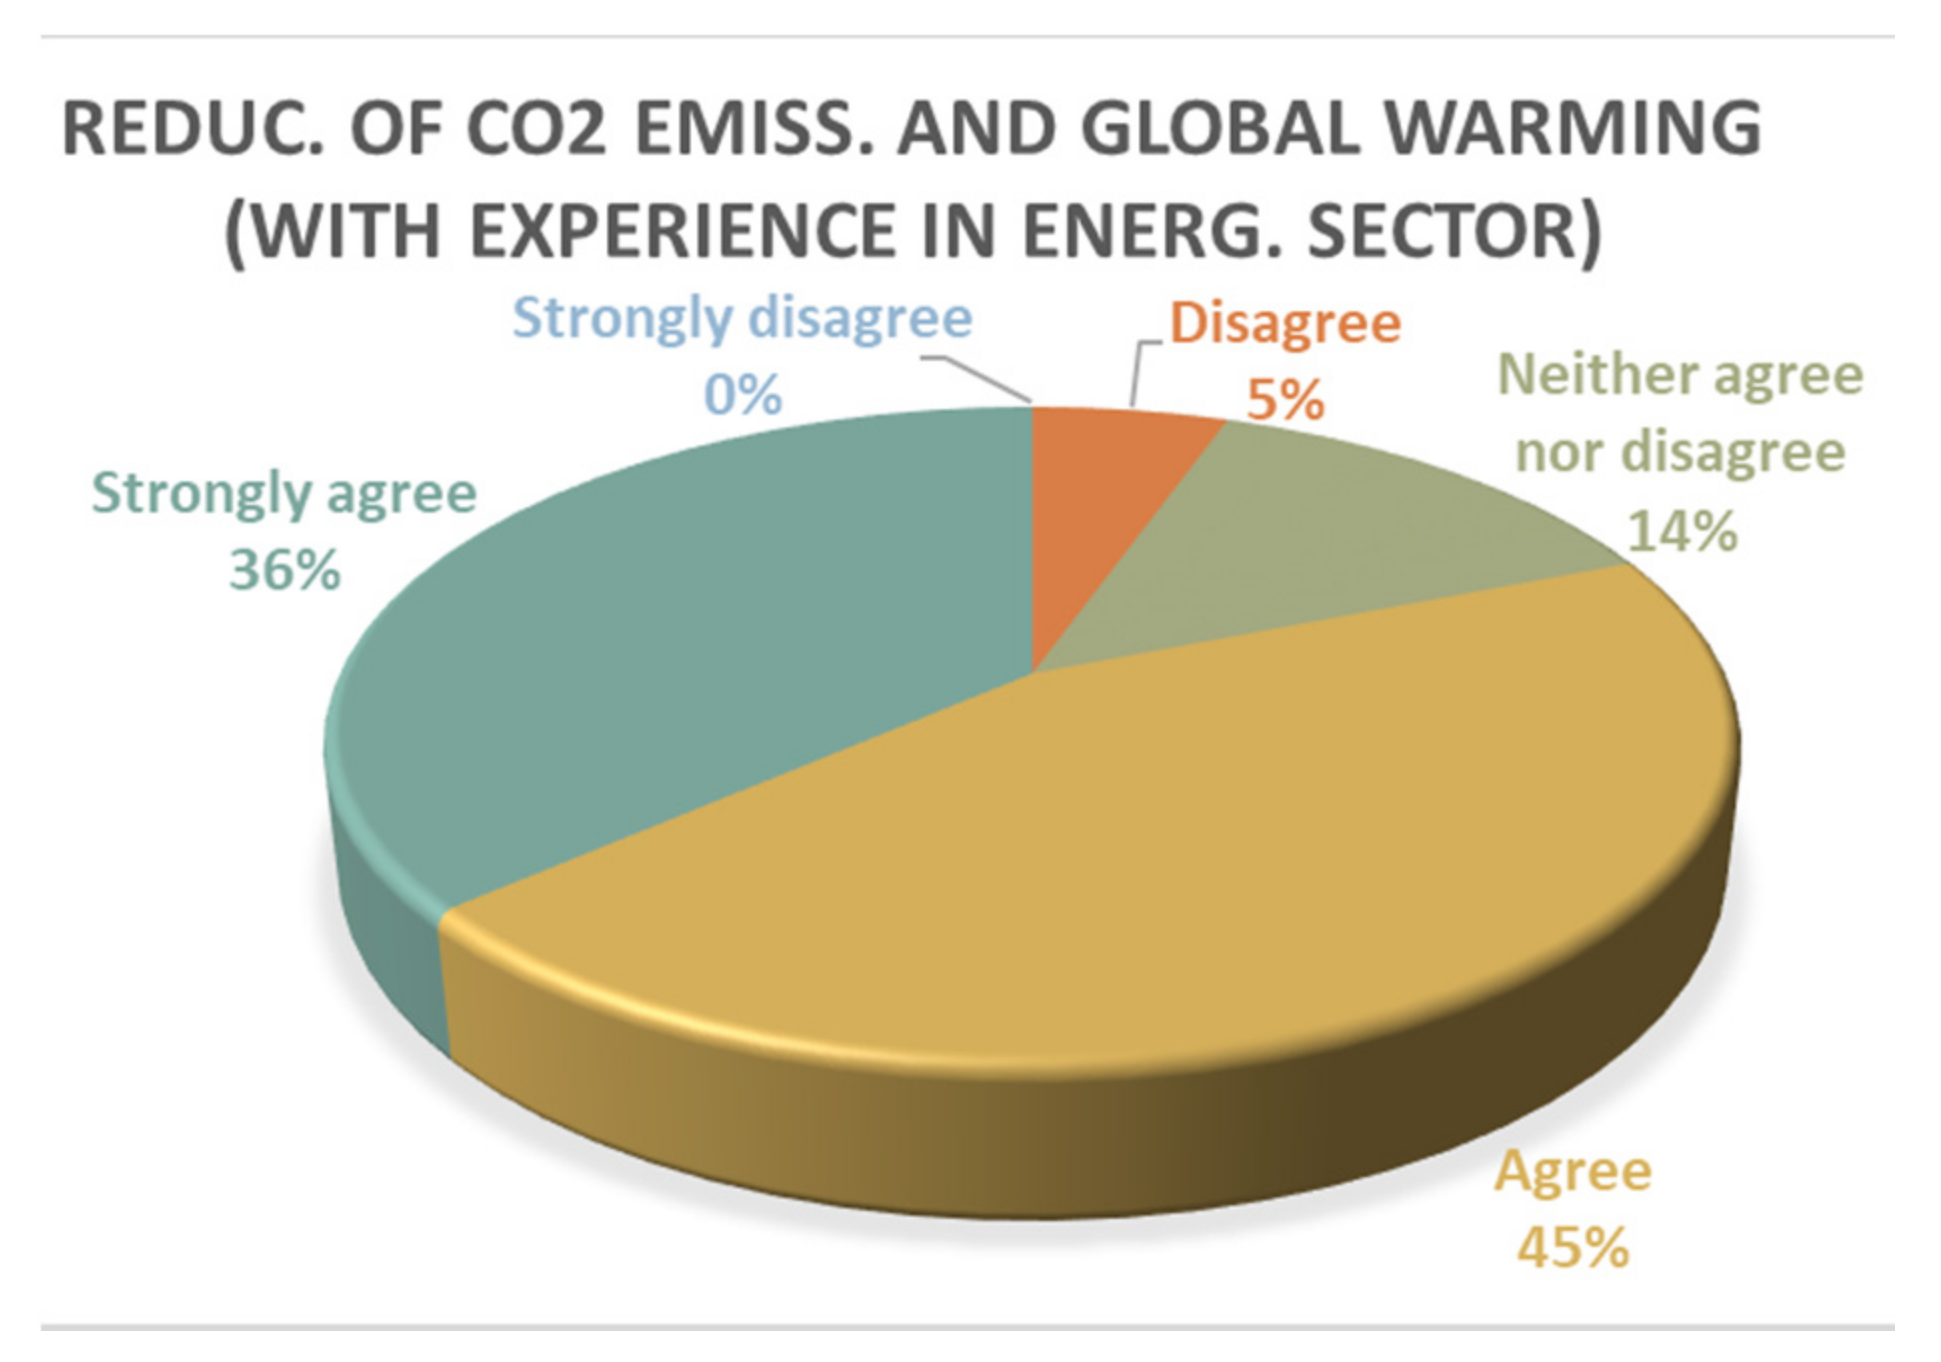
Another correlation that was analysed was the consumers’ level of experience in the energy field and their willingness to participate in DR programs in order to reduce the CO
2 emissions and reduce impacts on global warming (
Figure 6 and
Figure 7).
Both subject categories (with experience in the energy sector and without experience in the energy field) confirmed (81%) that they agreed to contribute to the reduction of CO2 emissions. In the case of consumers with experience in the energy field, the percentage of respondents that strongly agreed with the participation in DR programs for reduction of CO2 emissions was higher (36%) than respondents without experience in the energy field (25%).
Regarding the acceptance of devices on which end consumers could track instantaneous electricity consumption of different appliances in the house, 79% of them agreed (51% agreed and 28% strongly agreed) to use them. Regarding the use of devices to track how much renewable electricity the consumers used and how they could contribute to carbon emissions reduction, 78% agreed to use them (53% agreed and 25% strongly agreed). Detailed results are represented below in
Table 6.
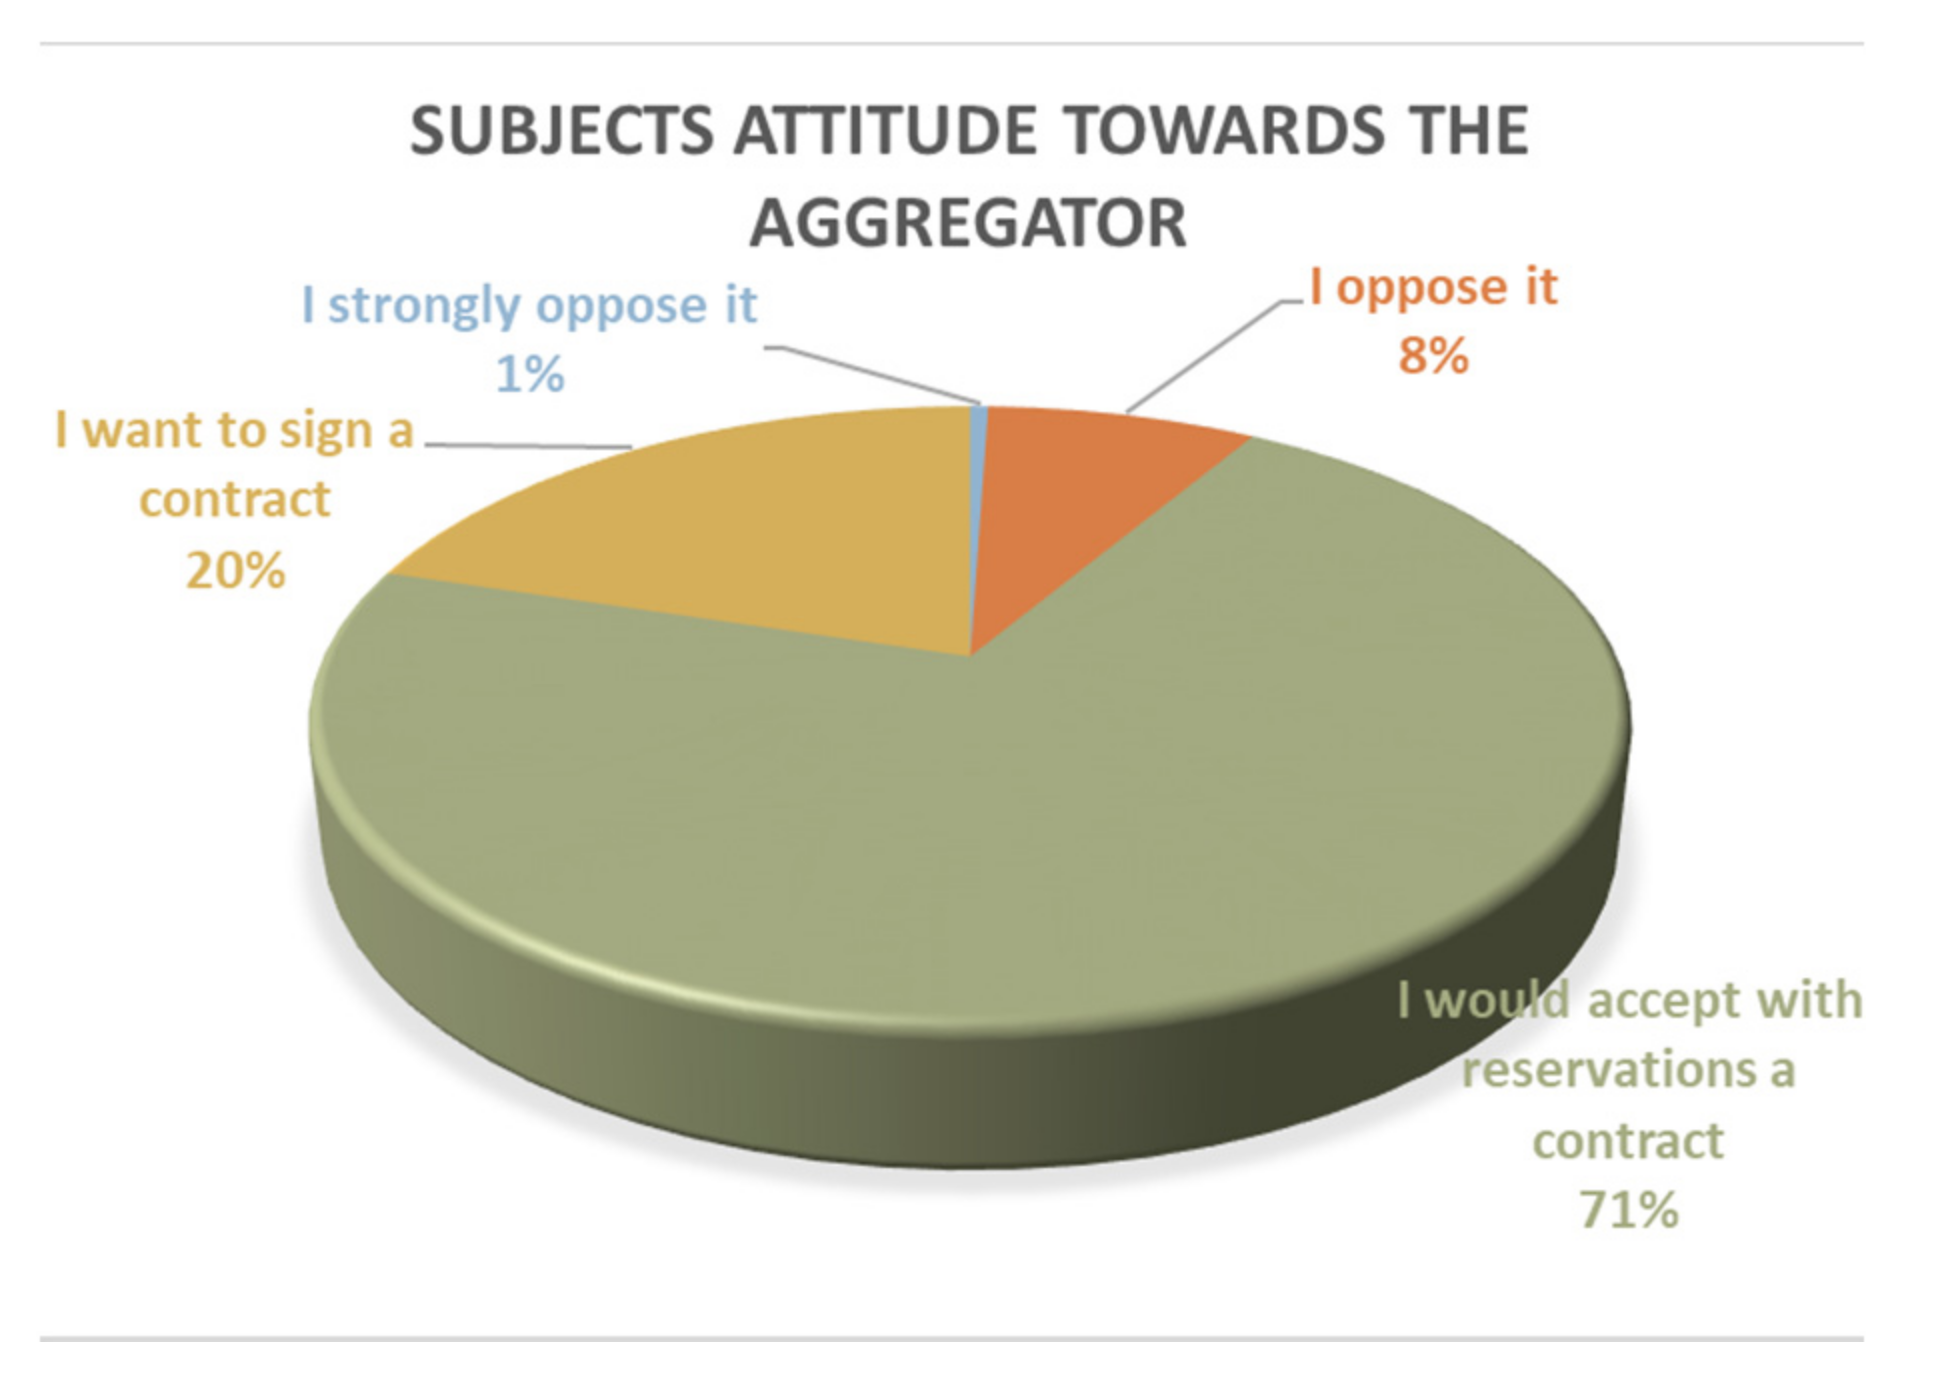
The second main research subject was related to the attitude of consumers towards the aggregator. Firstly, the subjects’ level of knowledge about the aggregator was analysed. Responses on knowledge about the aggregator show that 33% of respondents had an average level of knowledge. It can also be observed that 48% of respondents had an average or above-average level of knowledge about aggregators. However, more than half of the respondents (52%) did not really know what an aggregator was. It is important to start a campaign to inform consumers about the role of aggregators in the implementation of DR and to underline the advantages that can be achieved if the DR program is implemented under collaboration with an aggregator.
With regard to the subjects’ attitude toward the aggregator, we found that only 1% of the subjects strongly opposed aggregators. On the other hand, 71% of subjects would accept, with reservation, a contract with an aggregator, and only 20% said they would like to sign a contract with an aggregator (
Figure 8 and
Figure 9).
In order to evaluate the significance of the research results, a multiple linear regression analysis was conducted. The dependent variable was the acceptance of DR on the consumer side, and the independent variables which were analysed were: the decrease in value of energy bills, the level of competencies of consumers in the energy sector, the promotion of renewable energy, the reduction of CO2 emissions, and the percentage of their total income consumers spent on electricity.
The summaries of each multiple linear regression model are presented in
Table 7, where the dependent variable, which indicates the acceptance of DR on the consumer side, is represented by “my attitude toward the demand response”.
The results of the analysis of variance and the Fisher test are illustrated in
Table 8, which indicate that the models are globally significant.
In
Table 9, we present the coefficients of the validated model for regression with the accepted independent variables: the decrease in value of the energy bill, and consumer competencies in the energy sector.
The results of the multiple linear regression indicate that the acceptance of DR programs is mostly influenced by the reduction in the value of energy bills of consumers. Additionally, the acceptance of DR programs is directly influenced by the level of experience of consumers in the energy sector (
Table 9). Data were processed with MS Office Professional Plus 2016 and IBM SPSS Statistics for Windows, Version 27.0.1.0.
5. Conclusions
This paper analysed the acceptance level of the demand response and its implementation due to the collaboration with an aggregator on the energy consumer side. At first, the knowledge of DR was evaluated for electricity consumers. Unfortunately, the percentage of well-informed consumers was low (17%); therefore, there is a need to improve the communication between energy providers and consumers. Only 1% of respondents declared that they were against DR, but nobody expressed strong opposition against DR. The attitude of the consumers is a positive one for future implementation of the DR program.
A very positive fact is that even if DR programs are a relatively new business model approach to electricity supply, 46% of consumers were in favour of it (11% were firmly in favour of it and 35% were in favour of it).
An interesting result was conferred by the willingness of consumers to reduce CO2 emissions and to contribute to the reduction of global warming. In the case of consumers with experience in the energy field, the percentage of the respondents that strongly agreed with the participation in DR programs for reduction of CO2 emissions was high (36%). On the other hand, an important percentage of respondents without experience in the energy field also strongly agreed (25%).
In addition, a very positive outcome of the research is that 81% (29% strongly agreed and 52% agreed) of subjects said they would like to participate in DR programs in order to contribute to the reduction of CO2 emissions and of global warming. This fact can be the core approach of new business models when attracting end consumers to such programs.
Our second important research topic was focused on aggregators and consumers’ attitudes toward them. There was a higher percentage (52%) of respondents who did not know what an aggregator was. Therefore, it is important to start a campaign to inform consumers about the role of aggregators in the implementation of DR and to underline the advantages that the consumers can achieve if they implement the DR program in collaboration with an aggregator. In this campaign, it is also noteworthy that DR enables the reduction of CO2 emissions. A good point is that only a small percentage of subjects opposed or strongly opposed working with aggregators, and a large majority would accept a contract with reservation. This proves that only a few may oppose, and many would accept with reservation, the fact that end consumers could be convinced to give DR programs a try and to collaborate with an aggregator.
The research results are limited to the three states Serbia, Hungary and Romania, which have similar characteristics on the electricity market. Other electricity markets where this research can be developed are: Bulgaria, Croatia, Poland, Slovakia and the Czech Republic.
Future research in this field may be focused on the incentives that can be offered to consumers in order to increase their acceptance regarding the implementation of DR programs and working with aggregators. Therefore, this research can be improved with new research which will analyse the main services that aggregators can offer to consumers in order to motivate them.


