
Analytical Approach to Understanding the Effects of Implementing Fast-Frequency Response by Wind Turbines on the Short-Term Operation of Power Systems


1
Department of Electrical, Electronic and Telecommunication−DEET, Universidad de Cuenca, Cuenca 010203, Ecuador
2
Area of Electrical Engineering, Escuela Técnica Superior de Ingenieros Industriales, Universidad Politécnica de Madrid, 28006 Madrid, Spain
*
Author to whom correspondence should be addressed.
Energies 2021, 14(12), 3660; https://doi.org/10.3390/en14123660
Submission received: 17 May 2021
/
Revised: 11 June 2021
/
Accepted: 16 June 2021
/
Published: 19 June 2021
(This article belongs to the Topic Power System Modeling and Control)
Abstract
:The significant presence of variable-speed wind turbines in worldwide power systems has led to planners and grid operators requiring them to participate in frequency control tasks. To address this demand, a large number of wind frequency control proposals have been reported in the literature in recent years. Many of these solutions have been tested by specific experiments carried out in computer simulation environments. This paper proposes a methodology to evaluate the effects of enabling frequency support by wind turbines on the magnitudes that characterize the inertial response of a power system by using an analytical approach. The derived formulation and the illustrations are designed to provide a better understanding of both the mechanisms that determine the frequency stability indices and the improvement achieved by enabling the inertial response of wind turbines by implementing a virtual inertia-based method on the active power controllers of these machines. To facilitate the comprehension of the results obtained, the analytical approach is complemented with time-domain simulations in a predefined test system implemented in MATLAB/Simulink®. The proposed methodology achieves a generalization of the results and can be used for the assessment of any power system configuration.
1. Introduction
The imminent depletion of fossil fuel reserves, the growing concern for the preservation of the environment and the constant increase in energy needs are some of the factors that have motivated the use of renewable energy sources for production of electrical energy in recent decades. From the various alternatives available for the use of non-conventional renewable energy resources, wind generation has been making its way in the electricity generation market, so that, nowadays, it presents a significant share of participation in the energy mix of many power systems in the world and a high level of technological maturity [1,2]. Among the factors that have motivated this trend in the use of this generation technology are: the cost of the energy produced, the annual availability of the resource, the efficiency in energy conversion, the geographical areas required for its exploitation and the flexibility to respond to the technical requirements of the grid operator. However, the variable nature of wind and the uncertainty associated with its prediction make wind generation management complex, compared to conventional electricity generation, making its integration into the grid somewhat difficult, even more so when the level of its participation becomes significant [3,4].
One of the main challenges the grid operator must deal with in its effort to guarantee the quality, stability and reliability standards of the system, is related to frequency control, a task that has traditionally been performed by spinning synchronous generation. When the power system begins to experience an important penetration level of wind generators, displacing synchronous ones, the inertial response that the remaining generators can provide could be seriously weakened [5,6]. This is because wind generators do not contribute to the equivalent inertia of the system, since their mode of operation differs from that of conventional synchronous generators. A variable speed-wind turbine varies its rotor speed, depending on the availability of the primary energy resource, with the aim of optimizing the efficiency in the conversion of wind energy into mechanical energy in its rotor [7]. Consequently, the rotor speed of this machine is decoupled from the grid frequency and, therefore, its inertial resources cannot be directly exploited by the power system in order to ensure an acceptable frequency stability level [8].
To address this concern, many researchers have investigated the Load Frequency Control (LFC) in high penetrated power systems in recent years. A decentralized model of LFC of interconnected power systems with a massive integration of wind generation with stochastic fluctuations is presented in [9]. In addition, research reported in [10] describes the application of genetic and fuzzy logic controller on LFC in a power system dominated by variable-speed wind turbines devised to enhance the system frequency response. In [11], an exhaustive literature review on the topic of LFC addressing its challenges and opportunities in conventional, modern and future power systems is presented.
The apparition of unintentional electrical islands is another problem of interest in literature due to the massification of distributed generators, particularly in weak or isolated systems and microgrids. In networks with these characteristics, wind turbines controllers must be able to detect an off-grid operation and disconnect to avoid safety hazards and damage to the electrical infrastructure [12,13]. Nowadays, there are many methods of islanding detection that can be classified into three groups: passive, active, and communication-based [14]. An effective passive islanding detection algorithm for all types of distributed generators is designed in [15]. There, the measured frequency, voltage, and current are used by the proposal to successfully discriminate the islanding and non-islanding operating mode, as it is evidenced by simulation results on the IEEE 13-bus distribution system. Examples of active islanding detection methods are presented in [16,17], where an advanced method based on synchronized injection of small AC-signals and a control algorithm based on the observation and disturbance technique are proposed, respectively. Finally, ref [18] reports a communication-based islanding detection algorithm, where an intelligent micro-phasor measurement unit is leveraged for islanding detection. The design also includes a cyber-attack shield feature.
In case of extreme frequency collapse caused by a severe instantaneous imbalance between generated and consumed power, under-frequency load shedding (UFLS) procedure is a commonly accepted solution to avoid a power outage. Examples of recently published scientific contributions on this topic are found in [19,20]. In [19], a novel UFLS-method for inverter-based microgrids by using droop-characteristics is proposed. This method is aimed at estimating the power deficit, in several shedding stages, without using a broad communication platform. In [20], the use of higher order polynomial curve fitting to predict the minimum frequency and the power deficit is proposed. This technique leads to obtaining an improved UFLS scheme, whose effectiveness is proved by simulation in a real power system.
Now, getting into the research scope of this work, currently, there is considerable interest in addressing the technical challenges posed by the massive integration of wind turbines on the grid in terms of frequency support, evidenced in the publication of a significant number of works that present highly innovative proposals. For example, the following literature proposes different control techniques that implement an inertial response capability in a wind turbine similar to that offered by a conventional synchronous generator: a temporary frequency-support scheme designed to improve the frequency nadir while ensuring rapid frequency stabilization, particularly for high wind power penetration levels, is presented in [7]. The effectiveness of that proposal is evaluated in the IEEE-14 bus test system implemented in EMTP-RV simulator. A methodology for the analysis of frequency dynamics in large-scale power systems with a high level of wind energy penetration by means of a simplified model for wind generators and load frequency control-scheme is presented by the authors in [21]. In this work, an aggregated representation of the Spanish bulk system is used as a test bench in MATLAB/Simulink® simulation tool. In addition, by using a similar approach to a previous work, a novel frequency sensitive-based virtual inertia control to extract the kinetic energy of the wind turbine and stored energy from the DC-link capacitor for short-term grid frequency regulation is proposed in [22]. There, the MATLAB/Simulink® simulation results are complemented with hardware-in-the-loop simulations implemented in OPAL-RT software. An exhaustive assessment of the impact on the grid by wind power short-term frequency support by taking advantage of pitch angle de-loading [23], kinetic energy extraction [24], and wind turbine over-speeding is investigated [25]. A common aspect that characterizes all these research papers is the use of MATLAB/Simulink® as a simulation tool, except for [25] which assessed the effectiveness of its proposal in the IEEE-39 bus system implemented in DIgSILENT/PowerFactory software. In all the works described here, very promising results are obtained that justify the participation of wind turbines in grid frequency control tasks. Conclusions from these works are based on both simulation and experimental tests under certain operating scenarios and controlled environments, designed to accurately evaluate the benefits of the proposed control strategies. To address the study of frequency stability issues in power systems, two main different approaches can be found in the literature: one based on the concept of load frequency control (LFC) [26,27], and the other based on detailed computational simulations, sometimes including hardware-in-the-loop [28], or real-time simulations [29]. Each approach has its capabilities and advantages, although one can complement the other [30]. The literature review presented here shows that there are innovative proposals that successfully address the problem of high-level penetration of wind generators when these participate in the frequency control tasks. Various computer simulation programs are used to evaluate the proposals on a test-bench designed for the purpose of applying different approaches regarding the detailed representation of the system under analysis. From this review, it has been found that: (1) none of these studies offers a detail of how the corrective actions of the frequency control support by wind generators might impact on the parameters that define the inertial characteristics of the system as a whole, and (2) the proposals for participation of wind generators in frequency control are evaluated on specific operating scenarios under controlled environments.
In the first case, the cited papers conclusions are based on the final response of the system when the frequency control actions of the wind turbines are implemented. Although, in these results the reduction of frequency nadir and rate of change of frequency (RoCoF) when enabling frequency support by wind turbines is evident, it is not possible to identify which specific characteristic of the implemented frequency control strategy in wind turbines is responsible for improving both the equivalent inertia constant as the damping constant of the system. Finding this relationship would lead to a better understanding of the effect of the implementation of fast-frequency response by wind turbines on the short-term operation of the system.
In the second case, the design, modeling, and simulation of a specific test-bench to evaluate the performance of the wind-frequency control strategies, provide a restricted vision of the problem, since it would be necessary to carry out as many simulations as so many scenarios need to be represented with different operating conditions (for example, various wind generation penetration levels and incoming wind speeds) in order to obtain more general results.
These research gaps have motivated the development of our proposal, which consists of:
- The proposal of a methodology for deriving the LFC-transfer function of a weak and isolated power system that incorporates the participation of wind turbines in frequency control, which is based on the theory of small-signal analysis. With the derived LFC-transfer function, the authors design an analysis tool devised for studying the frequency response of the power system under contingency by considering all the possible scenarios characterized by different wind penetration levels and wind speed conditions. The numerical evaluation of the LFC-transfer function to get the main parameters that characterize the inertial response of the whole system, instead of implementing a specific test system in simulation, make it possible to represent a vast number of contingency scenarios without these having to run one at a time in the simulation environment.
- With the numerical results generated, an inertial chart is designed to show the locus of the values of the main frequency response parameters: frequency nadir and time-derivative of frequency as a function of the equivalent constant of inertia of the system. The resulting chart provides an outlook of the status of the frequency resilience of the system when wind generation is incorporated in substitution of the synchronous one.
- Based on the symbolic representation of the derived transfer function, this work proposes a method to identify which specific inertial parameters of the system (equivalent inertia constant or damping constant) the frequency response by wind turbines really impacts. This is done with the purpose of providing a comprehensive understanding of the corrective action provided by wind generation during its contribution to smoothing grid frequency fluctuations.
This work is organized as follows: Section 2 presents the conceptual framework and the analytical approach to the problem of primary frequency control in a power system and introduces a case study. As an example of a frequency control strategy for wind turbines, Section 3 explains the theoretical foundation and mechanics of the extended optimized power point tracking (OPPT) method [21] to allow for a better understanding of Section 4, which constitutes the main part of the work. Section 4 proposes a methodology for the assessment of the effects on the magnitudes that characterize the inertial response of the whole power system when wind turbines contribute to frequency support tasks. The application of the methodology is illustrated with the implementation of the OPPT method. In addition, the most relevant results are presented here and preliminary conclusions are established. Finally, Section 5 presents the lessons learned in this study.
2. Representation of a Power System for Primary Frequency Control Studies
Figure 1 illustrates the typical time scale of different physical processes involved in the operation and control of a power system [31,32,33,34]. Since the most relevant magnitudes in a frequency control study, i.e., maximum frequency deviation, maximum rate of change of frequency, and frequency deviation in quasi-steady state, take place a few seconds after a disturbance appears, the modeling and analysis efforts used in this work are focused on the time range that characterizes the primary frequency control (see the highlighted time frame in the figure).
2.1. Load Frequency Control Scheme
Within the time frame of interest shown in Figure 1, it is common practice to represent the dynamics of the power system using the LFC approach, in which the dynamics of the mechanical variables of the prime movers of conventional synchronous generation predominates over the dynamics of electromagnetic variables, whose time constants are significantly lower [35,36]. In addition, it can be verified in the same figure that the typical dynamics of the power converter interfacing the wind turbine to the grid is much faster than the mechanical dynamics of the wind turbine. From the perspective of the time frame of interest in this study, the practically instantaneous response of power converters usually leads to their dynamics being ignored in the analytical approach to modeling [33,37]. For that reason, this work focuses its efforts on modeling the power systems components within the time window shaded in Figure 1.
Figure 2 shows the typical representation of the LFC scheme for the case of n operating synchronous generators. The equivalent inertia constant of the synchronous machines is represented by Heq, and is calculated by means of Equation (1), where Hi is the individual inertia constant of each generator and wi is the participation factor, defined as the ratio of the nominal capacity of each generation unit to a certain base power. The introduction of this factor in the scheme is very useful when there is a need to represent different levels of participation of different generation agents, both in demand coverage and frequency support. In Figure 2, ΔPmi is the mechanical power deviation experienced by the speed control system of each generator in response to a deviation of its angular speed, which, for the time frame of interest, is common to all synchronous machines, Δωeq. It is worth noting that this simplification of a unique common frequency for the whole system drastically reduces the integration step in simulations and obtains analytical expressions for describing the dynamic behavior of the power system. The deviation of power demand in the system is denoted by ΔPL. Additionally, the damping constant of the supplied load is represented by Deq. Ri is the droop of each speed controller, whose dynamics is modeled by a transfer function TCi(s).
To evaluate the frequency response of the system, Δωeq, in the event of a disturbance, ΔPL, the following transfer function is derived from Figure 2:
This equation represents the LFC-transfer function of the power system.
2.2. Case Study
A case study for evaluating the effects of the frequency support provided by variable speed-wind turbines on the inertial response of a given power system for facing mismatches between generation and demand is presented in Figure 3. It represents a power system (with a rated frequency of 50 Hz) dominated by thermal and wind generation within a frequency control area. This is a typical case of many island electric systems, in which the excursions of the frequency (either under normal conditions, due to intermittent injection of power from non-conventional renewable energy sources, or in contingency situations, due to the sudden loss of generation units or consumption centers) are very pronounced compared to a continental system [38,39]. In the example illustrated in Figure 3, the thermal generation is represented by the linearized model of the prime mover of a steam turbine and its speed governor [35]. The input, Δωeq, is applied to a droop characteristic, R1, in order to generate signals to be applied to the first-order turbine model with time constant τG (stage of admission of steam to the turbine). Then, the resulting signal is input to a block that represents the dynamics of each turbine stage: from high to lower pressure stages with contribution gain FHP and the time constants THP, TRH, and TCH. More details of this tandem-compound configuration of the steam turbine can be consulted in [35]. Finally, the complete thermal generation model generates a control signal, ΔPm1, intended to compensate the power mismatch in the LFC-scheme.
In the same figure, a block can be seen implementing the mathematical model used to represent the dynamics of the wind generation (variable speed-wind turbine, VSWT) within the LFC scheme. This model, which can be consulted in detail in [40], outputs an active power deviation signal, ΔPg, according to the incoming wind speed v. By default, the wind turbine model dispatches its active power according to an optimal power conversion criterion, and it is not expected that it provides frequency support to the system in any case, unless a wind-frequency control feature is enabled. The latter is discussed extensively in Section 3. The values of all the parameters of these two models are indicated in the Appendix A and Appendix B.
In this example, the thermal unit has an inertia constant H1 = 3.6 s and a participation factor w1 = 0.8 (where the base power is the total generation capacity of the system). Accordingly, the participation of wind generation is 20% (wWT = 0.2). It is also assumed that the wind speed is constant, v = 9.6 m/s, and that the active power of wind turbines is dispatched using the Maximum Power Point Tracking (MPPT) criterion. For the frequency control study, a contingency event characterized by a sudden load increase (for example, due to the loss of part of the operating generation) ΔPL = 1% is analyzed. This situation provokes a grid sub-frequency, through which it is possible to evaluate the inertial response of the system and the effectiveness of the frequency recovery tasks carried out by the synchronous generation. Figure 4 shows some results from simulations (with MATLAB/Simulink®) of the LFC scheme of Figure 3 under the operational situation previously described. It illustrates the time domain behavior of the following variables of interest: deviation of the mechanical power experienced by the primary mover of the synchronous generator, ∆Pm1, active power dispatched by the wind turbine, Pg, frequency of the system, fs, and the absolute value of its time derivative, |ROCOF|.
The simulation results show a typical behavior of these variables in response to a sudden power mismatch: the grid frequency (defined by the synchronous generator speed, Figure 4c) suffers a decay that triggers the frequency recovery task, carried out by the speed controllers of thermal groups (Figure 4a), leading to a maximum deviation, Δfmax = 0.083 Hz, and eventually a new equilibrium point with a quasi-steady deviation Δfqs = 0.03 Hz. Figure 4d shows the evolution of the absolute value of the rate of change of frequency (RoCoF), where its maximum value is |ROCOF|max = 0.0837 Hz/s. Since the power injected into the grid by the wind turbine (Figure 4b) depends solely on the incident wind speed (v = 9.6 m/s), which is assumed constant in this study, no response is expected, in terms of power, to contribute to the frequency recovery process. This situation highlights one of the challenges posed by the incorporation of wind power displacing conventional synchronous generation, as the latter is responsible for guaranteeing the frequency stability of the grid. To maintain the inertial characteristics of the system, wind turbines need to contribute to mitigating these negative effects by providing an effective inertial response.
2.3. Analytical Approach to the Problem
The simple experiment carried out in the previous subsection has been designed to warn the reader about the need to involve non-synchronous generators (e.g., variable speed-wind turbines), whose integration in an electrical system implies a displacement of conventional synchronous generation that is detrimental to the equivalent inertial response of the system. In order to broaden the results obtained up to this point and to draw more general conclusions, this problem is now approached analytically, taking the transfer function of the previous power system as a starting point. This function is presented in Equation (3), obtained from the definition expressed in Equation (2) and particularized for the system outlined in Figure 3. As it can be seen in the resulting expression, the response of the system frequency, Δωs, to a disturbance, ΔPL, is by no means conditioned by any parameter or variable related to the incorporated wind generation. This is because, as demonstrated in the previous example, the criterion with which variable speed-wind turbines deliver their active power makes a natural inertial response from this machine impossible. Therefore, it is to be expected that the higher the level of participation of these generators, the poorer the inertial response that the resulting conventional synchronous generation can provide to face power imbalances.
From the expression in Equation (3), it is possible to systematically analyze the frequency response of the system to a certain disturbance with different levels of participation of synchronous generation in frequency control tasks. For example, the response to a ΔPL = 0.01 pu step (as defined in Section 2.2) is evaluated below for all possible values of w1. The numerical calculation of the step response is focused on the evaluation of the following quantities:
- Peak value of the step response, max{Δωs(t)}: for calculation of the maximum frequency deviation, Δfmax.
- Steady state value of the step response, limt→∞{Δωs(t)}: for calculation of the quasi-steady state frequency deviation, Δfqs.
- Maximum absolute value of dΔωs/dt: for calculation of |RoCoF|max.
From this numerical procedure, the set of curves illustrated in Figure 5 is obtained, where the different participation factors, w1, are expressed in terms of the equivalent inertia constant, Heq, normalized for the base case (w1 = 0.8). In this example, 100 possible values of w1 have been used to evaluate Equation (3), which means that the generated chart represents an equal number of simulated scenarios. In this chart, each simulation result is represented by one round marker placed over the corresponding curve. For this example, the chart contains a total of 300 numerical results (∆fmax, ∆fqs, and |ROCOF|max) for 100 simulated scenarios. If the user requires a chart with a higher resolution, a finer variation of the values of participation factors, w1, must be done. The inertial chart of Figure 5 allows for visualizing the effect of conventional synchronous generation displacement on the parameters that characterize the inertial response of the system within the time frame of interest. As a fact, the inertial characteristics of the system under study tend to degrade as operating synchronous generation is displaced. Therefore, non-synchronous generators should participate in the frequency recovery tasks in a similar way as the displaced conventional synchronous units did. In Figure 5 it can be seen that, for the base case (in which thermal generation is 80% of the total installed capacity), the numerical results obtained from evaluation of Equation (3) are very close to those achieved by simulation in Figure 4.
3. Frequency Support Provided by Wind Generation
3.1. Method Based on the Concept of Virtual Inertia
Making use of the significant amount of inertial resources available in a wind turbine, several works (e.g., [7,21,22,23]) address the issue of providing an effective inertial response from this machine, so that it participates in the grid frequency control. This is achieved through additional control loops that complement the main MPPT controllers of the wind turbine. These auxiliary control loops introduce additional active power set points, depending on the system requirements, as a function of the frequency deviation that may exist, thereby enabling an inertial response from the wind turbine. At this point, it must be taken into account that this inertial response would be forced, controlled, virtual, or synthetic, but energetically supported by a real physical property of the wind turbine: its natural inertia.
To fulfill the central objective of this work, the virtual inertia control strategy proposed by the authors in [21], called the extended optimized power point tracking (OPPT) method, whose mechanics are explained below, has been considered. Generally, the active power dispatched by variable speed wind turbines follows a set point signal, PMPPT, which is applied to the corresponding control system implemented in the machine. Equation (4) shows the definition of this signal for the optimization zone, where: fKopt is a multiplication factor (equal to unity, by default), Kopt is the optimization constant of the turbine (which depends on aerodynamic and constructive characteristics of the rotor), and ωg is the shaft speed. If this expression is plotted on the P-ω plane of the wind turbine, taking into account the technical limits of the machine, the locus shown in Figure 6 (blue line) is obtained, known as the MPPT curve.
The control function of the extended OPPT method is shown in Equation (5), where: ωg0 is the rotor speed prior to the requirement of frequency support, kvir is a design constant of the method, Wvir is a weighting factor, and HWT is the inertia constant of the wind turbine. This expression, derived in detail in [21], has two components that determine the magnitude of the wind inertial response sought: one dependent on the grid frequency deviation, Δfs, and another dependent on the time derivative of frequency, dfs/dt.
where .
To explain the inertia emulation process of the wind turbine achieved by implementing the extended OPPT method (whose implementation scheme in the active power control system of the wind turbine is illustrated in Figure 7), let us return to Figure 6. Starting from the hypothesis that the wind turbine is driven by a constant wind speed (v = 9.6 m/s), under normal operating conditions, the generator will deliver an active power PA, associated with a speed ωg0, according to the MPPT control. If, for example, the power system experiences an underfrequency event caused by a sudden decompensation between generated and consumed power, the presence of non-zero values of Δfs and dfs/dt in Equation (5) will cause the corresponding implementation scheme to start the inertial response emulation process by moving the MPPT curve upwards, in order to drive the operation of the wind turbine towards point B of its P-ω characteristics.
At this point, the value adopted by PB will depend on the severity of the frequency event, measured in terms of the magnitude of Δfs and dfs/dt. Under this operational situation, the value of the active power extracted from the electric generator will exceed the value of the mechanical power delivered by the turbine, causing an internal power imbalance, which will lead to the deceleration of the rotating masses of the wind turbine. This use of kinetic energy, seen as a decrease in the speed of the turbine-generator set, moves the operating point from B to C, following the path imposed by the MPPT curve shifted to the left. At point C, the active power produced by the generator, PC, equals again the mechanical power given by the turbine, at a new equilibrium condition. The excursion of the active power of the wind turbine along the path A→B→C makes its contribution to the frequency support of the system feasible. Once this support is finished, the method forces the turbine to recover an optimal operating condition (point A), thus preparing it to meet future requirements. Similarly, in case of an over-frequency event in the system, the inertial support provided by the turbine will follow the path A→D→E→A by shifting the MPPT curve downwards.
3.2. Evaluation of the Inertial Response Provided by the Wind Turbines in the Study System
Figure 8 shows the simulation results of implementing the scheme of Figure 7 in the wind turbines that integrate the power system under study. The benefits of using the kinetic energy available in a wind turbine to contribute to the grid frequency support can be appreciated. First, the inertial response of wind generation to the frequency drop (Figure 8b) makes the mechanical power control action from thermal generation somewhat smoother and of a lower magnitude (Figure 8a). The combined control action of wind and thermal generation in frequency support gives, in this case, a 24% reduction of the maximum frequency deviation, compared to the base case (Figure 8c). Additionally, a 19% reduction in the maximum magnitude of RoCoF is obtained (Figure 8d). Here, it is important to note that the results presented are due to a particular wind generation situation. The effectiveness of the virtual inertia algorithm (extended OPPT-method) in reducing Δfmax and |RoCoF|max will depend, on the one hand, on the magnitude of the disturbance (measured in terms of the state of Δfs and dfs/dt), and on the other hand, on the level of kinetic energy stored in the machine before the request for the frequency support service (see the influence of the term ωg0 in Equation (5)). Since the shaft speed, ωg0, is determined by pre-existing wind conditions, a more general analysis is required. This is discussed in detail in the next section.
4. Effect of the Frequency Support from Wind Turbines on the Inertial Characteristics of the System
4.1. Linearization of the Extended OPPT Method
In order to study the effects that frequency support from wind generation has on the inertial characteristics of the system, similar to the analysis presented in Section 2.3, it is necessary to include the particular control function of the frequency control method used, in this case the extended OPPT one in Equation (5), in the transfer function of Equation (3) that defines the dynamics of the system within the time frame of interest to this work. To get a rational transfer function, in the first place, it is necessary to carry out a linearization process.
Considering the term dependent on Δfs in Equation (5):
Since, in frequency stability studies, small disturbances are considered (that is, Δfs ≈ 0), it is possible to linearize the previous expression as follows:
Then, as explained in Section 3.1, an increase in the active power dispatched by the wind turbine, by shifting the MPPT curve upwards (from point A to point B in Figure 6), can be formulated as follows:
By substituting Equation (7) in Equation (8), and making Δfs[pu] = Δωs[pu]:
With some algebra in Equation (10) and expressing ωs in terms of its deviation from the nominal value ωs0:
Considering small disturbances (Δωs≈ 0): , and the previous equation can be reduced to:
Then, adding Equations (9) and (12) to obtain the control function of the linearized extended OPPT method and taking into account the weighting factor of the frequency derivative dependent term, Wvir, in the Laplace domain:
Or, in compact form:
Next, in order to evaluate the numerical accuracy of the linearization process with respect to the control method outlined in Figure 7 and implemented on the diagram in Figure 3, the control function in Equation (14) is included in the transfer function of the power system in Equation (3), finally being:
where: and .
At this point, it is essential to discuss the scalability and the complexity of the developed model in larger power systems with their generation units disaggregated. In order to obtain a general equation for implementing the proposal on a multimachine power system, let us take the complete transfer function in Equation (15) and pay particular attention to the denominator terms. The contribution to the grid-frequency support from synchronous generator and wind turbine, SG1(s) and WT1(s) terms, respectively, can be extracted from Equation (15) and defined as follows:
According to the representation of the LFC-scheme for a multimachine power system illustrated in Figure 2, and expressed in Equations (1) and (2), the denominator term corresponding to the synchronous generation speed governor model and its inertia in Equation (16) can be extended to the case of n-synchronous generation units, as below:
where, Hi, Ri, wi and TCi are the parameters and functions of the ith synchronous generator unit (similar to those introduced in Section 2.1).
Now, if we consider the denominator term corresponding to the wind turbine equipped with a frequency control characteristic (extended OPPT-method, in this study), as in Equation (17), it can be extended to the case of N-wind turbines as:
where, α’i, β’i, and wWTi are functions and parameters of the ith wind turbine that incorporates a frequency response characteristic. Note that, according to the definition of α and β in Equation (13), αi and βi will depend on the pre-disturbance rotor speed ωg0i, which is a function of the incoming wind speed to the ith wind turbine, vi (see Appendix D). If the user is interested in disabling the participation of a specific wind turbine in frequency support, it is enough to make the corresponding functions α’i and β’i equal to zero.
Finally, the general form of the transfer function for the implementation of the proposed method in case of multimachine power systems is:
Now, returning to our case of study, note that, in Equation (15), the transfer functions of the high pass and low pass filters (from the Δfs and dfs/dt dependent loops of Figure 7) have been included. The final form of this transfer function is the one that was sought to fulfill the main objective of this research.
Finally, the control action of the extended OPPT method can be expressed as follows:
It is important to note that, since the linearized model, which represents the inertial response by the wind generation, that has been incorporated into the transfer function of the power system Equation (15) does not take into account the dynamics of the wind turbine’s mechanical system, its accuracy will be limited to a time window of the order of the wind turbine’s natural inertia constant, HWT (which for the model considered, corresponds to a value of 5.29 s). This can be verified in Figure 9, where the inertial response offered by the wind turbine for the studied contingency scenario (∆PL = 1%) has been plotted using two approaches: the exact one, by implementing Equation (5) in the electromechanical model of the wind turbine (Figure 3), and the linearized one, by means of the direct application of Equation (21) in the LFC-transfer function of the power system (Equation (15)). The values for the numerical evaluation of Equation (21) can be found in the Appendix B, Appendix C and Appendix D.
Note that the error when using the linearized approach does not exceed 0.4% in any case. This is reflected in the high numerical accuracy of the results in terms of frequency and its derivative (Figure 10) within the time frame of interest.
4.2. Evaluation of the Effect of Wind Generation Contribution to Frequency Support on the Inertial Characteristics of the System
After evaluating the numerical accuracy of the approximate approach, this section follows a procedure similar to that described in Section 2.3 (which led to the results of Figure 5) to evaluate the transfer function in Equation (15), considering the same contingency event for different incident wind conditions and different values of the participation factor, w1. As a result, the inertial charts in Figure 11 are obtained, which show the effect of the displacement of the spinning synchronous generation on the Δfmax and |RoCoF|max indicators when the contribution of wind generators to frequency support is enabled. Since 100 different values of w1 were assigned, each of the curves represents 100 simulated scenarios. This figure shows the corrective action of wind turbines if the extended OPPT method is implemented. The participation of these generation units in the frequency recovery contributes to reducing the level of degradation of the inertial characteristics of the system as a whole, the benefit being much more pronounced, the higher the wind speed is. The fact that the increase in wind generation penetration has the effect of shifting the curves upwards means that the contribution of wind generators to frequency support makes their integration (displacing synchronous generators) less harmful, in terms of the parameters of interest: Δfmax and |RoCoF|max.
To better understand the corrective effect that the implementation of the wind turbine frequency control strategy has on the inertial response of the system, one can take a look at the denominator of the transfer function in Equation (15). By regrouping terms, it is possible to write the following expressions:
From Equations (22) and (23) it is inferred that the loop of the extended OPPT method dependent on dfs/dt directly influences the equivalent inertia constant of the system, HT (influence of the term β’), whereas the loop dependent on Δfs affects the equivalent damping constant of the system, DT (effect of the term α’). Therefore, when the extended OPPT control scheme starts operating during the frequency event, it forces the wind turbine to produce variations in the active power injected into the grid, in such a way that the system perceives a variation in its HT and DT parameters, although temporarily and while the control action implemented in the wind turbine lasts.
To provide a notion of this phenomenon in the time domain, the case study presented in Section 3.2 will be considered again. According to Equation (21), the dynamics of coefficients α’ and β’ can be calculated by using Equations (24) and (25), respectively, using the numerical results obtained when evaluating Equation (15).
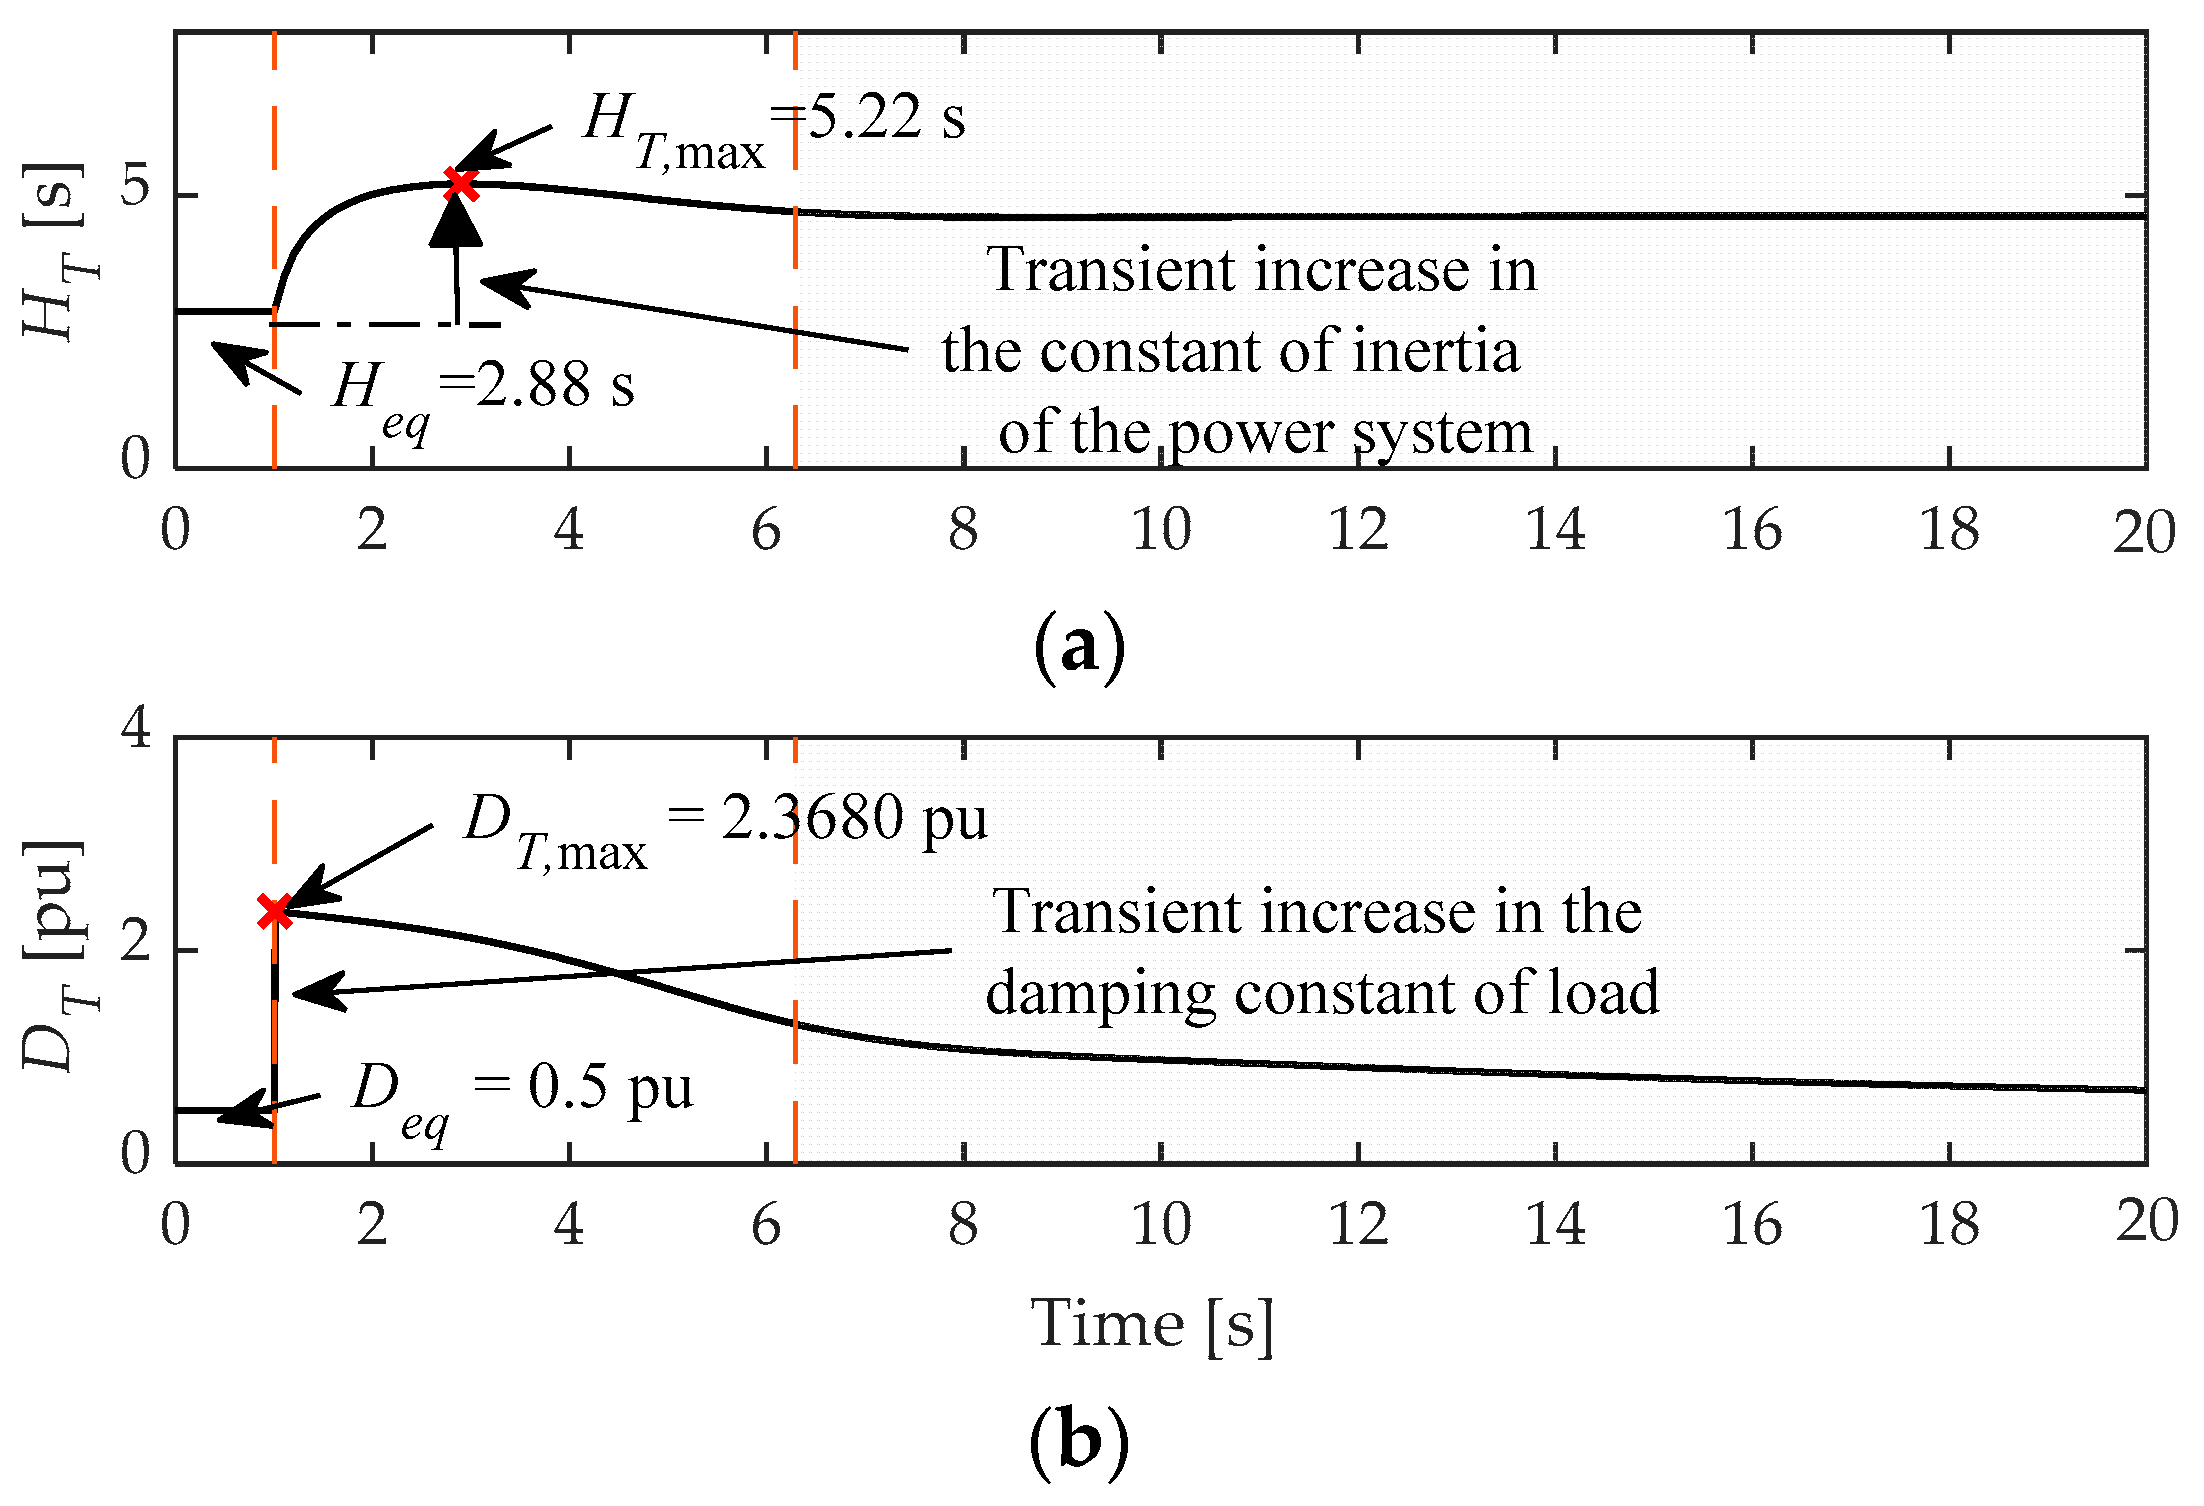
Finally, by replacing the results of this calculation in expressions Equations (22) and (23), it is possible to obtain the dynamics of HT and DT (Figure 12), whose precision, once again, is limited to the time interval covered by HWT (the unshaded time window). Note in this figure that the participation of wind generation in the frequency support of the system has an amplifying effect of the synchronous equivalent constant of inertia of the system, HT, even as to double the pre-disturbance value at a specific moment. Theoretically, it is expected that, once the wind power participation has ended, HT will stabilize at a new value, defined only by the spinning synchronous generation.
The main effect of the transient increase of HT on the inertial characteristics of the system is the reduction of |RoCoF|max with respect to the base case, as already shown in Figure 8d and Figure 11b. Something similar happens with the dynamics of DT. The implemented virtual inertia method introduces a sudden and significant increase in the equivalent damping constant of the load, a fact that contributes to the reduction of the Δfmax (Figure 8c and Figure 11a). In this case, the tendency of DT to recover its original Deq value, as the wind turbine contribution to frequency control ends, is evident.
5. Conclusions
This paper proposes a methodology for the analysis of the effects of the contribution of wind generation to frequency control tasks on the inertial characteristics of power systems. This problem is approached from an analytical perspective through the study of the transfer function that represents the dynamics of the system frequency in response to power disturbances in the primary frequency control stage. This analytical approach allows the researcher to go from implementing a specific test system in a time-domain simulation to directly studying the results generated by the numerical evaluation of the wind-penetrated power system transfer function, in order to get the main parameters that characterize the inertial response of the whole system. In this way, it is possible to represent a vast number of contingency scenarios without these having to be run one at a time in the simulation environment, as has been a common practice in the literature. With these results, an inertial chart that represents the locus of the frequency nadir and its maximum time derivative, as a function of the wind-penetration level and the incoming wind speed, is constructed to show the improvement of the frequency recovery capability of the whole system offered by the participation of the wind generation in the frequency control task. As seen by the example plotted in Figure 11, 100 possible scenarios of wind generation penetration in the system were represented, each one evaluated for five different wind conditions and one base case (600 scenarios to quantify the frequency nadir and 600 to evaluate RoCoF; 1200 numerical results in total). These results were generated by the proposed analysis tool in a single run.
Furthermore, with the symbolic form of the derived transfer function it is possible to identify the influence of implementing virtual inertia in wind turbines on the equivalent system inertia constant and load damping constant (Equations (22) and (23)). Both parameters are decisive in characterizing the equivalent inertial response of the power system as a whole, measured in terms of the maximum frequency deviation and its maximum rate of change. In the particular case used as an example illustrating the proposed methodology, the results of this analysis (Figure 12) show the benefits achieved by promoting the participation of wind generators in this task for the operation and control of a power system, reducing the negative impact of their massive integration in terms of an adequate frequency response to power imbalances: on the one hand, the equivalent constant of inertia of the system is transiently boosted (Figure 12a), passing from the pre-disturbance value 2.88 s to 5.22 s in the fast-frequency response stage. This improvement of the inertial characteristics caused by wind generation leads to a decrease in the frequency nadir by about 24% to the base case (Figure 8c). On the other hand, with the participation of wind turbine in the frequency control tasks, the instantaneous load damping constant is rapidly increased after the disturbance appears, passing from a steady-state value of 0.5 pu to 2.368 pu (Figure 12b). This effect explains the mitigation of the frequency change rate (Figure 8d), where the maximum absolute value of RoCoF reduces by about 19% if it is compared with the base case. Without Equations (22) and (23), derived through the proposed methodology, it would have been complicated to identify the influence of the fast-frequency response from wind turbines on the system parameters Heq and Deq. This application justifies the benefits of the analytical approach used for the design of the proposal.
It also constitutes an analytical tool that allows for obtaining general conclusions and having a first vision about the behavior of the system under contingency and how different control parameters affect this behavior. For example, it can be used as a tuning tool for the virtual inertia controllers of wind turbines. It can also be used to understand the interactions with other elements connected to the network through power electronics. Of course, it is a high-level analysis that needs to be complemented with detailed studies for each specific case.
Finally, it is important to note that the spirit of this paper is to present to the scientific community the formulation and benefits of the proposed methodology. Thus, in order to achieve a final model that can be run with a low computational burden without punishing the numerical accuracy of the tool, some simplifications have been introduced: use of linearized models of the speed-governor of the synchronous generation, linearization of the frequency control characteristic of wind turbines, disregard of the dynamics of wind turbine power converters and non-linearities, among others. All these practices are well justified in the literature, and they have been indicated in the corresponding part of the article’s body.
Author Contributions
D.O.: conceptualization, methodology, software, validation, investigation, resources, data curation, writing—original draft, writing—review and editing, visualization, funding acquisition. S.M.: conceptualization, methodology, validation, resources, writing—review and editing, supervision, project administration, funding acquisition. All authors have read and agreed to the published version of the manuscript.
Funding
This work was supported by the Secretaría de Educación Superior, Ciencia, Tecnología e Innovación (SENESCYT), Government of the Republic of Ecuador [grant number 2015-AR6C5141] and by the Spanish National Research Agency Agencia Estatal de Investigación [grant number PID2019-108966RB-I00/AEI/10.13039/501100011033].
Conflicts of Interest
The authors declare no conflict of interest.
Nomenclature
| LFC | Load frequency control |
| AC | Alternating current |
| UFLS | Under-frequency load shedding |
| MPPT | Maximum power point tracking |
| OPPT | Optimized power point tracking |
| VSWT | Variable speed-wind turbine |
| WT | Wind turbine |
| n | Number of operating synchronous generators |
| N | Number of operating variable speed-wind turbines |
| Heq | Equivalent inertia constant of the synchronous generators |
| Hi | Individual inertia constant of the ith generator |
| wi | Participation factor of the ith generator |
| ΔPmi | Mechanical power deviation of the ith generator |
| Δωeq | Equivalent rotor speed of synchronous generators |
| ΔPL | Load power deviation |
| Deq | Damping constant of load |
| TCi(s) | Prime mover transfer function of the ith generator |
| Δfmax | Maximum grid frequency deviation |
| Δfqs | Quasi-steady grid frequency deviation |
| RoCoF | Rate of Change of Frequency |
| Δωs | Angular frequency of the system |
| dΔωs/dt | Time derivative of angular frequency of the system |
| PMPPT | Optimal power dispatched by wind turbine |
| fKopt | Virtual inertia multiplication factor |
| Kopt | Optimization constant of the wind turbine |
| ωg | Rotor speed of the wind turbine |
| ωg0 | Pre-disturbance rotor speed of the wind turbine |
| kvir | Virtual inertia design constant |
| Wvir | Virtual inertia weighting factor |
| HWT | Inertia constant of the wind turbine |
| Δfs | Grid frequency deviation |
| dfs/dt | Time derivative of grid frequency |
| v | Wind speed |
| |RoCoF|max | Maximum absolute value of RoCoF |
| ∆Pg | Output active power deviation of the wind turbine |
| Two | Virtual inertia wash-out filter time constant |
| Tlp | Virtual inertia low-pass filter time constant |
| HT | Equivalent inertia constant of the system |
| DT | Equivalent damping constant of the system |
| Ri | Droop of the ith generator speed controller |
| τG | Main servo time constant (thermal generation) |
| FHP | Fraction of total turbine power (thermal generation) |
| TRH | Reheater time constant (thermal generation) |
| TCH | Time constant of main inlet columns and steam chest (thermal gen.) |
Appendix A
Appendix B
Parameters of the wind turbine model [21]:
- Rated power (base power): Pbase = 1.5 MW.
- Wind speed base (Pvbase = 0.73 pu): vbase = 12 m/s.
- Optimization constant: Kopt = 0.4225.
- Turbine-generator inertia constant: HWT = 5.29 s.
- Pitch controller gains: KPpc = 500, KIpc = 0.
- Speed controller gains: KPsc = 3, KIsc = 80.
Appendix C
Parameters of the frequency control scheme of the wind turbine: Kopt = 0.4225, kvir = 8, Wvir = 0.2, Two = 10 s, Tlp = 100 ms.
Appendix D
Calculation of the pre-disturbance rotor speed of the wind turbine, ωg0, depending on the incident wind condition, v0:
, where Cp(λ,β) is the power coefficient of the turbine [40], which reaches a maximum value of Cp,max = 0.48 under optimal operating conditions. For example, an incoming wind speed of 9.6 m/s generates a pre-disturbance rotor speed of 0.96 pu.
References
- Chang, Y.; Phoumin, H. Harnessing Wind Energy Potential in ASEAN: Modelling and Policy Implications. Sustainability 2021, 13, 4279. [Google Scholar] [CrossRef]
- Shourangiz-Haghighi, A.; Diazd, M.; Zhang, Y.; Li, J.; Yuan, Y.; Faraji, R.; Ding, L.; Guerrero, J.M. Developing More Efficient Wind Turbines: A Survey of Control Challenges and Opportunities. IEEE Ind. Electron. Mag. 2020, 14, 53–64. [Google Scholar] [CrossRef]
- Martínez-Lucas, G.; Sarasúa, J.I.; Pérez-Díaz, J.I.; Martínez, S.; Ochoa, D. Analysis of the Implementation of the Primary and/or Inertial Frequency Control in Variable Speed Wind Turbines in an Isolated Power System with High Renewable Penetration. Case Study: El Hierro Power System. Electronics 2020, 9, 901. [Google Scholar] [CrossRef]
- Probst, O.; Minchala, L.I. Mitigation of Short-Term Wind Power Ramps through Forecast-Based Curtailment. Appl. Sci. 2021, 11, 4371. [Google Scholar] [CrossRef]
- Nguyen, N.; Mitra, J. Effect of wind power on load frequency control. In Proceedings of the 2016 IEEE Power and Energy Society General Meeting (PESGM), Boston, MA, USA, 17–26 July 2016; pp. 1–5. [Google Scholar]
- Alam, M.S.; Alotaibi, M.A.; Alam, M.A.; Hossain, M.A.; Shafiullah, M.; Al-Ismail, F.S.; Rashid, M.M.U.; Abido, M.A. High-Level Renewable Energy Integrated System Frequency Control with SMES-Based Optimized Fractional Order Controller. Electronics 2021, 10, 511. [Google Scholar] [CrossRef]
- Yang, D.; Kim, J.; Kang, Y.C.; Muljadi, E.; Zhang, N.; Hong, J.; Song, S.-H.; Zheng, T. Temporary Frequency Support of a DFIG for High Wind Power Penetration. IEEE Trans. Power Syst. 2018, 33, 3428–3437. [Google Scholar] [CrossRef]
- Fernández-Guillamón, A.; Gómez-Lázaro, E.; Molina-García, Á. Extensive frequency response and inertia analysis under high renewable energy source integration scenarios: Application to the European interconnected power system. IET Renew. Power Gener. 2020, 14, 2885–2896. [Google Scholar] [CrossRef]
- Magdy, G.; Shabib, G.; Elbaset, A.A.; Kerdphol, T.; Qudaih, Y.; Bevrani, H.; Mitani, Y. A Novel Design of Decentralized LFC to Enhance Frequency Stability of Egypt Power System Including Wind Farms. Int. J. Energy Convers. IRECON 2018, 6, 17–29. [Google Scholar] [CrossRef] [Green Version]
- El-Saady, G.; Youssef, A.M.; Ibrahim, E.-N.M.; Nour-Eldin, S.A. Effect of Wind Driven Double-Fed Induction Generator upon the Stability of decentralized power systems via Load Frequency Controllers design. In Proceedings of the 2019 21st International Middle East Power Systems Conference (MEPCON), Cairo, Egypt, 17–19 December 2019; pp. 803–808. [Google Scholar]
- Alhelou, H.H.; Hamedani-Golshan, M.-E.; Zamani, R.; Heydarian-Forushani, E.; Siano, P. Challenges and Opportunities of Load Frequency Control in Conventional, Modern and Future Smart Power Systems: A Comprehensive Review. Energies 2018, 11, 2497. [Google Scholar] [CrossRef] [Green Version]
- IEEE Guide for Design, Operation, and Integration of Distributed Resource Island Systems with Electric Power Systems; IEEE: New York, NY, USA, 2011; pp. 1–54. [CrossRef]
- Murugesan, S.; Murali, V. Hybrid Analyzing Technique Based Active Islanding Detection for Multiple DGs. IEEE Trans. Ind. Inform. 2019, 15, 1311–1320. [Google Scholar] [CrossRef]
- Murugesan, S.; Murali, V. Decentralized Unintentional Islanding Identification for Converter-Interfaced Multiple DGs. IEEE Trans. Ind. Inform. 2021, 17, 4512–4520. [Google Scholar] [CrossRef]
- Abyaz, A.; Panahi, H.; Zamani, R.; Haes Alhelou, H.; Siano, P.; Shafie-khah, M.; Parente, M. An Effective Passive Islanding Detection Algorithm for Distributed Generations. Energies 2019, 12, 3160. [Google Scholar] [CrossRef] [Green Version]
- Karimi, M.; Farshad, M.; Hong, Q.; Laaksonen, H.; Kauhaniemi, K. An Islanding Detection Technique for Inverter-Based Distributed Generation in Microgrids. Energies 2021, 14, 130. [Google Scholar] [CrossRef]
- Kaewthai, S.; Ekkaravarodome, C.; Jirasereeamornkul, K. Novel disturbance and observation based active islanding detection for three-phase grid-connected inverters. J. Power Electron. 2021, 21, 438–450. [Google Scholar] [CrossRef]
- Shukla, A.; Dutta, S.; Sadhu, P.K. An island detection approach by μ-PMU with reduced chances of cyber attack. Int. J. Electr. Power Energy Syst. 2021, 126, 106599. [Google Scholar] [CrossRef]
- Dehghanpour, E.; Karegar, H.K.; Kheirollahi, R. Under Frequency Load Shedding in Inverter Based Microgrids by Using Droop Characteristic. IEEE Trans. Power Deliv. 2021, 36, 1097–1106. [Google Scholar] [CrossRef]
- Alhelou, H.H.; Golshan, M.E.H.; Zamani, R.; Moghaddam, M.P.; Njenda, T.C.; Siano, P.; Marzband, M. An Improved UFLS Scheme based on Estimated Minimum Frequency and Power Deficit. In Proceedings of the 2019 IEEE Milan PowerTech, Milan, Italy, 23–27 June 2019; pp. 1–6. [Google Scholar]
- Ochoa, D.; Martinez, S. Fast-Frequency Response Provided by DFIG-Wind Turbines and its Impact on the Grid. IEEE Trans. Power Syst. 2017, 32, 4002–4011. [Google Scholar] [CrossRef]
- Pradhan, C.; Bhende, C.N.; Samanta, A.K. Adaptive virtual inertia-based frequency regulation in wind power systems. Renew. Energy 2018, 115, 558–574. [Google Scholar] [CrossRef]
- Attya, A.B.T.; Dominguez-García, J.L. Insights on the Provision of Frequency Support by Wind Power and the Impact on Energy Systems. IEEE Trans. Sustain. Energy 2018, 9, 719–728. [Google Scholar] [CrossRef] [Green Version]
- Fernández-Guillamón, A.; Martínez-Lucas, G.; Molina-García, Á.; Sarasua, J.I. An Adaptive Control Scheme for Variable Speed Wind Turbines Providing Frequency Regulation in Isolated Power Systems with Thermal Generation. Energies 2020, 13, 3369. [Google Scholar] [CrossRef]
- Zhang, X.; Zha, X.; Yue, S.; Chen, Y. A Frequency Regulation Strategy for Wind Power Based on Limited Over-Speed De-Loading Curve Partitioning. IEEE Access 2018, 6, 22938–22951. [Google Scholar] [CrossRef]
- Oshnoei, S.; Oshnoei, A.; Mosallanejad, A.; Haghjoo, F. Novel load frequency control scheme for an interconnected two-area power system including wind turbine generation and redox flow battery. Int. J. Electr. Power Energy Syst. 2021, 130, 107033. [Google Scholar] [CrossRef]
- Ali, H.; Magdy, G.; Xu, D. A new optimal robust controller for frequency stability of interconnected hybrid microgrids considering non-inertia sources and uncertainties. Int. J. Electr. Power Energy Syst. 2021, 128, 106651. [Google Scholar] [CrossRef]
- Ferrari, M.; Park, B.; Olama, M.M. Design and Evaluation of a Model-Free Frequency Control Strategy in Islanded Microgrids with Power-Hardware-in-the-Loop Testing. In Proceedings of the 2021 IEEE Power Energy Society Innovative Smart Grid Technologies Conference (ISGT), Washington, DC, USA, 16–18 February 2021; pp. 1–5. [Google Scholar]
- Armghan, H.; Yang, M.; Armghan, A.; Ali, N. Double integral action based sliding mode controller design for the back-to-back converters in grid-connected hybrid wind-PV system. Int. J. Electr. Power Energy Syst. 2021, 127, 106655. [Google Scholar] [CrossRef]
- Milano, F.; Dorfler, F.; Hug, G.; Hill, D.J.; Verbic, G. Foundations and Challenges of Low-Inertia Systems (Invited Paper). In Proceedings of the 2018 Power Systems Computation Conference (PSCC), Dublin, Ireland, 11–15 June 2018; IEEE: Dublin, Ireland, 2018; pp. 1–25. [Google Scholar]
- Tielens, P.; Van Hertem, D. The relevance of inertia in power systems. Renew. Sustain. Energy Rev. 2016, 55, 999–1009. [Google Scholar] [CrossRef]
- Perdana, A. Dynamic Models Of Wind Turbines: A Contribution towards the Establishment of Standardized Models of Wind Turbines for Power System Stability Studies; Doktorsavhandlingar vid Chalmers Tekniska Högskola; Chalmers University of Technology: Göteborg, Sweden, 2008; ISBN 978-91-7385-226-5. [Google Scholar]
- Li, S.; Donghui, Z.; Lan, Z.; Chen, W. Modeling and mechanism analysis of inertia and damping issues for wind turbines PMSG grid-connected system. Soft Comput. 2020, 24, 15681–15691. [Google Scholar] [CrossRef]
- Tang, C.; Pathmanathan, M.; Soong, W.L.; Ertugrul, N. Effects of inertia on dynamic performance of wind turbines. In Proceedings of the 2008 Australasian Universities Power Engineering Conference, Sydney, NSW, Australia, 14–17 December 2008; pp. 1–6. [Google Scholar]
- Kundur, P. Power System Stability and Control, 1st ed.; McGraw-Hill: New York, NY, USA, 1994. [Google Scholar]
- Ochoa, D.; Martinez, S. Frequency Control Issues in Power Systems: The Effect of High Share of Wind Energy. IEEE Lat. Am. Trans. 2018, 16, 1934–1944. [Google Scholar] [CrossRef]
- Li, S.; Deng, C.; Shu, Z.; Huang, W.; He, J.; You, Z. Equivalent inertial time constant of doubly fed induction generator considering synthetic inertial control. J. Renew. Sustain. Energy 2016, 8, 053304. [Google Scholar] [CrossRef]
- Sarasúa, J.; Martínez-Lucas, G.; Platero, C.; Sánchez-Fernández, J. Dual Frequency Regulation in Pumping Mode in a Wind–Hydro Isolated System. Energies 2018, 11, 2865. [Google Scholar] [CrossRef] [Green Version]
- Bouzounierakis; Katsigiannis; Fiorentzis; Karapidakis Effect of Hybrid Power Station Installation in the Operation of Insular Power Systems. Inventions 2019, 4, 38. [CrossRef] [Green Version]
- Ochoa, D.; Martinez, S. A Simplified Electro-Mechanical Model of a DFIG-based Wind Turbine for Primary Frequency Control Studies. IEEE Lat. Am. Trans. 2016, 14, 3614–3620. [Google Scholar] [CrossRef] [Green Version]
Figure 1.
Typical time ranges in which the phenomena involved in the operation and control of a power system take place.
Figure 1.
Typical time ranges in which the phenomena involved in the operation and control of a power system take place.
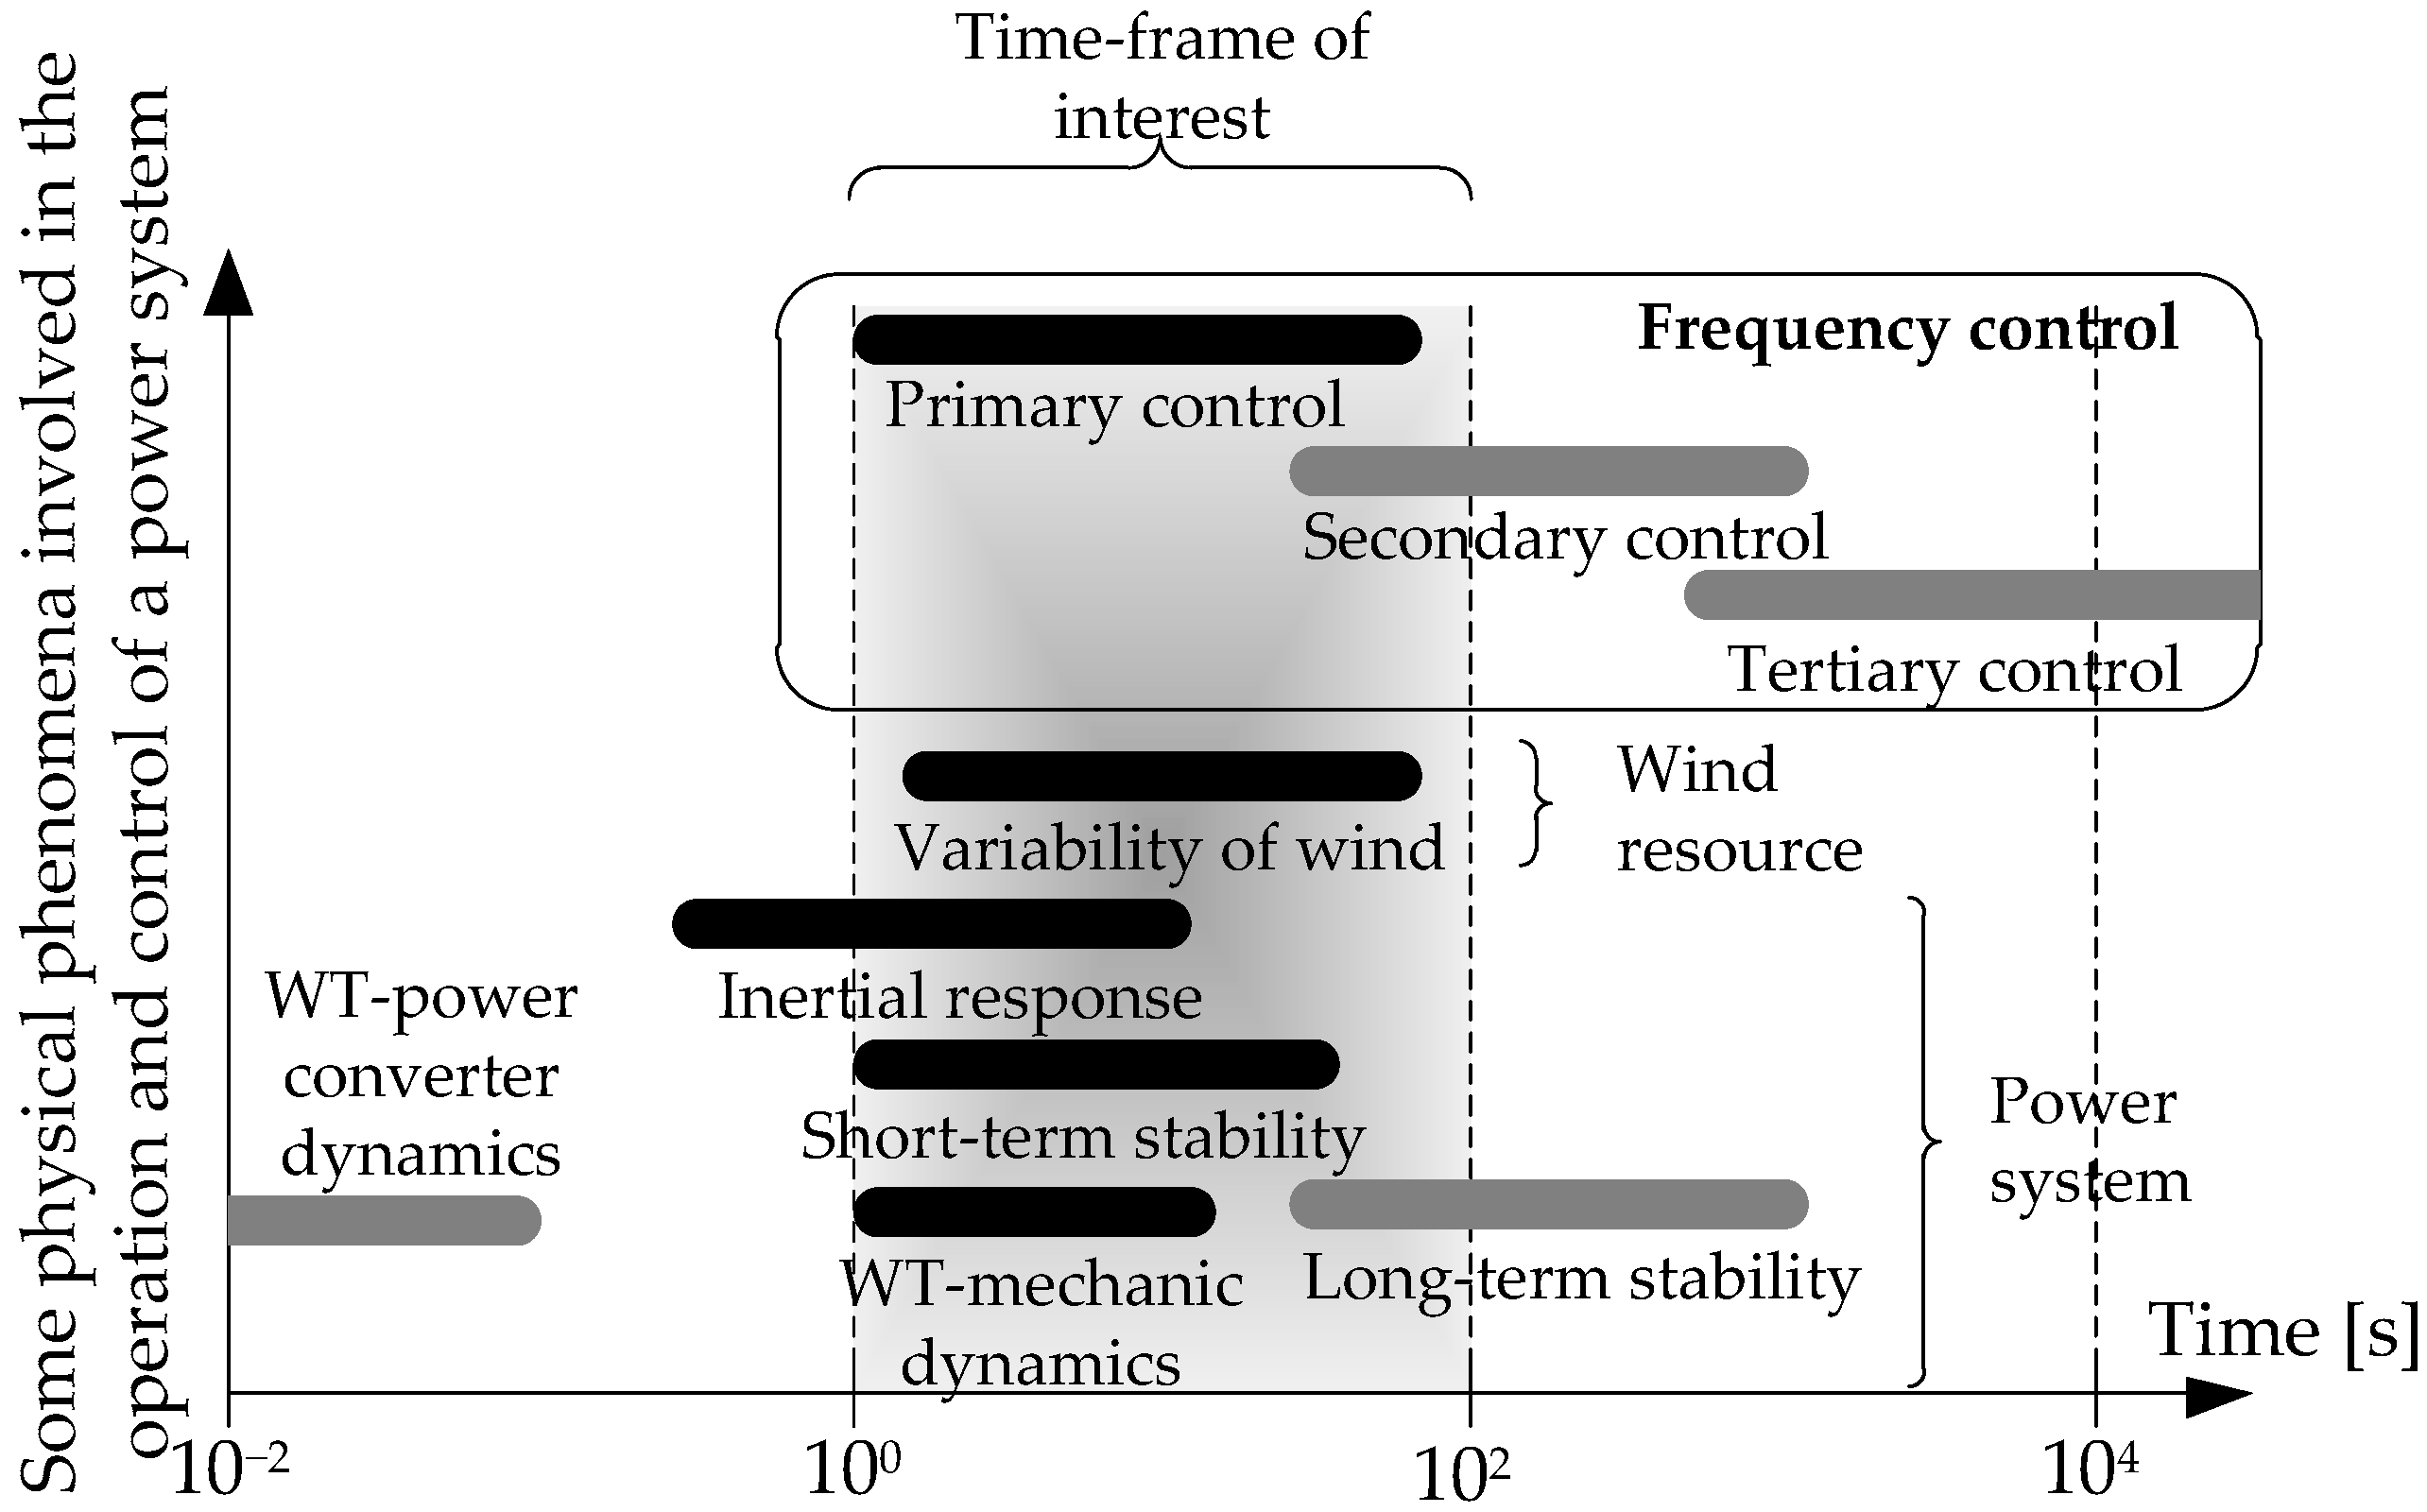
Figure 2.
Representation of power system dynamics using the LFC-scheme.

Figure 3.
LFC scheme for the power system under study.

Figure 4.
Response of the system to a sub-frequency event (base case). (a) Thermal power deviation, (b) wind power generation, (c) grid frequency, (d) absolute value of RoCoF.
Figure 4.
Response of the system to a sub-frequency event (base case). (a) Thermal power deviation, (b) wind power generation, (c) grid frequency, (d) absolute value of RoCoF.
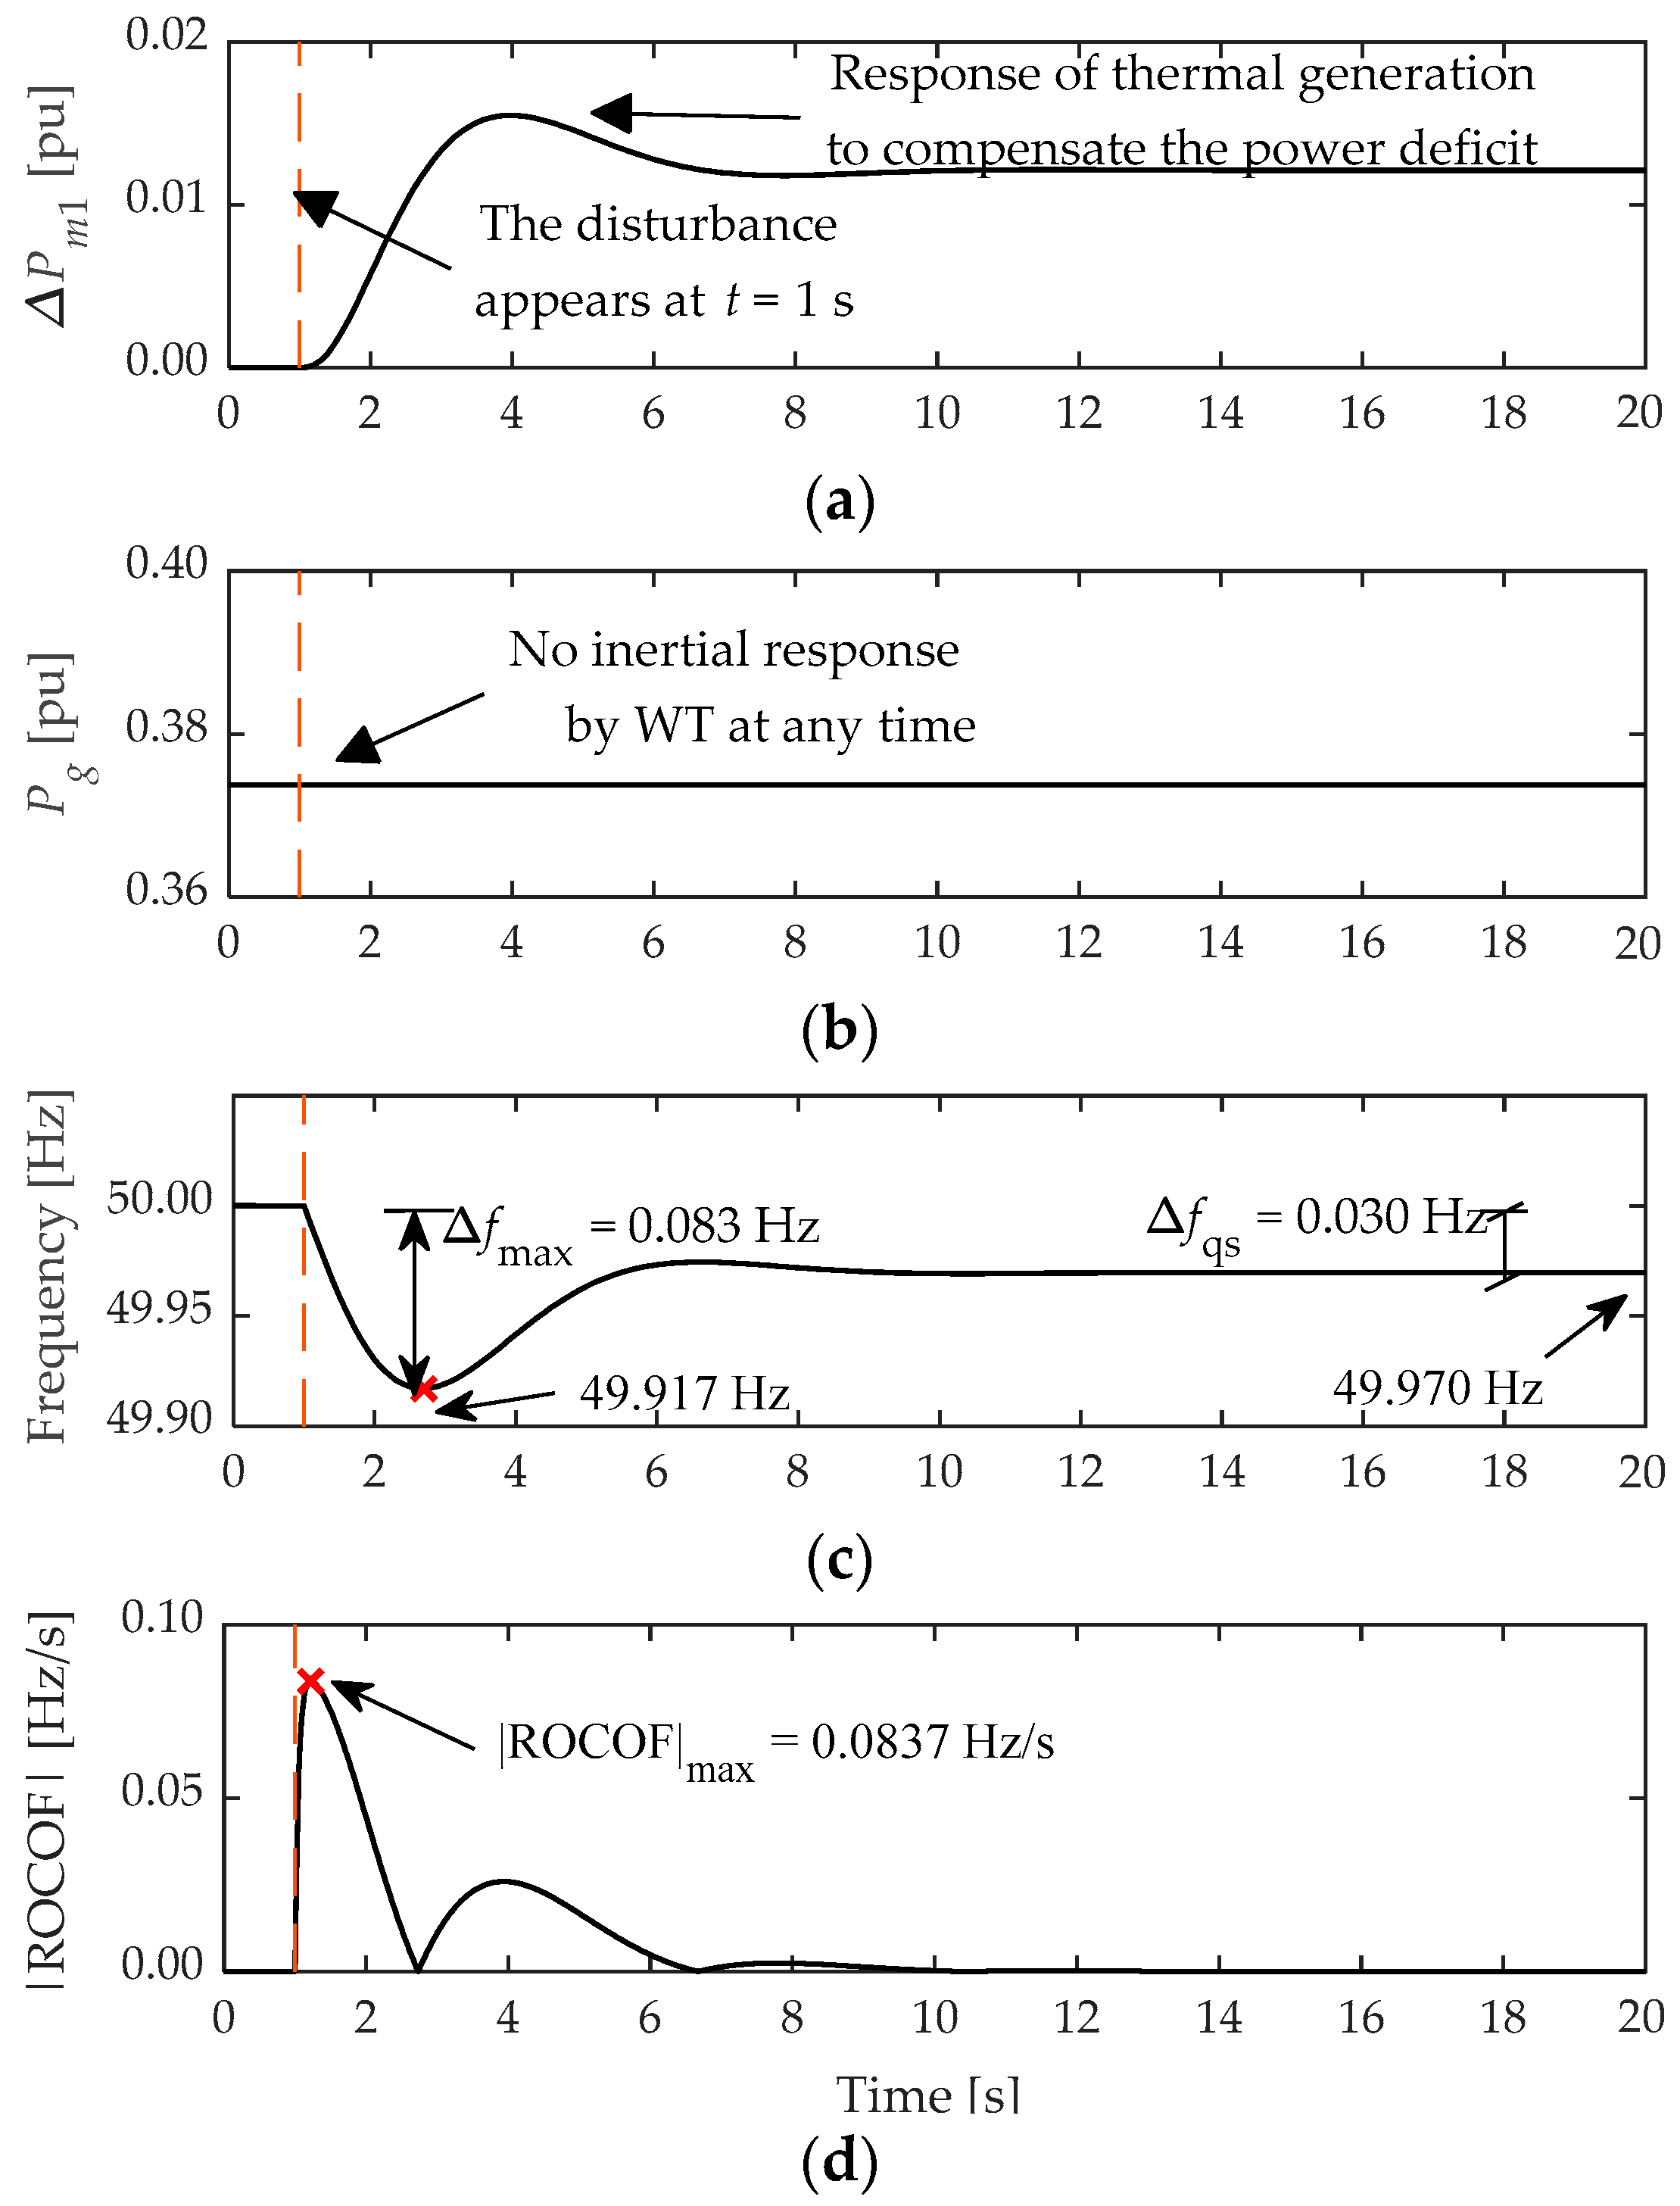
Figure 5.
Effect of conventional synchronous generation displacement on the inertial response of the system.
Figure 5.
Effect of conventional synchronous generation displacement on the inertial response of the system.
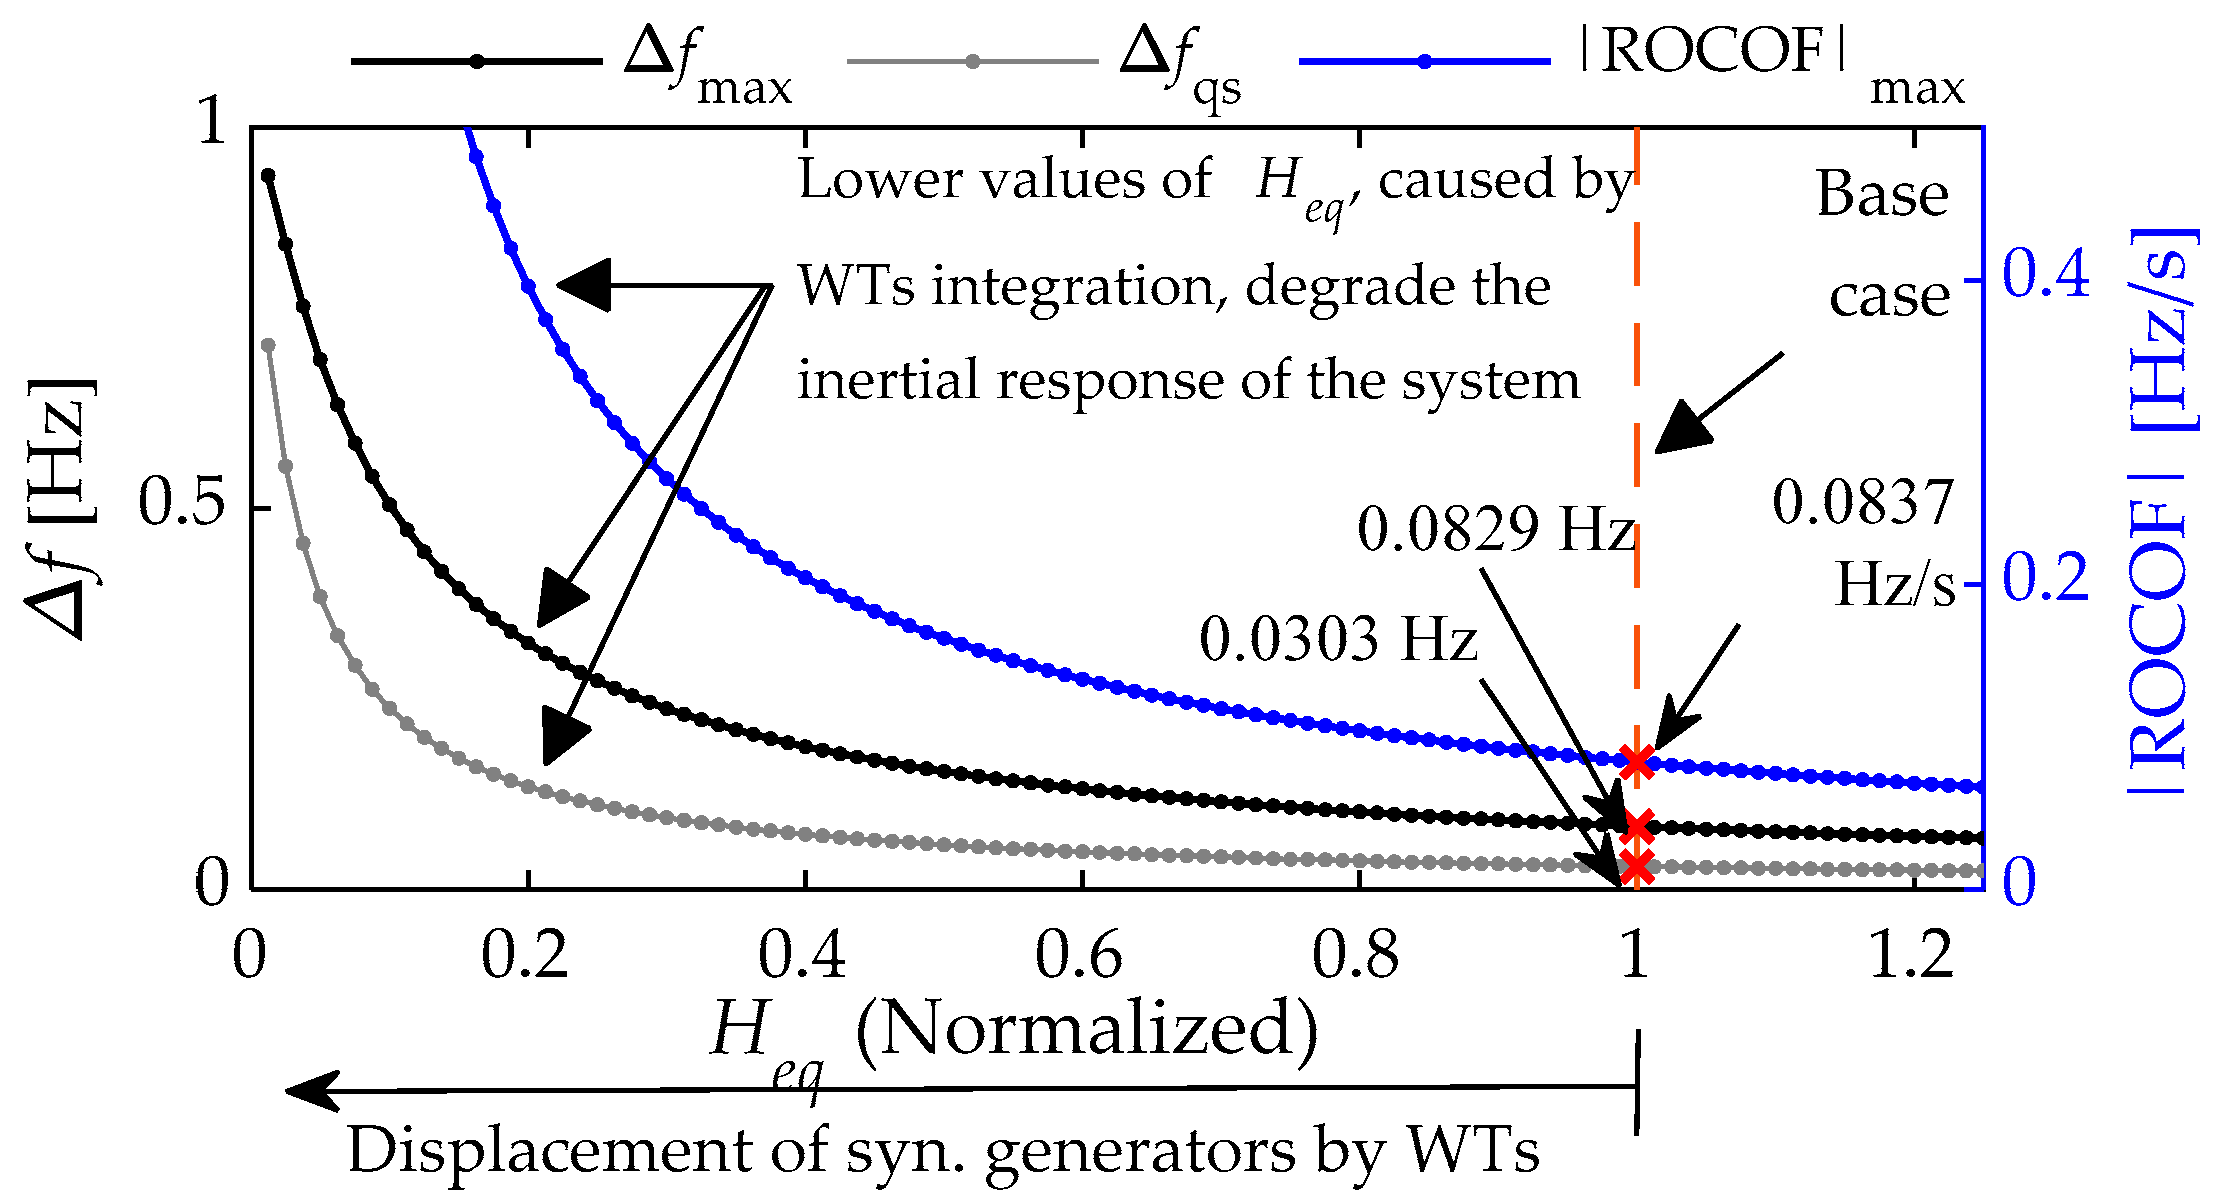
Figure 6.
Mechanics of the method based on virtual inertia control.

Figure 7.
Scheme of the virtual inertia control implemented in the wind turbine (the values assigned to the main parameters are given in the Appendix C).
Figure 7.
Scheme of the virtual inertia control implemented in the wind turbine (the values assigned to the main parameters are given in the Appendix C).

Figure 8.
System response to a sub-frequency event considering the inertial support provided by wind generation. (a) Thermal power deviation, (b) wind power generation, (c) grid frequency, (d) absolute value of RoCoF.
Figure 8.
System response to a sub-frequency event considering the inertial support provided by wind generation. (a) Thermal power deviation, (b) wind power generation, (c) grid frequency, (d) absolute value of RoCoF.
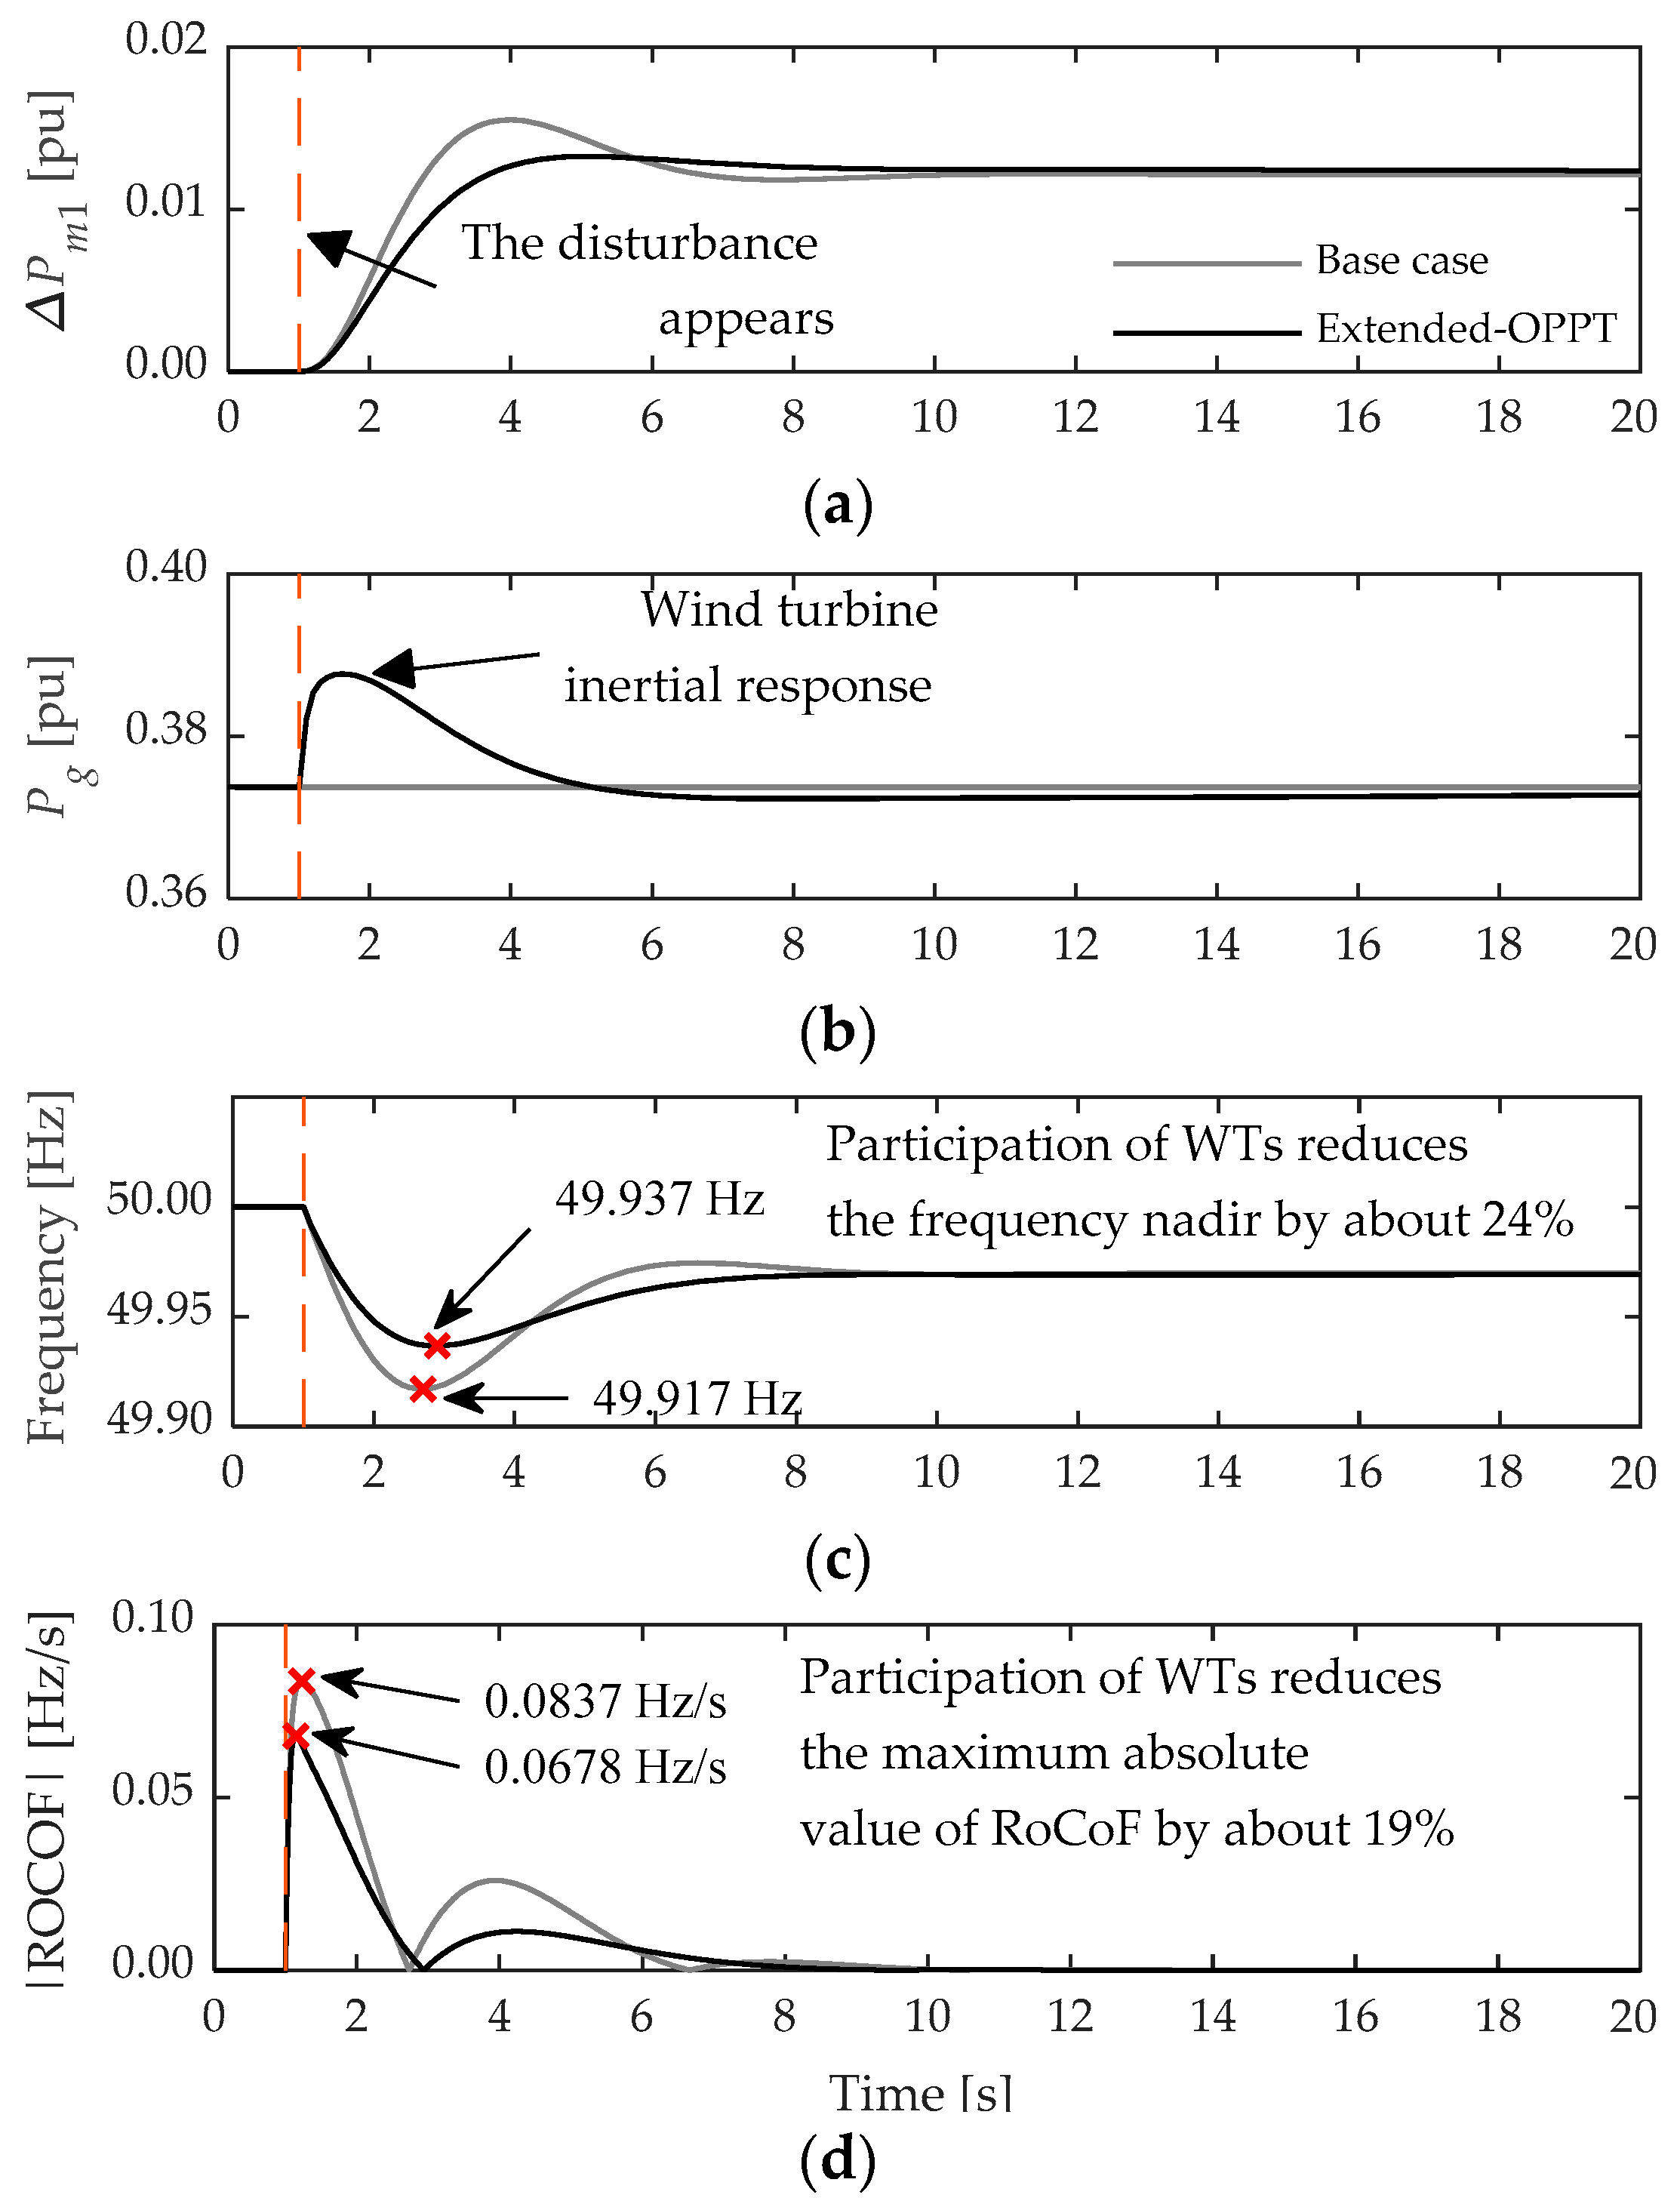
Figure 9.
Inertial response provided by wind generation: exact formulation vs. linearized formulation. (a) Wind power generation, (b) numerical error.
Figure 9.
Inertial response provided by wind generation: exact formulation vs. linearized formulation. (a) Wind power generation, (b) numerical error.

Figure 10.
Comparison of results: exact formulation vs. linearized formulation. (a) Grid frequency, (b) absolute value of RoCoF.
Figure 10.
Comparison of results: exact formulation vs. linearized formulation. (a) Grid frequency, (b) absolute value of RoCoF.
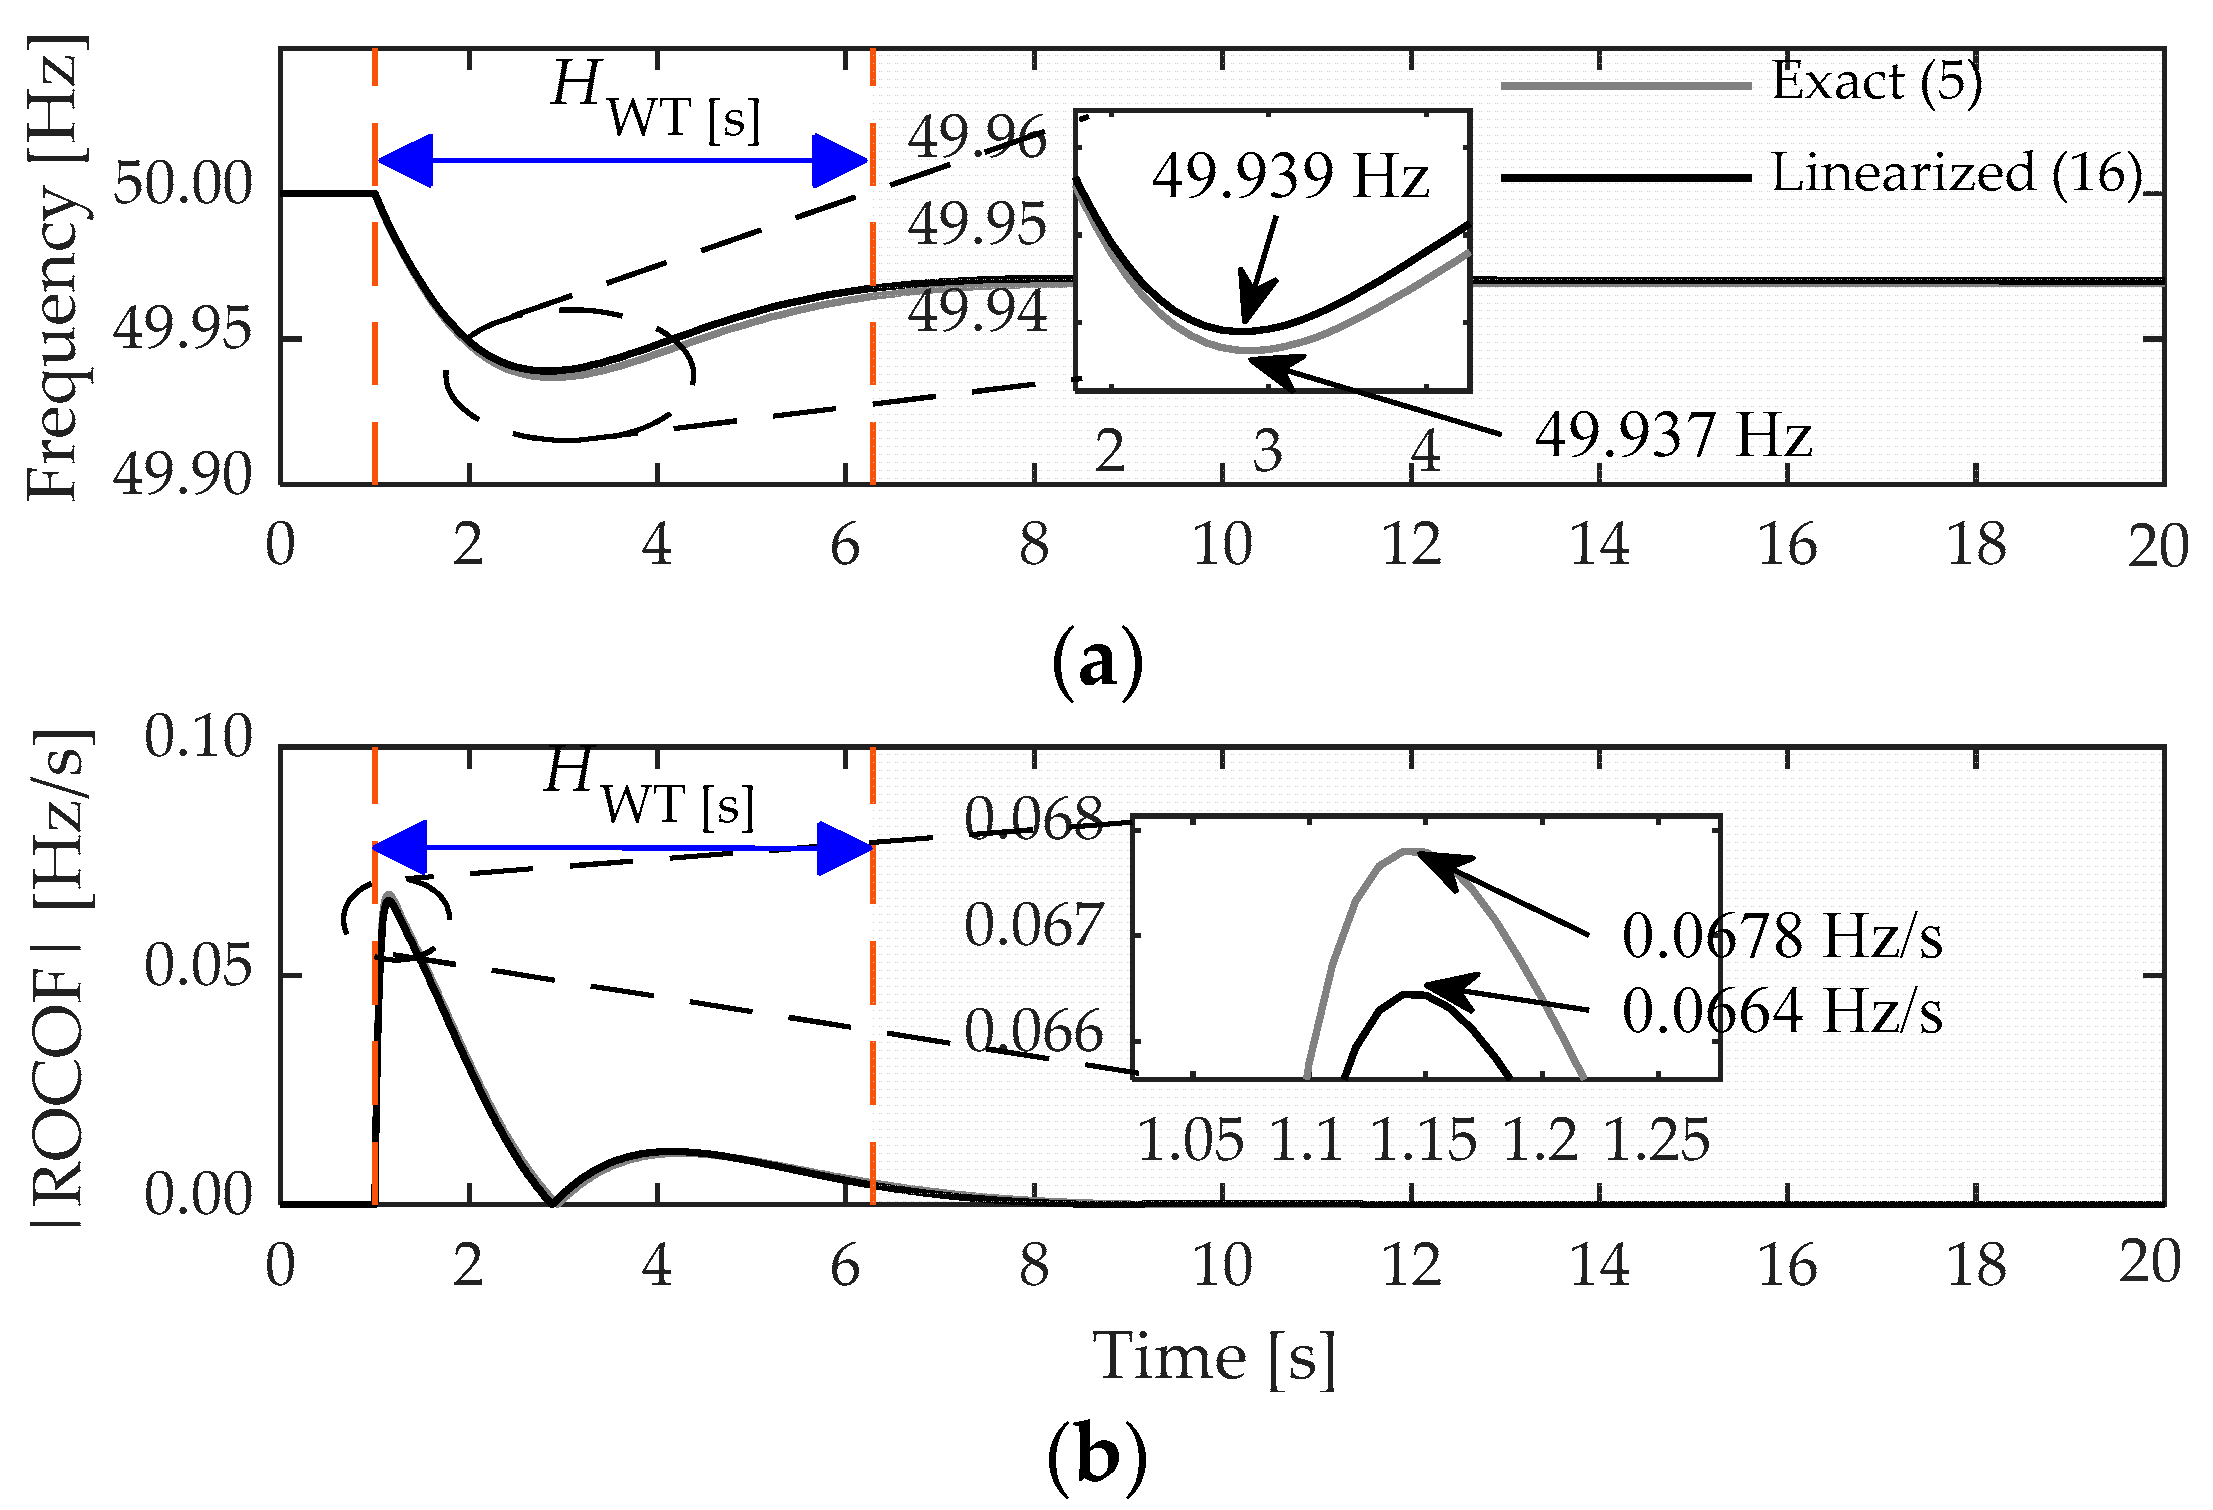
Figure 11.
Effect of synchronous generation displacement on the inertial response of the system considering the participation of wind generation in frequency control. (a) Maximum frequency deviation, (b) maximum absolute value of RoCoF.
Figure 11.
Effect of synchronous generation displacement on the inertial response of the system considering the participation of wind generation in frequency control. (a) Maximum frequency deviation, (b) maximum absolute value of RoCoF.
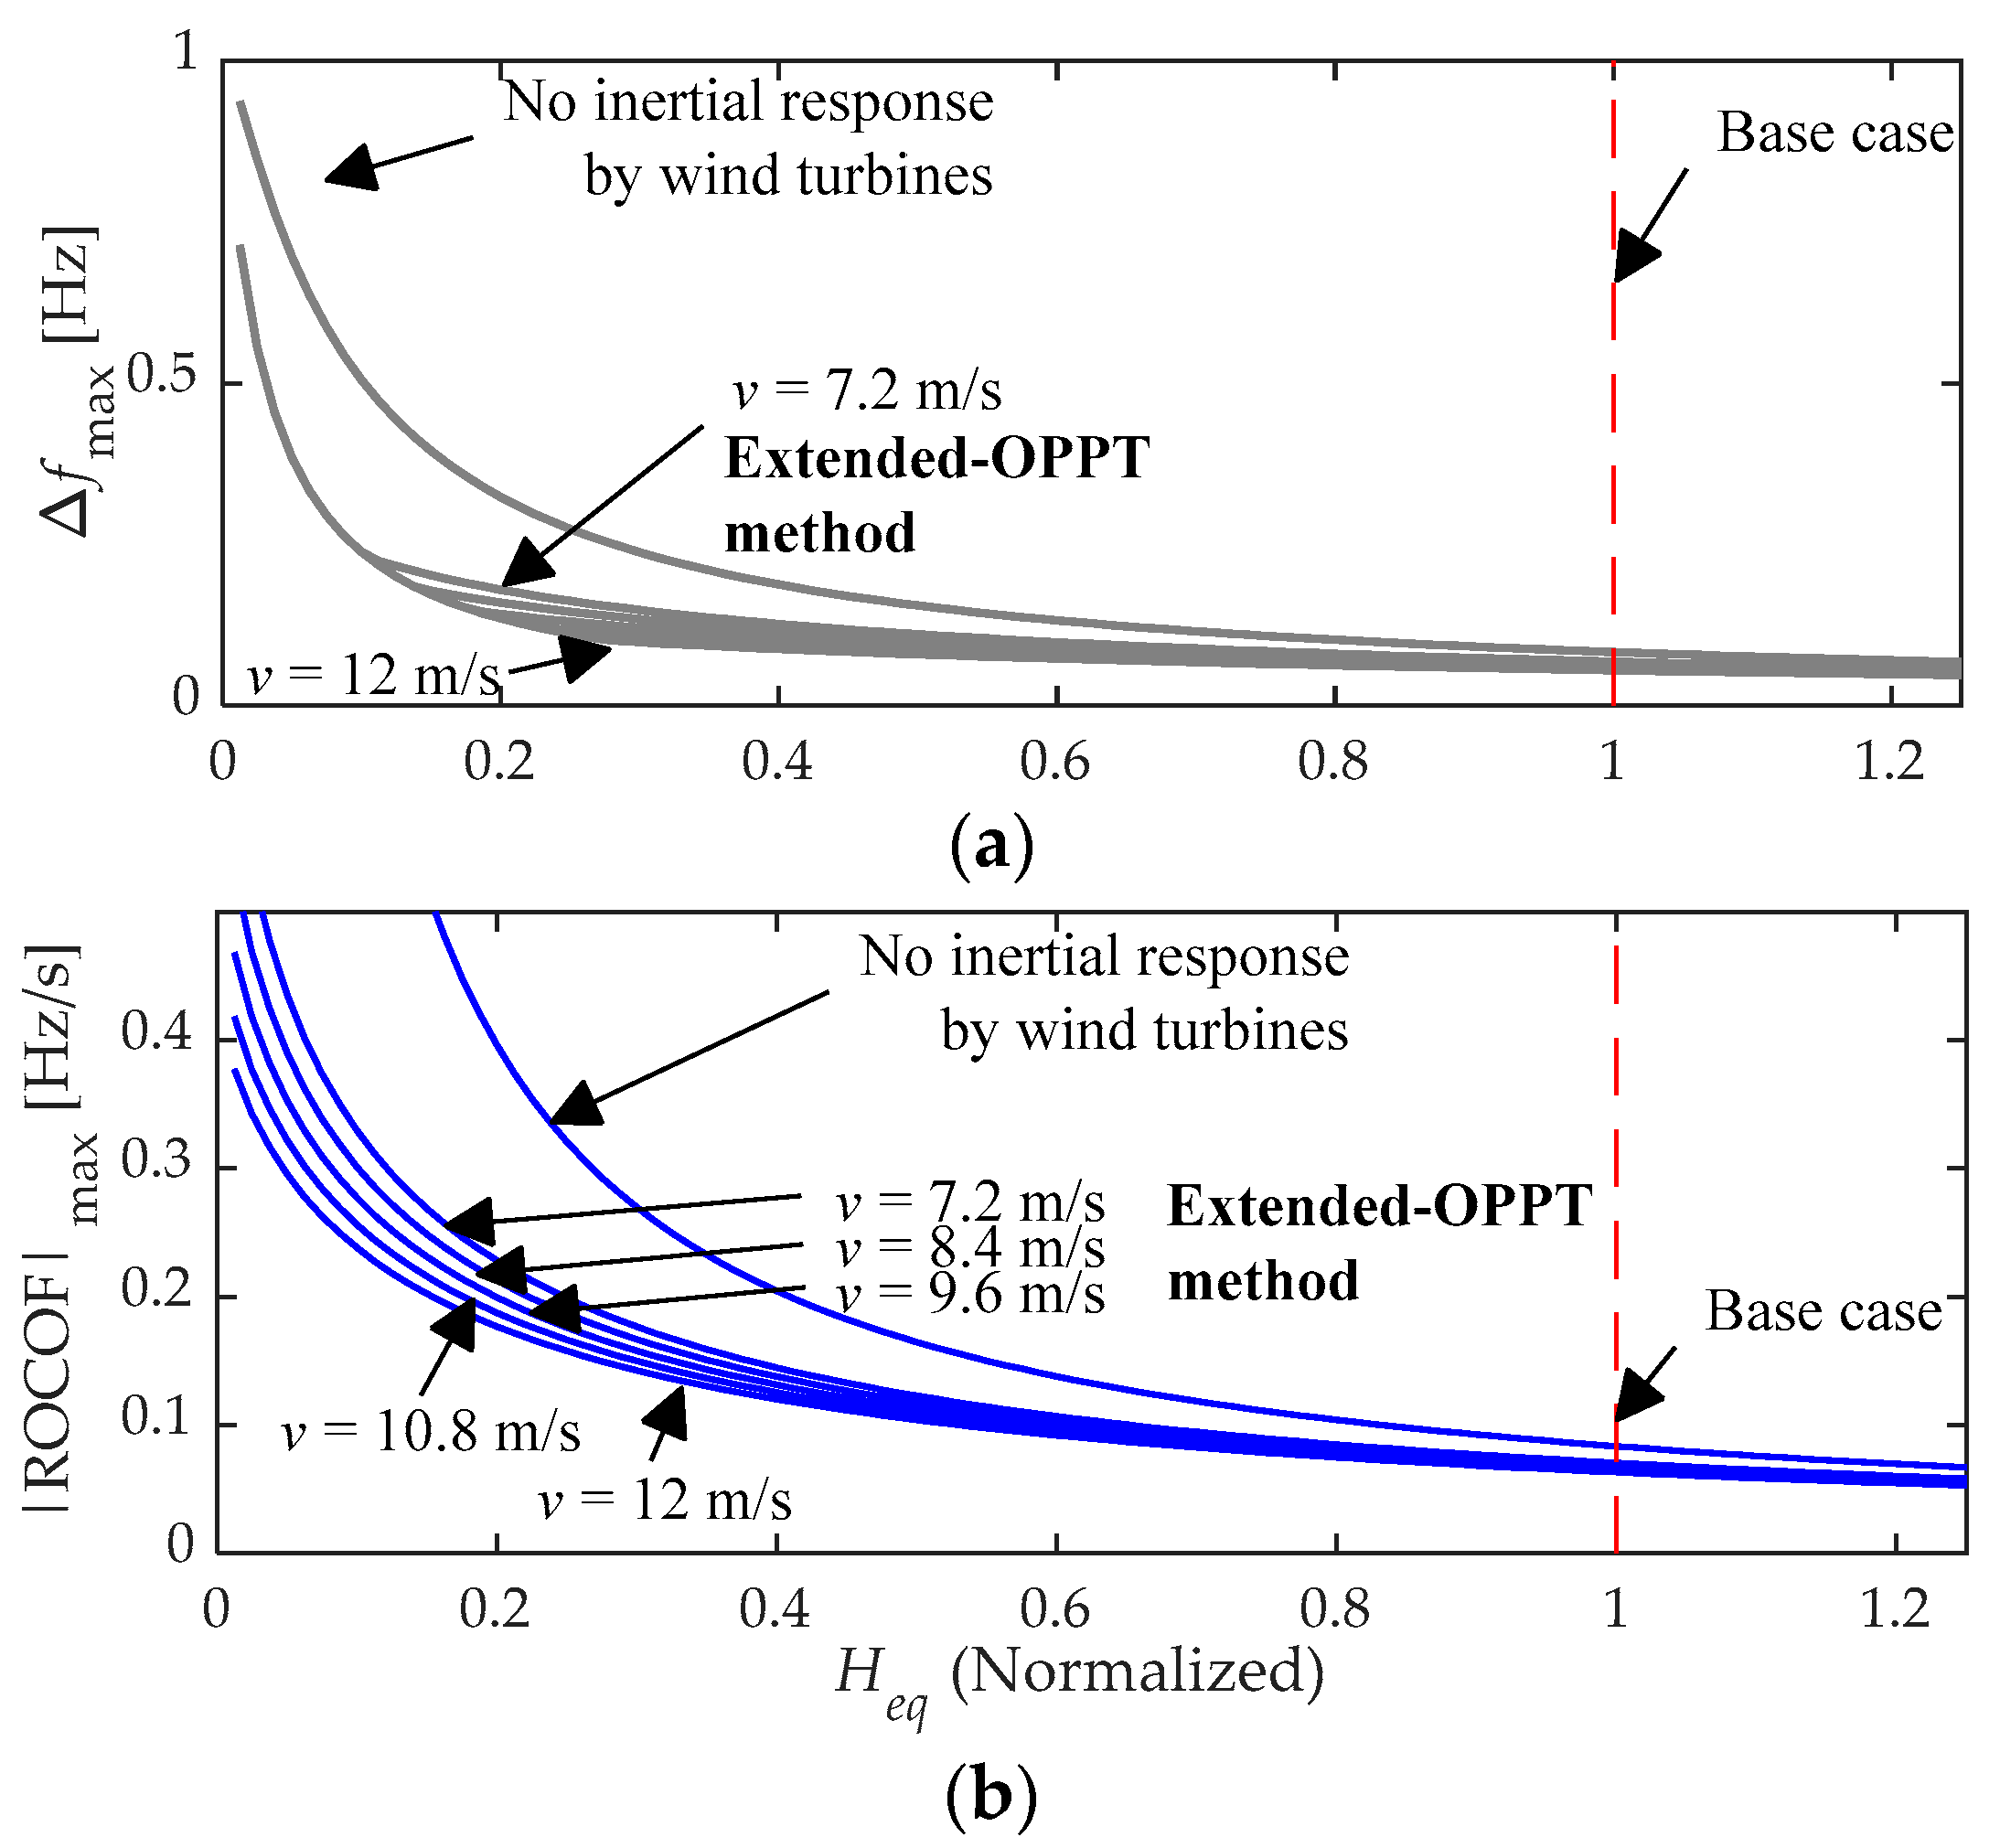
Figure 12.
Influence of the inertia emulation of wind generation on the parameters that define the equivalent inertial response of the system. (a) Equivalent inertia constant, (b) load damping constant.
Figure 12.
Influence of the inertia emulation of wind generation on the parameters that define the equivalent inertial response of the system. (a) Equivalent inertia constant, (b) load damping constant.
Publisher’s Note: MDPI stays neutral with regard to jurisdictional claims in published maps and institutional affiliations. |
© 2021 by the authors. Licensee MDPI, Basel, Switzerland. This article is an open access article distributed under the terms and conditions of the Creative Commons Attribution (CC BY) license (https://creativecommons.org/licenses/by/4.0/).
Share and Cite
MDPI and ACS Style
Ochoa, D.; Martinez, S. Analytical Approach to Understanding the Effects of Implementing Fast-Frequency Response by Wind Turbines on the Short-Term Operation of Power Systems. Energies 2021, 14, 3660. https://doi.org/10.3390/en14123660
AMA Style
Ochoa D, Martinez S. Analytical Approach to Understanding the Effects of Implementing Fast-Frequency Response by Wind Turbines on the Short-Term Operation of Power Systems. Energies. 2021; 14(12):3660. https://doi.org/10.3390/en14123660
Chicago/Turabian StyleOchoa, Danny, and Sergio Martinez. 2021. "Analytical Approach to Understanding the Effects of Implementing Fast-Frequency Response by Wind Turbines on the Short-Term Operation of Power Systems" Energies 14, no. 12: 3660. https://doi.org/10.3390/en14123660
Note that from the first issue of 2016, this journal uses article numbers instead of page numbers. See further details here.