
An Energy Management Optimization Method for Community Integrated Energy System Based on User Dominated Demand Side Response

1
School of Electrical Engineering, Southeast University, Nanjing 210096, China
2
College of Energy and Electrical Engineering, Hohai University, Nanjing 210098, China
3
State Grid Jiangsu Electric Power Co., Ltd., Nanjing Power Supply Branch, Nanjing 210019, China
*
Author to whom correspondence should be addressed.
Energies 2021, 14(15), 4398; https://doi.org/10.3390/en14154398
Submission received: 23 June 2021
/
Revised: 14 July 2021
/
Accepted: 19 July 2021
/
Published: 21 July 2021
(This article belongs to the Special Issue Situation Awareness for Smart Distribution Systems)
Abstract
:With the development of integrated energy systems (IES), the traditional demand response technologies for single energy that do not take customer satisfaction into account have been unable to meet actual needs. Therefore, it is urgent to study the integrated demand response (IDR) technology for integrated energy, which considers consumers’ willingness to participate in IDR. This paper proposes an energy management optimization method for community IES based on user dominated demand side response (UDDSR). Firstly, the responsive power loads and thermal loads are modeled, and aggregated using UDDSR bidding optimization. Next, the community IES is modeled and an aggregated building thermal model is introduced to measure the temperature requirements of the entire community of users for heating. Then, a day-ahead scheduling model is proposed to realize the energy management optimization. Finally, a penalty mechanism is introduced to punish the participants causing imbalance response against the day-ahead IDR bids, and the conditional value-at-risk (CVaR) theory is introduced to enhance the robustness of the scheduling model under different prediction accuracies. The case study demonstrates that the proposed method can reduce the operating cost of the community under the premise of fully considering users’ willingness, and can complete the IDR request initiated by the power grid operator or the dispatching department.
1. Introduction
1.1. Background and Motivation
The development of energy cogeneration and integration technologies as well as renewable energies (e.g., photovoltaic (PV)) has attracted many scholars to undertake research on integrated energy systems (IES). The term IES takes into consideration many kinds of energy subsystems, e.g., electricity supply, gas supply, heating, cooling [1,2]. Different forms of energy are coupled and closely connected through energy conversion equipment (e.g., combined heat and power (CHP) unit, electric heating equipment), and can meet the diverse energy demands of users. However, because of its multienergy coupling characteristic, it is impossible to design, plan and optimize separately the operation of various energy supply systems as the traditional distributed energy supply system does [3]. Therefore, how to efficiently deal with the complementarity and substitution between different energy streams has become a key issue to realize energy cascade utilization and to improve comprehensive energy utilization efficiency. Additionally, the traditional energy management system (EMS) framework cannot adapt to the coexistence and interaction features of centralization and distribution in IES [4,5] (e.g., the energy management policy proposed in [6] only considers the electric energy, and cannot be applied to deal directly with multienergy flow problems). Therefore, it is necessary to study the integrated energy management system (IEMS) technology for multienergy flow.
The control objects of the IEMS can be divided into three layers. The upper layer is the system-level multienergy flow transmission network, which involves the production, transmission and safe operation of energy such as gas, electricity, and heat. The middle layer is a local microenergy unit, with industrial parks, smart communities, and intelligent buildings as typical application scenarios, and it involves the coordinated scheduling and optimized operation of multiple energy sources. The lower layer is the user-level integrated producer and consumer. The multienergy complementarity and alternative features of IEMS not only provide users with more options for energy use, but also bring optimization space for the overall regulation and operation of the system. With the development of IES, existing studies based on the traditional demand response (DR) technologies for a single energy source (electric energy) [7,8,9] can no longer meet users’ actual needs, and there is an urgent need to study integrated demand response (IDR) technology for integrated energy. Reasonable use of user-side responsive resources to participate in the IDR of the system will play an important role in realizing the two-way interaction between the supply and the demand and the win–win situation [10]. On the other hand, information communication and engineering measurement and control technology have developed rapidly recently. Having access to a large number of smart sensors has greatly increased the amount of multienergy flow information that can be collected by the middle layer and user layer of IEMS. The IEMS can adjust in time based on the measurement or user feedback information, and improve energy efficiency and operating economy on the premise of ensuring the user’s energy comfort.
Thus far, the IDR strategies and mechanisms have been studied for many purposes. In [11], the concept of IDR was first proposed and gas turbines were introduced to supply power to the power grid during peak time, converting part of the power load into gas load. Additionally, the incentive effect of natural gas prices on IDR was analyzed through Nash game theory. In [12], the physical constraints of the natural gas network and the heating network were processed by piecewise linearization, and an IDR optimal transaction strategy model based on the mixed-integer second-order cone programming algorithm and transaction price incentive was proposed. The authors in [13] summarized the development of IDR from the aspects of system modeling, optimization strategy and power market mechanisms, and affirmed the positive effect of IDR on improving the flexibility of IES load response. In [14], an IDR model based on medium- and long-term time dimensions considering system dynamics was proposed, and taking flexible loads, energy storage, and electric vehicles into account, an IES scheduling model was established in order to simulate the benefits for users participating in IDR. In [15], a day-ahead and intraday optimization scheduling model based on the demand side response was proposed, and the scheduling times for different energy subsystems were considered to perform rolling optimization scheduling.
Current research mostly focuses on the impact of market price mechanisms and the refined modeling of IES equipment and networks on IDR [16,17]. It is assumed that users will continue to participate in IDR events satisfactorily under certain price incentives, or users will maximize their responsive load during IDR events. Additionally, users are assumed to allow their own load equipment to be adjusted by EMS or energy service providers. However, most research ignored users’ willingness to participate in DR programs. In fact, users are not necessarily willing to give the control of the equipment to EMS or energy service providers underprice incentives [18]. Users may not provide the maximum responsive load during IDR due to privacy reasons. In [18], a survey was conducted on the willingness of 1499 households from a state in Australia to participate in a direct load control (DLC) plan, and the results showed that only about 13% of customers accepted the DLC plan. For users, the main reason for reluctance to participate in the DLC program is that users have low trust in energy companies. At present, there are very few studies on the relationship between user satisfaction with participating in IDR events and response load capacity. In [19], a user dominated demand side response (UDDSR) scheme that allows energy users to dynamically choose to join or withdraw from DR events was put forward. In this scheme, users can submit flexible DR bids to community EMS for participating in DR events. That is, users can flexibly choose the working hours of each household device. However, this scheme only focuses on electric load, and fails to consider the overall optimization within IES.
1.2. Novelty and Contribution
In this paper, an energy management optimization method for community IES based on UDDSR is put forth, where users can submit the day-ahead IDR bid for load responses that fully meets their own comfort, and respond to the IDR requests issued by the power grid operator or dispatching department according to the planned capacity of the IDR bid on the next day. Additionally, an aggregated buildings thermal model is introduced to establishe the adjustable thermal load model, and the user’s power load adjustable time, power load adjustable capacity, thermal load adjustable time and heating temperature are set as optimized parameters to establish a day-ahead scheduling model. Considering the uncertainty of PV output, user load, outdoor temperature, and user actual UDDSR response capacity in the community IES, a penalty mechanism is introduced to punish the participants making imbalanced response against the day-ahead IDR bids, and the conditional value-at-risk (CVaR) theory is introduced to enhance the robustness under different prediction accuracy.
The contributions of this paper are summarized as follows:
- (1)
- The interruptible power load, shiftable power load, and adjustable thermal load are modeled, respectively, and are optimized by UDDSR scheme in order to obtain the aggregated IDR bids.
- (2)
- An aggregated buildings thermal model is introduced to measure the temperature requirements of the entire community of users for heating. The adjustable thermal loads of the IDR bids submitted by users are modeled within the context of air temperature, and can be optimized by regulating the indoor temperature of users.
- (3)
- From the overall perspective of system operation, a day-ahead scheduling optimization model for the community IES based on UDDSR is established, and the CVaR theory is introduced to deal with the uncertainties in IES.
2. Demand Response Load Modeling Based on UDDSR
In this paper, the detailed UDDSR optimization approach is based on the mechanism described in [19]. This mechanism allows users to submit flexible bids for DR events and achieves the optimal aggregation of these bids within the DR events. However, it only considers electric equipment including interruptible appliances (e.g., heating systems) and shiftable appliances (e.g., electric vehicles). In this section, the UDDSR optimization with adjustable thermal loads is further studied within the IDR events.
2.1. UDDSR Optimization with Adjustable Thermal Loads
In this paper, thermal loads of the aggregated buildings are modeled within the context of air temperature, and can be adjusted by regulating the indoor temperature of end users. Regarding the adjustable thermal loads of the IDR bids, the maximum and minimum of the heating temperature, the maximum adjustable temperature for heating, and the adjustable time period for heating can be set by users. Since this paper studies the centralized temperature regulation in the case of central heating, the community energy management system (CEMS) will first classify users according to the maximum adjustable temperature for heating in the IDR bids. For users who have the same adjustable temperature, CEMS will select as many users as possible who are willing to adjust the heating temperature within the IDR request period to participate in the UDDSR thermal load response according to (1). Additionally, CEMS will select the minimum of the highest temperatures and the maximum of the lowest temperatures submitted by all users in the IDR bids as the temperature constraint range of the central heating, as demonstrated in (2).
where is the total number of users willing to participate in UDDSR thermal load response at time t; Tinmin/Tinmax is the minimum/maximum indoor temperature that costumers are willing to accept, respectively; Tl,i/Tu,i is the minimum/maximum heating temperature submitted by the user i.
2.2. Adjustable Thermal Loads Model Based on UDDSR
According to [20], the thermodynamic model of the aggregated buildings can be formulated as the RC equivalent circuit model, as demonstrated in Figure 1, where R is the equivalent thermal resistance of the house shell; Cair is the air specific heat; is the adjustable thermal load at time t; and are the indoor and outdoor temperature at time t.
Therefore, the relation equation between indoor temperature and adjustable thermal load is as follows:
The discrete model of (3) is
where e is a constant; Δt is the scheduling interval and is assumed to be 1 h in this paper.
Then, the adjustable thermal load is calculated from:
where Tadj is the maximum adjustable indoor temperature allowed by end users during IDR event; , determined by IDR bids, is the adjustable time of thermal load allowed by users, and if = 1/ = 0, the thermal load can/cannot be adjusted; ΔTmax is the maximum indoor temperature variation during Δt, and it should be less than 2 °C in order not to affect the comfort of users.
2.3. Electric Loads Model Based on UDDSR
In the community CHP system, the electric loads includes interruptible power loads and shiftable power loads. Based on the aggregated IDR bids obtained from UDDSR optimization in [19], the total response power of the interruptible appliances during the IDR event should be less than the maximum interruptible power at the same time after the aggregated IDR bid. Thus the interruptible power load is expressed as
where is the interruptible power load at time t; is the maximum interruptible power load at time t, which can be obtained from aggregated IDR bid of end users.
The shiftable load model is expressed as
where is the total shiftable power load at time t; and are the load and the maximum load shifted from time t to other time; and are the load and maximum load shifted to time t, respectively; T is the optimized scheduling cycle; and can be obtained from aggregated IDR bid of end users.
3. Distributed Generator and Co-Supply Equipment Model
3.1. PV Model
PV is a common distributed generation device in the community, and can be modeled as:
where is the PV output power; Pstc is the maximum PV output power under standard test conditions; Gt is the light intensity and Gstc is that under standard test conditions; ε is the PV power temperature coefficient; is surface temperature of PV and Tstc is that under standard test conditions.
3.2. Power Supply Equipment Model
3.2.1. Microgas Turbine (MT) Model
MT is an important CHP equipment in community CHP system, and its model is as follows:
where is the MT output power at time t; is the MT gas consumption at time t; Hng is the calorific value of natural gas; ηMT is the MT power generation efficiency; is the MT output heat power at time t; ηloss is the MT power loss efficiency.
3.2.2. Gas Boiler (GB) Model
GB burns natural gas to provide heat for community users and can be modeled as:
where is the GB output heat power at time t; is the GB gas consumption at time t; ηGB is the GB heat production efficiency.
3.2.3. Waste Heat Recovery (WHR) Device Model
WHR can recover the flue gas waste heat after MT power generation to improve the energy utilization efficiency, and can be modeled as:
where is the WHR recovered heat power at time t; is the MT waste heat at time t; ηWHR is the WHR heat recovery efficiency.
3.2.4. Heat Exchanger (HE) Model
HE can convert the heat of hot stream into hot water to provide heating for community end users, and is modeled as:
where / is the HE heat power output/input at time t; ηHE is the HE heat exchange efficiency.
3.3. Energy Storage Equipment Model
3.3.1. Battery (BT) Model
The charging and discharging of BT can greatly improve the utilization rate of the response load on the user side, and the model of BT is:
where represents the stored energy in BT; ηBT,loss is the power loss rate of BT; and are the charging and discharging power of BT, respectively; ηBT,ch and ηBT,dis are the charging and discharging efficiency of BT, respectively.
3.3.2. Thermal Storage Tank (TST) Model
When the output thermoelectric power ratio of MT does not match the thermoelectric load ratio of community users, TST can compensate for the difference of thermoelectric ratio through heat storage and release behavior, and improve the utilization efficiency of user-side response heat load. TST can be modeled as:
where is the amount of heat stored in TST at time t; ηTST,loss is the energy loss rate of TST; is the heat storage power of TST; ηTST,ch is the heat storage efficiency; is the heat release power; ηTST,dis is the heat release efficiency.
4. Community CHP System Model Based on UDDSR
In this paper, the community CHP system consists of MT, GB, WHR, HE, PV, BT and TST, and its structure diagram is shown in Figure 2.
Then, an energy hub model based on the bus bar form [21] is adopted to model the community CHP system. The bus bar structure of the community system is shown in Figure 3, and the flow relations of electricity, gas and heat energy are marked by arrows.
4.1. Day-Ahead Energy Optimization Model
In the community system studied in this paper, by participating in the UDDSR response arranged by CEMS, users can submit the day-ahead IDR bid of load response that fully meets their own comfort, and respond to the IDR request issued by the power grid operator or dispatching department the next day according to the planned capacity of IDR bid. For users, they can reduce or transfer unnecessary loads during the IDR event, and at the same time receive the subsidy of IDR response from the grid operator. For the entire community energy system, CEMS can schedule the user loads to the greatest extent according to the IDR bid plan of users, and thus achieve “peak clipping and valley filling” in energy use. Meanwhile, on the basis of ensuring the stability of the system operation, the overall operation cost of the system can also be reduced, and the economy of the system operation can be improved.
The goal of system optimization is to minimize the total cost of system operation and the temperature change caused by the thermal load response adjustment within the allowable range of users, so as to ensure their satisfaction with energy use as much as possible. This can be described as the objective function below:
where Ctotal is the total cost of system operation; Tref is the national standard indoor optimum temperature; δt is a time-varying parameter that measure the thermal comfort of users, and during the UDDSR event, δt is relaxed to achieve the purpose of temperature regulation and consumption reduction, while in other moments δt plays the role of making the indoor temperature close to the optimal temperature; N is the optimal scheduling cycle.
The total cost of system operation is calculated by the following function:
where Cgrid is the cost of electricity purchasing from the grid; Cng is the cost of natural gas; Com is the cost of equipment operation and maintenance; CUDDSR is the total subsidy for UDDSR participation given to users by the operator.
Cgrid and Cng can be calculated as:
where is the power purchased from the grid; is the market price; egas is the price of natural gas.
Com can be calculated as:
where Com,MT, Com,GB and Com,PV are the unit power operation and maintenance costs of MT, GB, and PV, respectively.
CUDDSR can be calculated as:
where Cu is the load response subsidy for users; Ces is the energy storage subsidy; is electric load response compensation per unit power; is the thermal load response compensation per unit power; is the change of thermal power caused by lowering the room temperature ΔTt within the range allowed by users at time t; is the indoor temperature before UDDSR event; eBT is the unit power subsidy for the charging and discharging behavior of BT; eTST is the unit power subsidy for heat storage and release behavior of TST.
The operation constraints are described as follows.
- Energy balancing constraints
- 2.
- Energy supply constraints
- 3.
- Energy storage constraints
For BT, the constraints are:
where and are 0–1 variables representing the charging and discharging state of BT; PBT,chmax and PBT,dismax are the maximum charging and discharging power of BT; WBTmax and WBTmin are the maximum and minimum energy storage capacity of BT.
For TST, the constraints are:
where and are 0–1 variables representing the heat storing and releasing state of TST; PTST,chmax and PTST,dismax are the maximum heat storing and releasing power of TST; WTSTmax and WTSTmin are the maximum and minimum heat storage capacity of TST.
4.2. CVaR-Based Energy Optimization Model
The day-ahead energy optimization model mentioned in the above section is based on the accurate prediction of the basic electric and heat loads, PV output, and outdoor temperature. It ignores the error between the predicted value and actual value, and assumes that users will maximize the UDDSR response according to the response load capacity of the IDR bid. However, actually, the prediction error may have a significant impact on the optimization results, and users may not respond according to the maximum capacity after UDDSR bid, which must be taken into consideration. In order to solve the above questions, CVaR is applied.
4.2.1. CVaR Model
CVaR theory was firstly used to solve the optimal portfolio problem of investment risk related to financial hedging. It is mainly used to measure the investment loss when the investment loss exceeds the expected maximum loss (i.e., Value-at-Risk (VaR)) under a given confidence level. The CVaR model is shown as follows.
where CVaRcon is the average excess loss under a given confidence level; con is the confidence level; f(X, γ) is the loss function; X is the investment portfolio; γ is the risk variable; VaRcon is the expected maximum loss under the con; E[.] expresses the expect function.
If the probability of γ in different scenarios is known, the formulation of discrete CVaR can be expressed as follows.
where is the probability of γ occurring at time t; N is the number of discrete time intervals.
However, (42) needs to obtain VaR at the same confidence level first, which complicates the computing process. To increase the computing speed, the relaxation method in [22] is applied to solve CVaR and VaR simultaneously. The relaxed CVaR discrete function is converted into a common optimization problem, and its calculation formula is expressed as follows.
where CVaRcon is the minimum value of g(X, α); α is the intermediate variable after relaxation of VaR, and when g(X, α) goes to the minimum, α is equal to VaRcon.
4.2.2. Day-Ahead Energy Optimization Model Based on CVaR
In the community CHP system, the uncertainties include the prediction errors of electric and heat load, PV output and outdoor temperature, and the response load fluctuation of UDDSR. In this section, the random simulation algorithm is used to generate a set of uncertinty scenarios. It is assumed that the probability distribution of forecast errors and load response fluctuation obeys the normal distribution with the mean value being the forecast, i.e., γ~N(rforecast, σ2), and the probability distribution formula is:
where r is the uncertainty variable; σ is the standard deviation of r; rforecast is the forecast value of r.
According to (43), the day-ahead energy optimization model based on CVaR is formulated as follows.
where Ctotal,i is the total cost of system operation in scenario i; E[Ctotal,i] is the expected cost of system operation in all simulated uncertainty scenarios; is the middle variable in scenario i; M is the total number of uncertainty scenarios.
Then, after considering the uncertainties of forecast error and response fluctuation, the total cost of system operation can be converted into:
where Cpunish is the penalty fee when users do not respond according to the response load optimized by day-ahead UDDSR; is the total actual response load; is the response load optimized by day-ahead UDDSR.
Additionally, according to (18), the objective function can be converted into
where β is the uncertainty factor, i.e., the willingness of the community system to take risks, and β Є [0,1].
Meanwhile, the purpose of the energy optimization based on CVaR is to meet the operating conditions in all uncertainty scenarios, thus the bus balancing constraints can be converted into:
5. Case Study
The proposed model is conducted on a community IES modified from a central neighborhood in Anhui province in China. The community structure diagram is presented in Figure 2. The forecast curves of electricity load, hot water load, PV output and outdoor temperature of the system on a typical winter day is shown in Figure 4. In the appendix, the peak-valley time-of-use electricity price, the subsidy for users participating in UDDSR and the gas price are shown in Table A1, the equipment operating parameters are shown in Table A2, and the equipment cost and subsidy parameters are shown in Table A3, which are all modified from [23]. The cases were compiled with Python 3.7, and solved by Gurobi solver.
5.1. Day-Ahead Energy Optimization Based on UDDSR
In order to verify the impact of the UDDSR mechanism on the whole community system, the outputs of the system equipment before and after the UDDSR response were analyzed.
5.1.1. Energy Optimization Results without UDDSR Response
When users do not participate in the UDDSR response, the community CHP optimizes energy consumption according to the prediction values of electric and heat loads, PV outputs, and outdoor temperature. The optimization results of equipment outputs are shown in Figure 5. It can be seen that during the valley period of the electricity price, since the cost of purchasing electricity from the grid is lower than that of MT generation, the electrical load is almost entirely satisfied by the power supply from the grid. Meanwhile, since the cost of heat production per unit power of GB is lower than that of MT, and the heat load at this time is higher, GB gives priority to full power to ensure heat supply. During the peak period of the electricity price, the cost of power supply from MT is lower than the electricity price, thus the power supply of MT increases significantly. At this time, the remaining heat load is supplemented by GB.
On the other hand, due to the CHP characteristics of MT, after complementing the heat load, MT has excess power. BT charges at the time of 04:00–05:00 and 15:00–16:00 to dissipate the excess power, and discharges during the peak period of power consumption, which improves the energy utilization rate and operating economy of the system. Similarly, when MT produces too much heat, TST uses the heat storage and release characteristics to meet the thermal load demand.
The change of indoor heating temperature is depicted in Figure 6. It can be observed that the indoor temperature is always maintained near the optimal room temperature, and the heating needs are met.
5.1.2. Energy Optimization Results with UDDSR Response
When users participate in the UDDSR response, they submit a flexible IDR bid to CEMS according to their own energy demand. The bid content includes the interruptible load, the shiftable load, the time and capacity of the adjustable load and the CEMS aggregates and optimizes the responsive loads of the users. Based on the aggregated results of the responsive loads, the energy use of the community CHP system is optimized. The UDDSR bid results are shown in Figure 7. In this figure, the green curve indicates the adjustable time of the heating temperature allowed by users. When L_DRH State >0, the upper and lower limits of the heating temperature are allowed to be reduced by Tadj, i.e., the heating range is changed into Tinmin- Tadj ≤ Tt in ≤ Tinmax- Tadj; when L_DRH State < 0, the heating temperature cannot be reduced, i.e., the thermal load cannot be adjusted. In this case, it is assumed that Tadj = 1, Tinmin = 18, Tinmax = 26. It can be seen that the operating costs of the community CHP system are lower when users perform UDDSR based on the optimized IDR response load, compared with performing UDDSR according to the maximum response capacity of the aggregated IDR bid.
The optimization results of the equipment output after the UDDSR response are shown in Figure 8. Figure 8a indicates that after the UDDSR response, the power purchasing from the grid during the peak load period is significantly reduced, since part of the unnecessary load is interrupted or shifted. Figure 8b indicates that during the period of 00:00–05:00 and 21:00–23:00, the MT heat supply is significantly reduced, and the heat load of the users has been adjusted.
Figure 9 represents the comparison of the electric heating load before and after the user response. It can be observed that the UDDSR mechanism has an obvious “peak-shaving and valley-filling” effect on the community system, and can successfully complete the demand response events initiated by the grid operator or dispatching department.
Figure 10 displays the indoor heating temperature changes before and after UDDSR response. After the UDDSR response, the heat load during the period of 00:00–05:00 and 21:00–23:00 has been reduced to a certain extent. Although the actual room temperature has been lowered, it is still higher than Tinmin- Tadj. This means the community system does not operate according to the minimum heating temperature, which guarantees the energy satisfaction of users to the greatest extent, and verifies the accuracy and validity of the heating temperature constraint in (18)
The comparison of system operating costs before and after UDDSR response is shown in Table 1. It can be seen that after participating in the UDDSR response, users can directly receive a load response compensation of RMB 250.49 (including power load and thermal load response compensation). The total daily operating cost of the community system is reduced by RMB 543.75, and the saving rate can reach 3.09%. The results verify the effectiveness of the proposed UDDSR mechanism.
5.2. CVaR-Based Energy Optimization
In this subsection, the random simulation sampling method based on (44) is used to model the uncertainties that the community system may face. Four scenarios where the maximum prediction error and maximum load response fluctuation (maximum uncertainty fluctuations) are not more than 5%, 10%, 15% and more than 15% are set for comparison. Among them the maximum prediction error of outdoor temperature is set to be not more than 2 °C. The number of subscenarios in the uncertainty scenario set for each scenario is 100. The influence of different confidence levels con and different uncertainty coefficients β on the system optimization results is analyzed.
5.2.1. Energy Risk Optimization Results Based on CVaR
Scenario 2, where the maximum uncertainty fluctuation does not exceed 10%, is taken as an example to analyze the optimization results when con = 0.95, β = 1. A set of uncertainty scenarios is depicted in Figure 11.
The electrical load response is assumed to fluctuate below the optimal response obtained by day-ahead optimization based on UDDSR, i.e., the case only considers the situation where the actual response of users does not meet the standard. The adjustable thermal load is allowed to be regulated at 00:00–05:00 and 21:00–23:00, and this setting has a certain logical consistency with the heating needs of users.
The system energy optimization results of scenario 2 are depicted in Figure 12. From Figure 12a, it can be observed that when β = 1, the power supply of the community system is greater than the predicted electric load in most periods. In Figure 12b, L_AC0 is the thermal load of users before the UDDSR response, and the heating power of the community system during 00:00 and 06:00–13:00 is greater than the predicted heating load. The community system adopts a completely conservative risk avoidance strategy, i.e., to make the system operate normally under the interference of any risk fluctuations in the second scenario, the system equipment output as much power as possible to meet the electric and heating demand of users.
Figure 13 shows the changes in indoor temperature in the four scenarios. It can be seen that the greater the risk fluctuation, the greater the indoor temperature variation. However, the change of the indoor temperature remains within 2 °C per unit time, and the indoor temperature is kept within the upper and lower limits allowed by users.
The comparison of system operating costs in the four scenarios is shown in Table 2. When the maximum risk fluctuation is less than or equal to 5%, the expected total cost of system operation is reduced by RMB 158.7 compared with the total cost without UDDSR response, that is, a saving of 0.9%. When the maximum risk fluctuation is less than or equal to 10%, the expected cost of the community system operating in the second scenario is RMB 212.33 higher than that without UDDSR response. The system only needs to pay 1.21% more in operating expenses to deal with the impact of 10% risk fluctuation. When the maximum risk fluctuation is larger than 10%, the expected cost of system operation will continue to rise as the risk fluctuation becomes larger. Once the prediction error is large, the system must pay high costs in order to avoid operational risks. On the other hand, the average excess loss of the system increases with the increase in risk fluctuations, indicating that the system needs to increase investment to better deal with risks, which verifies the rationality of the algorithm proposed in this paper.
5.2.2. Impact of Confidence Level and Uncertainty Coefficient of CVaR on Energy Use Optimization
To further study the impact of confidence level con and uncetianty coefficient β (the risk preference of system operators) on the system optimization results, scenario 2 is used as an example to construct the following test set.
The performance of the expected cost of community system operation on the test set under scenario 2 is shown in Figure 14. The expected cost of system operation decreases as the confidence level decreases. This is because the predicted value of the uncertainty variable is used to generate the scenario. The lower the value of con, the lower the probability that the predicted value of the uncertainty variable is included in the uncertainty scenario set (i.e., the closer the uncertainty variable is to the predicted value). On the other hand, β represents the weight of CVaR in the optimization objective function. The larger the weight, the more the system tends to avoid uncertainties. Therefore, when con is determined, the expected cost of the system increases with the increase of β.
Figure 15 shows the average excess loss CVaR that the community runs under uncertainty on the test set. The average excess loss of the system decreases with the increase in the CVaR weight. The larger the CVaR weight, the more prone the system is to uncertainties, and the system will try to reduce possible uncertainty-induced losses even if this results in of higher operation costs. On the other hand, when β is determined, the average excess loss increases with the rise of con. This is because CVaR measures the tail uncertainty outside the confidence interval. The larger con is, the greater the deviation between the uncertainty variables and the predicted value in the uncertainty scenario, and the greater the possible uncertainty loss is.
To more clearly show the relationship between CVaR and the expected cost of system operation, a case where con = 0.95 is analyzed. In this case, the uncertainty variables contained in the uncertainty scenario set are more volatile, and the system is faced with greater possible uncertainties. The results are shown in Figure 16. When β increases, the expected cost of the system continues to increase, while the average excess loss of the system continues to decrease. This is because the greater β is, the more the system prefers to avoid uncertainties, and the system is willing to pay higher operating costs in exchange for lower excess losses.
6. Conclusions
This paper proposes an energy optimization method for community IES based on UDDSR. The thermal model of aggregated buildings is introduced to measure users’ adjustable thermal load, and the responsive loads including power loads and thermal loads are aggregated and optimized through UDDSR optimization. Then, a day-ahead scheduling model is proposed to optimize the energy management for the community IES, and CVaR theory is introduced to deal with the volatility of PV output, user load, outdoor temperature, and user actual UDDSR response load. The case study shows that the proposed UDDSR mechanism can effectively reduce the operating costs under the premise of fully considering the willingness of users to participate in IDR events. Additionally, the optimization method based on CVaR enables the community system to pay less than 2% in additional operating costs to deal with the energy deviation caused by the maximum uncertainty of 10%, thus verifying the correctness and effectiveness of the method presented in this paper. For further study, the relationship between user energy consumption behavior and response capacity can be explored, so as to construct a reward and punishment mechanism that is more suitable for the energy needs of users.
Author Contributions
Conceptualization, J.Z.; Formal analysis, Y.L.; Funding acquisition, Z.M.; Investigation, Y.P.; Methodology, J.Z.; Project administration, Z.M.; Resources, Z.M.; Software, Y.L.; Supervision, Y.P. and S.Z.; Validation, J.Z. and Z.M.; Writing—original draft, Y.L.; Writing—review and editing, Y.P. and S.Z. All authors have read and agreed to the published version of the manuscript.
Funding
This research was funded by the Science and Technology Project of Jiangsu State Grid Corporation of China, Grant J20210148.
Institutional Review Board Statement
Not applicable.
Informed Consent Statement
Not applicable.
Data Availability Statement
Not applicable.
Conflicts of Interest
The authors declare no conflict of interest.
Appendix A

Table A1.
The electricity price, subsidy for UDDSR participators and gas price.
| Time period | Electricity Price (RMB/kWh) | Power Load Response Subsidy (RMB/kWh) | Thermal Load Response Subsidy (RMB/kWh) | Imbalance Response Penalty (RMB/kWh) | Gas Price (RMB/m³) |
|---|---|---|---|---|---|
| Peak time ((09:00–13:00], [17:00–20:00)) | 1.19 | 0.3 | 0.2 | 0.6 | 3 |
| Normal time ((06:00–08:00], [14:00–16:00)) | 0.75 | 0.1 | 0.2 | 0.4 | 3 |
| Valley time ((00:00–05:00], [21:00–23:00)) | 0.36 | 0.05 | 0.2 | 0.18 | 3 |
Table A2.
The equipment operating parameters.
| Parameter | Value | Parameter | Value |
|---|---|---|---|
| MT generating efficiency | 0.36 | TST heat releasing efficiency | 0.95 |
| MT maximum output power | 500 kW | TST self-loss rate of thermal energy | 0.04 |
| MT minimum output power | 10 kW | TST maximum capacity | 100 kWh |
| GB heat production efficiency | 0.85 | TST minimum capacity | 0 kWh |
| GB maximum thermal output power | 600 kW | TST maximum heat storage/release power | 50 kW |
| GB minimum thermal output power | 0 kW | Maximum power purchased from the grid | 1000 kW |
| BT charging efficiency | 0.95 | Minimum power purchased from the grid | 0 kW |
| BT discharging efficiency | 0.95 | Maximum power of interruptible power load | |
| BT self-loss rate of electrical energy | 0.04 | Maximum power of shiftable power load | / |
| BT maximum capacity | 100 kWh | Maximum indoor temperature | 26 |
| BT minimum capacity | 0 kWh | Minimum indoor temperature | 18 |
| BT maximum charging/discharging power | 50 kW | Optimum indoor temperature | 21 |
| TST heat storing efficiency | 0.95 | Maximum adjustable temperature | Tadj |
Table A3.
The operation and maintenance cost of equipment and subsidy parameters.
| Equipment | Operation and Maintenance Cost (RMB/kWh) | Equipment | Subsidy (RMB/kWh) |
|---|---|---|---|
| MT | 0.075 | BT | 0.01 |
| GB | 0.08 | TST | 0.01 |
| PV | 0.01 |
References
- Jia, B.; Li, F.; Sun, B. Design of energy management platform for integrated energy system. In Proceedings of the 2019 14th IEEE Conference on Industrial Electronics and Applications (ICIEA), Xi’an, China, 19–21 June 2019; pp. 1593–1597. [Google Scholar]
- Tao, H.; Fang, L.; YaLou, L.; Xiaoxin, Z. The Design of the Simulation System for the Integrated Energy System. In Proceedings of the 2018 International Conference on Power System Technology (POWERCON), Guangzhou, China, 6–9 November 2018; pp. 410–416. [Google Scholar]
- Zhou, X.; Bao, Y.-Q.; Chen, P.-P.; Ji, T.; Deng, W.; Jin, W. Integrated Electricity and Natural Gas Energy System Scheduling Model Considering Multi-Energy Storage Systems. In Proceedings of the 2018 IEEE PES Asia-Pacific Power and Energy Engineering Conference (APPEEC), Sabah, Malaysia, 7–10 October 2018; pp. 178–182. [Google Scholar]
- Miao, B.; Lin, J.; Li, H.; Liu, C.; Li, B.; Zhu, X.; Yang, J. Day-Ahead Energy Trading Strategy of Regional Integrated Energy System Considering Energy Cascade Uti-lization. IEEE Access 2020, 8, 138021–138035. [Google Scholar] [CrossRef]
- Chen, Y.; Wei, W.; Liu, F.; Sauma, E.E.; Mei, S. Energy Trading and Market Equilibrium in Integrated Heat-Power Distri-bution Systems. IEEE Trans. Smart Grid 2019, 10, 4080–4094. [Google Scholar] [CrossRef]
- Tedesco, F.; Mariam, L.; Basu, M.; Casavola, A.; Conlon, M.F. Economic Model Predictive Control-Based Strategies for Cost-Effective Supervision of Community Microgrids Considering Battery Lifetime. IEEE J. Emerg. Sel. Top. Power Electron. 2015, 3, 1067–1077. [Google Scholar] [CrossRef]
- Qinwei, D. A price-based demand response scheduling model in day-ahead electricity market. In Proceedings of the 2016 IEEE Power and Energy Society General Meeting (PESGM), Boston, MA, USA, 17–21 July 2016; pp. 1–5. [Google Scholar]
- Junhui, L.; Hongkun, B.; Hujun, L.; Qinchen, Y.; Fangzhao, D.; Wenjie, Z. Optimal Decomposition of Flexible Load Resource Reserve Target Based on Power Demand Response. In Proceedings of the 2021 IEEE International Conference on Power Electronics, Computer Applications (ICPECA), Shenyang, China, 22–24 January 2021; pp. 1046–1049. [Google Scholar]
- Parisio, A.; Rikos, E.; Glielmo, L. A Model Predictive Control Approach to Microgrid Operation Optimization. IEEE Trans. Control Syst. Technol. 2014, 22, 1813–1827. [Google Scholar] [CrossRef]
- Du, Y.; Zheng, N.; Cai, Q.; Li, Y.; Li, Y.; Shi, P. Research on Key Technologies of User Side Integrated Demand Response for Multi-Energy Coordination. In Proceedings of the 2020 IEEE 4th Conference on Energy Internet and Energy System Integration (EI2), Wuhan, China, 30 October–1 November 2020; pp. 2461–2464. [Google Scholar]
- Bahrami, S.; Sheikhi, A. From Demand Response in Smart Grid toward Integrated Demand Response in Smart Energy Hub. IEEE Trans. Smart Grid 2015, 7, 650–658. [Google Scholar] [CrossRef]
- Liu, P.; Ding, T.; Zou, Z.; Yang, Y. Integrated demand response for a load serving entity in multi-energy market considering network constraints. Appl. Energy 2019, 250, 512–529. [Google Scholar] [CrossRef]
- Wang, J.; Zhong, H.; Ma, Z.; Xia, Q.; Kang, C. Review and prospect of integrated demand response in the multi-energy system. Appl. Energy 2017, 202, 772–782. [Google Scholar] [CrossRef]
- Ren, S.; Dou, X.; Wang, Z.; Wang, J.; Wang, X. Medium- and Long-Term Integrated Demand Response of Integrated Energy System Based on System Dynamics. Energies 2020, 13, 710. [Google Scholar] [CrossRef] [Green Version]
- Yang, H.; Li, M.; Jiang, Z.; Zhang, P. Multi-Time Scale Optimal Scheduling of Regional Integrated Energy Systems Con-sidering Integrated Demand Response. IEEE Access 2020, 8, 5080–5090. [Google Scholar] [CrossRef]
- Tahir, M.F.; Haoyong, C.; Mehmood, K.; Ali, N.; Bhutto, J.A. Integrated Energy System Modeling of China for 2020 by Incorporating Demand Response, Heat Pump and Thermal Storage. IEEE Access 2019, 7, 40095–40108. [Google Scholar] [CrossRef]
- Jiang, Z.; Ai, Q.; Hao, R. Integrated Demand Response Mechanism for Industrial Energy System Based on Multi-Energy Interaction. IEEE Access 2019, 7, 66336–66346. [Google Scholar] [CrossRef]
- Stenner, K.; Frederiks, E.R.; Hobman, E.V.; Cook, S. Willingness to participate in direct load control: The role of consumer distrust. Appl. Energy 2017, 189, 76–88. [Google Scholar] [CrossRef]
- Zhou, S.; Zou, F.; Wu, Z.; Gu, W.; Hong, Q.; Booth, C. A smart community energy management scheme considering user dominated demand side response and P2P trading. Int. J. Electr. Power Energy Syst. 2020, 114, 105378. [Google Scholar] [CrossRef]
- Brahman, F.; Honarmand, M.; Jadid, S. Optimal electrical and thermal energy management of a residential energy hub, integrating demand response and energy storage system. Energy Build. 2015, 90, 65–75. [Google Scholar] [CrossRef]
- Wang, C.S.; Hong, B.W.; Guo, L.; Zhang, D.J.; Liu, W.J. A General Modeling Method for Optimal Dispatch of Combined Cooling, Heating and Power Microgrid. Proc. CSEE 2013, 33, 26–33. [Google Scholar]
- Zhang, Q.; Wang, X. Hedge Contract Characterization and Risk-Constrained Electricity Procurement. IEEE Trans. Power Syst. 2009, 24, 1547–1558. [Google Scholar] [CrossRef]
- Sheikhi, A.; Rayati, M.; Bahrami, S.; Ranjbar, A.M. Integrated Demand Side Management Game in Smart Energy Hubs. IEEE Trans. Smart Grid 2015, 6, 675–683. [Google Scholar] [CrossRef]
Figure 1.
Thermodynamic model of the aggregated buildings.

Figure 2.
Community CHP system structure diagram based on UDDSR.

Figure 3.
Community CHP system bus bar structure diagram based on UDDSR.

Figure 4.
The forecast curves of electric load, hot water load, PV output and outdoor temperature of the system on a typical winter day.
Figure 4.
The forecast curves of electric load, hot water load, PV output and outdoor temperature of the system on a typical winter day.

Figure 5.
Energy optimization results without UDDSR response. (a) Optimization results of electric bus; (b) optimization results of heat bus.
Figure 5.
Energy optimization results without UDDSR response. (a) Optimization results of electric bus; (b) optimization results of heat bus.

Figure 6.
The change of indoor heating temperature without UDDSR response.

Figure 7.
The response loads of users participating in UDDSR.

Figure 8.
Energy optimization results with UDDSR response. (a) Optimization results of electric bus; (b) optimization results of heat bus.
Figure 8.
Energy optimization results with UDDSR response. (a) Optimization results of electric bus; (b) optimization results of heat bus.
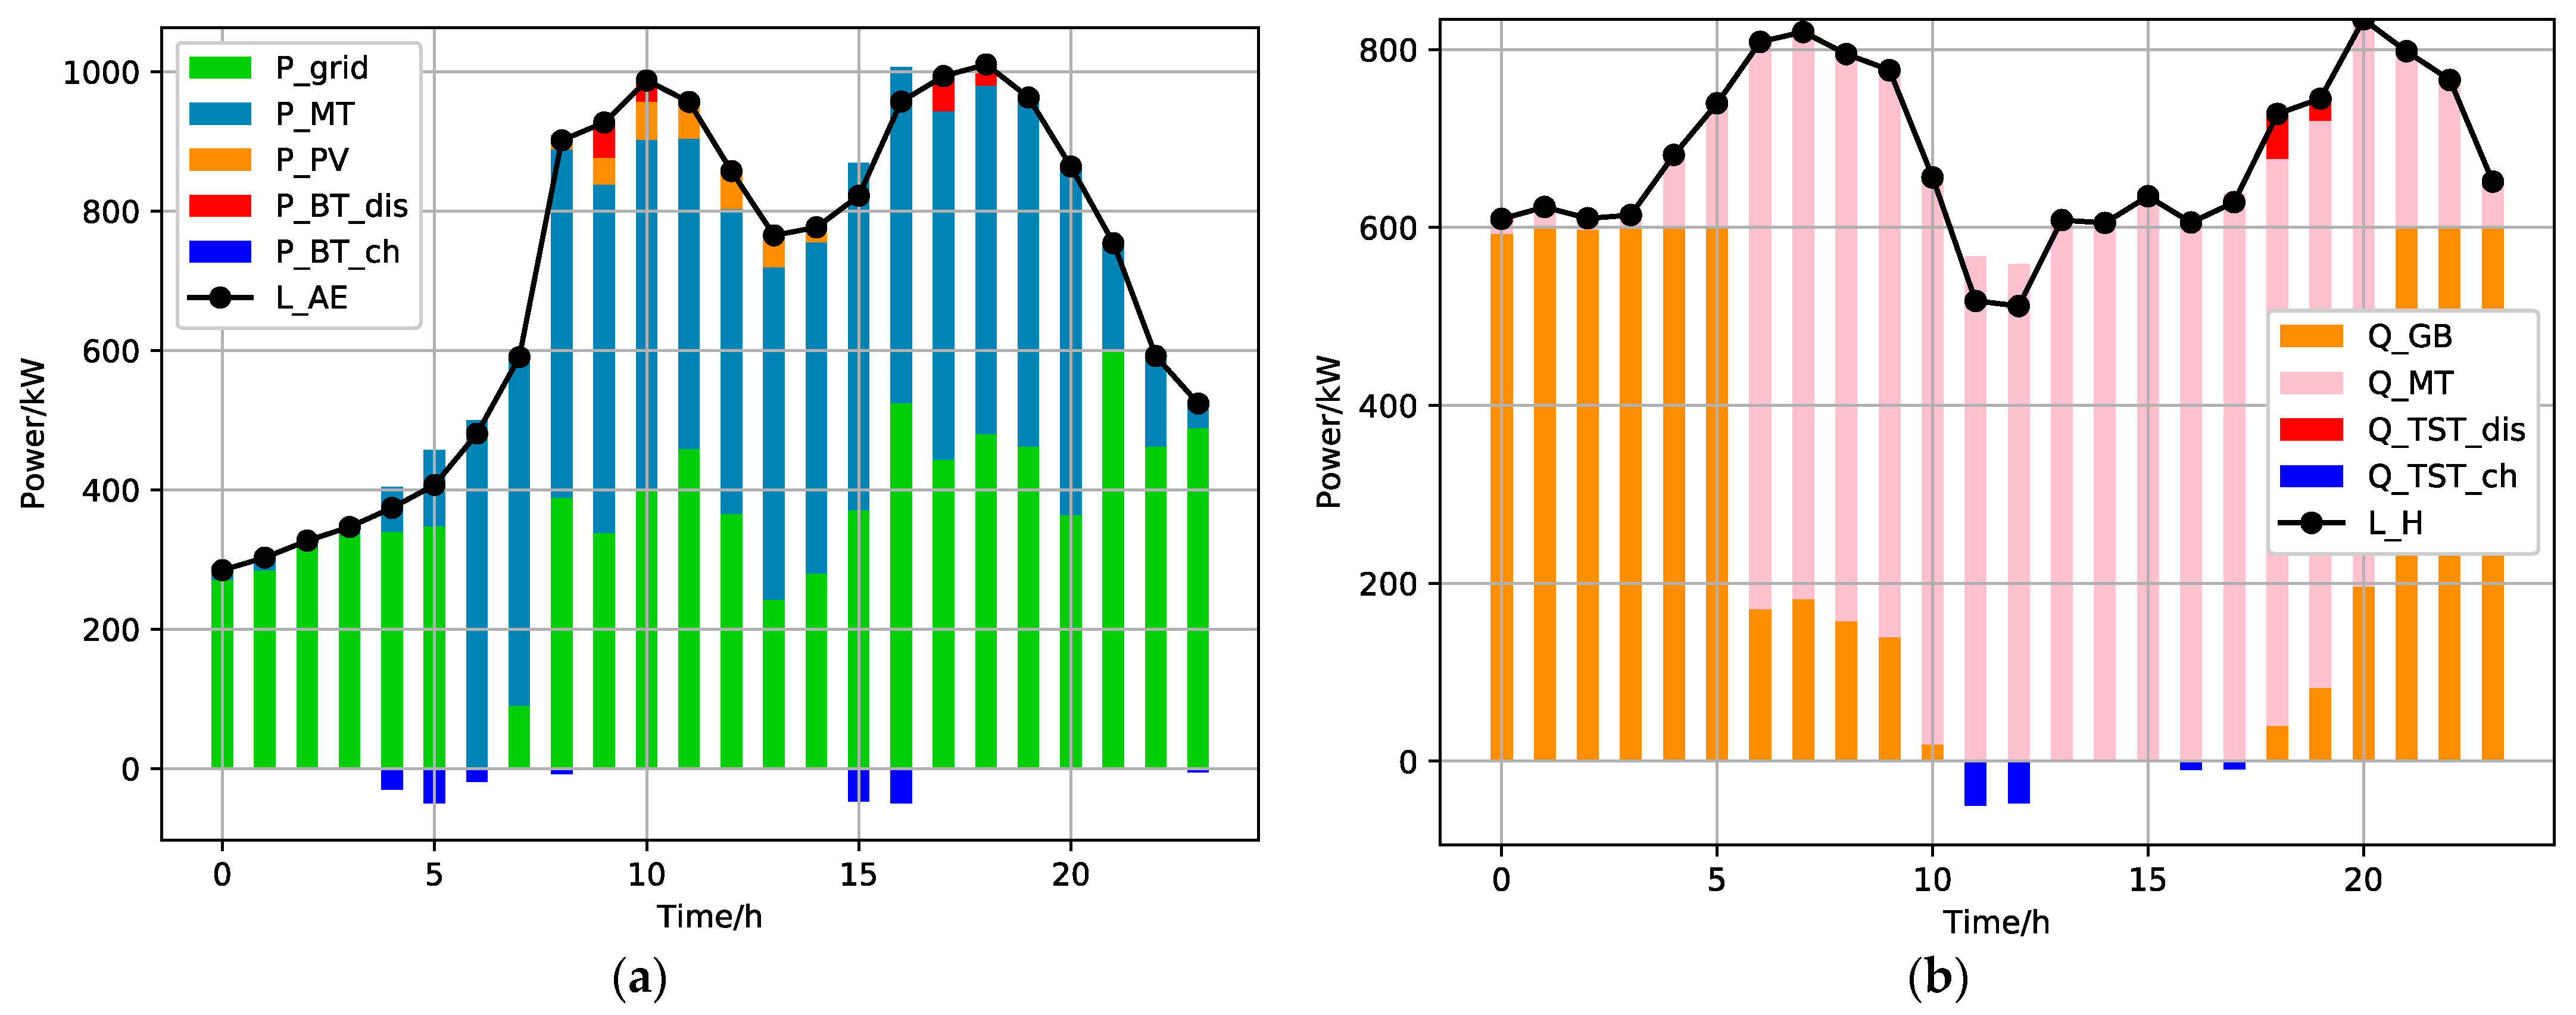
Figure 9.
Comparison of electric and heat load before and after UDDSR. (a) Comparison of electric load before and after response; (b) comparison of heat load before and after response.
Figure 9.
Comparison of electric and heat load before and after UDDSR. (a) Comparison of electric load before and after response; (b) comparison of heat load before and after response.

Figure 10.
Indoor heating temperature before and after UDDSR.

Figure 11.
Uncertainty scenarios set with maximum risk fluctuation ≤10%.

Figure 12.
System energy optimization results with maximum uncertainty fluctuation ≤10%. (a) Optimization results of electric bus; (b) optimization results of heat bus.
Figure 12.
System energy optimization results with maximum uncertainty fluctuation ≤10%. (a) Optimization results of electric bus; (b) optimization results of heat bus.

Figure 13.
Comparison of indoor heating temperature in different scenarios (con = 0.95, β = 1): (a) maximum uncertainty fluctuation ≤5%; (b) maximum uncertainty fluctuation ≤10%; (c) maximum uncertainty fluctuation ≤15%; (d) maximum uncertainty fluctuation >15% (about 50%).
Figure 13.
Comparison of indoor heating temperature in different scenarios (con = 0.95, β = 1): (a) maximum uncertainty fluctuation ≤5%; (b) maximum uncertainty fluctuation ≤10%; (c) maximum uncertainty fluctuation ≤15%; (d) maximum uncertainty fluctuation >15% (about 50%).


Figure 14.
The changes of expected cost of system operation with con and β (maximum uncertainty fluctuation ≤10%).
Figure 14.
The changes of expected cost of system operation with con and β (maximum uncertainty fluctuation ≤10%).

Figure 15.
The changes of CVaR with con and β (maximum risk fluctuation ≤10%).
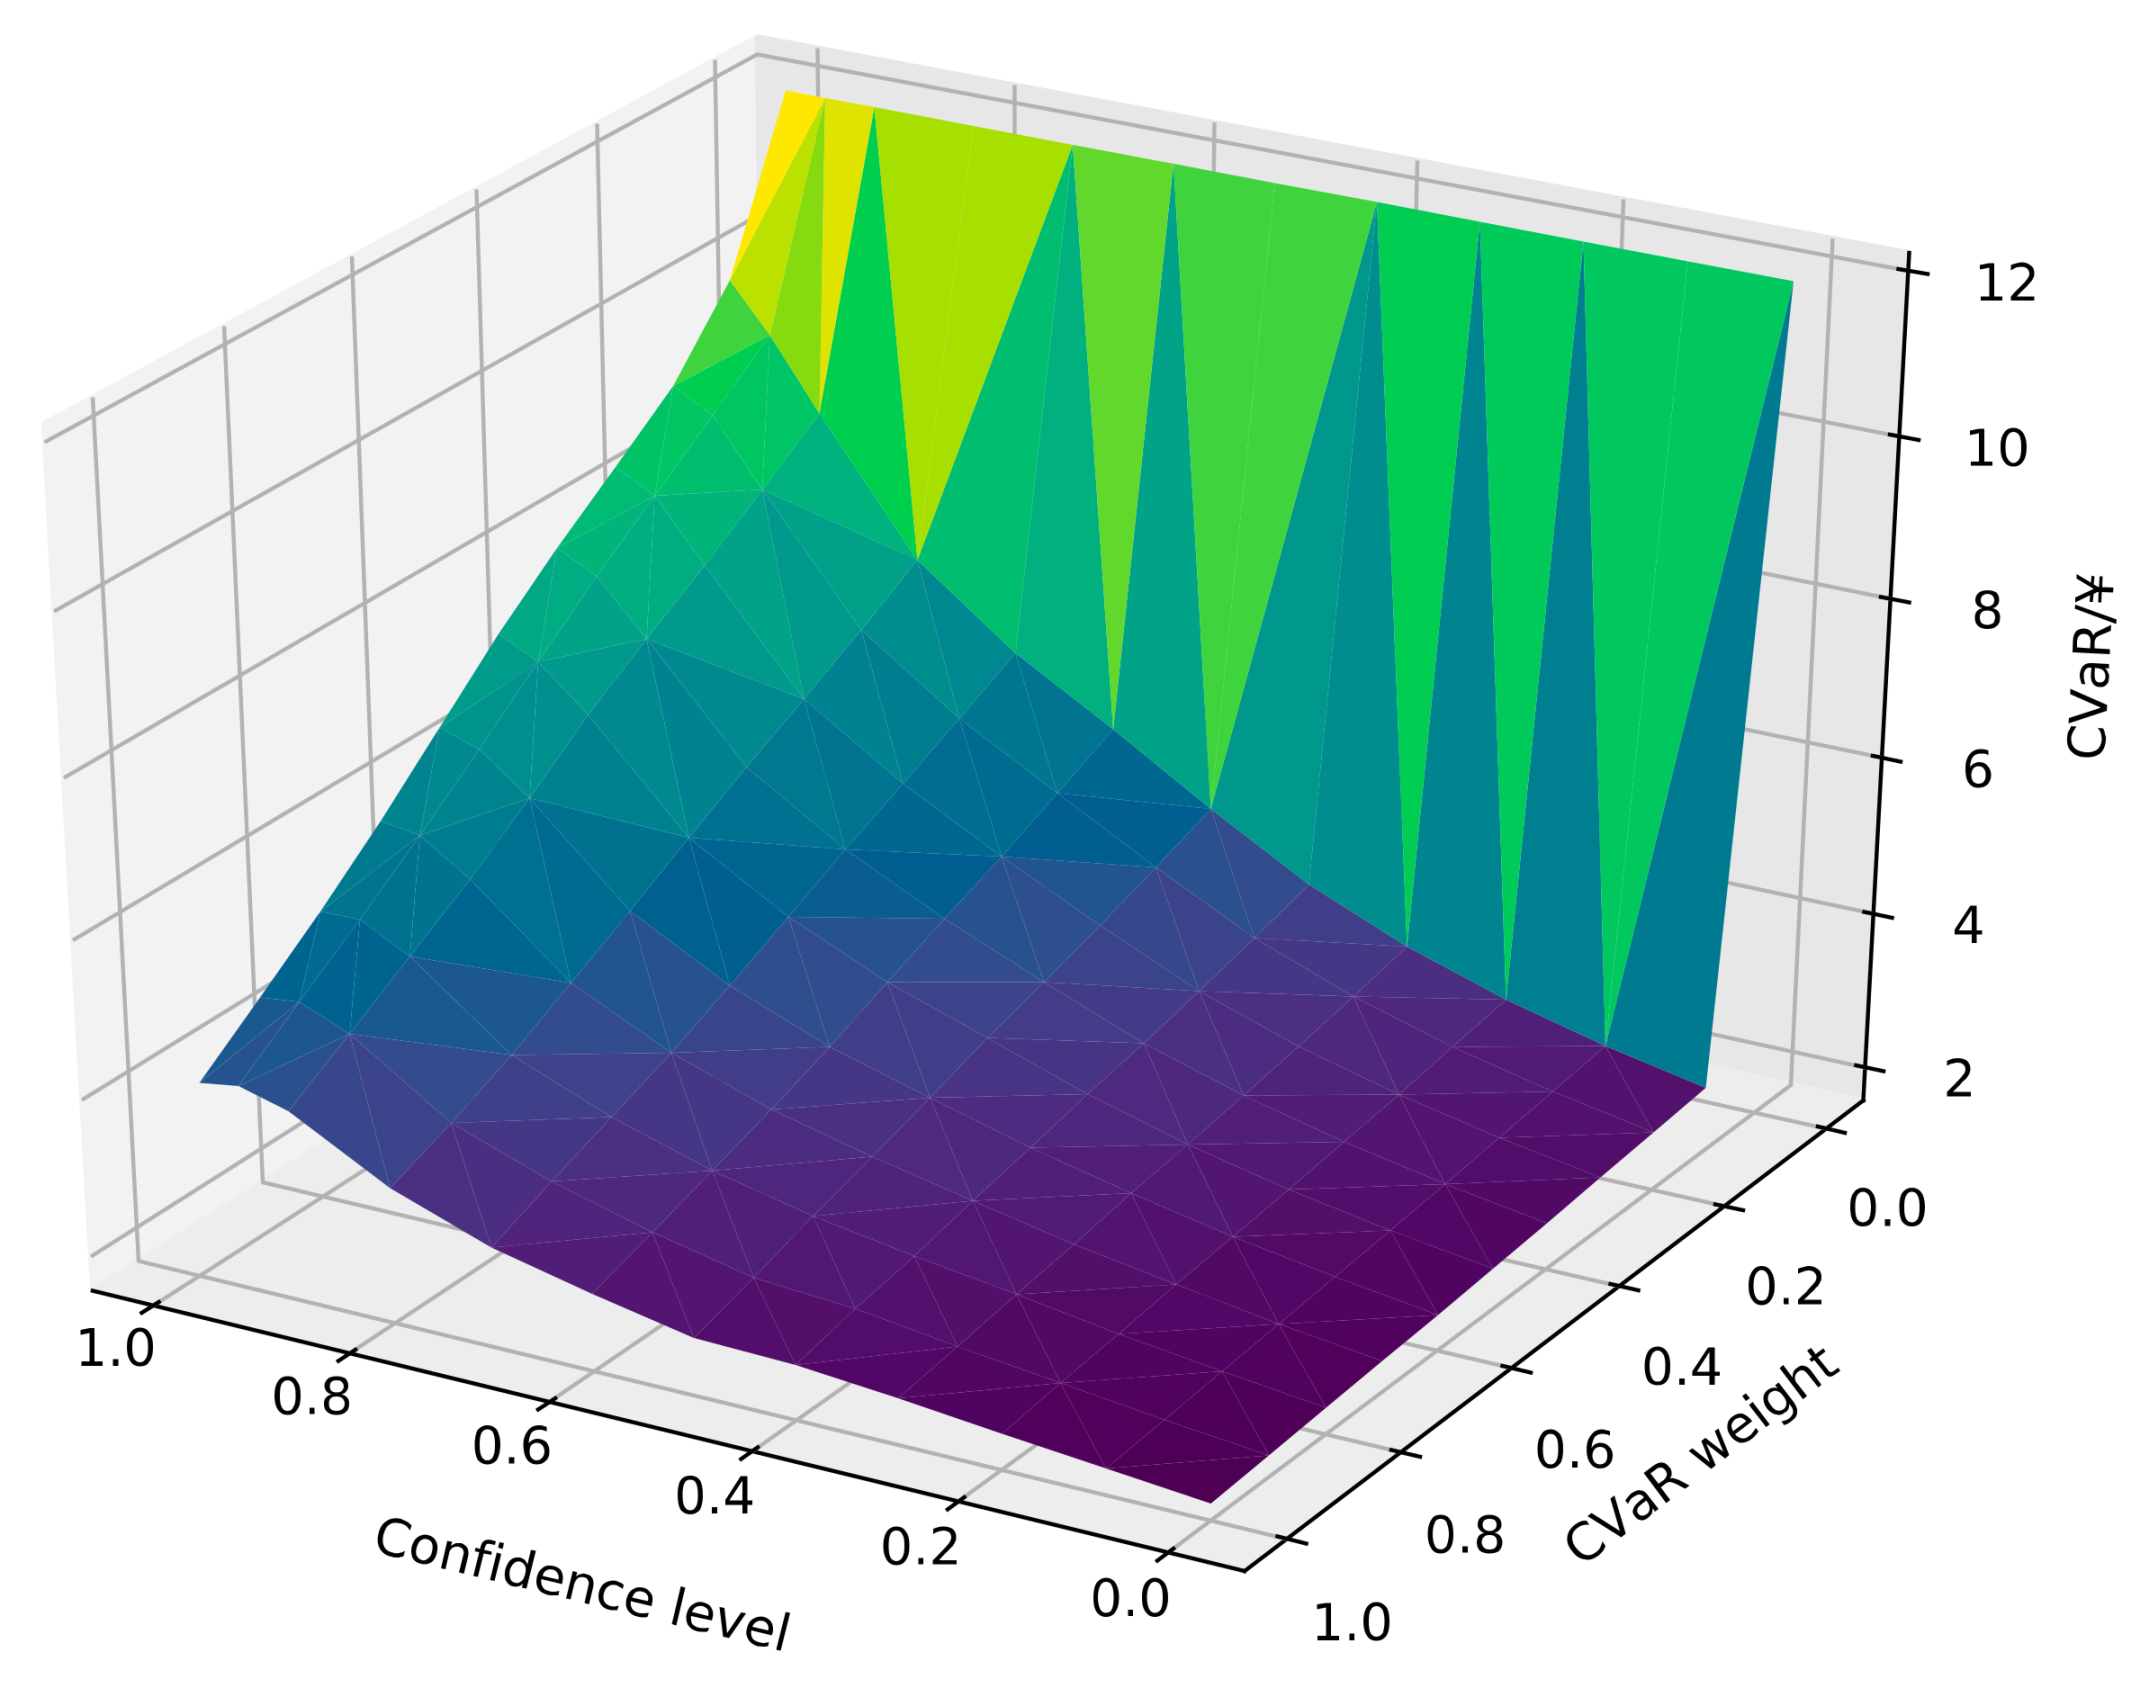
Figure 16.
The changes of CVaR and expected cost with β (maximum uncertainty fluctuation ≤10%).

Table 1.
System operation costs before and after UDDSR response.
| Before UDDSR | After UDDSR | Saving (%) | |
|---|---|---|---|
| Electricity purchasing cost (RMB) | 7344.90 | 6715.64 | 8.57% |
| Gas purchasing cost (RMB) | 9153.34 | 9001.82 | 1.66% |
| Operation and maintenance (RMB) | 1122.07 | 1108.60 | 1.20% |
| Power load response compensation (RMB) | 0 | 205 | / |
| Thermal load response compensation (RMB) | 0 | 45.49 | / |
| BT subsidies (RMB) | 0 | 5.70 | |
| Adjustable temperature (°C) | 0 | 1 | / |
| Total cost (RMB) | 17,620.31 | 17,076.56 | 3.09% |
Table 2.
System operation costs in different scenarios (con = 0.95, β = 1).
| Scenarios | Before UDDSR | 1 | 2 | 3 | 4 |
|---|---|---|---|---|---|
| Maximum risk fluctuation | 0% | ≤5% | ≤10% | ≤15% | >15% |
| Electricity purchasing cost (RMB) | 7344.90 | 6889.18 | 7293.46 | 8048.00 | 11529.32 |
| Gas purchasing cost (RMB) | 9153.34 | 9208.27 | 9177.42 | 9338.93 | 9765.28 |
| Power load response subsidies (RMB) | 0 | 203.25 | 200.87 | 196.98 | 183.88 |
| Thermal load response subsidies (RMB) | 0 | 37.32 | 45.13 | 26.54 | 20.97 |
| BT subsidies (RMB) | 0 | 5.70 | 5.70 | 5.71 | 5.93 |
| Imbalance response penalty (yaun) | 0 | 3.77 | 8.81 | 17.21 | 46.23 |
| Adjustable tmperature (°C) | 0 | 1 | 1 | 1 | 1 |
| Total expected cost of operation (RMB) | 17,620.31 | 17,461.61 | 17,832.64 | 18,739.14 | 22,662.36 |
| CVaR (RMB) | 0 | 4.13 | 5.21 | 17.45 | 41.01 |
| Total cost savings ratio | / | 0.90% | −1.21% | −6.34% | −28.61% |
Publisher’s Note: MDPI stays neutral with regard to jurisdictional claims in published maps and institutional affiliations. |
© 2021 by the authors. Licensee MDPI, Basel, Switzerland. This article is an open access article distributed under the terms and conditions of the Creative Commons Attribution (CC BY) license (https://creativecommons.org/licenses/by/4.0/).
Share and Cite
MDPI and ACS Style
Li, Y.; Zhang, J.; Ma, Z.; Peng, Y.; Zhao, S. An Energy Management Optimization Method for Community Integrated Energy System Based on User Dominated Demand Side Response. Energies 2021, 14, 4398. https://doi.org/10.3390/en14154398
AMA Style
Li Y, Zhang J, Ma Z, Peng Y, Zhao S. An Energy Management Optimization Method for Community Integrated Energy System Based on User Dominated Demand Side Response. Energies. 2021; 14(15):4398. https://doi.org/10.3390/en14154398
Chicago/Turabian StyleLi, Yiqi, Jing Zhang, Zhoujun Ma, Yang Peng, and Shuwen Zhao. 2021. "An Energy Management Optimization Method for Community Integrated Energy System Based on User Dominated Demand Side Response" Energies 14, no. 15: 4398. https://doi.org/10.3390/en14154398
Note that from the first issue of 2016, this journal uses article numbers instead of page numbers. See further details here.