


Abstract
Efficient air-cooling systems for hot climatic conditions, such as Southern Europe, are required in the context of nearly Zero Energy Buildings, nZEB. Innovative air-cooling systems such as regenerative indirect evaporative coolers, RIEC and desiccant regenerative indirect evaporative coolers, DRIEC, can be considered an interesting alternative to direct expansion air-cooling systems, DX. The main aim of the present work was to evaluate the seasonal performance of three air-cooling systems in terms of air quality, thermal comfort and energy consumption in a standard classroom. Several annual energy simulations were carried out to evaluate these indexes for four different climate zones in the Mediterranean area. The simulations were carried out with empirically validated models. The results showed that DRIEC and DX improved by 29.8% and 14.6% over RIEC regarding thermal comfort, for the warmest climatic conditions, Lampedusa and Seville. However, DX showed an energy consumption three and four times higher than DRIEC for these climatic conditions, respectively. RIEC provided the highest percentage of hours with favorable indoor air quality for all climate zones, between 46.3% and 67.5%. Therefore, the air-cooling systems DRIEC and RIEC have a significant potential to reduce energy consumption, achieving the user’s thermal comfort and improving indoor air quality.
1. Introduction
According to the Energy Performance of Building Directive, sustainable development and the achievement of competitive HVAC systems were established as main objectives [1]. The final energy consumption in buildings accounts for 40% of the total energy consumption in Europe, as well as 36% of the total CO2 emissions [2]. HVAC systems represent a significant percentage of this energy consumption. Hence, the development of innovative air-cooling systems is required. Moreover, reduced places with high sensible and latent loads present greater complexity to control indoor air conditions, such as classrooms, offices, etc. [3].
Previous research studies analyzed the behavior of different heating, ventilation and air-conditioning, HVAC, systems [4,5]. HVAC systems with variable refrigerant flow (VRF) are becoming popular due to their flexible operation. Efforts in the research and application of these systems have been made. However, all outside air-cooling systems require further research and development, regarding thermal comfort, air quality and energy efficiency [4]. Several works on HVAC systems were carried out in order to optimize operational parameters, control parameters and design parameters [5]. In most works, the thermal comfort was evaluated, either indicated by the indoor air quality (IAQ) or the predicted mean vote (PMV). The results showed that the thermal comfort control of HVAC systems by PMV achieved a reduction in energy consumption of 46% compared to a control by IAQ [5]. Conventional HVAC systems widely used to serve classrooms in hot-humid climatic conditions are direct expansion units, DX [6,7]. Although the use of air-handling units, AHU, is less frequent than DX in Southern Europe, this system could be considered as a possible case study as a conventional HVAC system [8,9]. DX systems use refrigerant gases and mainly depend on electric power. For this reason, other technologies such as desiccant cooling systems have been studied in other works and present an interesting alternative solution to DX systems [10,11]. The seasonal energy performance of these hybrid systems, based on cooling equipment and dehumidification equipment, has been investigated in previous work with simulation tools [12,13,14]. According to the desiccant capacity in different HVAC systems, the regeneration temperature is the most influential parameter on it [15,16]. Other numerical works analyzed the energy behavior of indirect evaporative coolers in different hybrid systems in terms of indoor air temperature and performance, improving both parameters [17,18,19].
Some authors carried out studies of thermal comfort in schoolrooms with different ventilation strategies during the warmest months of the year [20,21]. School buildings are generally ventilated by natural ventilation. However, due to the high temperatures in summer in Southern Europe, it is not possible to overcome the internal thermal loads by natural ventilation. Many research articles focused on the natural ventilation impact on thermal comfort in the Mediterranean and Atlantic Ocean climate zones [22,23,24]. In most of these works, adaptive thermal comfort was used during occupancy hours, calculated from EN 15251 standard, which was cancelled by European standard EN 16798 [25,26]. Thermal comfort analysis in school buildings of East-Mediterranean area were carried out using the adaptative comfort limits of these standards. Cross ventilation during all day achieved the highest values of thermal comfort, 51% of the period occupied [22]. Other thermal comfort works about a classroom of 60 m2 were based on the EN 15251 standard [23]. Natural ventilation strategies showed that 60% of the occupied period was within thermal comfort [23]. In a recent work, HVAC systems with adaptive thermal comfort (EN 16798-1) were analyzed. In this study, a maximum value of 47% of occupied hours within the comfort conditions was achieved using conventional ventilation [24].
The energy consumption of different hybrid HVAC systems was analyzed in other research studies [27,28,29,30,31]. A numerical study showed a COP value of 2.1 using a solar desiccant cooling system when operating in cooling mode [28]. The COP value did not decrease significantly, 2.0, when the system worked in cooling-dehumidification mode. Furthermore, 75% of the total energy consumed came from solar thermal energy and outdoor air [28]. In another work, it was observed that a maximum of 52% energy saving was achieved in an office with occupancy automatic control as compared to the conventional control of cooling systems [29]. In another study of HVAC systems, CO2 conversion prices were considered, in addition to the initial investment and maintenance costs [30]. In this study, the results showed that the CO2 conversion price varied between 15% and 40% of the total cost, considering the economic and environmental costs values. Another energy study was carried out for a renewable HVAC system installed in an office in Madrid [31]. The renewable HVAC system was composed of a heat pump powered by geothermal energy and fan-coils for heating, cooling and dehumidifying. A reduction in total energy consumption of 39% and a reduction in CO2 emissions of 41% were achieved.
The interest in the indoor air quality research have heightened in order to provide a relationship between the required air ventilation rates and the energy consumption involved, mainly in less studied buildings such as schools. A recent piece of research of ventilation in 94 different classrooms showed an average CO2 concentration of 895 ppm during occupancy period. Estimated ventilation rates of 5.2 l s−1 person−1 showed that insufficient ventilation affects the health of the students [32]. According to measurements and ventilation rates studies in more than 20 classrooms around the world, ventilation rates below the minimum required in standards were notified [33]. In addition to maintaining the air quality in favourable conditions, ventilation systems can also be used for cooling purposes in order to achieve optimal indoor thermal comfort.
Some research studies available in literature show limitations, mainly in terms of acceptable values of air quality and thermal comfort in school buildings. So, it would be interesting to analyze innovative air-cooling systems during the warmest period of the year. The main aim of the present work was to evaluate the seasonal performance of three air-cooling systems in terms of indoor air quality, thermal comfort and energy consumption, in a standard classroom for four different climate zones of the Mediterranean area. The analysis was carried out based on European standards [25,26]. Annual energy simulations for a regenerative indirect evaporative cooler, RIEC, a hybrid air-cooling system based on a desiccant regenerative indirect evaporative cooler, DRIEC and a direct expansion unit, DX, were carried out. Thermal comfort, wfTC, air quality, wfAQ and electric energy consumption, EEC, of each system were studied for each climate zone.
2. Methodology
2.1. Description of Air-Cooling Systems
Three air-cooling systems were studied for a standard classroom: (i) a conventional air-cooling system based on a direct expansion unit (DX); (ii) an air-cooling system based on a regenerative indirect evaporative cooler (RIEC); and (iii) a desiccant regenerative indirect evaporative cooler (DRIEC). In this piece of work, the choice of the air-cooling units was based on the cooling capacity to obtain comparable results in terms of thermal comfort, air quality and energy consumption.
2.1.1. DX System
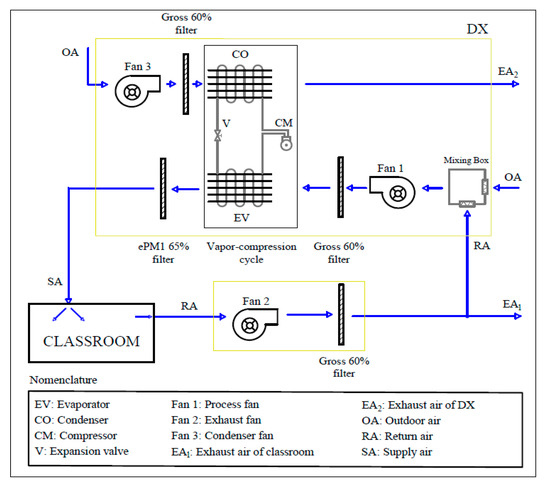
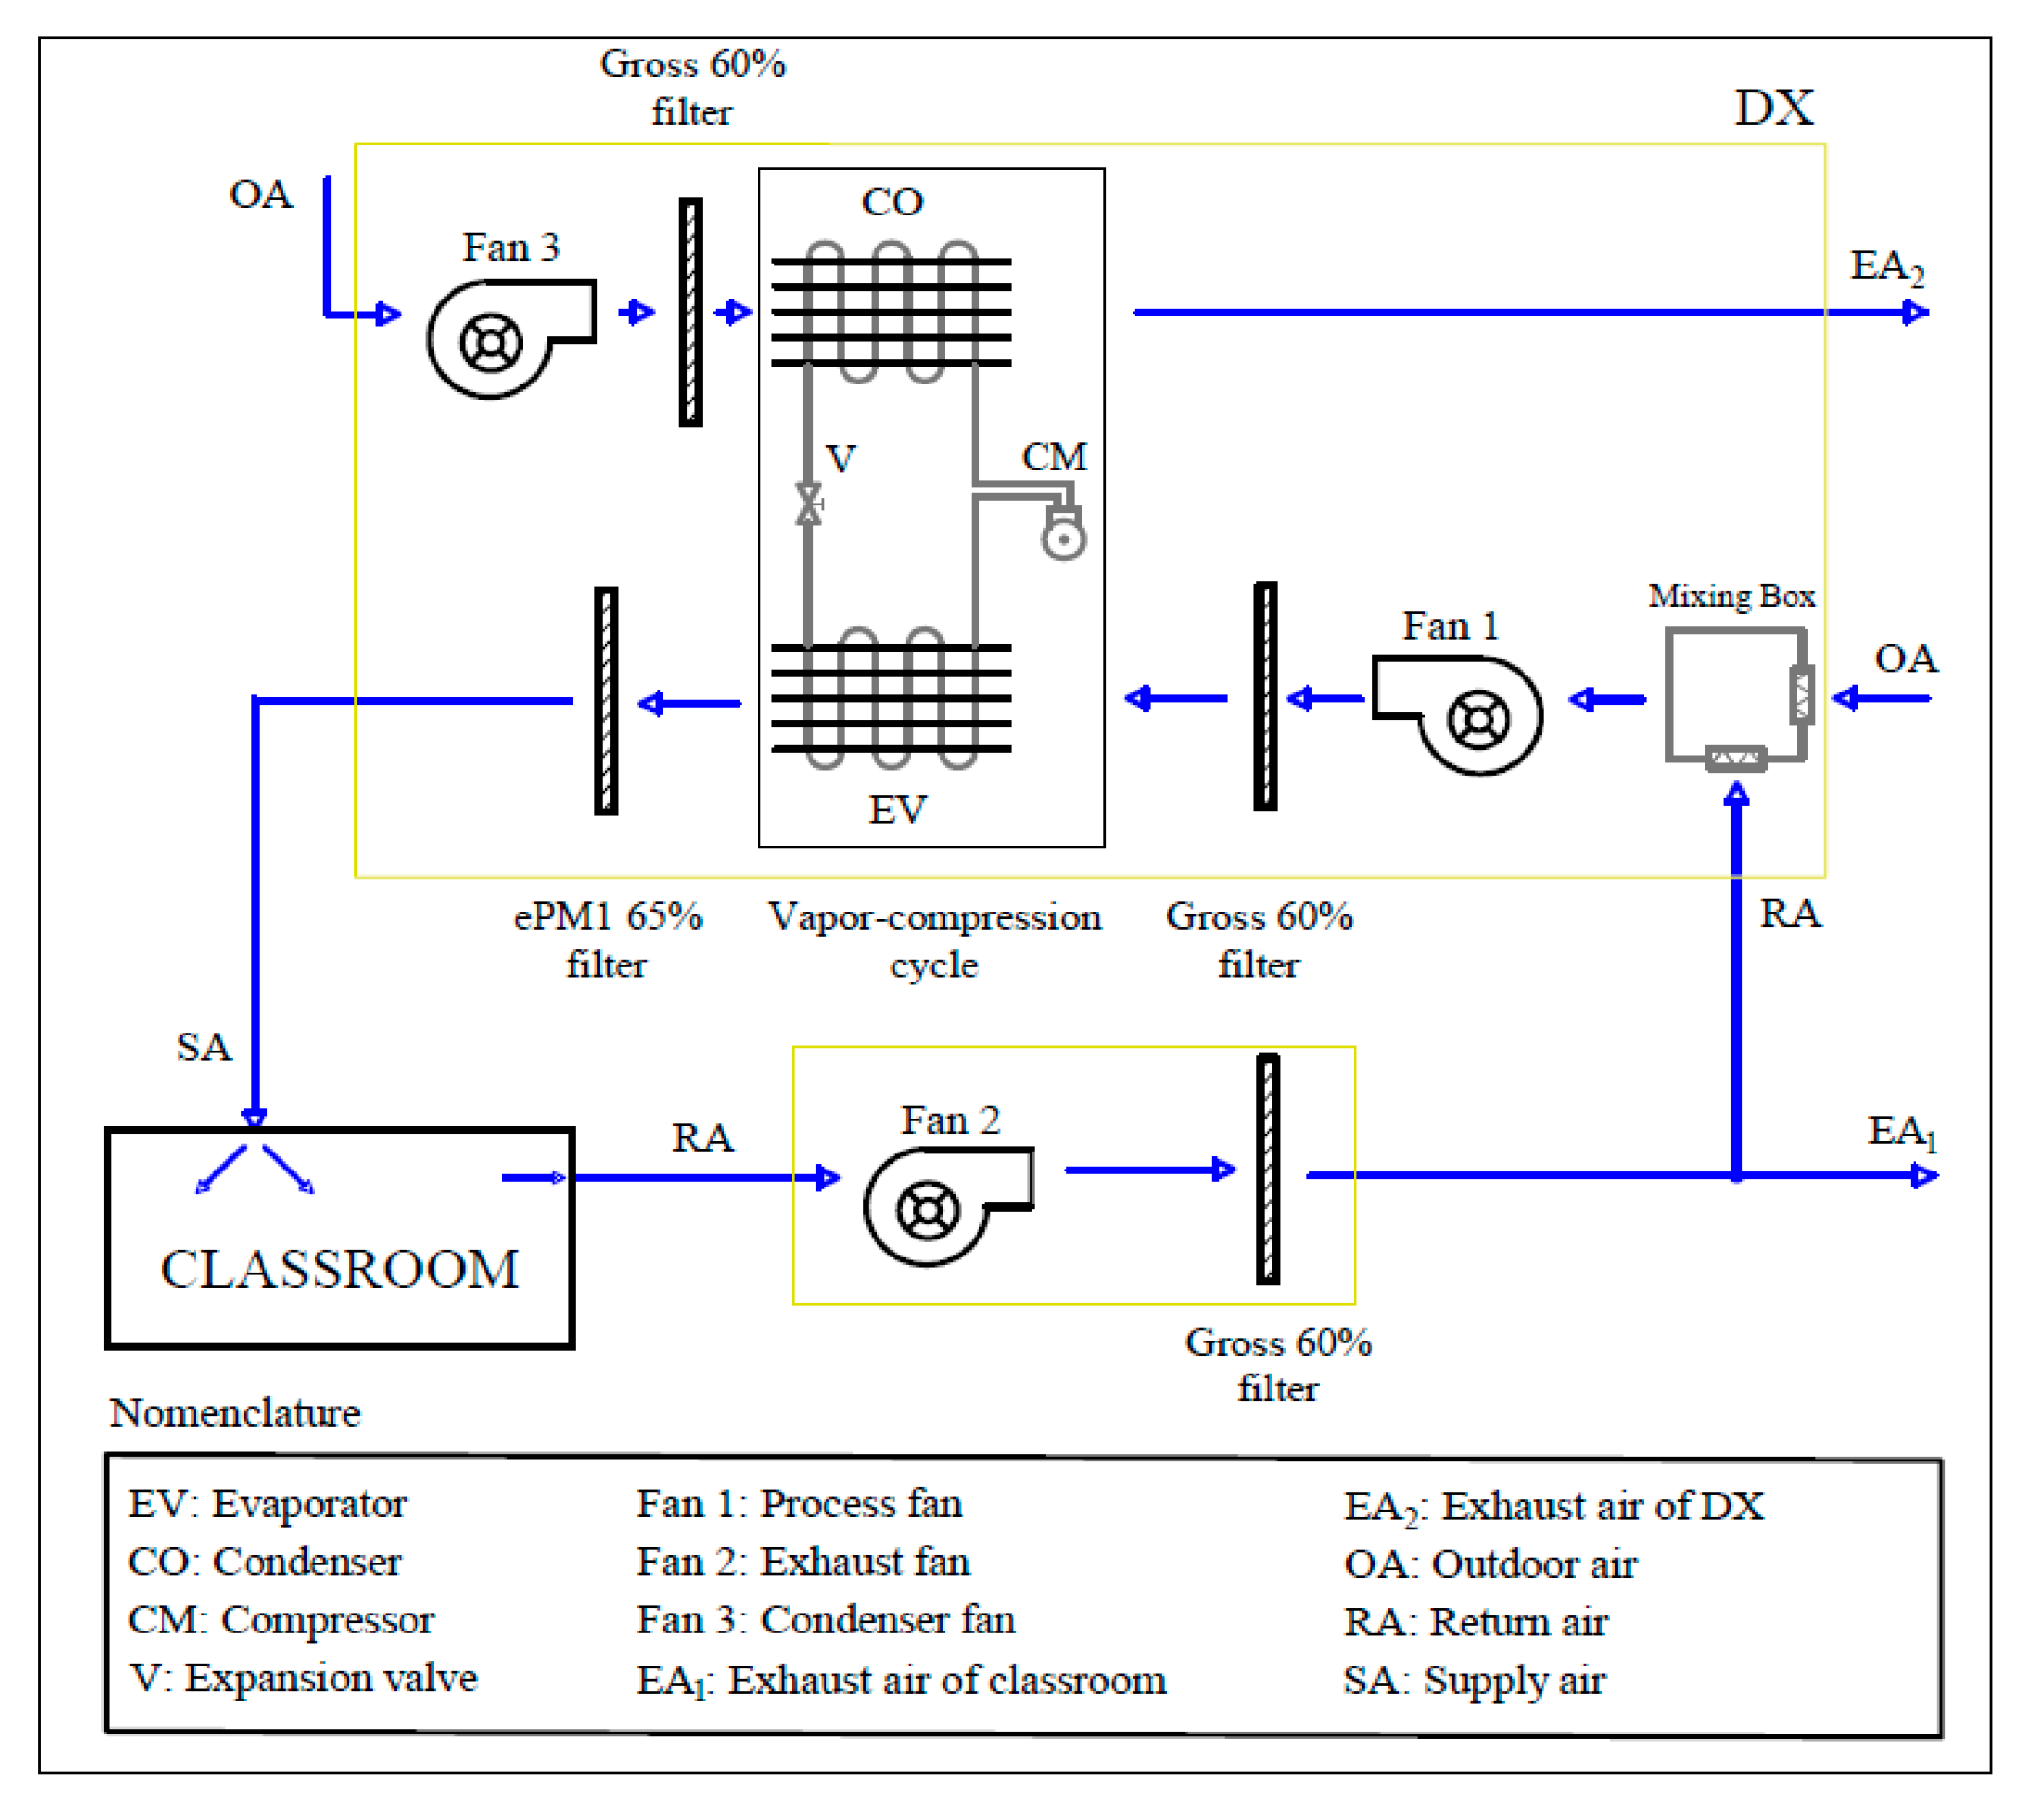
The main components of DX were an air-mixing box, MB and a direct expansion unit, where the condenser, CO and the evaporator, EV, were installed in a parallel arrangement. A schematic of the DX system is represented in Figure 1.
Figure 1.
Schematic of the DX system.
The outdoor air flow and the return air flow were mixed in the air-mixing box. According to the ventilation rates values, see Table 1, the outdoor air flow required was 350 m3 h−1. The mixed air flow was cooled and dehumidified by EV, until the indoor temperature and the set-point temperature were equal.
Table 1.
Geometrical and thermal characteristics of the classroom.
In relation to the air treatment of the DX system, the air mixture of RA and OA passed through the evaporator, reducing the air temperature and the air humidity. The condenser of vapour compression cycle dissipated the heat absorbed in the evaporator and the energy of the compressor, see Figure 1.
- Operation modes of DX
The control system of DX was based on indoor air temperature and indoor air CO2 concentration. The indoor air humidity ratio was no controlled. The DX system operation modes are explained below. The first loop was an indoor temperature control and the second loop was an CO2 concentration control.
- 1.
- Temperature control
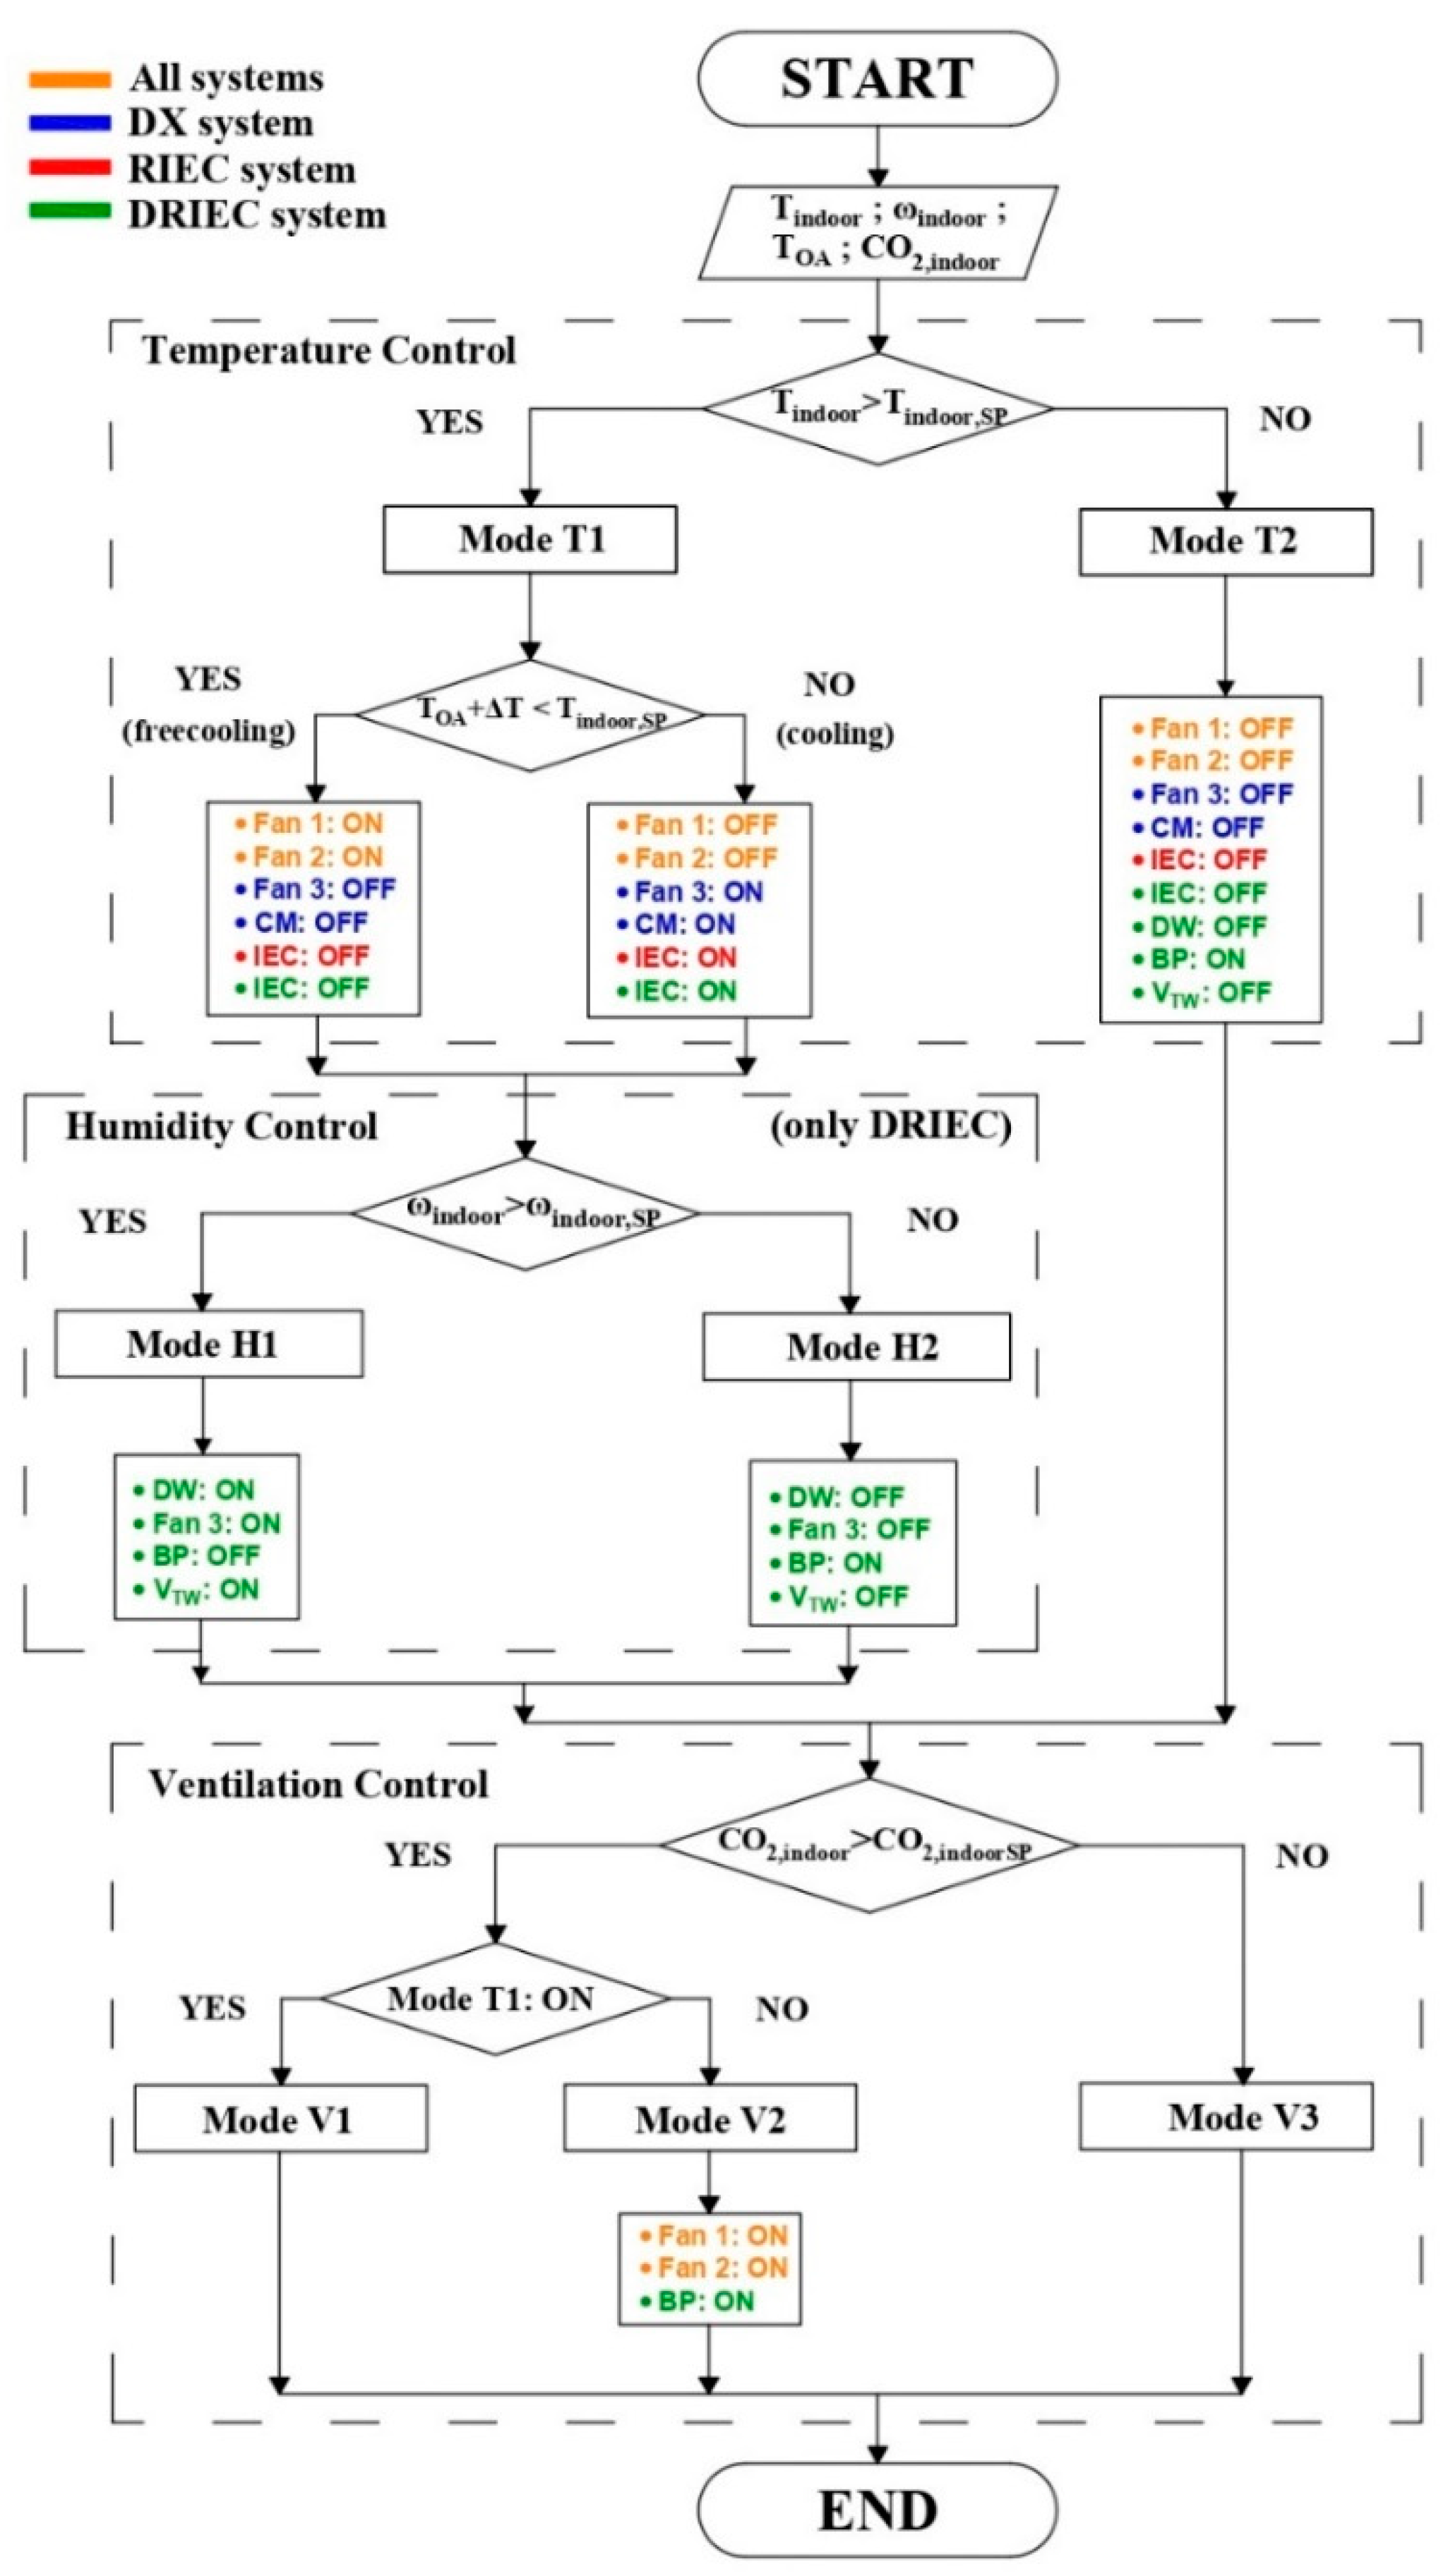
The temperature loop controlled the indoor air temperature, Tindoor. This loop had two specific modes of operation: “Mode T1” and “Mode T2”. Mode T1 was activated when the indoor temperature was higher than the set-point indoor temperature. Free cooling mode was used when the outdoor temperature plus an increase in temperature of 2 °C, ΔT, was less than the indoor temperature set-point. The refrigeration vapour compression unit was activated, cooling mode, when the free cooling conditions were not met. Mode T2, no temperature control, was activated when the indoor temperature was lower than the indoor temperature set-point.
- 2.
- Ventilation control
The ventilation control loop was based on the indoor CO2 concentration. This loop had three specific modes of operation: “Mode V1”, “Mode V2” and “Mode V3”–. Mode V2 was activated when the indoor CO2 concentration was higher than the indoor CO2 concentration set-point and Mode T1 was no used. Mode V1 was activated when Mode T1 was activated. For Mode T1, the fans F1 and F2 were already running, so it was not necessary any process. Mode V3, no ventilation control, was activated when to the indoor CO2 concentration was lower than the indoor CO2 concentration set-point.
2.1.2. RIEC System
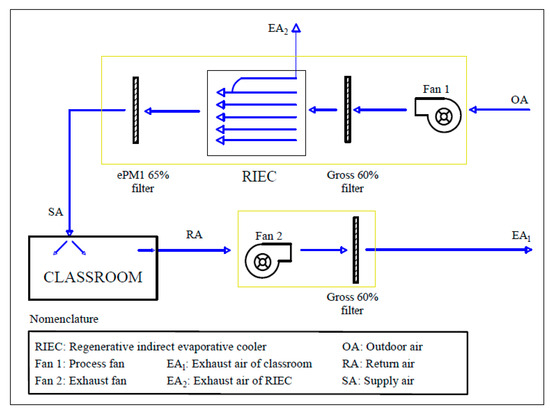
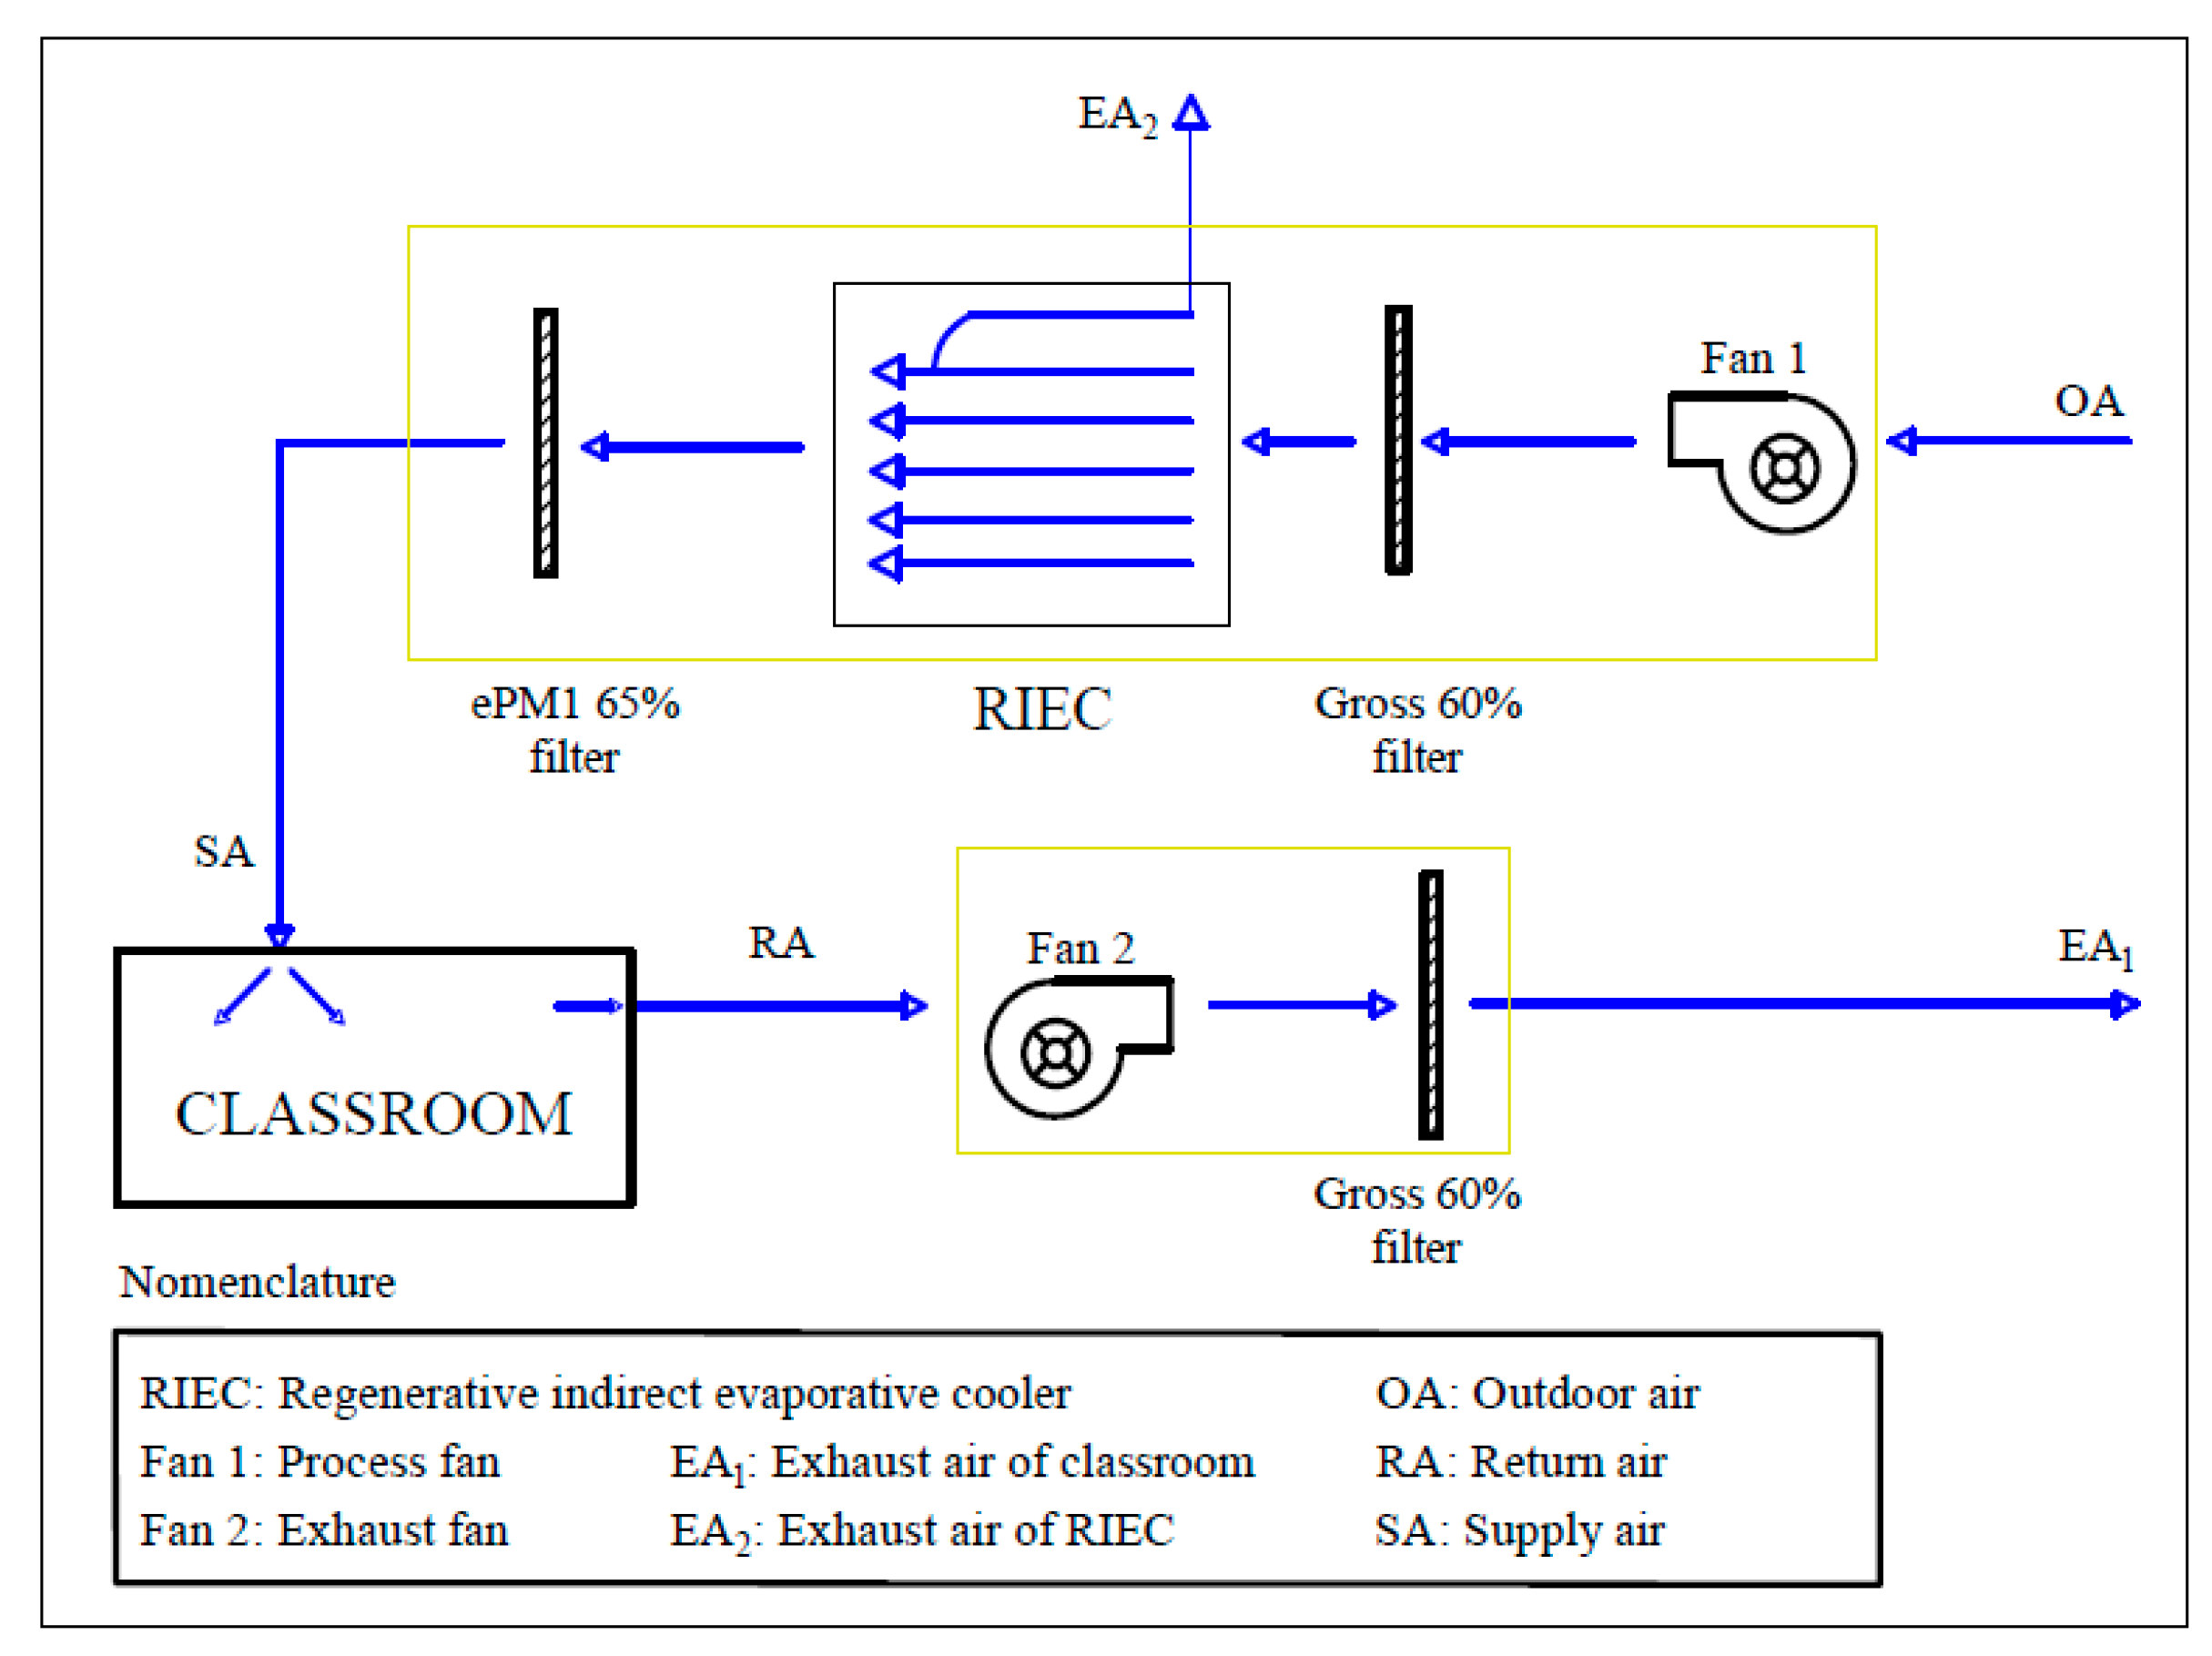
The RIEC system was mainly composed by a regenerative indirect evaporative cooler equipment, which worked with a single inlet air stream (100% outdoor air). This inlet air stream was divided into two air streams: exhaust air, EA and supply air, SA. A schematic of this air-cooling system is represented in Figure 2.
Figure 2.
Schematic of the RIEC system.
Regarding the daily thermal behaviour of the RIEC system, the OA passed through the IEC being cooled. The process air flow, without modifying its humidity, was supplied to the classroom. The EA was humidified and was exhausted outside, as shown in Figure 2.
- Operation modes of RIEC
The control system of RIEC was based on adjusting the indoor air temperature and indoor air CO2 concentration. This system did not control humidity ratio. Two main control loops were considered, which are described below.
- 1.
- Temperature control
The air temperature control strategy for RIEC was equal to that of DX. However, in this case, in Mode T1, the IEC was activated. For RIEC, the control system proportionally modulated the fans to reach the setpoint air temperature.
- 2.
- Ventilation control
The ventilation control strategy for RIEC was also equal to that of DX. The control system also proportionally modulated the fans to reach the setpoint CO2 concentration.
2.1.3. DRIEC System
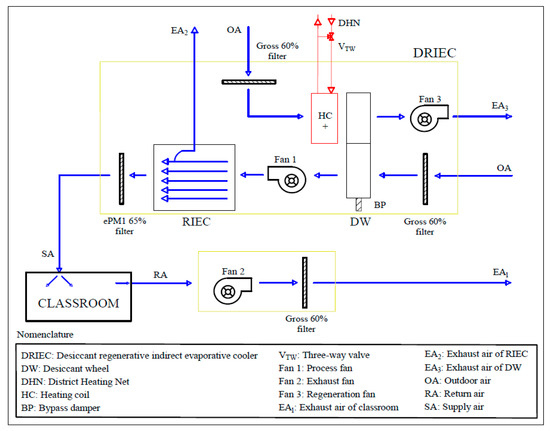
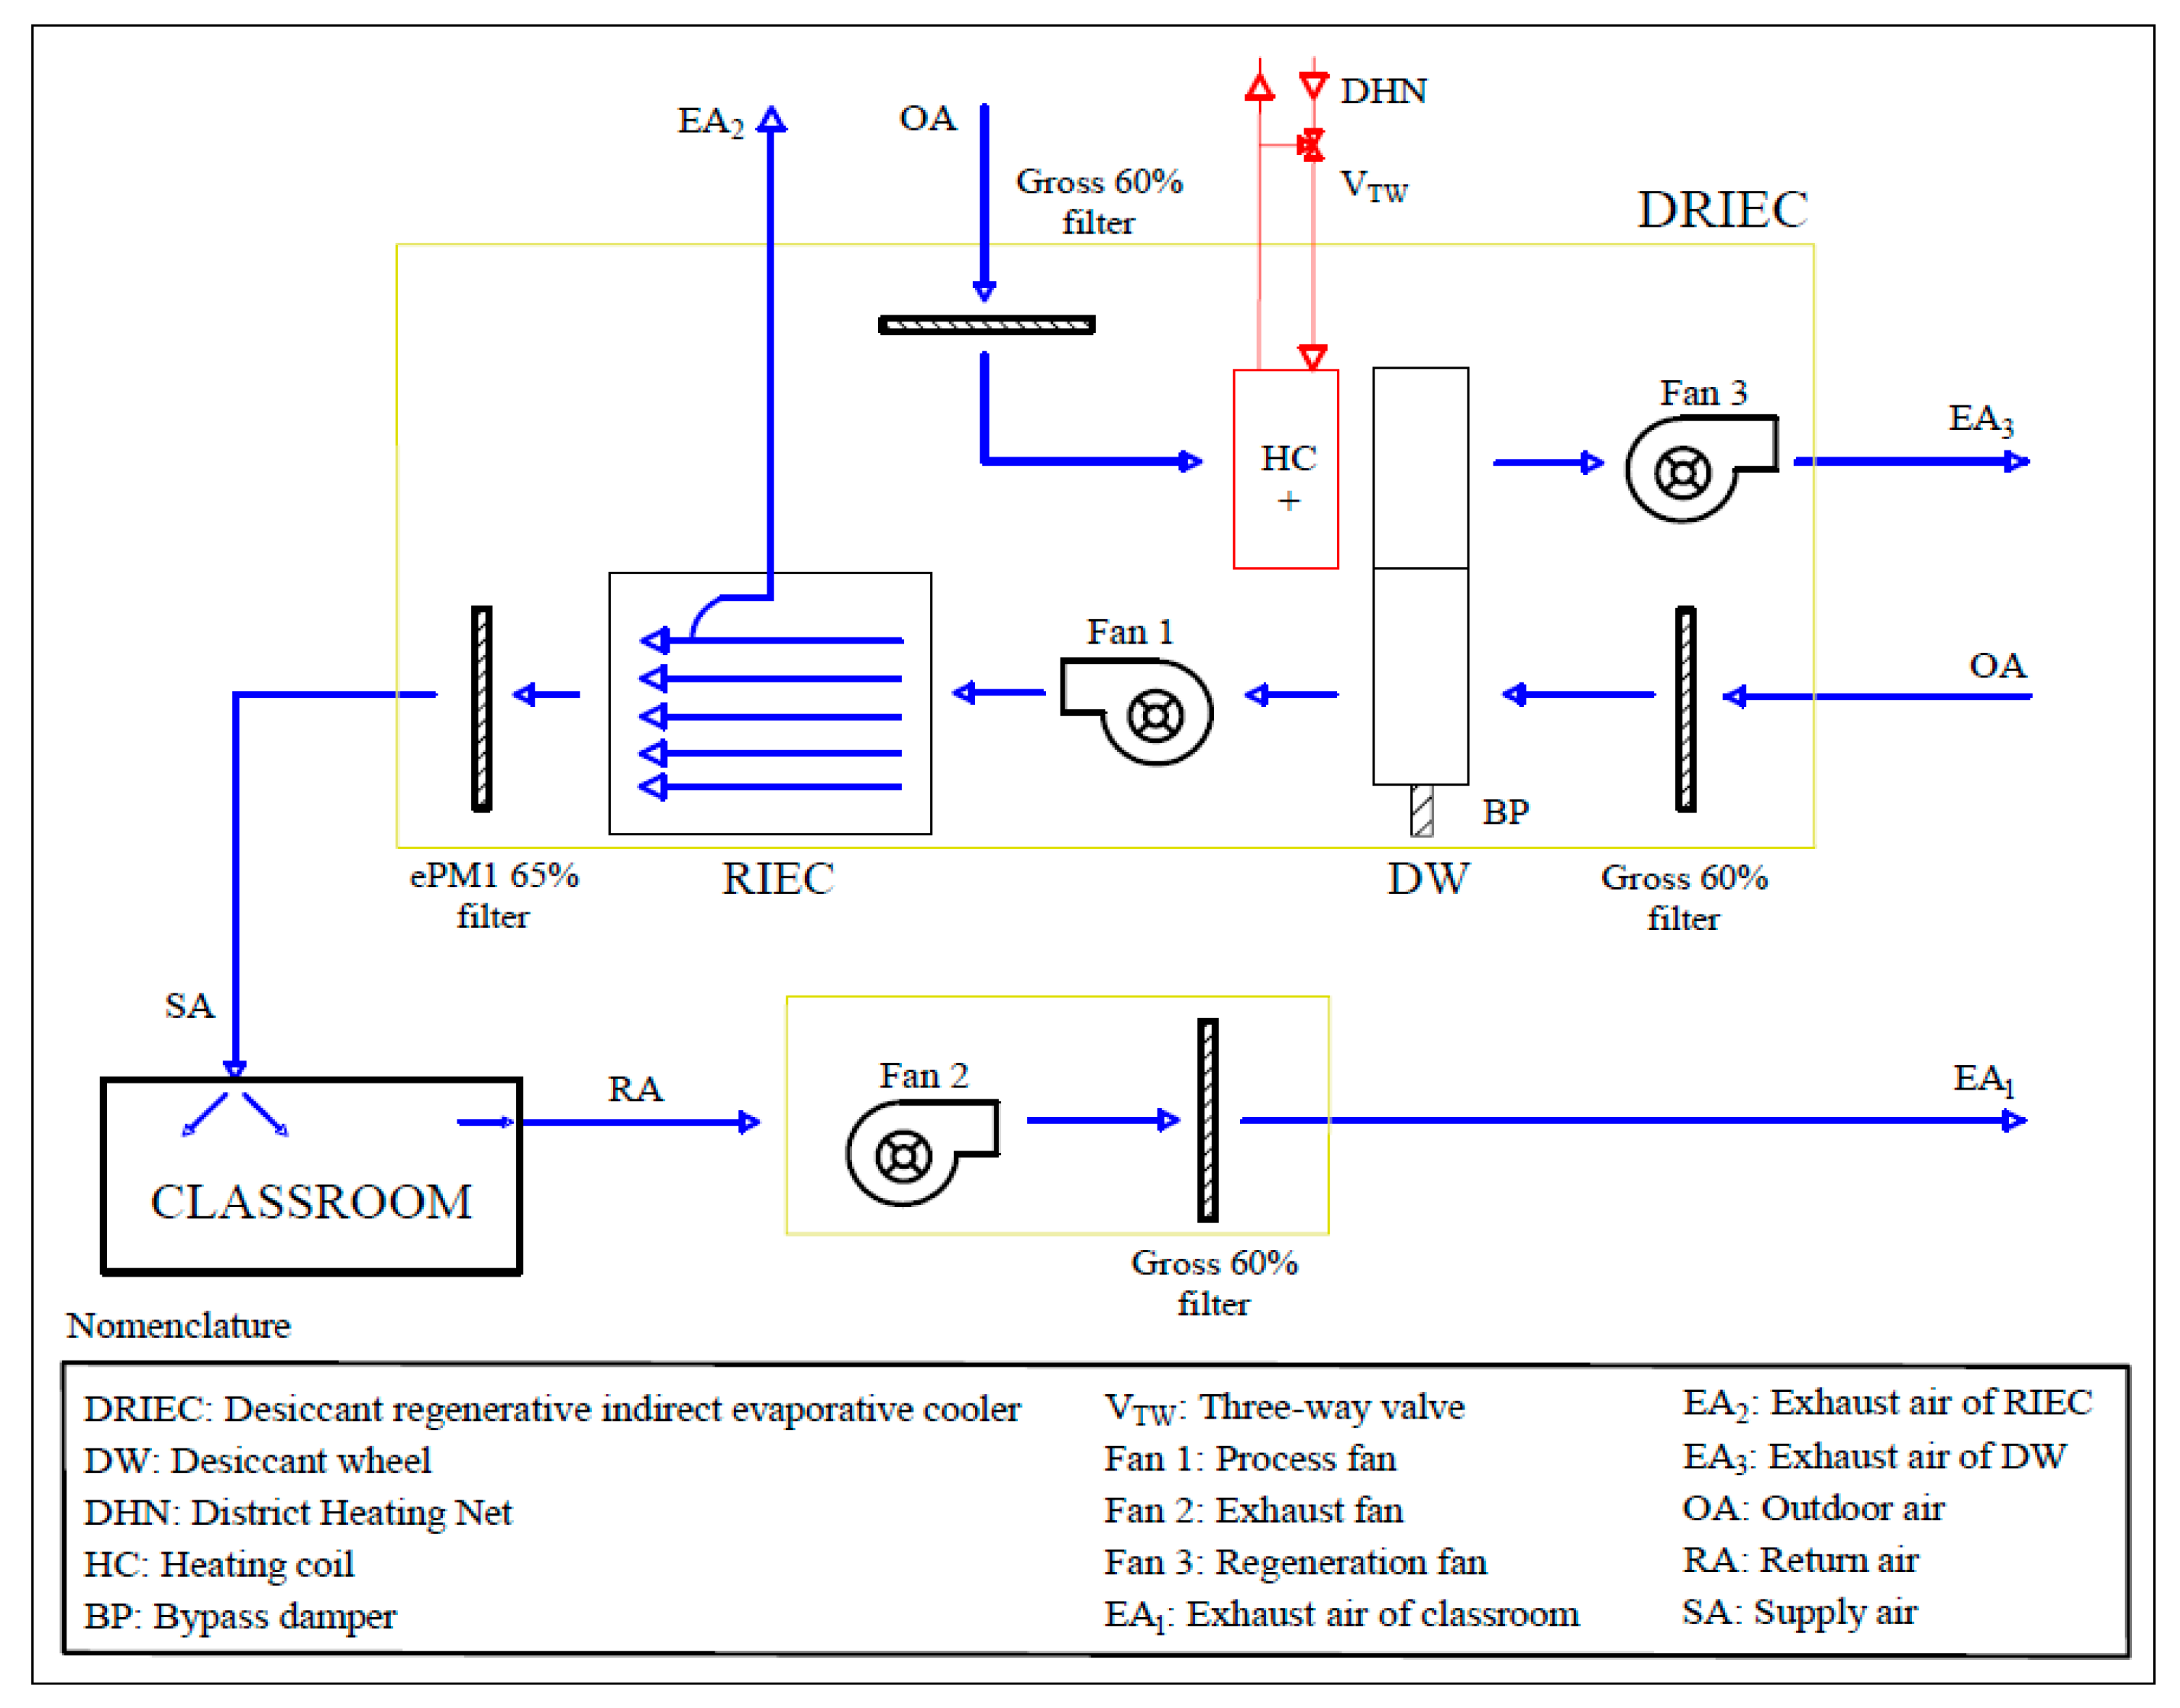
The DRIEC system was mainly composed of a desiccant wheel and a heating coil to dehumidify air and a regenerative indirect evaporative cooler to cool this stream. A schematic of this air-cooling system is represented in Figure 3.
Figure 3.
Schematic of the DRIEC system.
DRIEC independently controlled the sensible and latent gains of the classroom. A desiccant wheel was used to control indoor air humidity ratio and a regenerative indirect evaporative cooler to control indoor air temperature.
In the DRIEC system, the 100% of the outdoor air was treated by the DW, to dehumidify the air stream and by the IEC, to cool this stream, before it being supplied to the class. A heating coil fed with water from a district hot water network, at 80 °C, activated this DW. Several gross and fine filters were used to filter the OA and SA streams, respectively (see Figure 3).
- Operation modes of DRIEC
The control system of DRIEC was based on adjusting the indoor air humidity ratio, indoor air temperature and indoor CO2 concentration. The operating modes used had as priority to achieve thermal comfort conditions, reducing energy consumption.
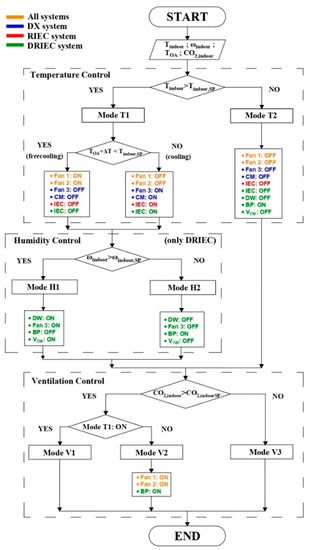
Three main control loops were considered for DRIEC. The first loop controlled the indoor temperature, the second loop controlled the indoor humidity ratio and the third loop controlled the CO2 concentration. The temperature and ventilation controls were equal to that of the RIEC system. The air humidity control loop is described below. The control logic of each studied air-cooling system is shown in Figure 4.
Figure 4.
Air-cooling systems control logic diagram.
- 1.
- Humidity control
The humidity loop controlled the indoor humidity ratio, ωindoor. This loop had two specific modes: “Mode H1” and “Mode H2”. The first one was activated when the indoor humidity ratio was higher than the indoor humidity ratio set-point. In Mode H1, Fan 3, DW and VTW were activated. Mode H2 was activated when it was not necessary to dehumidify, due to the indoor humidity ratio was less than the indoor humidity ratio set-point. The outdoor air passed through a bypass damper, BP, when Mode H2 was activated.
2.2. Building Model
Annual energy simulations were performed considering that the three air-cooling systems served a standard classroom. Loads due to outside temperature, solar loads and internal loads were considered for the energy simulations. The software used to perform these simulations was the Transient System Simulation Tool, TRNSYS17 [34]. The geometrical and thermal characteristics of the classroom are shown in Table 1.
The classroom had two exterior walls with South and East orientations and two interior walls with North and West orientations. Three windows of 1 m2 were considered in the East orientation exterior wall. The main characteristics of this type of window were that it was clear simple glass with thickness of 6 mm and 15% frame. A constant air change of infiltration of 0.996 h−1 was considered. The floor of the room was connected with another classroom and the roof of the classroom was an exterior component. The daily number of the people in the room was constantly 20 during occupancy period. Heat gains from lighting were not considered since the analysis period was during the day and very low lighting loads were assumed. The classroom had a daily schedule from 9:00 a.m. to 15:00 p.m. during the whole year. There was no artificial equipment in this classroom. The number of occupation hours in air cooling mode in each climate zone was different. In the present work, the indoor air temperature was set at 23.5 °C, within the range indicated in Table 1.4.1.1 entitled “Indoor design conditions” of the regulation of thermal installations buildings document [35] and the favorable conditions of thermal comfort obtained. The indoor relative humidity of 55% was the result of setting the indoor humidity ratio at 10 g/kg, within the range indicated in that table.
2.3. Components Modelling
Three air-cooling systems were proposed to maintain the set-point indoor conditions in a standard classroom in different climate zones. RIEC and DRIEC handled 100% outdoor air, while the conventional DX system handled 9% outdoor air. Mathematical models of these systems were obtained from experimental data. The energy simulations of the building and the air-cooling systems were carried out in TRNSYS software [34] for four climatic conditions, using time steps of 2.4 min.
The models of the refrigeration vapour compression unit, the regenerative indirect evaporative cooler and the desiccant wheel were fitted by second order polynomial equations, see Equation (1).
where X are input variables; bi, bii and bij are the estimated coefficients of linear terms, quadratic terms and the second order terms and is the estimated variable.
2.3.1. Refrigeration Vapour Compression Unit Model
The considered DX unit was sized to serve air-conditioning a standard classroom. The main characteristics of the vapour compression unit are shown in Table 2. This unit was modelled from data of the manufacturer [36]. The response variables and the input parameters were expressed by Equation (1).
Table 2.
Characteristics of the DX system.
The input parameters of the DX unit model were the dry bulb outdoor temperature, the wet bulb outdoor temperature and the air flow rate ratio; TOA, Twb,OA, = , respectively, see Table 3. The response variables were the nominal sensible cooling capacity, scooling,N, the nominal latent cooling capacity, lcooling,N and the nominal absorbed capacity, abs,N.
Table 3.
Estimated coefficients of the vapor compression unit model.
2.3.2. Regenerative Indirect Evaporative Cooler Model
The thermal behavior of RIEC was modelled from manufacturer’s data [37]. This RIEC model was developed with the statistical technique of design of experiments. The response variables and the input parameters were expressed by Equation (1). The main characteristics of the RIEC system are summarized in Table 4.
Table 4.
Characteristics of the RIEC system.
The response variable of the RIEC model was the supply air temperature, TSA, from the outdoor air dry bulb temperature, the volumetric air flow rate and the outdoor air wet bulb temperature; TOA, and Twb,OA, respectively, as shown in Table 5.
Table 5.
Estimated parameters of the RIEC model.
2.3.3. Desiccant Wheel Model
DW was modelled from the available data of the manufacturer [38]. The DW model was also developed with the statistical technique of design of experiments and its main characteristics are shown in Table 6.
Table 6.
Characteristics of the desiccant wheel.
This model was fitted to obtain the outlet process temperature, Tp,o, the outlet regeneration temperature, Tr,o, the outlet process humidity ratio, ωp,o and the outlet regeneration humidity ratio, ωr,o, in the DW. The input parameters were the outdoor dry bulb temperature, the inlet regeneration air temperature the outdoor air humidity ratio and the air flow rate; TOA, Tr,i, ωOA and , respectively. The relationship between the response variable and input parameters was examined using linear and second-order polynomial equations, see Equation (1). The estimated coefficients of this model are summarized in Table 7.
Table 7.
Estimated coefficients of the DW model.
2.3.4. Heating Coil Model
HC of the DRIEC system was integrated into the TRNSYS software using “Type 753a” [34]. It was fed with water from a district heating network, at a constant temperature of 80 °C. The heating power of the HC was obtained by using Equation (2).
2.3.5. Filter Model
The pressure drop of the filters was set constant. According to outdoor and indoor environmental conditions, several air filters with ePM1 65% and Gross 60% protection were considered.
2.3.6. Fan Model
The fans were designed to maintain the air flow rate according to the calculated pressure drop. Pressure drops were considered, as shown in Table 8. The efficiency of all fans was 50%.
Table 8.
Pressure drops considered in fan model.
The DX system was composed of three fans (process, condenser and exhaust), the RIEC system of two fans (process and exhaust) and the DRIEC system of three fans (process, regeneration and exhaust). The input variables were the volumetric air flow rate, , the pressure drop, ΔP and the efficiency, ε, of each fan. The response variable was the electric power consumption of each fan, , which was calculated by Equation (3).
2.4. Climate Zones
The seasonal energy behavior analysis of the three air-cooling systems for a standard classroom was evaluated for four climate zones [39]. Different values of cooling degrees-day and heating degrees-day were considered in each climate zones. Typical climatic zones in the Mediterranean area were selected from hot (dry) to mixed (humid), according to thermal criteria shown in Table 9. In addition, the cooling period was defined as the number of hours in which the outside temperature exceeded the base temperature of 18 °C. This premise was considered during the schedule school for each climate zone.
Table 9.
Selected climate zones.
The three air-cooling systems were simulated for the representative cities of the hot-dry, warm-humid, warm-dry and mixed-humid climate zones. The energy simulations were carried out using the Meteonorm software database [40]. The average values of climate data of the four climate zones are shown in Table 10.
Table 10.
Average OA temperature and average OA humidity ratio in each studied climate zone.
2.5. Systems Evaluation
The three air cooling systems were evaluated in terms of thermal comfort, air quality and energy consumption. The evaluation methods for these criteria are described below.
2.5.1. Thermal Comfort
The thermal comfort index was evaluated according to predicted percentage dissatisfied, PPD and predicted mean vote, PMV. The influence of six thermal parameters were considered: air temperature, activity, clothing, air velocity, mean radiant temperature and humidity. The different parameters values are shown in Table 1. PMV value, see Equations (4)–(7) and PPD value (see Equation (8)) were calculated by the TRNSYS software [34] according to Standard UNE-EN ISO 7730:2006 [41].
PMV = [0.303·exp(−0.036·M) + 0.028]·{(M − W) − 3.05·10−3·[5733 − 6.99·(M − W) − pa] − 0.42·[(M − W) − 58.15]
− 1.7·10−5·M·(5867 − pa) − 0.0014·M·(34 − ta) − 3.96·10−8·fcl·[(tcl + 273)4 − (tr + 273)4] − fcl·hc·(tcl − ta)}
− 1.7·10−5·M·(5867 − pa) − 0.0014·M·(34 − ta) − 3.96·10−8·fcl·[(tcl + 273)4 − (tr + 273)4] − fcl·hc·(tcl − ta)}
tcl = 35.7 − 0.028·(M − W) − Icl·{3.96·10−8·fcl·[(tcl + 273)4 − (tr + 273)4] + fcl·hc·(tcl − ta)}
fcl = 1.00 + 1.290·Icl for Icl ≤ 0.078 m2·K/W
1.05 + 0.645·Icl for Icl > 0.078 m2·K/W
1.05 + 0.645·Icl for Icl > 0.078 m2·K/W
PPD = 100 − 95·exp(−0.03353·PMV4 − 0.2179·PMV2)
Four categories of thermal comfort were differentiated according to Standard UNE-CEN/TR 16798-2:2019 [26]: (i) category I for PPD values less than 6%; (ii) category II for PPD values less than 10%; (iii) category III for PPD values less than 15%; (iv) category IV for PPD values less than 25%. Table 11 is referred to Table B.1 of Standard UNE 16798-2 [26].
Table 11.
Thermal comfort categories by Standard UNE 16798-2:2019.
This Standard proposed five methods for long term evaluation of the general thermal comfort conditions. In this paper, the method C called “PPD weighted criteria” was used to calculate the percentage of hours of the considered period (see Table 9) in each category. The weighting factor calculated, wfTC, was the ratio between the current PPD and the PPD limit according to thermal comfort category, see Equation (9).
where PMV was between PMVlimit,lower and PMVlimit,upper. PPDactualPMV is the PPD corresponding to the actual PMV and PPDPMVlimit is the PPD corresponding to PMVlimit.
wfTC = PPDactualPMV/PPDPMVlimit
The product of this weighing factor and the step time was summed for the cooling period defined in each climate zone. Regarding this thermal comfort index, the favorable comfort conditions were assumed when the indoor conditions were within categories I and II.
2.5.2. Air Quality
An air quality indicator was determined analogously to the thermal comfort evaluation method. The outdoor CO2 concentration considered was 420 ppm constantly. Four categories of air quality corresponding to the difference between indoor and outdoor concentration, ΔCO2, were considered: (i) category I for ΔCO2 values less than 550 ppm; (ii) category II for ΔCO2 values less than 800 ppm; (iii) category III for ΔCO2 values less than 1350 ppm; (iv) category IV for ΔCO2 values greater than 1350 ppm. The following Table 12 is referred to Table B.12 of Standard EN 16798-2:2019 [26].
Table 12.
Air quality categories by Standard EN 16798-2:2019.
For this case, the weighting factor values of air quality, wfAQ, for each category were obtained with the ΔCO2 value in real time and the limit ΔCO2 value of each category, see Equation (10).
wfAQ = ΔCO2,actual/ΔCO2,limit
The sum of the product of this factor and the step time was performed to each cooling period of the climate zones. The categories I and II were considered favorable, as well as for the favorable thermal comfort conditions.
2.5.3. Energy Consumption and CO2 Emission
The energy consumption of the air-cooling systems was obtained as the sum of the electric consumption of each HVAC element, i.e., compressor, fans and pumps. The time period used to integrate this consumption was the cooling period, see Table 9.
EEC = ⅀ Electric Energy Consumptionelement × Time step/Sclassroom
In Equation (11), the energy-consuming elements of the DX system were the compressor, the exhaust fan, the condenser fan and the process fan. Regarding the RIEC and DRIEC systems, the elements that consume energy were the pumps, the exhaust fan and the process fan. The regeneration fan was also considered for the DRIEC system.
Regarding environmental impact, CO2 emissions emitted by each air-cooling system during the cooling period in each climate zone were calculated. The emission factor between final electricity consumption and CO2 emissions were different for each country, as shown in Table 13. The CO2 emission factor for Spain was taken from the technical building code, CTE 2019 [42]. The CO2 emission factors for the rest of the countries were taken from the 2020 carbon footprint document [43].
Table 13.
CO2 emission factor for each climate zone.
The CO2 emissions results [kgCO2 m−2 year−1], for each system and each climate zone throughout cooling period, were calculated as the product of the total energy consumption [kWh m−2 year−1] and the respective CO2 emission factor [kgCO2 kWh−1].
3. Results and Analysis
Daily and annual analysis were carried out for the three air-cooling systems. The daily analysis was performed for the climate zone of Lampedusa. Two summer days were selected: a typical summer day and a severe summer day. Then, the influence of climatic severity in the thermal comfort, air quality and energy consumption criteria were studied to understand the annual results in each climate zone.
3.1. Thermal Comfort
3.1.1. Daily Analysis of the Air-Cooling Systems
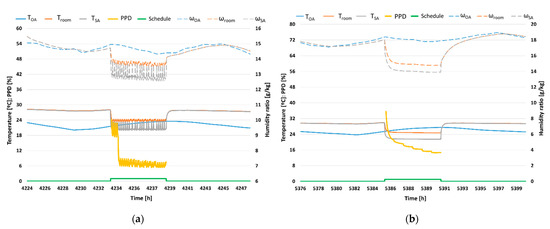
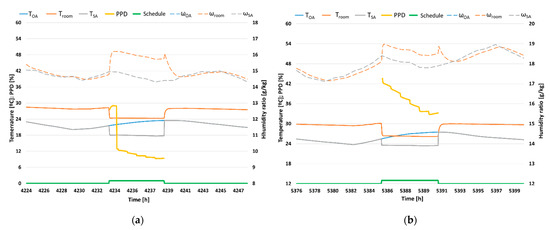
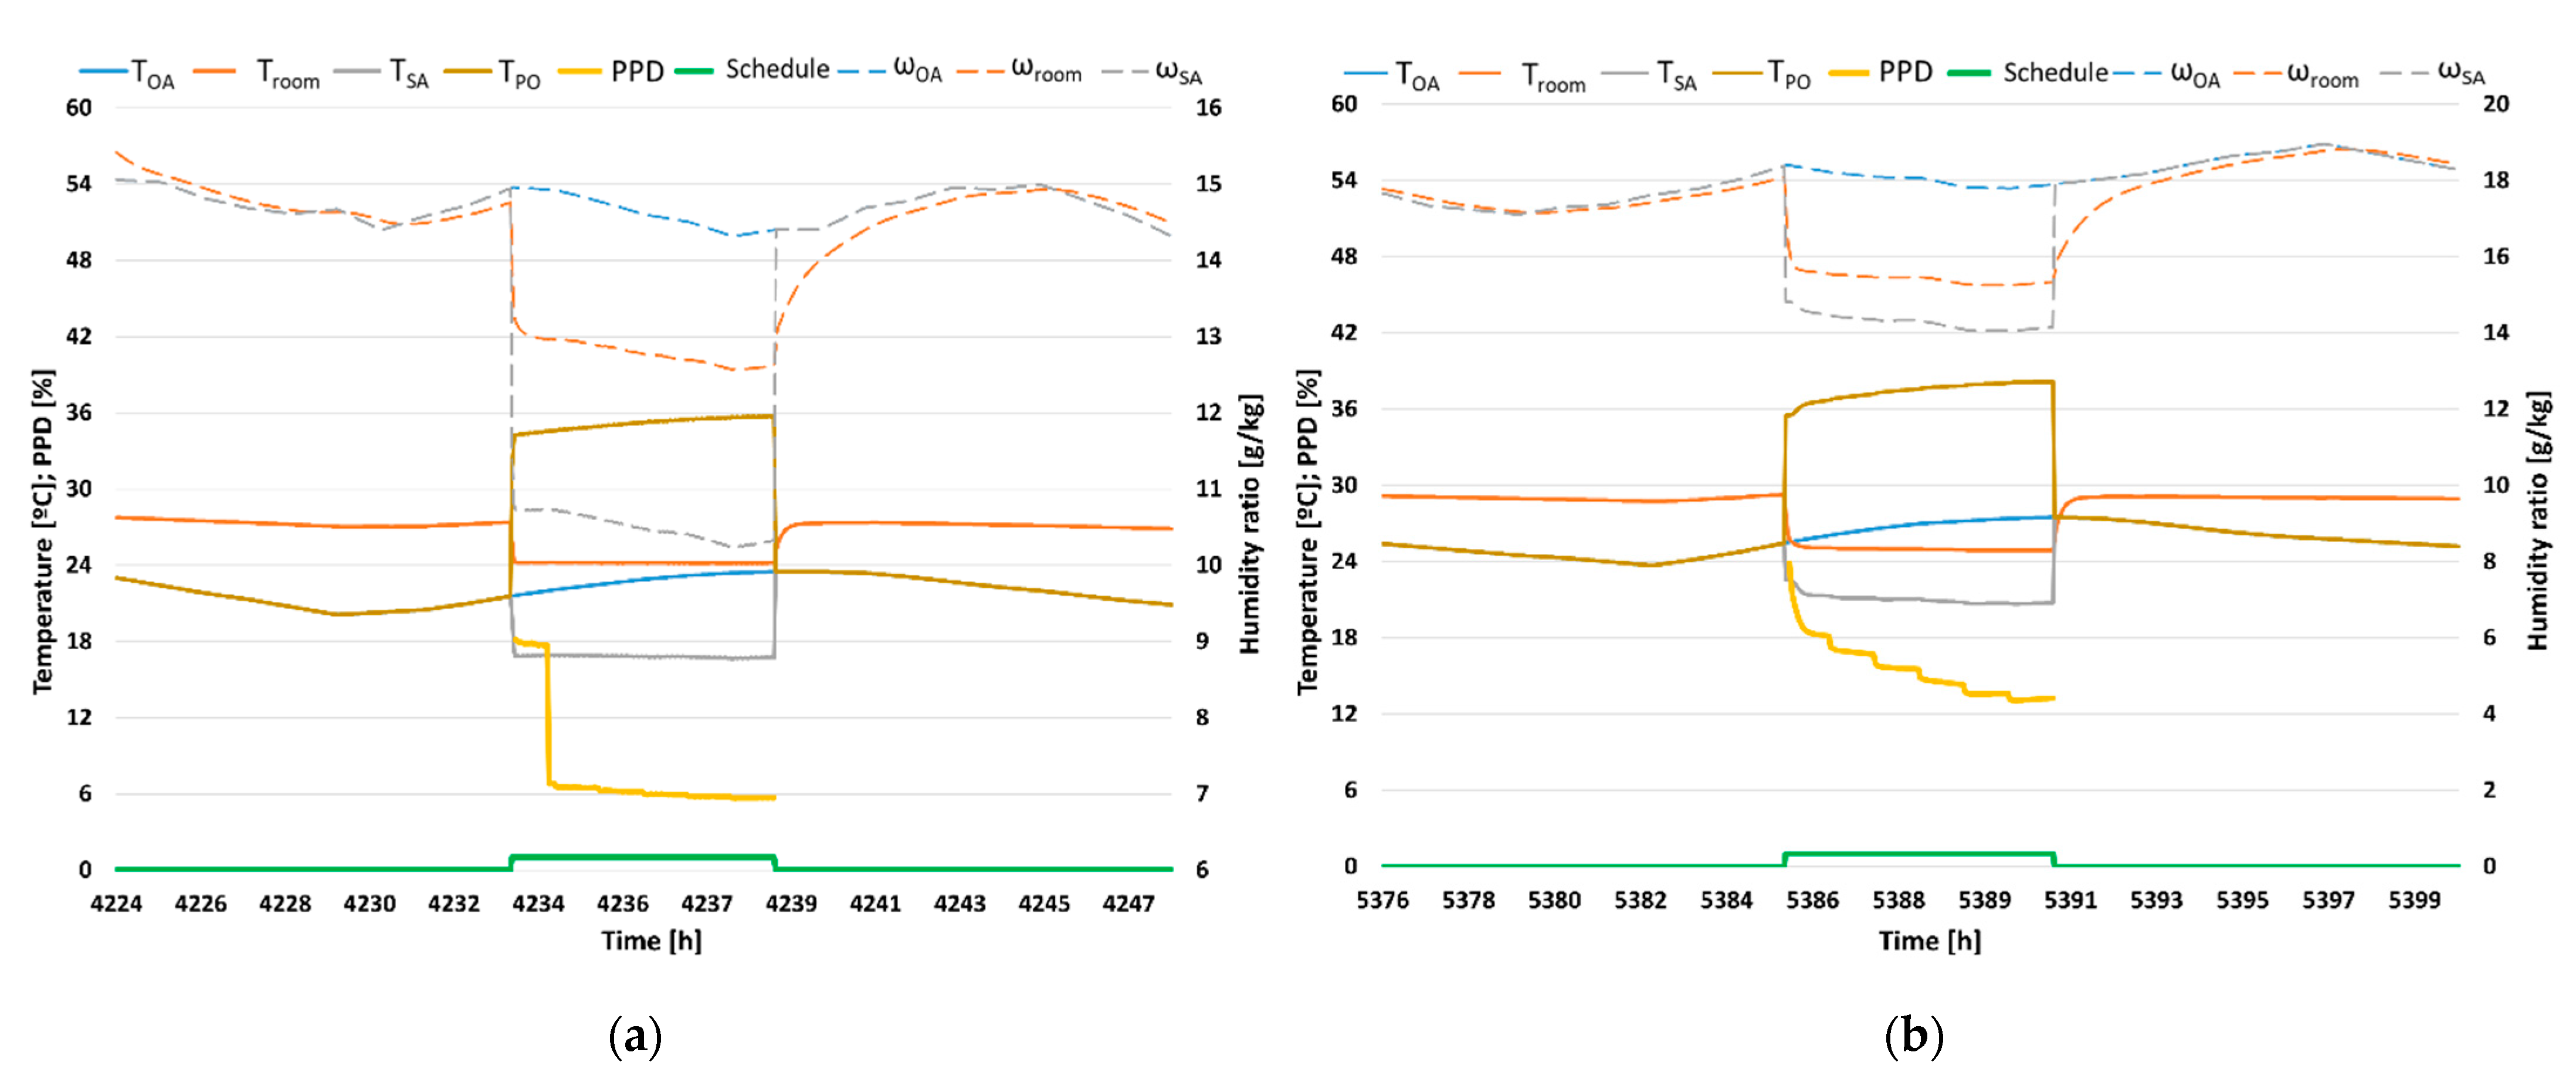
The daily results of the air-cooling systems DX, RIEC and DRIEC are represented in Figure 5, Figure 6 and Figure 7, respectively. For each air-cooling system, air temperatures, air humidity ratio and PPD values over typical and severe summer days are shown.
Figure 5.
Temperature and humidity. DX system in Lampedusa. (a) Typical summer day and (b) Severe summer day.
Figure 6.
Temperature and humidity. RIEC system in Lampedusa. (a) Typical summer day and (b) Severe summer day.
Figure 7.
Temperature and humidity. DRIEC system in Lampedusa. (a) Typical summer day and (b) Severe summer day.
In Figure 5a, it can be observed the outdoor conditions in a typical summer day in Lampedusa. TOA was between 21.5–23.5 °C but high values of ωOA between 14.3 g/kg and 15 g/kg were shown during the occupancy period. The indoor temperature values remained at 24 °C during the hours of occupation, with supply air temperature values between 20 °C and 24 °C. It is shown that indoor humidity ratio in was maintained at 14 g/kg, with a supply air humidity ratio that ranged between 13 g/kg and 14 g/kg. Favorable thermal comfort conditions were achieved during most of the hours of occupation. However, in the first 1–3 h, PPD values were in unfavorable category III due to the change from zero occupancy to full occupancy. In Figure 5b, a severe summer day in Lampedusa with values of TOA between 25.5–27.5 °C and ωOA values between 17.8–18.4 g/kg were shown during the occupancy period. In this case, higher PPD values between 15% and 35% were obtained when the DX system served the standard classroom.
Figure 6a,b show the same outdoor conditions as Figure 5a,b, respectively. The indoor air temperature remained at 24 °C during the hours of occupation, with a supply air temperature of 18 °C in the typical summer day case. In relation to the humidity ratio in the classroom, it was around 16 g/kg with a supply air humidity ratio that varied between 14.2–15 g/kg, equal to outdoor humidity ratio, due to the air humidity was no controlled, see Figure 6a. According to the severe summer day, a mean PPD value of 38% was obtained due to mainly the indoor humidity ratio exceeded 18 g/kg during the occupancy period (see Figure 6b).
The DRIEC system was also simulated to serve air to a standard classroom in Lampedusa climatic conditions, see Figure 7. For the typical summer day, it can be observed that the indoor temperature remained at 24 °C, with a supply air temperature that ranged between 16 °C and 17 °C, see Figure 7a. Regarding indoor humidity ratio, it was maintained between 12–13 g/kg, with a supply humidity ratio that ranged between 10.1–11 g/kg, since the air supply humidity was controlled. According to the severe summer day, the indoor air humidity was reduced to 14 g/kg while the ωOA value was 18 g/kg, due to the DW effect, see Figure 7b. This system achieved a mean PPD value of 16%, so the thermal comfort results of this system were more favorable than those of the RIEC system, due to humidity control.
3.1.2. Annual Thermal Comfort Results
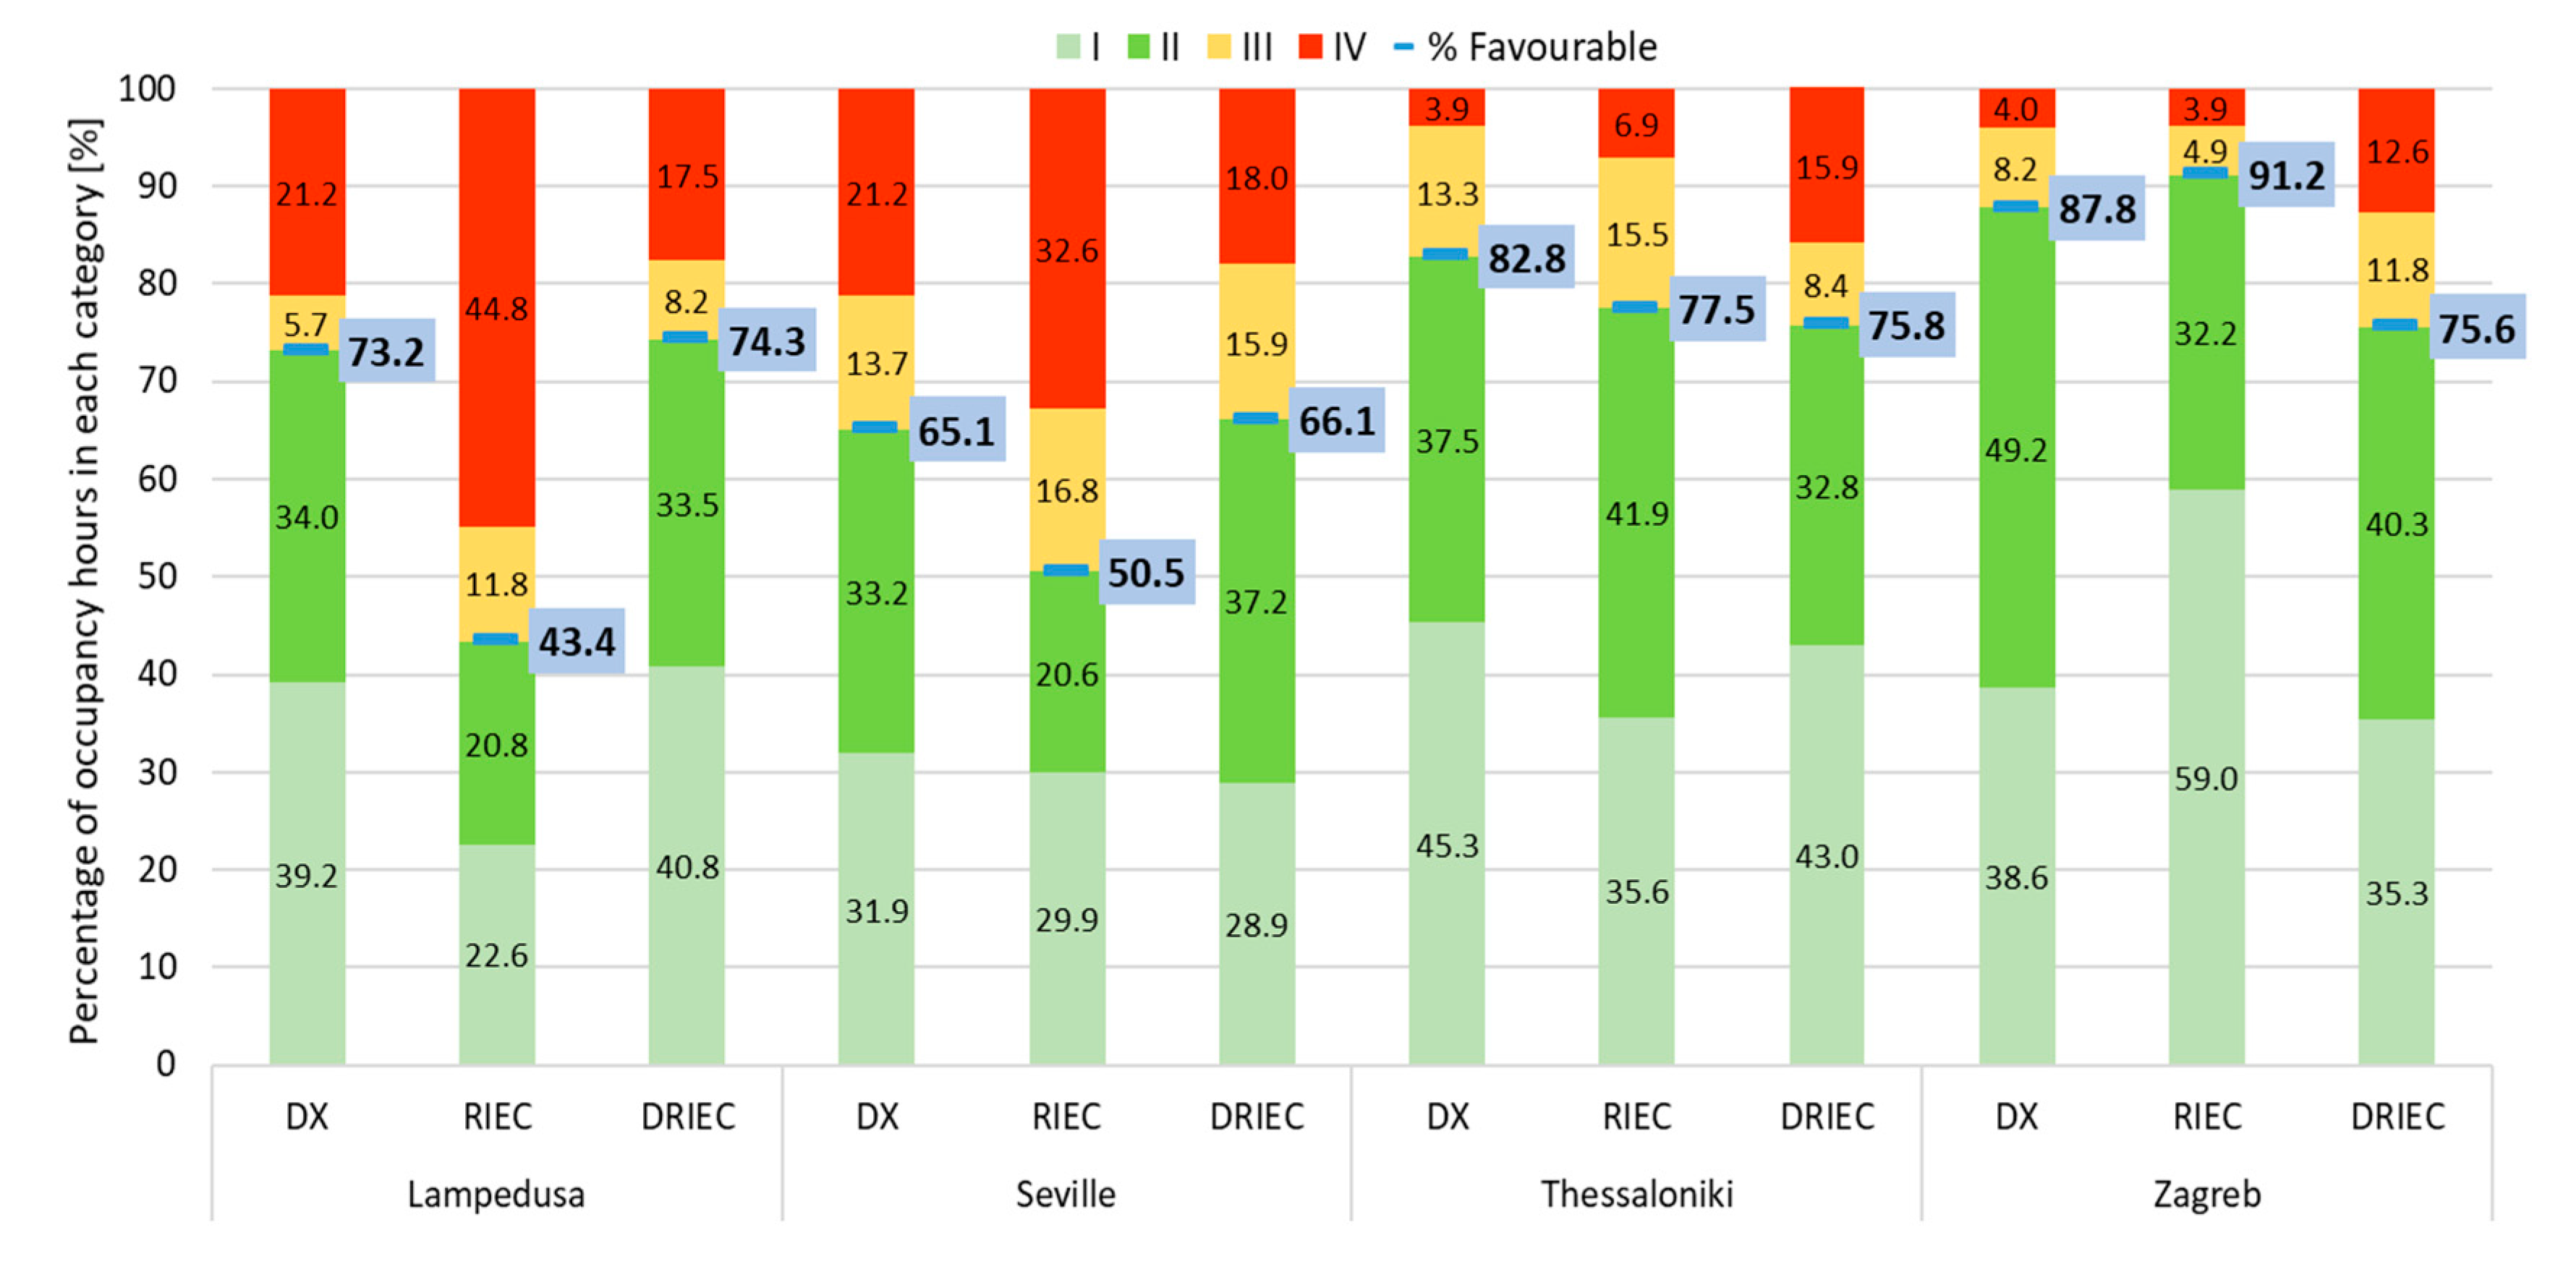
The annual thermal comfort results for the three air-cooling systems and the four climate zones selected are shown in Figure 8. The bars show the percentage of each comfort category during the cooling period. It can be observed that the DX and DRIEC systems achieved really close favorable conditions (sum of percentages when the indoor conditions were within categories I and II) in the warmer climate zones, Lampedusa and Seville. The percentages of favorable thermal comfort conditions for the DRIEC system were equal to 74.3% and 66.1%, respectively, during their cooling periods, see Figure 8. However, a significant reduction was obtained with the RIEC system in Lampedusa. This was caused by a high humidity in the supply air.
Figure 8.
Annual thermal comfort results. Percentage of occupancy hours in each category.
Outdoor temperature and outdoor humidity ratio were less severe in the climatic conditions of Thessaloniki and Zagreb, with less annual cooling hours (see Table 9). These weather conditions achieved higher percentage of thermal comfort hours when the DX and RIEC systems came into operation. In these climate zones, the DRIEC system showed low values of favorable thermal comfort conditions, due to lower indoor air temperature ranged between 21 °C and 24 °C. The temperature control, Mode T1, allowed a ΔT of 2 °C.
3.2. Air Quality
3.2.1. Daily Analysis of the Air-Cooling Systems
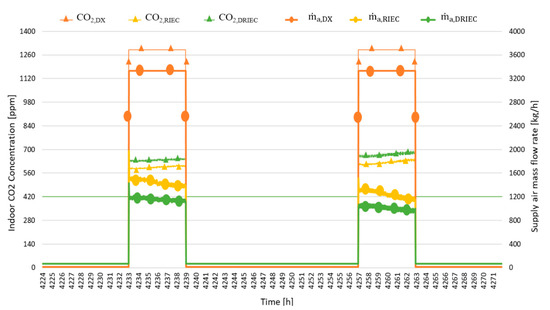
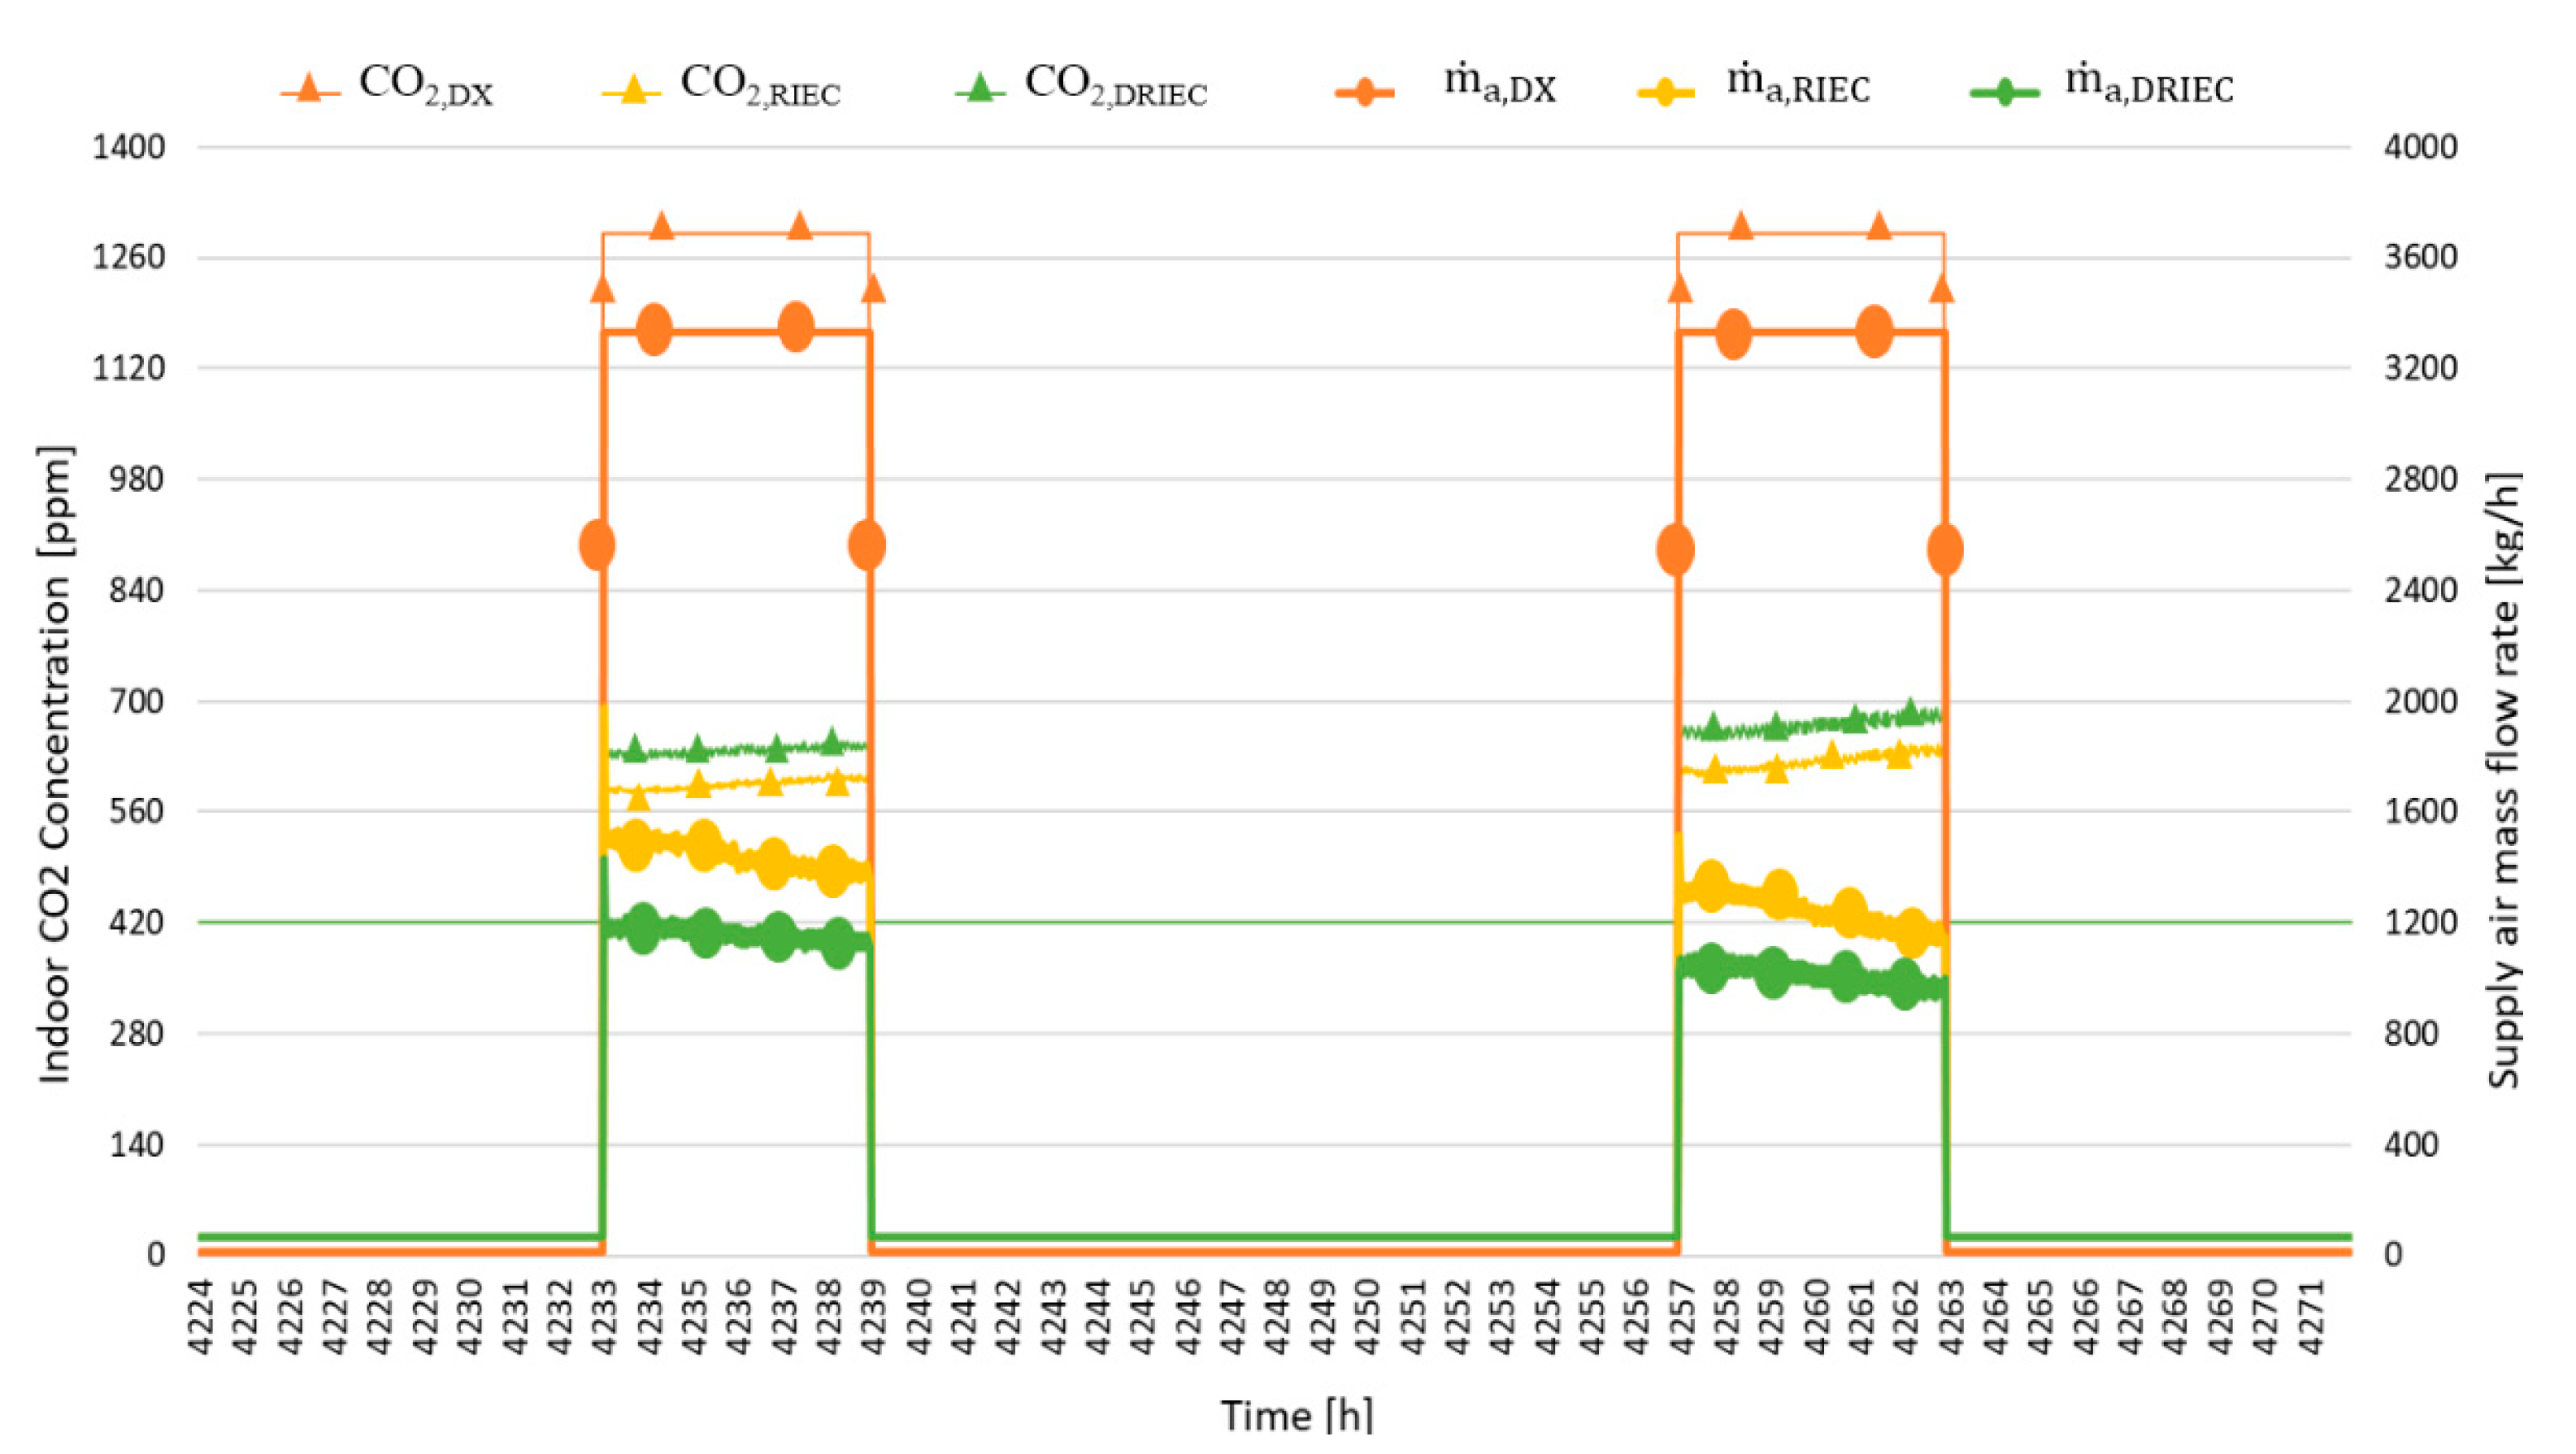
The daily results related to air quality for the three air-cooling systems and the climate zone of Lampedusa are shown in Figure 9. It shows the CO2 concentration inside the room (420 ppm were considered as outdoor CO2 concentration) and the supply air mass flow rate into the room, for each air-cooling system.
Figure 9.
Indoor CO2 concentration and supply air mass flow rate. DX, RIEC and DRIEC systems in Lampedusa in two representative summer days.
The DX system showed the highest CO2 concentration values, since only a low percentage of supply air came from outside. The indoor CO2 concentration for the occupancy period was 1291 ppm in the classroom simulated in Lampedusa for the DX system. The RIEC and DRIEC systems used 100% outdoor air, while the DX system used 9% outdoor air. Consequently, the RIEC and DRIEC systems achieved indoor CO2 concentrations lower than those of the DX system. The RIEC system achieved better conditions of indoor air quality than the DRIEC system. RIEC supplied 448 kg h−1 more of air flow rate to the classroom than DRIEC since humidity was not controlled by this first.
3.2.2. Annual Air Quality Results
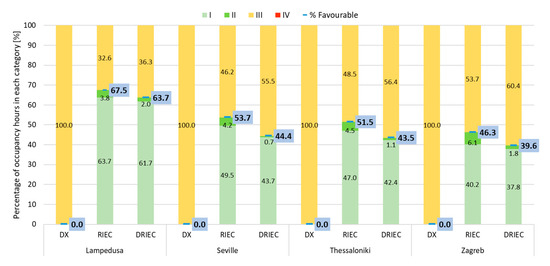
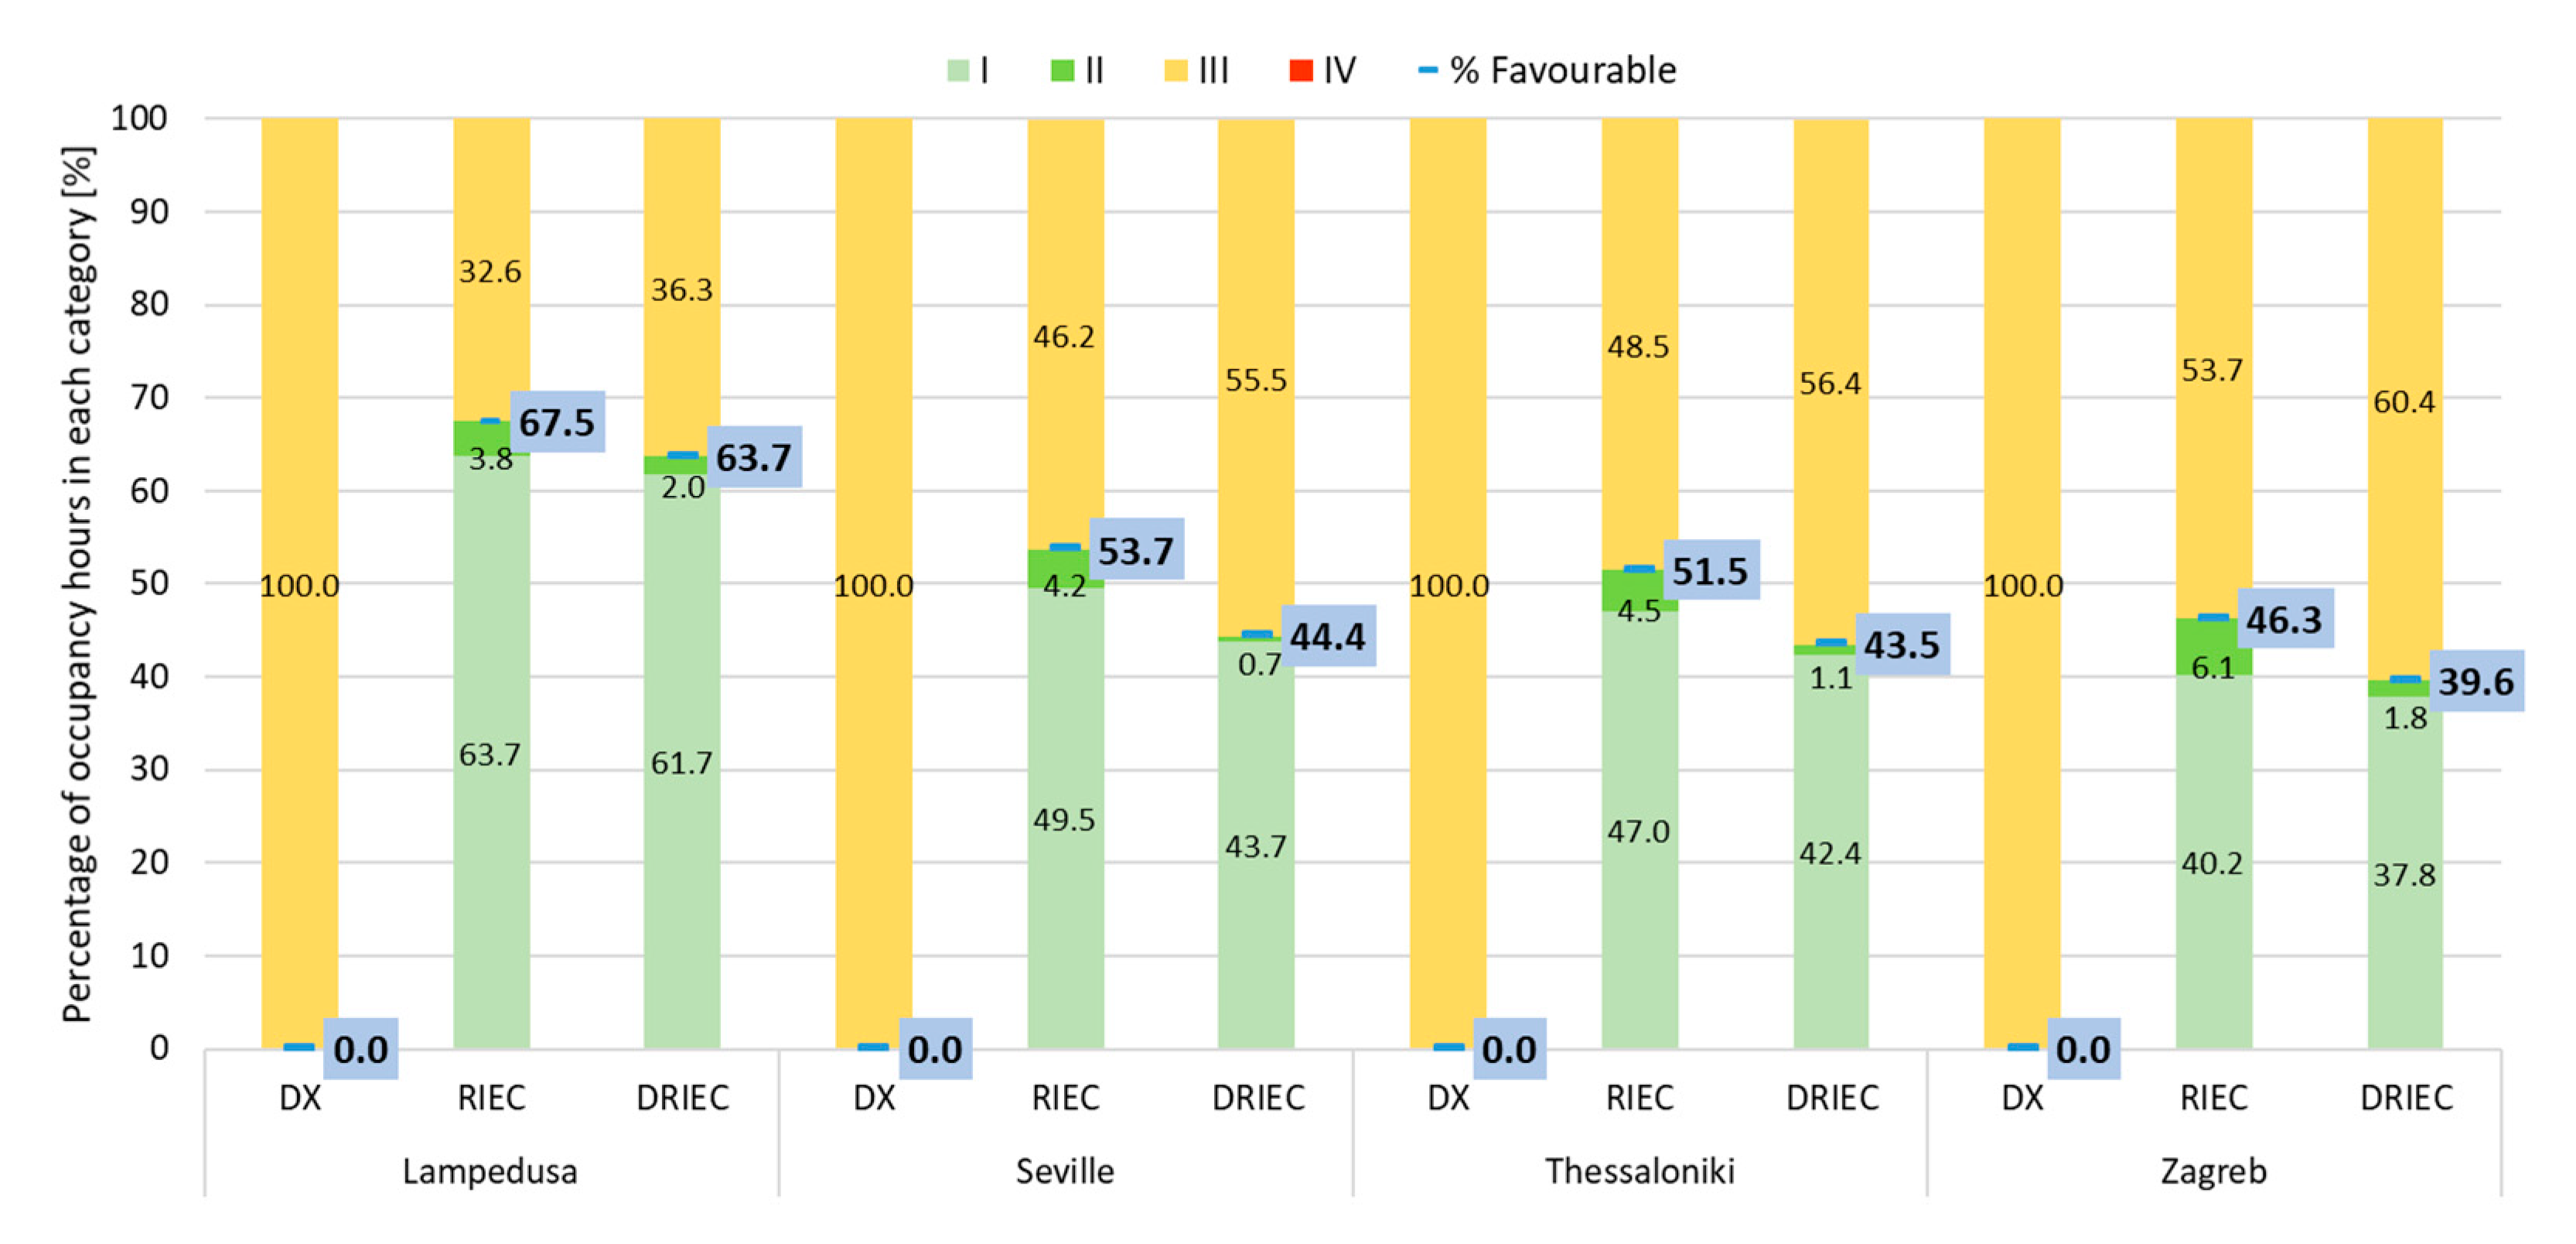
The annual air quality results for the three air-cooling systems and the four climate zones selected are shown in Figure 10. The bars show the percentage of cooling period, for each air-cooling system in each air quality category for the four climate conditions. As DX system used 9% outdoor air, it can be observed that this system was in unfavorable category III throughout occupation period in each climate zone. The RIEC and DRIEC systems achieved similar favorable conditions because they are all outside air systems.
Figure 10.
Annual air quality results. Percentage of occupancy hours in each category.
For the warmest climate of Lampedusa, the air quality favorable conditions of the RIEC system were only 4% higher than the air quality favorable conditions of the DRIEC system. However, due to the difference between the RIEC and DRIEC supply air mass flow rates, this increase reached 9.3%, 8% and 6.7% for the climates of Seville, Thessaloniki and Zagreb, respectively. This analysis was performed for the same number of operating hours of each system, see Table 9.
3.3. Energy Consumption
3.3.1. Daily Analysis of the Air-Cooling Systems
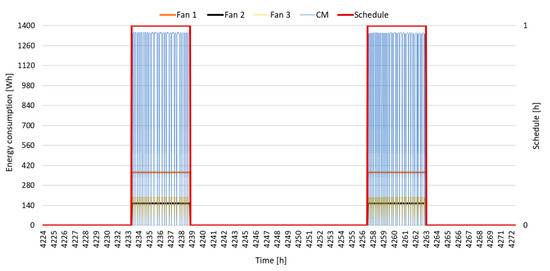
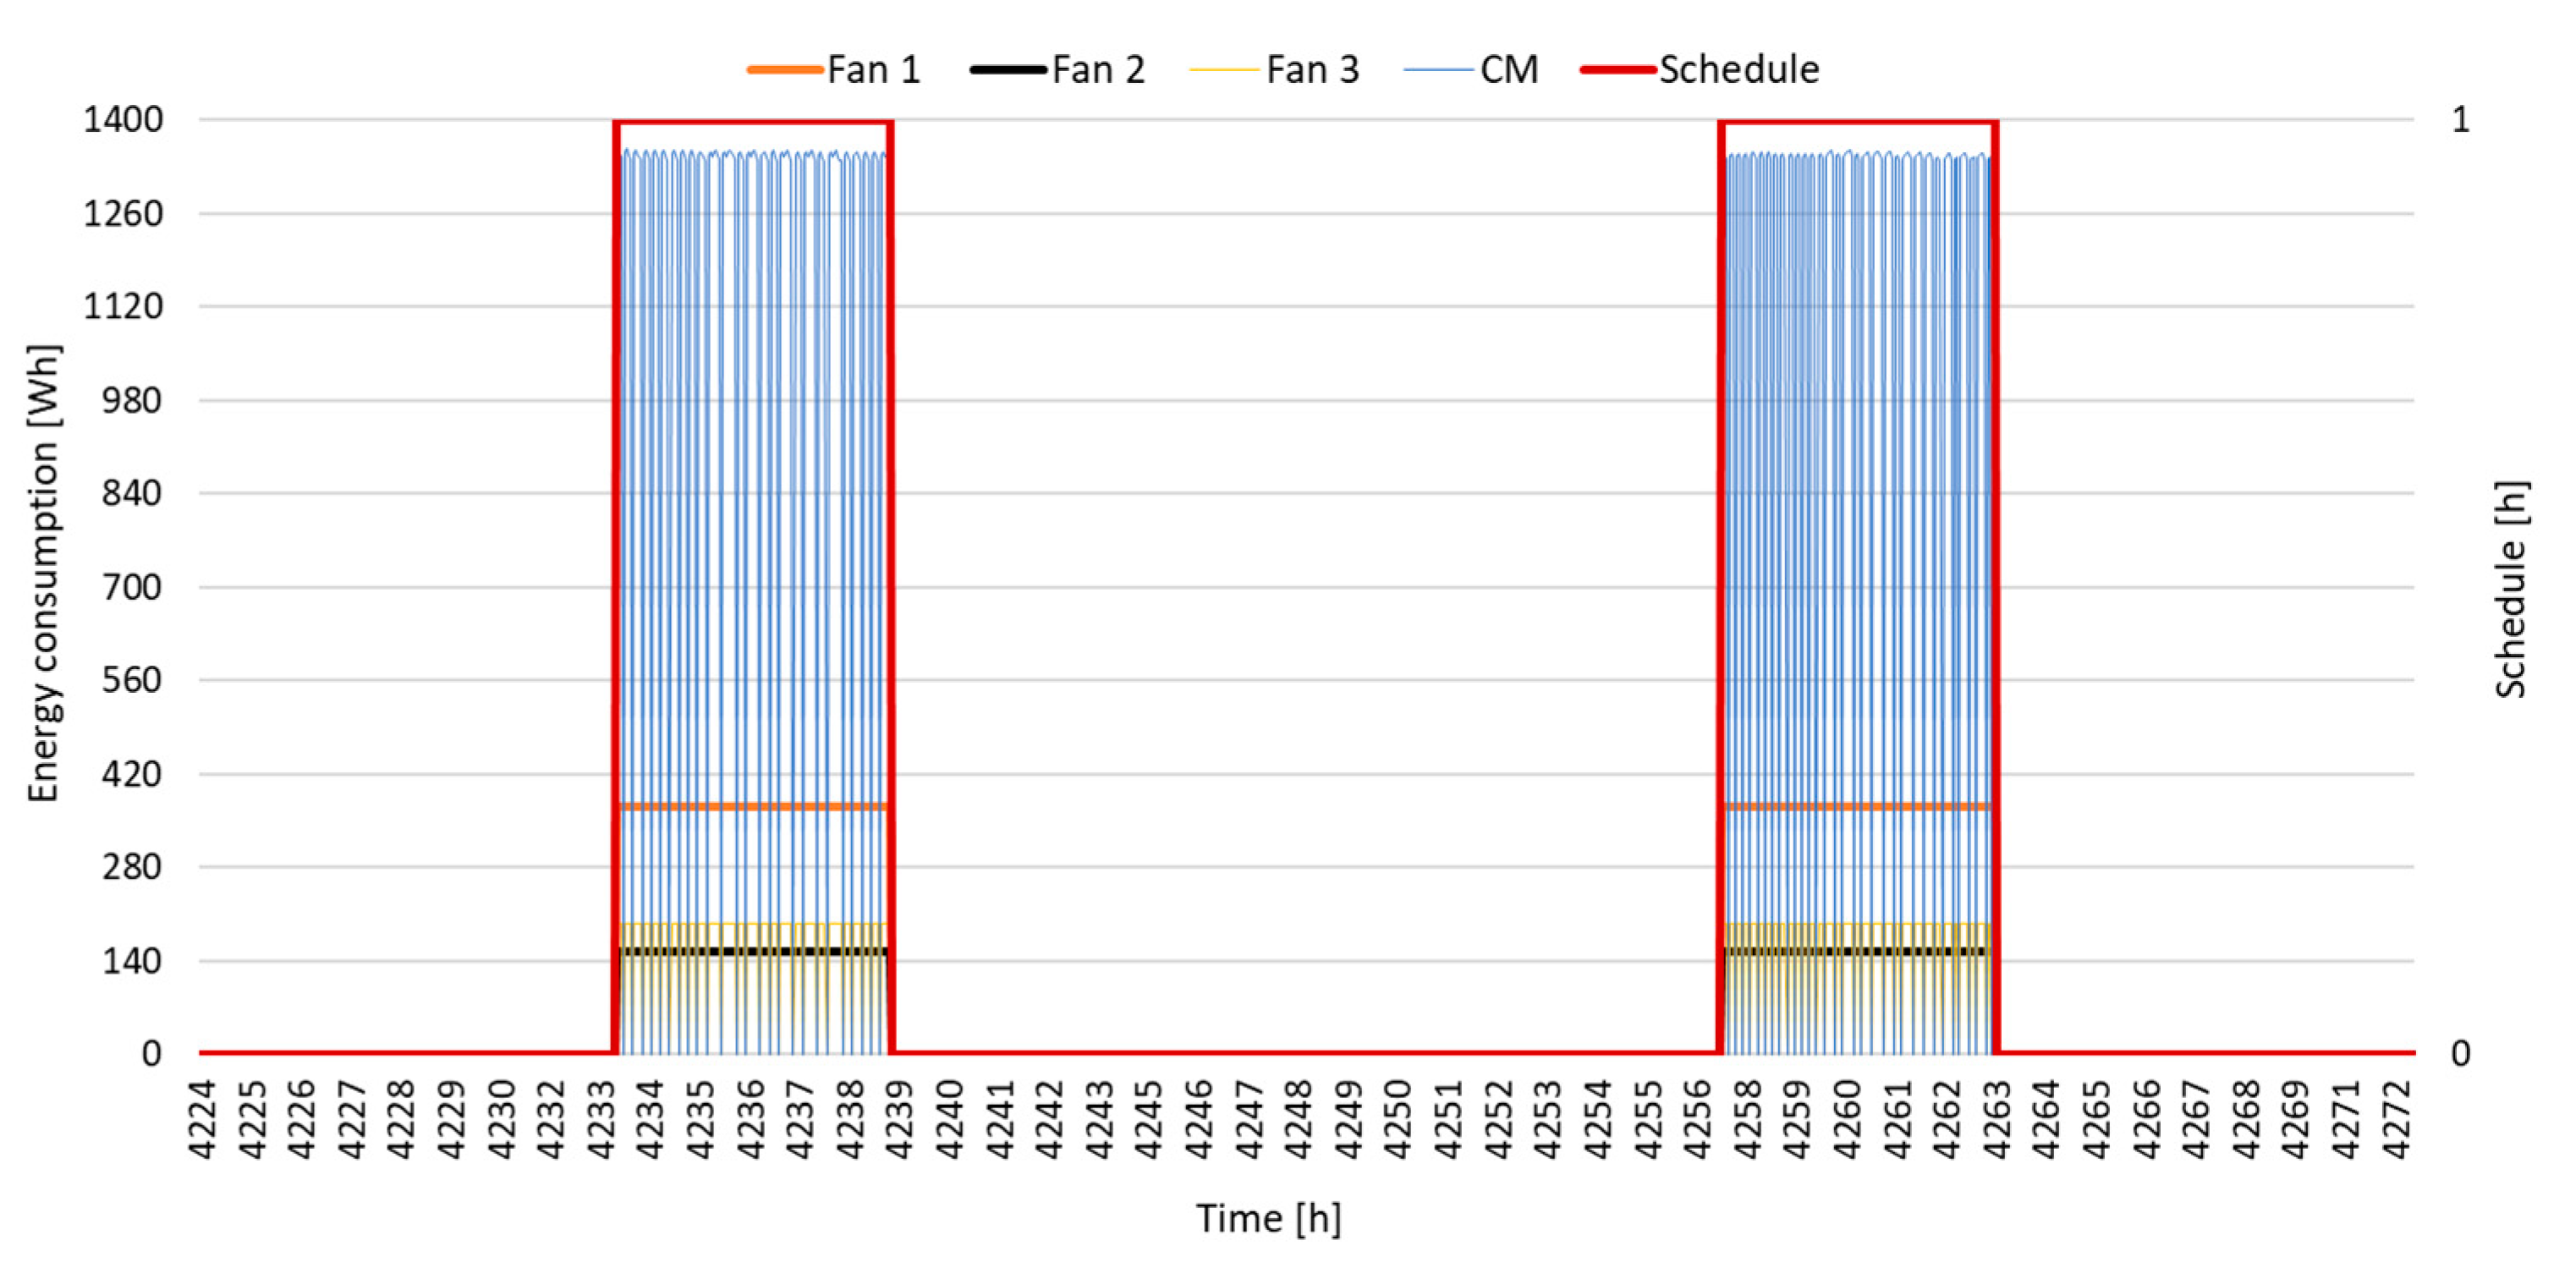
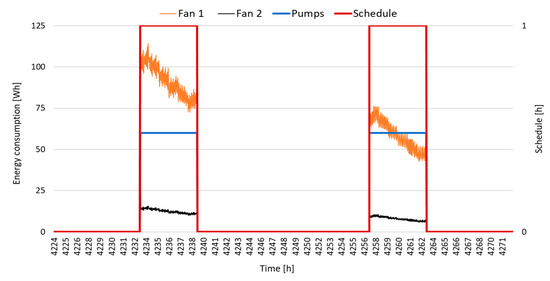
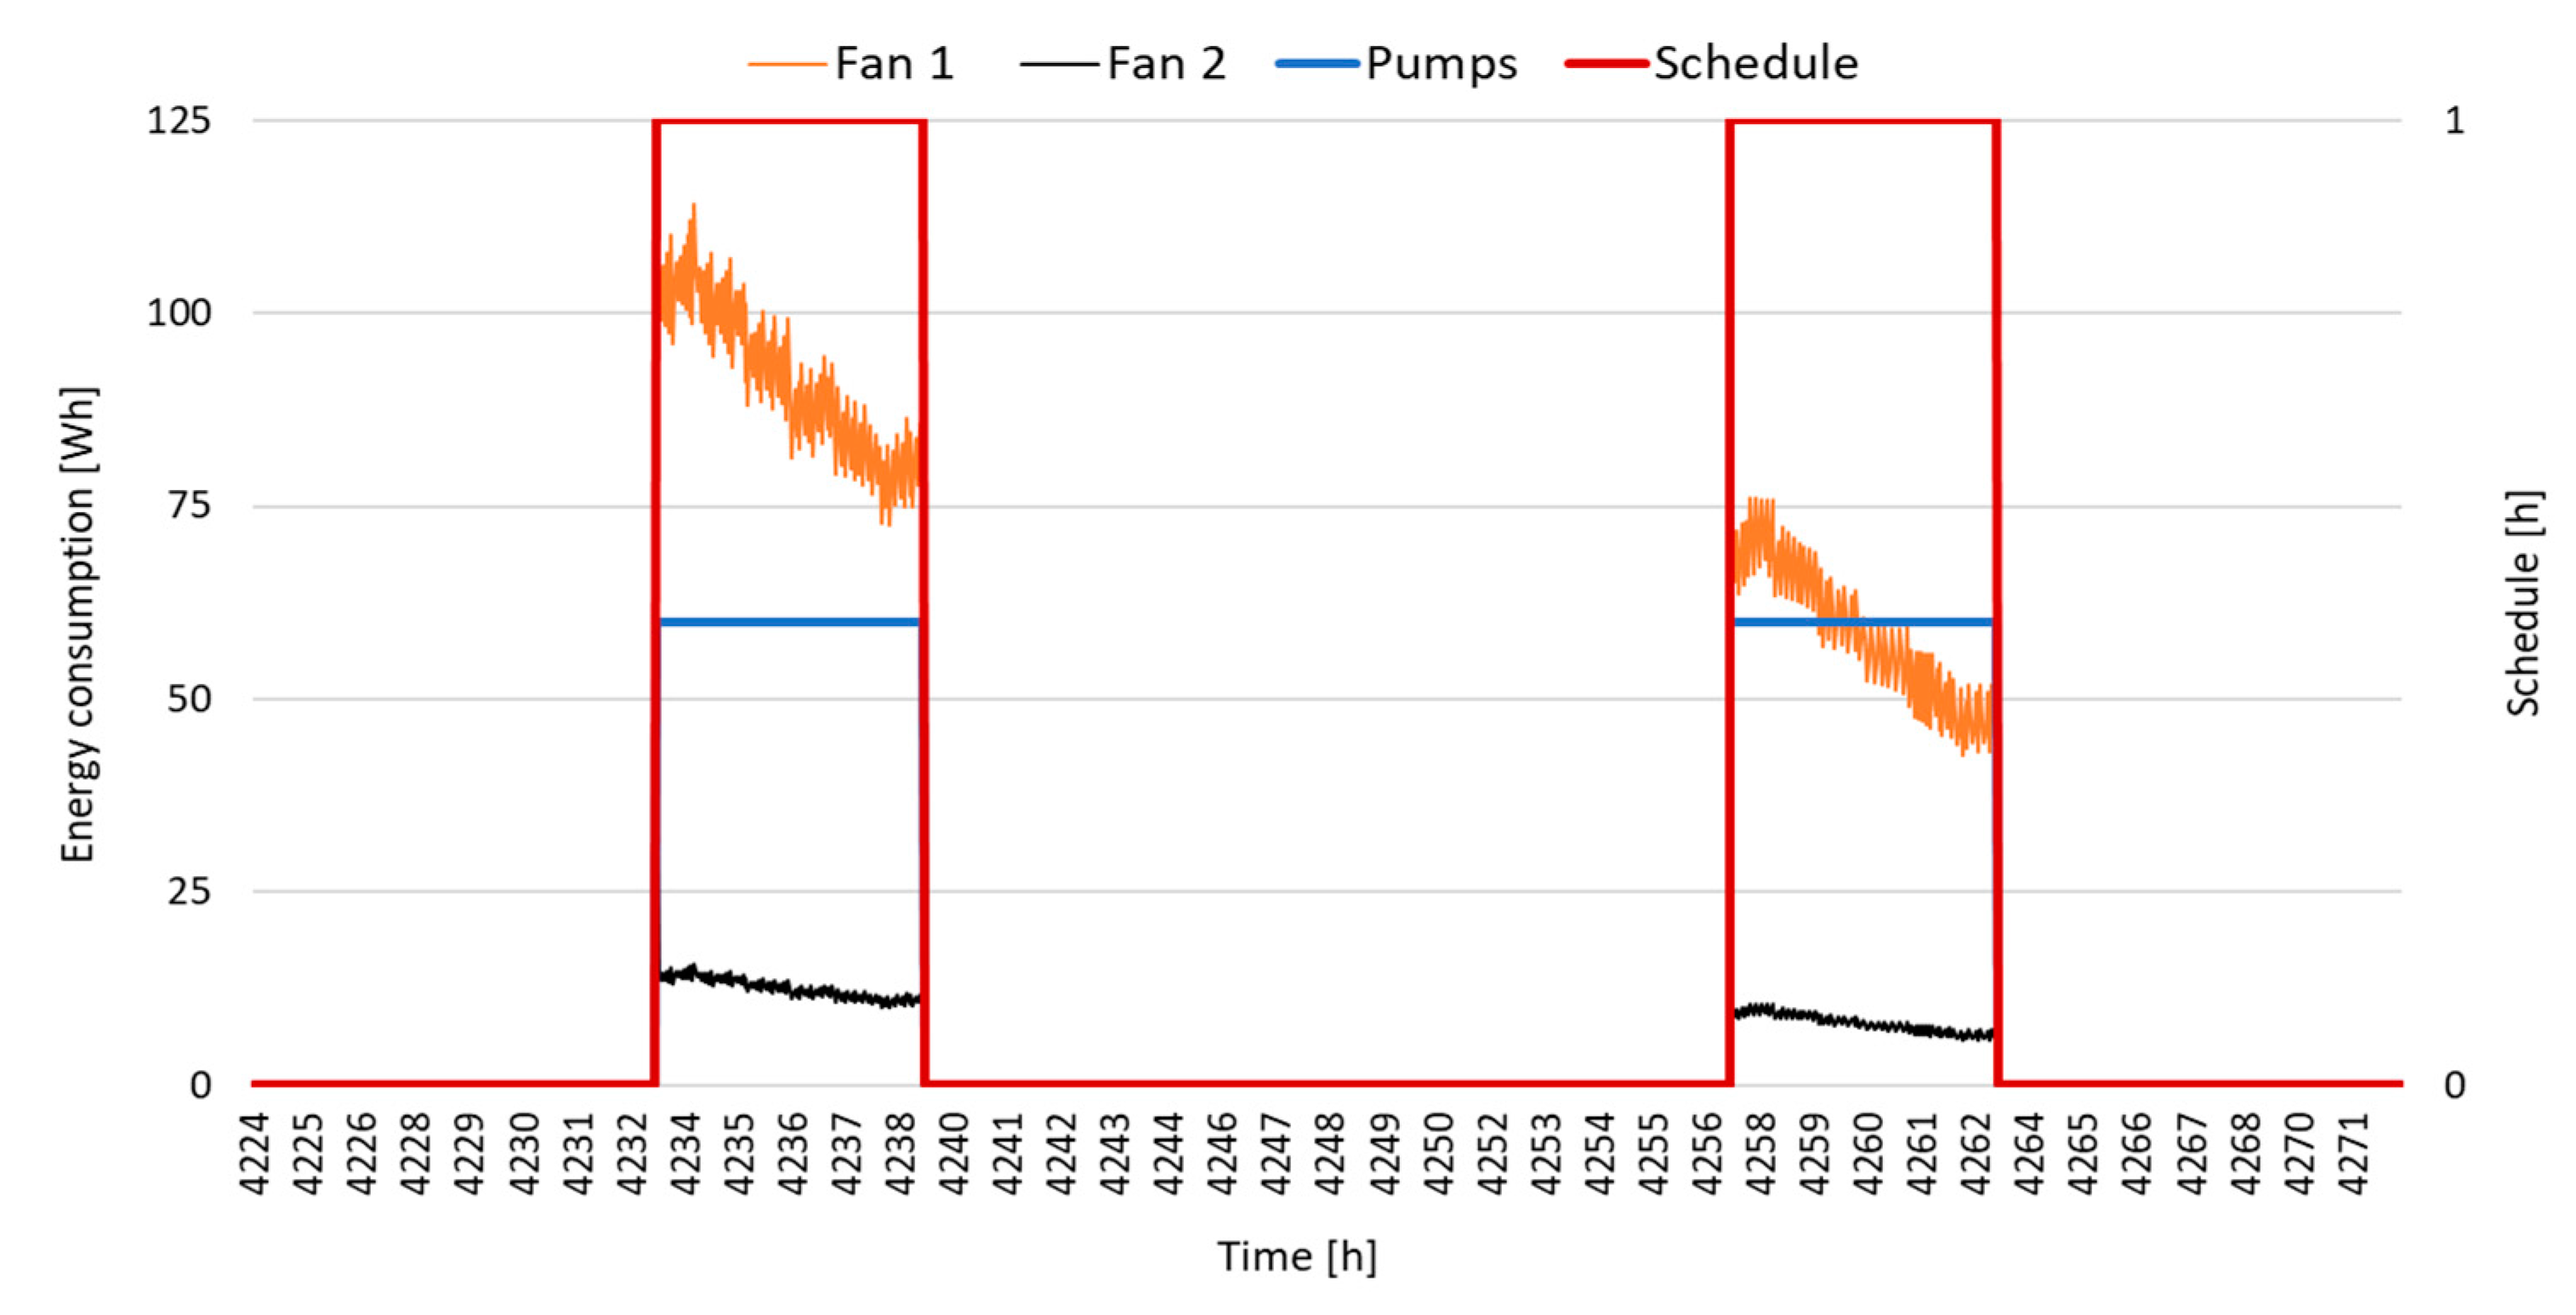
The energy consumption results for the three air-cooling systems in the climate zone of Lampedusa are shown in Figure 11, Figure 12 and Figure 13. The lines show the energy consumption during the occupancy hours of two days above. The electric energy consumption of each element was calculated: (i) DX, mainly with a compressor and exhaust, condenser and process fans; (ii) RIEC, mainly with pumps and exhaust and process fans; (iii) DRIEC, mainly with pumps and exhaust, regeneration and process fans.
Figure 11.
Energy consumption. DX system in Lampedusa in two representative summer days.
Figure 12.
Energy consumption. RIEC system in Lampedusa in two representative summer days.
Figure 13.
Energy consumption. DRIEC system in Lampedusa in two representative summer days.
In Figure 11, it can be observed that the process and exhaust fans constantly consumed 370 and 154 Wh, respectively, during this period. The condenser fan and compressor consumptions ranged between 0–195 and 0–1350 Wh, in that order. The moisture retention of the DX system was not considered during periods of inactivity.
The energy consumption of the process fan in the RIEC system oscillated between 45 and 120 Wh during the occupancy hours, see Figure 12. The exhaust fan and pumps constantly consumed 15 and 60 Wh, respectively.
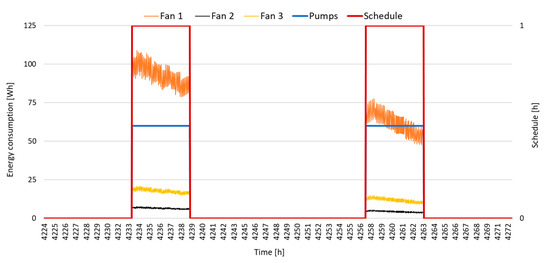
In relation to the energy consumption in the DRIEC system, see Figure 13, the pumps consumed the same as the RIEC system. However, the exhaust fan consumed half that of the RIEC and the process fan ranged from 50 to 115 Wh, a smaller range than in this last system. The regeneration fan added about 20 Wh to the total energy consumption during these school hours.
The results showed that the compressor energy consumption determined a significant difference compared to the energy consumption of RIEC and DRIEC. Furthermore, the main difference between RIEC and DRIEC system was due to the consumption of the regeneration fan, since the RIEC system does not have one. The operation hours of the three air-cooling systems were identical regarding each climate zone. They are indicated in Table 9 such as cooling period.
3.3.2. Annual Energy Consumption Results
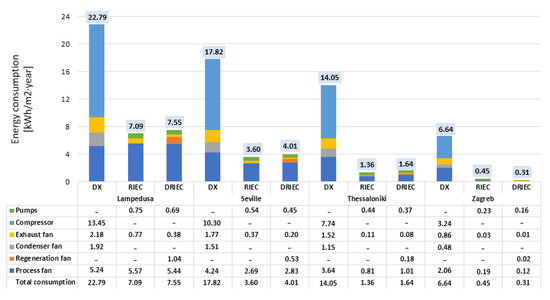
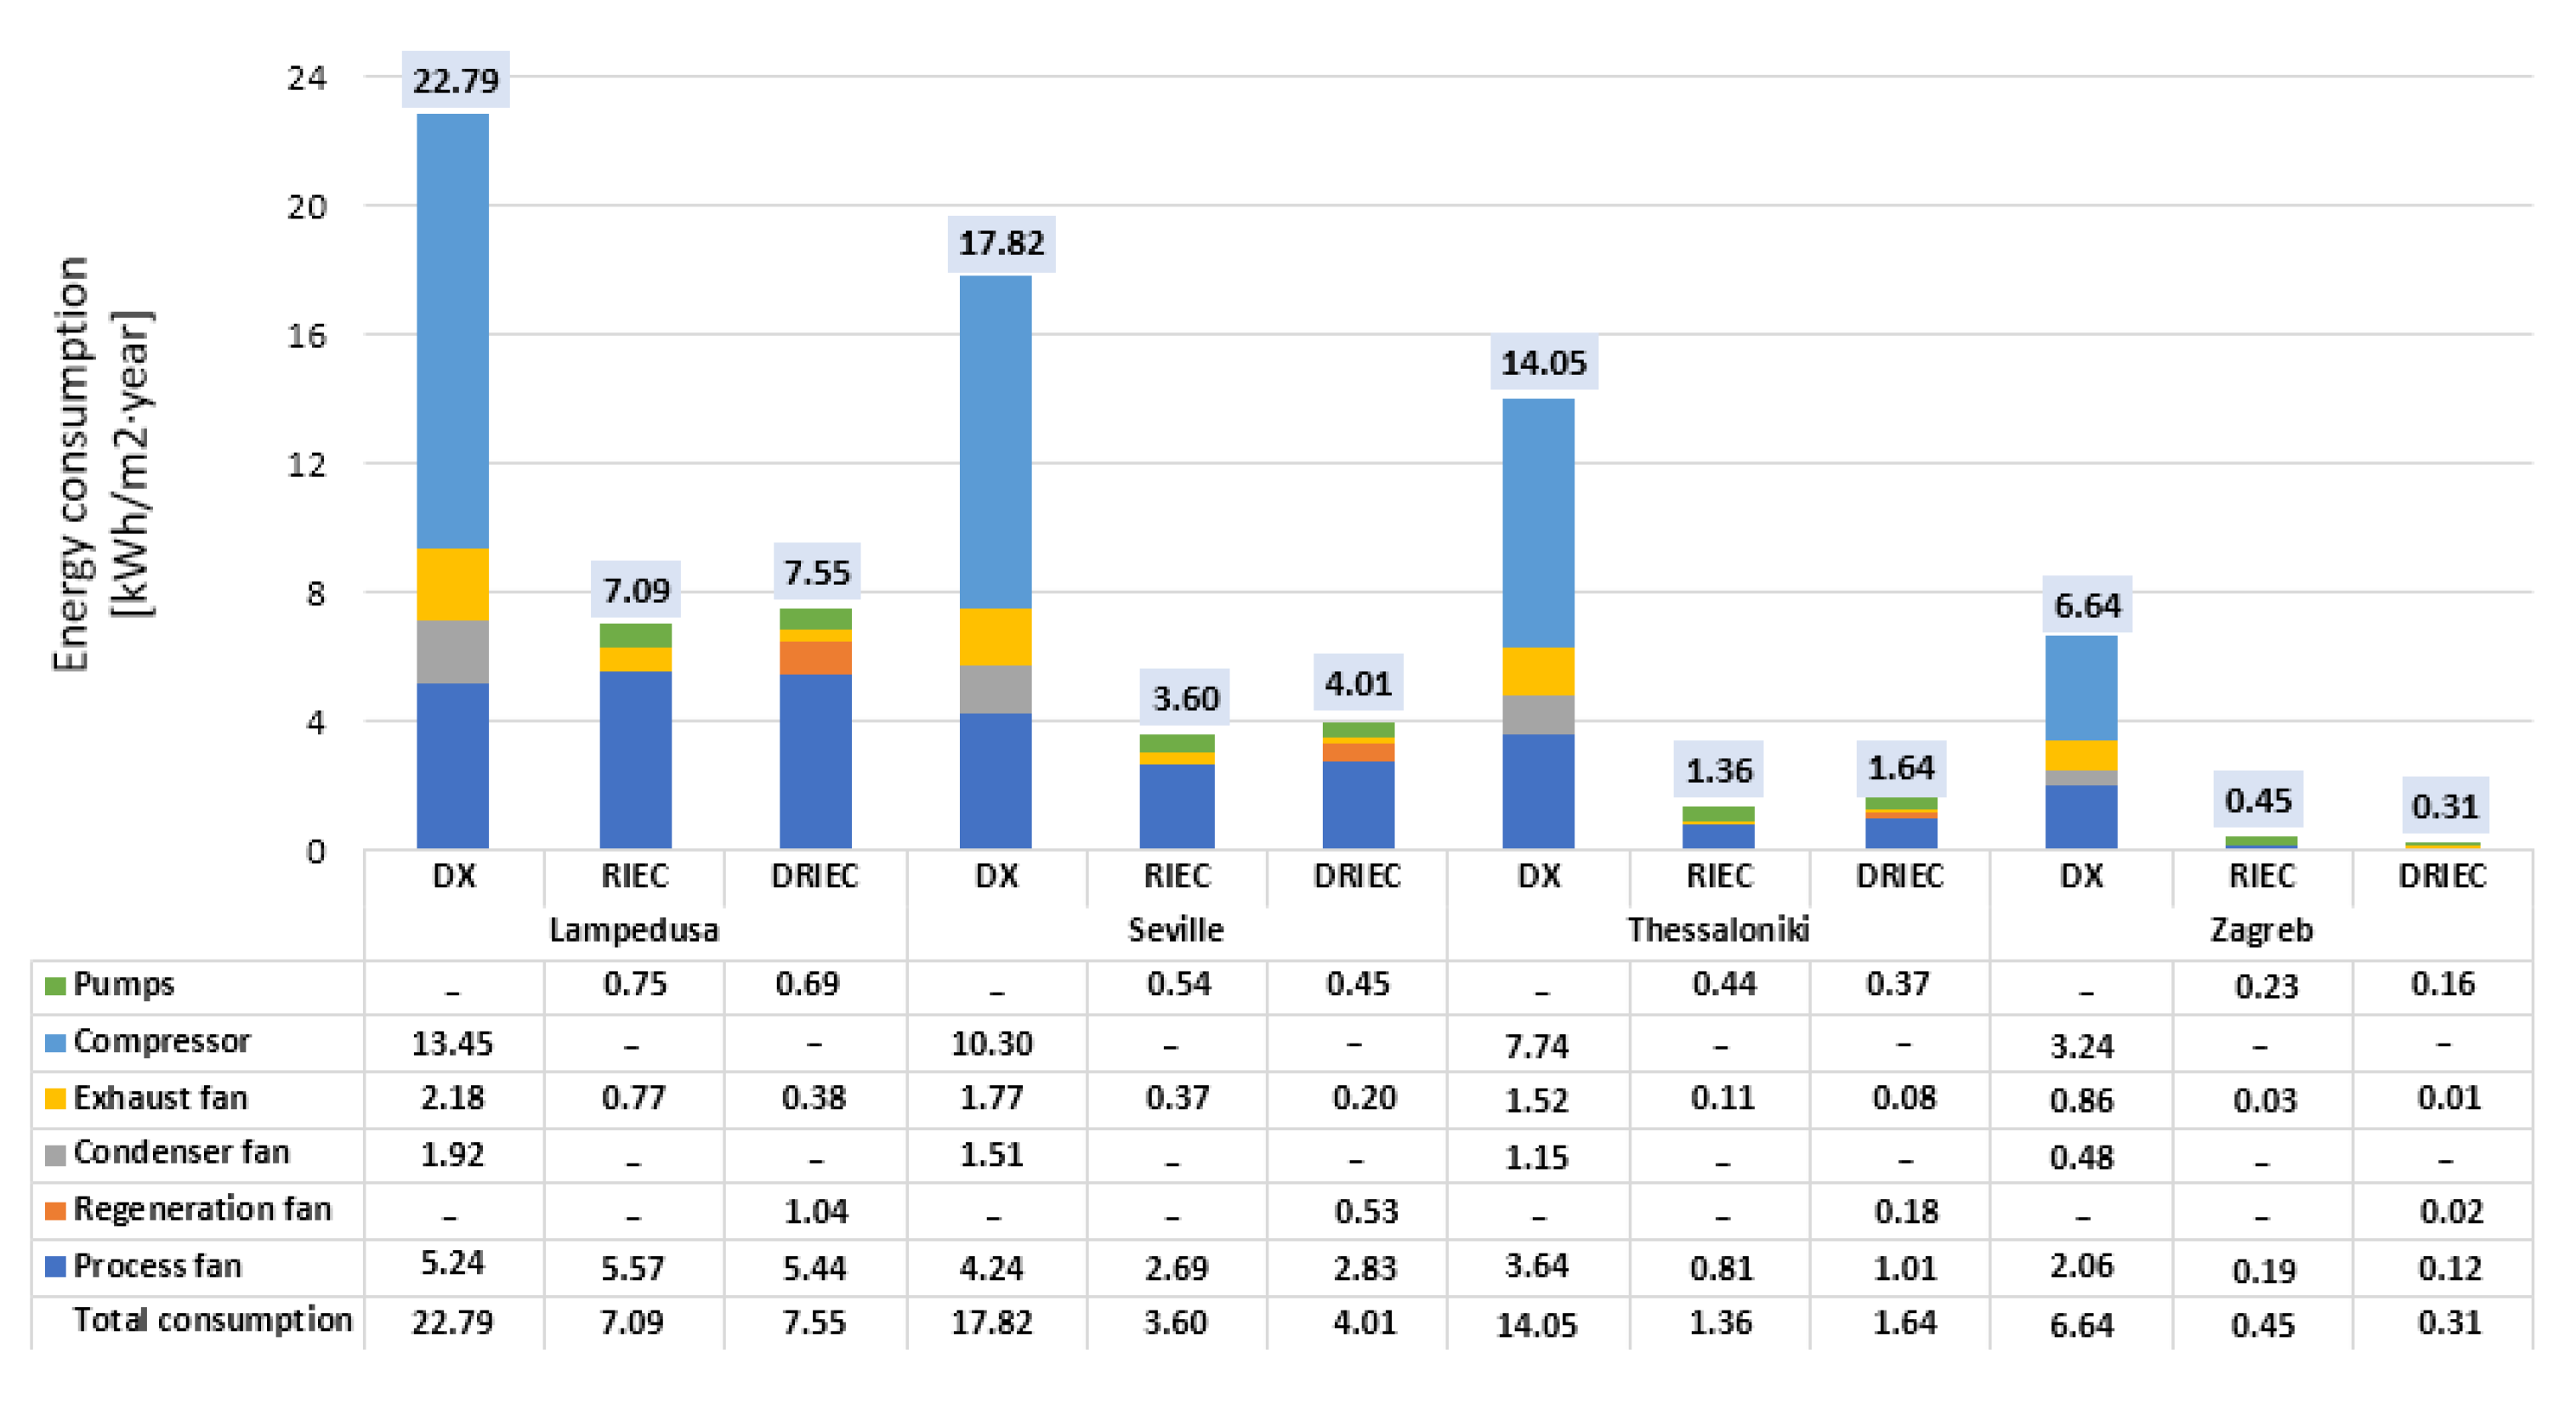
These results were obtained as the sum of the energy consumption of each air-cooling system element. The bars show the consumption per m2 of useful classroom area, of each system for each climate zone selected. In Figure 14 it can be observed these consumption values during the respective cooling periods of the year. The RIEC and DRIEC systems had similar energy consumptions in each climate zone. The main difference between these two systems was in the exhaust fan energy consumption. Due to the lower supply air mass flow rate values by DRIEC, its exhaust fan energy consumption was approximately the half of the exhaust fan energy consumption of RIEC. However, the DX system consumed three times more than the DRIEC system in Lampedusa and four times more than the DRIEC system in Seville, mainly due to the energy consumption of the compressor.
Figure 14.
Annual energy consumption results.
In the more temperate climates of Thessaloniki and Zagreb, cooling period hours were lower than Lampedusa and Seville climates, see Table 9. The difference in energy consumption between the conventional DX system and the efficient RIEC and DRIEC systems were significant. The process fans energy consumption achieved lower values in these two last systems due to the outdoor conditions. The DX system consumed ten times more than the RIEC system in the Thessaloniki climate and twenty times more than the DRIEC system in the Zagreb climate.
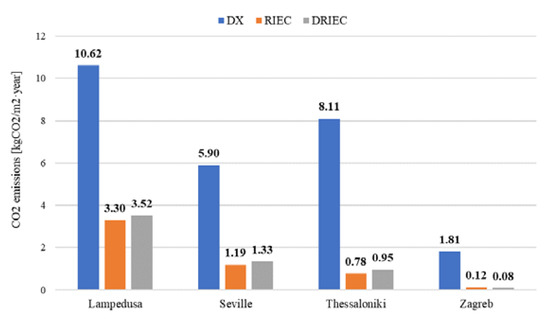
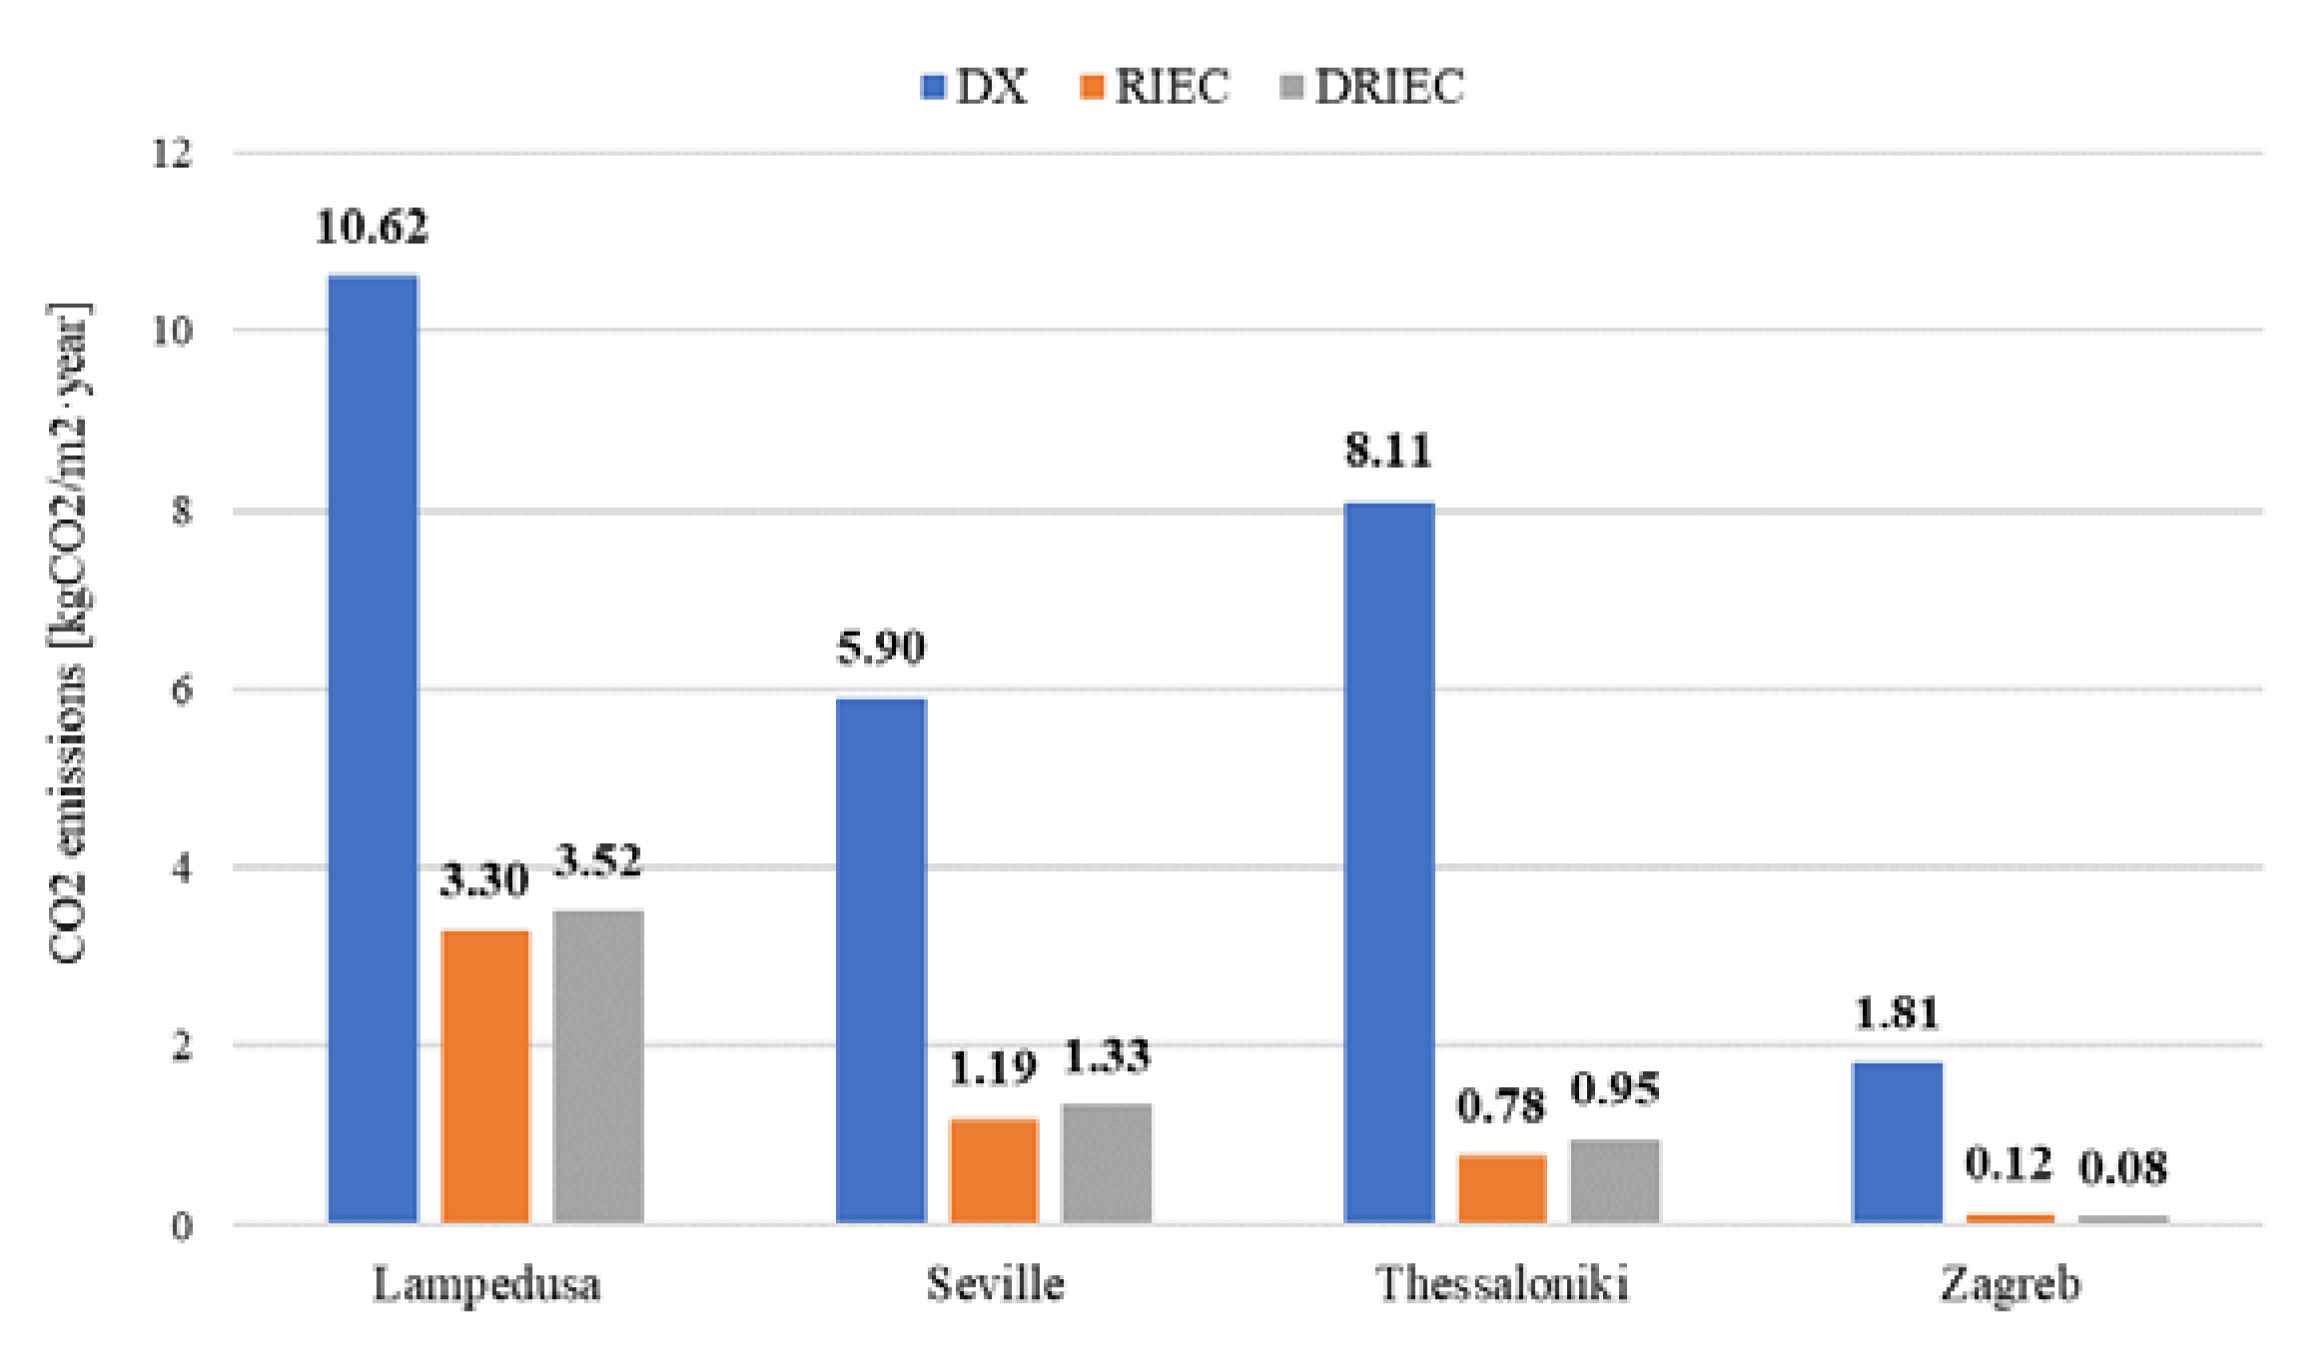
In relation to environmental impact, the annual results of CO2 emissions for the three air-cooling systems and the four climate zones selected are shown in Figure 15. It can be observed that these CO2 emissions values were directly proportional to the energy consumption values. The relationship between these two indicators was the emission factor, indicated in Table 13, for each country.
Figure 15.
Annual CO2 emissions results.
3.4. Comparative Analysis of Air-Cooling Systems and Climate Zones
The influence of climatic severity on thermal comfort, air quality and energy consumption indicators are shown in this section. Increased climatic severity is referred to increased cooling period hours number, see Table 9. The three air-cooling systems were compared for the four climates selected.
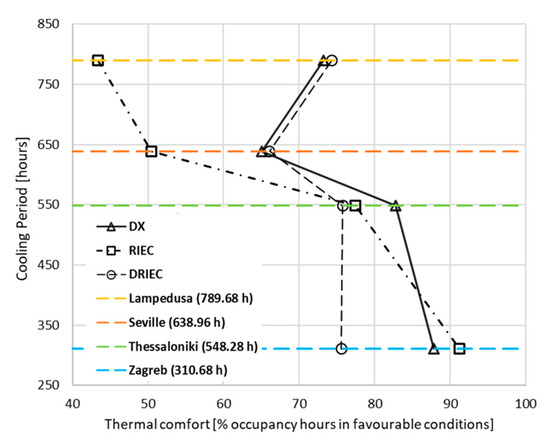
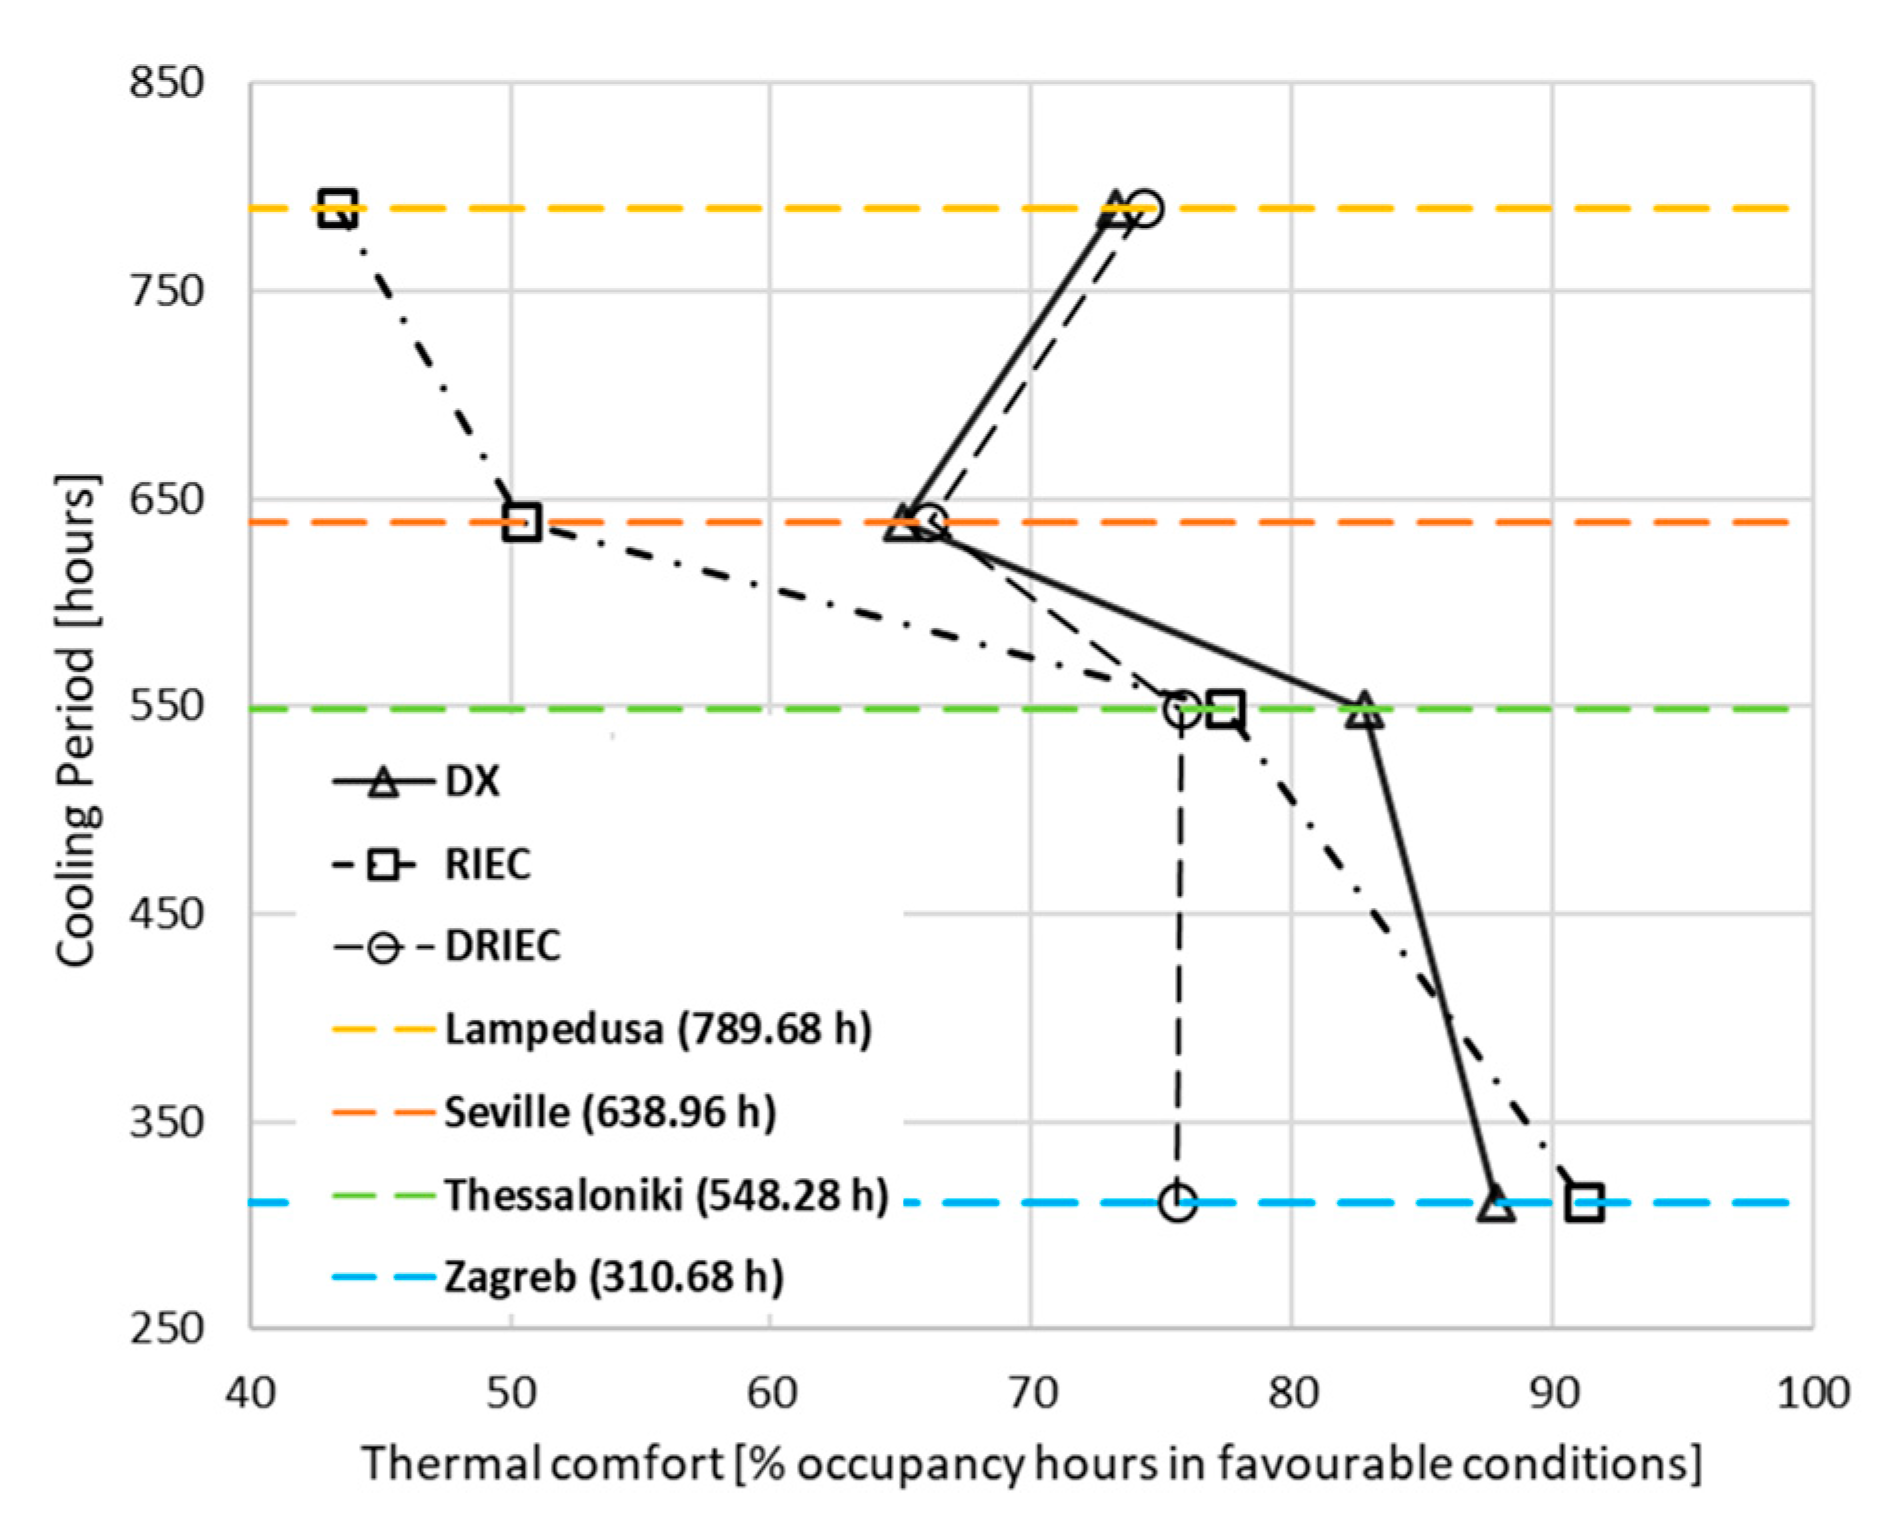
Figure 16 show the relationship between the cooling period hours and the percentage of hours in favorable thermal comfort conditions. The DX and DRIEC systems were similar in Lampedusa and Seville. A reduction of 20% in terms of thermal comfort was shown when DX served the standard classroom, for the less severe climates of Seville and Thessaloniki. RIEC reached the biggest difference of comfort favorable conditions between these climate zones, see Figure 16. It was due to the outdoor humidity difference, parameter no controlled by the RIEC system. However, DRIEC showed close values of percentage of occupation hours in favorable category. It can be observed that the thermal comfort indicator remained between 65% and 75% to all climates.
Figure 16.
Influence of climatic severity on thermal comfort indicator.
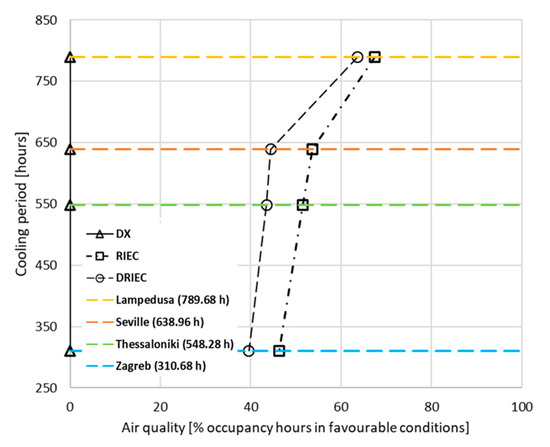
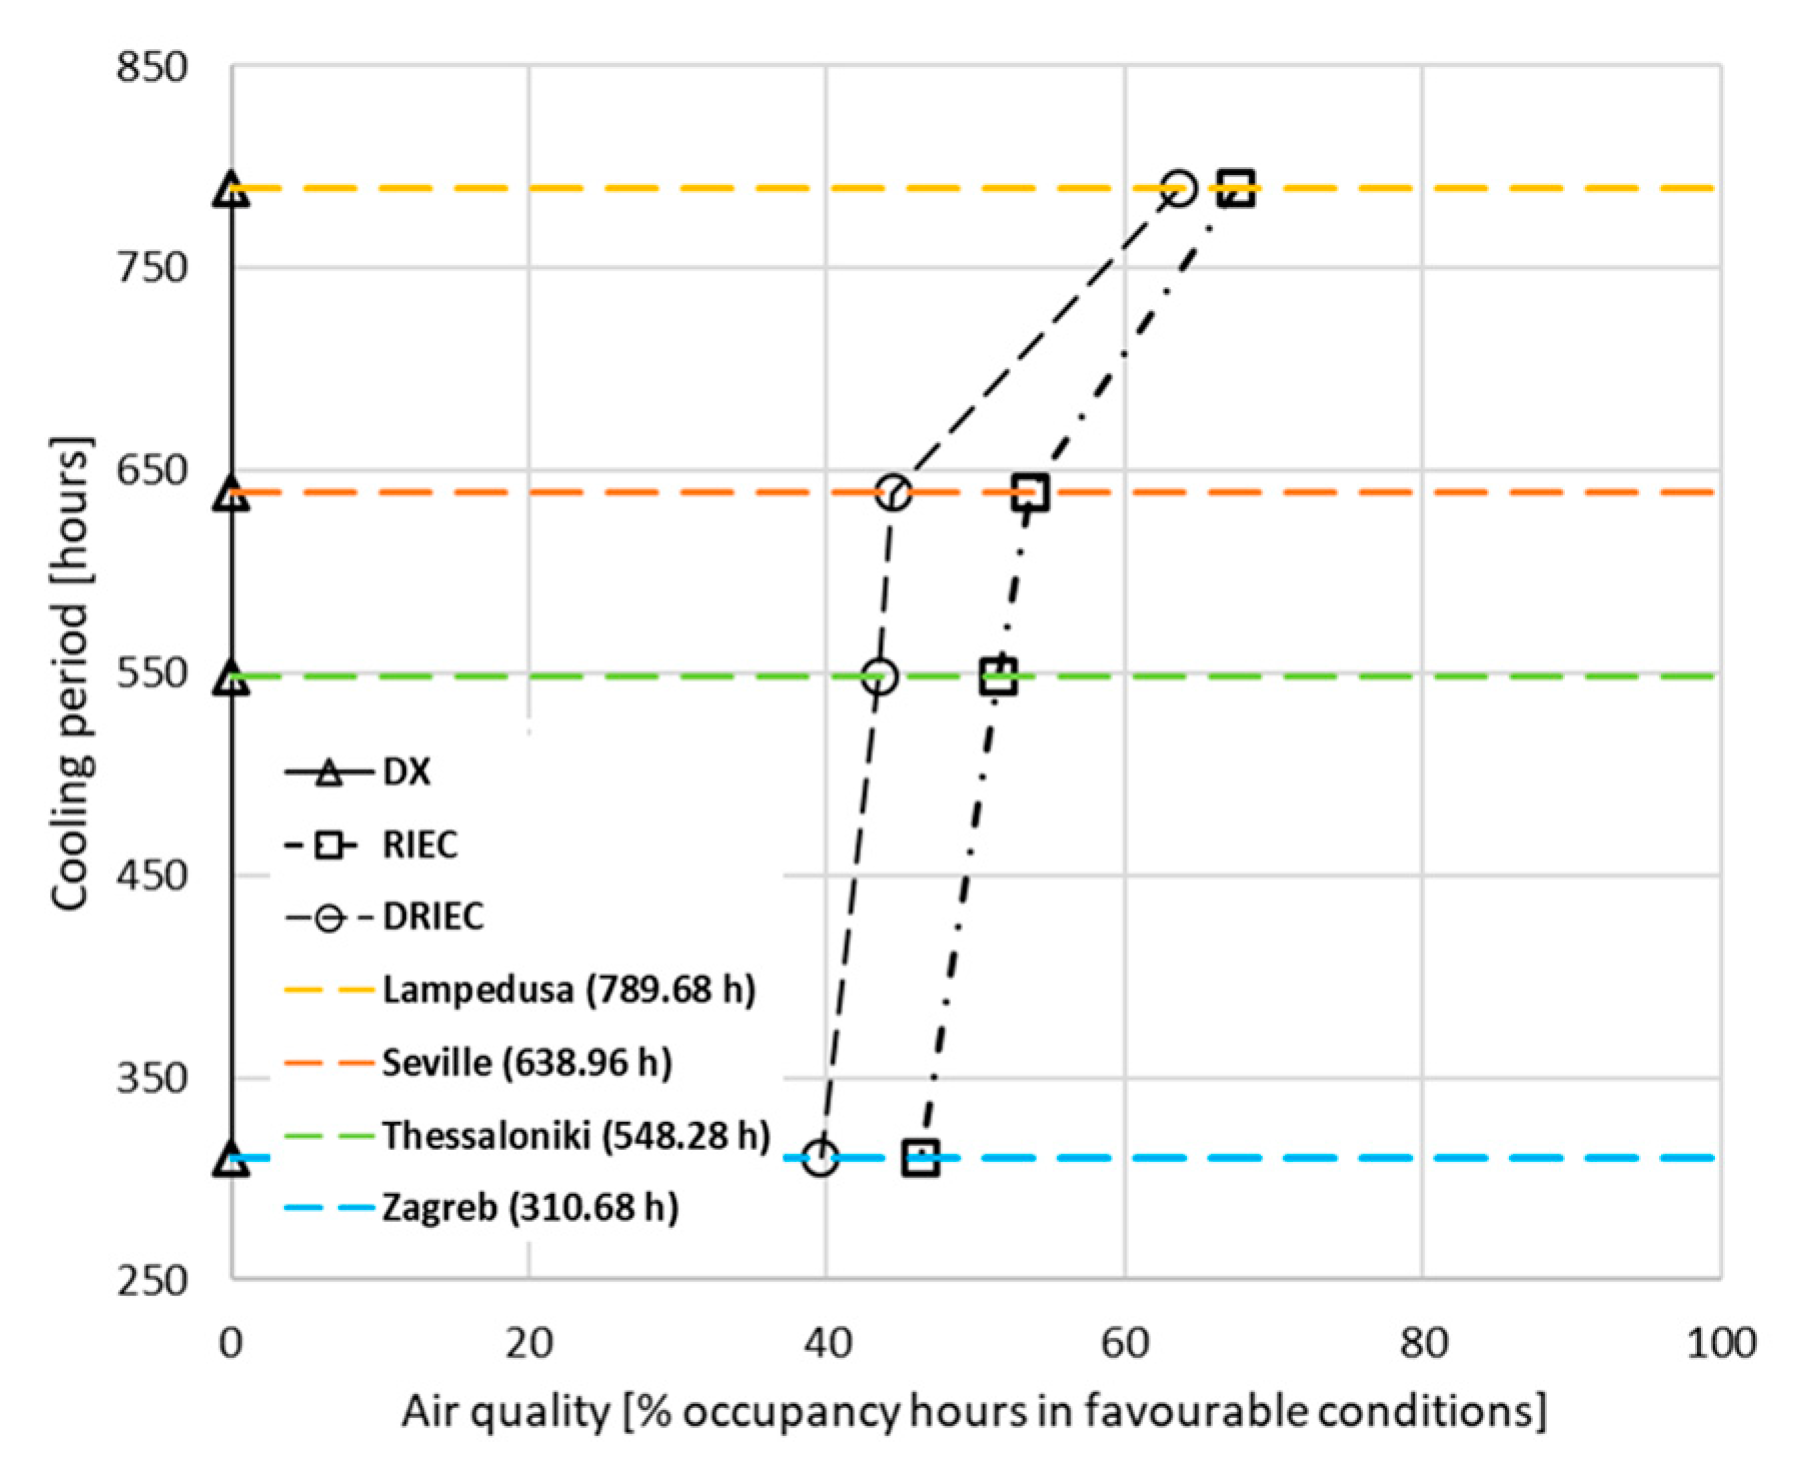
Figure 17 show the results of the climatic severity influence on air quality indicator. The indoor conditions obtained with the DX system were in III unfavorable category throughout occupation period, in each studied climate. The RIEC and DRIEC systems showed values close to 65% for the severe climate of Lampedusa. However, RIEC improved air quality in the classroom by 10% compared to DRIEC in the climates of Seville, Thessaloniki and Zagreb. The RIEC system achieved about 50% of occupancy period hours in favorable conditions in these three last cities. The air quality indicator to RIEC and DRIEC improved with climatic severity, due to the need of higher supply air mass flow values.
Figure 17.
Influence of climatic severity on air quality indicator.
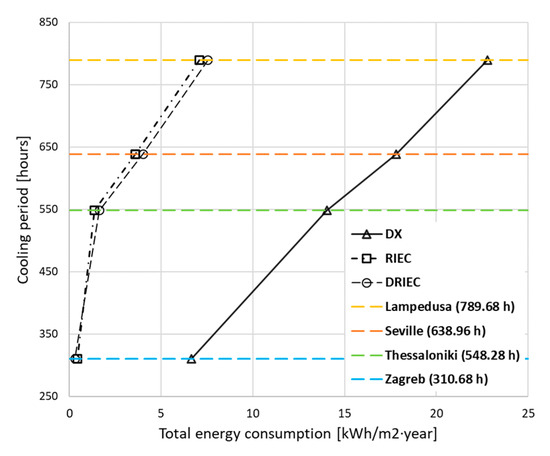
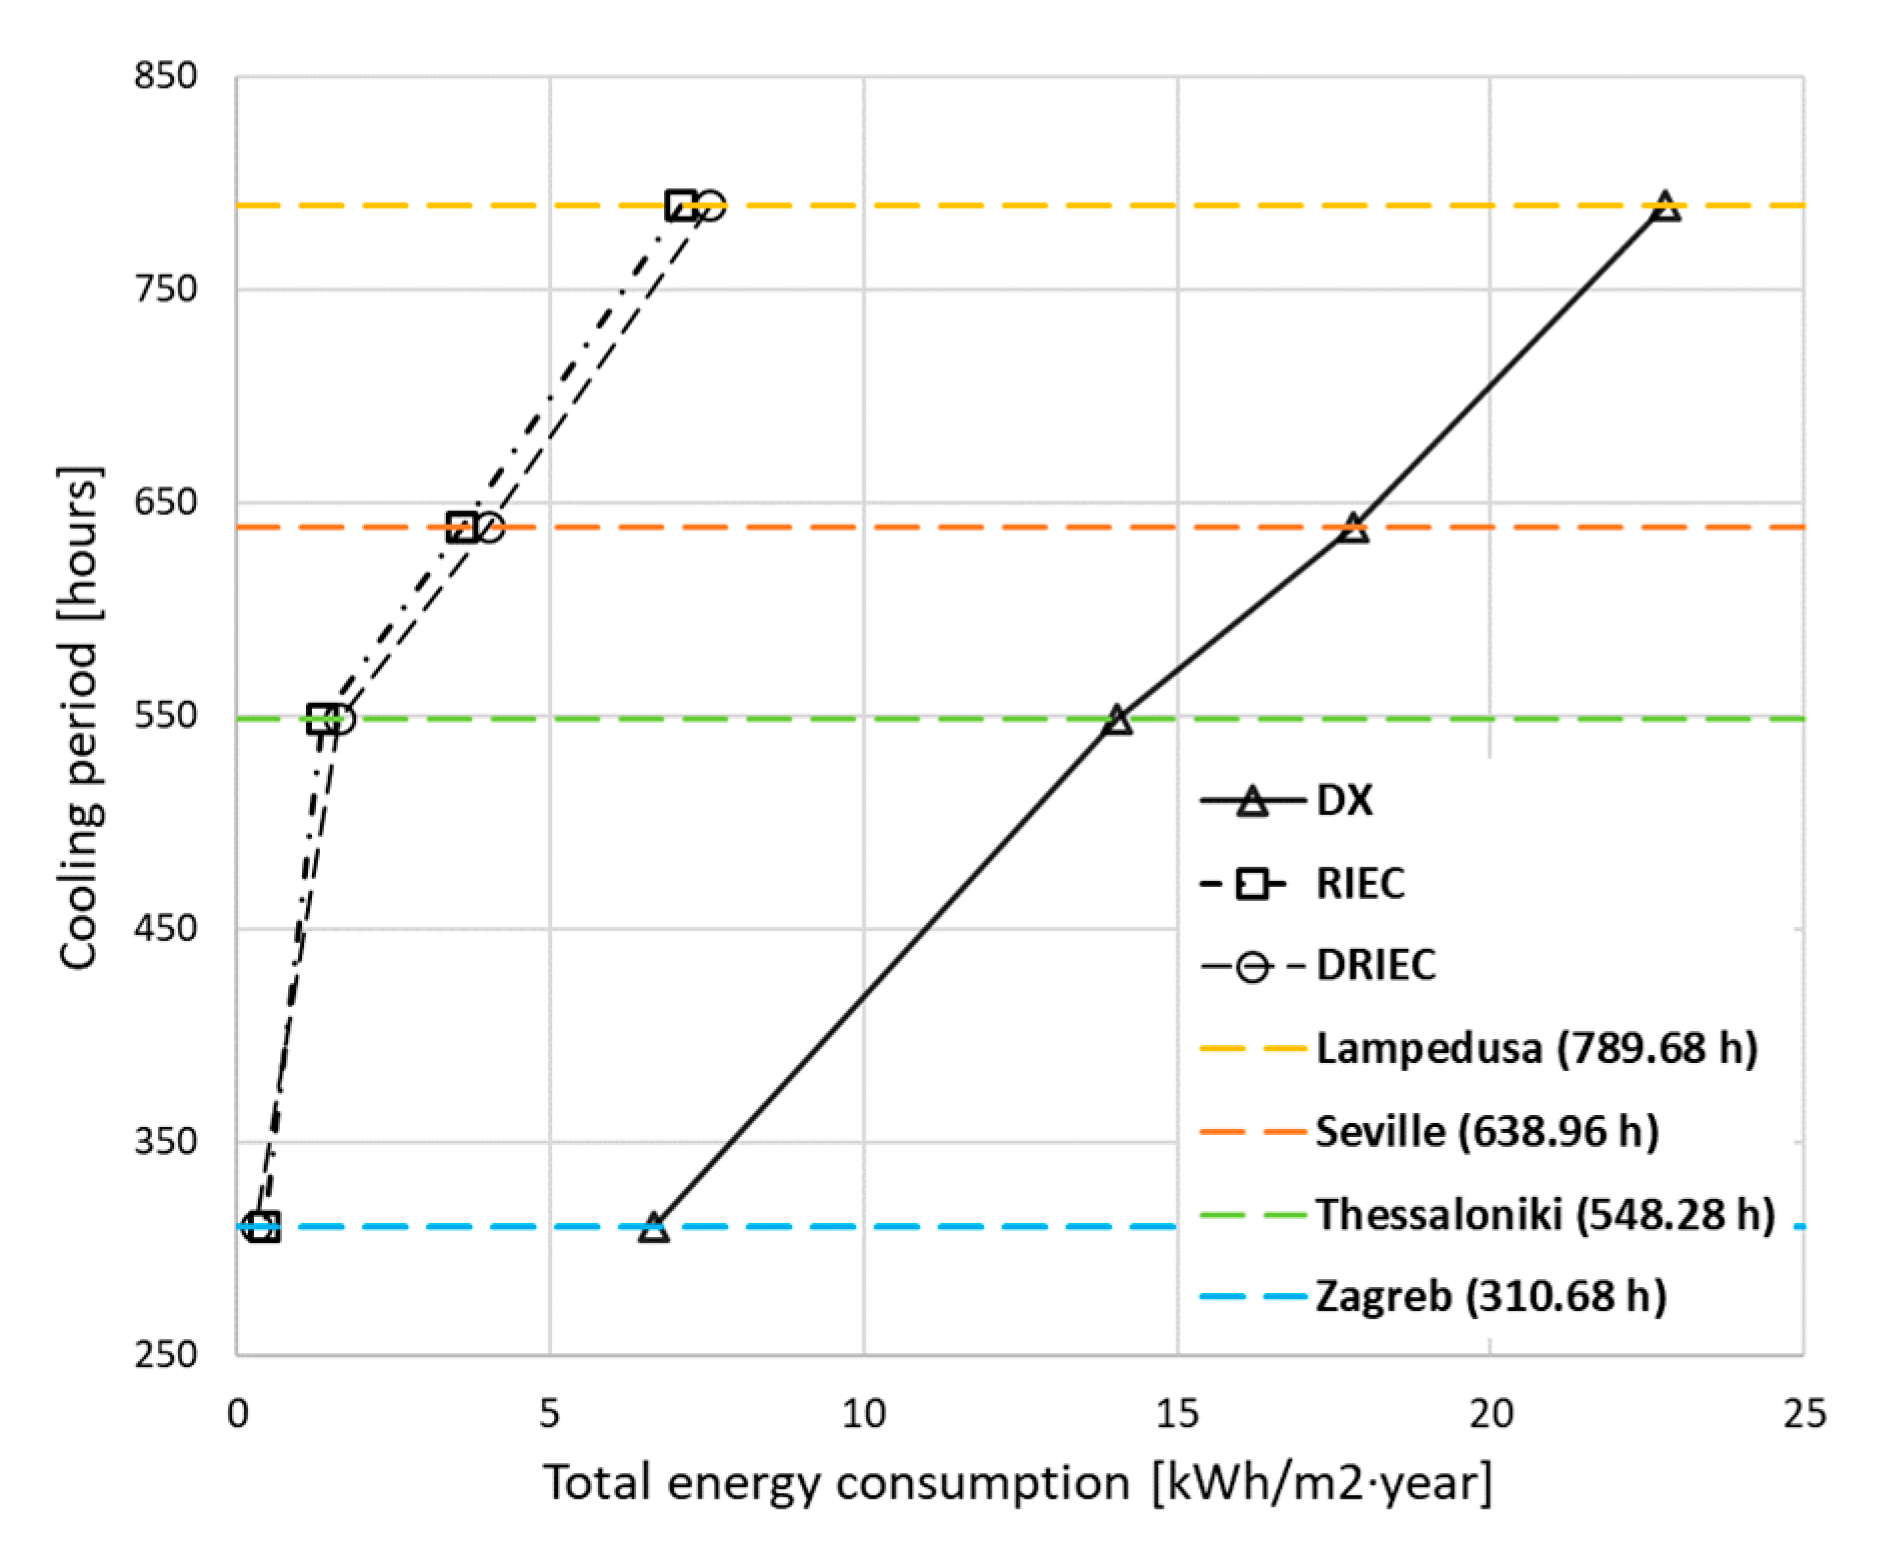
In Figure 18 the results of the influence of climatic severity on energy consumption are shown. The increase in the cooling period hours caused a higher consumption in the three systems. However, it can be observed that the slope between the different four climates was more pronounced in DX. This system reached higher values of energy consumption when it served a standard classroom than in the cases of RIEC and DRIEC. These last two had almost the same energy consumption in each climate zone.
Figure 18.
Influence of climatic severity on energy consumption indicator.
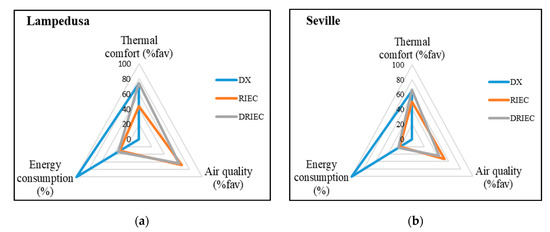
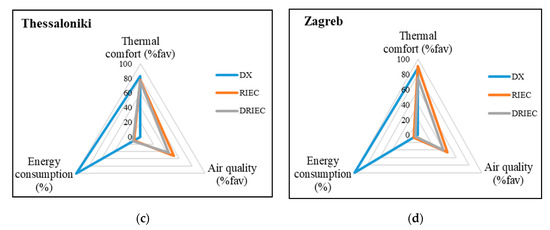
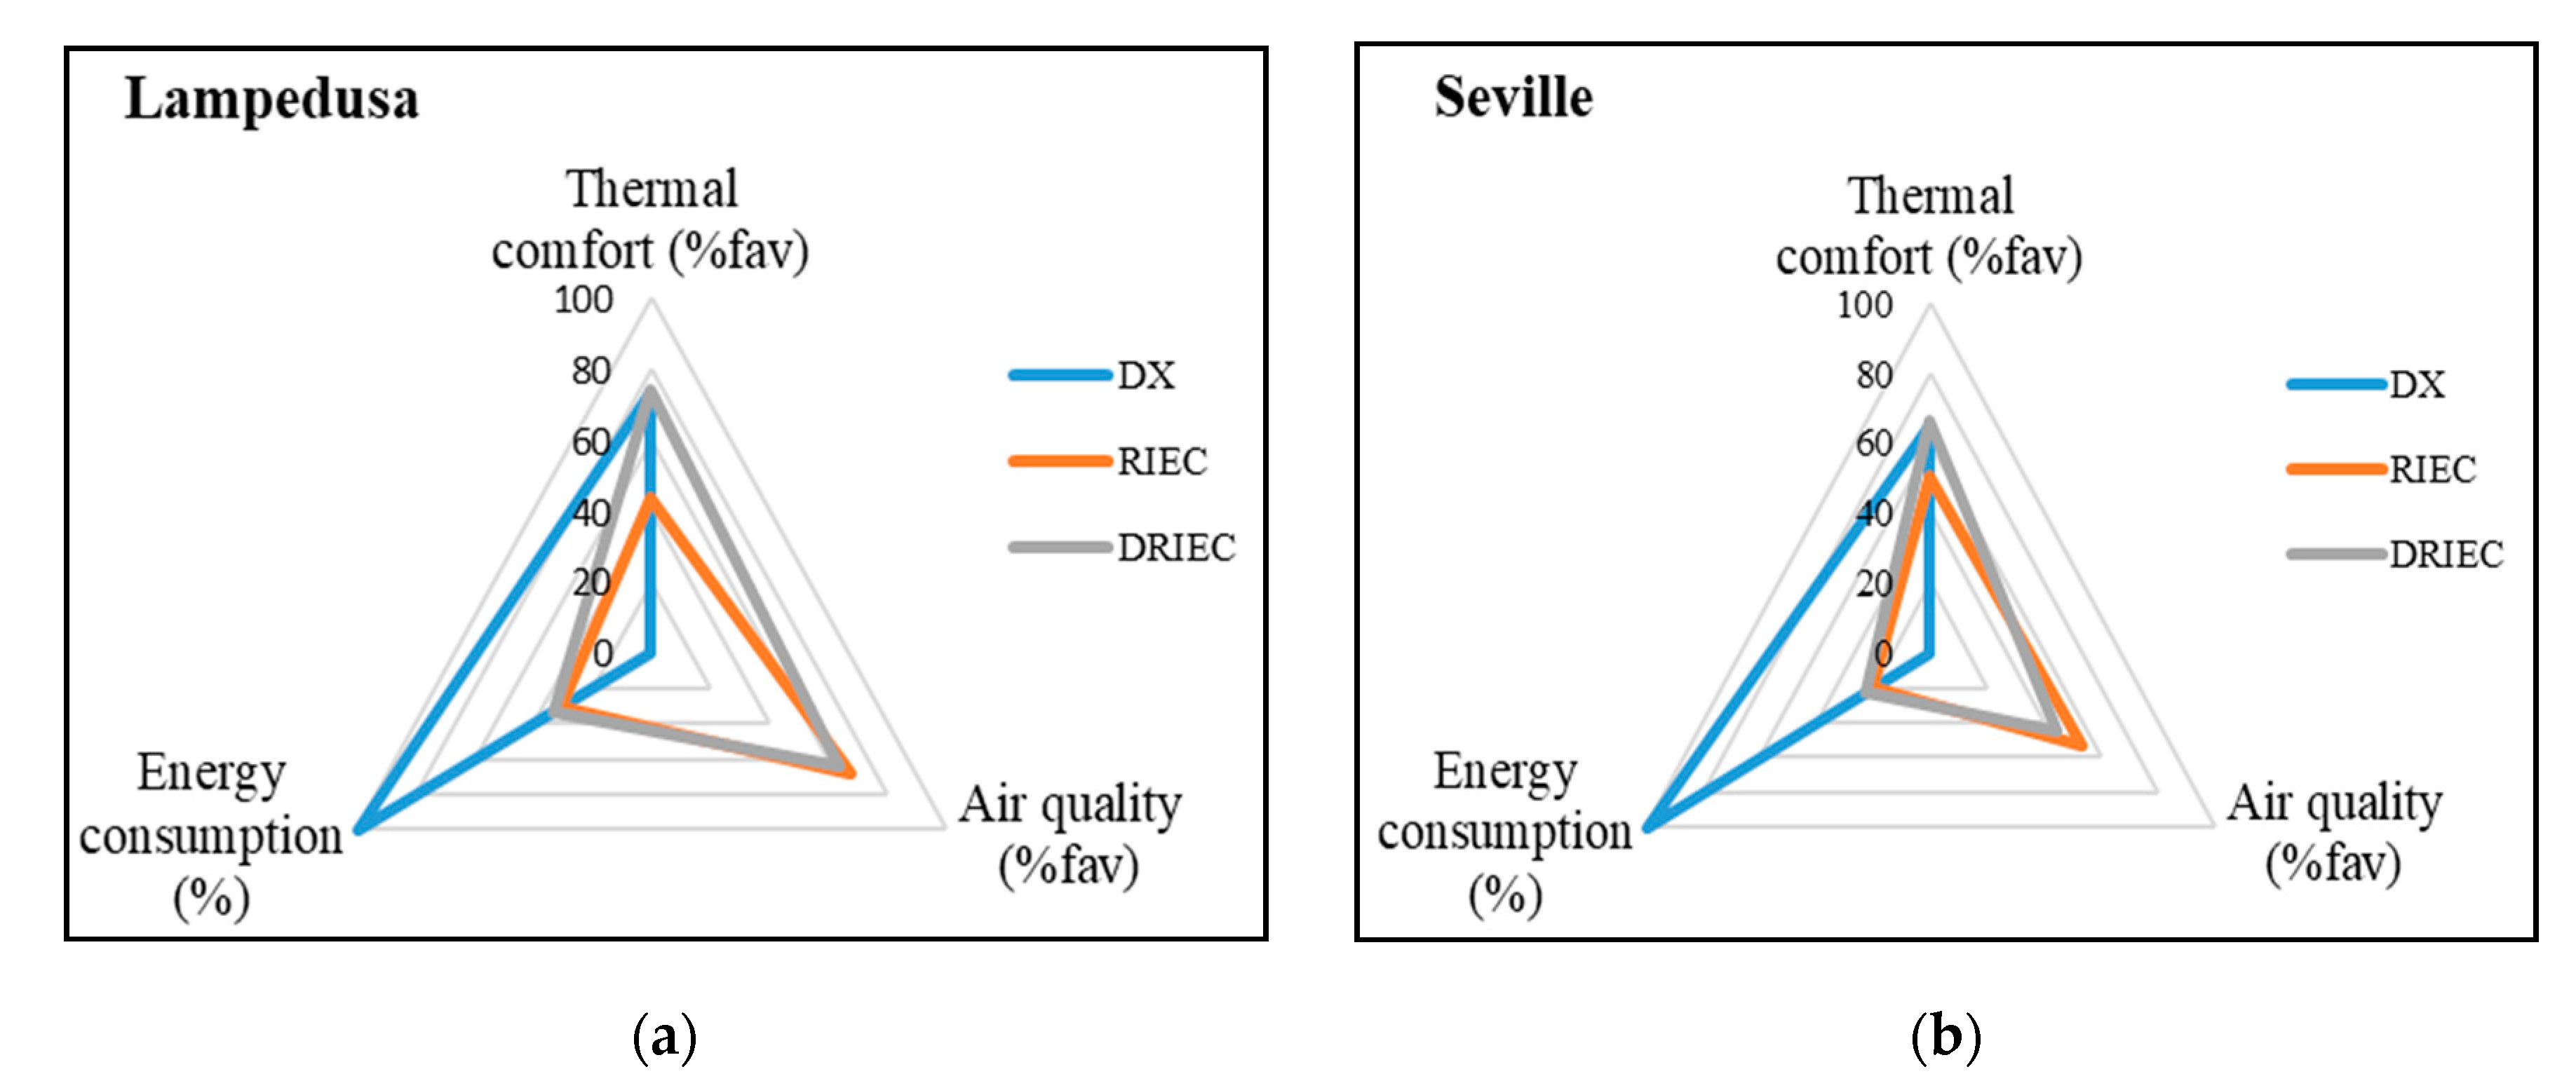
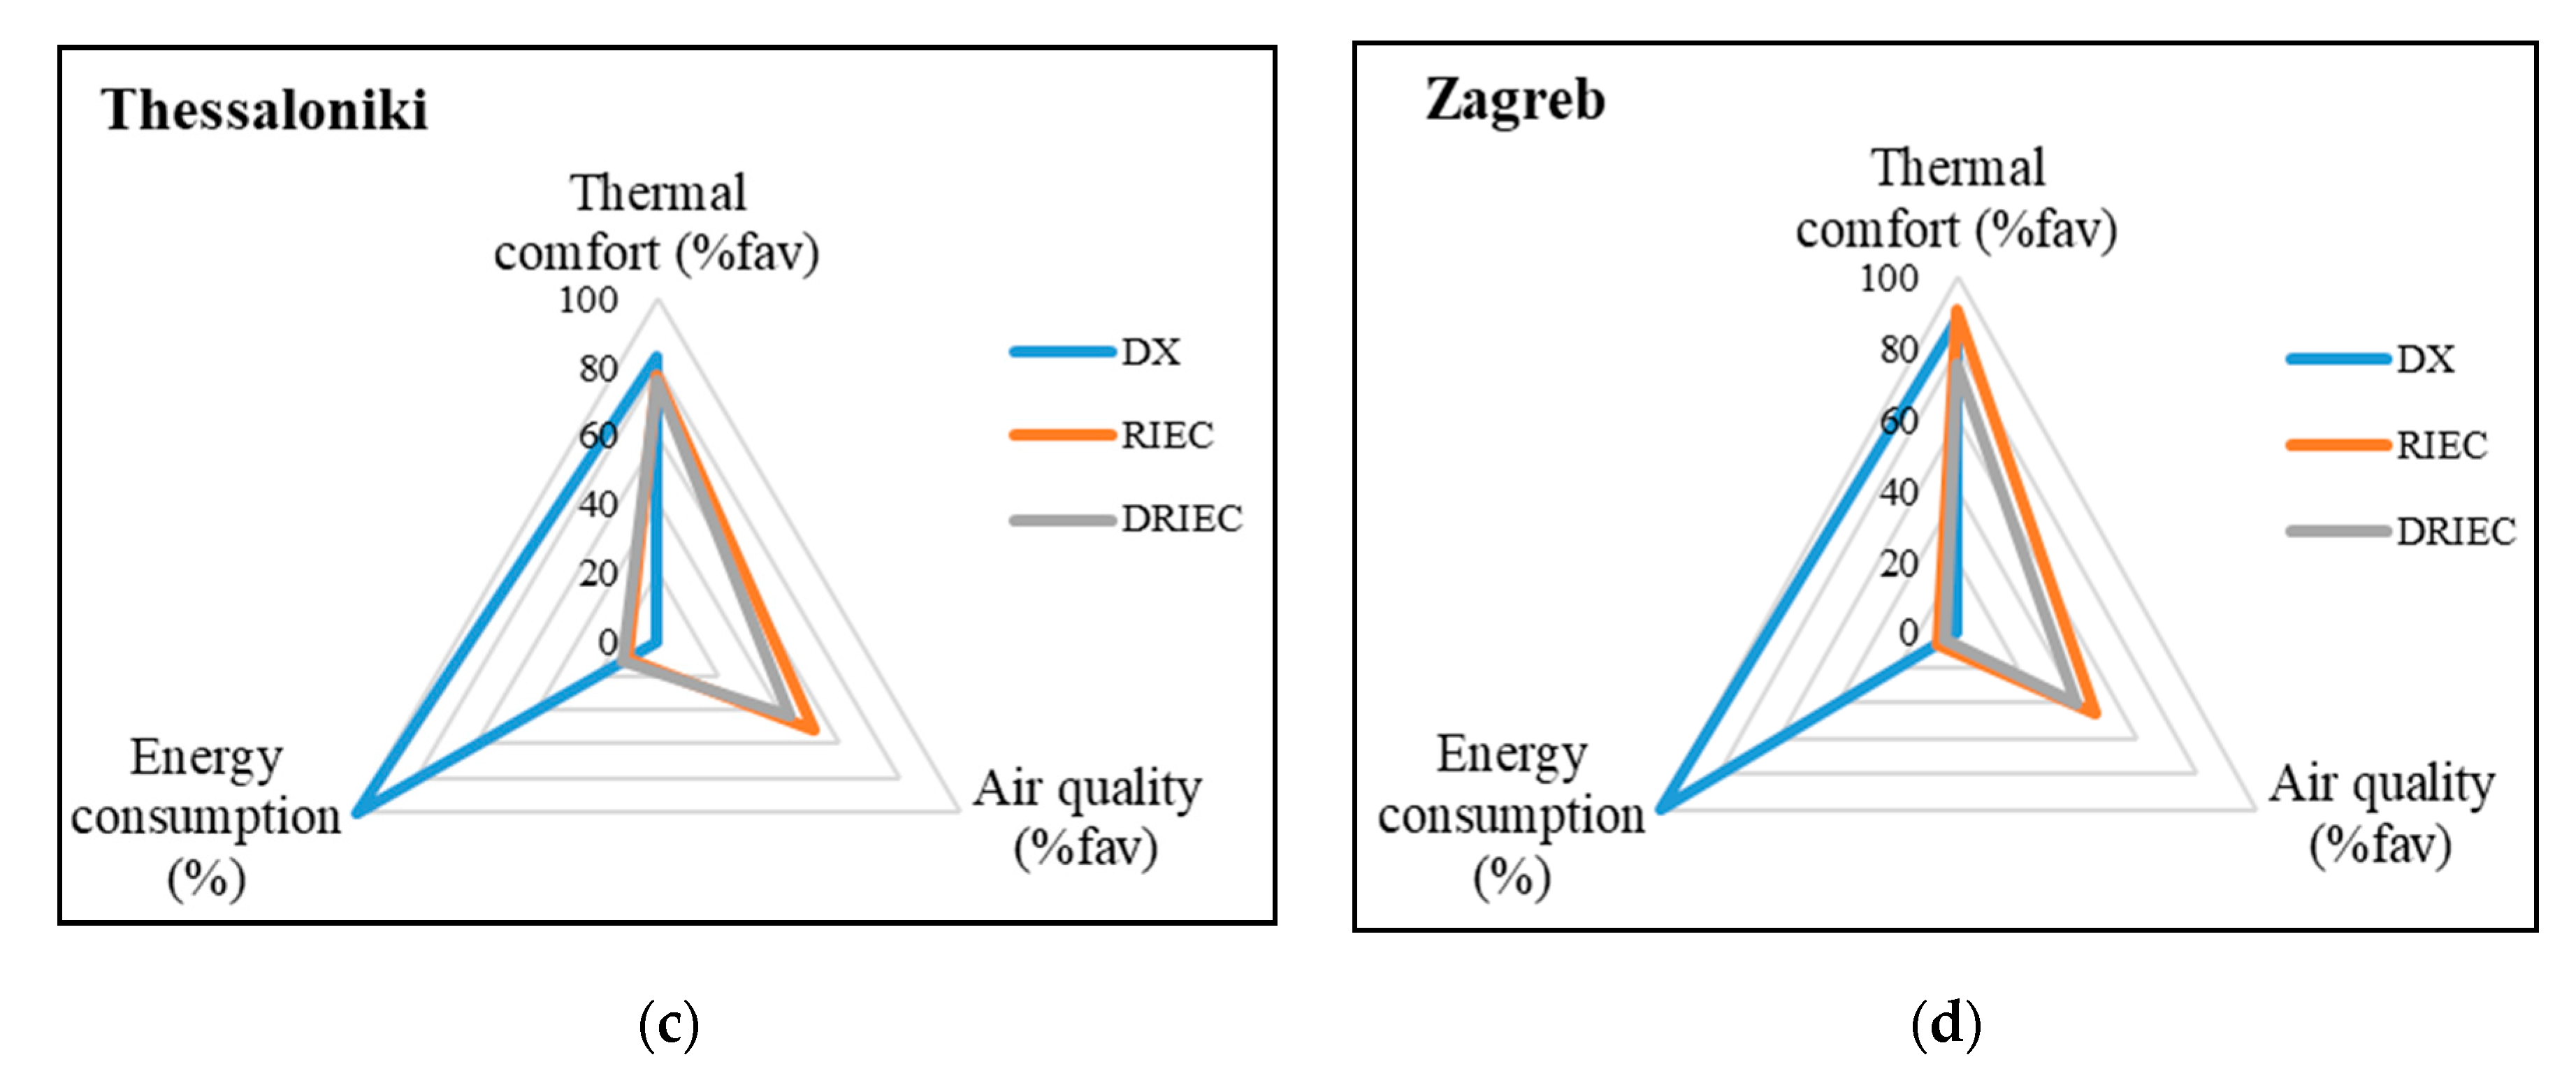
Finally, Figure 19 show the comparison between the three air-cooling systems and the four climatic zones studied, in terms of the thermal comfort, air quality and energy consumption criteria. The energy consumption results in this figure are shown as percentages with the goal to compare the three systems. DX total energy consumption was assumed as 100% in each climate zone. RIEC and DRIEC consumption percentages were calculated in function of this.
Figure 19.
Radar chart. Systems and climate zones comparison (a) Lampedusa; (b) Seville; (c) Thessaloniki and (d) Zagreb.
4. Conclusions
The thermal comfort, air quality and energy consumption of three different air-cooling systems were studied in the present work. The first air-cooling system was composed mainly of a direct expansion unit, DX, the second air-cooling system was composed mainly of a regenerative indirect evaporative cooler, RIEC and the third air-cooling system of a desiccant wheel and a regenerative indirect evaporative cooler, DRIEC. Annual energy simulations were performed considering three air-cooling systems served a standard classroom. Four climate zones, from hot zones to temperate zones in the Mediterranean area, were used to carry out this study. The conclusions obtained in this work are:
- Thermal comfort: the most favorable conditions were obtained with the DX and DRIEC systems to serve a standard classroom in Lampedusa and Seville climates, with 74.3% and 66.1% of cooling period in favorable thermal comfort conditions, respectively. The RIEC system achieved more unfavorable comfort conditions since the air supply humidity was no controlled. Due to the less climatic severity, the highest thermal comfort values were presented by the DX and RIEC for the climates of Thessaloniki and Zagreb, with percentages of 82.8% and 91.2%, respectively.
- Air quality: the air-cooling system with the longest period in favorable air quality conditions was the RIEC system for all climatic zones, due to the high outside air flow rates that was supplied to the classroom. Seville and Thessaloniki showed very similar values, 53.7% and 51.5%, respectively. The indoor conditions obtained with the DX system always were in category III, unfavorable category.
- Energy consumption: the systems with the lowest energy consumption were RIEC and DRIEC. These systems consumed up to three, four, ten and fifteen times less than the DX system, in Lampedusa, Seville, Thessaloniki and Zagreb, respectively. RIEC and DRIEC systems obtained very similar energy consumption values for each climate zone. The highest energy consumption of the DX system was mainly due to the energy consumption of the compressor. Regarding environmental impact, the RIEC and DRIEC innovative air-cooling systems could be an alternative to DX systems to reduce CO2 emissions by 68% and 78.8% in the warmest zones, Lampedusa and Seville, respectively.
The results indicated that the RIEC and the DRIEC systems have a strong potential to reduce energy consumption, improving both indoor air quality and thermal comfort.
Author Contributions
Conceptualization, M.J.R.-L., F.C. and M.R.d.A.; methodology, M.J.R.-L.; software, F.C.; validation, F.C. and M.R.d.A.; formal analysis and investigation, M.J.R.-L., F.C. and M.R.d.A.; writing—original draft preparation, M.J.R.-L.; writing—review and editing, M.J.R.-L., F.C. and M.R.d.A.; visualization and supervision, F.C. and M.R.d.A.; funding acquisition, M.R.d.A. All authors have read and agreed to the published version of the manuscript.
Funding
This research was funded by EUROPEAN UNION’S HORIZON 2020 RESEARCH AND INNOVATION PROGRAM, through the research project WEDISTRICT, reference H2020-WIDE-SPREAD2018-03-857801.
Acknowledgments
The authors acknowledge the financial support received by the European Regional Development Fund and the Andalusian Economy, Knowledge, Enterprise and University Council, Spain, through the research project HICOOL, reference 1263034 and the Postdoctoral Fellowship of the University of Cordoba, Spain and by European Union’s Horizon 2020 research and innovation program, through the research project WEDISTRICT, reference H2020-WIDESPREAD2018-03-857801.
Conflicts of Interest
The authors declare no conflict of interest.
Nomenclature
| b | estimated parameter |
| BP | bypass damper |
| CM | compressor |
| CO | condenser |
| CTE | technical building code |
| DRIEC | desiccant regenerative indirect evaporative cooler |
| DX | direct expansion |
| DW | desiccant wheel |
| EA | exhaust air |
| EEC | electric energy consumption (cooling period) (kWh m−2 year−1) |
| EV | evaporator |
| f | factor |
| F | fan |
| h | heat transfer coefficient (W m−2 K−1) |
| HC | heating coil |
| HVAC | heating, ventilating and air conditioning |
| IEC | indirect evaporative cooler |
| I | insulation (m2 K W−1) |
| k | number of parameters |
| M | metabolic rate (W m−2) |
| MB | mixing box |
| mass flow (kg s−1) | |
| nZEB | nearly zero energy buildings |
| OA | outdoor air |
| P | static pressure (Pa) |
| PPD | predicted percentage dissatisfied (%) |
| PMV | predicted mean vote (-) |
| capacity (kW) | |
| RA | return air |
| RIEC | regenerative indirect evaporative cooler |
| S | area (m2) |
| SA | supply air |
| T | dry bulb temperature (°C) |
| U | heat transfer coefficient (W m−2 K−1) |
| v | air velocity (m s−1) |
| V | expansion valve; valve |
| volumetric air flow rate (m3 h−1) | |
| W | effective mechanical power (W m−2) |
| electric power consumption (kW) | |
| wfTC | thermal comfort indicator (%) |
| wfAQ | air quality indicator (%) |
| X | input variable |
| estimated variable | |
| Greek letters | |
| Δ | increase |
| ∑ | sum |
| Ω | specific mass air flow rate (kg s−1 m−3) |
| ε | efficiency (-) |
| ρ | density (kg m−3) |
| ω | humidity ratio (g kg−1) |
| Subscripts | |
| a | air |
| abs | absorbed |
| avg | average |
| c | convection |
| cl | clothing surface |
| e | evaporator |
| i | inlet |
| l | latent |
| N | nominal |
| o | outlet |
| OA | outdoor air |
| p | process air |
| r | regeneration |
| s | sensible |
| SP | set-point |
| TW | three-way |
| w | water |
| wb | wet bulb |
| Superscripts | |
| ‘ | dimensionless value |
References
- Directive 2010/31/EU. European Parliament and of the Council of 19 May 2010 on the Energy Performance of Buildings (Recast); OJ L 153, 18.6.2010, p. 13 - 35 (BG, ES, CS, DA, DE, ET, EL, EN, FR, IT, LV, HU, MT, NL, PL, PT, RO, SK, SL, FI, SV) Special edition in Croatian; EUR-Lex: Brussels, Belgium, 2010; Chapter 12; Volume 003, pp. 124–146. [Google Scholar]
- Congedo, P.M.; Baglivo, C.; D’Agostino, D.; Zacà, I. Cost-optimal design for nearly zero energy office buildings located in warm climates. Energy 2015, 91, 967–982. [Google Scholar] [CrossRef] [Scilit]
- Andriamamonjy, A.; Klein, R. A modular, open system for testing ventilation and cooling strategies in extremely low energy lecture rooms. Eff. Ventil. High Perf. Build. 2015, 2015, 416–425. [Google Scholar]
- Enteria, N.; Cuartero-Enteria, O.; Sawachi, T. Review of the advances and applications of variable refrigerant flow heating, ventilating, and air-conditioning systems for improving indoor thermal comfort and air quality. Int. J. Energy Environ. Eng. 2020, 11, 459–483. [Google Scholar] [CrossRef] [Scilit]
- Selamat, H.; Haniff, M.F.; Sharif, Z.M.; Attaran, S.M.; Sakri, F.M.; Al’Hapis Bin Abdul Razak, M. Review on HVAC system optimization towards energy saving building operation. Int. Energy J. 2020, 20, 345–357. [Google Scholar]
- Chen, W.; Fang, G.; Wang, C.; Weng, W.; Ming-Yin, C.; Deng, S.; Liu, X.; Yan, H. An experimental study on a novel direct expansion based temperature and humidity independent control air conditioning system. Energy Procedia 2019, 158, 2237–2243. [Google Scholar] [CrossRef] [Scilit]
- Yang, L.; Deng, S.; Fang, G.; Li, W. Improved indoor air temperature and humidity control using a novel direct-expansion-based air conditioning system. J. Build. Eng. 2021, 43, 102920. [Google Scholar] [CrossRef] [Scilit]
- Almeida, R.M.S.F.; De Freitas, V.P. Indoor environmental quality of classrooms in Southern European climate. Energy Build. 2014, 81, 127–140. [Google Scholar] [CrossRef] [Scilit]
- Soto Francés, V.M.; Serrano Lanzarote, A.B.; Valero Escribano, V.; Navarro Escudero, M. Improving schools performance based on SHERPA project outcomes: Valencia case (Spain). Energy Build. 2020, 225. [Google Scholar] [CrossRef] [Scilit]
- Rambhad, K.S.; Walke, P.V.; Tidke, D.J. Solid desiccant dehumidification and regeneration methods—A review. Renew. Sustain. Energy Rev. 2016, 59, 73–83. [Google Scholar] [CrossRef] [Scilit]
- Jani, D.B.; Mishra, M.; Sahoo, P.K. Solid desiccant air conditioning—A state of the art review. Renew. Sustain. Energy Rev. 2016, 60, 1451–1469. [Google Scholar] [CrossRef] [Scilit]
- Delfani, S.; Karami, M. Transient simulation of solar desiccant/M-Cycle cooling systems in three different climatic conditions. J. Build. Eng. 2020, 29, 101152. [Google Scholar] [CrossRef] [Scilit]
- Sudhakar, K.; Jenkins, M.S.; Mangal, S.; Priya, S.S. Modelling of a solar desiccant cooling system using a TRNSYS-MATLAB co-simulator: A review. J. Build. Eng. 2019, 24, 100749. [Google Scholar] [CrossRef] [Scilit]
- El-Maghlany, W.M.; ElHefni, A.A.; ElHelw, M.; Attia, A. Novel air conditioning system configuration combining sensible and desiccant enthalpy wheels. Appl. Therm. Eng. 2017, 127, 1–15. [Google Scholar] [CrossRef] [Scilit]
- Angrisani, G.; Minichiello, F.; Roselli, C.; Sasso, M. Experimental analysis on the dehumidification and thermal performance of a desiccant wheel. Appl. Energy 2012, 92, 563–572. [Google Scholar] [CrossRef] [Scilit]
- Comino, F.; Ruiz de Adana, M.; Peci, F. Experimetal study of the moisture removal capacity of a desiccant wheel activated at low and high temperature. In Proceedings of the ClLIMA, 12th REHVA World Congress; Aalborg University, Department of Civil Engineering, Aalborg, Denmark, 22–25 May 2016. [Google Scholar]
- White, S.D.; Kohlenbach, P.; Bongs, C. Indoor temperature variations resulting from solar desiccant cooling in a building without thermal backup. Int. J. Refrig. 2009, 32, 695–704. [Google Scholar] [CrossRef] [Scilit]
- Goldsworthy, M.; White, S. Optimisation of a desiccant cooling system design with indirect evaporative cooler. Int. J. Refrig. 2011, 34, 148–158. [Google Scholar] [CrossRef] [Scilit]
- Elgendy, E.; Mostafa, A.; Fatouh, M. Performance enhancement of a desiccant evaporative cooling system using direct/indirect evaporative cooler. Int. J. Refrig. 2015, 51, 77–87. [Google Scholar] [CrossRef] [Scilit]
- Mumovic, D.; Davies, M.; Pearson, C.; Pilmoor, G.; Ridley, I.; Altamirano-Medina, H.; Oreszczyn, T. A comparative analysis of the indoor air quality and thermal comfort in schools with natural, hybrid and mechanical ventilation strategies. Proc. Clima WellBeing Indoors 2007, 2007, 8. [Google Scholar]
- Breesch, H.; Merema, B.; Versele, A. Ventilative cooling in a school building: Evaluation of the measured performances. Fluids 2018, 3, 68. [Google Scholar] [CrossRef] [Scilit]
- Heracleous, C.; Michael, A. Thermal comfort models and perception of users in free-running school buildings of East-Mediterranean region. Energy Build. 2020, 215, 109912. [Google Scholar] [CrossRef] [Scilit]
- Cellura, M.; Guarino, F.; Longo, S.; Mistretta, M. Natural Ventilative Cooling in School Buildings in Sicily. 2016, pp. 12–16. Available online: https://www.rehva.eu/fileadmin/REHVA_Journal/REHVA_Journal_2016/RJ_issue_1/P.12/12-16_RJ1601_WEB.pdf (accessed on 19 July 2021).
- Bienvenido-Huertas, D.; Pulido-Arcas, J.A.; Rubio-Bellido, C.; Pérez-Fargallo, A. Feasibility of adaptive thermal comfort for energy savings in cooling and heating: A study on Europe and the Mediterranean basin. Urban Clim. 2021, 36. [Google Scholar] [CrossRef] [Scilit]
- EN 16798-1:2019 Energy Performance of Buildings—Ventilation for Buildings—Part 1: Indoor Environmental Input Parameters for Design and Assessment of Energy Performance of Buildings Addressing Indoor Air Quality, Thermal Environment, Lighting and Acoustics—Module M1. 2020, pp. 1–87. Available online: https://standards.iteh.ai/catalog/standards/cen/b4f68755-2204-4796-854a-56643dfcfe89/en-16798-1-2019 (accessed on 30 October 2020).
- CEN/TR 16798-2:2019 Energy Performance of Buildings—Ventilation for Buildings—Part 2: Interpretation of the Requirements in EN 16798-1—Indoor Environmental Input Parameters for Design and Assessment of Energy Performance of Buildings Addressing Indoor Air Quality, ther. 2019, p. 88. Available online: https://standards.iteh.ai/catalog/standards/cen/554e05d6-df03-4e67-8907-52a8dbd298f5/cen-tr-16798-2-2019 (accessed on 30 October 2020).
- Comino, F.; Ruiz de Adana, M.; Peci, F. Energy saving potential of a hybrid HVAC system with a desiccant wheel activated at low temperatures and an indirect evaporative cooler in handling air in buildings with high latent loads. Appl. Therm. Eng. 2018, 131, 412–427. [Google Scholar] [CrossRef] [Scilit]
- Comino, F.; Castillo González, J.; Navas-Martos, F.J.; Ruiz de Adana, M. Experimental energy performance assessment of a solar desiccant cooling system in Southern Europe climates. Appl. Therm. Eng. 2020, 165, 114579. [Google Scholar] [CrossRef] [Scilit]
- Peng, Y.; Rysanek, A.; Nagy, Z.; Schlüter, A. Using machine learning techniques for occupancy-prediction-based cooling control in office buildings. Appl. Energy 2018, 211, 1343–1358. [Google Scholar] [CrossRef] [Scilit]
- Kim, J.; Hong, T.; Koo, C.W. Economic and environmental evaluation model for selecting the optimum design of green roof systems in elementary schools. Environ. Sci. Technol. 2012, 46, 8475–8483. [Google Scholar] [CrossRef] [Scilit] [PubMed]
- Congedo, P.M.; D’Agostino, D.; Baglivo, C.; Tornese, G.; Zacà, I. Efficient solutions and cost-optimal analysis for existing school buildings. Energies 2016, 9, 851. [Google Scholar] [CrossRef] [Scilit]
- Chan, W.R.; Li, X.; Singer, B.C.; Pistochini, T.; Vernon, D.; Outcault, S.; Sanguinetti, A.; Modera, M. Ventilation rates in California classrooms: Why many recent HVAC retrofits are not delivering sufficient ventilation. Build. Environ. 2020, 167, 106426. [Google Scholar] [CrossRef] [Scilit]
- Fisk, W.J. The ventilation problem in schools: Literature review. Indoor Air 2017, 27, 1039–1051. [Google Scholar] [CrossRef] [Scilit]
- Klein, S.A. TRNSYS 17: A Transient System Simulation Program. 2006. Available online: https://ci.nii.ac.jp/naid/10003777297/ (accessed on 2 November 2020).
- Ministerio de Industria Energía y Turismo RITE. Reglamento de Instalaciones Térmicas en los edificios. Versión Consolidada. Bol. Of. Estado 2013, 137. Available online: https://energia.gob.es/desarrollo/EficienciaEnergetica/RITE/Reglamento/RDecreto-1027-2007-Consolidado-9092013.pdf. (accessed on 8 November 2020).
- CIAT. Available online: http://www.grupociat.es/ (accessed on 16 November 2020).
- Seeley International. Climate Wizard. Available online: https://www.seeleyinternational.com/eu/commercial/brands/climate-wizard-emea/ (accessed on 10 December 2020).
- ProFlute Technology Leader. Available online: https://proflute.se/ (accessed on 14 December 2020).
- Society 8400. ASHRAE STANDARD 90.1 Energy Standard for Buildings Except Low-Rise Residential Buildings. 2007, pp. 358–417. Available online: https://ashrae.iwrapper.com/ASHRAE_PREVIEW_ONLY_STANDARDS/STD_90.1_2019 (accessed on 20 November 2020).
- Weather Data. Trnsys 17, vol. 8. Available online: http://www.trnsys.com/ (accessed on 5 December 2020).
- Comité técnico ISO/TC 159 UNE-EN ISO 7730. Ergonomía del ambiente térmico. 2006. Available online: https://www.une.org/encuentra-tu-norma/busca-tu-norma/norma?c=N0037517 (accessed on 15 December 2020).
- Ministerio de Fomento (España) Documento Básico HE Ahorro de Energía 2019. Código Técnico la Edif. 2019, 1–129.
- Carbon Footprint Carbon Footprint Country Specific Electricity Grid Greenhouse Gas Emission Factors. 2019, pp. 1–10. Available online: https://www.carbonfootprint.com/docs/2020_07_emissions_factors_sources_for_2020_electricity_v1_3.pdf (accessed on 14 December 2020).

Publisher’s Note: MDPI stays neutral with regard to jurisdictional claims in published maps and institutional affiliations. |
© 2021 by the authors. Licensee MDPI, Basel, Switzerland. This article is an open access article distributed under the terms and conditions of the Creative Commons Attribution (CC BY) license (https://creativecommons.org/licenses/by/4.0/).