Article

Connecting Blue Economy and Economic Growth to Climate Change: Evidence from European Union Countries

by
Roxana Maria Bădîrcea
1,
Alina Georgiana Manta
1,
Nicoleta Mihaela Florea
1,
Silvia Puiu
2,*,
Liviu Florin Manta
3 and
Marius Dalian Doran
4
1
Department of Finance, Banking and Economic Analysis, Faculty of Economics and Business Administration, University of Craiova, 13 A.I. Cuza Street, 200585 Craiova, Romania
2
Department of Management, Marketing and Business Administration, Faculty of Economics and Business Administration, University of Craiova, 13 A.I. Cuza Street, 200585 Craiova, Romania
3
Department of Mechatronics and Robotics, Faculty of Automation, Computers and Electronics, University of Craiova, 107 Bld. Decebal, 200440 Craiova, Romania
4
Doctoral School of Economic Sciences, Faculty of Economics and Business Administration, University of Craiova, 13 A.I. Cuza Street, 200585 Craiova, Romania
*
Author to whom correspondence should be addressed.
Energies 2021, 14(15), 4600; https://doi.org/10.3390/en14154600
Submission received: 28 May 2021 / Revised: 23 July 2021 / Accepted: 27 July 2021 / Published: 29 July 2021

Abstract

:
Blue Economy represents a new and interesting concept on a global level, both from the economic potential but also by the fact that it can be used to reduce environmental degradation. The main goal of this research is to identify the causality relations between the greenhouse gas emissions, the Blue Economy and economic growth based on a panel of annual data from the 28 countries that are members of the European Union (EU) over the 2009–2018 period. After applying stationarity and cointegration tests, the long term cointegration coefficients shall be determined with the help of the fully modified ordinary least squares (FMOLS) estimator. Granger causality estimation based on the vector error correction model (VECM) was applied to identify the causality relationship between the variables and to detect the direction of causality. Based on the identified causality relations, the Blue Economy has a significant influence on greenhouse gas emissions in the long run. Unidirectional causality relations were identified from the economic growth of greenhouse gas emissions in the long term, as well as from the greenhouse gas emissions on economic growth in the short term.

Graphical Abstract

1. Introduction

There are no doubts that the economy of the seas and oceans is needed for the welfare and the prosperity of humankind. Seas and oceans represent safe sources of food, energy, minerals, health and free time, and they also provide the transport of more than 90% of traded goods worldwide [1].
There is also the need for sustainable use of the ocean and its resources, so as not to threaten the welfare and prosperity of the world. This sustainable use of oceans and seas cannot be accomplished without the coherent management of all sectors of human activities generating effects.
‘Blue Economy’ is a term widely used as of late in the reference literature regarding the government of seas and oceans. The interest for this term appeared along with the depletion of the terrestrial resources and orientation towards the economic opportunities included inside and beneath the seas or oceans [2].
Although it was adopted as a concept, but also as an objective for the development of policies and investments, there is still no widely accepted definition of the term Blue Economy. In some definitions, Blue Economy means using the seas and its resources for a sustainable economic development, whereas in others it only refers to any economic activity within the maritime sector, regardless of whether it is sustainable or not [3]. The definition of the concept of Blue Economy sets to combine the ocean-based development opportunities with environmental management and protection. The concept can be considered according to the most recent trends in environmental management: environment sustainability, economic development and social equity or inclusion [4]. In other definitions, the term is associated with long-term sustainable development due to the balancing of economic benefits with the health of the world’s oceans and seas [5].
According to OECD [2], the global Blue Economy is going to grow faster than the general economy, almost doubling by 2030. At the same time, the impact on the environment and the loss of natural resources caused by the unsustainable economic activity related to oceans and seas affect the resource generating source relying on such growth. In consequence, we need concerted effort for the protection and revival of the health of the oceans and seas. The importance of harmonizing the ocean, coastline and marine economic activities was emphasized with the values imposed by the sustainable economy to stimulate the growth of sustainable development [6].
To ensure a balance between the use of coastal resources and the maximization of economic and social benefits, the integrated coastal zones management (ICZM) system was implemented, through which “conservation and development become compatible objectives”. Thus, at the European level, a proposal was adopted for a Directive establishing a framework for maritime spatial planning and integrated coastal management [7] which aims to create the necessary framework to develop Europe’s Blue Economy.
The purpose of this paper is to investigate the causality relations between the blue economy, climate change, and the economic growth in EU countries and Great Britain. The study of these relations is important because they could efficiently manage the use of the economic potential of the seas and oceans and reach all the sustainable development objectives, including the reduction of greenhouse gas emissions. Up to the present, there are no studies on the causality relations among greenhouse gas emissions and the Blue Economy. Instead, most of the studies are focused on the influence of economic growth on the performance of the environment or the influence of climate change on the Blue Economy.
The structure of the paper is as follows: Section 2 presents a short revision of the literature regarding the Blue Economy and the effects generated by the activities in the maritime field on the environment. Section 3 reveals the variables of the analysis and the methodology used. Section 4 presents the results and Section 5 describes the discussions. Section 6 points out the conclusions of the study.

2. Literature Review

The connection between the Blue Economy and climate change is bidirectional: on one hand, there are sectors of the Blue Economy that are not sustainable and contribute to climate change and an increase of greenhouse gas (GHG) emissions; on the other hand, climate change determined by economic activities (not only by Blue Economy) affect the quality of coastal tourism, the quality of oceans and of people living near a coastal area.
There are a many papers investigating the effects of environmental changes on the seas and oceans, but they are less interested in the effects of maritime activities on climate change. This is why we systematically analyzed works in the literature that highlighted the effects of maritime activities on the environment: the effects of economic growth on ocean health, the effects of aquaculture, the effects of maritime transport, the effects of renewable energy production, the effects of fishing and the importance of carbon storage, seas and oceans.
Therefore, these studies analyze economic growth simultaneously with the health of the oceans in the Caribbean [8], but also focus on the political framework and governance for the transition to the Blue Economy, and not on the quantization of the relations and effects between the two (economic growth and the health of the oceans).
More papers analyze the way in which aquaculture is generating waste affecting the maritime ecosystem. Hall et al. [9] analyzed the way in which the fishing farms might affect the environment especially regarding the nitrogen used to feed the fish. Porrello et al. [10] (2003) quantified the nutritional components N and P evacuated in the Lagoon Orbetello (Tuscany, Italy).
Acknowledging that aquaculture is the food sector with the highest growth in the past 20 years, Robb et al. [11] analyzed the effects of aquaculture on greenhouse gas emissions, because these appear not only in the production process, but also in the entire process of transmitting the raw material to the final consumers.
In the study entitled, The Ocean as a Solution to Climate Change: Five Opportunities for Action, Hoegh-Guldberg et al. [12] reached the conclusion that the opportunities offered by the oceans and seas might lead to a reduction of the greenhouse gas emissions (GES) on a global level with almost 4 billion tons of carbon dioxide (CO2) per year 2030 more than 11 billion tons per year in 2050. Therefore, they analyzed the five fields where climate actions can be taken to reduce greenhouse gas emissions: renewable energy from the ocean; ocean and maritime transport coastal and marine ecosystems; a food system oriented towards the products from seas and oceans (wild fishing, aquaculture); carbon deposits on the bottom of the seas and oceans.
As the United Nations Environment Programme (2019) [13] mentions, GHG emissions “are depriving … oceans of oxygen”, and oceans attract 93% of all GHGs. The consequences of GHG on oceans are important and have a direct impact on water temperature, sea levels and marine life. The entire blue ecosystem is thus affected. These changes should lead to an increased interest in protecting water and developing a sustainable Blue Economy that does not maintain this vicious circle of GHGs produced by economic activities related to oceans and seas.
Reaching the objective proposed by the Paris Agreement of reducing the greenhouse gas emissions proved to not be enough to provide the global temperature with 2 °C [14]. That is why the interest for the elimination of carbon dioxide from the air includes capturing and depositing the carbon.
Adams and Caldeira [15] studied the effects of CO2 capturing and injection on the bank of the oceans on climate change, and analyzed the various injection methods and costs compared to other storage methods. As compared to other methods, ocean injection reduces the maximum CO2 concentration and slows down the growth rhythm on the level of the atmosphere and on the level of the surface of the ocean. With all these advantages, the CO2 injection in oceans leads to the increase of alkalinity, causing more studies to identify the local impact of this growth and the response of the ecosystem to these injections [16]. Widdicombe et al. [17] considered that the impact of the acidification of the oceans due to the oceans’ absorption of CO2 is complex, and must be assessed based on the growth of the effects caused by climate change, particularly, the warming of the oceans.
The cultivation of seaweed generates, among the various advantages for the coastline affected by eutrophic, hypoxic or acid conditions, the possibility of taking over a CO2 quantity which could help in the fight against climate change [18].
Regarding maritime transport, its effects on air and ocean waters have been identified and several steps have been proposed to reduce GHG emissions with various results, namely: emissions controls, voluntary agreements, environmental indexing, taxation, and tradable permits [19]. It is considered that without the application of technological solutions, regulations and implementation mechanisms are not sufficient.
Another paper [20] highlighted that ship owners are required by a series of regulations to invest in ships that use new hybrid and electric technologies that reduce global warming, however they are currently unprofitable from a financial standpoint. This is the use of electric ferries and hydrogen fuel which, compared to conventional diesel ships, leads to a reduction in CO2 emissions of up to 90%, including NOx, SOx emissions.
According to the European Commission (2020a) [21], the carbon dioxide (CO2) generated by water transportation, capture fisheries and aquaculture decreased between 2009 and 2017 both per euro of GVA and euro of turnover. The GVA and turnover increased for these sectors of the Blue Economy and at the same time the CO2 decreased for water transportation and just slightly increased for capture fisheries and aquaculture. Still, the report mentions that shipping emissions are still important—138 million tons of CO2 in 2018. This represents almost 4% of the CO2 emissions in the EU, according to the European Commission (2020b) [22], a third being generated by container ships. One of the solutions could be investments in a new fleet that is more efficient in terms of its carbon footprint. As a first step in reducing CO2 emissions from maritime transportation in the EU, the EU MRV Regulation was adopted [23]. Thus, companies must monitor and report their shipping emissions to have a better understanding at a country- and European-level and be able to implement adequate measures for reducing CO2 emissions by considering the type of ship, its age or the type of fuel used.
In a paper consisting of a revision of the literature regarding the potential of reducing greenhouse gas emissions in maritime transport, Bouman et al. [24] noticed that no single measure is enough in produce significant results, but a reduction of more than 75% by 2050 may be reached if political measures and field regulations are combined. In addition, implementation should be supported by the results of studies that address multiple effects and measures at the same time.
Countries with access to seas and oceans are increasingly interested the seas and oceans as attractive sources of renewable energy. With all the advantages that this energy has, we must consider the fact that many marine animals and birds are already affected by human activities such as fishing, coastal tourism development, marine transport and extraction from seas and oceans, and generating this type of energy might affect them even more [25].
New technological discoveries in the field of producing renewable energy [26], such as floating turbines, might lead to the extension of the aeolian optimum area and reduction in the environmental impact to provide a sustainable Blue Growth.
The Food and Agriculture Organization of the United Nations (FAO) underlined the importance of fishing and aquaculture for nourishment, but also for the welfare of people since millions of people are employed in these fields. This sector does not lack challenges because there is the need to reduce the fish stock below the level of political sustainability, to provide the correct treatment of the disease and for the marine biosecurity [27].
On a European level, the Blue Growth strategy is oriented towards the five sectors identified as having a potential for growth: aquaculture, coastline tourism, blue energy, marine biotechnology, and marine mining [28]. The coastline tourism proved to be the largest sector of Blue Economy, but also the one generating the highest challenges for the environment. The blue energy sector showed great success on a European level, because the EU is a global leader in wind and ocean energy. The aquaculture and biotechnology sectors are less developed in the EU region because of the administrative complexity, access difficulties, and standards regarding health and the EU environment. In the field of marine mining, we determined that there were not enough studies to avoid the associated risks.
Investigating a single cause related to the environmental changes generating Blue Economy might lead to tricky results in a multi-varied natural environment, representing a major source of incertitude for projections. That is why within this paper all the fields of the Blue Economy are correlated by using the gross added value from all the economic activity fields.

3. Materials and Methods
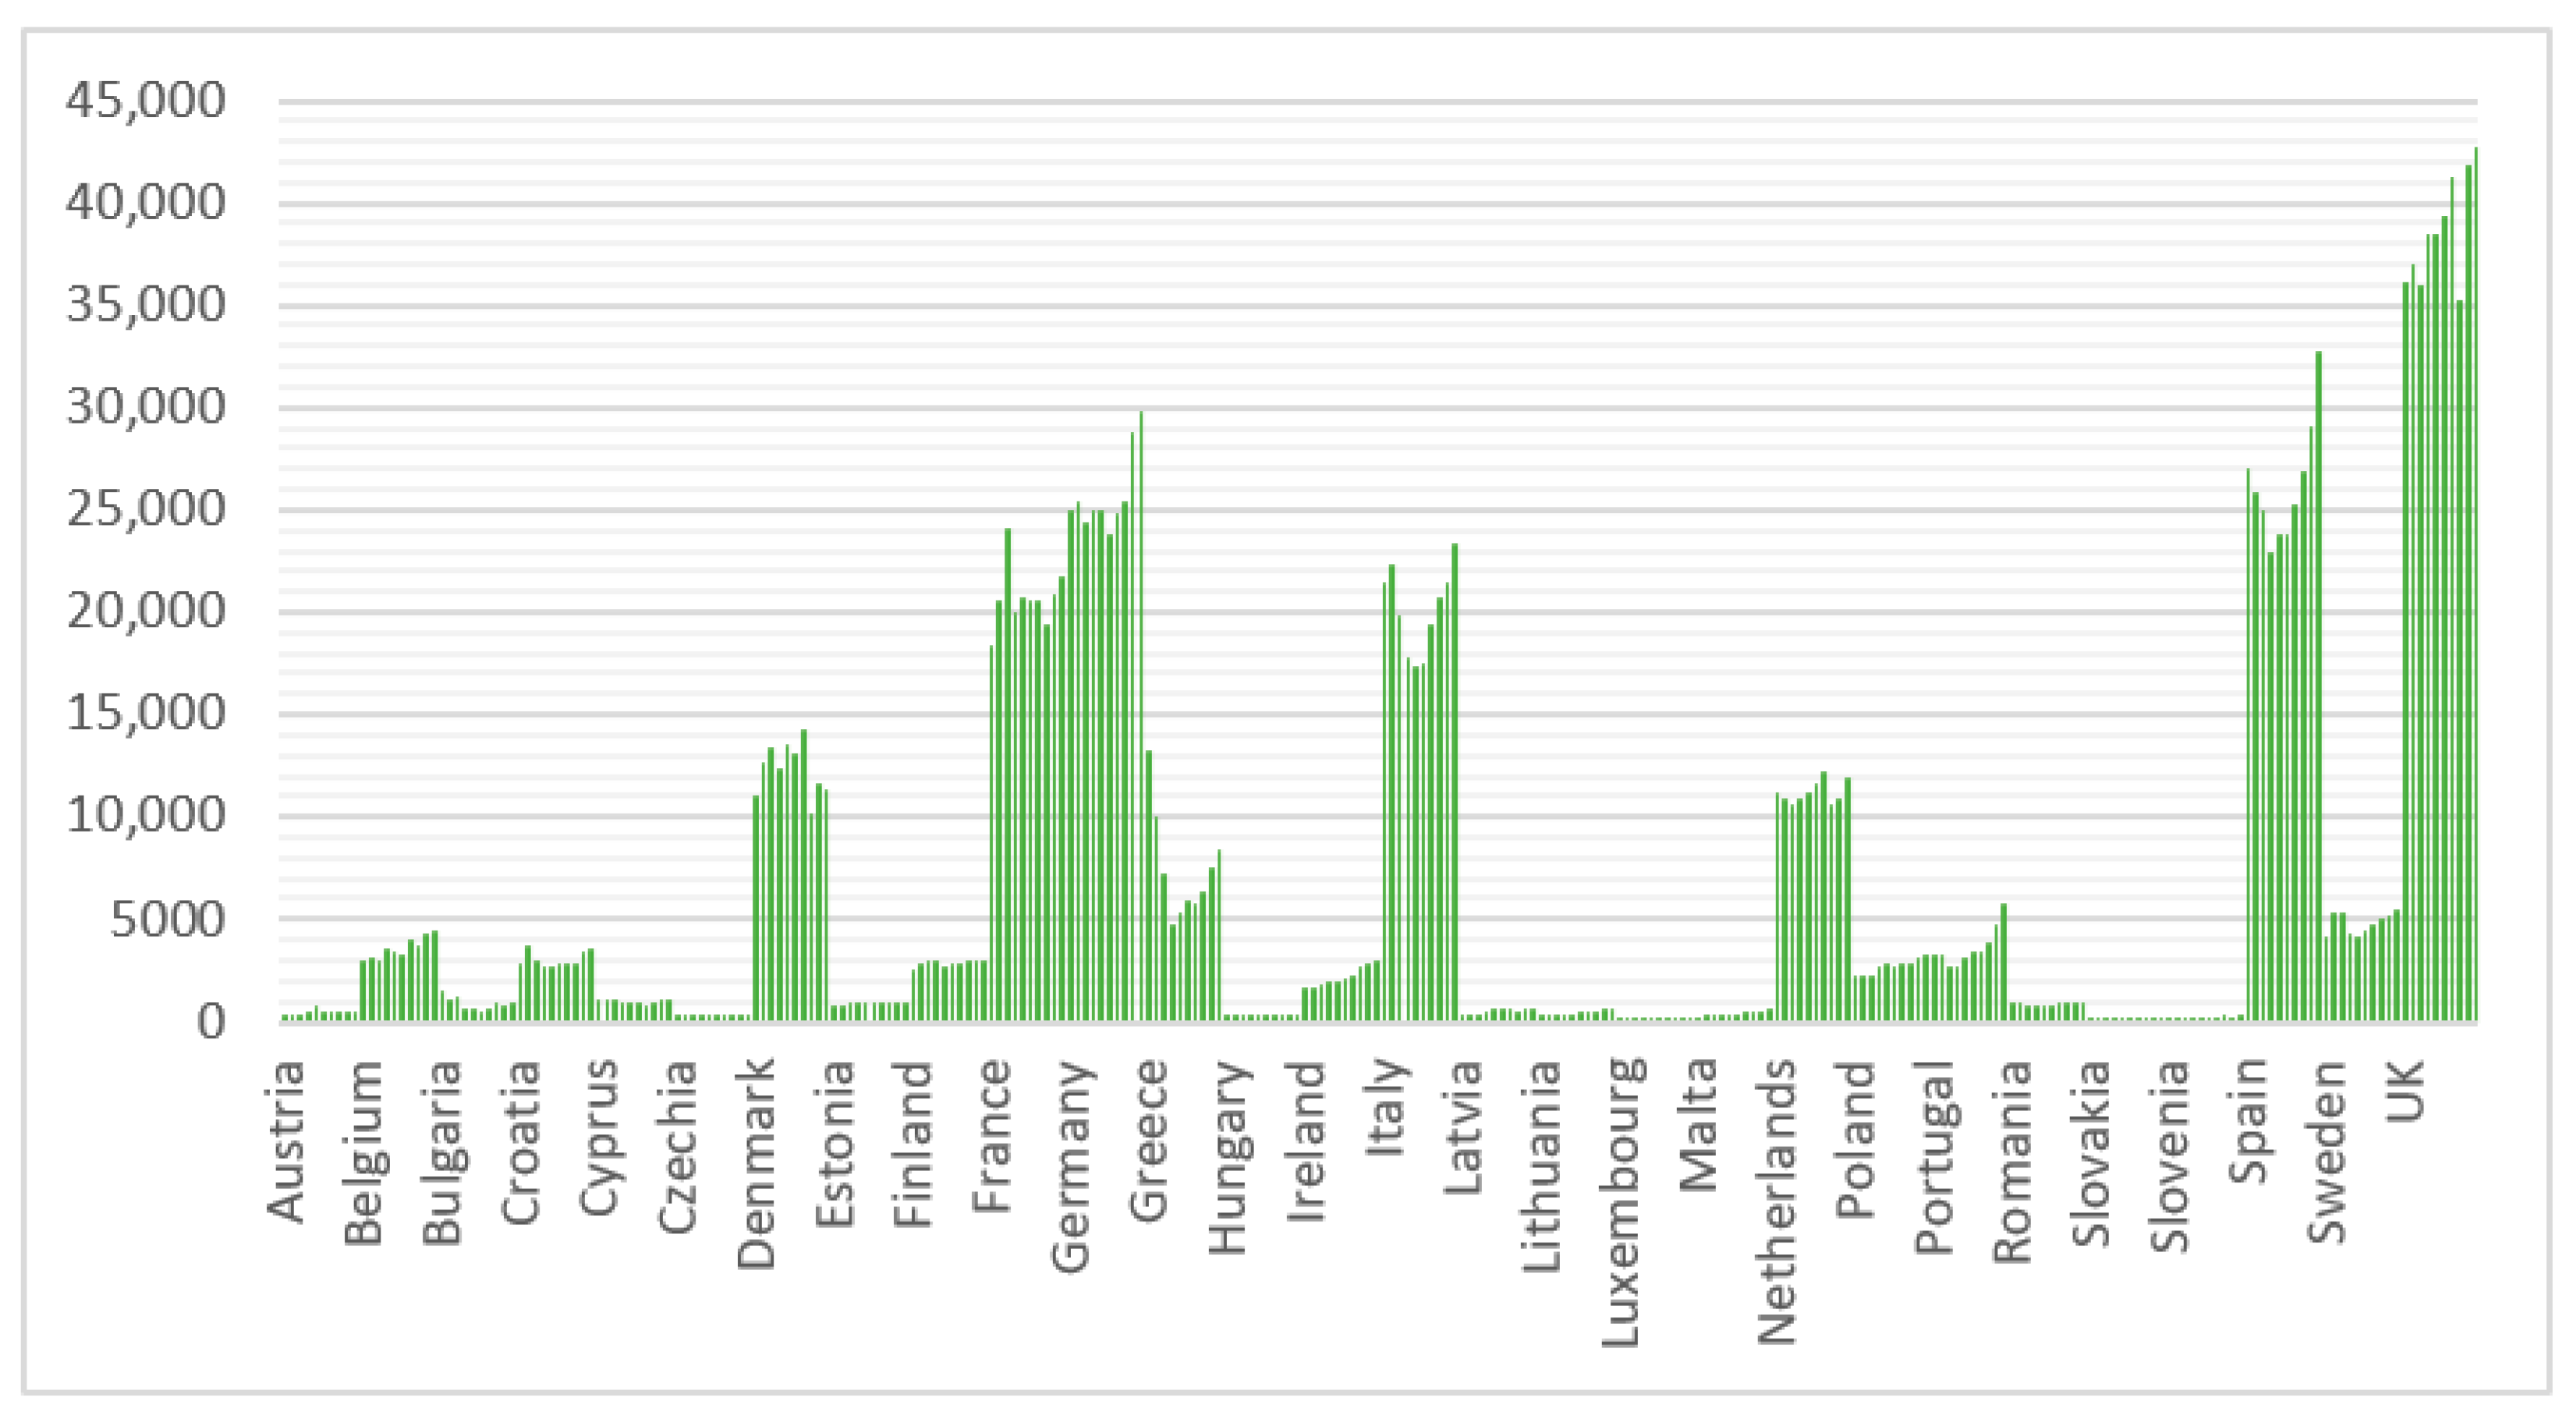
3.1. Data Analysis

For an analysis of the causality relationships among greenhouse gas emissions, the Blue Economy and economic growth we used a data panel with annual data for 28 countries in the EU, taken from the database of the European Commission (EC), available on the official website and from the report published online [21], for the period 2009–2018. We opted for an analysis of a pack of data because there is a low amount of information regarding the Blue Economy and in consequence a low number of information included in the model. The concept only started to gain significant importance around 2009, when the European Commission published the first information on this subject. To meet the proposed objective, we used the following variables within the econometric model: the total value of greenhouse gas emissions expressed in thousands of tons (GHG), the gross added value from the Blue Economy expressed in millions of Euros (GVA), and the real GDP per capita expressed in Euros (GDP and GDP2).
The EC characterized the economic significance of the Blue Economy in the EU-28 countries considering that this region has all the elements required to provide for sustainable development of the maritime economy, because it is registered by a low unemployment as compared to the rest of the economic sectors, high economic growth rates and low government debts [29].
Nevertheless, an increase in the GVA produced by the Blue Economy established sectors (coastal tourism, living resources, non-living resources, maritime transport, port activities, shipbuilding and repair and marine renewable energy) that can be identified in most Member States between 2009 and 2018 (see Figure 1). The most important growth is achieved in Ireland, Portugal, and Malta. Comparably, “an increase of about 30% or more can be noticed in Belgium, Poland and Sweden. On the other hand, in 2018 GVA in Bulgaria and Greece had not yet recovered to the levels observed in 2009” [21] (see Figure 1).
The highest added value in the EU-28 countries comes from the maritime transport, but the highest employment comes from the sectors of tourism and fishing. The maritime transport increased constantly in the last decade in the EU-28 countries as a reflection of the intensification of the international cooperation and economic growth, the number and the size of the ships continuously growing.
After the negative impact generated by the world economic crisis, in the period 2009–2018 the economies of the EU-28 countries increased gradually as a consequence of the measures taken by governments; the most important being, the reduction of expenses, competitive exports, increased trust in the international credit markets, and a suitable climate for business [21].
Based on the prognosis regarding the GHG emissions [30], we reached the conclusion that EU-28 countries can meet the targets set in the EU package for climate and energy, although they represent a huge challenge for some states.
As for climate change, we forecast that by the end of this century, the temperature will grow 2–4 °C with direct consequences, but also indirect consequences on salinity, nutrients, oxygen concentration, the level of phosphates, and migration or disappearance of species [21]. The EU-28 countries implemented similar reduction tools for the GHG emissions, based on the requirements of the EU accession, but these measures determined different effects on the GHG emissions. This can also be explained by the dimension of each country but also by the primary energy supply and final energy consumption levels [31].

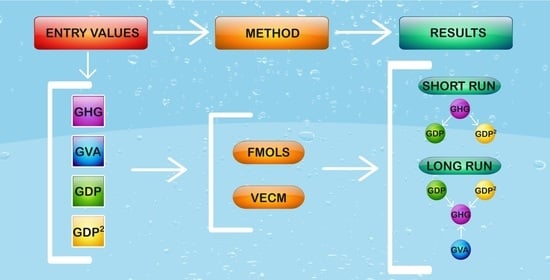
3.2. Research Methodology

The objective of this study is represented by the identification and analysis of the causality relation between climate change, the Blue Economy, and economic growth in the EU countries. Starting from this main objective there are three secondary objectives:
  • The identification and the direction of the causality relation among the variables included in the model;
  • An analysis of the Blue Economy’s influence on the performance of the environment;
  • Positioning these EU-28 countries from the point of view of the influence of the economic growth on the degradation of the environment according to the EKC [32].
Starting from the equations used within the studies regarding the impact of economic growth on the environment [33], we developed the following equation corresponding to the present study:
GHGit = f(GVAit, GDPit, GDP2it)
To research the causality relation between the variables included in the model, after making the logarithm of the data, Equation (1) becomes:
lnGHGit = αi + δit + β1lnGVAit + β2lnGDPit + β3lnGDP2it + μit
where i = 1, 2, …, 28 represent the EU-28 countries included in the panel, t = 2009, …, 2018 represent the time period for which the analysis was made, μit expresses the value of the residual term, βi are coefficients associated to the variable of the model, αi and δi are the parameters that allow for the possibility of country-specific fixed effects and deterministic trends.
The first stage in the analysis of the causality relation among the variables is represented by testing the stationarity of the data used by applying the Levin–Lin–Chu test [34]. A correlation matrix was used prior to summarize data, as input into a more advanced analysis, and as a diagnostic for advanced analyses. The second stage involves applying the cointegration tests to identify the existence of a cointegration relation among the variables included in the analysis by using the Pedroni test [35,36] and the Kao test [37].
In case of at least one cointegration relation among the variables of the model, the long-term cointegration coefficients are established with the fully modified ordinary least squares (FMOLS) estimator suggested by Phillips and Hansen [38]. Furthermore, a vector error correction model (VECM) is used to identify the long- and short-term causality relations. The cointegration term is known as the error correction term (ECT).

4. Results

At first, a correlation matrix is used to show the correlation coefficients between the variables in the model. All of the correlations are positive, and significantly different from zero at conventional levels (see Table 1).
The LLC test involves a common unit root process, so this test does not allow the possibility that data provided for a variable in a particular country included in the panel will be stationary and for another country to have a unitary root. The null hypothesis of this test is that the data series contains a unit root, and the alternative hypothesis assumes that the series is stationary. The Levin–Lin–Chu test with panel-specific means requires that the number of time periods grow more quickly than the number of panels, so the ratio of panels to time periods tends to zero, which makes this test appropriate for the proposed model. The results of the unity root LLC test point out the fact that all variables are stationary at level or at first difference. Thus, all the variables rejected the null hypothesis of the unit root after first difference. Moreover, alternative hypothesis of no unit root is acceptable (see Table 2).
The cointegration test will be applied on the level form of the variables. The first cointegration test is the Pedroni test (see Table 3). This test is one of the most important and widely used tests of cointegration for panel data. It proposes several tests for cointegration that allow for heterogeneous intercepts and trend coefficients across cross-sections.
The results of the test presented in Table 3 point to the existence of a long term cointegration relation among the variables of the model. To improve the accuracy of the analysis, the Kao cointegration test was applied (see Table 4).
The Kao residual cointegration test also emphasizes that the null hypothesis of no cointegration is rejected and the p-value (0.0498) offers strong evidence that between the variables there is a long-term relationship.
Assessing the long-term cointegration coefficients was carried out by using the FMOLS estimator. The results from Table 5 point out the fact that in the long-term there is a cointegration relation among the greenhouse gas emissions, the Blue Economy and economic growth. Analyzing the coefficients associated with the variables lnGDP and lnGDP2 we can formulate the conclusion that this panel of EU-28 countries is on an inverted U shape curve (conventional EKC) in the long-run, because the coefficient associated to the linear term GDP per capita is positive and that associated to the nonlinear term (GDP2) is negative. This result supports the environmental Kuznets curve theory according to which greenhouse gas emissions increase within the first phase of the economic growth and decrease after reaching a certain point (see Table 5).
As for the Blue Economy, according to the results obtained from Table 5, this negatively influences the greenhouse gas emissions; therefore, for a growth with a unit of the gross added value in the Blue Economy there will be a decrease of 0.1065 units of the greenhouse gas emissions.
The existence of a cointegration nexus between the variables of the model implies the existence of a causality connection from at least one direction. To evaluate the causality connections between greenhouse gas emissions, gross value added from the Blue Economy, GDP, and GDP2, the Granger test [39] based on the VECM framework was used. This test determines if there is a short-run, long-run or strong causality between the variables. To analyze the long-run causal impacts, the t-statistics of the ECT are analyzed. If the value of t-statistics proves to be negative, then there is a long-run nexus among variables. As for the existence of a short-term nexus among variables, this is demonstrated by the p-value granted for the coefficients associated to each variable. Therefore, if the p-value is lower than 0.5, then the null hypothesis with the lack of cointegration is rejected and it is accepted that the alternative hypothesis of an existence of a short-term causality nexus among the variables of the model (see Table 6).
According to the results obtained, the direction of causality on the short-run is from greenhouse gas emissions (GHG) to gross domestic product (GDP and GDP2).
On the other hand, the direction of causality from greenhouse gas emissions (GHG) to gross domestic product (GDP and GDP2), on the long- and short-run, demonstrate the real influence that the economy has on greenhouse gas emissions.

5. Discussions

Results indicated that the Blue Economy negatively influences greenhouse gas emissions. This result might be explained by the fact that the economic activity from the seas and oceans are not only based on the use of the renewable energy resources, and governments are taking significant measures to prevent traditional sources and to liberate in the atmosphere harmful gases for the environment. Another example in this sense is represented by the sector of maritime transport, liberating in the atmosphere a higher quantity of CO2, the most important greenhouse gas. The first data obtained from the EU system to monitor, report and verify CO2 emissions from ships over 5000 gross tonnages showed that they emitted more than 138 million tons of CO2 into the atmosphere in 2018.
Furthermore, according to the results obtained, the direction of causality in the short-run is from greenhouse gas emissions (GHG) to gross domestic product (GDP and GDP2). This means that, in the short-run, the levels of greenhouse gas emissions have a negative influence on GDP and GDP2.
Moreover, the direction of causality from greenhouse gas emissions (GHG) to gross domestic product (GDP and GDP2), in the long- and short-run, demonstrate the real influence that the economy has on greenhouse gas emissions.
The results above prove that economic growth and gross value added from Blue Economy have a significant influence on reducing greenhouse gas emissions in the long- and short-run in the EU-28 countries, while in the short-run the influence of greenhouse gas emissions on economic growth was determined. Thus, this fact could be explained because for countries with a high level of pollution, the level of economic growth is important when they have goals in the long-run, but at the same time they have to acknowledge the need for other measures in the short-run to diminish the negative impact that the activities from the maritime field generate on climate change. However, policymakers should create adequate green policies adapted to each member country to reduce these impacts and to maintain the level of economic growth that is very important for the financial development of the country.
Therefore, the results of this study are similar to other papers also mentioned in the literature review section. Furthermore, as Bouman et al. [24] noted that no single measure is enough to cause a significant reduction, we also believe that policymakers should address multiple measures to see a real reduction in the negative impacts on the seas and oceans.
Nevertheless, like other authors’ ([25,26]) views on sustaining economic growth, our results confirm that countries with access to seas and oceans are more interested in generating energy from the seas and oceans as an attractive source of renewable energy which will help reduce the environmental impact in order to provide a sustainable Blue Growth.

6. Conclusions

The purpose of the paper is to analyze the correlations among the Blue Economy, climate change, and economic growth in the EU-28 countries. The motivation of choosing the EU-28 countries resides in the fact that they implemented similar reduction tools for the GHG emissions, based on the requests of the EU accession, but these measures determined different effects on GHG emissions.
The novelty element of the paper is represented by the causality relations among the greenhouse gas emissions, the Blue Economy and the economic growth under the form of a data panel over the period 2009–2018, using the FMOLS and VECM methods and taking into account the fact that there is a lower amount of information regarding the Blue Economy and studies analyzing the effects generated by the maritime activities on climate change. At the same time, this type of analysis was not approached in other research studies and gained a significant importance in the EU starting in 2009, when the European Commission published the first information on this subject.
Another novelty element of the paper is using and including the gross added value in the chosen pattern of the Blue Economy (GVA) synthesizing all the economic activity fields within the Blue Economy because the analysis of a single cause generating changes on the environment might lead to contradictory results in a multi-varied natural environment, representing a major uncertainty for future projections.
In consequence, to meet the proposed goal we used the following variables within the econometric model: the total value of the greenhouse gas emissions expressed in thousand tons (GHG), the gross added value in the Blue Economy expressed in million Euros (GVA), and the real GDP per capita expressed in Euros (GDP and GDP2).
The results obtained indicate the fact that in the long-term there is a cointegration relation among greenhouse gas emissions, the Blue Economy, and economic growth. As for the Blue Economy, according to the results obtained, they negatively influence greenhouse gas emissions. This can also be explained by the fact that the economic activity from the seas and oceans sector is not only based on traditional sources liberating harmful gases in the atmosphere but also on renewable energy sources; thus, the EU-28 countries are taking important steps in preserving the environment. At the same time, we identified unidirectional causality relationships from the greenhouse gas emissions on the economic growth in the short-term and from the economic growth to the greenhouse gas emissions in the long-term. These results indicate that the Blue Economy is a very important part of the global economy and the negative impact over the seas and oceans also reflect on other fields of the economy.
We agree with the opinion expressed by the specialists of the European Commission [6], that we need concerted actions to protect and reset the health of the oceans and seas and to reduce the impact on the environment and the losses of natural resources caused by the unsustainable economic activity related to seas and oceans. The conservation and growth of natural capital accumulated in the seas and oceans is essential for the provision of sustainable ecosystem services and for the achievement of the EU’s Sustainable Development Goals (SDGs) set by the UN for 2030. Therefore, Marine Strategy Framework Directive (MSFD) offers a comprehensive and holistic approach for the protection of the European sea, acting as an environmental pillar of the EU’s broader maritime strategy. However, climate change (rising temperatures, acidification, deoxygenation, rising sea levels) is another additional pressure that is exacerbating the effects of pollution, biodiversity, and other existing threats. Thus, the Blue Economy is linked to many other economic activities and its impact goes beyond the sectors mentioned above. Therefore, we strongly agree that on the EU level it is important to harmonize the ocean, coastline and marine economic activities with the values imposed by the sustainable economy to support sustainable growth.
The limitations of this study can be outlined on one hand, by the fact that the analysis only includes the EU-28 countries and therefore we propose to include other OECD countries within our study. On the other hand, once the threats on the oceans and seas are more varied, we intend to include other macroeconomic variables in the proposed model.

Author Contributions

All six authors equally contributed to designing and writing this paper. Specific tasks were done as follows: conceptualization, N.M.F., R.M.B. and A.G.M., investigation, S.P.; methodology, A.G.M., M.D.D. and S.P.; project administration, N.M.F., A.G.M., L.F.M. and R.M.B.; supervision, N.M.F. and S.P.; writing—review and editing, S.P. and L.F.M. All authors have read and agreed to the published version of the manuscript.

Funding

This article received no external funding.

Institutional Review Board Statement

Not applicable.

Informed Consent Statement

Not applicable.

Data Availability Statement

Not applicable.

Conflicts of Interest

The authors declare no conflict of interest.

References

  1. UNEP. Annual Report. 2016. Available online: www.unenvironment.org/annualreport/2015/en/index.html (accessed on 1 May 2021).
  2. OECD. The Ocean. Economy in 2030; OECD Publishing: Paris, France, 2016; Available online: www.oecd-ilibrary.org/economics/the-ocean-economyin-2030_9789264251724-en (accessed on 25 April 2021).
  3. WWF. Principles for a Sustainable Blue Economy. 2018. Available online: https://wwfeu.awsassets.panda.org/downloads/wwf_marine_briefing_principles_blue_economy.pdf (accessed on 5 April 2021).
  4. Keen, M.R.; Schwarz, A.M.; Wini-Simeon, L. Towards defining the Blue Economy: Practical lessons from Pacific Ocean governance. Mar. Policy 2017, 88, 333–341. [Google Scholar] [CrossRef]
  5. UNEP. Blue Economy: Sharing Success Stories to Inspire Change. 2015. Available online: www.unep.org/greeneconomy (accessed on 13 May 2021).
  6. European Commission. Communication from the Commission to the European Parliament, the Council, the European Economic and Social Committee and the Committee of the Regions Initiative for the Sustainable Development of the Blue Economy in the Western Mediterranean. 2017. Available online: https://ec.europa.eu/regional_policy/sources/docoffic/2014/com_2017_376_2_en.pdf (accessed on 14 March 2021).
  7. European Commission. Proposal for a Directive of the European Parliament and of the Council Establishing a Framework for Maritime Spatial Planning and Integrated Coastal Management. 2013. Available online: https://ec.europa.eu/environment/iczm/pdf/Proposal_en.pdf (accessed on 3 May 2021).
  8. Patil, P.G.; Virdin, J.; Diez, S.M.; Roberts, J.; Singh, A. Toward a Blue Economy: A Promise for Sustainable Growth in the Caribbean; An Overview; The World Bank: Washington, DC, USA, 2016. [Google Scholar]
  9. Hall, P.O.J.; Anderson, L.G.; Holby, O.; Kollberg, S.; Samuelsson, M.O. Chemical fluxes and mass balances in a marine fish cage farm. I. Carbon. Mar. Ecol. Prog. Ser. 1990, 61, 61–73. [Google Scholar] [CrossRef]
  10. Porello, S.; Lenzi, M.; Persia, E.; Tomassetti, P.; Finoia, M.G. Reduction of aquaculture wastewater eutrophication by phytotreatment ponds system I. Dissolved and particulate nitrogen and phosphorus. Aquaculture 2003, 219, 515–529. [Google Scholar] [CrossRef]
  11. Robb, D.H.F.; MacLeod, M.; Hasan, M.R.; Soto, D. Greenhouse Gas. Emissions from Aquaculture: A Life Cycle Assessment of Three Asian Systems; FAO Fisheries and Aquaculture Technical Paper No. 609; Food And Agriculture Organization of the United Nations: Rome, Italy, 2017; ISBN 978-92-5-109833-2. [Google Scholar]
  12. Hoegh-Guldberg, O.; Caldeira, K.; Chopin, T.; Gaines, S.; Haugan, P.; Hemer, M.; Howard, J.; Konar, M.; Krause-Jensen, D.; Lovelock, C.; et al. The Ocean as a Solution to Climate Change: Five Opportunities for Action; Report; World Resources Institute: Washington, DC, USA, 2019; Available online: https://oceanpanel.org/sites/default/files/2019-10/HLP_Report_Ocean_Solution_Climate_Change_final.pdf (accessed on 13 April 2021).
  13. United Nations Environment Programme. Greenhouse Gases Are Depriving Our Oceans of Oxygen. 2019. Available online: www.unenvironment.org/news-and-stories/story/greenhouse-gases-are-depriving-our-oceans-oxygen (accessed on 16 June 2021).
  14. Rogelj, J.; Elzen, M.D.; Höhne, N.; Fransen, T.; Fekete, H.; Winkler, H.; Schaeffer, R.; Sha, F.; Riahi, K.; Meinshausen, M. Paris Agreement climate proposals need a boost to keep warming well below 2 °C. Nat. Cell Biol. 2016, 534, 631–639. [Google Scholar] [CrossRef] [PubMed] [Green Version]
  15. Adams, E.E.; Caldeira, K. Ocean Storage of CO2. Elements 2008, 4, 319–324. Available online: https://people.ucsc.edu/~mdmccar/migrated/ocea213/readings/15_GeoEngineer/C_sequestration/adams_2008_Elements_CALDERIA_Ocean_CO2_Storeage.pdf (accessed on 31 March 2021). [CrossRef]
  16. Renforth, P.; Henderson, G. Assessing Ocean Alkalinity for Carbon Sequestration. Rev. Geophys 2017, 55, 636–674. [Google Scholar] [CrossRef]
  17. Widdicombe, S.; Blackford, J.C.; Spicer, J.J. Assessing the Environmental Consequences of CO2 Leakage from Geological CCS: Generating Evidence to Support Environmental Risk Assessment. Mar. Pollut. Bull. 2013, 73, 399–401. [Google Scholar] [CrossRef] [PubMed]
  18. Froehlich, H.E.; Afflerbach, J.C.; Frazier, M.; Halpern, B.S. Blue Growth Potential to Mitigate Climate Change through Seaweed Offsetting. Curr. Biol. 2019, 29, 3087–3093. [Google Scholar] [CrossRef] [PubMed]
  19. Walker, T.R.; Adebambo, O. Environmental effects of marine transportation. In World Seas: An Environmental Evaluation Volume III: Ecological Issues and Environmental Impacts, 2nd ed.; Elsevier Ltd.: Amsterdam, The Netherlands, 2018; Volume 3, pp. 505–530. [Google Scholar]
  20. Vidas, S.; Cukrov, M.; Sutalo, V.; Rudan, S. CO2 Emissions Reduction Measures for RO-RO Vessels on Non-Profitable Coastal Liner Passenger Transport. Sustainability 2021, 13, 6909. [Google Scholar] [CrossRef]
  21. European Commission. 2020 Blue Economy Report: Blue Sectors Contribute to the Recovery and Pave Way for EU Green Deal. 2020. Available online: https://ec.europa.eu/commission/presscorner/detail/en/IP_20_986 (accessed on 19 June 2021).
  22. European Commission. 2019 Annual Report from the European Commission on CO2 Emissions from Maritime Transport. 2020. Available online: https://ec.europa.eu/clima/sites/clima/files/transport/shipping/docs/swd_2020_82_en.pdf (accessed on 20 June 2021).
  23. European Parliament and Council. Regulation (EU) 2015/757 on the Monitoring, Reporting and Verification of Carbon Dioxide Emissions from Maritime Transport. 2015. Available online: https://eur-lex.europa.eu/legal-content/EN/TXT/?uri=celex%3A32015R0757 (accessed on 4 July 2021).
  24. Bouman, E.A.; Lindstad, E.; Rialland, A.I.; Strømman, A.H. State-of-the-Art Technologies, Measures, and Potential for Reducing GHG Emissions from Shipping: A Review. Transp. Res. Part. D 2017, 52, 408–421. [Google Scholar] [CrossRef]
  25. Copping, A.; Sather, N.; Hanna, L.; Whiting, J.; Zydlewski, G.; Staines, G.; Gill, A.; Hutchison, I.; O’Hagan, A.; Simas, T.; et al. Annex IV 2016 State of the Science Report: Environmental Effects of Marine Renewable Energy Development Around the World. 2016. Available online: https://tethys.pnnl.gov/publications/state-of-the-science-2016 (accessed on 20 April 2021).
  26. Rodriguez-Rodrigues, D.; Rodriguez, J.; Malak, D.A.; Nastasi, A.; Hernandes, P. Marine protected areas and fisheries restricted areas in the Mediterranean: Assessing "actual" marine biodiversity protection coverage at multiple scales. Mar. Policy 2016, 64, 24–30. [Google Scholar] [CrossRef]
  27. FAO. The State of World Fisheries and Aquaculture 2018—Meeting the Sustainable Development Goals. Rome. Licence: CC BY-NC-SA 3.0 IGO. 2018. Available online: http://www.fao.org/3/i9540en/i9540en.pdf (accessed on 20 March 2021).
  28. EPRS. Ocean Governance and Blue Growth Challenges, Opportunities and Policy Responses. 2019. Available online: www.europarl.europa.eu/RegData/etudes/BRIE/2019/635557/EPRS_BRI(2019)635557_EN.pdf (accessed on 15 April 2021).
  29. European Commission. A Sustainable Blue Growth Agenda for the Baltic Sea Region. Brussels, 16.5.2014. SWD(2014) 167 Final. 2014. Available online: https://ec.europa.eu/maritimeaffairs/sites/maritimeaffairs/files/docs/body/swd-2014-167_en.pdf.pdf (accessed on 19 June 2021).
  30. Roos, I.; Soosaara, S.; Volkovaa, A.; Streimikeneb, D. Greenhouse gas emissions reduction perspectives in the Baltic States in frames of EU energy and climate policy. Renew. Sustain. Energy Rev. 2012, 16, 2133–2146. [Google Scholar] [CrossRef]
  31. Streimikiene, D. Climate Change Mitigation Policies in Energy Sector of Baltic States. 2007. Available online: www.worldenergy.org/assets/downloads/PUB_Energy_and_Climate_Change_Annex_Baltic_states_2007_WEC.pdf (accessed on 21 April 2021).
  32. Kuznets, S. Economic growth and income inequality. Am. Econ. Rev. 1955, 45, 1–28. [Google Scholar]
  33. He, J.; Richard, P. Environmental Kuznets curve for CO2 in Canada. Ecol. Econ. 2010, 69, 1083–1093. [Google Scholar] [CrossRef] [Green Version]
  34. Levin, A.; Lin, C.F.; Chu, C.S.J. Unit Root Tests in Panel Data: Asymptotic and Finite-Sample Properties. J. Econom. 2002, 108, 1–24. [Google Scholar] [CrossRef]
  35. Pedroni, P. Critical values for cointegration tests in heterogeneous panels with multiple regressors. Oxf. Bull. Econ. Stat. 1999, 61, 653–670. [Google Scholar] [CrossRef]
  36. Pedroni, P. Panel cointegration: Asymptotic and finite sample properties of pooled time series tests with an application to the PPP hypothesis. Econom. Theory 2004, 20, 597–625. [Google Scholar] [CrossRef] [Green Version]
  37. Kao, C. Spurious regression and residual-based tests for cointegration in panel data. J. Econom. 1999, 90, 1–44. [Google Scholar] [CrossRef]
  38. Phillips, P.; Hansen, B. Statistical Inference in Instrumental Variables Regression with I(1) Process-es. Rev. Econ. Stud. 1990, 57, 99–125. [Google Scholar] [CrossRef]
  39. Engle, R.F.; Granger, C.W.J. Cointegration and Error Correction: Representation, Estimation and Testing. Econometrica 1987, 55, 251–276. [Google Scholar] [CrossRef]
Figure 1. Gross added value (GVA) in EU-28 during 2009–2018 (millions of Euros).
Energies 14 04600 g001
Table 1. Correlation matrix for the variables.
lnGHGlnGVAlnGDPlnGDP2
lnGHG1.000000
-
lnGVA0.675645
(0.0000)
1.000000
-
lnGDP0.143160
(0.0165)
0.257532
(0.0000)
1.000000
-
lnGDP20.137406
(0.0215)
0.244562
(0.0000)
0.999312
(0.0000)
1.000000
-
Table 2. Unit root test results in EU-28 countries.
MethodCommon Unit Root Test
LLC
lnGHGStat (p-value)−7.7373 (0.0000)
dlnGHGStat (p-value)−4.7787 (0.0000)
lnGVAStat (p-value)0.5585 (0.7118)
dlnGVAStat (p-value)−6.9652 (0.0000)
lnGDPStat (p-value)−0.1718 (0.4318)
dlnGDPStat (p-value)−7.8937 (0.0000)
lnGDP2Stat (p-value)−0.0274 (0.4891)
dlnGDP2Stat (p-value)−7.7604 (0.0000)
Table 3. Pedroni cointegration test for the variables in EU-28 countries.
Alternative Hypothesis: Common AR Coeff. (within-Dimension)
StatisticProb.StatisticProb.
Panel v-Stat−2.13190.9835−2.65060.9960
Panel rho-Stat2.67440.99632.49160.9936
Panel PP-Stat−6.21310.0000−6.06100.0000
Panel ADF-Stat−4.92400.0000−4.55300.0000
Alternative Hypothesis: Individual AR Coeff. (between-Dimension)
StatisticProb.
Group rho-Stat5.10941.0000
Group PP-Stat−8.70190.0000
Group ADF-Stat−5.84700.0000
Table 4. Kao cointegration test in EU-28 countries.
t-StatisticProb.
ADF−1.6468950.0498
Residual variance0.008152
HAC variance0.006855
Table 5. Long run estimates—fully modified ordinary least squares (FMOLS) model.
VariableCoefficientStd. Errort-StatisticProb.
Long Run Equation
lnGDP3.04530.0187162.04520.0000
lnGDP2–0.23180.0406–5.69780.0000
lnGVA–0.10650.0286–3.71650.0003
Table 6. VECM estimation for the variables in EU-28 countries.
Error Correction:d(lnGHG)d(lnGVA)d(lnGDP)d(lnGDP2)
ECT(−1)−0.0003430.000403−0.000160−0.002435
(0.00024)(0.00035)(6.4 × 10⁻⁵)(0.00131)
[−1.44727][1.15182][−2.48574][−1.86299]
d(lnGHG(−1))−0.153350−0.0201060.0291950.574425
(0.06374)(0.09405)(0.01726)(0.35135)
[−2.40575][−0.21379][1.69176][1.63492]
d(lnGVA(−1))0.043706−0.1381910.0164610.323563
(0.04465)(0.06588)(0.01209)(0.24613)
[0.97878][−2.09753][1.36165][1.31460]
d(lnGDP(−1))−0.3414551.9096221.07464815.59224
(3.32055)(4.89916)(0.89897)(18.3027)
[−0.10283][0.38979][1.19542][0.85191]
d(lnGDP2(−1))0.016601−0.032226−0.030785−0.321307
(0.16535)(0.24396)(0.04476)(0.91139)
[0.10040][−0.13210][−0.68771][−0.35254]
Publisher’s Note: MDPI stays neutral with regard to jurisdictional claims in published maps and institutional affiliations.

