
Selecting Freight Transportation Modes in Last-Mile Urban Distribution in Pamplona (Spain): An Option for Drone Delivery in Smart Cities


Abstract
:
1. Introduction
1.1. Urban Freight Transportation
1.2. The Pamplona Case
1.3. Aim of This Study
2. Literature Review
2.1. Economic Criterion
2.2. Environmental Criterion
2.3. Social Criterion
2.4. Multicriteria Analysis
3. Methodology
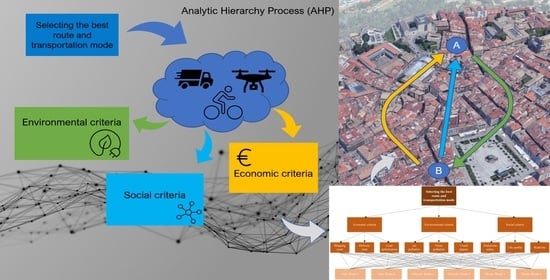
3.1. Applied Model
3.2. Model Criteria
- Subcriterion 1: Shipping costs. Firstly, the marginal shipping cost are lower for larger capacities, which makes the traditional van the cheapest alternative. Similarly, driving smaller distances will also reduce the shipping costs. Nevertheless, given the regulation for deliveries in the city center of Pamplona, the final comparison is not clear. That is, a cargo-bike may perform the deliveries at any time, without time-windows constraints that allow them to better optimize their routing planning. We explain these details at our AHP respondents and leave them to freely show their preferences with respect to the shipping cost.
- Subcriterion 2: Delivery time. Similarly to the previous point, time-windows heavily constrain good routing solutions for the traditional van deliveries. At the same time, bike deliveries need to schedule a greater number of routes to distribute the same number of parcels. Additionally, drone distribution may only deliver one parcel at a time, but it avoids traffic jams and flies in straight line, which reduces the traveling time.
- Subcriterion 3: Loading optimization. This subcriterion measures the ability of a vehicle to achieve the full load for their operations so the number of routes are minimize. That means that a vehicle with higher capacity will have a better performance than a smaller one. Again, the particular characteristics of the last-mile distribution in the city center are explained to the respondent that freely give their opinion in this point.
- Subcriterion 4: Air pollution. Freight transport emissions depend, in large part, on the type of fuel used. Despite the current great variety of different alternative fuels, diesel continues to be the main fuel used by goods vehicles [4]. Only a small amount is moved by electrically powered road vehicles; however, electric vehicles are not entirely sustainable due to the fact they depend on the primary energy source used to produce the batteries [50].
- Subcriterion 5: Noise pollution. Street activity noise generated by freight transportation tends to be nonstop, and hence considered a more significant issue than noise caused by other transport modes, e.g., railroad or aircraft noise, which are irregular.
- Subcriterion 6: Visual impact. The presence of vehicles in the city center may bother residents and visitors. Thus, the visual intrusion is assessed for each specific vehicle and route.
- Subcriterion 7: Pedestrian safety. This item considers the physical disturbance of freight vehicles for pedestrians walking in the city center.
- Subcriterion 8: Life quality. The city center is a very dynamic area in which bars, shops, and households coexist. For that reason, the presence of freight vehicle may disturb and prevent the users from fully enjoying the city center.
- Subcriterion 9: Road use. It is of utmost importance that cyclists, vans, and pedestrians are able to circulate on the streets without causing any setback to their passage.
4. Data Collection
4.1. Survey Implementation
4.2. Urban Freight Modes
- Cargo bike: A three-wheeled bicycle with a built-in trailer for transporting loads up to 200 kg. They can have an electric motor to help the driver to provide power to the bike, or they can be human driven without any external support.
- Traditional delivery van: They are small internal-combustion-engine vehicles that are used for the last-mile distribution. They are designed to transport up to 1500 kg.
- Drone: Unmanned aircraft vehicle, which can fly autonomously once it has been programmed or used by an operator with a remote controller. The usual drone load capacity is one parcel up to 2.5 kg.
- Route 1. Crossing the Pamplona City Center.
- Route 2. Surrounding the Pamplona City Center.
5. Results
6. Conclusions
- Social dimension is much more valued than economic or environmental aspects. In fact, pedestrian safety and life quality are the factors most appreciated by the respondent. It is particularly interesting that economic criteria are not critical for this analysis.
- Drone is seen as the best alternative for deliveries in the city center. Aerial distribution can be very useful in areas where traffic is heavy, counting not only vehicles, but also pedestrians. Hence, the Pamplona city center is a good example of this balance of people and distribution vehicles, where neighbors, traders, transporters, and tourists live together on a daily basis. Nevertheless, according to Figliozzi [51] the lower environmental impact of the use of drones and their easiness of control makes it a promising urban delivery mode, mainly with the use of new advanced technologies of managing big data, 5G, IoT, or autonomous vehicles. For now, the biking delivery is the preferred option in the short run.
- Avoiding entering the city center is preferred for drones and vans. This is not the case for the cargo-bikes, which people prefer to cross the city center. These reasons are motivated mainly for environmental and social aspects, as bike delivery is cleaner, less intrusive, and safer than other transportation modes. As such, it integrates better into the urban environment making it friendlier to residents.
6.1. Managerial Implications
6.2. Limitations and Future Research
Author Contributions
Funding
Institutional Review Board Statement
Informed Consent Statement
Data Availability Statement
Conflicts of Interest
Appendix A. Pairwise Comparison Matrices

| Economic | Social | Environmental | Priority | |
|---|---|---|---|---|
| Economic | 1 | 1/5 | 1/5 | 0.09 |
| Social | 5 | 1 | 3 | 0.61 |
| Environmental | 5 | 1/3 | 1 | 0.3 |
| Economic | Shipping Cost | Delivery Time | Load Optimization | Priority |
|---|---|---|---|---|
| Shipping cost | 1 | 3 | 5 | 0.61 |
| Delivery time | 1/3 | 1 | 5 | 0.3 |
| Load optimization | 1/5 | 1/5 | 1 | 0.09 |
| Social | Road Use | Pedestrian Safety | Life Quality | Priority |
|---|---|---|---|---|
| Road use | 1 | 1/5 | 1/5 | 0.1 |
| Pedestrian safety | 5 | 1 | 1 | 0.45 |
| Life quality | 5 | 1 | 1 | 0.45 |
| Environmental | Air Pollution | Noise Pollution | Visual Impact | Priority |
|---|---|---|---|---|
| Air pollution | 1 | 1 | 5 | 0.48 |
| Noise pollution | 1 | 1 | 3 | 0.41 |
| Visual impact | 1/5 | 1/3 | 1 | 0.11 |
| Economic Shipping Costs | Bike-R1 | Bike-R2 | Van-R1 | Van-R2 | Drone-R1 | Drone-R2 | Priority |
|---|---|---|---|---|---|---|---|
| Bike-R1 | 1 | 3 | 3 | 3 | 5 | 3 | 0.33 |
| Bike-R2 | 1/3 | 1 | 3 | 5 | 1/3 | 3 | 0.19 |
| Van-R1 | 1/3 | 1/3 | 1 | 3 | 1/3 | 1/3 | 0.09 |
| Van-R2 | 1/3 | 1/5 | 1/3 | 1 | 3 | 3 | 0.13 |
| Drone-R1 | 1/5 | 3 | 3 | 1/3 | 1 | 3 | 0.17 |
| Drone-R2 | 1/3 | 1/3 | 3 | 1/3 | 1/3 | 1 | 0.09 |
| Economic Delivery Time | Bike-R1 | Bike-R2 | Van-R1 | Van-R2 | Drone-R1 | Drone-R2 | Priority |
|---|---|---|---|---|---|---|---|
| Bike-R1 | 1 | 3 | 1/3 | 1/3 | 1/5 | 3 | 0.13 |
| Bike-R2 | 1/3 | 1 | 1/3 | 1/3 | 1/3 | 1/3 | 0.06 |
| Van-R1 | 3 | 3 | 1 | 1/3 | 1/5 | 1/3 | 0.11 |
| Van-R2 | 3 | 3 | 3 | 1 | 1/5 | 1/5 | 0.14 |
| Drone-R1 | 5 | 3 | 5 | 5 | 1 | 3 | 0.37 |
| Drone-R2 | 1/3 | 3 | 3 | 5 | 1/3 | 1 | 0.19 |
| Economic Load Optimization | Bike-R1 | Bike-R2 | Van-R1 | Van-R2 | Drone-R1 | Drone-R2 | Priority |
|---|---|---|---|---|---|---|---|
| Bike-R1 | 1 | 3 | 3 | 1/3 | 3 | 1/5 | 0.16 |
| Bike-R2 | 1/3 | 1 | 1/5 | 1/5 | 1/5 | 5 | 0.08 |
| Van-R1 | 1/3 | 5 | 1 | 1/5 | 5 | 3 | 0.17 |
| Van-R2 | 3 | 5 | 5 | 1 | 5 | 3 | 0.34 |
| Drone-R1 | 1/3 | 5 | 1/5 | 1/5 | 1 | 5 | 0.13 |
| Drone-R2 | 5 | 1/5 | 1/3 | 1/3 | 1/5 | 1 | 0.13 |
| Social Road Use | Bike-R1 | Bike-R2 | Van-R1 | Van-R2 | Drone-R1 | Drone-R2 | Priority |
|---|---|---|---|---|---|---|---|
| Bike-R1 | 1 | 1/3 | 5 | 3 | 1/5 | 3 | 0.20 |
| Bike-R2 | 3 | 1 | 3 | 1/5 | 1/5 | 1/3 | 0.11 |
| Van-R1 | 1/5 | 1/3 | 1 | 1/3 | 1/5 | 1/3 | 0.05 |
| Van-R2 | 1/3 | 5 | 3 | 1 | 1/5 | 1/5 | 0.11 |
| Drone-R1 | 5 | 5 | 5 | 5 | 1 | 1/5 | 0.27 |
| Drone-R2 | 1/3 | 3 | 3 | 5 | 5 | 1 | 0.28 |
| Social Pedestrian Safety | Bike-R1 | Bike-R2 | Van-R1 | Van-R2 | Drone-R1 | Drone-R2 | Priority |
|---|---|---|---|---|---|---|---|
| Bike-R1 | 1 | 1/3 | 1/3 | 1/3 | 1/3 | 1/5 | 0.04 |
| Bike-R2 | 3 | 1 | 5 | 1/3 | 1/3 | 3 | 0.21 |
| Van-R1 | 3 | 1/5 | 1 | 1/5 | 1/5 | 1/3 | 0.06 |
| Van-R2 | 3 | 3 | 5 | 1 | 1/5 | 1/5 | 0.16 |
| Drone-R1 | 3 | 3 | 5 | 5 | 1 | 1/5 | 0.24 |
| Drone-R2 | 5 | 1/3 | 3 | 5 | 5 | 1 | 0.30 |
| Social Life Quality | Bike-R1 | Bike-R2 | Van-R1 | Van-R2 | Drone-R1 | Drone-R2 | Priority |
|---|---|---|---|---|---|---|---|
| Bike-R1Bike-R1 | 1 | 3 | 5 | 3 | 1/5 | 1/5 | 0.14 |
| Bike-R2 | 1/3 | 1 | 1/3 | 5 | 1/5 | 1/3 | 0.10 |
| Van-R1 | 1/5 | 3 | 1 | 1/5 | 1/5 | 1/5 | 0.07 |
| Van-R2 | 1/3 | 1/5 | 5 | 1 | 1/3 | 1/5 | 0.08 |
| Drone-R1 | 5 | 5 | 5 | 3 | 1 | 1/3 | 0.25 |
| Drone-R2 | 5 | 3 | 5 | 5 | 3 | 1 | 0.37 |
| Environmental Air Pollution | Bike-R1 | Bike-R2 | Van-R1 | Van-R2 | Drone-R1 | Drone-R2 | Priority |
|---|---|---|---|---|---|---|---|
| Bike-R1 | 1 | 5 | 5 | 5 | 5 | 1/5 | 0.29 |
| Bike-R2 | 1/5 | 1 | 5 | 5 | 1/5 | 1 | 0.12 |
| Van-R1 | 1/5 | 1/5 | 1 | 5 | 1/5 | 1/5 | 0.06 |
| Van-R2 | 1/5 | 1/5 | 1/5 | 1 | 1/5 | 1/5 | 0.02 |
| Drone-R1 | 1/5 | 5 | 5 | 5 | 1 | 5 | 0.28 |
| Drone-R2 | 5 | 1 | 5 | 5 | 1/5 | 1 | 0.23 |
| Environmental Noise Pollution | Bike-R1 | Bike-R2 | Van-R1 | Van-R2 | Drone-R1 | Drone-R2 | Priority |
|---|---|---|---|---|---|---|---|
| Bike-R1 | 1 | 5 | 5 | 3 | 1/5 | 1/3 | 0.18 |
| Bike-R2 | 1/5 | 1 | 3 | 5 | 1/5 | 1 | 0.15 |
| Van-R1 | 1/5 | 1/3 | 1 | 1/5 | 1/3 | 1/5 | 0.04 |
| Van-R2 | 1/3 | 1/5 | 5 | 1 | 1/3 | 1/5 | 0.08 |
| Drone-R1 | 5 | 5 | 3 | 3 | 1 | 1/3 | 0.25 |
| Drone-R2 | 3 | 1 | 5 | 5 | 3 | 1 | 0.30 |
| Environmental Visual Impact | Bike-R1 | Bike-R2 | Van-R1 | Van-R2 | Drone-R1 | Drone-R2 | Priority |
|---|---|---|---|---|---|---|---|
| Bike-R1 | 1 | 1/3 | 5 | 5 | 5 | 1/5 | 0.19 |
| Bike-R2 | 3 | 1 | 3 | 5 | 1/5 | 1/3 | 0.16 |
| Van-R1 | 1/5 | 1/3 | 1 | 1/3 | 1/5 | 1 | 0.08 |
| Van-R2 | 1/5 | 1/5 | 3 | 1 | 1/5 | 1/5 | 0.06 |
| Drone-R1 | 1/5 | 5 | 5 | 5 | 1 | 1/5 | 0.20 |
| Drone-R2 | 5 | 3 | 1 | 5 | 5 | 1 | 0.31 |
References
- Perez-Martinez, P.; Miranda, R.; Andrade, M.; Kumar, P. Air quality and fossil fuel driven transportation in the Metropolitan Area of São Paulo. Transp. Res. Interdiscip. Perspect. 2020, 5, 100137. [Google Scholar] [CrossRef]
- Wang, T.; Lin, B. Fuel consumption in road transport: A comparative study of China and OECD countries. J. Clean. Prod. 2019, 206, 156–170. [Google Scholar] [CrossRef]
- Denant-Boemont, L.; Faulin, J.; Hammiche, S.; Serrano-Hernandez, A. Valuations of Transport Nuisances and Cognitive Biases: A Survey Laboratory Experiment in the Pyrenees Region. Environ. Model. Assess. 2021, 1–16. Available online: https://link.springer.com/article/10.1007/s10666-021-09773-7 (accessed on 10 July 2020).
- Corlu, C.; De La Torre, R.; Serrano-Hernandez, A.; Juan, A.; Faulin, J. Optimizing energy consumption in transportation: Literature review, insights, and research opportunities. Energies 2020, 13, 1115. [Google Scholar] [CrossRef] [Green Version]
- Faulin, J.; Grasman, S.E.; Juan, A.A.; Hirsch, P. Sustainable transportation: Concepts and current practices. In Sustainable Transportation and Smart Logistics; Elsevier: Amsterdam, The Netherlands, 2019; pp. 3–23. [Google Scholar]
- Visser, J.; Nemoto, T.; Browne, M. Home Delivery and the Impacts on Urban Freight Transport: A Review. Procedia Soc. Behav. Sci. 2014, 125, 15–27. [Google Scholar] [CrossRef] [Green Version]
- Li, Y.; Zhao, R.; Liu, T.; Zhao, J. Does urbanization lead to more direct and indirect household carbon dioxide emissions? Evidence from China during 1996–2012. J. Clean. Prod. 2015, 102, 103–114. [Google Scholar] [CrossRef]
- Li, L.; Liu, Y. Spatial-Temporal Patterns and Driving Forces of Sustainable Urbanization in China since 2000. J. Urban Plan. Dev. 2019, 145, 05019014. [Google Scholar] [CrossRef]
- Yuan, W.; Li, J.; Meng, L.; Qin, X.; Qi, X. Measuring the area green efficiency and the influencing factors in urban agglomeration. J. Clean. Prod. 2019, 241, 118092. [Google Scholar] [CrossRef]
- Juan, A.A.; Kelton, W.D.; Currie, C.S.; Faulin, J. Simheuristics applications: Dealing with uncertainty in logistics, transportation, and other supply chain areas. In Proceedings of the 2018 Winter Simulation Conference (WSC), Gothenburg, Sweden, 9–12 December 2018; pp. 3048–3059. [Google Scholar]
- Toleuuly, A.; Yessengeldin, B.; Jumabaeva, S.; Zhanseitov, A. Contemporary problems and prospects of e-commerce development in modern conditions. Espacios 2019, 40, 24. [Google Scholar]
- Saha, S.; Zhuang, G.; Li, S. Will Consumers Pay More for Efficient Delivery? An Empirical Study of What Affects E-Customers’ Satisfaction and Willingness to Pay on Online Shopping in Bangladesh. Sustainability 2020, 12, 1121. [Google Scholar] [CrossRef] [Green Version]
- Ramkumar, B.; Ellie Jin, B. Examining pre-purchase intention and post-purchase consequences of international online outshopping (IOO): The moderating effect of E-tailer’s country image. J. Retail. Consum. Serv. 2019, 49, 186–197. [Google Scholar] [CrossRef]
- Comi, A.; Nuzzolo, A. Exploring the Relationships between e-shopping Attitudes and Urban Freight Transport. Transp. Res. Procedia 2016, 12, 399–412. [Google Scholar] [CrossRef]
- Capgemini Research Institute. The Last-Mile Delivery Challenge. 2019. Available online: https://www.capgemini.com/wp-content/uploads/2019/01/Report-Digital-%E2%80%93-Last-Mile-Delivery-Challenge1.pdf (accessed on 10 July 2020).
- Faulin, J.; Sarobe, P.; Simal, J. The DSS LOGDIS optimizes delivery routes for FRILAC’s frozen products. Interfaces 2005, 35, 202–214. [Google Scholar] [CrossRef] [Green Version]
- He, Y.; Wang, X.; Zhou, F.; Lin, Y. Dynamic vehicle routing problem considering simultaneous dual services in the last mile delivery. Kybernetes 2019, 49, 1267–1284. [Google Scholar] [CrossRef]
- Archetti, C.; Bertazzi, L. Recent challenges in Routing and Inventory Routing: E-commerce and last-mile delivery. Networks 2020, 77, 255–268. [Google Scholar] [CrossRef]
- Serrano-Hernandez, A.; Hirsch, P.; Faulin, J.; Fikar, C. The role of horizontal cooperation to improve service quality in last-mile distribution. Int. J. Simul. Process Model. 2018, 13, 299–309. [Google Scholar] [CrossRef]
- Serrano-Hernandez, A.; Faulin, J.; Hirsch, P.; Fikar, C. Agent-based simulation for horizontal cooperation in logistics and transportation: From the individual to the grand coalition. Simul. Model. Pract. Theory 2018, 85, 47–59. [Google Scholar] [CrossRef]
- Quintero-Araujo, C.L.; Gruler, A.; Juan, A.A.; Faulin, J. Using horizontal cooperation concepts in integrated routing and facility-location decisions. Int. Trans. Oper. Res. 2019, 26, 551–576. [Google Scholar] [CrossRef]
- Paddeu, D.; Parkhurst, G.; Fancello, G.; Fadda, P.; Ricci, M. Multi-stakeholder collaboration in urban freight consolidation schemes: Drivers and barriers to implementation. Transport 2018, 33, 913–929. [Google Scholar] [CrossRef] [Green Version]
- Allen, J.; Bektaş, T.; Cherrett, T.; Friday, A.; McLeod, F.; Piecyk, M.; Piotrowska, M.; Zaltz Austwick, M. Enabling a freight traffic controller for collaborative multidrop urban logistics: Practical and theoretical challenges. Transp. Res. Rec. 2017, 2609, 77–84. [Google Scholar] [CrossRef]
- Salama, M.; Srinivas, S. Joint optimization of customer location clustering and drone-based routing for last-mile deliveries. Transp. Res. Part C Emerg. Technol. 2020, 114, 620–642. [Google Scholar] [CrossRef]
- Jackson, A.; Srinivas, S. A Simulation-Based Evaluation of Drone Integrated Delivery Strategies for Improving Pharmaceutical Service. In Supply Chain Management in Manufacturing and Service Systems. International Series in Operations Research and Management Science; Srinivas, S., Rajendran, S., Ziegler, H., Eds.; Springer: Cham, Switzerland, 2021; Volume 304, pp. 185–204. [Google Scholar]
- Erdoĝan, S.; Miller-Hooks, E. A Green Vehicle Routing Problem. Transp. Res. Part E Logist. Transp. Rev. 2012, 48, 100–114. [Google Scholar] [CrossRef]
- Moghdani, R.; Salimifard, K.; Demir, E.; Benyettou, A. The green vehicle routing problem: A systematic literature review. J. Clean. Prod. 2021, 279, 123691. [Google Scholar] [CrossRef]
- Liu, C.; Wang, Q.; Susilo, Y. Assessing the impacts of collection-delivery points to individual’s activity-travel patterns: A greener last mile alternative? Transp. Res. Part E Logist. Transp. Rev. 2019, 121, 84–99. [Google Scholar] [CrossRef]
- Wygonik, E.; Goodchild, A. Urban form and last-mile goods movement: Factors affecting vehicle miles travelled and emissions. Transp. Res. Part D Transp. Environ. 2018, 61, 217–229. [Google Scholar] [CrossRef]
- Ranieri, L.; Digiesi, S.; Silvestri, B.; Roccotelli, M. A review of last mile logistics innovations in an externalities cost reduction vision. Sustainability 2018, 10, 782. [Google Scholar] [CrossRef] [Green Version]
- Klompmaker, J.; Janssen, N.; Bloemsma, L.; Gehring, U.; Wijga, A.; van den Brink, C.; Lebret, E.; Brunekreef, B.; Hoek, G. Residential surrounding green, air pollution, traffic noise and self-perceived general health. Environ. Res. 2019, 179, 108751. [Google Scholar] [CrossRef]
- Lu, X.; Kang, J.; Zhu, P.; Cai, J.; Guo, F.; Zhang, Y. Influence of urban road characteristics on traffic noise. Transp. Res. Part D Transp. Environ. 2019, 75, 136–155. [Google Scholar] [CrossRef]
- Morillas, J.; Gozalo, G.; González, D.; Moraga, P.; Vílchez-Gómez, R. Noise Pollution and Urban Planning. Curr. Pollut. Rep. 2018, 4, 208–219. [Google Scholar] [CrossRef]
- Sánchez, M.; López-Mosquera, N.; Lera-López, F.; Faulin, J. An Extended Planned Behavior Model to Explain the Willingness to Pay to Reduce Noise Pollution in Road Transportation. J. Clean. Prod. 2018, 177, 144–154. [Google Scholar] [CrossRef]
- Demir, E.; Huang, Y.; Scholts, S.; Van Woensel, T. A selected review on the negative externalities of the freight transportation: Modeling and pricing. Transp. Res. Part E Logist. Transp. Rev. 2015, 77, 95–114. [Google Scholar] [CrossRef]
- Pathak, D.; Thakur, L.; Rahman, S. Performance evaluation framework for sustainable freight transportation systems. Int. J. Prod. Res. 2019, 57, 6202–6222. [Google Scholar] [CrossRef]
- Reyes-Rubiano, L.; Faulin, J.; Calvet, L.; Juan, A. A simheuristic approach for freight transportation in smart cities. In Proceedings of the 2017 Winter Simulation Conference (WSC), Las Vegas, NV, USA, 3–6 December 2017; pp. 3346–3357. [Google Scholar]
- Boschmann, E.; Kwan, M.P. Toward socially sustainable urban transportation: Progress and potentials. Int. J. Sustain. Transp. 2008, 2, 138–157. [Google Scholar] [CrossRef]
- Hamurcu, M.; Eren, T. An application of multicriteria decision-making for the evaluation of alternative monorail routes. Mathematics 2018, 7, 16. [Google Scholar] [CrossRef] [Green Version]
- Faulin, J.; de Paz, E.; Lera-López, F.; Juan, Á.A.; Gil-Ramírez, I. Practice summaries: Distribution companies use the analytical hierarchy process for environmental assessment of transportation routes crossing the Pyrenees in Navarre, Spain. Interfaces 2013, 43, 285–287. [Google Scholar] [CrossRef] [Green Version]
- Islam, R.; Saaty, T. The analytic hierarchy process in the transportation sector. In Lecture Notes in Economics and Mathematical Systems; Springer: Berlin/Heidelberg, Germany, 2010; Volume 634, pp. 79–91. [Google Scholar]
- Sawik, B.; Faulin, J.; Pérez-Bernabeu, E. Multi-criteria optimization for fleet size with environmental aspects. Transp. Res. Procedia 2017, 27, 61–68. [Google Scholar] [CrossRef]
- Sawik, B.; Faulin, J.; Pérez-Bernabeu, E. Selected multi-criteria green vehicle routing problems. In Applications of Management Science; Emerald Publishing Limited: Bingley, UK, 2017. [Google Scholar]
- Caceres-Cruz, J.; Arias, P.; Guimarans, D.; Riera, D.; Juan, A.A. Rich Vehicle Routing Problem: A Survey. ACM Comput. Surv. 2014, 47, 1–28. [Google Scholar] [CrossRef]
- Toth, P.; Vigo, D. (Eds.) Vehicle Routing—Problems, Methods and Applications, 2nd ed.; SIAM—Society for Industrial and Applied Mathematics: Philadelphia, PA, USA, 2014. [Google Scholar]
- Serrano-Hernandez, A.; Juan, A.; Faulin, J.; Perez-Bernabeu, E. Horizontal collaboration in freight transport: Concepts, benefits, and environmental challenges. SORT 2017, 41, 1–22. [Google Scholar]
- Abdullahi, H.; Reyes-Rubiano, L.; Ouelhadj, D.; Faulin, J.; Juan, A.A. Modelling and Multi-criteria Analysis of the Sustainability Dimensions for the Green Vehicle Routing Problem. Eur. J. Oper. Res. 2020, 77, 95–114. [Google Scholar] [CrossRef]
- Saaty, T. How to make a decision: The analytic hierarchy process. Interfaces 1994, 24, 19–43. [Google Scholar] [CrossRef] [Green Version]
- Alvarez, P.; Serrano-Hernandez, A.; Faulin, J.; Juan, A. Using Modelling Techniques to Analyze Urban Freight Distribution. A Case Study in Pamplona (Spain). Transp. Res. Procedia 2018, 33, 37–74. [Google Scholar] [CrossRef]
- Juan, A.; Mendez, C.; Faulin, J.; De Armas, J.; Grasman, S. Electric vehicles in logistics and transportation: A survey on emerging environmental, strategic, and operational challenges. Energies 2016, 9, 86. [Google Scholar] [CrossRef] [Green Version]
- Figliozzi, M.A. Carbon emissions reductions in last mile and grocery deliveries utilizing air and ground autonomous vehicles. Transp. Res. Part D Transp. Environ. 2020, 85, 102443. [Google Scholar] [CrossRef]
- Reyes-Rubiano, L.; Voegl, J.; Rest, K.D.; Faulin, J.; Hirsch, P. Exploration of a disrupted road network after a disaster with an online routing algorithm. OR Spectr. 2021, 43, 289–326. [Google Scholar] [CrossRef]
- Macrina, G.; Pugliese, L.D.P.; Guerriero, F.; Laporte, G. Drone-aided routing: A literature review. Transp. Res. Part C Emerg. Technol. 2020, 120, 102762. [Google Scholar] [CrossRef]
- Lemardelé, C.; Estrada, M.; Pagès, L.; Bachofner, M. Potentialities of drones and ground autonomous delivery devices for last-mile logistics. Transp. Res. Part E Logist. Transp. Rev. 2021, 149, 102325. [Google Scholar] [CrossRef]
- Aurambout, J.P.; Gkoumas, K.; Ciuffo, B. Last mile delivery by drones: An estimation of viable market potential and access to citizens across European cities. Eur. Transp. Res. Rev. 2019, 11, 30. [Google Scholar] [CrossRef] [Green Version]


| Economic | Environmental | Social | |||||||
|---|---|---|---|---|---|---|---|---|---|
| Reference | Cost | Time | Load | Air | Noise | Visual | Safety | Life Quality | Road Use |
| He et al. [17] | √ | ||||||||
| Archetti and Bertazzi [18] | √ | ||||||||
| Serrano-Hernandez et al. [19] | √ | √ | |||||||
| Serrano-Hernandez et al. [20] | √ | √ | √ | ||||||
| Quintero-Araujo et al. [21] | √ | √ | √ | ||||||
| Paddeu et al. [22] | √ | √ | |||||||
| Allen et al. [23] | √ | √ | |||||||
| Salama and Srinivas [24] | √ | ||||||||
| Jackson and Srinivas [25] | √ | √ | |||||||
| Erdoĝan and Miller-Hooks [26] | √ | ||||||||
| Moghdani et al. [27] | √ | ||||||||
| Liu et al. [28] | √ | √ | |||||||
| Wygonik and Goodchild [29] | √ | √ | |||||||
| Ranieri et al. [30] | √ | ||||||||
| Klompmaker et al. [31] | √ | ||||||||
| Lu et al. [32] | √ | ||||||||
| Morillas et al. [33] | √ | ||||||||
| Sánchez et al. [34] | √ | √ | |||||||
| Demir et al. [35] | √ | √ | √ | ||||||
| Pathak et al. [36] | √ | √ | √ | ||||||
| Reyes-Rubiano et al. [37] | √ | √ | √ | ||||||
| Boschmann and Kwan [38] | √ | √ | √ | ||||||
| Hamurcu and Eren [39] | √ | √ | √ | ||||||
| Faulin et al. [40] | √ | √ | √ | √ | |||||
| Islam and Saaty [41] | √ | √ | √ | ||||||
| Sawik et al. [42] | √ | √ | |||||||
| Sawik et al. [43] | √ | √ | |||||||
| This paper | √ | √ | √ | √ | √ | √ | √ | √ | √ |
| 18–24 | 25–34 | 35–44 | 45–55 | 55–64 | >64 | ||
|---|---|---|---|---|---|---|---|
| Men | 22 | 5 | 10 | 10 | 8 | 0 | 55 |
| Women | 16 | 10 | 5 | 13 | 6 | 2 | 52 |
| 38 | 15 | 15 | 23 | 14 | 2 | 107 |
| Compared to the Second | Numerical Rating |
|---|---|
| Alternative, the First Alternative Is: | |
| Strongly preferred | 5 |
| Moderately preferred | 3 |
| Equally preferred | 1 |
| Moderately rejected | 1/3 |
| Strongly rejected | 1/5 |
| Criteria | Criteria Priority | Subcriteria | Subcriteria Priority |
|---|---|---|---|
| Economic | 0.09 | Shipping cost | 0.61 |
| Delivery time | 0.3 | ||
| Load optimization | 0.09 | ||
| Environmental | 0.3 | Air pollution | 0.48 |
| Noise pollution | 0.41 | ||
| Visual impact | 0.11 | ||
| Social | 0.61 | Pedestrian safety | 0.45 |
| Life quality | 0.45 | ||
| Road use | 0.1 |
| Decisional Matrix | Bike- R1 | Bike-R2 | Van-R1 | Van-R2 | Drone-R1 | Drone-R2 |
|---|---|---|---|---|---|---|
| Shippment Cost | 0.33 | 0.19 | 0.09 | 0.13 | 0.17 | 0.09 |
| Delivery Time | 0.13 | 0.06 | 0.11 | 0.14 | 0.37 | 0.19 |
| Vehicle Optimization | 0.16 | 0.08 | 0.17 | 0.34 | 0.13 | 0.13 |
| Road Use | 0.2 | 0.11 | 0.04 | 0.11 | 0.27 | 0.28 |
| Pedestrian Safety | 0.04 | 0.21 | 0.06 | 0.16 | 0.24 | 0.3 |
| Life Quality | 0.14 | 0.1 | 0.07 | 0.08 | 0.25 | 0.37 |
| Air Pollution | 0.29 | 0.12 | 0.06 | 0.02 | 0.28 | 0.23 |
| Noise Pollution | 0.18 | 0.15 | 0.04 | 0.08 | 0.25 | 0.3 |
| Visual Impact | 0.19 | 0.16 | 0.08 | 0.06 | 0.2 | 0.31 |
| Alternative | Priority |
|---|---|
| Drone-R2 | 0.2927 |
| Drone- R1 | 0.2484 |
| Bike- R1 | 0.1524 |
| Bike- R2 | 0.1429 |
| Van- R2 | 0.1016 |
| Van- R1 | 0.0620 |
| Consistency Index | Random Index | Consistency Ratio | |
|---|---|---|---|
| Among criteria | 0.0298 | 0.58 | 0.0514 |
| Economic criteria | 0.0760 | 0.58 | 0.1311 |
| Social criteria | 0.0314 | 0.58 | 0.0541 |
| Environmental criteria | 0.0167 | 0.58 | 0.0288 |
| Shipment cost | 0.1340 | 1.24 | 0.1081 |
| Delivery time | 0.1188 | 1.24 | 0.0958 |
| Vehicle optimization | 0.3032 | 1.24 | 0.2445 |
| Road use | 0.1884 | 1.24 | 0.1519 |
| Pedestrian safety | 0.1452 | 1.24 | 0.1171 |
| Life quality | 0.1327 | 1.24 | 0.1071 |
| Air pollution | 0.3238 | 1.24 | 0.2611 |
| Noise pollution | 0.0964 | 1.24 | 0.0777 |
| Visual impact | 0.1898 | 1.24 | 0.1531 |
Publisher’s Note: MDPI stays neutral with regard to jurisdictional claims in published maps and institutional affiliations. |
© 2021 by the authors. Licensee MDPI, Basel, Switzerland. This article is an open access article distributed under the terms and conditions of the Creative Commons Attribution (CC BY) license (https://creativecommons.org/licenses/by/4.0/).
Share and Cite
Serrano-Hernandez, A.; Ballano, A.; Faulin, J. Selecting Freight Transportation Modes in Last-Mile Urban Distribution in Pamplona (Spain): An Option for Drone Delivery in Smart Cities. Energies 2021, 14, 4748. https://doi.org/10.3390/en14164748
Serrano-Hernandez A, Ballano A, Faulin J. Selecting Freight Transportation Modes in Last-Mile Urban Distribution in Pamplona (Spain): An Option for Drone Delivery in Smart Cities. Energies. 2021; 14(16):4748. https://doi.org/10.3390/en14164748
Chicago/Turabian StyleSerrano-Hernandez, Adrian, Aitor Ballano, and Javier Faulin. 2021. "Selecting Freight Transportation Modes in Last-Mile Urban Distribution in Pamplona (Spain): An Option for Drone Delivery in Smart Cities" Energies 14, no. 16: 4748. https://doi.org/10.3390/en14164748