
Carbon-Negative Scenarios in High CO2 Gas Condensate Reservoirs


Faculty of Mining, Geology and Petroleum Engineering, University of Zagreb, Pierottijeva 6, 10000 Zagreb, Croatia
*
Author to whom correspondence should be addressed.
Energies 2021, 14(18), 5898; https://doi.org/10.3390/en14185898
Submission received: 31 July 2021
/
Revised: 9 September 2021
/
Accepted: 11 September 2021
/
Published: 17 September 2021
(This article belongs to the Special Issue Advances in Natural Gas Engineering)
Abstract
:A gas condensate reservoir in Northern Croatia was used as an example of a CO2 injection site during natural gas production to test whether the entire process is carbon-negative. To confirm this hypothesis, all three elements of the CO2 life cycle were included: (1) CO2 emitted by combustion of the produced gas from the start of production from the respective field, (2) CO2 that is separated at natural gas processing plant, i.e., the CO2 that was present in the original reservoir gas composition, and (3) the injected CO2 volumes. The selected reservoir is typical of gas-condensate reservoirs in Northern Croatia (and more generally in Drava Basin), as it contains about 50% CO2 (mole). Reservoir simulations of history-matched model showed base case (production without injection) and several cases of CO2 enhanced gas recovery, but with a focus on CO2 storage rather than maximizing hydrocarbon gas production achieved by converting a production well to a CO2 injection well. General findings are that even in gas reservoirs with such extreme initial CO2 content, gas production with CO2 injection can be carbon-negative. In almost all simulated CO2 injection scenarios, the process is carbon-negative from the time of CO2 injection, and in scenarios where CO2 injection begins earlier, it is carbon-negative from the start of gas production, which opens up the possibility of cost-effective storage of CO2 while producing natural gas with net negative CO2 emissions.
1. Introduction
The biggest anthropogenic CO2 emissions contributors are fossil fuels combustion, iron, steel, cement, and fertilizers production and agriculture [1]. Being the biggest emitters, those industries are the very best candidates for carbon capture, utilization and storage (CCUS) technologies aiming at zero emission future. The first, and usually the most expensive step (60–85% of the overall costs) in any CCUS project is the CO2 separation from the reservoir fluid stream [1]. The CO2 sources are generally classified in two groups: (1) point sources (e.g., power plants, refineries, natural gas sources with CO2 content ranging from 4 to 100% and (2) scattered sources (implies CO2 capture from the atmosphere, where the concentration is significantly lower—400 ppm, or 0.04%).
Petroleum industry utilizes CO2 for enhanced oil recovery (EOR), where CO2 is commercially valued as raw material. However, due to high costs of CO2 purchase, EOR incentives are adjusted to minimize the CO2 use while maximizing the hydrocarbon production. If the incentive scheme changed, e.g., carbon charge, EOR economics would also change, and CO2 storage estimation (potentially measured in Gt regionally) would become crucial, along with a simultaneous estimation of the commercial value of the produced hydrocarbons [2].
Carbon dioxide utilization in EOR processes has been successfully applied for over 40 years [3,4,5], and there are numerous reports regarding specific projects [6,7,8,9], and even specific problems [10,11], as opposed to CO2 enhanced gas recovery (CO2-EGR), that has been more intensively developed only in the last 20 or so years [12,13,14], especially for tight or gas-condensate reservoirs [15,16,17]. Some of the reasons for such a low level of the CO2 injection research into natural gas reservoirs are high costs and high risk in production estimation. i.e., CO2-breakthrough prediction. The injected CO2 moves toward the injection wells and in this case, gas rate drops significantly, while the CO2 production increases ([18,19]).
Physical CO2 properties provide potentially feasible conditions for a reservoir repressurization [15,19,20,21]. CO2 is 2–6 times denser in the reservoir conditions and consequently has lower mobility compared to methane, which should enable the CO2 migration downward. This way, an effective methane displacement occurs. Solubility factor is another interesting property—CO2 is potentially more soluble in brine than methane in reservoir conditions, and this feature delays the CO2 breakthrough.
Natural gas reservoirs have significantly higher potential for CO2 retention compared to depleted oil reservoirs, considering the same original fluid volumes in the reservoirs. Ultimate gas recovery reaches approximately 65% of the initial gas in place, which is almost double the usual primary ultimate oil recovery (35%).
Recently, attractive technologies have been those that ensure a secure gas supply in a carbon neutral, but more importantly, carbon-negative manner. It is usually necessary to analyze some complex concepts, such as Bioenergy with Carbon Capture and Storage (BECCS), or Direct Air Carbon Capture and Storage (DACCS). Such concepts encompass different CO2 Capture and Utilization (CCU) or cogeneration technology sets, usually accompanied by a wide range of estimated necessary prices (penalties) of CO2 emissions or emitted CO2 quantities [22].
Since no similar example of analysis can be found in the literature, the motivation of this study is to show that the production process from a gas reservoir with extremely high CO2 content (about 50%mol) can be carbon-negative when evaluated from cradle to grave. Except from the company’s point of view, potentially carbon negative scenarios in already producing fields are attractive considering the technological and ecology frontiers as they encompass the use of highly efficient solutions that are in line with environment goals, i.e., CO2 emissions reduction, which is currently not only a matter of isolated actions of few ‘green’ groups, but organized political effort recognized on an international level. An existing gas reservoir model was tuned (history matched) to real experimental and production data without increasing the complexity of the whole process, i.e., by converting a production well into a CO2 injector. The results might help in the economic evaluation of the conditions under which the process could be cost-effective.
2. Materials and Methods
In the last 20 years, CO2-EGR related research has intensified, and within this work, a hypothetical-deductive research model [23] has been applied to test the hypothesis that carbon negative scenarios can be achieved in petroleum industry upstream. The quantitative methods used included the emission calculation according to published equations after different scenarios have been simulated to obtain the produced gas composition from a real geological model that had previously been validated. If only storage of CO2 is considered, estimates of the CO2 storage potential in depleted gas reservoirs can be considered simple, and estimates of CO2 storage capacities can be reliably assessed by a simple (volumetric) material balance formula [24]:
where Gi is the initial (original) gas in place at standard conditions (m3, s.c. or sm3). Gp is the produced gas volume (sm3), is the CO2 storage capacity (sm3), Bgi is the initial gas formation volume factor:
where is volume of the gas at reservoir conditions and is the volume of same (number of moles) gas at standard (surface) conditions. is formation volume factor of CO2 and natural gas (remained) in reservoir, at final injection conditions, and total molar composition of the system (mixture of original gas composition in the reservoir and CO2) and can be calculated by some of commonly used cubic equations of state ([25,26,27]).
If data about produced gas are accurate, the above equations are useful for static estimates of CO2 storage capacity as initial screening parameter. However, to estimate dynamic change of injectivity, more details about CO2 injection strategy and about reservoir properties are required [28,29]. Injectivity mainly depends on reservoir permeability, heterogeneity and on reservoir and injection pressure. In zones where CO2 saturation increases, relative permeability will also increase [30,31], which consequently increases injectivity, but the pressure will also be increased, which requires more energy for CO2 compression and higher injection costs [32,33].
Immiscible process might occur when natural gas is displaced by supercritical CO2, which is described through effects of relative permeability [30,34], as more detailed (microscopic = pore scale or core scale) rock-fluid interactions, like miscibility, wettability and interfacial tension (of rock-CO2-natural gas-brine system) changes [35,36] are hard to include in (upscale to) reservoir-scale simulation models.
In this work, the Petrel RE (i.e., compositional Eclipse 300) reservoir simulation package was used (provided by Schlumberger), which makes it possible to include complex geological model and well models, and perform history matching with past production data (essentially well pressures and production rates, allowing validation of the spatial distribution of properties that are affecting multiphase porous flow).
Such dynamic models require data on relative reservoir geometry (including 3D fault modeling), porosity and permeability, and rock physics (relative permeability tables, capillary pressure tables, pore compressibility correlation, fluid compositions, and tuned equation-of-state parameters) and well data (completion data, skin factor, etc.). Since CO2 is injected under high pressure, it is certainly in the supercritical state, which is treated as a liquid phase in the reservoir simulator. This allows some CO2-natural gas relationships to be defined (the most important being relative permeability), and in this real case all parameters were used as tuning parameters for the history match).
By using such compositional simulator, detailed simulation of different future scenarios is possible, including (beside saturation and pressure change in 3D space with time) fluid compositions, among which gas composition is crucial as CO2 emissions depend on the quality of the combusted gas considering its carbon content. The method of checking the carbon-negativity consists of calculating the overall emissions.
With known composition and volume of the ‘pure’ natural gas (gas from which CO2 is removed) CO2 emissions resulting from gas being used as fuel can be stoichiometrically calculated [37]: Produced gas (without CO2) will be the source of new CO2 emissions. Based on the known composition of the pure gas produced, these emissions can be calculated (assuming 100% efficient natural gas combustion) using the stoichiometric relationships [37]:
where:
- —amount of produced CO2, kg
- V—(flaring) gas volume, m3
- molar volume conversion—conversion from molar volume to mass (23.685 m3/kgmole)
- —molecular weight of carbon dioxide, g/mol
- zi—molar fraction of component i, fraction
- Cc—carbon content of the mixture:
- wi—weight fraction of component i,
- —carbon content of (hydrocarbon) component i (mass part of unit):
- MC—molecular weight of carbon (MC = 12 g/mol)
- x—stoichiometric coefficient for carbon (number of carbon atoms in a molecule)
- Mi—molecular weight of component, g/mol
For plus fraction, stoichiometric coefficient (x) is determined proportionally to its molar weight:
The observed reservoir was modeled with a unique gas-water contact at an absolute depth of −2525 m, which was determined based on testing and analysis of well-logs (Figure 1).
The model was spatially populated with porosity data (Figure 2) by the kriging method.
Before the development of scenarios for the purposes of this study, several preliminary checks were made on simplified models in terms of reducing the total number of cells and it was concluded that a satisfactory history match can be obtained with smaller models. For the needs of the dynamic model, a function is set to populate the model with permeability data and to include permeability anisotropy.
Function parameters were selected based on empirically proven relationships and performed and interpreted hydrodynamic measurements on wells of the reservoir, since laboratory core measurements are insufficient (too few data, i.e., 37 samples were measured from one well and 7 from the other, while other cores, if taken, were not used for petrophysical analyses). and they are not representative to be taken into account when determining reservoir permeability.
Reservoir fluid composition, which contains about 50% CO2, also contributes to the complexity of the system, which can be described as retrograde, gas-condensate. A sample from one of the wells taken before the start of reservoir exploitation was used to describe the fluid (Table 1).
Finally, history-matched model with small number of gridblocks (NX × NY × NZ = 28 × 30 × 9, which contains 7560 gridblocks—simulation cells) was used for simulating different scenarios of CO2 injection.
The input data for the calculation of CO2 emissions consists of a result data set for the base case (no injection at all) and result data sets for six simulation cases with simultaneous injection and production.
Production data for this gas reservoir are available for the period of 16.5 years, where the initial reservoir pressure (pi) of 396 bar at −2483 m (the reservoir brunt true vertical depth) has dropped to 51.5% of the respective pressure (simulation result, while the last measured data from the wells, and translated to average reservoir pressure at the brunt is 236 bar after 14.5 years). After tuning the reservoir parameters and obtaining a satisfactory quality of matching, the model can be used for different scenarios simulation and boundary conditions. The reservoir is rather small and developed with three production wells.
For overall CO2 emissions analysis, two different EGR timings were chosen—early (EGR1) and late (EGR2). In order to compare the reservoir behavior with and without the application of enhanced recovery method, it was necessary to simulate the case in which the production continues in all 3 wells (after history matching of the first 8 years and validation of the model for the rest of the period for which real data exist). The base case was initiated at 0.75 of pi, which is the point in time for which real data still exist (and previous production and pressure are history matched). Adjusting the flowing bottom pressure in each well to 0.87 of the average (current) reservoir pressure (pr) resulted in satisfactory matching of the cumulative gas production and pressure decline according to the next set of data. The rest of the production period (until the end of 40 years, which is a reasonable period for such a reservoir) is made of the base case scenario with the same drawdown. In the injection scenarios, two wells are kept as producers, while the third one becomes an injector. Injection is also defined through pressure multipliers (PM) for both EGR timings (Table 2).
3. Results and Discussion
Only one EGR scenario failed to reach the base case considering the cumulatively produced total gas (gas with CO2), while ‘pure’ gas cumulatively produced showed suboptimal results of these development schemes (Figure 3). This can be ascribed to the reservoir fluid contamination, but the fact that there is one production well less should also be kept in mind.
Regardless of the previously stated shortcoming of such scenarios, total CO2 emissions were calculated for each of them.
Considering the high CO2 content in the reservoir fluid, and assuming this CO2 will be separated before gas is used (combusted), the original gas composition was normalized before emissions calculation (Table 3).
This composition eventually yields lower cumulative CO2 emissions for all EGR scenarios comparing to the base case (Figure 4).
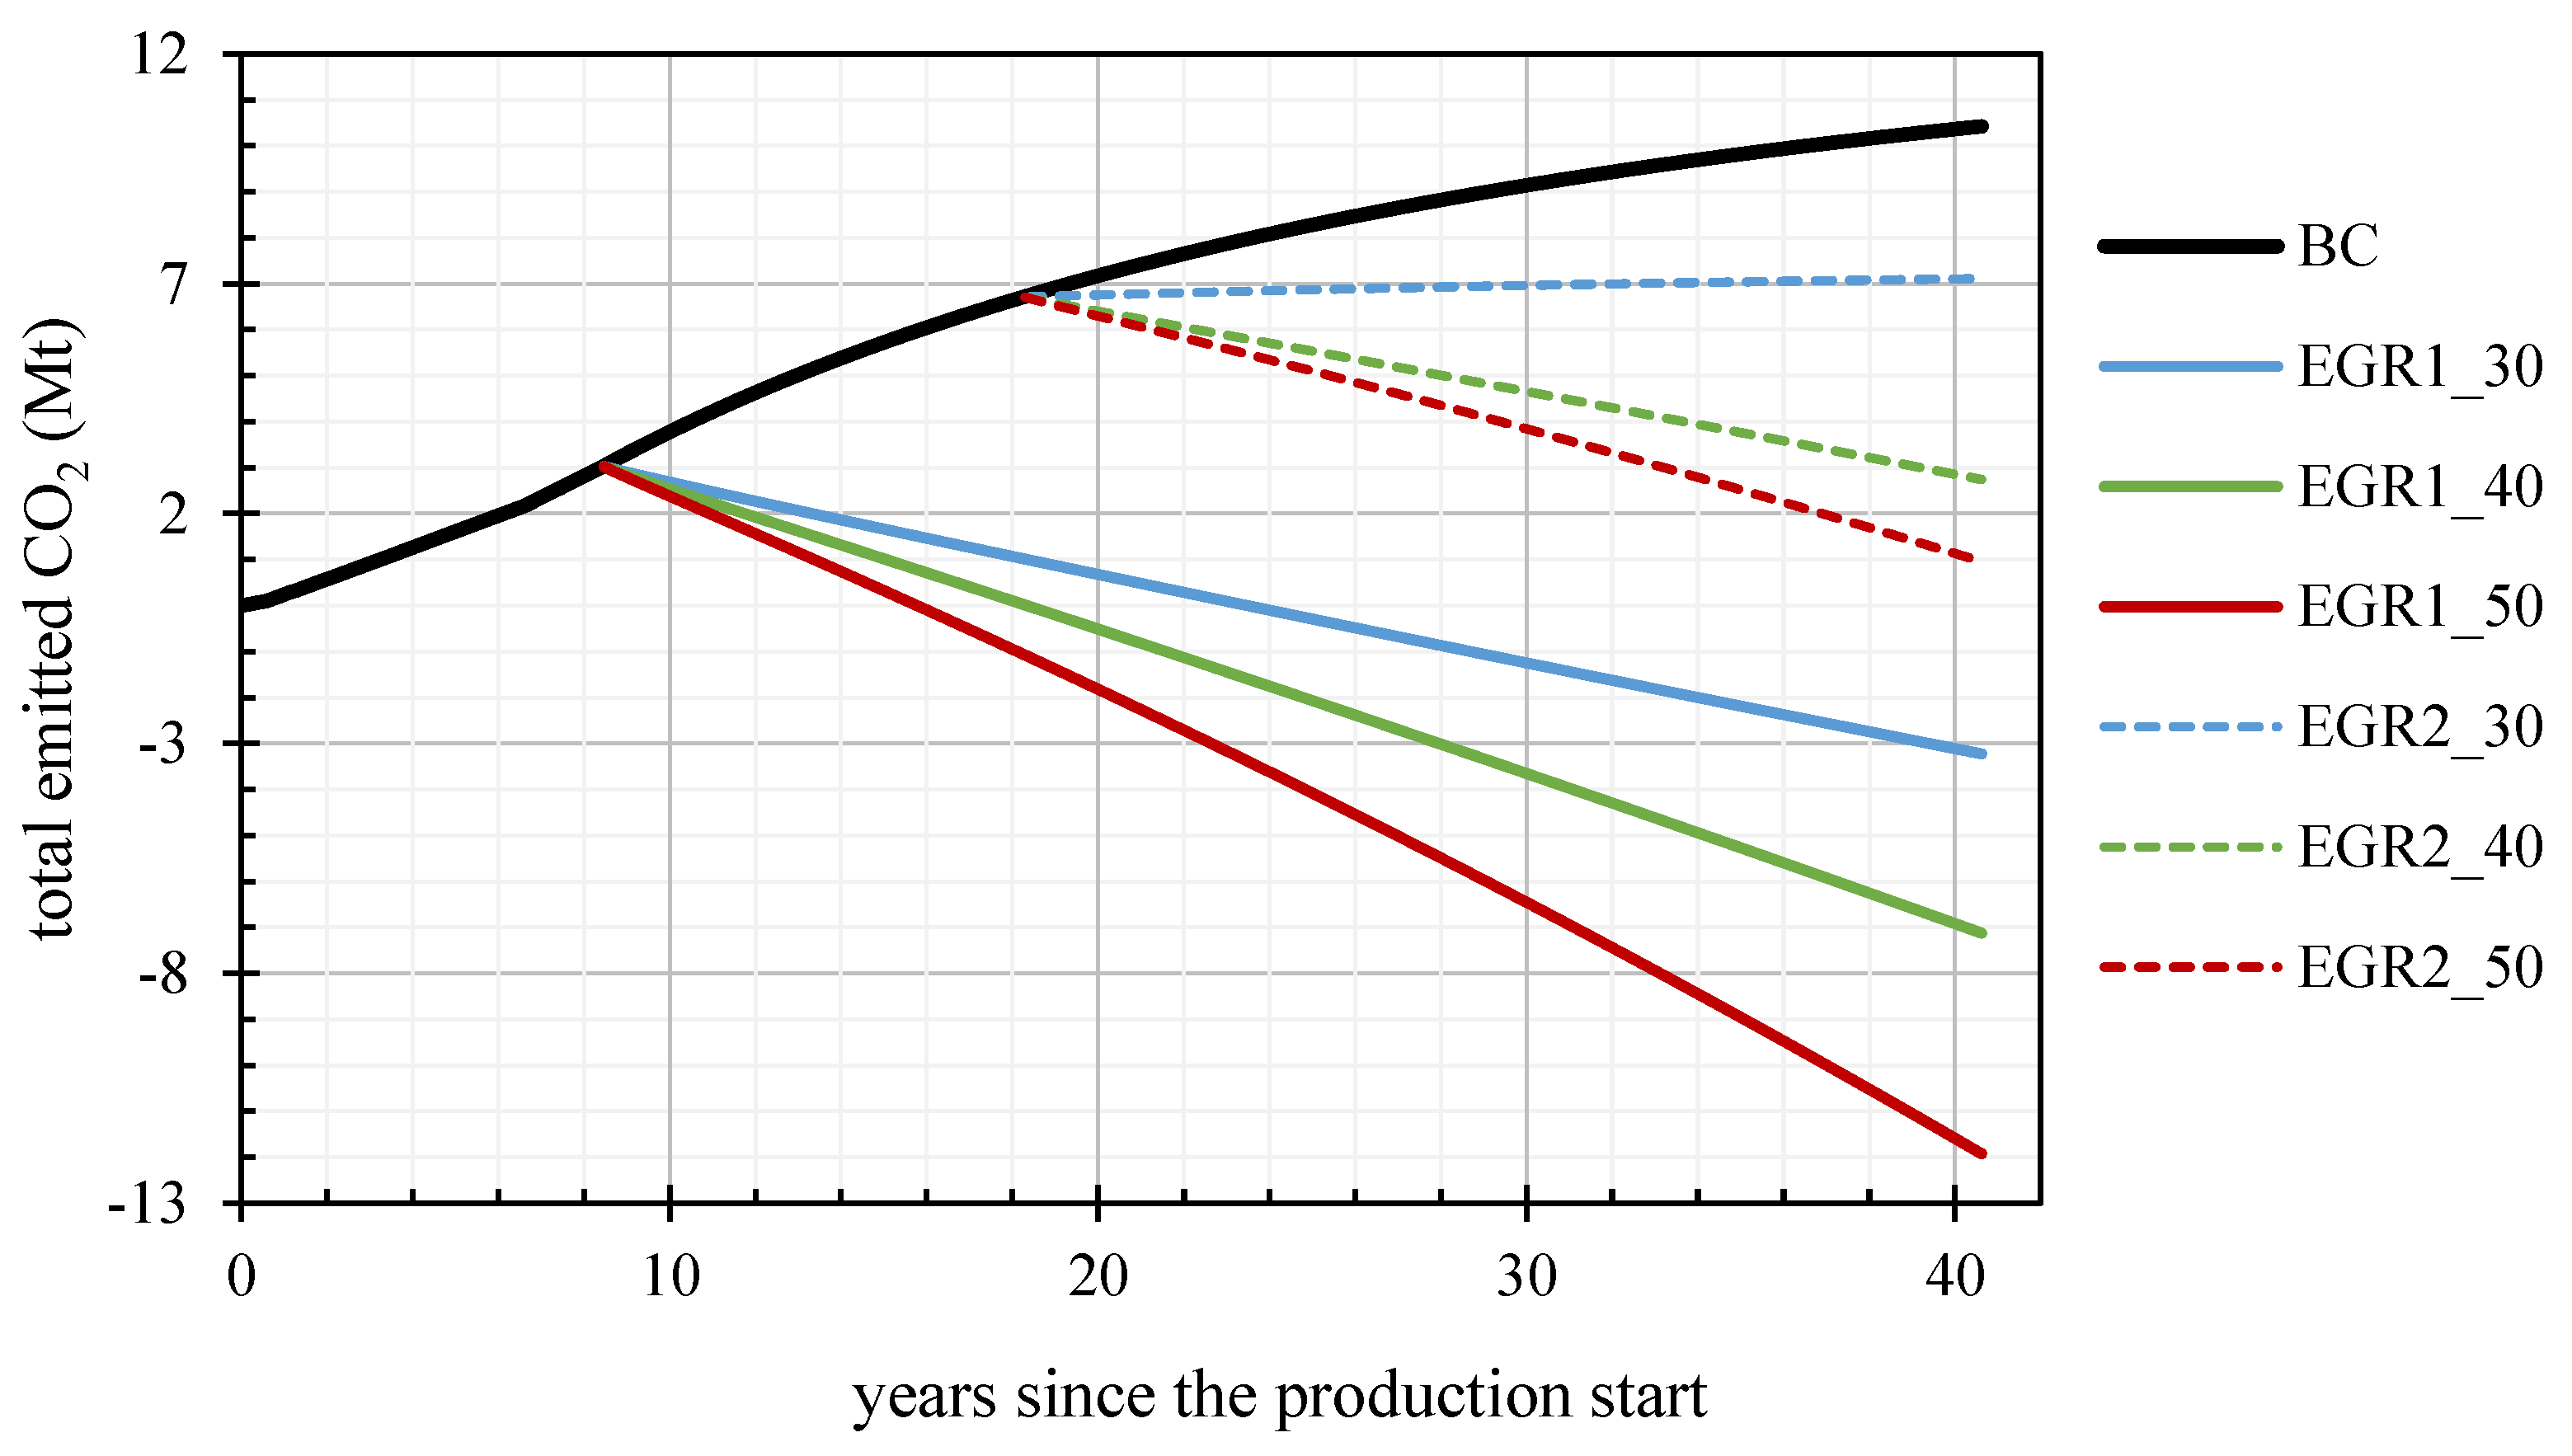
For carbon ‘negativity’ assessment of the EGR process itself (cradle-to-gate), it is necessary to observe the difference between CO2 cumulatively produced and injected (Figure 5). However, the most interesting result is the ‘net’ CO2 obtained in each scenario, i.e., the CO2 that would be emitted, or avoided by injection (Figure 6). This value is obviously dominated by the difference of produced and injected CO2 trend, and negativity can be explained by, and ascribed to higher quantities of CO2 injected than produced. Considering it was shown that in the case of high content in the original fluid, earlier EGR scenarios yield better results as significantly more CO2 is injected than produced compared to the base case, they can be declared as carbon negative. Later EGR scenarios could be considered more adequate for reservoir conversion to a CO2 storage facility as they result in higher ‘pure’ gas cumulative and lower total gas cumulative (Figure 3).
CO2 enhanced gas recovery for the case of a typical natural gas-condensate reservoir in the Northern Croatia, with high CO2 content (around 50%) mole was simulated to assess production possibilities in the transition period until zero-emission in 2050 are achieved in the European Union. This makes the analysis different from CO2-EGR studies—with a focus on CO2 emissions, which is the opposite of usual EOR studies, where the objective is the maximum possible hydrocarbon recovery. Total amounts of CO2 from both capture (which actually takes place in natural gas processing plants and thus represents one of the largest CO2 point sources in Croatia) and combustion of the hydrocarbon portion of the gas produced were taken into account.
This is novel approach, as “pure gas” production was shown, and in this particular case, when more than a half of produced fluid (before CO2 injection) is CO2 such representation of results makes a big difference (Figure 3).
4. Conclusions
The production of pure gas in this particular reservoir can be optimized by short-period CO2 injection, however this was not in the scope of this study. Features of the simulation results and the analysis are:
- all CO2 injection scenarios result with lower total pure (hydrocarbon) gas production than base case (without CO2 injection)
- lower cumulative hydrocarbon productions should be attributed to the fact that one production well is converted to CO2 injection well, causing instantaneous production rate decrease.
- lower cumulative hydrocarbon productions can also be attributed to CO2 breakthrough from injection to production wells and it can be connected to the fact that later start of CO2 injection (EGR2 cases) results in higher cumulative production
- also, higher pure hydrocarbon cumulative production is observed for cases with lower CO2 injection pressure (consequently, lower CO2 injection rate)
- the increase in CO2 production after breakthrough is smaller than CO2 retention—the difference between injected and produced CO2 is so large, that, from the beginning of CO2 injection, all EGR case, except EGR2_30 become carbon negative (negative slope of EGR cases shown in the last figure)
The motivation of this study is to show that natural gas production can be carbon-negative if all emissions, even those from produced gas combustion are counted. Economic feasibility in this case will depend only on CO2 compression costs and cost of conversion of one producing well (which is significantly less than for drilling a new one) as capital expenses and on fiscal system related to CO2 capture, utilization and storage, as the production of natural gas at such field will be reduced. If stored and avoided CO2 is counted as a value (negative) cost, CO2 injection at natural gas fields becomes a great opportunity both to reduce CO2 from the atmosphere and to produce natural gas cost-effectively. Two main EGR strategies, one in early stage of production and one in later stage near depletion indicate also two opportunities for different business strategies
Early start of CO2 injection would be feasible if CCS is to be acknowledged as the opportunity for storage of great amounts of CO2. In that case, the process should be recognized as utilization (carbon capture, utilization and storage, CCUS), as total CO2 emissions from produced gas can be only a half of the CO2 stored.
If CO2 injection would start at near-depleted high CO2-content gas reservoirs, that would make such gas fields carbon-neutral considering the cradle to grave cycle.
Author Contributions
Conceptualization, D.V.; methodology, D.V.; validation, L.J. and D.V.; formal analysis, L.J., D.V., V.K., M.A.; investigation, L.J., D.V., V.K.; data curation, L.J. and V.K.; writing—original draft preparation, L.J., D.V., V.K.; writing—review and editing, L.J., D.V., V.K., M.A.; visualization, D.V. and M.A.; supervision, D.V.; funding acquisition D.V. All authors have read and agreed to the published version of the manuscript.
Funding
The APC was funded by Strategy CCUS project, grant agreement No. 837754.
Institutional Review Board Statement
Not applicable.
Informed Consent Statement
Not applicable.
Data Availability Statement
Not applicable.
Acknowledgments
A part of this research was performed for additional analyses related to EUH2020 (European Union’s Horizon 2020 research and innovation programme) Strategy CCUS project, grant agreement No. 837754.
Conflicts of Interest
The authors declare no conflict of interest. The funders had no role in the design of the study; in the collection, analyses, or interpretation of data; in the writing of the manuscript, or in the decision to publish the results.
References
- Orr, F.M. Carbon Capture, Utilization, and Storage: An Update. SPE J. 2018, 23, 2444–2455. [Google Scholar] [CrossRef]
- Majumdar, A.; Deutch, J. Research Opportunities for CO2 Utilization and Negative Emissions at the Gigatonne Scale. Joule 2018, 2, 805–809. [Google Scholar] [CrossRef] [Green Version]
- Rojas, G.; Ali, S.M.F. Scaled Model Studies of Carbon Dioxide/Brine Injection Strategies for Heavy Oil Recovery from Thin Formations. J. Can. Pet. Technol. 1986, 25. [Google Scholar] [CrossRef]
- Blunt, M.; Fayers, F.J.; Orr, F.M. Carbon dioxide in enhanced oil recovery. Energy Convers. Manag. 1993, 34, 1197–1204. [Google Scholar] [CrossRef]
- Holm, L.W. Status of CO2 and Hydrocarbon Miscible Oil Recovery Methods. J. Pet. Technol. 1976, 28, 76–84. [Google Scholar] [CrossRef]
- Bealessio, B.A.; Alonso, N.A.B.; Mendes, N.J.; Sande, A.V.; Hascakir, B. A review of enhanced oil recovery (EOR) methods applied in Kazakhstan. Petroleum 2021, 7, 1–9. [Google Scholar] [CrossRef]
- Pittaway, K.R.; Hoover, J.W.; Deckert, L.B. Development and Status of the Maljamar CO2 Pilot. J. Pet. Technol. 1985, 37, 537–544. [Google Scholar] [CrossRef]
- Kane, A.V. Performance Review of a Large-Scale CO2-WAG Enhanced Recovery Project, SACROC Unit Kelly-Snyder Field. J. Pet. Technol. 1979, 31, 217–231. [Google Scholar] [CrossRef]
- Carcoana, A.N. Enhanced Oil Recovery in Rumania; Society of Petroleum Engineers: Tulsa, OK, USA, 1982. [Google Scholar] [CrossRef]
- Ormiston, R.M.; Luce, M.C. Surface Processing of Carbon Dioxide in EOR Projects. J. Pet. Technol. 1986, 38, 823–828. [Google Scholar] [CrossRef]
- Adams, G.H.; Rowe, H.G. Slaughter Estate Unit CO2 Pilot—Surface and Downhole Equipment Construction and Operation in the Presence of H2S. J. Pet. Technol. 1981, 33, 1065–1074. [Google Scholar] [CrossRef]
- Oldenburg, C.; Stevens, S.; Benson, S. Economic feasibility of carbon sequestration with enhanced gas recovery (CSEGR). Energy 2004, 29, 1413–1422. [Google Scholar] [CrossRef] [Green Version]
- Sim, S.S.K.; Turtata, A.T.; Singhal, A.K.; Hawkins, B.F. Enhanced Gas Recovery: Factors Affecting Gas-Gas Displacement Efficiency. J. Can. Pet. Technol. 2009, 48, 49–55. [Google Scholar] [CrossRef]
- Kalra, S.; Wu, X. SPE-169578-MS CO2 Injection for Enhanced Gas Recovery. In Proceedings of the SPE Western North American and Rocky Mountain Joint Meeting, Denver, CO, USA, 15–18 April 2014; Society of Petroleum Engineers: Richardson, TX, USA; pp. 16–18. [Google Scholar] [CrossRef]
- Ping, G.; Shasha, J.; Caizhen, P. Technologies and countermeasures for gas recovery enhancement. Nat. Gas Ind. B 2014, 1, 96–102. [Google Scholar] [CrossRef] [Green Version]
- Carpenter, C. Enhanced Gas Recovery by CO2 Sequestration vs. Refracturing Treatment. J. Pet. Technol. 2015, 67, 125–127. [Google Scholar] [CrossRef]
- Baek, S.; Akkutlu, I.Y. Enhanced Recovery of Nanoconfined Oil in Tight Rocks Using Lean Gas (C2H6 and CO2) Injection. SPE J. 2021, 26, 2018–2037. [Google Scholar] [CrossRef]
- Van der Meer, B. Carbon dioxide storage in natural gas reservoir. Oil Gas Sci. Technol. 2005, 60, 527–536. [Google Scholar] [CrossRef]
- Khan, C.; Amin, R.; Madden, G. Carbon dioxide injection for enhanced gas recovery and storage (reservoir simulation). Egypt. J. Pet. 2013, 22, 225–240. [Google Scholar] [CrossRef] [Green Version]
- Khan, C.; Amin, R.; Madden, G. Effects of CO2 and acid gas injection on enhanced gas recovery and storage. J. Pet. Explor. Prod. Technol. 2013, 3, 55–60. [Google Scholar] [CrossRef] [Green Version]
- Narinesingh, J.; Alexander, D. CO2 Enhanced Gas Recovery and Geologic Sequestration in Condensate Reservoir: A Simulation Study of the Effects of Injection Pressure on Condensate Recovery from Reservoir and CO2 Storage Efficiency. Energy Procedia 2014, 63, 3107–3115. [Google Scholar] [CrossRef] [Green Version]
- Full, J.; Merseburg, S.; Miehe, R.; Sauer, A. A New Perspective for Climate Change Mitigation—Introducing Carbon-Negative Hydrogen Production from Biomass with Carbon Capture and Storage (HyBECCS). Sustainability 2021, 13, 4026. [Google Scholar] [CrossRef]
- Borowski, P.F. Significance and Directions of Energy Development in African Countries. Energies 2021, 14, 4479. [Google Scholar] [CrossRef]
- Lai, Y.-T.; Shen, C.-H.; Tseng, C.-C.; Fan, C.-H.; Hsieh, B.-Z. Estimation of Carbon Dioxide Storage Capacity for Depleted Gas Reservoirs. Energy Procedia 2015, 76, 470–476. [Google Scholar] [CrossRef] [Green Version]
- Peng, D.-Y.; Robinson, D.B. A New Two-Constant Equation of State. Ind. Eng. Chem. Fundam. 1976, 15, 59–64. [Google Scholar] [CrossRef]
- Stryjek, R.; Vera, J.H. PRSV: An improved peng-Robinson equation of state for pure compounds and mixtures. Can. J. Chem. Eng. 1986, 64, 323–333. [Google Scholar] [CrossRef]
- Soave, G. Equilibrium constants from a modified Redlich-Kwong equation of state. Chem. Eng. Sci. 1972, 27, 1197–1203. [Google Scholar] [CrossRef]
- Vulin, D.; Saftić, B.; Macenić, M. Estimate of dynamic change of fluid saturation during CO2 injection—Case study of a regional aquifer in Croatia. Interpretation 2018, 6, SB51–SB64. [Google Scholar] [CrossRef]
- Loizzo, M.; Lecampion, B.; Bérard, T.; Harichandran, A.; Jammes, L. Reusing O&G-Depleted Reservoirs for CO2 Storage: Pros and Cons. SPE Proj. Facil. Constr. 2010, 5, 166–172. [Google Scholar] [CrossRef]
- Al-Abri, A.; Hiwa, S.; Robert, A. Experimental investigation of the velocity-dependent relative permeability and sweep efficiency of supercritical CO2 injection into gas condensate reservoirs. J. Nat. Gas Sci. Eng. 2009, 1, 158–164. [Google Scholar] [CrossRef]
- Hamza, A.; Hussein, I.A.; Al-Marri, M.J.; Mahmoud, M.; Shawabkeh, R.; Aparicio, S. CO2 enhanced gas recovery and sequestration in depleted gas reservoirs: A review. J. Pet. Sci. Eng. 2021, 196, 107685. [Google Scholar] [CrossRef]
- Zhang, L.; Niu, B.; Ren, S.; Zhang, Y.; Yi, P.; Mi, H.; Ma, Y. Assessment of CO2 Storage in DF1-1 Gas Field South China Sea for a CCS Demonstration. J. Can. Pet. Technol. 2010, 49, 9–14. [Google Scholar] [CrossRef]
- Trivedi, J.J.; Babadagli, T.; Lavoie, R.G.; Nimchuk, D. Acid Gas Sequestration During Tertiary Oil Recovery: Optimal Injection Strategies and Importance of Operational Parameters. J. Can. Pet. Technol. 2007, 46. [Google Scholar] [CrossRef]
- Sidiq, H.; Amin, R. The Impact of Pore Pressure on CO2-Methane Displacement. Pet. Sci. Technol. 2012, 30, 2531–2542. [Google Scholar] [CrossRef]
- Honari, A.; Zecca, M.; Vogt, S.J.; Iglauer, S.; Bijeljic, B.; Johns, M.L.; May, E.F. The impact of residual water on CH4-CO2 dispersion in consolidated rock cores. Int. J. Greenh. Gas Control 2016, 50, 100–111. [Google Scholar] [CrossRef]
- Kashefi, K.; Pereira, L.M.C.; Chapoy, A.; Burgass, R.; Tohidi, B. Measurement and modelling of interfacial tension in methane/water and methane/brine systems at reservoir conditions. Fluid Phase Equilib. 2016, 409, 301–311. [Google Scholar] [CrossRef]
- Sedlar, D.K.; Vulin, D.; Jukić, L.; Smajla, I. Possibility of decreasing CO2 emissions from flaring on a mature oil field. J. Pet. Sci. Eng. 2018, 171, 1302–1308. [Google Scholar] [CrossRef]
Figure 1.
Contour map of the formation top depths with the gas/water contact.

Figure 2.
D porosity distribution model.

Figure 3.
Total and ‘pure’ gas cumulative production.

Figure 4.
Comparison of CO2 emissions in the base case and each EGR scenario.

Figure 5.
Difference between the produced and injected CO2.

Figure 6.
Total emitted CO2 in each scenario.

Table 1.
Gas composition used in simulations.
| Component | %mol |
|---|---|
| N2 | 1.98 |
| CO2 | 48.95 |
| C1 | 45.41 |
| C2 | 1.66 |
| C3 | 0.36 |
| iC4 | 0.13 |
| nC4 | 0.22 |
| iC5 | 0.07 |
| nC5 | 0.07 |
| C6 | 0.16 |
| C7 | 0.15 |
| C8 | 0.11 |
| C9 | 0.10 |
| C10+ | 0.63 |
| total | 100.00 |
Table 2.
List of simulation scenarios.
| EGR Scenario | Timing | PM (iBHP = PM∙pr) |
|---|---|---|
| EGR1_30 | 0.75∙pi | 1.3 |
| EGR1_40 | 1.4 | |
| EGR1_50 | 1.5 | |
| EGR2_30 | 0.5∙pi | 1.3 |
| EGR2_40 | 1.4 | |
| EGR2_50 | 1.5 |
pi—inital reservoir pressure; PM—pressure multiplier; iBHP—injection bottom hole pressure; pr—current reservoir pressure.
Table 3.
Normalized composition of the gas to be used as fuel.
| Component | yi (%) |
|---|---|
| N2 | 3.88 |
| CO2 | 0.00 |
| C1 | 88.95 |
| C2 | 3.25 |
| C3 | 0.71 |
| iC4 | 0.24 |
| nC4 | 0.42 |
| iC5 | 0.14 |
| nC5 | 0.14 |
| C6 | 0.32 |
| C7 | 0.29 |
| C8 | 0.22 |
| C9 | 0.19 |
| C10+ | 1.24 |
| Σ | 100.00 |
Publisher’s Note: MDPI stays neutral with regard to jurisdictional claims in published maps and institutional affiliations. |
© 2021 by the authors. Licensee MDPI, Basel, Switzerland. This article is an open access article distributed under the terms and conditions of the Creative Commons Attribution (CC BY) license (https://creativecommons.org/licenses/by/4.0/).
Share and Cite
MDPI and ACS Style
Jukić, L.; Vulin, D.; Kružić, V.; Arnaut, M. Carbon-Negative Scenarios in High CO2 Gas Condensate Reservoirs. Energies 2021, 14, 5898. https://doi.org/10.3390/en14185898
AMA Style
Jukić L, Vulin D, Kružić V, Arnaut M. Carbon-Negative Scenarios in High CO2 Gas Condensate Reservoirs. Energies. 2021; 14(18):5898. https://doi.org/10.3390/en14185898
Chicago/Turabian StyleJukić, Lucija, Domagoj Vulin, Valentina Kružić, and Maja Arnaut. 2021. "Carbon-Negative Scenarios in High CO2 Gas Condensate Reservoirs" Energies 14, no. 18: 5898. https://doi.org/10.3390/en14185898
Note that from the first issue of 2016, this journal uses article numbers instead of page numbers. See further details here.