Exergy-Based Assessment of Polymers Production and Recycling: An Application to the Automotive Sector


1
Politecnico di Torino, 10138 Torino, Italy
2
CIRCE Institute, Universidad de Zaragoza, 50018 Zaragoza, Spain
3
SEAT-SA, Autovia A-2 Km. 585, 08760 Martorell, Spain
*
Author to whom correspondence should be addressed.
Energies 2021, 14(2), 363; https://doi.org/10.3390/en14020363
Submission received: 29 December 2020
/
Revised: 4 January 2021
/
Accepted: 6 January 2021
/
Published: 12 January 2021
(This article belongs to the Special Issue Materials Recycling and Energy Use of Waste)
Abstract
:In the last century, the economic growth has been accompanied by a worldwide diffusion of polymers for multiple applications. However, there is a growing attention to the environmental pollution and energy consumption linked to the unconditional use of plastic. In the present work, exergy is used as a measure of the resource consumption during the life cycle of polymers. Nine commercially diffused polymers are chosen, and their production chains are identified according to the “grave to cradle” approach. The global Embodied Exergy (EE) is calculated as the sum of the contribution of each step of the chain, including the production process and the Exergy Replacement Cost (ERC) of the fossil fuel. Then, recycling routes and the associated exergy consumption are analysed. Thermodynamic recycling indexes are developed depending on the final product, namely the crude polymeric material and the oil derivatives or structural molecules. The main results show that some commonly used polymers have a considerable impact in terms of EE (e.g., PET). Recycling indexes encourage the recycling processes, which are always energetically convenient (from 10% to 60% of exergy savings) compared with the production from virgin raw material. Results from EE calculation are used for the thermodynamic assessment of the plastic content of vehicle components, to obtain useful information for recycling practices development.
1. Introduction
Nowadays, polymeric materials are widely diffused in the everyday life of people all around the world. In the last decades, they have become a milestone of the industry and the economy, with a production of 57.9 million of tons in Europe in 2019. This constitutes only 16% of the global production, being Asia the major producer (51%) [1]. The spread of the worldwide use of plastic is strictly linked to the growth of the petrochemical industry. Currently, the major feedstock for polymers production is still coming from by-products of oil and gas refineries: heavy hydrocarbons (e.g., kerosene and naphtha) or saturated hydrocarbons (e.g., ethane and propane) [2]. According to an estimation of Hamman [3], between 1.3% and 2.1% of primary hydrocarbon resources consumed each year are diverted to hydrocarbon feedstocks for the production of plastics world-wide. It corresponds to an average energy consumption (e.g., energy in the feedstock) of 45 MJ/kg of plastic. Moreover, the additional energy for processing the polymers ranges from 36 to 54 MJ/kg of plastic. Considering the European 2018 production, it means that between 0.531 and 0.797 Gtoe of primary energy have been invested for polymer manufacturing.
Despite polymeric materials are usually referred to as ‘plastics’, they are composed by a great variety of materials designed to cover the different needs of the end products. More than 350 different types of polymers are currently commercially available [4]. All polymers can be classified in one of the following two categories, depending on the polymerization process: thermoplastics, a family of polymers that can be melted when heated and hardened when cooled in a reversible way; thermosets, which include plastics that change their chemical structure with heat and so they cannot be reshaped [5].
As reported by a PlasticEurope survey [1], 29.1 Mt of plastics were collected as post-consumer waste in EU countries in 2018. Of these, 42.6% were sent to energy recovery, 32.5% to recycling and 24.9% ended up in landfills. However, according to Crippa et al. [6], only 13% of the total volume collected for recycling reaches European converters, while 30% is exported without certified information on its final destiny. In general, the level of substitution of virgin material is low and often recycled plastics are used in applications requiring lower material quality [7].
Even if the major demand of plastic is for packaging (40%), about 10% of the produced polymers in Europe is used in the automotive sector [1,8]. In the last 15 years, an impressive enhancement of End of Life Vehicles (ELVs) occurred, due to the shortening of the cars average life, estimated in 10–12 years [9]. According to a survey delivered by the EU commission [10], the ELVs legally deregistered produce every year between 7 and 8 million tonnes of wastes; however, considering also the number of estimated ‘unknown whereabouts’ vehicles, the total increases to 13–15 million tonnes of wastes. Furthermore, in the last 10 years, the percentage of plastic in vehicle increased, since the reduction in weight is justified by a decrease in fuel consumption; the current amount is between 15–17% of the car total weight and 50% of its volume [11]. Plastics in ELVs are not recycled, apart from the amount that is incidentally reused during the pre-shredding phases of depollution and dismantling (e.g., tyres, bumpers, tanks), which does not exceed 25% of the total [12]. Considering an average weight of vehicle of 1250 kg, it means that 150 kg of mixed plastics per vehicle are discarded, shredded, and ultimately landfilled. Therefore, only in EU about 2 million of tonnes of plastic are dispersed every year due to the automotive sector, approximately 4 kg per person. For comparison, the average production of plastic packaging per year in EU is 31 kg per person [13].
Various examples of energy and environmental impact analysis of polymers production and recycling are present in literature. Results of Cumulative Energy Demand and CO2 emissions are reported in [14] for many products of organic chemical industry, including a large number of polymers, starting with the extraction of resources and ending with the saleable material. In [15] a Life Cycle Assessment (LCA) and environmental impact of polymeric products is presented. An important contribution is represented by the PlasticEurope Eco-profiles [16]. LCA methodology has been widely used also for evaluating the polymers recycling chain. Environmental impact of PET bottle-to-fibre recycling is assessed in [17], comparing four recycling cases. A life-cycle impact of recycling PVC window frames is presented in [18]. An application of LCA to the products and processes involved in mechanical recycling of black HDPE is also reported in [19]. An application of LCA for quantifying the overall environmental performance of mechanical recycling of plastic containers in Italy is presented in [20]. Besides, examples of resource assessment analysis applied to the automotive sector are present. In [21] a resource efficiency comparison between a plug-in hybrid vehicle with a conventional combustion engine is carried out using a methodology that considers the pollution of the environment as well as the physical and socio-economic availability of resources. An assessment of strategic raw materials in the automobile sector is presented in [22], including supply risk analysis.
Among all the different approaches, the exergy-based one is a promising instrument to assess resource consumption in industrial and natural processes [23,24,25]. The use of exergy (e.g., the maximum useful work obtainable from a system when it is taken from its given state to the thermodynamic equilibrium with the environment, by only interacting with the environment) can be useful when the systems involve material and no material streams, as rational basis to compare flows of different nature [26]. Exergy analysis has been widely used for efficiency evaluation of power plants [27,28]; coupled with cost analysis (Exergoeconomics) it has been applied to the diagnosis of complex energy systems and plant management [29,30]. Dewulf et al. [31] have developed the Cumulative Exergy Extraction from the Natural Environment (CEENE) indicator, which quantifies the exergy withdrawn from the nature according to eight categories of resources. The CEENE method is then applied to a number of different products and materials. A CEENE assessment of post-industrial plastic waste is presented in [32].
The inclusion of exergy-based indicators into the Industrial Ecology (IE) have been implemented by Stanek et al. [33], who applied the Thermo-Ecological Cost (TEC) theory to the analysis of different energy and technological systems (e.g., hard coal production). Exergy analysis offers also advanced tools for the evaluation of non-renewable mineral resources, as demonstrated by Valero et al. [34,35,36]. They presented a new thermodynamic approach, based on quantifying the exergy costs required to replace the extracted minerals. In this way, exergy is a measure of the ‘distinction’ from the surroundings and the thermodynamic rarity of minerals is defined as the total amount of exergy resources needed to obtain a mineral from a completely degraded state (called ‘Thanatia’), using the best prevailing technologies [37]. The total exergy cost is the sum of the energy associated with conventional mining, beneficiation, smelting and refining processes, plus the exergy theoretically invested in concentrating the resources from Thanatia to mines ore grade, i.e., their Exergy Replacement Cost (ERC). An interesting application is found in [38,39], where thermodynamic rarity is used to rank the critical metals used in passenger car and as a weighting factor for assessing their downcycling. A comprehensive metal assessment of two passenger cars (conventional and battery electric models) in terms of mass and thermodynamic rarity is also presented in [40].
The general method used to account for the total exergy of the resources invested in a product life cycle is the calculation of the Cumulative Exergy Consumption (CExC) [41]. In this work, the concept of CExC is combined with the methodology and the definition of thermodynamic rarity.
Currently, no examples are present of use of exergy for comparing the resources invested in producing polymers from virgin (primary) material with those from secondary materials through recycling. Besides, no applications are present for the thermodynamic assessment of vehicle plastic components.
The aim of the present work is to define and assess the exergy life cycle of polymeric materials and to develop exergy-based indicators comparing polymers production from primary and secondary raw materials. Besides, a thermodynamic assessment of the vehicle plastic components is performed with the aim of obtaining useful information for developing recycling practices.
2. Materials and Methods
The general scheme of the adopted methodology which will be detailed in the next paragraphs is presented in Figure 1.
2.1. Polymers Production Routes
Nowadays the main feedstock for plastics production is still found in by-products of oil and gas refineries. Most of these hydrocarbons (e.g., naphtha, ethane, propane, gas oil) have little commercial value and must be separated and processed in order to obtain lightweight unsaturated olefins [2]. To this end, the most common process is the steam cracking [42]; the process energy demand is consistent and depends on the feedstock characteristics.
Ethylene, propylene, butadiene, benzene, toluene and xylene are the main building blocks for creating the macromolecules of polymers and are mainly obtained by steam cracking of naphtha, gas oil or light hydrocarbons [14]. The creation of polymers from monomers is accomplished through the polymerization process. Temperature, pressure, catalysts and energy requirement vary in order to create the conditions for the building blocks to combine and bond. Catalysts can be used to start or speed up the reaction [43]. The most common mechanisms of polymerization are by addition or condensation. In addition polymerization (e.g., PE, PP and PVC) the growth of polymer occurs by reaction between a monomer and a reactive site; no by-products are generated. In condensation polymerization (e.g., PET, PA and PC), the reaction between the repeating unit and the growing chain produces by-products. Table 1 reports a brief description of the production routes identified for the 9 polymers analysed in this work. The selected polymers are among the most commercially diffused; they are also the ones with the highest weight percentage in the vehicle plastic composition presented in the next Sections.
2.2. Polymers Exergy Life Cycle
In order to calculate the exergy invested along all the polymer production chain, some assumptions are made on its structure. According to the “grave to cradle” path [48], polymers production phases are considered as follows: (i) polymerization; (ii) production of monomers or ‘building blocks’ from oil and gas heavy by-products (referred as ‘naphtha’); (iii) production of naphtha from fossil fuel (referred as ‘coal’); (iv) fossil fuels from organic matter (referred as ‘wood’). The first two phases have been described in Section 2.1; details on phase (iii) and (iv) are reported below.
- Naphtha from coal: naphtha is produced from the processing of fossil fuels [49]. Although the most common commercial route is the one from petroleum refinery, there are historical examples of naphtha production from coal through direct liquefaction or Fisher Trops (FT) reaction as well as from destructive distillation of biomass [50]. In this work fossil fuel is modelled as coal since it appears inclusive of all the characteristics of the generic fossil fuel. Therefore, direct liquefaction from coal is assumed, resulting the most efficient process in terms of yield of naphtha (i.e., 10%, considering that the black sub-bituminous coal and the lignite are more suitable for this process). The invested fossil energy (excluding the feedstock energy) is 38 MJ/kg of naphtha [49].
- Coal from wood: coal is chosen in the model also for its convenience at the time of calculating the Exergy Replacement Cost (ERC), presenting a more stable composition than oil. In its general definition, the ERC corresponds to the natural bonus of having resources concentrated in a deposit. The ERC of fossil fuels has not been previously considered by Valero and Valero ‘due to the impossibility of reproducing the photosynthetic process that once created the resource’ [37]. This makes sense if oil, coal and natural gas are considered strictly as fuels, which are destined to be finally burned. Anyway, if fossil fuels are used as raw materials, as in the case of polymer production, it becomes theoretically possible to come back to the ‘grave’ with recycling. According to Whiting and Carmona [51], the ERC of fossil fuels can be evaluated considering the cumulative exergy cost of equivalent fossil fuels (first generation bio-fuels) production (e.g., bioethanol for gasoline, biogas for natural gas, biochar for coal); furthermore, they extend the boundary of the analysis including the ‘solar radiation to crop’ factor to ERC calculation. In this work, only the ‘crop to fuel’ part of the described ERC is taken, which represents the exergy invested in processing and concentrating the natural primary resources into viable deposits.
In line with [51], charcoal produced from timber is considered as the alternative bio-fuel for ERC evaluation; the invested exergy is composed by the feedstock exergy of the biomass, 54.5 MJ/kg of coal, and an external contribution for the process amounting to 28.1 MJ/kg of coal. All the previously reported values of invested energy refer to the main product unit (i.e., by-products are not included in the calculation).
The sum of all the contributions in terms of materials and exergy invested in the different steps of polymer production chain gives the Embodied Exergy (EE) of the materials, as reported in Table 2. The exergy data are expressed in MJ of exergy/kg of final product (i.e., polymeric material). The energy consumption is divided into direct fossil fuel use, electricity and heat. The chemical exergy of fossil fuel is calculated by means of the Szargut correction factor φ of Lower Heating Value (LHV) (Equation (1)) [41]. The method is applied also for calculating the feedstock exergy of polymers, namely the primary exergy of the initial fossil fuel embodied in the final product. The value of φ is 1.06 for oil fuel and 1.04 for natural gas, while for each polymer it is evaluated by means of Equation (2) for fuels with O/C < 0.667, according to the ultimate analysis (carbon C, hydrogen H, oxygen O and nitrogen N). ‘Heat’ refers to steam consumption and its exergy is evaluated as the sum of two contributions: physical exergy (), where h, s, h0 and s0 are the specific enthalpy (kJ/kg) and entropy (kJ/kg·K) of the considered and reference state (T0 = 288 K, p0 = 1 atm) respectively; chemical exergy of liquid water = 50 kJ/kg). If the conditions are not specified in literature, steam is considered saturated at 16 atm.
2.3. Polymers Recycling Routes
Recycling methods are usually referred to as primary, secondary, tertiary and quaternary recycling [59]. Primary and secondary recycling techniques are based on mechanical treatment of discarded polymers in order to obtain the starting material. The primary recycling is usually performed by the manufacturer itself for post-industrial waste (closed-loop recycling) [7]. The secondary recycling is the most common and involves a series of steps after collection, namely cleaning, drying, shredding, contaminant separation, addition of additives, agglomeration, pelletization and extrusion. The mechanical characteristics of recycled polymers can be degraded, so that they are commonly used in manufacturing less value products [6]. Only thermoplastic polymers can undergo mechanical recycling because they can be re-melted and reprocessed into end products [60]. Tertiary recycling consists in the recovering of monomers through depolymerisation processes, such as solvolysis, thermolysis and pyrolysis (thermal recycling) or glycolysis and methanolysis (chemical recycling). Many thermosets plastics can be chemically recycled in order to recover their constituent molecules [59]. The expression quaternary recycling is used to indicate the energy recovery from plastics through incineration [60].
Due to the variety of existing recycling processes, an extent literature review has been performed in order to identify the most suitable considering the specific application in vehicles. A brief description of the recycling processes and the associated exergy consumption (expressed in MJ of exergy per kg of recycled material) are reported in Table 3.
Thermodynamic Recycling Indexes
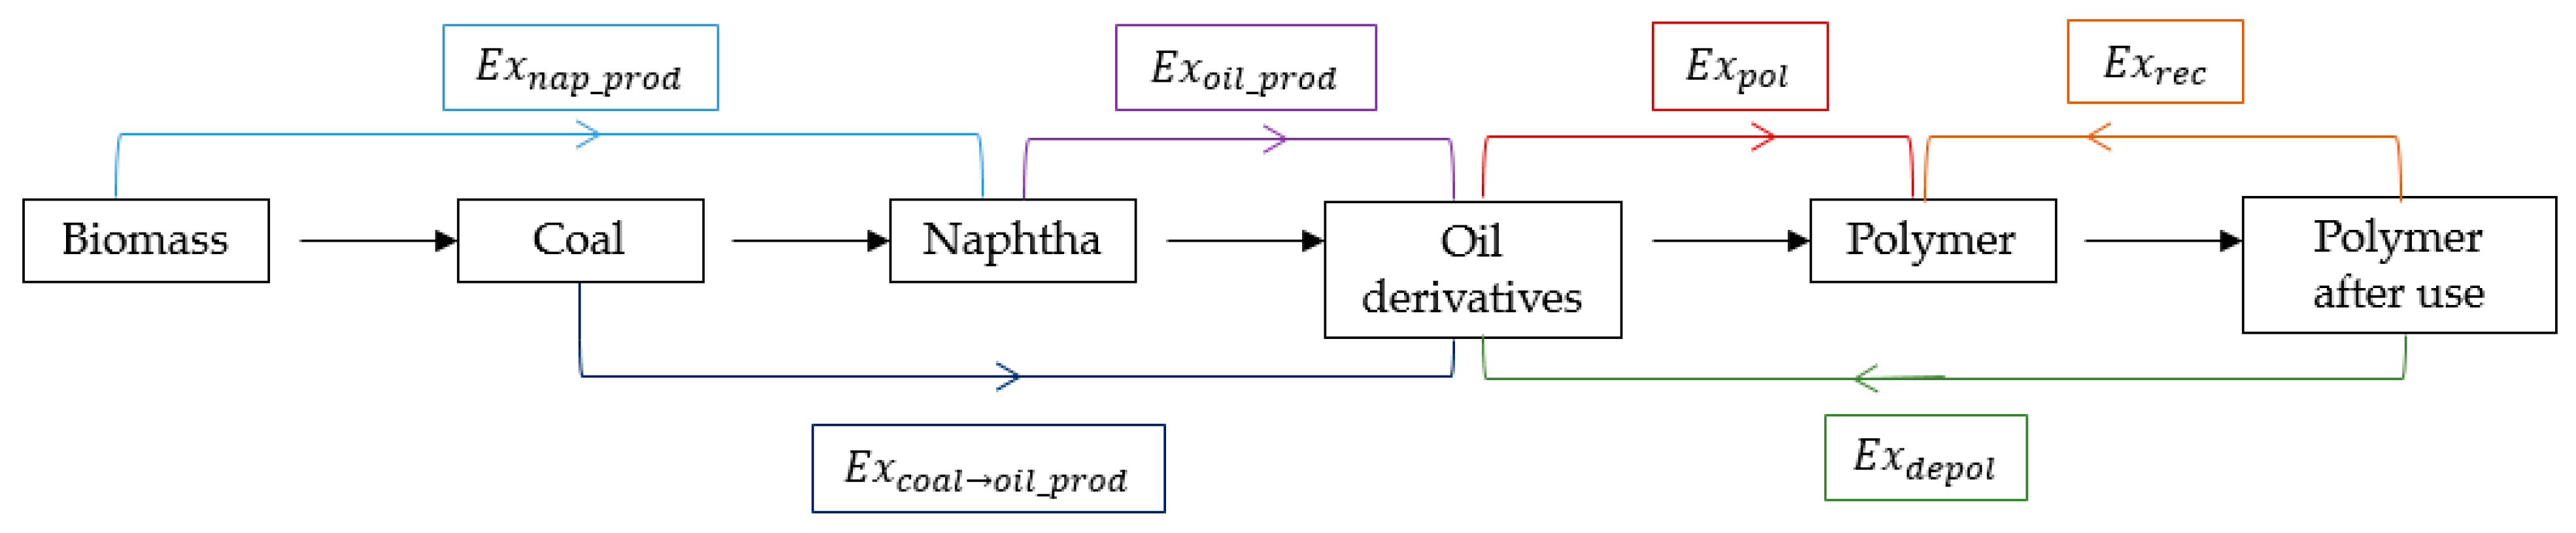
In order to evaluate the recycling process, exergy-based recycling indexes are developed, depending on the final product, namely the new crude polymeric material (primary product) or the oil derivatives (secondary products). Examples of developing of exergy-based indicators for products life cycle are present in [66]. Figure 2 can be useful for understanding the exergy flows.
A new polymer can be obtained by mechanical recycling (as in the case of PE, PP, PVC, ABS and PET) or via chemical recycling through decomposition into the constituent macromolecules and consequent re-polymerization (as for PU, PA6.6, PET, SBR, EPDM). According to this, different recycling indexes are adopted:
- RECmec, the mechanical recycling index (Equation (3)) is defined as a comparison between the embodied exergy of the mechanical recycling (Exrec) and the exergy of the production from virgin material, starting from naphtha, (Exoil_prod + Expol).
- RECter, the tertiary recycling index (Equation (4)) is defined as the ratio between the exergy necessary for re-obtaining the polymer via depolymerisation (Exdepol + Expol) and the one for producing it from naphtha.
- RECgl, the global recycling index (Equation (5)) is calculated as the ratio between the embodied exergy of the recycling (secondary or tertiary) and the one of the entire production chain starting from the biomass, in order to give a broader order of magnitude.
- RECch, the chemical recycling index (Equation (6)) compares the embodied exergy of the production of oil derivatives from polymers (Exdepol) with the one from fossil fuel (Excoal→oil prod). This indicator is introduced since, for some polymers (PE, PP, PVC), the chemical recycling consists in a decomposition into secondary products (hydrocarbon molecules).
It has to be considered that these indexes are strictly relative to the processes of materials manufacturing and recycling; they do not take into account the exergy invested in dismantling the end-of-life products or collecting and transporting the waste materials. The values of the indexes are given in percentage; low values mean that the recycling process is advantageous in terms of invested exergy compared to production from virgin materials.
2.4. Polymers in Vehicles
Data on polymeric composition of vehicles are provided by SEAT S.A. They refer to a 2017 SEAT Leon model of approximately 1270 kg, of which 16.6% are non-metallic materials (i.e., glass, polymers and ceramics). As reported in Table 4, 21 polymers are identified, composed by 14 thermoplastics and 9 thermosets. Adhesives and resins are not included (even if they can be polymer-based materials). The vehicle plastic composition is compared with data found in the literature, showing good accordance for typology and quantity of polymers. Only the polymers with a weight percentage higher than 2% were chosen for the analysis, namely PE, PP, PVC, ABS, PU, PA66, PET, SBR and EPDM. They also occur to be the most commercially diffused and with existent recycling practices.
Vehicle Components
The developed thermodynamic concepts and values are used for the analysis of the plastic content of a vehicle. In addition to the data on the total polymeric material contained in a SEAT Leon, the composition of some vehicle components has been provided by SEAT S.A., as reported in Table 5. The analysed car parts are chosen between the ones with significant plastic content as well as for their facility at the time of being eventually removed for recycling.
Many vehicle polymers incorporate additives for enhancing mechanical characteristics, strength, fire resistance or for coloring [67]. The composition of some of these chemical substances is not declared by producers, which only report the weight content. The most common declared additive are the ones reported in Table 6; their feedstock exergy has to be included in the calculation of the EE of the corresponding polymer.
The global EE of each car part is calculated, in order to account for the distribution among the various polymers. In case of no recycling and total shredding, the EE is totally dispersed. Therefore, the evaluation is useful also to give information at the time of planning recycling practices, together with the developed recycling indexes.
3. Results
3.1. Comparison of Polymer Production EE
First, the global EE of the polymers production chain (from ‘Biomass’ to ‘Polymer’ in Figure 2) is calculated (Figure 3a), evaluating the contribution of each step (Figure 3b).
Results show a wide range of values of EE for the analysed polymers, ranging from 0.036 toe/kg of PVC to 0.479 toe/kg of SBR. The average values of percentage contribution of each step to the global EE are reported in Figure 3b. The repartition is similar for all polymers, with approximately 60% of exergy embodied in the biomass for coal production, 32% in the external contribution to the ‘biomass-to-coal’ process, 4% in naphtha production from coal and the remaining 4% in polymerization process and feedstock. The major differences between polymers are linked to feedstock and process exergy, which strongly influence the global balance. The polyolefin (PE, PP, PVC) and the PU have the lowest values of EE, since the production processes are quite plain and the major constituent hydrocarbons (ethylene and propylene) have high yield from naphtha. An increase in the complexity of the molecules lead to a growth in the process exergy as well as in the quantity of required primary fossil fuel. This is the case of ABS, SBR and PET and, to a lesser extent, of PA6.6 and EPDM. The use of butadiene represents the major burden in the production of ABS (20 wt% of butadiene) and SBR (75 wt%), since it has a particularly low yield from naphtha (1:27); butadiene is present also in EPDM, even in lower quantities (10 wt%). The second more influencing factor is the presence of benzene (yield from naphtha 1:12) for styrene production. Despite its large commercial use, PET is the second most important in terms of global EE; in fact, the production of PTA requires para-xylene, which is extracted from heavy reformate of naphtha with very low yield (4 wt%).
3.2. Comparison of Recycling Indexes
According to the data reported in Section 2.3, the thermodynamic recycling indexes are calculated for each polymer. Results are graphically reported in Figure 4a–d.
Among the polyolefin, PE is the one with the highest RECmec (75%), followed by PP, PVC and ABS. Mechanical recycling is the most convenient option for PET, with an exergy saving of about 60% with respect to production from virgin materials; recycling through depolymerisation appears not so convenient, since the value of RECter is about 89%. This picture is confirmed by the real practice since PET is one of the most mechanically recycled polymers (other than one of the most diffused). In terms of tertiary recycling, PA6.6 has the lowest value of RECter, less than 50%. This should encourage the recycling of polyamide, better if in closed loop, which is not so diffused so far. Even the values of RECter of rubbers (50% for SBR and 58% for EPDM) appear not as high as for justifying the almost total absence of recycling practices in the world. Looking at the broader vision, the values of RECgl are quite low as expected. In fact, the exergy invested in the recycling process is less than 2% of the total exergy necessary for obtaining the polymer from virgin material, starting from the primary exergy of the biomass. Finally, it is interesting to notice the values of RECch of the polyolefin (24.6% for PP, 42.4% for PE and 37% for PVC). Considering this quite low exergy cost of the petrochemicals production, the depolymerisation could be a promising solution for obtaining secondary products to sell in the market if the mechanical recycling is not possible. It has to be considered that all these values refer to the processes only, excluding the collection and transport exergy cost of waste polymers as well as raw materials.
3.3. Thermodynamic Assessment of Vehicle Plastic Components
3.3.1. Vehicle Components
A first thermodynamic assessment of the vehicle is conducted by calculating the global EE of the vehicle polymeric content. Results are reported in Table 7, where a comparison with the rarity of the metals is presented [38]. It is evident that the exergy embodied in the polymeric materials is several orders of magnitude greater than the metals rarity. However, the analysis of the contribution of the single steps highlights that the exergy associated to the processing from raw materials is pretty similar. The real difference is represented by the ERC of fossil fuel. The ‘grave to cradle’ path for theoretically reintroducing the fossil fuel derivatives into their ‘dead state’ (so in the condition where they are organic material) is much more complicated and exergy intensive than the re-concentration of minerals from the Thanatia’s grade.
3.3.2. Vehicle Components
According to the material composition reported in Table 5, the total EE of the four vehicle components plastic content is calculated (the EE of additives is included). A comparison with the specific values (referred to the total amount of polymers) is reported in Figure 5.
The highest value (0.8 toe) associated to the floor covering is due to the presence of a large quantity of PET (83.5% of the total EE), which is a polymer with the highest values of EE together with SBR (also present in this component). Floor covering is the third component in terms of weight between the analysed, so its specific EE value (0.29 toe/kg) is higher than the one of dashboard (0.07 toe/kg) and rear bumper (0.16 toe/kg). The highest value (0.8 toe) associated to the floor covering is due to the presence of a large quantity of PET (83.5% of the total EE), which is a polymer with the highest values of EE together with SBR (also present in this component). Floor covering is the third component in terms of weight between the analysed, so its specific EE value (0.29 toe/kg) is higher than the one of dashboard (0.07 toe/kg) and rear bumper (0.16 toe/kg). On the other hand, the instrumental cluster has the lowest value of global EE (0.09 toe), since its weight is considerably lower than the others; this also implies that its EE specific value is high (0.26 toe/kg) since the resources are more concentrated. The dashboard has the highest weight and the smallest EE specific value (0.07 toe/kg), but its total EE (0.6 toe) is lower than the one of the floor covering and the rear bumper, since it is mainly composed by PP. Figure 6 reports the detailed distribution of the EE between the constituting polymers of the components.
3.3.3. Recycling Considerations
The polymeric composition of the vehicle components is a fundamental factor in defining recycling practices. All the exergy still embodied in the vehicle (in this case, in form of plastics) would be totally lost in case of no recycling and the material dispersed in case of landfill disposal or incineration. This means that the same amount of resources (EE of polymers) are needed in order to re-obtain the components; the aim of recycling is to recover the value and to spend only a percentage of the total resources for having the final products.
In theory, all these polymers are recyclable, in the sense that at least one recycling industrial process exists. In real practice the most recycled are PP, PE and PET. Moreover, many factors influence the practical implementation of recycling:
- the compatibility with the other polymers and the difficulty in separating them;
- the presence of additives that can affect the recycling process;
- the form on which the polymer is present (e.g., PET in the floor covering is in form of fibre, which is not commonly recycled differently from the ‘bottle’ PET material);
- the recycling volumes that can be achieved.
All these qualitative elements (together with the developed recycling indexes) have to be considered in order to assess the recyclability of the vehicle components and they will be further discussed in future works.
4. Conclusions and Discussion
An exergy-based assessment of polymeric materials has been performed in order to compare the resources invested in producing polymers from virgin material with those from secondary materials through recycling. Besides, the calculated data have been used to analyse the plastic composition of vehicle components with the aim of obtaining useful information for recycling.
First, the global Embodied Exergy of 9 different polymers has been calculated tracking back the exergy invested in the production process, considering polymerization, naphtha production from fossil fuel and Exergy Replacement Cost of coal. The set of analysed polymers have been chosen between the ones with a weight percentage higher than 2% basing on the plastic composition of a 2017 SEAT Leon vehicle.
The analysis of the entire chain enlarges the vision, showing that the major exergy investment occurs in the first steps where the primary natural resources (e.g., biomass) are concentrated in form of fossil fuel to be further utilized. Then, in the strictly production phase, the complexity of the processes for obtaining the constituent molecules is what determines the EE of the polymers.
Data on the best available recycling processes have been collected and exergy-based recycling indicators have been defined and calculated for each polymer, according to the type of recycling (secondary or tertiary) and the nature of the final products (new polymer or secondary materials). The resulted scenario confirms as quite convenient some practises that are already in use, such as the mechanical recycling of PET or of some polyolefin (PP, PVC) over the chemical one. These results are in line with the one of [20], where mechanical and feedstock recycling of plastic waste are compared with a LCA methodology. Also the results of [70] confirmed the environmental benefit of PET mechanical recycling under different scenarios.
From our analysis it also emerges that some scarcely diffused recycling processes are not so prohibitive from an exergy perspective, at least considering the comparison with the production process from virgin materials. Even if the transport and collection of waste polymers is not accounted for in the calculation of the EE, the fact that all the recycling indexes are lower than 100% (some of them even significantly) leaves a positive margin for further exergy consumption. This difference is even more marked in the comparison of the recycling process with the entire production chain (starting from the biomass up to the polymer), being the values of in the order of 2%. All these factors are an encouragement not only to pursue and improve recycling technologies, but also to optimize the connection between the producers of intermediate materials so that all stakeholders can benefit from the savings derived from recycling. This is a crucial point for the developing of plastic waste circular economy and it is also confirmed by the conclusion of [71].
Finally, a thermodynamic assessment of the plastic content of some vehicle components is presented. In the first place, the calculation of the total EE of the components gives an idea of the order of magnitude of the MJ of exergy that are definitively dispersed in case that the materials are not reused or recycled. The methodology applied to the single component can be useful to reveal which polymer can be critical with respect to the others at the time of recycling. Since many heterogenous factors are involved in defining the ‘recyclability’ concept, this will be the object of further investigation as well as the evaluation of the polymer substitution.
Author Contributions
Data curation, M.I.-É.; Supervision, A.V. (Alicia Valero), A.V. (Antonio Valero); Writing–original draft, S.R.; All authors have read and agreed to the published version of the manuscript.
Funding
This research received no external funding.
Institutional Review Board Statement
Not applicable.
Informed Consent Statement
Not applicable.
Data Availability Statement
The data presented in this study are partially available on request from the corresponding author, due to confidentiality issues.
Conflicts of Interest
The authors declare no conflict of interest
References
- PlasticEurope. Plastics—The Facts 2020. 2020. Available online: https://www.plasticseurope.org/en/resources/publications/4312-plastics-facts-2020 (accessed on 10 December 2020).
- Wittcoff, H.A.; Reuben, B.; Plotkin, J. Industrial Organic Chemicals; Wiley: Hoboken, NJ, USA, 2013; ISBN 9780470537435. [Google Scholar]
- Hamman, W.C. Energy for Plastic. In Introduction to the Physics of Energy; Standford University: Stanford, CA, USA, 2010; p. 3. [Google Scholar]
- Polymer Properties Database. Available online: https://polymerdatabase.com (accessed on 15 December 2020).
- Hawkins, W.L. Recycling of Polymers; Wiley: Hoboken, NJ, USA, 1987; Volume 10, ISBN 9783527338481. [Google Scholar]
- Crippa, M.; De Wilde, B.; Koopmans, R.; Leyssens, J.; Muncke, J.; Ritschkoff, A.-C.; Van Doorsselaer, K.; Velis, C.; Wagner, M. A Circular Economy for Plastics; European Commission: Brussels, Belgium, 2019; p. 244. [Google Scholar]
- Ignatyev, I.A.; Thielemans, W.; Vander Beke, B. Recycling of Polymers: A Review. ChemSusChem 2014, 7, 1579–1593. [Google Scholar] [CrossRef] [PubMed]
- CBI Market Intelligence. CBI Product Factsheet: Plastics for Vehicles in the European Union; CBI Market Intelligence: Dutch, The Netherlands, 2016; p. 10. [Google Scholar]
- EU Parliament. End of Life Vehicles (ELV) Directive. An Assessment of the Current State of Implementation by Member States; Policy Department: Brussels, Belgium, 2007; p. 69. [Google Scholar]
- European Commission. Assessment of the Implementation of Directive 2000/53/EU on End-of-Life Vehicles (the ELV Directive) with Emphasis on the End of Life Vehicles of Unknown Whereabouts; European Commission: Brussels, Belgium, 2017; p. 105. [Google Scholar]
- Miller, L.; Soulliere, K.; Sawyer-beaulieu, S.; Tseng, S.; Tam, E. Challenges and Alternatives to Plastics Recycling in the Automotive Sector. Materials 2014, 7, 5883–5902. [Google Scholar] [CrossRef] [PubMed] [Green Version]
- Santini, A.; Morselli, L.; Passarini, F.; Vassura, I.; Di, S.; Bonino, F. End-of-Life Vehicles management: Italian material and energy recovery efficiency. Waste Manag. 2011, 31, 489–494. [Google Scholar] [CrossRef] [PubMed]
- Eurostat. Packaging Waste Statistics. 2018. Available online: https://ec.europa.eu/eurostat/statistics-explained/index.php/Packaging_waste_statistics (accessed on 21 December 2020).
- Patel, M. Cumulative energy demand (CED) and cumulative CO2 emissions for products of the organic chemical industry. Energy 2003, 28, 721–740. [Google Scholar] [CrossRef]
- O’Neill, T.J. Life Cycle Assessment and Environmental Impact of Polymeric Products; Smithers Rapra: Shawbury, UK, 2003; p. 145. [Google Scholar]
- PlasticsEurope. Eco-Profiles and Environmental Declarations; PlasticsEurope: Bruxelles, Belgium, 2011; p. 51. [Google Scholar]
- Shen, L.; Nieuwlaar, E.; Worrell, E.; Patel, M.K. Life cycle energy and GHG emissions of PET recycling: Change-oriented effects. Int. J. Life Cycle Assess. 2011, 16, 522–536. [Google Scholar] [CrossRef] [Green Version]
- Stichnothe, H.; Azapagic, A. Life cycle assessment of recycling PVC window frames. Resour. Conserv. Recycl. 2013, 71, 40–47. [Google Scholar] [CrossRef]
- Garraín, D.; Martínez, P.; Vidal, R.; Bellés, M.J. LCA of Thermoplastics Recycling. In Proceedings of the 3rd International Conference on Life Cycle Management, Zurich, Switzerland, 27–29 August 2007; pp. 1–6. [Google Scholar]
- Perugini, F.; Mastellone, M.L.; Arena, U. A life cycle assessment of mechanical and feedstock recycling options for management of plastic packaging wastes. Environ. Prog. 2005, 24, 137–154. [Google Scholar] [CrossRef]
- Henßler, M.; Bach, V.; Berger, M.; Finkbeiner, M.; Ruhland, K. Resource efficiency assessment-comparing a plug-in hybrid with a conventional combustion engine. Resources 2016, 5, 5. [Google Scholar] [CrossRef]
- Ortego, A.; Calvo, G.; Valero, A.; Iglesias-Émbil, M.; Valero, A.; Villacampa, M. Assessment of strategic raw materials in the automobile sector. Resour. Conserv. Recycl. 2020, 161, 104968. [Google Scholar] [CrossRef]
- Valero, A.; Uson, S.; Torres, C.; Valero, A. Application of Thermoeconomics to Industrial Ecology. Entropy 2010, 12, 591–612. [Google Scholar] [CrossRef]
- Rosen, M.A.; Dincer, I.; Kanoglu, M. Role of exergy in increasing efficiency and sustainability and reducing environmental impact. Energy Policy 2008, 36, 128–137. [Google Scholar] [CrossRef]
- Jørgensen, S.E.Ã.; Nielsen, S.N. Application of exergy as thermodynamic indicator in ecology. Energy 2007, 32, 673–685. [Google Scholar] [CrossRef]
- Ayres, R.U.; Ayres, L.W.; Martina, K. Exergy, Waste Accounting, and Life-Cycle Analysis. Energy 1998, 23, 355–363. [Google Scholar] [CrossRef]
- Zvolinschi, A.; Kjerlstrup, S.; Bolland, O.; van der Kooi, H. Exergy Sustainability Indicators as a Tool in Industrial Ecology. J. Ind. Ecol. 2007, 11, 14. [Google Scholar] [CrossRef]
- Uson Gil, S. Comparative Analysis of Causal Diagnosis Methods of Malfunctions in Power Cycles. Ph.D. Thesis, University of Zaragoza, Zaragoza, Spain, 2008. [Google Scholar]
- Vittorio, V.; Borchiellini, R. Exergy method for the diagnosis of energy systems using measured data. Energy 2007, 32, 490–498. [Google Scholar]
- Torres, C. Symbolic Thermoeconomic Analysis of Energy Systems. In Exergy, Energy System Analysis, and Optimization; EOLSS Publications, University of Zaragoza: Zaragoza, Spain, 2009; p. 454. [Google Scholar]
- Dewulf, J.; Bosch, M.; De Meester, B.; van der Vorst, G.; Van Langenhove, H.; Huijbregts, A. Cumulative Exergy Extraction from the Natural Environment (CEENE): A comprehensive Life Cycle Impact Assessment method for resource accounting. Environ. Sci. Technol. 2007, 41, 8477–8483. [Google Scholar] [CrossRef]
- Huysman, S.; De Schaepmeester, J.; Ragaert, K.; Dewulf, J.; De Meester, S. Performance indicators for a circular economy: A case study on post-industrial plastic waste. Resour. Conserv. Recycl. 2017, 120, 46–54. [Google Scholar] [CrossRef]
- Stanek, W.; Szargut, J.; Czarnowska, L. Application of Thermo-ecological Cost (TEC) as Sustainability Measure for Useful Products. In Thermodynamics for Sustainable Management of Natural Resources; Stanek, W., Ed.; Springer: Berlin/Heidelberg, Germany, 2017; p. 264. ISBN 9783319486482. [Google Scholar]
- Valero, A.; Valero, A. Exergoecology: A thermodynamic approach for accounting the Earth’s mineral capital. The case of bauxite—Aluminium and limestone—Lime chains. Energy 2010, 35, 229–238. [Google Scholar] [CrossRef]
- Valero, A.; Valero, A.; Calvo, G.; Ortego, A. Material bottlenecks in the future development of green technologies. Renew. Sustain. Energy Rev. 2018, 93, 178–200. [Google Scholar] [CrossRef]
- Palacios, J.; Calvo, G.; Valero, A.; Valero, A. The cost of mineral depletion in Latin America: An exergoecology view. Resour. Policy 2018, 59, 117–124. [Google Scholar] [CrossRef]
- Valero, A.; Valero, D.A. Thanatia: The Destiny of the Earth’s Mineral Resources; World Scientific: Singapore, 2011; ISBN 978-981-4273-93-0. [Google Scholar]
- Ortego, A.; Valero, A.; Valero, A.; Iglesias, M. Downcycling in automobile recycling process: A thermodynamic assessment. Resour. Conserv. Recycl. 2018, 136, 24–32. [Google Scholar] [CrossRef]
- Ortego, A.; Valero, A.; Valero, A.; Restrepo, E. Vehicles and Critical Raw Materials: A Sustainability Assessment Using Thermodynamic Rarity. J. Ind. Ecol. 2018, 22, 1005–1015. [Google Scholar] [CrossRef] [Green Version]
- Iglesias-Émbil, M.; Valero, A.; Ortego, A.; Villacampa, M.; Vilaró, J.; Villalba, G. Raw material use in a battery electric car—A thermodynamic rarity assessment. Resour. Conserv. Recycl. 2020, 158, 104820. [Google Scholar] [CrossRef]
- Szargut, J.; Morris, D.R.; Steward, F.R. Exergy Analysis of Thermal, Chemical, and Metallurgical Processes; Hemisphere Publishing: New York, NY, USA, 1988. [Google Scholar]
- Ren, T.; Patel, M.; Blok, K. Olefins from conventional and heavy feedstocks: Energy use in steam cracking and alternative processes. Energy 2006, 31, 425–451. [Google Scholar] [CrossRef] [Green Version]
- Shrivastava, A. Polymerization. In Introduction to Plastics Engineering; Elsevier: Amsterdam, The Netherlands, 2018; p. 32. ISBN 9780323395007. [Google Scholar]
- European Commission. EC 2007 BAT Polymers; European Commission: Brussels, Belgium, 2007. [Google Scholar]
- European Commission. Best Available Techniques (BAT) Reference Document for the Production of Large Volume Organic Chemicals; European Commission: Brussels, Belgium, 2017; p. 693. [Google Scholar]
- PlasticsEurope. Eco-Profile: Styrene Acrylonitrile (SAN) and Acrylonitrile Butadiene Styrene (ABS); PlasticsEurope: Bruxelles, Belgium, 2015; pp. 1–36. [Google Scholar]
- PlasticsEurope. Eco-Profile: Long and Short-Chain Polyether Polyols for Polyurethane Products; PlasticsEurope: Bruxelles, Belgium, 2012. [Google Scholar]
- Valero, A.; Valero, A. From Grave to Cradle: A Thermodynamic Approach for Accounting for Abiotic Resource Depletion. J. Ind. Ecol. 2012, 17, 43–52. [Google Scholar] [CrossRef]
- Ren, T. Petrochemicals from Oil, Natural Gas, Coal and Biomass: Energy Use, Economics and Innovation. Ph.D. Thesis, Copernicus Institute for Sustainable Development and Innovation, Utrecht University, Utrecht, The Netherlands, 2009. [Google Scholar]
- Owen, J. Conversion and uses of liquid fuels from coal. Fuel 1981, 60, 755–761. [Google Scholar] [CrossRef]
- Whiting, K.; Carmona, L.G.; Carrasco, A.; Sousa, T. Exergy replacement cost of fossil fuels: Closing the carbon cycle. Energies 2017, 10, 979. [Google Scholar] [CrossRef] [Green Version]
- Ioelovich, M. Energy Potential of Natural, Synthetic Polymers and Waste Materials—A Review. Acad. J. Polym. Sci. 2018, 1, 1–5. [Google Scholar] [CrossRef] [Green Version]
- Kenneth, S.M. International PVC industry energy study. J. Vinyl Technol. 1979, 1, 186–196. [Google Scholar]
- PlasticsEurope. Eco-Profile: Polyurethane Rigid Foam; PlasticsEurope: Bruxelles, Belgium, 2005; pp. 1–19. [Google Scholar]
- PlasticsEurope. Eco-Profile: Polyamide 6.6 (PA6.6); PlasticsEurope: Bruxelles, Belgium, 2014; p. 29. [Google Scholar]
- PlasticsEurope. CPME Eco-Profile: Purified Terephthalic Acid (PTA); PlasticsEurope: Bruxelles, Belgium, 2016; pp. 1–32. [Google Scholar]
- PlasticsEurope. Eco-Profile: Benzene, Toluene and Xylenes (Aromatics, BTX); PlasticsEurope: Bruxelles, Belgium, 2013; p. 46. [Google Scholar]
- ENI Versalis. EPDM: Proprietary Process Technology; Versalis S.p.A: San Donato Milanese, Italy, 2018. [Google Scholar]
- Singh, N.; Hui, D.; Singh, R.; Ahuja, I.P.S.; Feo, L.; Fraternali, F. Recycling of plastic solid waste: A state of art review and future applications. Compos. Part B Eng. 2017, 115, 409–422. [Google Scholar] [CrossRef]
- Goodship, V. Plastic Recycling. Sci. Prog. 2007, 90, 245–268. [Google Scholar] [CrossRef] [PubMed]
- Arena, U.; Mastellone, M.L. Fluidized Bed Pyrolysis of Plastic Wastes. In Feedstock Recycling and Pyrolysis of Waste Plastics: Converting Waste Plastics into Diesel and Other Fuels; Wiley: Hoboken, NJ, USA, 2006; Chapter 16; ISBN 9780470021545. [Google Scholar]
- Tukker, A.; De Groot, H.; Simons, I.; Wiegersma, S. Chemical Recycling of Plastics Waste (PVC and Other Resins); TNO Institute of Strategy Technology and Policy: Delft, The Netherlands, 1999; p. 132. [Google Scholar]
- Ashby, M. Material profiles. In Materials and the Environment; Elsevier: Amsterdam, The Netherlands, 2013; pp. 459–595. [Google Scholar]
- Marković, V.; Hicks, D.A. Design for chemical recycling. Philos. Trans. R. Soc. A Math. Phys. Eng. Sci. 1997, 355, 1415–1424. [Google Scholar] [CrossRef]
- Dobrotă, D.; Dobrotă, G. Reducing of Energy Consumption by Improving the Reclaiming Technology in Autoclave of a Rubber Wastes. Energies 2019, 12, 1460. [Google Scholar] [CrossRef] [Green Version]
- Valero, A.; Valero, A. Thermodynamic Rarity and Recyclability of Raw Materials in the Energy Transition: The Need for an In-Spiral Economy. Entropy 2019, 21, 873. [Google Scholar] [CrossRef] [Green Version]
- Delgado, C.; Barruetabeña, L.; Salas, O. Assessment of the Environmental Advantages and Drawbacks of Existing and Emerging Polymers Recovery Processes; European Commission: Brussels, Belgium, 2007. [Google Scholar]
- Haynes, W.M.; Lide, D.R.; Bruno, T.J. CRC Handbook of Chemistry and Physics, 95th ed.; CRC Press: Boca Raton, FL, USA, 2014. [Google Scholar]
- Gardiner, G. The making of glass fiber. Compos. Technol. 2009, 15, 30–35. [Google Scholar]
- Overcash, M.R.; Ewell, J.H.; Griffing, E.M. Life cycle energy comparison of different polymer recycling processes. J. Adv. Manuf. Process. 2020, 2, e10034. [Google Scholar] [CrossRef] [Green Version]
- Gubanova, E.; Kupinets, L.; Deforzh, H.; Koval, V.; Gaska, K. Recycling of Polymer Waste in the Context of Developing Circular Economy. Archit. Civ. Eng. Environ. 2020, 12, 99–108. [Google Scholar] [CrossRef] [Green Version]
Figure 1.
General scheme of the research stages.

Figure 2.
Exergy flow chart of polymer life cycle.

Figure 3.
Global Embodied Exergy of polymers (a) and average percentage distribution of each step of the production chain (b).
Figure 3.
Global Embodied Exergy of polymers (a) and average percentage distribution of each step of the production chain (b).

Figure 4.
Exergy-baed recycling indexes for polymers: (a) mechanical recycling RECmec; (b) tertiary recycling RECter; (c) global recycling RECgl; (d) chemical recycling RECch.
Figure 4.
Exergy-baed recycling indexes for polymers: (a) mechanical recycling RECmec; (b) tertiary recycling RECter; (c) global recycling RECgl; (d) chemical recycling RECch.

Figure 5.
Comparison between total and specific EE values of vehicle components polymeric content.

Figure 6.
EE distribution between constituting polymers of (a) dashboard; (b) rear bumper; (c) floor covering; (d) instrumental cluster.
Figure 6.
EE distribution between constituting polymers of (a) dashboard; (b) rear bumper; (c) floor covering; (d) instrumental cluster.


| Polymer | Abbreviation | Production Process |
|---|---|---|
| Polyethylene/Polypropylene | PE/PP | Addition polymerization of ethylene (C2H4) for PE and propylene (C3H6) for PP, obtained from steam cracking of naphtha. |
| Polyvinyl Chloride | PVC | Chlorine (Cl2) is extracted from salt (NaCl) by electrolysis and it reacts with ethylene for producing Ethylene Dichloride (EDC); cracking of EDC produces Vinyl Chloride Monomer (VCM) and HCl, which is used to produce additional EDC by oxychlorination. Polymerization of VCM occurs by addition in aqueous medium. |
| Acrylonitrile Butadiene Styrene | ABS | Emulsion polymerization of acrylonitrile, polybutadiene and styrene. Acrylonitrile (C3H3N) is obtained by the reaction between propylene and ammonia (derived from natural gas); polybutadiene comes from polymerization of butadiene (C4H6) from naphtha cracking; styrene is produced from ethylbenzene dehydrogenation |
| Polyurethane | PU | Condensation polymerization between a diisocyanate (e.g., MDI) and a polyol. MDI production starts with a condensation reaction between aniline (C6H7N) and formaldehyde (CH2O) for producing MDA, which reacts with phosgene (COCl2) to produce MDI. A polyol is the result of an alkoxylation (ethylene oxide EO + OH group), with glycerine as initiator. |
| Polyamide 6.6 | PA6.6 | Polycondensation between adipic acid and hexamethylene diamine (HMD). Adipic acid proceeds from benzene, KA oil and nitric acid, while HMD is produced from hydrogenation of adiponitrile (from benzene). |
| Polyethylene Terephthalate | PET | Polymerization of terephthalic acid (PTA) (or dimethyl terephthalate DMT) and ethylene glycol (EG). PTA is obtained by oxidation of p-xylene (C8H10) with acetic acid as solvent, while EG (C2H6O2) comes from hydrolysis of EO. |
| Styrene Butadiene Rubber | SBR | Polymerization of styrene and butadiene, followed by vulcanization with sulphur (S). |
| Ethylene Propylene Diene Rubber | EPDM | Solution polymerization of ethylene, propylene and diene (e.g., hexadiene C6H10), followed by vulcanization with S or peroxide. |
Table 2.
Material and exergy flows in polymers production processes.
| Polymer | Yield of Products | Ratio (5) (kg/kg) | Process Phases | Exergy Consumption (MJex/kgpol) | Ref. | |||
|---|---|---|---|---|---|---|---|---|
| Fuel | Electricity | Heat | Water | |||||
| PE | Naphtha/Ethylene | 3.34 | Ethylene production | 21.7 | 0.3 | 0.145 | [14,42,44,52] | |
| Ethylene/PE | 1.02 | Polymerization | 2.3 | |||||
| Feedstock | 48 | |||||||
| PP | Naphtha/Propylene | 5.74 | Propylene production | 37.2 | 0.6 | 0.115 | [14,42,52] | |
| Propylene/PP | 1.02 | Polymerization | 1.2 | |||||
| Feedstock | 48 | |||||||
| PVC | Naphtha/Ethylene | 3.34 | Ethylene production | 11.1 | 0.16 | 0.155 | [14,45,52,53] | |
| Chlorine/VCM | 0.64 | Chlorine extraction | 9.34 | |||||
| Ethylene/VCM | 0.49 | VCM production | 0.045 | 0.77 | 1.7 (1) | |||
| VCM/PVC | 1.065 | PVC polymerization | 0.83 | 1.5 | ||||
| Feedstock | 20.5 | |||||||
| ABS | Propylene/Acrylonitrile | 0.75 | Acrylonitrile production | 14.2 | 0.19 | 0.2 | [14,45,46] | |
| Naphtha/Polybutadiene | 27.7 | Polybutadiene production | 12.6 | 0.2 | ||||
| EB/Styrene | 1.066 | Styrene production | 35 | 0.61 | 3.52 (2) | |||
| Styrene/ABS | 0.56 | Polymerization | 0.95 | 2 | 0.56 | |||
| Feedstock | 47.2 | |||||||
| PU | Benzene/MDI | 0.407 | MDI production | 20.3 | 0.45 | 0.75 (3) | [47,54] | |
| PO/Polyol | 0.8 | Polyol production | 17.7 | 0.15 | 0.19 (3) | |||
| PO/PU | 0.39 | Polymerization | 1.5 | |||||
| MDI/PU | 0.62 | Feedstock | 42.3 | |||||
| PA66 | Benzene/Adipic acid | 0.7 | HMD and adipic acid production | 79.1 | 7 | [52,55] | ||
| Adipic acid/HMD | 0.93 | Polymerization | 4 | 9.26 (3) | ||||
| Adipic acid/PA | 0.65 | Feedstock | 33 | |||||
| HMD/PA | 0.52 | |||||||
| PET | Ethylene/EG | 0.63 | EG production | 5.71 | 0.43 | 0.9 (3) | [14,44,52,56,57] | |
| p-xylene/PTA | 0.54 | PTA production | 63.5 | 1.3 | 1.1 (3) | |||
| PTA/PET | 0.85 | Polymerization | 3.5 | |||||
| EG/PET | 0.33 | Feedstock | 25.2 | |||||
| SBR | EB/Styrene | 1.066 | Styrene production | 17.6 | 0.37 | 1.6 (2) | 0.18 | [14,45,52] |
| Naphtha/Butadiene | 27.7 | Butadiene production | 45.05 | 0.7 | ||||
| Styrene/SBR | 0.25 | Polymerization | 1.9 | 1.9 | 3.9 (2) | |||
| Butadiene/SBR | 0.75 | Feedstock | 45 | |||||
| EPDM | Naphtha/Ethylene | 3.34 | Ethylene production | 9.04 | 0.14 | [14,52,58] | ||
| Naphtha/Propylene | 5.74 | Propylene production | 15.5 | 0.24 | ||||
| Ethylene/Hexadiene | 0.715 | Hexadiene production | 21.2 | 0.32 | ||||
| Butadiene/Hexadiene | 0.715 | Polymerization | 3.9 | 5.56 (4) | ||||
| Ethylene/EPDM | 0.68 | Feedstock | 45.5 | |||||
| Propylene/EPDM | 0.273 | |||||||
| Hexadiene/EPDM | 0.047 | |||||||
(1) Steam at saturated conditions at 13 atm. (2) Steam at 720 °C and 42 atm. (3) Steam at saturated conditions at 16 atm. (4) Steam at saturated conditions at 18 atm (5) kg of products/kg of reactant.
Table 3.
Recycling processes for polymers.
| Polymer | Type of Recycling | Process Description | Exergy Consumption (MJex/kg) | Ref. | |
|---|---|---|---|---|---|
| PE/PP | Secondary | Compacting, sorting and reprocessing phases are included. The reprocessing generally occurs by conventional melt filtration extrusion into granules. The temperature of extrusion will fall between the melting point of the polymer and the onset of any thermal degradation to prevent excessive damage to the plastic. | Fuel | 0.71 | [5,20,60] |
| Electricity | 2.2 | ||||
| Water | 0.09 | ||||
| Tertiary | Polyaddition polymers cannot be recycled on its monomer content. As a consequence, feedstock recycling is performed by low temperature pyrolysis in fluidized bed reactor. Process products include heavy fractions, naphtha, C3/C4 compound, sand, CaO, CaCl. | Fuel | 0.23 | [20,61] | |
| Electricity | 0.42 | ||||
| Water | 0.1 | ||||
| CaO | 2.3 | ||||
| PVC | Secondary | An example of recycling of post-consumer PVC window frames is assumed as reference process. The waste is first shredded, manually sorted, granulated into chips and then converted into powder in order to allow blending with other grades of PVC for extrusion. | Fuel | 0.14 | [18] |
| Electricity | 1.1 | ||||
| Tertiary | Among the others, the NKT process is chosen as reference. The chemical and thermal degradation of the PVC waste takes place in a reactor at low pressure (2–3 bar) and moderate temperatures (maximum 375 °C). The products of the process are: calcium chloride, coke, metal concentrate, organic condensate. | Fuel | 0.11 | [62] | |
| Electricity | 0.13 | ||||
| ABS | Secondary | Only few applications of ABS recycling are reported in literature; secondary recycling via injection moulding appears a viable solution. | Fuel | 2.3 | [63] |
| PU | Tertiary | A closed-loop recycling for PU foam is taken as reference, which consists in a split-phase glycolysis. The compacted PU foam pellets are charged into a stirred batch reactor containing diethylene glycol (DEG) in presence of catalysts at a temperature of 200 °C. Then the DEG and the polyols are separated and are used as raw materials for new polymers. | Fuel | 5.3 | [64] |
| PA66 | Tertiary | Applications mainly relates to carpet recycling. The most common techniques are ammonolysis and hydrolysis in concentrated sulfuric acid. | Fuel | 10.3 | [63] |
| PET | Secondary | PET reprocessing process consists in a first section to remove impurities (pre-washing, magnetic separation, x-ray separation of PVC) and in a second to recover PET and by-products (HDPE and fines) by flotation. The material is then dried, screened and stored. | Fuel | 2.7 | [20] |
| Electricity | 1.3 | ||||
| Water | 0.15 | ||||
| Tertiary | The considered depolymerisation process is methanolysis for DMT recovery. The reaction occurs in presence of catalysts and the DMT is recovered by precipitation, centrifugation and crystallization. | Fuel | 16.8 | [17] | |
| Methanol | 22 | ||||
| SBR/EPDM | Tertiary | Devulcanization is the most delicate phase, because a selective rupture of sulphur bonds (S-S or C-S) must be achieved without breaking the hydrocarbon bonds. The most common method is a thermal process carried out in steam-heated autoclave at a certain temperature (225 °C) and pressure (28–30 bar) in presence of catalysts. | Fuel | 11.4 | [65] |
Table 4.
Polymers in 2017 SEAT Leon vehicle according to category.
| Polymer | kg | % on Total Plastic |
|---|---|---|
| Thermoplastics | ||
| Polypropylene (PP) | 72.3 | 34.2 |
| Polyamide 66 (PA66) | 22.9 | 10.9 |
| Polyethylene Terephthalate (PET) | 15 | 7 |
| Polyethylene (PE) | 12.1 | 5.7 |
| Acrylonitrile Butadiene Styrene (ABS) | 10.9 | 5.2 |
| Polyvinyl Chloride (PVC) | 4.8 | 2.3 |
| Polycarbonate (PC) | 4.1 | 1.9 |
| Polyoxymethylene (POM) | 2.3 | 1.1 |
| Polysulfone (PES) | 1.7 | 0.8 |
| Polystyrene (PS) | 1.1 | 0.5 |
| Polyvinyl butyral (PVB) | 1 | 0.5 |
| Poly(methyl methacrylate) (PMMA) | 0.7 | 0.3 |
| Polyphenylene Sulfide (PPS) | 0.4 | 0.2 |
| Ethylene vinyl alcohol (EVOH) | 0.1 | 0.1 |
| Thermosets | ||
| Styrene-Butadiene Rubber (SBR) | 31.4 | 14.9 |
| Polyurethane (PU) | 17.2 | 8 |
| Ethylene Propylene Diene Rubber (EPDM) | 12.2 | 5.8 |
| Vinyl Methyl Silicone (VMQ) | 0.45 | 0.2 |
| Fluoroelastomer (FKM) | 0.28 | 0.1 |
| Polyacrylic rubber (ACM) | 0.17 | 0.1 |
| Epichlorohydrin rubber (ECO) | 0.11 | 0.05 |
| Total | 211.2 | |
| % on total car weight | 16.6 |
Table 5.
Details on plastic composition of SEAT Leon components.
| Vehicle Part | Polymer | Weight (g) | Additive | Weight (g) |
|---|---|---|---|---|
| Rear bumper | PP | 2627.3 | - | - |
| EPDM | 1409 | Talc | 162.2 | |
| PET | 39.6 | Titanium dioxide | 0.3 | |
| ABS | 26.8 | - | - | |
| PE | 18.9 | - | - | |
| PA6.6 | 3.3 | - | - | |
| tot | 4124.8 | tot | 162.5 | |
| % on component weight * | 78.5 | |||
| Dashboard | PP | 3228.6 | Talc | 296.6 |
| Glass fibre | 2865.4 | |||
| PE | 618.2 | - | - | |
| PU | 611.2 | - | - | |
| PVC | 511.6 | - | - | |
| PET | 6.6 | - | - | |
| tot | 5035.9 | tot | 3162 | |
| % on component weight * | 90.5 | |||
| Floor covering | PET | 1808.4 | - | - |
| PP | 581.3 | - | - | |
| PE | 219.1 | - | - | |
| SBR | 48.6 | Glass fibre | 105.2 | |
| PA6.6 | 23.9 | Glass fibre | 3.2 | |
| tot | 2681.2 | tot | 108.4 | |
| % on component weight * | 86.9 | |||
| Instrumental cluster | ABS | 237 | Carbon black | 1.19 |
| Glass fibre | 0.27 | |||
| PP | 53.3 | Talc | 38.4 | |
| PET | 5.9 | Titanium dioxide | 0.58 | |
| Glass fibre | 1.55 | |||
| Carbon black | 0.04 | |||
| PA6.6 | 4.2 | Glass fibre | 0.78 | |
| tot | 300.4 | tot | 42.8 | |
| % on component weight * | 46.5 |
* It refers to polymers with additives.
Table 6.
Composition of the major additives in vehicle polymers.
| Additive | Chemical Formula | Chemical Exergy (MJ/kg) | Ref. |
|---|---|---|---|
| Talc (Magnesium silicate) | Mg3H2(SiO3)4 | 0.096 | [41] |
| Titanium dioxide | TiO2 | 0.28 | [68] |
| Glass fibre | Combination of SiO2, CaO, Al2O3, B2O3, Na2O, MgO, FeO, TiO2, F2 | 0.97 | [41,68,69] |
| Carbon black | C | 34.2 | [41] |
Table 7.
Contribution of plastic to the embodied exergy of the entire vehicle.
| Polymers | Global EE (GJ) | EE of Vehicle (GJ/Ton) | Feedstock and Processing (from Naphtha to Polymer) (GJ) | ERC of Fossil Fuel (from Wood to Naphtha) (GJ) |
| 1715.9 | 1351.1 | 18.3 | 1697.6 | |
| Metals | Total rarity (GJ) | Rarity of vehicle (GJ/ton) | Beneficiation, smelting and refining (from mine to market) GJ | ERC of minerals (GJ) |
| 148.7 | 117.1 | 19.7 | 129 |
Publisher’s Note: MDPI stays neutral with regard to jurisdictional claims in published maps and institutional affiliations. |
© 2021 by the authors. Licensee MDPI, Basel, Switzerland. This article is an open access article distributed under the terms and conditions of the Creative Commons Attribution (CC BY) license (http://creativecommons.org/licenses/by/4.0/).
Share and Cite
MDPI and ACS Style
Russo, S.; Valero, A.; Valero, A.; Iglesias-Émbil, M. Exergy-Based Assessment of Polymers Production and Recycling: An Application to the Automotive Sector. Energies 2021, 14, 363. https://doi.org/10.3390/en14020363
AMA Style
Russo S, Valero A, Valero A, Iglesias-Émbil M. Exergy-Based Assessment of Polymers Production and Recycling: An Application to the Automotive Sector. Energies. 2021; 14(2):363. https://doi.org/10.3390/en14020363
Chicago/Turabian StyleRusso, Sofia, Alicia Valero, Antonio Valero, and Marta Iglesias-Émbil. 2021. "Exergy-Based Assessment of Polymers Production and Recycling: An Application to the Automotive Sector" Energies 14, no. 2: 363. https://doi.org/10.3390/en14020363
Note that from the first issue of 2016, this journal uses article numbers instead of page numbers. See further details here.