
Influence of Gas Flooding Pressure on Groundwater Flow during Oil Shale In Situ Exploitation
by
Lihong Yang
1, 
Zhao Liu
2,3,4,5,*,
Hao Zeng
1,
Jianzheng Su
1,
Yiwei Wang
1,
Xudong Chen
1 and
Wei Guo
2,3,4,5 1
Production Engineering Division, Sinopec Exploration & Production Research Institute, Beijing 100083, China
2
College of Construction Engineering, Jilin University, Changchun 130021, China
3
National-Local Joint Engineering Laboratory of In Situ Conversion, Drilling and Exploitation Technology for Oil Shale, Jilin University, Changchun 130021, China
4
Provincial and Ministerial Co-Construction of Collaborative Innovation Center for Shale Oil & Gas Exploration and Development, Jilin University, Changchun 130021, China
5
Key Lab of Ministry of Natural Resources for Drilling and Exploitation Technology in Complex Conditions, Jilin University, Changchun 130021, China
*
Author to whom correspondence should be addressed.
Energies 2021, 14(24), 8363; https://doi.org/10.3390/en14248363
Submission received: 21 October 2021
/
Revised: 19 November 2021
/
Accepted: 8 December 2021
/
Published: 11 December 2021
(This article belongs to the Special Issue Research and Development Progress in Oil Shale)
Abstract
:In order to weaken the influence of external groundwater on in situ pyrolysis exploitation, the flow characteristics of groundwater were studied according to the oil shale reservoir characteristics of Qingshankou Formation in Songliao Basin, China. In addition, the parameters of marginal gas flooding for water-stopping were optimized. Taking a one-to-one pattern and a five-spot pattern as examples, the characteristics of groundwater flow under the in situ process were studied. Under the one-to-one pattern, the external groundwater flows into the production well from the low-pressure side, and the water yield was basically stable at 1000 kg/d. In the five-spot pattern, the groundwater can flow into the production wells directly from the windward side, and the water yield of the production well on the leeward side mainly comes from the desaturated zone; the water yield of each production well remains at a high level. By setting water-stopping wells around the production well and keeping the gas flooding pressure slightly higher than the production well, the water yield of the production well can be reduced and stabilized within 100 kg/d under gas flooding pressures of 3 and 5 MPa. However, the gas yield of the production well slightly decreased when the gas flooding pressure reduced from 5 to 3 MPa. Therefore, the gas flooding pressure of water-stopping wells shall be determined in combination with the water yield and gas yield, so as to achieve the best process effect. It is expected that the results will provide technical support for large-scale oil shale in situ pyrolysis exploitation.
1. Introduction
Oil shale is a kind of solid combustible organic shale with high ash content. The internal kerogen can be cracked to produce shale oil at a temperature above 350 °C [1]. If the global oil shale resources are converted into shale oil, its resources are three times those of the proven crude oil reserves. Therefore, oil shale can be regarded as unconventional energy with huge reserves [2]. In situ pyrolysis is the most potential exploitation method of oil shale resources at present; this technology is used to heat the oil shale reservoir in situ to produce oil by kerogen cracking, and then extracting the products to the surface [3,4,5]. At present, one of the problems restricting the development of this technology is that it is difficult to cut off the connection between the pyrolysis zone and external groundwater, so that a large amount of injected heat is absorbed by the groundwater [5,6]. Moreover, the large amount of sewage produced will increase the burden of ground treatment. Therefore, reasonable measures should be taken to form a water-stopping effect in order to provide in situ pyrolysis space for oil shale.
At present, the widely used water-stopping methods both nationally and internationally mainly include an artificial freezing wall and underground grouting curtain [7,8,9,10]. The common disadvantage of the two technologies is that the sealing radius of a single well is small, less than 1 m, so it is not suitable for large-scale oil shale in situ exploitation [11,12,13]. In the field of underground engineering, such as landslide treatment, improving oil and gas recovery, and carbon dioxide geological storage [14,15], gas injection is a common technical means, where the injected gas can control the unexpected flow of the liquid phase [16,17,18,19,20,21]. Sun et al. proposed a novel technology of water-stopping by gas flooding (WSGF), which injects gas at high pressure around the in situ pyrolysis area to form a desaturated zone to block the infiltration of groundwater [6,22,23]. This method has the advantages of simplicity and high efficiency. Zhao et al. conducted in-depth research on the water-stopping characteristics and mechanism of WSGF by means of numerical simulation and experiment, and the results showed that the two-phase pressure balance at the gas–water interface is the main mechanism to prevent external groundwater infiltration. Through visual experiments, the mechanism was verified during gas flooding in two-dimensional porous media [22].
In summary, the following two points of the WSGF have not been discussed in detail, which obstructs its wide application:
- (1)
- The groundwater flow characteristics have not been focused on in combination with the in situ exploitation process of oil shale. In particular, a local high-permeability area will be formed in the oil shale reservoir after hydraulic fracturing.
- (2)
- The parameter optimization of SWGF was not considered. The optimum gas flooding pressure can significantly reduce the engineering cost and weaken the impact on the other process.
Numerical simulation is an ideal method that can coordinate the above two factors. Therefore, by considering the impact of hydraulic fracturing and other processes, this paper uses numerical simulation to study the gas–water two-phase flow and distribution characteristics in the oil shale in situ exploitation area before and during gas flooding, and the parameters of gas flooding for water-stopping were optimized in order to provide technical and theoretical reference for the application of SWGF in oil shale in situ mining.
2. Model Setup and Parameters
2.1. Numerical Simulation Model
In this paper, a Tough 2/EOS 3 module was used to study the groundwater flow characteristics in the oil shale in situ exploitation process. The mass and energy conservation equations of this module can be expressed as follows [24]:
where is the volume of any calculated micro-element, is the corresponding closed area of , F is the mass or heat flux, and M represents the source sink term and the mass or energy accumulation term. In the process of in situ pyrolysis of oil shale, the high-temperature area only exists between the heat injection well and the production well and will not have a significant impact on the external groundwater flow. Therefore, this paper simplified the operation and performed simulations in the isothermal state. Therefore, F only represents the mass flux generated by convection, which can be calculated by Darcy’s law.
Tough 2 provides different types of calculation methods for relative permeability and capillary pressure, and the Van Genuchten–Mualem model was selected in this paper because a change in pore characteristics is not present in this study; the relative permeability of water and gas can be expressed as follows [25]:
Similarly, the capillary pressure is as follows:
In this paper, numerical simulation was carried out according to the oil shale reservoir characteristics of Qingshankou Formation in Songliao Basin, China. The simulated layer depth is 500 m, and the hydraulic fracturing range is 35 m × 35 m; due to the existence of the hydraulic fracturing area, most of the injected gas flows into the fracturing area [26], so the selected calculation area is 50 m × 50 m, which can effectively reduce the influence of the boundary effect. Because the oil shale reservoir bedding is well developed, the fingering caused by gas-phase buoyancy is not obvious, so the two-dimensional geometric in the X/Y direction was selected. The hydraulic fracturing area is located in the middle of the model, and the heat injection well and production wells are also in the hydraulic fracturing area, with a distance of 10 m. In total, 2500 grid units (50 × 50) were divided with a single-layer grid in the longitudinal direction.
2.2. Model Parameters
The selection of hydrogeological parameters of the whole model intends to integrate the geological conditions of Fuyu and Fushun area in Songliao Basin, China [27]. The selected hydrogeological parameters of the model are shown in Table 1 below.
During the operation of the oil shale in situ pyrolysis process, it is necessary to use the heat injection well to inject heat-carrying gas into the formation to heat the oil shale reservoir, and the pyrolysis products are displaced by fluid and then produced from the production wells. Therefore, the heat injection well (Wh) and the production well (Wp) are necessary elements in the in situ pyrolysis exploitation process, and the distance between the two wells is 10 m. The initial groundwater velocity is 2.0 × 10⁻⁵ kg/s·m2, and the direction is from right to left. Taking one injection well and one production well (one-to-one and five-spot patterns) as examples, this paper firstly studied the characteristics of groundwater flow before gas flooding, and then water-stopping wells were adopted, which were used to inject gas at different pressures to control groundwater flow and minimize the infiltration of external groundwater into the in situ pyrolysis zone. In the exploitation process, in order to achieve a satisfactory convective heating and displacement effect, the pressure of the heat injection well is generally higher than the pore-water pressure, so the gas injection pressure of the heat injection well was set as 13 MPa in this model according to a pilot test in Fuyu, China [27]; the production well pressure was set to 2 MPa to discover the collection of pyrolysis products in the wells. The water-stopping wells (Wg) were used to regulate the flow direction of the surrounding groundwater, so pressures of 13, 5, and 3 MPa were selected arbitrarily from lower than the pore-water pressure to the heat injection pressure. Therefore, the influence of the relationship between the gas injection pressure and pore water pressure on the water-stopping effect can be discussed. The specific layout scheme of the water-stopping wells was determined according to this effect.
3. Simulation Results
3.1. Characteristics of Groundwater Flow without Marginal Gas Flooding
Firstly, this paper focused on the flow characteristics of groundwater in the conventional oil shale in situ exploitation process and evaluated the groundwater infiltration behavior under different patterns by taking the water yield of production wells and groundwater flow trace as indicators.
3.1.1. One-to-One Pattern
The one-to-one pattern is a general technical method for in situ oil shale pyrolysis exploitation at the lowest input cost. Based on the common parameters of a 500 m deep oil shale reservoir, this paper studied the infiltration trace of external groundwater and the water yield of production wells.
As shown in Figure 1, after the gas injection at a pressure of 13 MPa, a two-phase coexistence zone with a gas saturation of ~0.5 was formed between the two wells; taking the production well as the center, an obvious hydraulic gradient was formed, especially on the upper and lower sides. At the beginning of gas injection, the injected gas flowed to the production well under the pressure gradient and displaced the groundwater between the wells; then, a large number of gas–water mixtures were produced in the production well. The water yield of the production well was up to about 8000 kg/d after 5 days of gas injection. With the extension of the gas injection time, the groundwater between the wells was gradually displaced, the gas saturation increased, and the desaturated zone expanded gradually outward. Due to the existence of a high-permeability fracturing area, it is difficult for the gas to flow to the external low-permeability area. Therefore, the desaturated zone only expands in the high-permeability fracturing area and is basically stable after 180 days.
It can be seen that the water yield showed less variation after gas injection for 80 days, which is basically stable at 1000 kg/d. Although the water yield was greatly reduced compared with the initial stage of gas injection, it still remains at a high level. It can be seen from the groundwater flow trace in Figure 2 that the external groundwater flows around both sides when it encounters the high-pressure area so as to avoid invading the desaturated zone and flow into the production well. Although the gas injection well is located at the right side of the pyrolysis zone, which effectively avoids the direct invasion of groundwater, the groundwater can also carry the pyrolysis products at the edge of the pyrolysis zone into the production well so that the sewage production in the production well remains at a high level and increases the burden of surface treatment. Therefore, in this pattern, the high-pressure gas injection well on the windward side can reduce the impact of groundwater intrusion on the pyrolysis zone but cannot significantly reduce the sewage production of the production well.
3.1.2. Five-Spot Pattern
The five-spot pattern is not only used in conventional petroleum engineering, but also in the in situ pyrolysis exploitation of oil shale. The four production wells are evenly distributed outside, which can reduce the loss of pyrolysis products and realize the efficient and regular production of oil shale.
As shown in Figure 3a, the gas saturation between wells in this pattern is significantly higher than that in the one-to-one pattern, and the effective pyrolysis range is larger. The hydraulic gradient mainly exists in the inter-well area, while the hydraulic gradient outside the production wells is small. Under the dynamic action of groundwater on the right, the desaturated area develops slightly to the left. It can be seen from the groundwater trace in Figure 4 that the groundwater can directly flow into Wp1, Wp3, and Wp4 under a hydraulic gradient, while the water yield in Wp2 mainly comes from the continuous displacement of groundwater by high-pressure gas. Under the long-term high-pressure displacement, the inter-well water saturation decreases gradually, and the movable groundwater content also decreases gradually. Therefore, compared with the other three production wells, the water yield of Wp2 is the least, at ~300 kg/d, and the water yield of Wp4 is as high as 700 kg/d. According to the groundwater flow trace, it presents that only the water yield of Wp2 will carry pyrolysis products, while most of the other three wells are the direct infiltration of external groundwater, which has little mass exchange effect on the pyrolysis zone. In summary, the sewage production remains at a high level under this pattern.
3.2. Characteristics of Groundwater Flow with Marginal Gas Flooding
The previous experimental results showed that groundwater infiltration can be controlled by high-pressure gas flooding around the in situ pyrolysis zone [22]. Therefore, the flow characteristics of groundwater under marginal gas flooding according to the one-to-one pattern were further studied in this paper. The reason why the five-spot pattern was not selected as the research object was to reduce the model size and improve the calculation speed. No matter which pattern is used, the influencing mechanism of gas flooding on groundwater flow remains the same.
3.2.1. Marginal Gas Flooding of 13 MPa
Firstly, we adopted a gas flooding pressure of 13 MPa in water-stopping wells (Wg1–Wg3), which was consistent with the pressure in the heat injection well, and set three water-stopping wells outside the production well to study the characteristics of water yield in the production well. As shown in Figure 5, under the condition of 13 MPa high-pressure gas flooding, a desaturated zone was formed between the four high-pressure gas injection wells and the production well, but the range of the desaturated zone between the heat injection well and production well was smaller than that of the other regions. This was due to the expansion of the high-pressure area and the increase in the flow resistance of groundwater. The groundwater flowed to the production well along the hydraulic gradient, and it can also be seen from Figure 6 that the water yield of the production well mainly comes from the external groundwater. In addition, the groundwater velocity on the windward side was larger and that on the leeward side was smaller. It can also be seen that under the condition of marginal gas flooding, the water yield of the production well was reduced from 1000 kg/d to about 800 kg/d, indicating that the water yield of the production well was not effectively controlled when the marginal gas flooding pressure was high, and the groundwater flow through the edge of the in situ pyrolysis zone can carry a large amount of pyrolysis products and injection heat. In brief, the effect improvement was not obvious, so it is necessary to optimize the parameters of gas flooding for water-stopping.
3.2.2. Marginal Gas Flooding of 5 and 3 MPa
When the gas flooding pressure is equal to the pressure in the in situ pyrolysis zone, the whole area is at a high pressure level, and the groundwater will invade the pyrolysis zone under a large pressure gradient. Therefore, the gas flooding pressure was reduced to 5 MPa to optimize the distribution of the underground pressure field. As shown in Figure 7, the gas saturation of the whole area was high, with an average of ~0.4, and the area with high gas saturation was significantly expanded, which means that the pyrolysis zone between the heat injection well and the production well is expanded. In addition, the results showed that since the pressure of the heat injection well was significantly higher than the gas flooding pressure (Figure 8 and Figure 9), the width of the desaturated zone on the right side was larger than that on the left side but was limited to the fracturing area. The groundwater invaded into the water-stopping well Wg2 on the left side of the desaturated zone. Therefore, the low-pressure gas flooding makes the high-speed seepage area of groundwater transfer from the right to the left and it can effectively avoid the intrusion of groundwater into the in situ pyrolysis zone, which is also the result of the regulation of the groundwater flow direction by gas flooding.
Since the gas flooding pressure of 5 MPa realized the shielding effect on the groundwater, the gas flooding pressure was further reduced to 3 MPa in this paper. As shown in Figure 8, the range of the whole desaturated zone and the gas saturation change slightly, and the water flow trace was almost consistent with that of the 5 MPa condition. Therefore, from the perspective of restraining groundwater intrusion, a gas flooding pressure of 3 MPa can also meet the engineering requirements. Figure 10 presents the water yield of the production well when the gas flooding pressure is 5 and 3 MPa. It can be seen that the water yield of the production well can be reduced and stabilized within 100 kg/d under the two pressure levels. When the gas flooding pressure was 5 MPa, the water yield of the production well was slightly higher at the initial stage of gas injection but with the displacement of groundwater, the water yield of the production well was basically the same.
4. Discussion
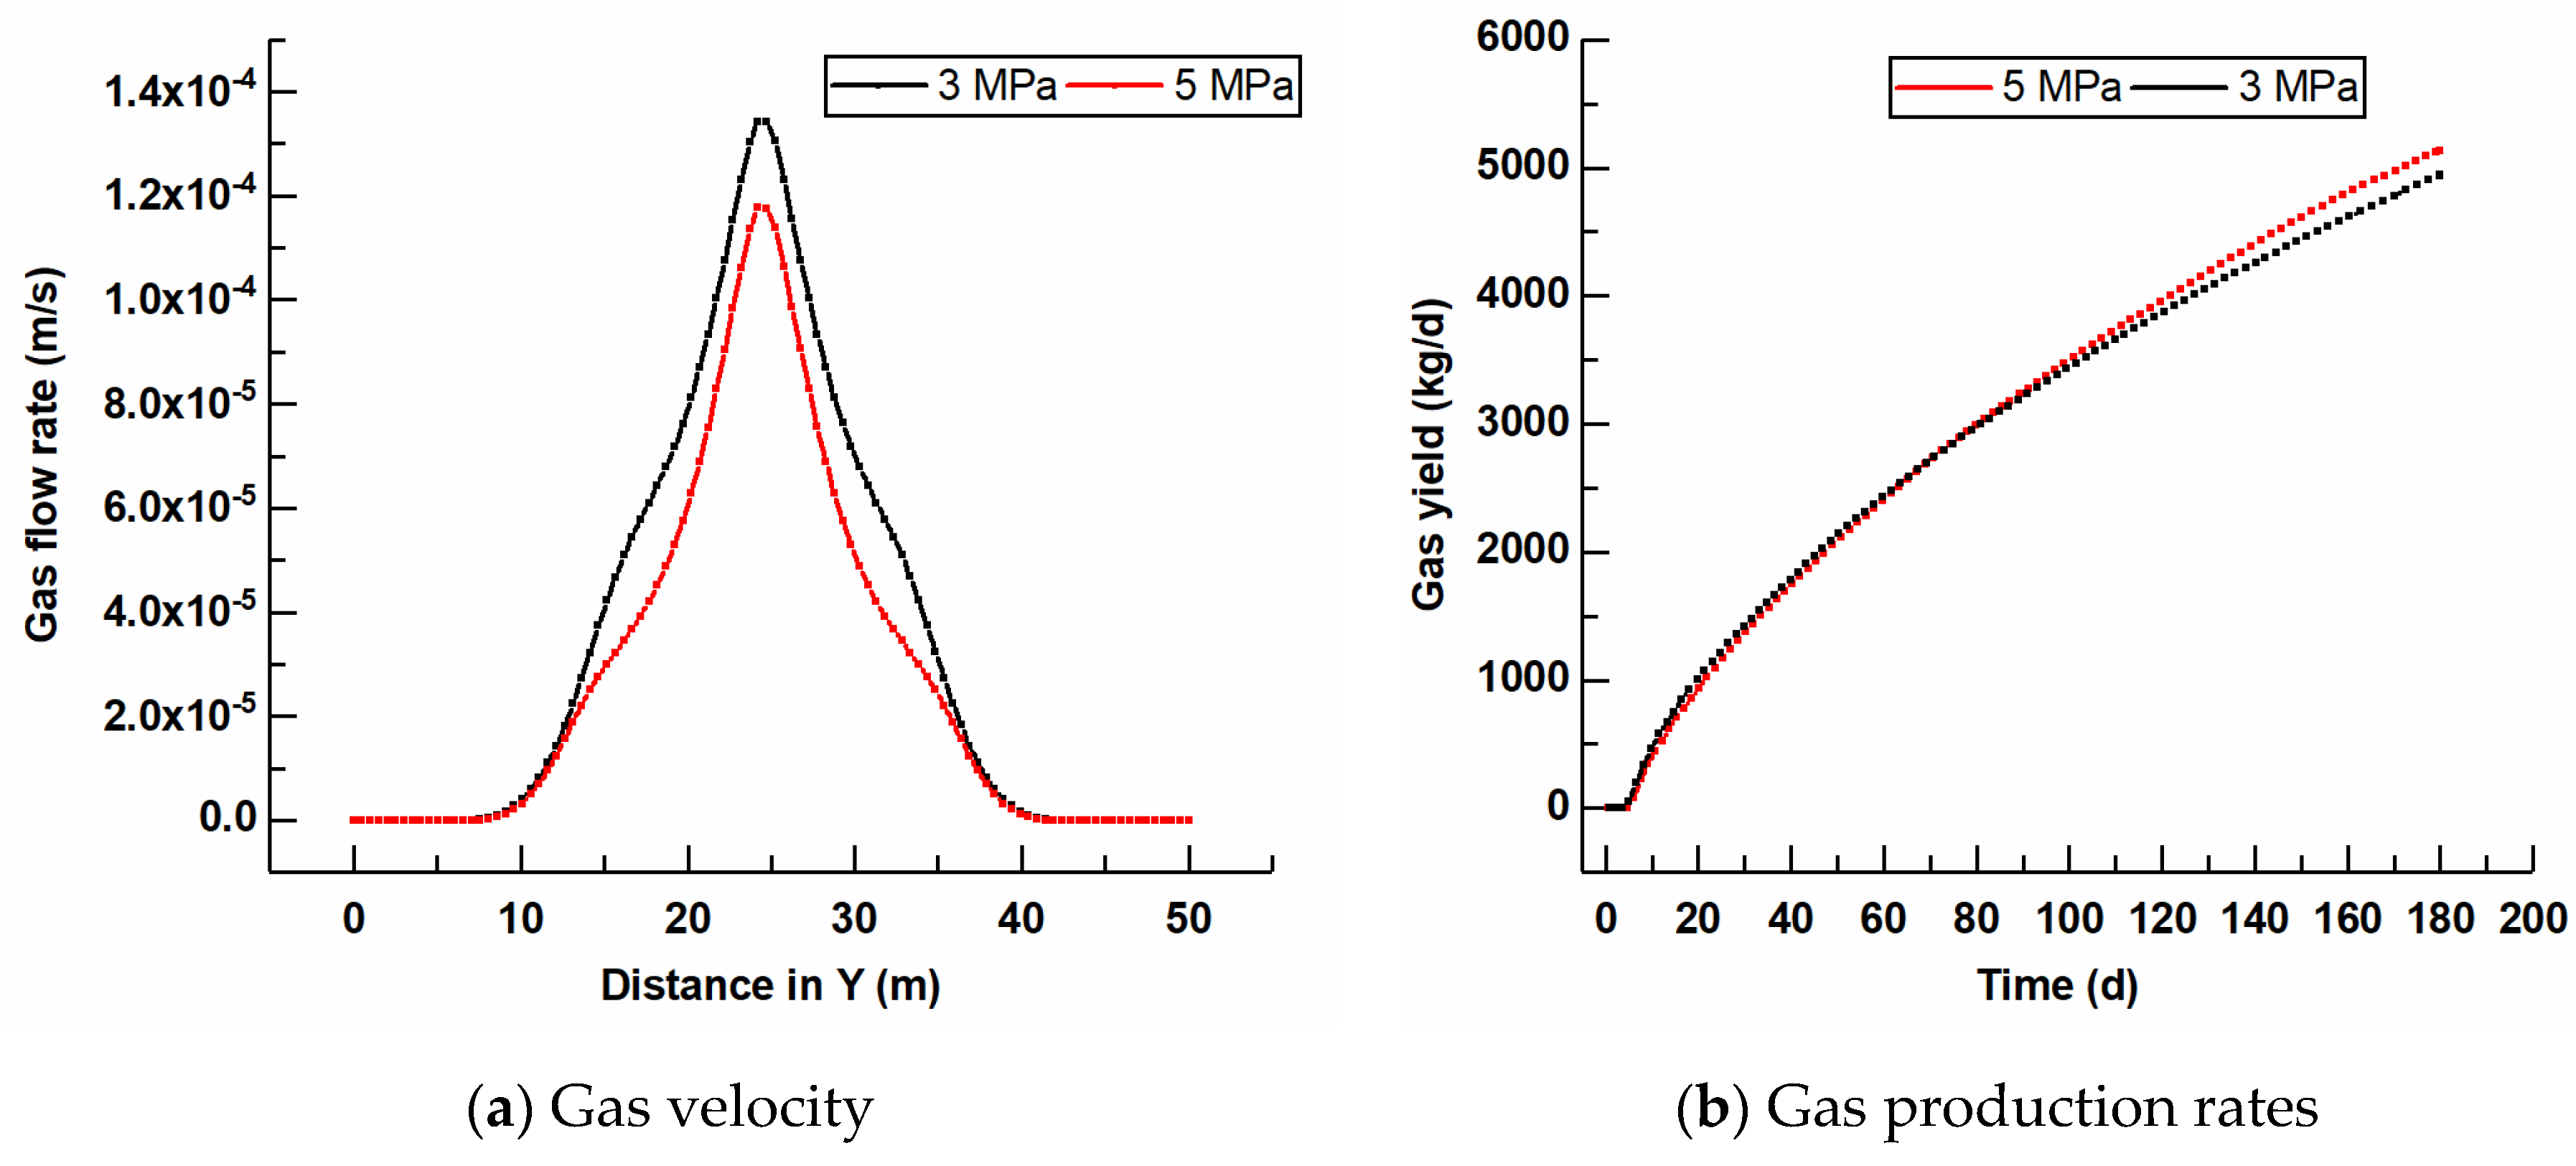
The pressure change in the water-stopping well will affect the flow range and flow rate of heat-carrying gas, and then affect the convective heating efficiency and heating range. Figure 11 showed the distribution of gas velocity in the vertical direction between the heat injection well and the production well. It showed that when the gas flooding pressure was 3 MPa, the gas velocity in the in situ pyrolysis zone was slightly higher than that of the 5 MPa condition. This is due to the reduction in gas flooding pressure, which can significantly reduce the pressure level at the side of the production well so as to improve the pressure gradient between the heat injection well and the production well, and then the gas velocity increases. According to the gas production rate in the production well, the gas production rate was relatively low under a gas flooding pressure of 3 MPa, which indicates that although the gas velocity is large, the effective width of the gas flow field from the heat injection well to the production well is reduced, which affects the width of the in situ pyrolysis zone. Although the two gas pressure levels can achieve an expected and consistent water-stopping effect, they will have different effects on the other in situ pyrolysis processes.
Water-stopping in the in situ pyrolysis zone is a key process for the in situ pyrolysis exploitation of oil shale. Therefore, it is necessary not only to inhibit groundwater infiltration to the greatest extent, but also to minimize the impact of gas flooding on the other in situ pyrolysis process. According to our previous research, the balance between the gas pressure, pore water pressure, and capillary pressure at the gas–water front interface is the mechanism of water-stopping [6,22]. Therefore, the gas flooding pressure being slightly higher than the local pore water pressure is a necessary condition for water-stopping. In this paper, since the production well pressure is 2 MPa, gas flooding pressures of 3 and 5 MPa can achieve the expected water-stopping effect. When the gas flooding pressure is continuously reduced below 2 MPa, the pressure of the water-stopping well is lower than that of the production well, which will significantly affect the direction of the pressure gradient and change the flow direction of the heat-carrying fluid. It can be roughly deduced from Figure 11 that a lower gas flooding pressure will reduce the gas yield in the production well, which is not conducive to the in situ pyrolysis process. In addition, when the gas flooding pressure is too low, the gas flooding effect will decrease significantly, and the water-stopping well can only play the role of precipitation. Therefore, setting the pressure of the gas flooding as slightly higher than the production well and the surrounding layout of water-stopping wells can play an excellent water-stopping effect with the lowest impact on in situ pyrolysis.
It is notable that this work is based on a reservoir-scale numerical simulation, and the characteristics of gas–water two-phase flow at the pore scale need to be further developed, especially in porous media with a high-permeability fracturing area. Furthermore, relevant research can provide a more in-depth explanation for this work. Meanwhile, it can provide theoretical guidance for the application of this method.
5. Conclusions
In order to weaken the influence of external groundwater on the in situ pyrolysis exploitation, the flow characteristics of groundwater were studied. In addition, the parameters of marginal gas flooding for water-stopping were optimized by numerical simulation in this paper. The specific conclusions are as follows:
- (1)
- Taking the one-to-one and five-spot patterns as examples, the characteristics of groundwater flow were studied. Under the one-to-one pattern, the external groundwater flows into the production well from the low-pressure side, and the water yield of the production well was basically stable at 1000 kg/d. In the five-spot pattern, groundwater can flow into the production wells directly from the windward side, and the water inflow of the production well on the leeward side mainly comes from the desaturated zone; the water yield of each production well remains at a high level.
- (2)
- By setting water-stopping wells around the production well and keeping the gas flooding pressure slightly higher than the production well, the water yield of the production well can be reduced and stabilized within 100 kg/d under gas flooding pressures of 3 and 5 MPa.
- (3)
- The lower the gas flooding pressure, the lower the gas yield in the production well, so the gas flooding pressure of the water-stopping well shall be determined in combination with the water yield and gas yield so as to achieve the best process effect.
Author Contributions
Conceptualization, L.Y., Z.L. and Y.W.; Investigation, L.Y. and Z.L.; Methodology, H.Z., Y.W. and X.C.; Resources, H.Z.; Supervision and Project administration, J.S. and W.G.; Writing-Original draft preparation, Z.L. All authors have read and agreed to the published version of the manuscript.
Funding
This work was supported by the Sinopec “Key Technologies for In-situ Conversion and Exploi-tation of Oil Shale” (Grant No. P20066) and the National Key Research and Development Pro-gram of China (Grant No. 2019YFA0705502 and Grant No. 2019YFA0705503).
Institutional Review Board Statement
Not applicable.
Informed Consent Statement
Not applicable.
Acknowledgments
We are appreciative of the insightful comments on our manuscript from anonymous reviewers, which were beneficial for improving our work.
Conflicts of Interest
The authors declare no conflict of interest.
References
- Russell, P.L. Oil Shales of the World: Their Origin, Occurrence, and Exploitation; Pergamon Press: Oxford, UK, 1990. [Google Scholar]
- Dyni, J.R. Geology and resources of some world oil-shale deposits. Oil Shale 2003, 20, 193–252. [Google Scholar]
- Sun, Y.; Bai, F.; Liu, B.; Liu, Y.; Guo, M.; Guo, W.; Wang, Q.; Lü, X.; Yang, F.; Yang, Y. Characterization of the oil shale products derived via topochemical reaction method. Fuel 2014, 115, 338–346. [Google Scholar] [CrossRef]
- Sun, Y.; Yang, Y.; Lopatin, V.; Guo, W.; Liu, B.; Yu, P.; Gao, K.; Ma, Y. High Voltage-Power Frequency Electrical Heating In-Situ Conversion Technology of Oil Shale; Egu General Assembly: Munich, Germany, 2014. [Google Scholar]
- Kang, Z.; Zhao, Y.; Yang, D. Review of oil shale in-situ conversion technology. Appl. Energy 2020, 269, 115121. [Google Scholar] [CrossRef]
- Sun, Y.; Liu, Z.; Li, Q.; Guo, W. Controlling groundwater infiltration by gas flooding for oil shale in situ pyrolysis exploitation. J. Pet. Sci. Eng. 2019, 179, 444–454. [Google Scholar] [CrossRef]
- Granata, R.; Vanni, D.; Mauro, M. New experiences in ground treatment by permeation grouting. In Proceedings of the Fourth International Conference on Grouting and Deep Mixing, New Orleans, LA, USA, 15–18 February 2012; pp. 2013–2023. [Google Scholar]
- Semin, M.; Golovatyi, I.; Pugin, A. Analysis of Temperature Anomalies during Thermal Monitoring of Frozen Wall Formation. Fluids 2021, 6, 297. [Google Scholar] [CrossRef]
- Xu, L. Underground grouting technology for water blocking curtain in coal mines. China Coal 2008, 34, 53–55. [Google Scholar]
- He, K.; Wang, R.; Jiang, W. Groundwater Inrush Channel Detection and Curtain Grouting of the Gaoyang Iron Ore Mine, China. Mine Water Environ. 2012, 31, 297–306. [Google Scholar] [CrossRef]
- Guo, W.; Zhang, M.; Sun, Y.; Li, Q.; Zhao, S.; Deng, S. Numerical simulation and field test of grouting in Nong’an pilot project of in-situ conversion of oil shale. J. Pet. Sci. Eng. 2019, 184, 106477. [Google Scholar] [CrossRef]
- Vitel, M.; Rouabhi, A.; Tijani, M.; Guérin, F. Modeling heat transfer between a freeze pipe and the surrounding ground during artificial ground freezing activities. Comput. Geotech. 2015, 63, 99–111. [Google Scholar] [CrossRef]
- Hu, X.; Fang, T.; Chen, J.; Ren, H.; Guo, W. A large-scale physical model test on frozen status in freeze-sealing pipe roof method for tunnel construction. Tunn. Undergr. Space Technol. 2018, 72, 55–63. [Google Scholar] [CrossRef]
- Bao, J.; Zeliang, C.; Chenggang, X. Investigations of CO2 storage capacity and flow behavior in shale formation. J. Pet. Sci. Eng. 2022, 208, 109659. [Google Scholar]
- Herring, A.L.; Harper, E.J.; Andersson, L.; Sheppard, A.; Bay, B.K.; Wildenschild, D. Effect of fluid topology on residual nonwetting phase trapping: Implications for geologic CO2 sequestration. Adv. Water Resour. 2013, 62, 47–58. [Google Scholar] [CrossRef]
- Johnson, R.L.; Johnson, P.C.; Mcwhorter, D.; Hinchee, R.E.; Goodman, I. An Overview of In Situ Air Sparging. Ground Water Monit. Remediat. 2010, 13, 127–135. [Google Scholar] [CrossRef]
- Song, X.; Zhao, Y.; Wang, H.; Qin, C. Predictive models and airflow distribution associated with the zone of influence (ZOI) during air sparging remediation. Sci. Total Environ. 2015, 537, 1–8. [Google Scholar] [CrossRef] [PubMed]
- Sun, D.M.; Semprich, S. Using Compressed Air Injection to Control Seawater Intrusion in a Confined Coastal Aquifer. Transp. Porous Media 2013, 100, 259–278. [Google Scholar] [CrossRef]
- Dror, I.; Berkowitz, B.; Gorelick, S.M. Effects of air injection on flow through porous media: Observations and analyses of laboratory—Scale processes. Water Resour. Res. 2004, 40, 101–102. [Google Scholar] [CrossRef] [Green Version]
- Xie, W.; Shang, Y.; Wu, G.; Wei, Z. Investigation of the formation process of a low-permeability unsaturated zone by air injection method in a slope. Eng. Geol. 2018, 245, 10–19. [Google Scholar] [CrossRef]
- Wang, Y.; Liu, H.; Chen, Z.; Wu, Z.; Pang, Z.; Dong, X.; Chen, F. A visualized investigation on the mechanisms of anti-water coning process using nitrogen injection in horizontal wells. J. Pet. Sci. Eng. 2018, 166, 636–649. [Google Scholar] [CrossRef]
- Liu, Z.; Sun, Y.; Guo, W.; Li, Q. Experimental study of the characteristics of gas-injection barrier in two-dimensional porous media. J. Hydrol. 2021, 593, 125919. [Google Scholar] [CrossRef]
- Liu, Z.; Sun, Y.; Guo, W.; Li, Q. Sealing effects of marginal gas injection on oil shale in situ pyrolysis exploitation. J. Pet. Sci. Eng. 2020, 189, 106968. [Google Scholar] [CrossRef]
- Pruess, K.; Oldenburg, C.M.; Moridis, G.J. TOUGH2 User’s Guide Version 2; Office of Scientific & Technical Information Technical Reports; The U.S. Department of Energy: Washington, DC, USA, 1999.
- Genuchten, V.; Th, M. A closed-form equation for predicting the hydraulic conductivity of unsaturated soils. Soil Sci. Soc. Am. J. 1980, 44, 892–898. [Google Scholar] [CrossRef] [Green Version]
- Zhao, S.; Sun, Y.; Wang, H.; Li, Q.; Guo, W. Modeling and field-testing of fracturing fluid back-flow after acid fracturing in unconventional reservoirs. J. Pet. Sci. Eng. 2019, 176, 494–501. [Google Scholar] [CrossRef]
- Liu, Z.; Sun, Y.; Guo, W.; Li, Q. Reservoir-scale study of oil shale hydration swelling and thermal expansion after hydraulic fracturing. J. Pet. Sci. Eng. 2020, 195, 107619. [Google Scholar] [CrossRef]
Figure 1.
Gas saturation and pressure nephograms after gas injection for 6 months (the red dotted line box represents the hydraulic fracturing area).
Figure 1.
Gas saturation and pressure nephograms after gas injection for 6 months (the red dotted line box represents the hydraulic fracturing area).
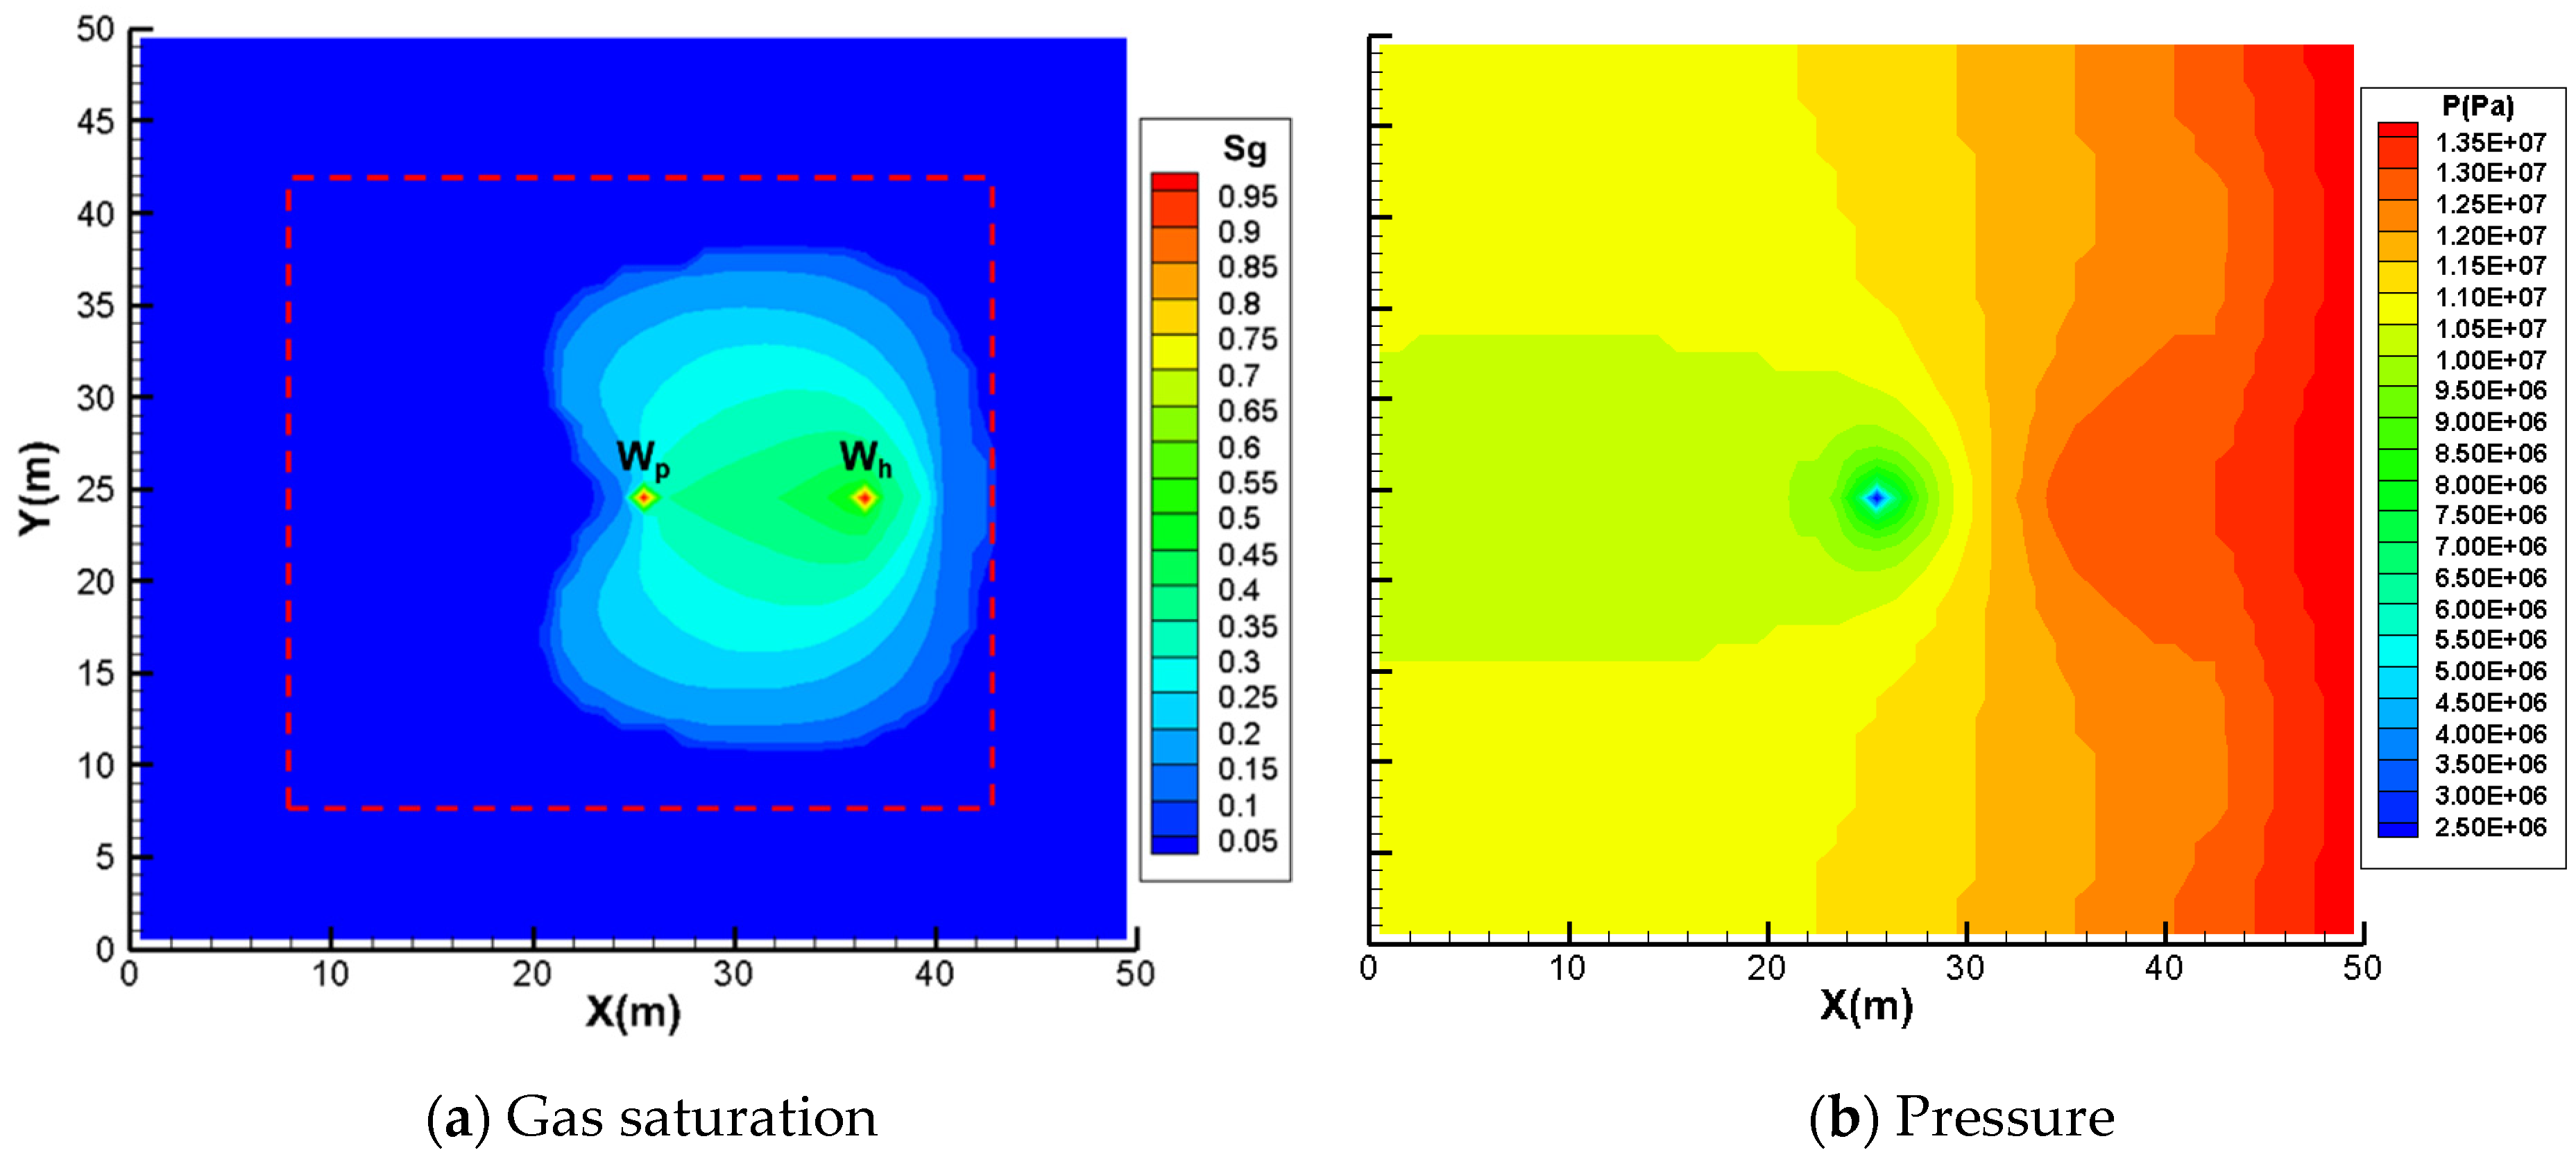
Figure 2.
Groundwater flow traces and water yield of production well.
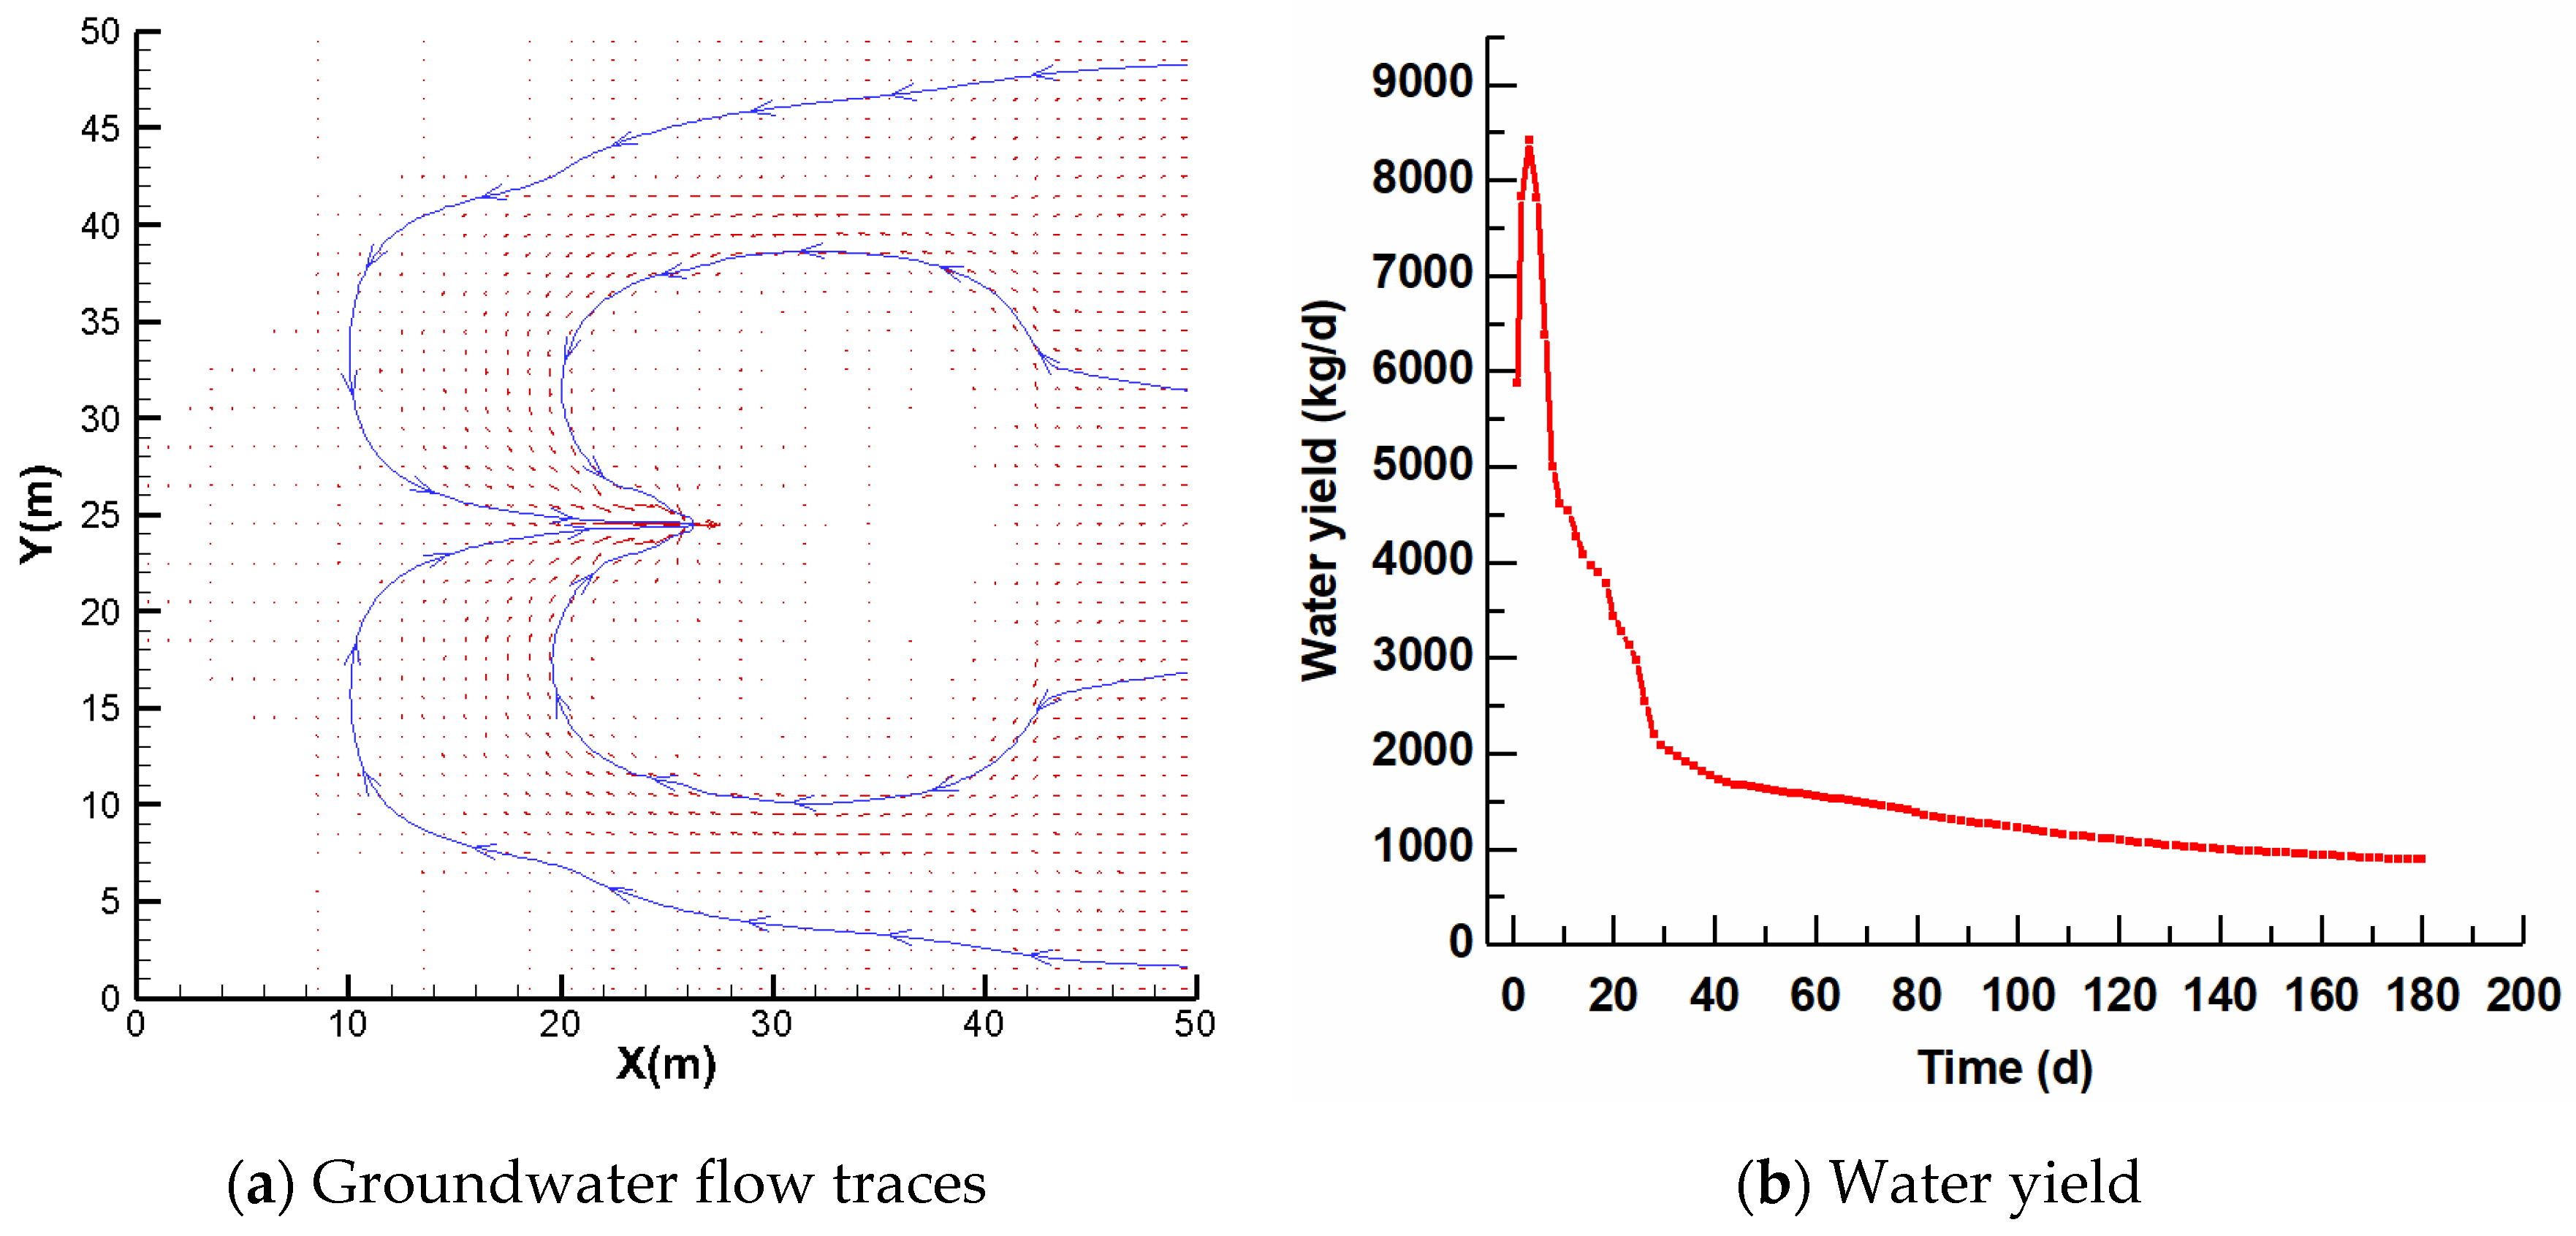
Figure 3.
Gas saturation and pressure nephograms after gas injection for 6 months.
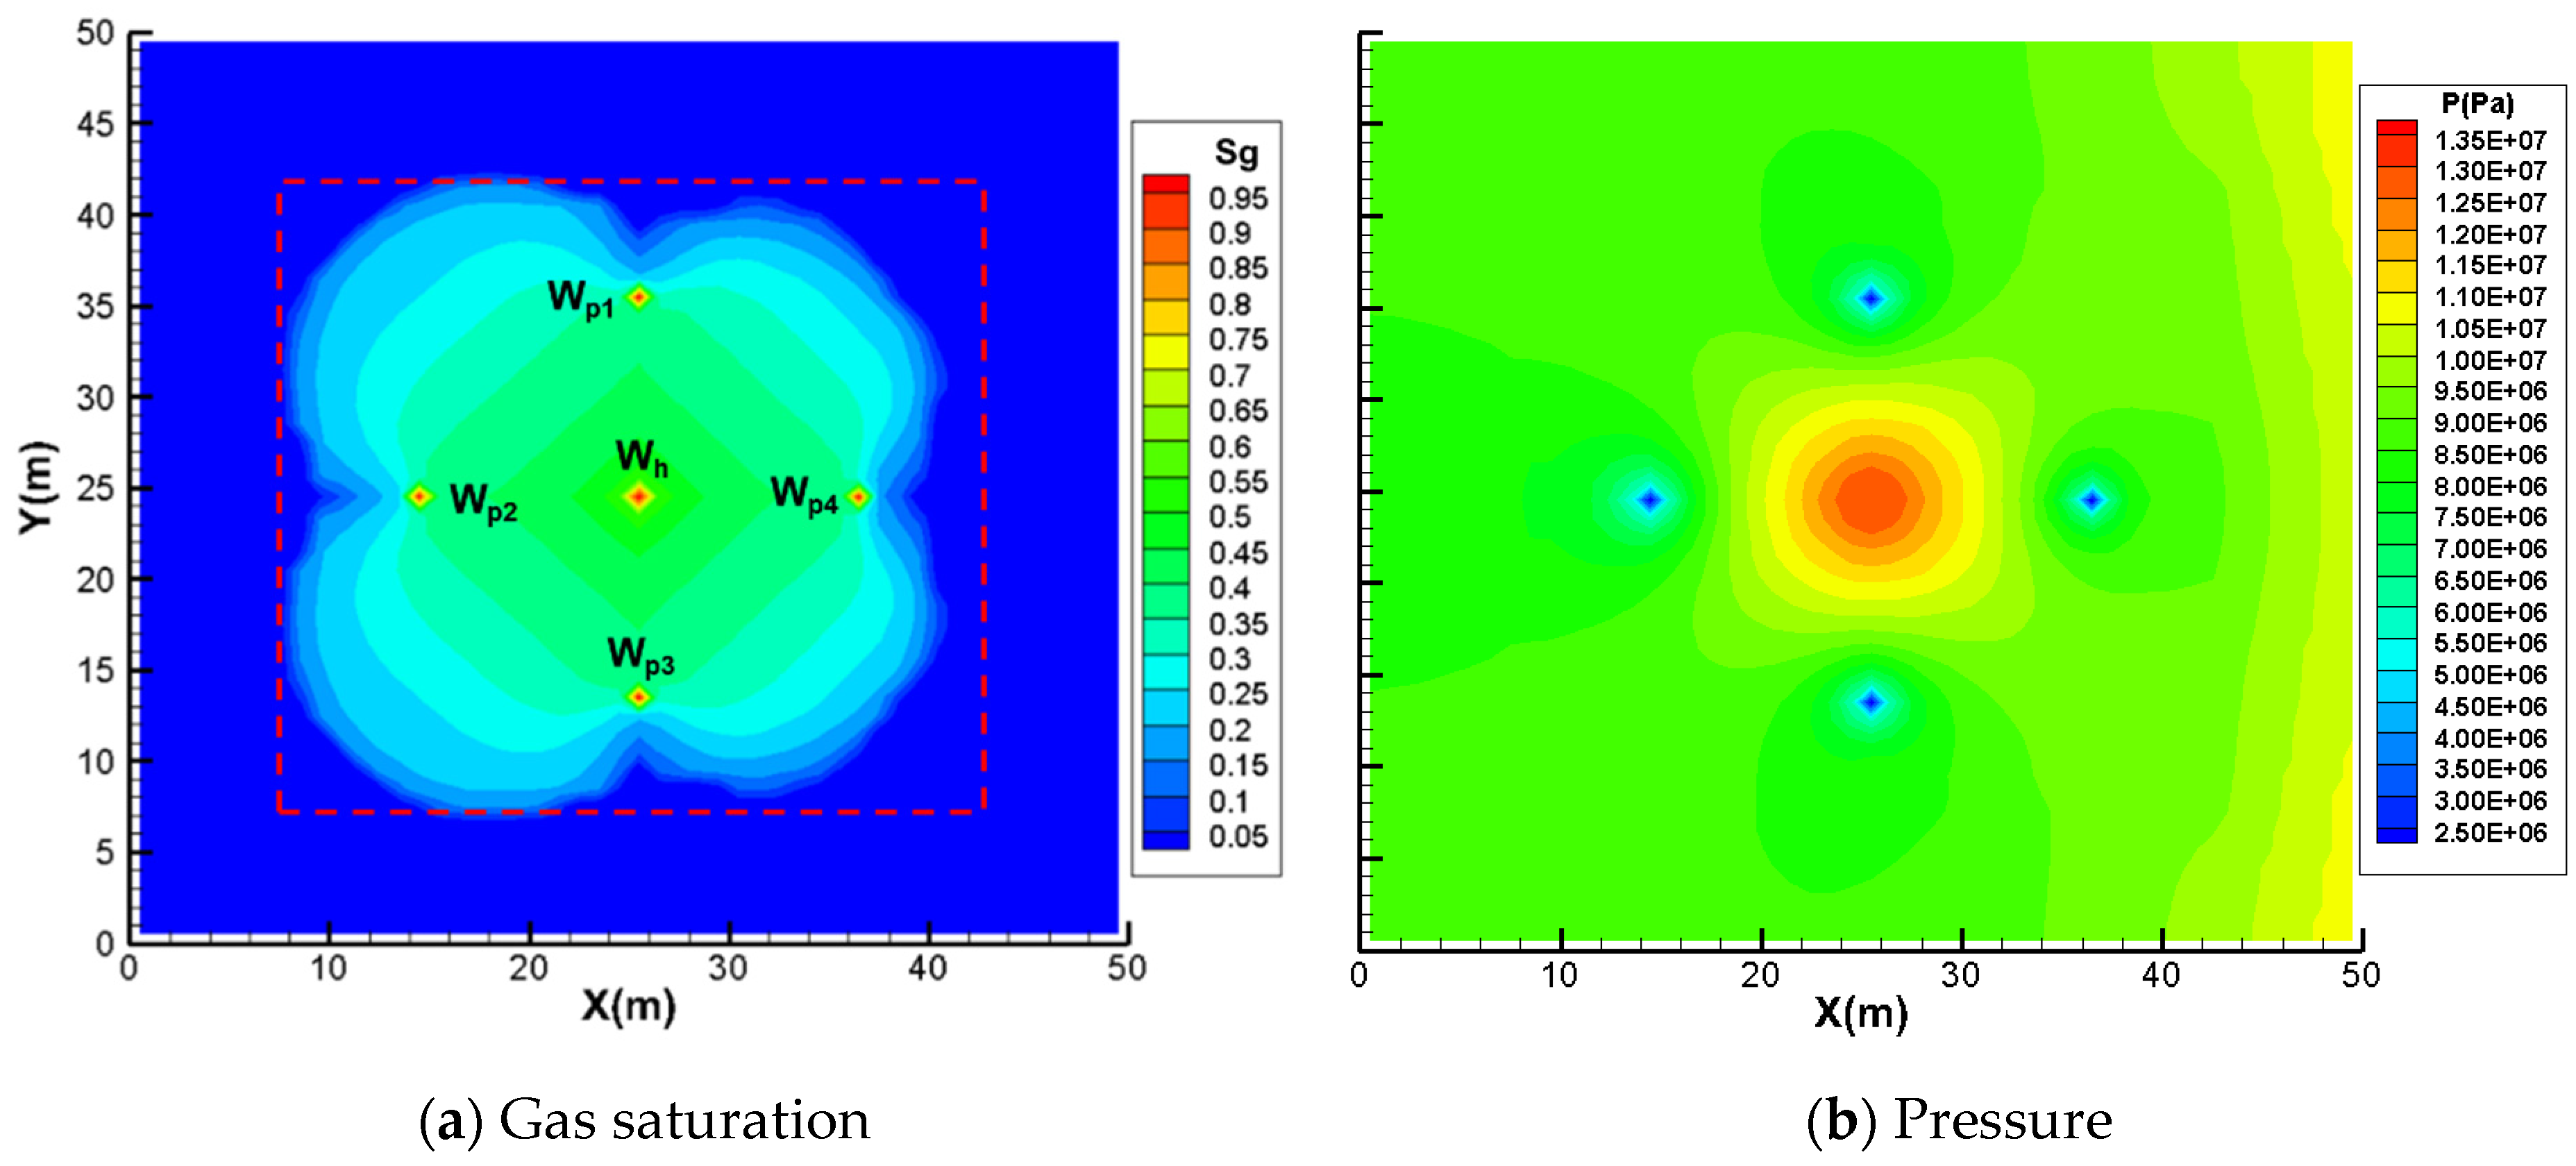
Figure 4.
Groundwater flow traces and water yield of the production wells.
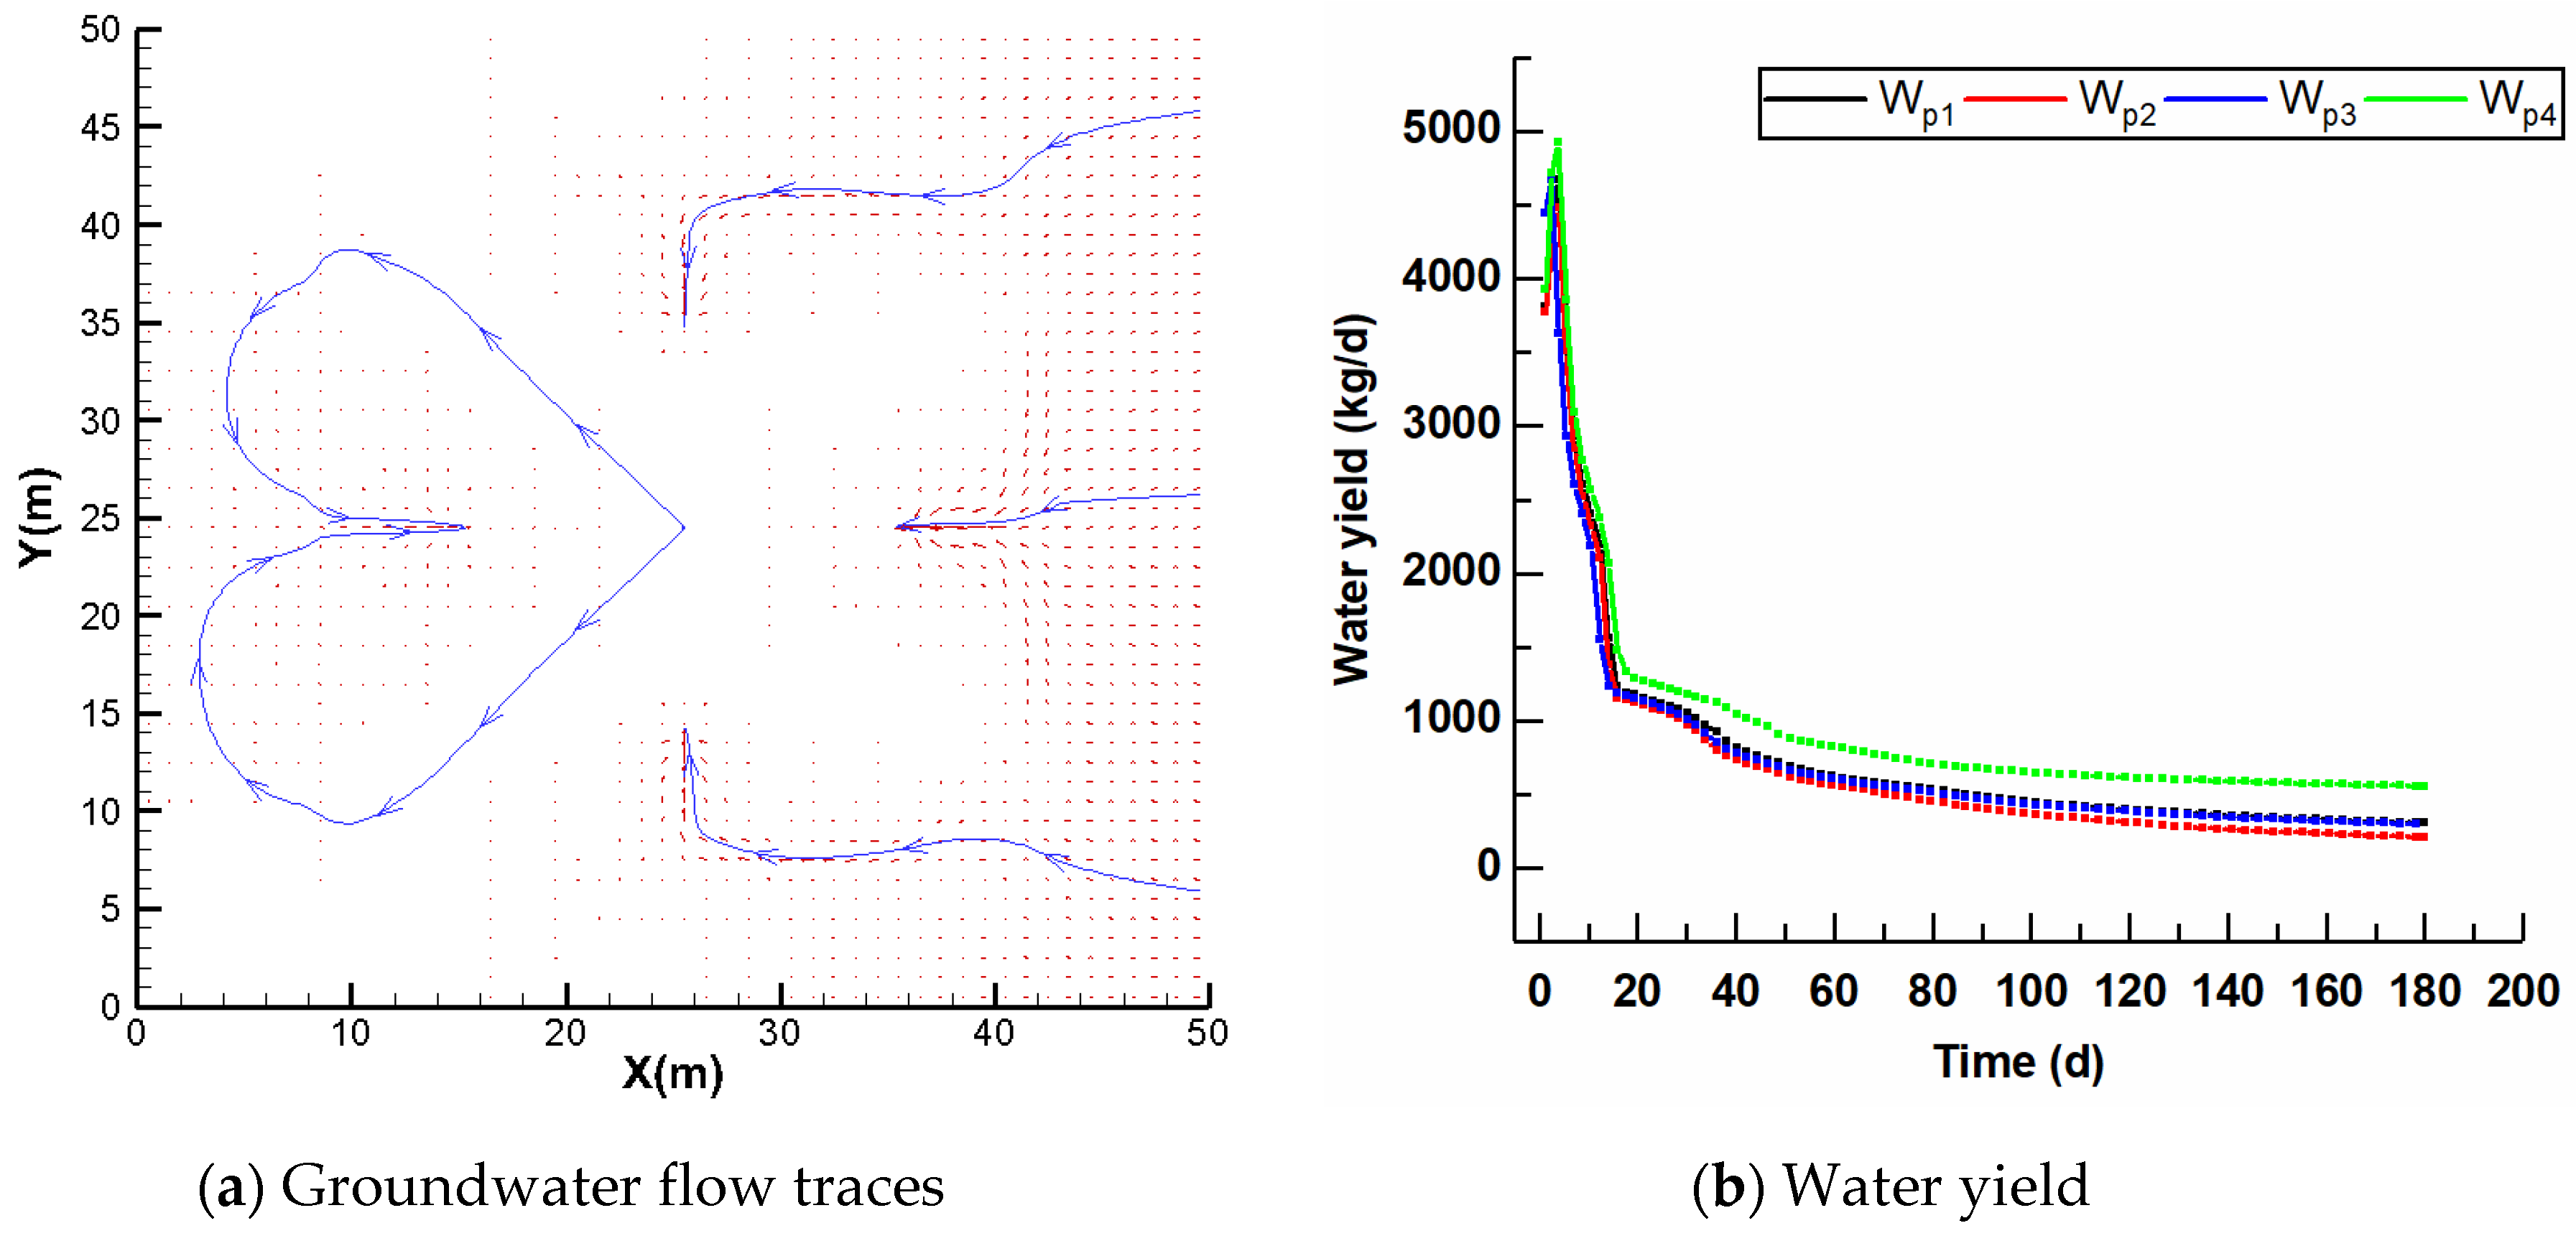
Figure 5.
Gas saturation and pressure nephograms after gas injection for 6 months.
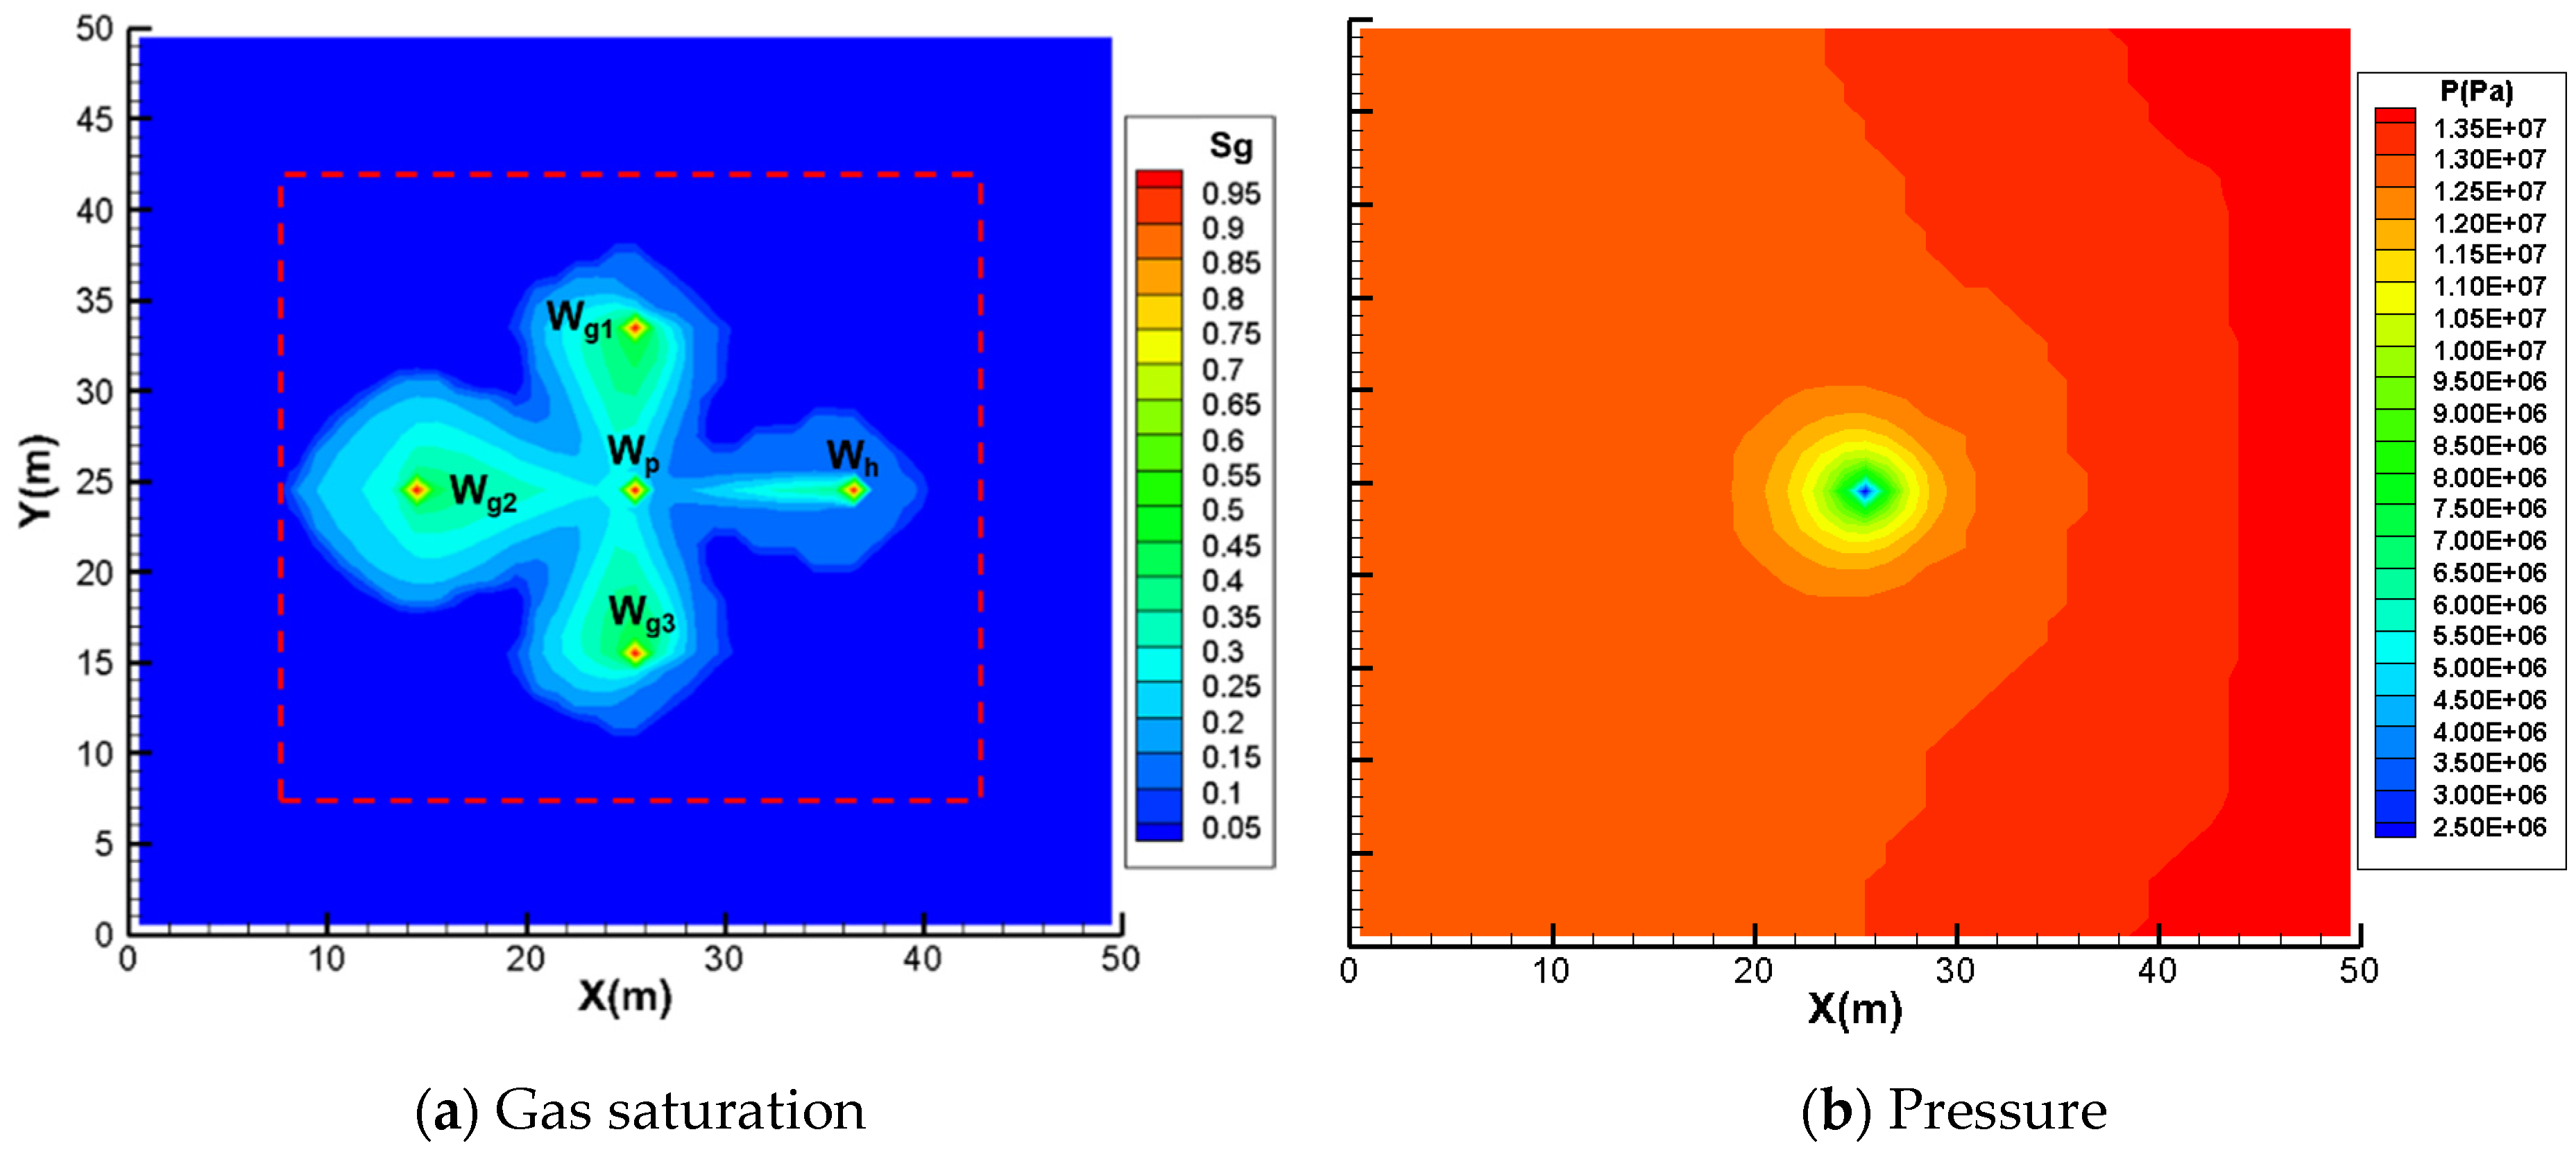
Figure 6.
Groundwater flow traces and water yield of the production well.
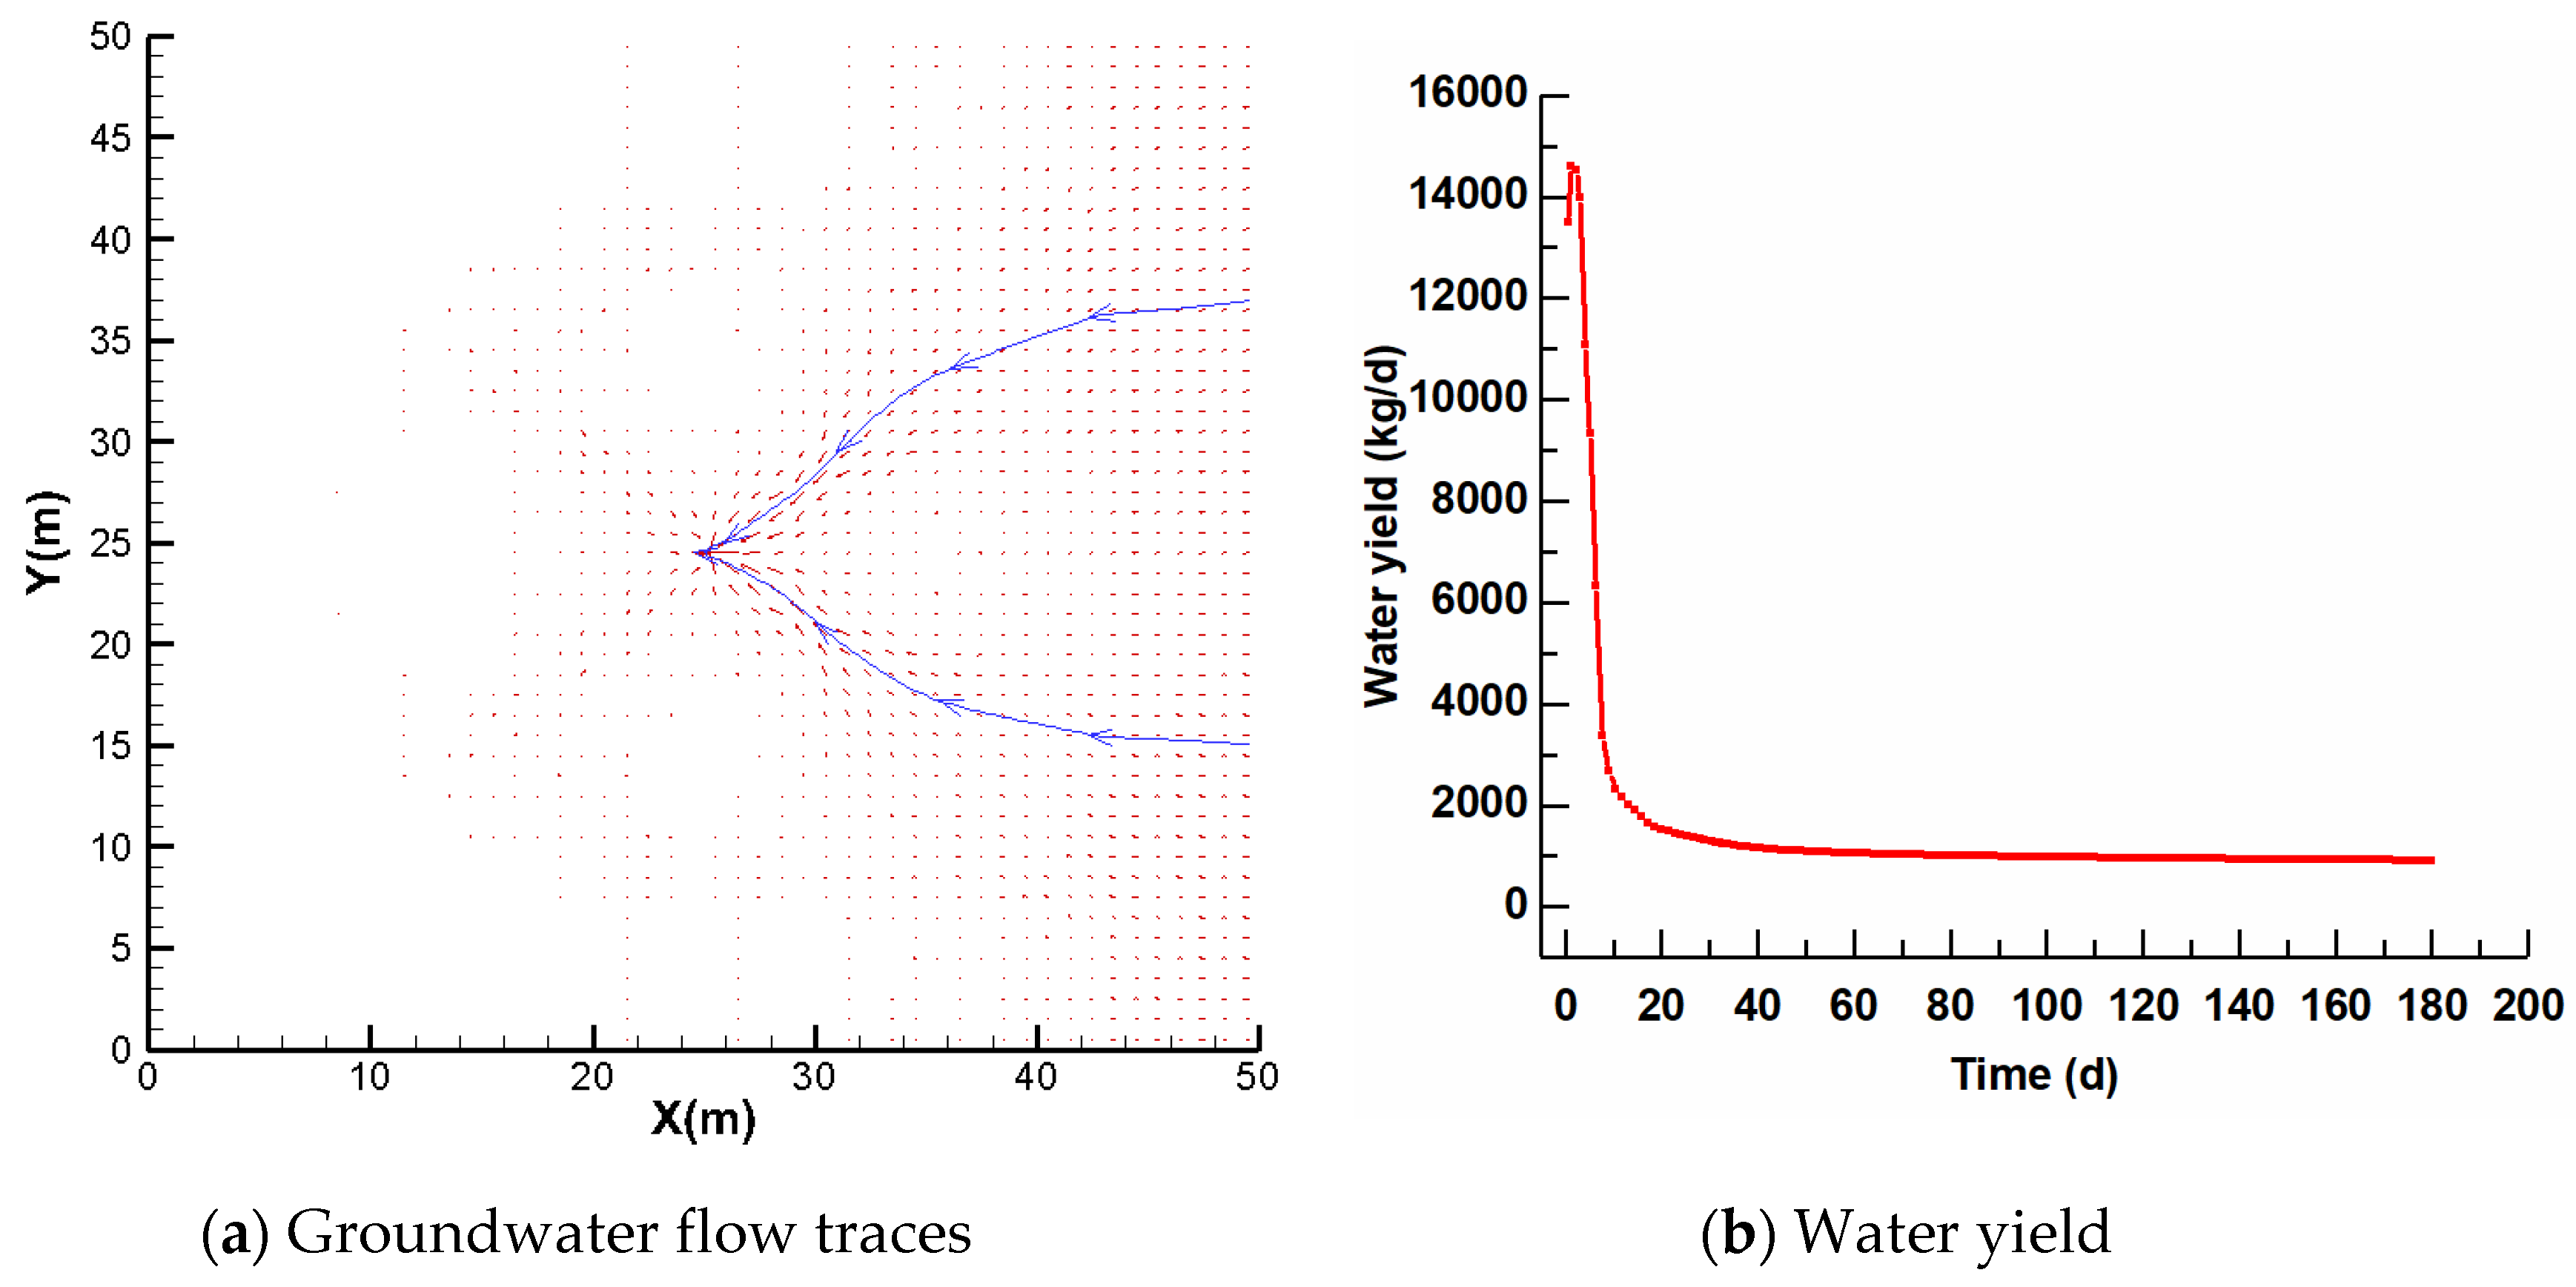
Figure 7.
Gas saturation nephogram and groundwater flow traces in the gas flooding pressure of 5 MPa.
Figure 7.
Gas saturation nephogram and groundwater flow traces in the gas flooding pressure of 5 MPa.

Figure 8.
Gas saturation nephogram and groundwater flow traces in the gas flooding pressure of 3 MPa.
Figure 8.
Gas saturation nephogram and groundwater flow traces in the gas flooding pressure of 3 MPa.
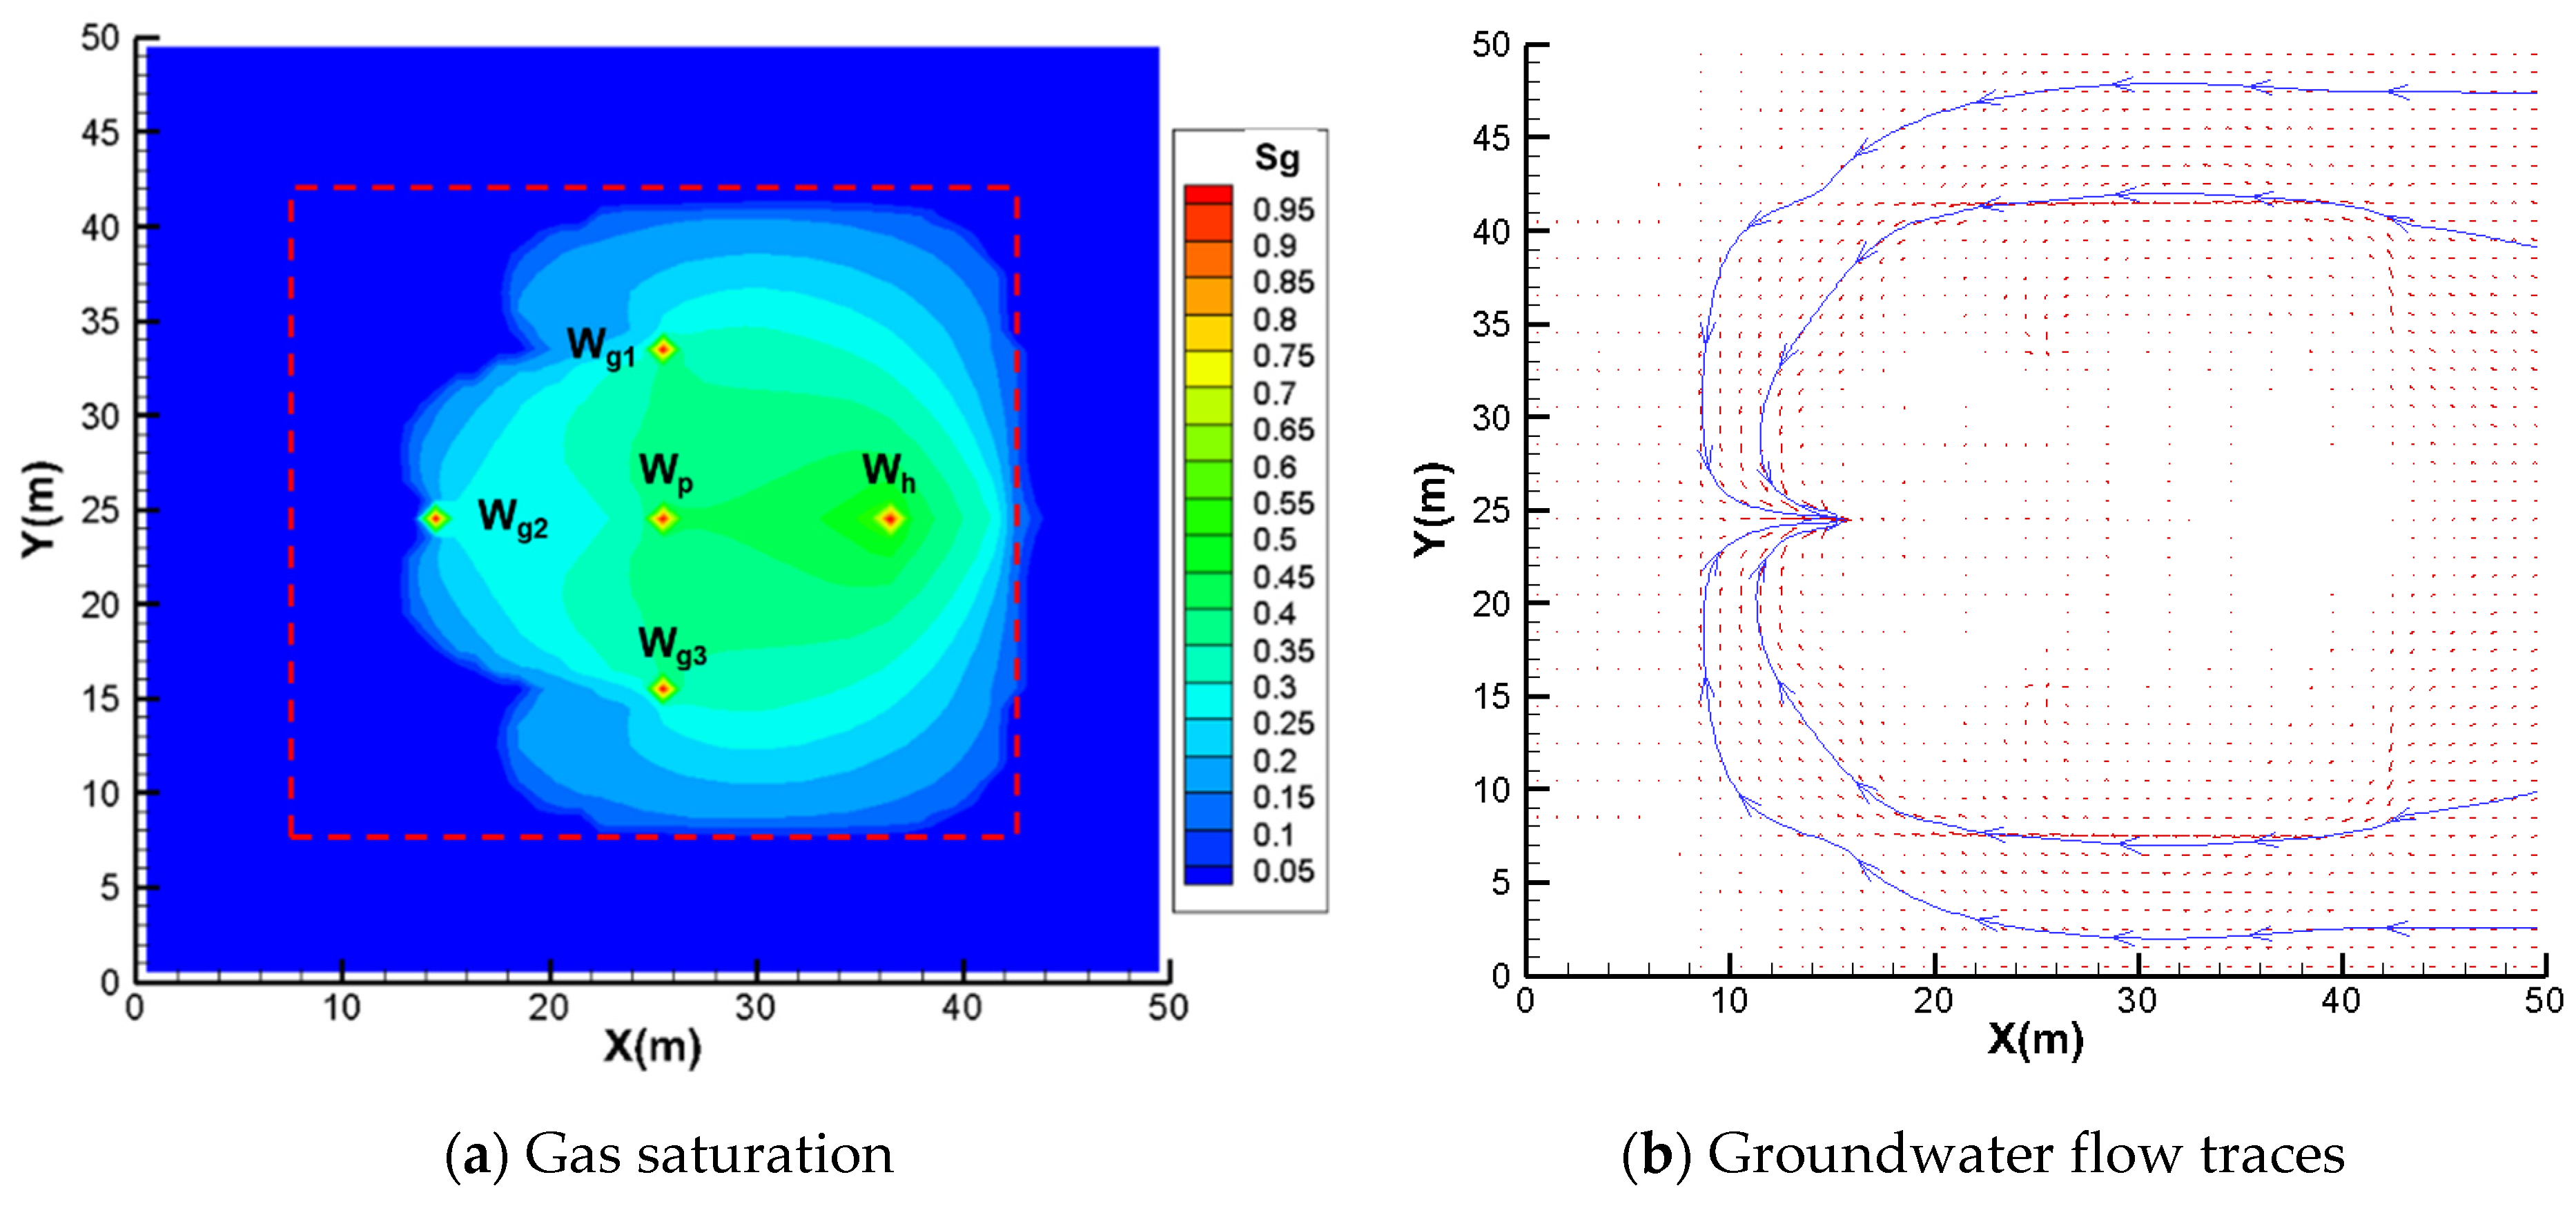
Figure 9.
Pressure nephograms when the gas flooding pressure is 5 and 3 MPa, respectively.
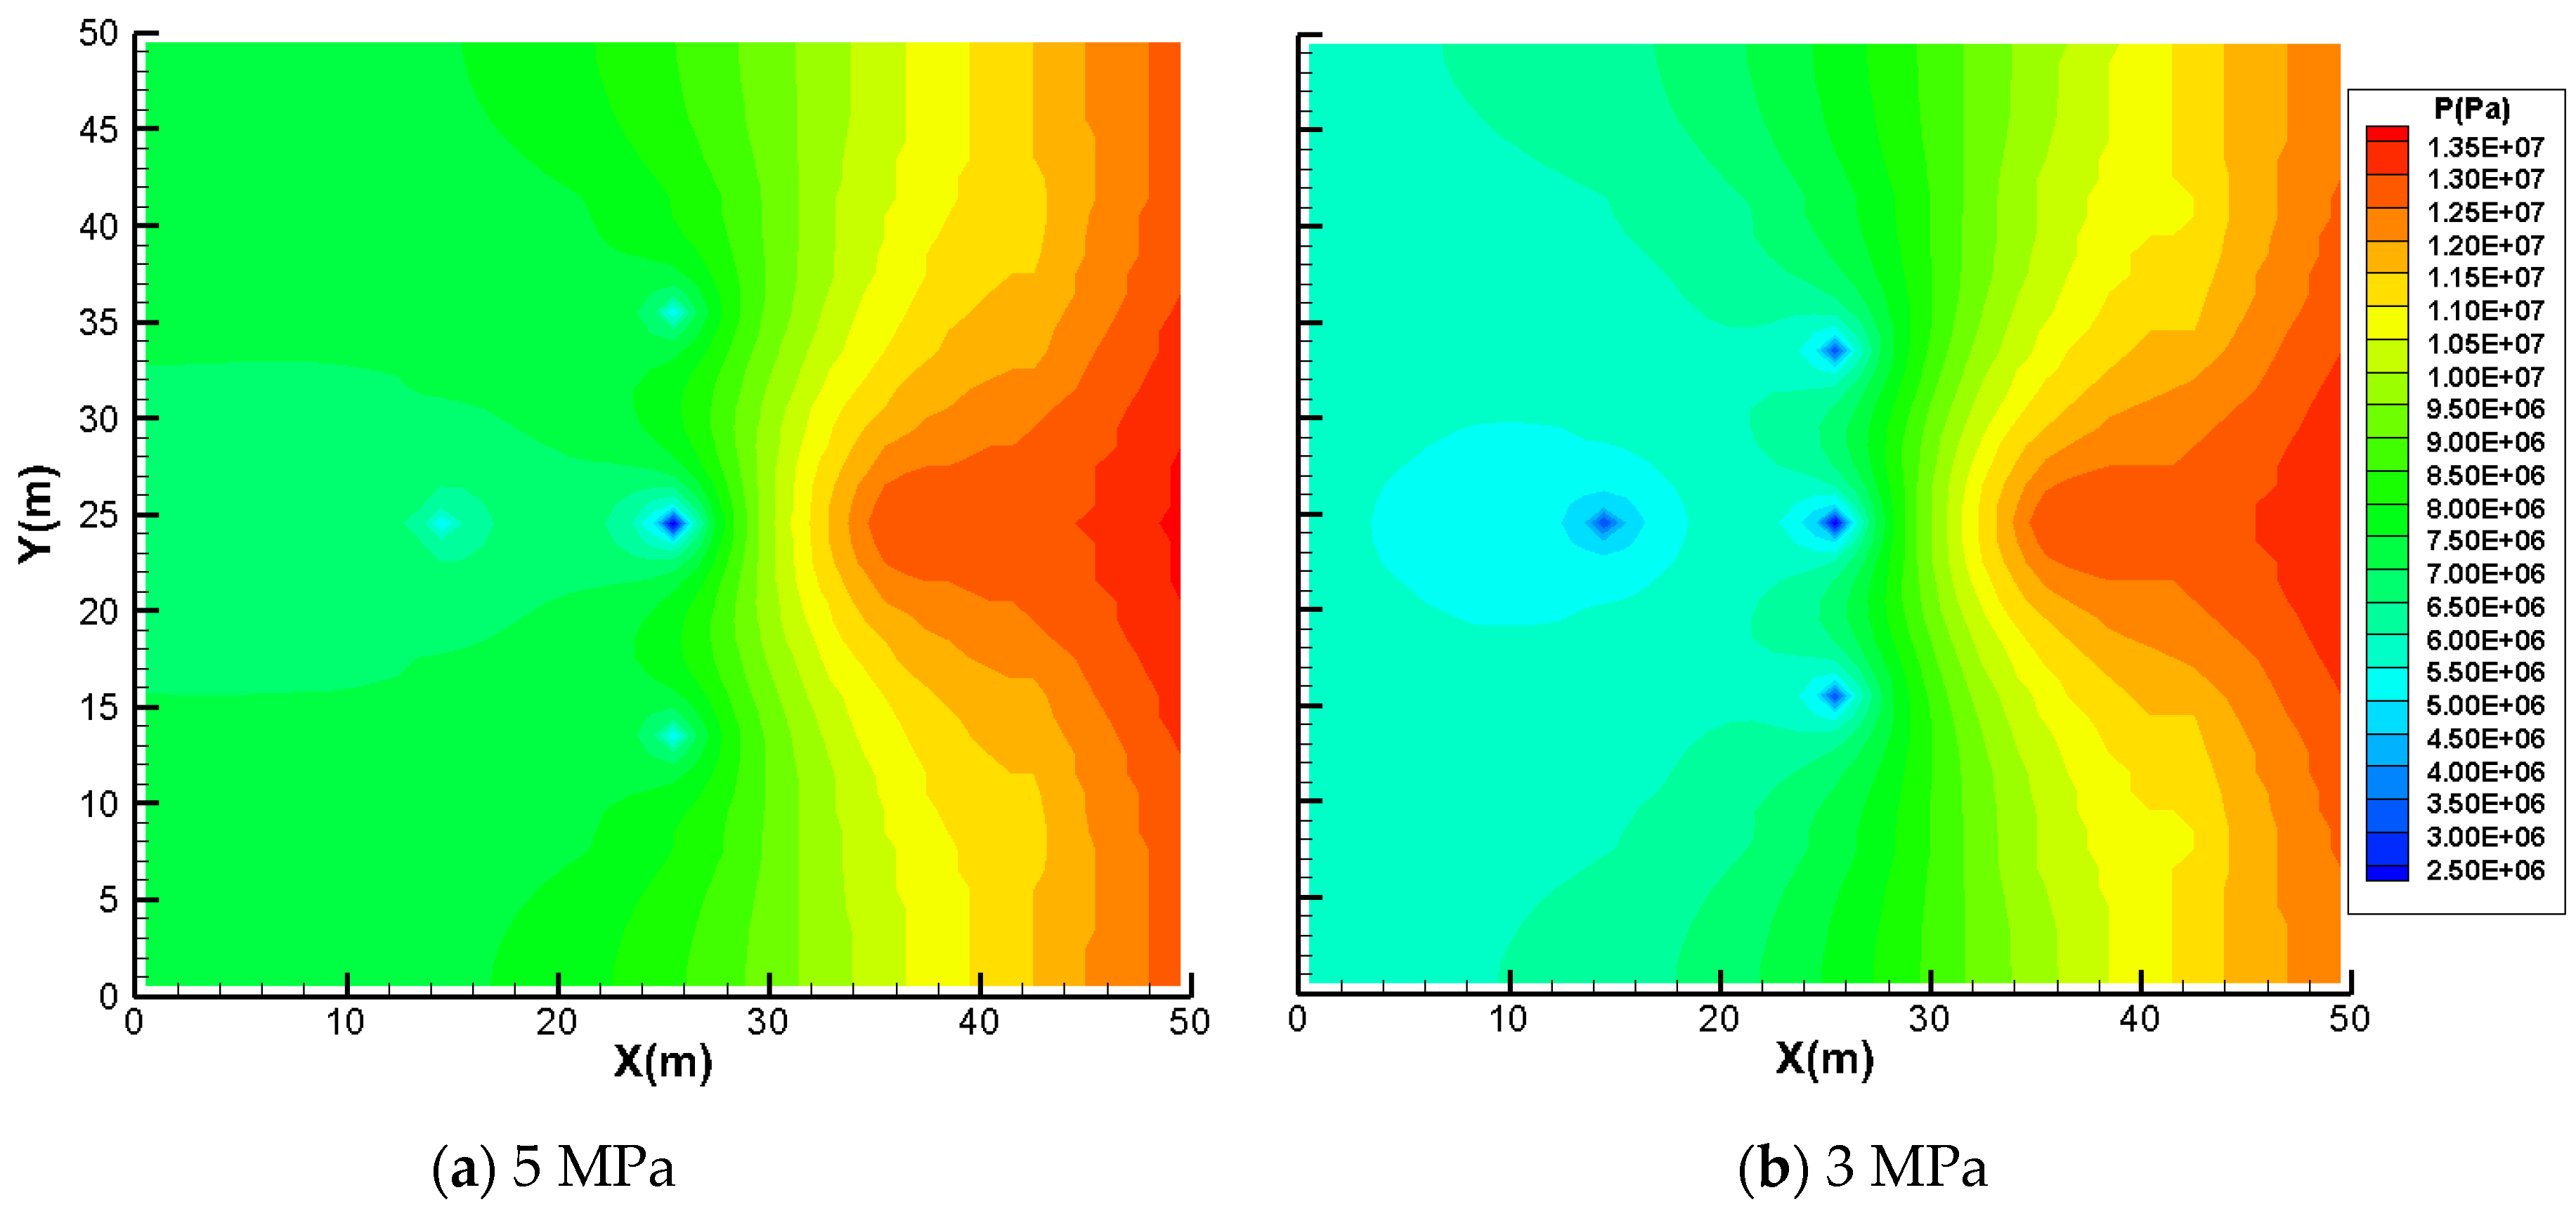
Figure 10.
Water yield of production well in the gas flooding pressure of 5 and 3 MPa.

Figure 11.
Gas velocity and gas production rates in the production well when the gas flooding pressure is 5 and 3 MPa, respectively.
Figure 11.
Gas velocity and gas production rates in the production well when the gas flooding pressure is 5 and 3 MPa, respectively.

Table 1.
Hydrogeological parameters of the model.
| Hydrogeological Parameters | Value |
|---|---|
| Permeability of hydraulic fracturing zone, k (m2) | 1 × 10⁻¹⁵ |
| Permeability of original rock, k (m2) | 1 × 10⁻¹⁶ |
| Porosity of hydraulic fracturing zone, φ | 0.15 |
| Porosity of original rock, φ | 0.08 |
| Density, ρ (kg/m3) | 1800 |
| Residual water saturation, Slr | 0.3 |
| Initial groundwater velocity, v (kg/s·m2) | 2.0 × 10⁻⁵ |
| van Genuchten λ | 0.457 |
| van Genuchten m (Pa−1) | 1.25 × 10⁻⁶ |
Publisher’s Note: MDPI stays neutral with regard to jurisdictional claims in published maps and institutional affiliations. |
© 2021 by the authors. Licensee MDPI, Basel, Switzerland. This article is an open access article distributed under the terms and conditions of the Creative Commons Attribution (CC BY) license (https://creativecommons.org/licenses/by/4.0/).
Share and Cite
MDPI and ACS Style
Yang, L.; Liu, Z.; Zeng, H.; Su, J.; Wang, Y.; Chen, X.; Guo, W. Influence of Gas Flooding Pressure on Groundwater Flow during Oil Shale In Situ Exploitation. Energies 2021, 14, 8363. https://doi.org/10.3390/en14248363
AMA Style
Yang L, Liu Z, Zeng H, Su J, Wang Y, Chen X, Guo W. Influence of Gas Flooding Pressure on Groundwater Flow during Oil Shale In Situ Exploitation. Energies. 2021; 14(24):8363. https://doi.org/10.3390/en14248363
Chicago/Turabian StyleYang, Lihong, Zhao Liu, Hao Zeng, Jianzheng Su, Yiwei Wang, Xudong Chen, and Wei Guo. 2021. "Influence of Gas Flooding Pressure on Groundwater Flow during Oil Shale In Situ Exploitation" Energies 14, no. 24: 8363. https://doi.org/10.3390/en14248363
Note that from the first issue of 2016, this journal uses article numbers instead of page numbers. See further details here.