
Development of a 1 kW Micro-Polygeneration System Fueled by Natural Gas for Single-Family Users


Department of Industrial Engineering, University of Naples Federico II, Via Claudio 21, 80125 Napoli, Italy
*
Author to whom correspondence should be addressed.
Energies 2021, 14(24), 8372; https://doi.org/10.3390/en14248372
Submission received: 31 October 2021
/
Revised: 6 December 2021
/
Accepted: 9 December 2021
/
Published: 12 December 2021
(This article belongs to the Special Issue Experimental Development, Thermodynamic/Thermo-Fluid Dynamic Analysis and Optimization of Cogeneration Systems and Polygeneration Plants)
Abstract
:The use of primary energy saving techniques and renewable energy systems has become mandatory to tackle the effects of global temperature rise. As a result, a transition is taking place from centralized energy generation to distributed energy generation. Starting from the experience concerning a 15 kW micro-CHP plant previously designed at DII, this paper addresses the development of a 1 kW micro-CHP system fueled by natural gas for single-family users. Specifically, the paper presents a wide experimental investigation aimed at optimizing performance and emissions of a small scale two-stroke spark ignition gasoline engine properly modified to be fueled with natural gas to make the engine more suitable for cogeneration purposes. The described activity was carried out at the DII of the University of Naples Federico II. Rigorous laboratory tests were conducted with the engine in order to characterize both gasoline and CNG operation in terms of brake mechanical power, overall efficiency and exhaust gas emissions in different operating regimes. Furthermore, several physical quantities associated with the engine operation were measured through several sensors in order to optimize performance and emissions achieved when the engine is fueled with CNG. In particular, dynamic pressure variations inside the cylinder were measured and analyzed to evaluate the effect of the adopted fuel on the optimum ignition-timing angle and cyclic dispersion.
1. Introduction
Anthropogenic carbon dioxide emissions are the most critical issue that must be faced to mitigate the global temperature rise [1]. Specific directives have been enacted to support the use of renewable energy systems and primary energy saving techniques [2]. The adopted energy policies promote the transition from centralized electricity generation to distributed energy generation mostly consisting of small and medium scale polygeneration plants [3,4,5,6,7]. These may also include users belonging to residential and commercial sectors [8,9]. Many research centers have been interested in the study of CHP plants [10,11,12,13]. Some studies addressed the development of calculation algorithms for the optimal configuration and operation of the plants [14,15,16,17,18,19,20]. In the 1990s, many experimental investigations concerning micro-CHP systems were carried out at the University of Naples Federico II [21,22]. Starting from that complex experimental activity, the objective of this research has been the development of a 1 kW micro-CHP system fueled by natural gas for single-family domestic users. To meet thermal and cooling demand from domestic users, a double water circuit configuration has been considered because of its ability to supply a small absorption chiller at the required temperature. The first water circuit (Low Temperature circuit in Figure 1) is thermally coupled to the engine cooling system, so a constant mass flow rate of water is used to ensure the proper thermal operation of the engine. The second circuit (High Temperature circuit in Figure 1) recovers heat from the exhaust gases, so that the mass flow rate of water can be properly adjusted to comply with a specific thermal demand of the user or a small absorption chiller. The novelty of the paper is the performance and emissions optimization of the small scale two-stroke spark ignition gasoline engine on which the 1 kW micro-CHP is based. Specifically, to this aim this engine has been opportunely modified to be fueled with natural gas to make it more suitable for cogeneration purposes and a preliminary comprehensive experimental investigation has been carried out.
In fact, two-stroke engines are particularly interesting for their simplified architecture, high power-to-displacement ratio and small size. However, two-stroke engines are usually too inefficient and polluting, since up to 30% of total active charge is regularly short-circuited into the exhaust port. This scavenging losses contain high levels of unburned gasoline and lubricating oil which is generally added to the fuel. Furthermore, although both governments and vehicle manufacturers are finding technical solutions applicable to two stroke gasoline engines [23,24], a large portion of the incompletely burned lubricant and heavier hydrocarbons are emitted as small oil droplets that increase visible smoke and particulate emissions. Four-stroke engines allow a significant reduction of hydrocarbon and particulate emissions, although emissions of nitrogen oxides are increased. In fact, since there are no scavenging losses in four-stroke engines, a much larger percentage of fuel is ignited into the combustion chamber, resulting in 10–20% greater thermal efficiency. To overcome the drawbacks of two-stroke engines, performance and emission improvement perspectives concerning the adoption of natural gas direct injection have been also estimated in this research work. The use of a low-carbon fuel such as natural gas could provide a substantial reduction of exhaust gas emissions, especially if combined to appropriate and innovative engine operating strategies, in the face of a limited impact on production costs. In this scenario, the adoption of a natural gas direct injection system could provide a clean technology that might also guarantee a low environmental impact to these types of engines.
2. Experimental Investigation
The experimental activity was conducted by coupling the engine object of investigation to a DC electric motor/generator dynamometer which equips the test bench (Figure 2).
The dynamometer was used to absorb and measure the output power of the engine in different operating regimes. The experimental apparatus includes several instantaneous and overall sensors (or transducers), data acquisition instrumentation and actuators to control the engine, as schematized in Figure 3 and explained in Table 1. Further details can be found in [25]. Pressure variations inside the crankcase, cylinder and exhaust pipe were measured by quartz piezoelectric transducers in a speed range from 4000 to 8500 rpm. Additional quantities like air mass flow rate, engine torque and speed, fuel flow rate, exhaust gas and wall temperatures were measured and collected in several sections along the exhaust system. Furthermore, emission species concentration in the exhaust gas such as carbon monoxide, carbon dioxide and unburned hydrocarbons, were also detected. As shown in Figure 3, the engine has been subject to specific modifications to allow Natural Gas operation, with NG injected upstream of the reed valve assembly.
2.1. Engine Specifications
The engine object of the experimental investigation is the Morini AH50L, which is a single-cylinder, two-stroke, spark-ignition gasoline engine usually adopted in the moped sector and equipped with a carburetor. The air–fuel mixture is inducted through an automatic reed-valve assembly into the crankcase, where it is compressed before passing through the intake ports located on the cylinder wall. The engine is air-cooled and both its weight and dimensions are quite contained. Additional technical specifications are listed in Table 2.
2.2. Fuel Properties
The experimental campaign was performed by fueling the engine with commercial unleaded gasoline and natural gas, whose chemical composition is shown in Table 3 [25], alternatively.
Methane is the primary chemical species, accounting for approximately 88% of the volume. Heavier gaseous hydrocarbons such as ethane, propane and butane also occur, while hydrocarbons heavier than C4H10 are present in very small concentrations. As methane is a stable molecule, RON lies between 120 and 130 while the LHV has been estimated to be 45.471 kJ/kg. Chemical and physical properties of the adopted natural gas are reported in Table 4, as obtained from laboratory tests, while the average properties of the commercial unleaded gasoline were considered for the adopted gasoline (Table 5).
2.3. Testing Conditions
The experimental tests were carried out at full load (WOT) of the engine over the speed range from 4000 to 8500 rpm [25]. Both gasoline and natural gas operation have been tested with a speed-step of 500 rpm. Natural gas has been injected within the intake pipe upstream from the crankcase with a slight over-pressure compared to the surrounding atmospheric pressure. Moreover, to reduce intake pressure, temperature and humidity fluctuations, natural gas operation has been performed immediately after gasoline operation. At each operating condition, acquisitions have been made at the end of the thermal transient, including that of the catalyst, to achieve stable conditions and detect more significant data. Gasoline tests have been performed under nearly stoichiometric operation (average equivalence ratio, = 0.92). As for natural gas tests, firstly they have been carried out at almost the same equivalence ratio provided by the standard carburetor during gasoline operation (i.e., nearly stoichiometric mixture conditions, = 0.95). Then, further experimental tests were performed adopting lean ( = 1.28) and extremely lean ( = 1.47) air–fuel mixtures. Figure 4 shows the experimental values adopted for the air–fuel equivalence ratio as a function of the engine speed. As known, λ highly affects the combustion process by changing the flame front propagation speed and so the heat release rate. The range of values adopted for the air–fuel equivalence ratios and related average values are summarized in Table 6.
3. Experimental Results
The experimental results show that natural gas operation causes a significant decrease in the brake power over the whole engine speed range (Figure 5). This power reduction further increases as leaner mixtures are used.
In particular, if the engine speed of 5500 rpm is considered as reference, as it is the operating condition for which the air index is closest and nearly coincident between gasoline and NG equal λ operation (Figure 4), and it also corresponds with the maximum thermal efficiency conditions both for gasoline and lean operation. The power decrease between gasoline and CNG operation at equal λ is about 16% (highlighted with a red line both in Figure 5 and in the second column of Table 7).
As shown in Table 7, this is mainly due to a decrease in air mass flow rate of about 4%, a decrease in Ki = Hi/αst of about 3% and a decrease in thermal efficiency of about 9%. As expected, under the same air–fuel equivalence ratio, the injection of a gaseous fuel like natural gas reduces the incoming air mass flow rate to the cylinder since its specific volume is higher than that of gasoline vapor. This reduction is mitigated in lean burn conditions, while a slight increase in air mass flow rate can be obtained under extremely lean burn operation (Figure 6).
As for the specific thermal content [kJ/kg air] () of the air–NG mixture, representing the thermal energy released by the fuel within a stoichiometric mixture when one kilogram of air is considered and a complete combustion is assumed, this is lower if compared to a stoichiometric air–gasoline mixture, contributing to a reduction in the output power estimated to be around 3%. Indeed, the power reduction is mainly due to the drop in thermal efficiency (Figure 7), which is mainly due to a longer combustion duration, especially when the highest value of the equivalence ratio is used (Figure 8). However, this phenomenon can be properly mitigated through the optimization of the spark ignition timing, through a proper calibration process [26,27], in order to take advantage of the intrinsic anti-knock characteristics of methane. As will be discussed in paragraph 4, this property may even allow the use of a higher engine compression ratio and related knock limited spark advance angles, which may lead to a recovery of the measured power reduction, also through an improvement of the thermal efficiency. Unfortunately, variations of the spark advance were not allowed for the tested engine.
If, instead, reference is made to the tested lower engine speed condition of 4000 rpm, which represents the engine operating condition for which the unburned hydrocarbon emission species concentration have been detected during the experimental activity (see Section 3.1), the power reduction between gasoline and CNG operation at equal λ is about 13%. Specifically, air mass flow rate, Ki = Hi/αst and thermal efficiency decrease about 3%, 3% and 9%, respectively.
3.1. Exhaust Emissions
Exhaust gases have been gathered upstream from the catalytic converter and sent to specific measurement devices. Carbon monoxide, carbon dioxide and unburned hydrocarbons concentrations were measured through Nondispersive Infrared (NDIR) and Flame Ionization Detector (FID) sensors while nitrogen oxides were measured using a Chemiluminescence Analyzer (CLA). In addition, the main chemical species of unburned hydrocarbons were detected using a mass-spectrograph at the engine speed of 4000 rpm. CO emissions are not too dependent on the fuel adopted, as they are more closely related to the equivalence ratio, as clearly shown in Figure 9. Therefore, the use of natural gas lean mixtures is highly beneficial. As for NOX emissions, the use of natural gas shows relevant improvements (Figure 10), especially in the case of very lean air–NG mixtures (i.e., the green line in Figure 10). These advantages are mainly due to a lower peak temperature and, consequently, to a cooler combustion within the cylinder. The NG operation also results in lower specific CO2 emissions, even though extremely lean operation is negatively affected by the fall in thermal efficiency, and hence in brake power, occurring at medium and high engine speed due to not-optimized spark ignition timing (Figure 11). NG operation significantly reduces reactive UHC concentrations measured as parts per million (Figure 12), especially when lean or extremely lean mixtures are used. However, again because of the decrease in output power occurring when the engine is fueled by NG, specific emissions of THC, expressed in terms of g/kWh, show a slight difference between gasoline and natural gas operation, while they even worsen in case of extremely lean operation (Figure 13).
It should be noted, indeed, that, if reference is made to THC measurements at 4000 rpm under CNG operation, UHC are composed by about 82.5% in mass of methane which cannot be strictly considered a pollutant gas. In fact, it is not harmful to the health, unlike more complex hydrocarbons from petrol compounds (Table 8). The high methane concentration in the exhaust gases is mainly due to the well-known problem of the short-circuiting of unburned air–fuel mixture. Moreover, conventional catalysts fail to oxidize methane. Conversely, THC measurements in gasoline engine operation at 4000 rpm highlight that about 84.5% in mass is constituted by highly pollutant heavy hydrocarbons, including benzene which is carcinogenic. As a result, the conversion to natural gas operation may lead to an 80% reduction in the emission of NMHC, which are strictly harmful to the health.
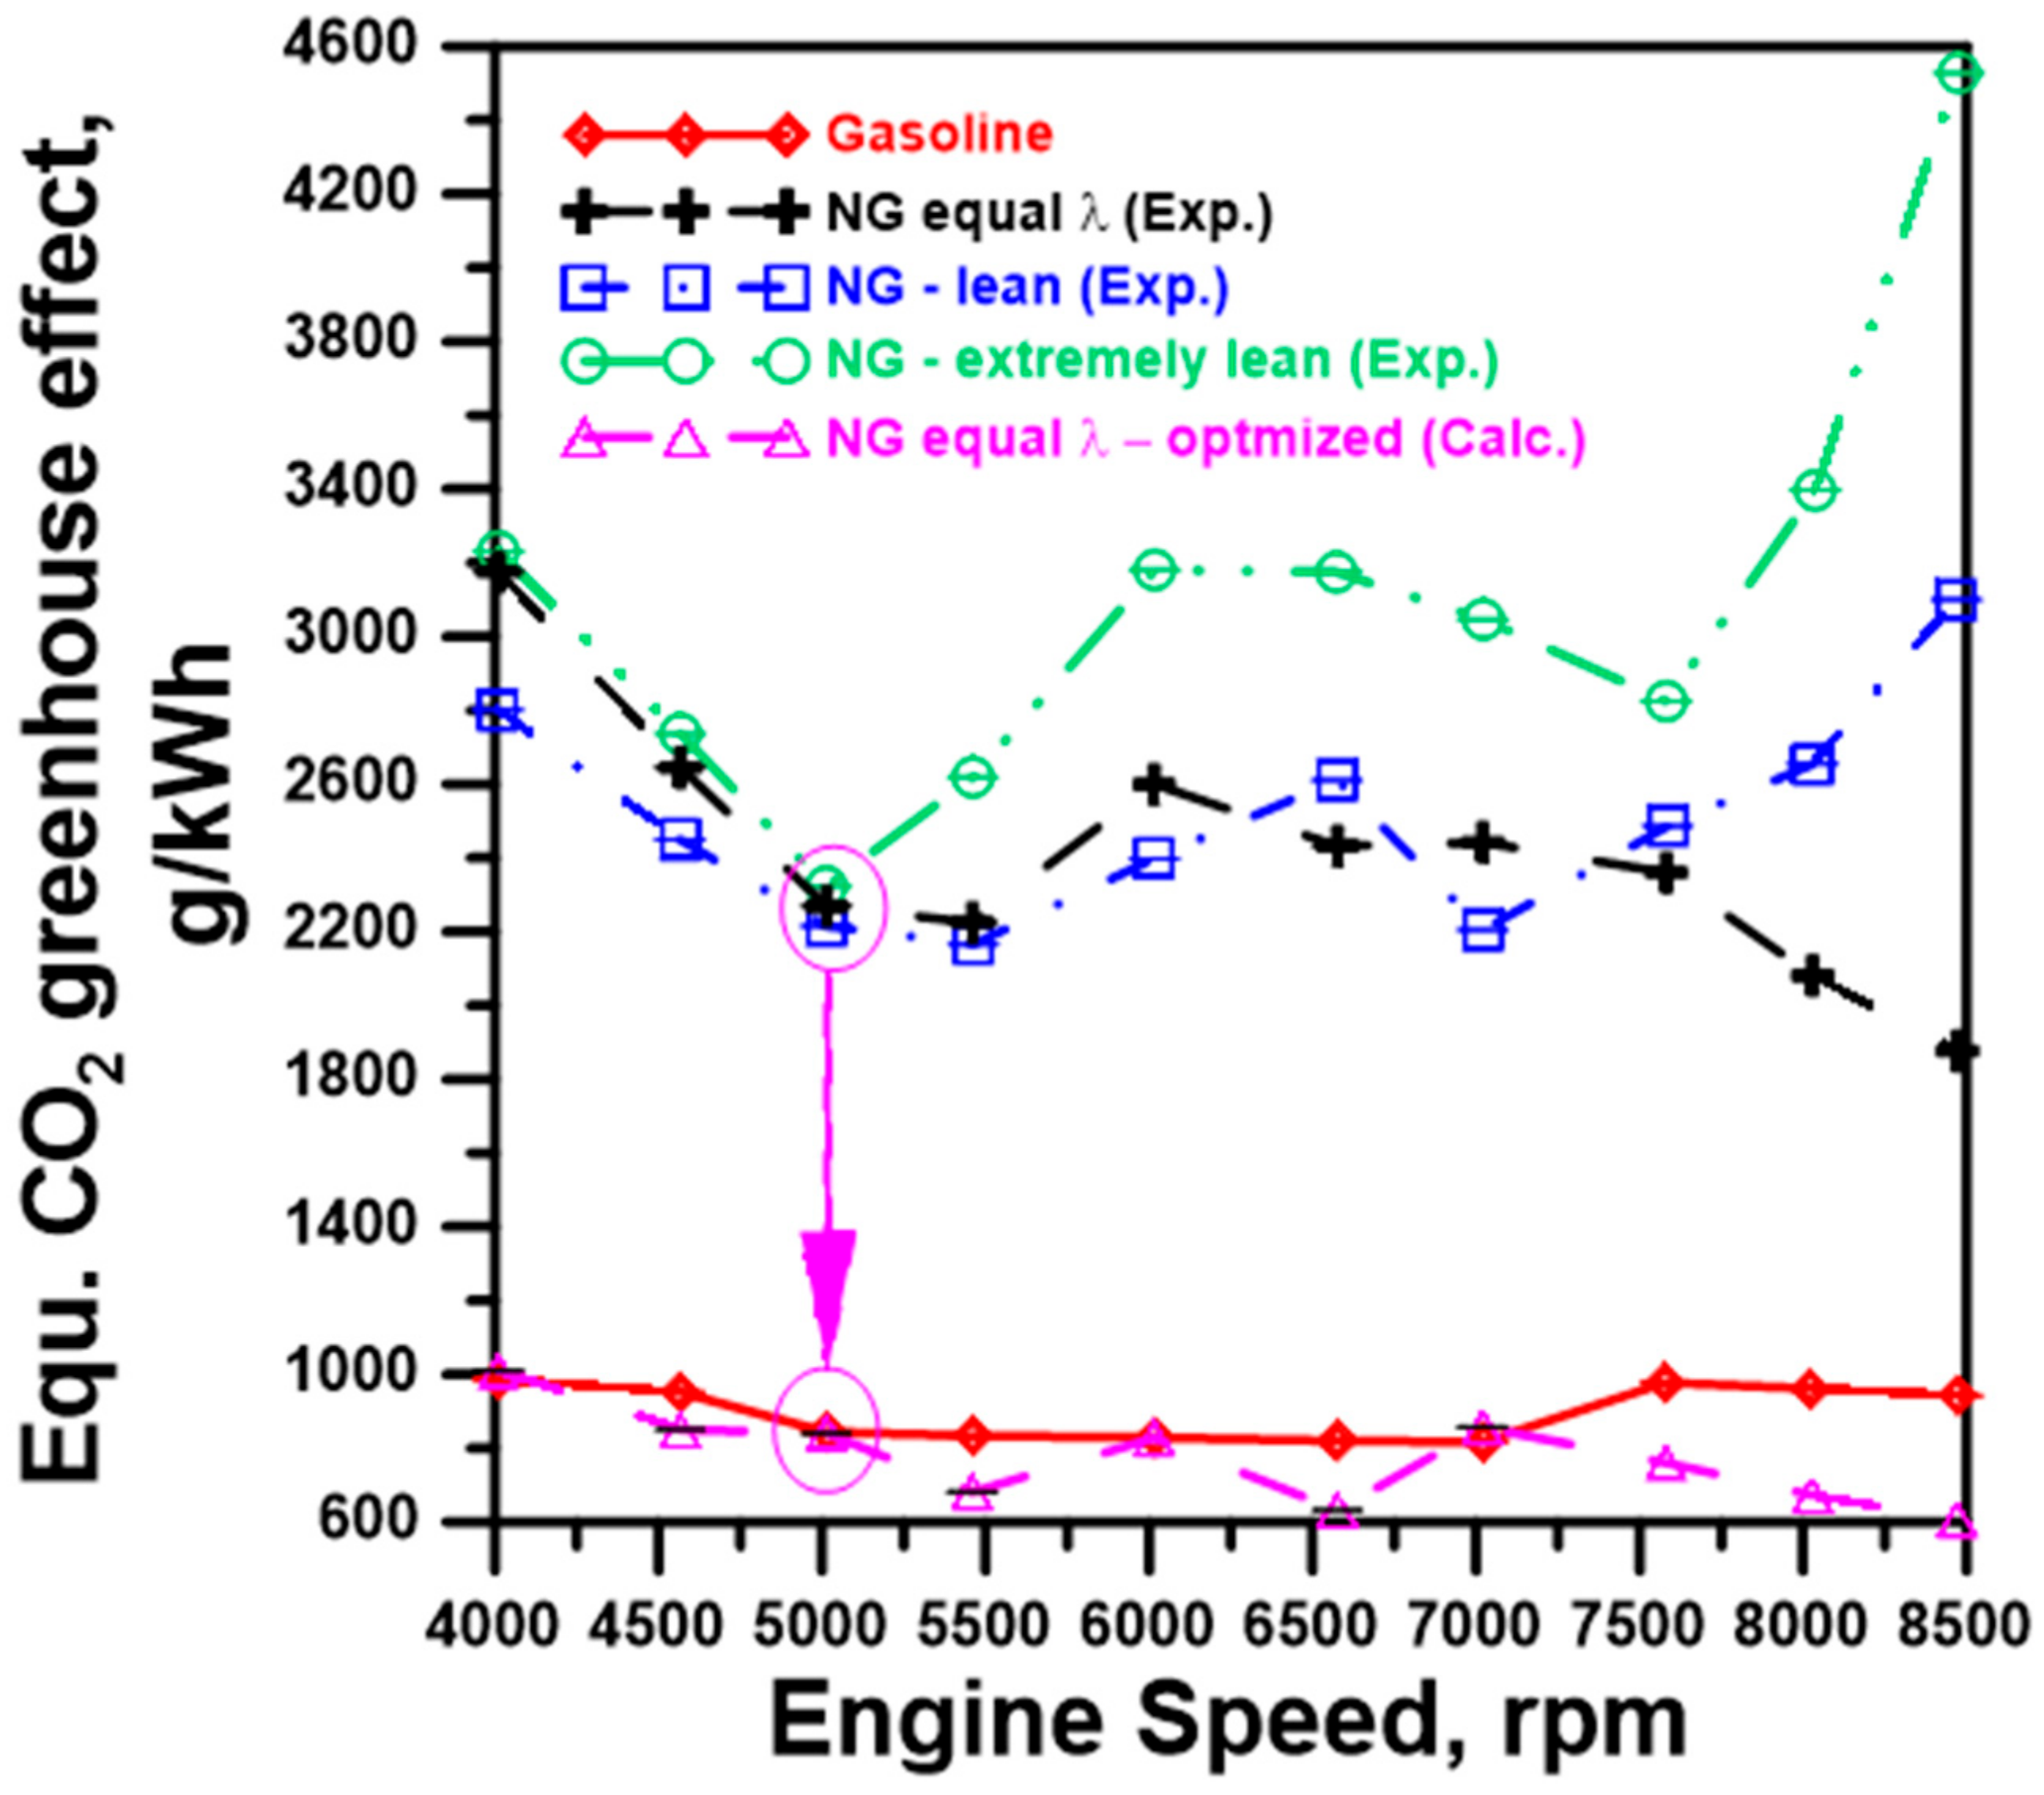
However, methane is a strong greenhouse gas, estimated to have a Global Warming Potential about 21 times higher than carbon dioxide [28]. Therefore, considering the greenhouse potential effect of methane in the exhaust gases, the result is subverted (Figure 14) if compared to that represented in Figure 11.
4. Optimized Configuration Potential of Two Stroke Engines
The determination of the potential achievable by an optimal CNG engine configuration has been performed through a 1D engine simulation software, including predictive combustion, turbulence and knock models developed at the DII of the University of Naples Federico II [29,30,31] and a commercial CFD tool for the full-3D multi-cycle analysis of the combustion process and knock-occurrence. This last activity was performed by the University of Modena [32,33].
The 1D flow model uses an advanced finite-volume Total Variation Diminishing numerical scheme to solve the one-dimensional continuity, momentum and energy equations, which characterize the wave propagation phenomena which affect the volumetric efficiency of the engine. The flow equations are expressed in the conservative form along each pipe as follows:
where the terms , , p, , and represent density, velocity, pressure, total internal energy and total enthalpy per unit mass, respectively. The flow model also includes two equations describing the scalar transport of chemical species, i.e., the fuel and residual mass fractions, and , which allow a correct estimation of the gas composition inside the cylinder. The source term S takes into account the influence of the ducts’ area variation (), the friction (f), and the fluid–wall heat exchange (q). As for the combustion model, a quasi-dimensional model based on a fractal schematization of the flame front has been used. Further details and a deep discussion of the 1D model adopted can be found in [29].
A 3D thermo-fluid dynamic simulation of the engine was performed in order to properly characterize the development of the combustion process under CNG operation at the fixed running speed of 5000 rpm by assuming a compression ratio (CR) equal to 14 and a spark advance (SA) of 30.5 CAD BFTDC respectively. These represent the combination of knock–limited values of those two engine parameters at 5000 rpm identified in [32,33], where the reason for selecting the specific engine operation at 5000 rpm is also discussed. Engine performance has been evaluated by means of the calculation of brake power, overall efficiency, gross IMEP and related gross BSFC (Figure 15). The following results (Figure 16, Figure 17, Figure 18, Figure 19, Figure 20 and Figure 21) refer to WOT operation and the same equivalence ratio for both gasoline and CNG operation.
For a fixed NG to gasoline air-index ratio of one, identified by the black circle in Figure 16, the brake power and the brake efficiency of the optimized CNG engine increase by approximately 30% and 93%, respectively, compared to the experimental results previously obtained for the base gasoline configuration. This optimal result is accompanied by a BSFC reduction accounting for 50%.
The increased output power leads to a similar specific emission reduction because the exhaust gas mass flow rate per unit of energy (expressed in g/kWh) is lower.
As a result, carbon monoxide (CO), carbon dioxide (CO2) and reactive hydrocarbons (HC) emissions are approximately 33% lower under CNG optimized operation than under standard CNG operation, while the global greenhouse effect due to methane and carbon dioxide emissions doubled compared to gasoline operation.
5. Conclusions
The paper presents a wide experimental and numerical investigation aimed at optimizing performance and emissions of a small scale two-stroke spark ignition gasoline engine properly modified to be fueled with natural gas to make the engine more suitable for cogeneration or polygeneration purposes. The results show great potential to improve engine performance and emissions. In particular, it is possible to at least recover or even improve the CNG engine operation performance if compared to gasoline operation by increasing both the engine compression ratio (CR) and the spark advance (SA). This solution may also involve an improvement in specific pollutant emissions that become lower as power increases. More specifically, results show how, for a fixed NG to gasoline air-index ratio of one, brake power and brake efficiency of the optimized CNG engine operation increase by approximately 30% and 93%, respectively, if compared to the experimental results previously obtained for the base gasoline configuration. Moreover, a BSFC reduction accounting for 50% can be achieved. The increased output power leads to a similar specific emission reduction, with carbon monoxide (CO), carbon dioxide (CO2) and reactive hydrocarbons (HC) emissions that can be approximately 33% lower under CNG optimized configuration if compared to the base CNG operation. Conversely, global greenhouse effect due to methane and carbon dioxide emissions is expected to double if compared to gasoline operation.
Author Contributions
Conceptualization, A.G. and M.M.; methodology, A.G. and M.M.; software, A.G. and M.M.; validation, A.G. and M.M.; formal analysis, A.G. and M.M.; investigation, A.G. and M.M.; resources, A.G. and M.M.; data curation, A.G. and M.M.; writing—original draft preparation, A.G. and M.M.; writing—review and editing, A.G. and M.M.; visualization, A.G. and M.M.; supervision, A.G. and M.M.; project administration, A.G. and M.M.; no funding acquired. All authors have read and agreed to the published version of the manuscript.
Funding
This research received no external funding.
Institutional Review Board Statement
Not applicable.
Informed Consent Statement
Not applicable.
Data Availability Statement
Not applicable.
Conflicts of Interest
The authors declare no conflict of interest.
Abbreviations
| 1D | One Dimensional |
| 3D | Three Dimensional |
| BBDC | Before Bottom Dead Center |
| BSFC | Brake Specific Fuel Consumption |
| B(F)TDC | Before (Firing) Top Dead Center |
| CAD | Crank Angle Degree |
| CFD | Computational Fluid Dynamics |
| CLA | Chemi-Luminescence Analyzer |
| CNG | Compressed Natural Gas |
| CR | Compression Ratio |
| DAQ | Data Acquisition |
| DAS | Data Acquisition System |
| DC | Direct Current |
| DI | Direct injection |
| DIS | Direct Injection System |
| DII | Department of Industrial Engineering of the University of Naples Federico II |
| EU | European Union |
| FID | Flame Ionization Detector |
| HC | Hydrocarbons |
| IMEP | Indicated Mean Effective Pressure |
| LHV | Lower Heating Value |
| NDIR | Non-Dispersive Infra-Red Detector |
| NG | Natural Gas |
| NMHC | Non Methanic Hydrocarbons |
| RC | Compression Ratio |
| R&D | Research and Development |
| RICE | Reciprocating Internal Combustion Engine |
| RON | Research Octane Number |
| SA | Spark Advance |
| SA0 | Reference Spark Advance |
| SI | Spark Ignition |
| THC | Total Hydrocarbons |
| UHC | Unburned Hydrocarbons |
| VOC | Volatile Organic Compounds |
| WOT | Wide Open Throttle |
Glossary
| Latin | Greek | ||
| Pb | Brake Power | αst | Stoichiometric Air-Fuel Ratio |
| Hi | Lower Heating Value | λ | Air-fuel equivalence ratio |
| Ki | Specific Thermal Content | ω | Angular Velocity |
| LS | Laminar Flame Speed | τ | Brake Torque |
| ṁa | Air Mass Flow Rate | ||
| ṁf | Fuel Mass Flow Rate | ||
| N | Rotational Speed | ||
| N0 | Reference engine speed | ||
| rpm | Revolutions Per Minute | ||
References
- Intergovernmental Panel on Climate Change. Global Warming of 1.5 °C. Available online: http://www.ipcc.ch (accessed on 20 July 2021).
- Directive 2012/27/EU of the European Parliament and of the Council on Energy Efficiency, Amending Directives 2009/125/EC and 2010/30/EU and Repealing Directives 2004/8/EC and 2006/32/EC. Available online: https://eur-lex.europa.eu/legal-content/EN/TXT/?uri=CELEX:32012L0027 (accessed on 20 July 2021).
- Pfeifer, A.; Dobravec, V.; Pavlinek, L.; Krajačić, G.; Duić, N. Integration of renewable energy and demand response technologies in interconnected energy systems. Energy 2018, 161, 447–455. [Google Scholar] [CrossRef]
- Gimelli, A.; Muccillo, M. The Key Role of the Vector Optimization Algorithm and Robust Design Approach for the Design of Polygeneration Systems. Energies 2018, 11, 821. [Google Scholar] [CrossRef] [Green Version]
- Calise, F.; Figaj, R.D.; Massarotti, N.; Mauro, A.; Vanoli, L. Polygeneration system based on PEMFC, CPVT and electrolyzer: Dynamic simulation and energetic and economic analysis. Appl. Energy 2017, 192, 530–542. [Google Scholar] [CrossRef]
- El-Emam, R.S.; Dincer, I. Assessment and Evolutionary Based Multi-Objective Optimization of a Novel Renewable-Based Polygeneration Energy System. ASME J. Energy Resour. Technol. 2016, 139. [Google Scholar] [CrossRef]
- Calise, F.; Cappiello, F.L.; Dentice d’Accadia, M.; Libertini, L.; Vicidomini, M. Dynamic Simulation and Thermoeconomic Analysis of a Trigeneration System in a Hospital Application. Energies 2020, 13, 3558. [Google Scholar] [CrossRef]
- D’Accadia, M.D.; Sasso, M.; Sibilio, S.; Vanoli, L. Micro-combined heat and power in residential and light commercial applications. Appl. Therm. Eng. 2003, 23, 1247–1259. [Google Scholar] [CrossRef]
- Valenti, G.; Bischi, A.; Campanari, S.; Silva, P.; Ravidà, A.; Macchi, E. Experimental and Numerical Study of a Microcogeneration Stirling Unit under On–Off Cycling Operation. Energies 2021, 14, 801. [Google Scholar] [CrossRef]
- Katsaros, G.; Nguyen, T.-V.; Rokni, M. Tri-generation System based on Municipal Waste Gasification, Fuel Cell and an Absorption Chiller. J. Sustain. Dev. Energy Water Environ. Syst. 2018, 6, 13–32. [Google Scholar] [CrossRef]
- Xie, D.; Lu, Y.; Sun, J.; Gu, C.; Yu, J. Optimal Operation of Network-Connected Combined Heat and Powers for Customer Profit Maximization. Energies 2016, 9, 442. [Google Scholar] [CrossRef] [Green Version]
- Markovska, N.; Duic, N.; Vad Mathiesen, B.; Guzovic, Z.; Piacentino, A.; Schlor, H.; Lund, H. Addressing the main challenges of energy security in the twenty-first century—Contributions of the conferences on Sustainable Development of Energy, Water and Environment Systems. Energy 2016, 115, 1504–1512. [Google Scholar] [CrossRef]
- Gimelli, A.; Mottola, F.; Muccillo, M.; Proto, D.; Amoresano, A.; Andreotti, A.; Langella, G. Optimal configuration of modular cogeneration plants integrated by a battery energy storage system providing peak shaving service. Appl. Energy 2019, 242, 974–993. [Google Scholar] [CrossRef]
- Calise, F.; di Vastogirardi, G.D.N.; d’Accadia, M.D.; Vicidomini, M. Simulation of polygeneration systems. Energy 2018, 163, 290–337. [Google Scholar] [CrossRef]
- Ren, H.; Zhou, W.; Nakagami, K.I.; Gao, W.; Wu, Q. Multi-objective optimization for the operation of distributed energy systems considering economic and environmental aspects. Appl. Energy 2010, 87, 3642–3651. [Google Scholar] [CrossRef]
- Gimelli, A.; Muccillo, M.; Sannino, R. Optimal design of modular cogeneration plants for hospital facilities and robustness evaluation of the results. Energy Convers. Manag. 2017, 134, 20–31. [Google Scholar] [CrossRef]
- Gimelli, A.; Luongo, A.; Muccillo, M. Efficiency and cost optimization of a regenerative Organic Rankine Cycle power plant through the multi-objective approach. Appl. Therm. Eng. 2017, 114, 601–610. [Google Scholar] [CrossRef]
- Carvalho, M.; Lozano, M.A.; Serra, L.M. Multicriteria synthesis of trigeneration systems considering economic and environmental aspects. Appl. Energy 2012, 91, 245–254. [Google Scholar] [CrossRef]
- Eppinger, B.; Muradi, M.; Scharrer, D.; Zigan, L.; Bazan, P.; German, R.; Will, S. Simulation of the Part Load Behavior of Combined Heat Pump-Organic Rankine Cycle Systems. Energies 2021, 14, 3870. [Google Scholar] [CrossRef]
- Wang, J.; Liu, W.; Liu, G.; Sun, W.; Li, G.; Qiu, B. Theoretical Design and Analysis of the Waste Heat Recovery System of Turbine Exhaust Steam Using an Absorption Heat Pump for Heating Supply. Energies 2020, 13, 6256. [Google Scholar] [CrossRef]
- Muccillo, M.; Gimelli, A. Experimental Development, 1D CFD Simulation and Energetic Analysis of a 15 kW Micro-CHP Unit based on Reciprocating Internal Combustion Engine. Appl. Therm. Eng. 2014, 71, 760–770. [Google Scholar] [CrossRef]
- Cirillo, N.C.; Cozzolino, R. Micro-cogeneration with LPG fuelled S.I. engines: New ways for emissions control. In Proceedings of the 1998 Fall Technical Conference of the ASME Internal Combustion Engine Division, Part 1 (of 3), Clymer, NY, USA, 27–30 September 1998; pp. 63–69. [Google Scholar]
- Kojima, M.; Brandon, C.; Shah, J. Improving Urban Air Quality in South Asia by Reducing Emissions from Two-Stroke Engine Vehicles; The International Bank for Reconstruction and Development/The World Bank: Washington, DC, USA, 2000. [Google Scholar]
- Muslim, M.T.; Selamat, H.; Alimin, A.J.; Rohi, N.M.; Hushim, M.F. A retrofit fuel injection technology for small carburetted motorcycle engines towards lower fuel consumption and clearer exhaust emissions. Renew. Sustain. Energy Rev. 2014, 35, 279–284. [Google Scholar] [CrossRef] [Green Version]
- Gimelli, A.; Cascone, C.; Pennacchia, O.; Unich, A.; Capaldi, P. Performance and Emissions of a Natural Gas Fueled Two-Stroke SI Engine; SAE Paper Number 2008-01-0318, SAE 2008 World Congress & Exhibition; SAE: Warrendale, PA, USA, 2008. [Google Scholar] [CrossRef]
- De Nola, F.; Giardiello, G.; Gimelli, A.; Molteni, A.; Muccillo, M.; Picariello, R. A Model-Based Computer Aided Calibration Methodology Enhancing Accuracy, Time and Experimental Effort Savings through Regression Techniques and Neural Networks; SAE Technical Paper # 2017-24-0054; SAE: Warrendale, PA, USA. [CrossRef] [Green Version]
- De Nola, F.; Giardiello, G.; Gimelli, A.; Molteni, A.; Muccillo, M.; Picariello, R. Volumetric efficiency estimation based on neural networks to reduce the experimental effort in engine base calibration. Fuel 2019, 244, 31–39. [Google Scholar] [CrossRef]
- Forster, P.; Ramaswamy, V.; Artaxo, P.; Berntsen, T.; Betts, R.; Fahey, D.W.; Haywood, J.; Lean, J.; Lowe, D.C.; Myhre, G.; et al. Changes in Atmospheric Constituents and in Radiative Forcing. In Climate Change 2007: The Physical Science Basis; Solomon, S., Qin, M.D., Manning, Z., Chen, M., Marquis, K.B., Averyt, M.T., Miller, H.L., Eds.; Contribution of Working Group I to the Fourth Assessment Report of the Intergovernmental Panel on Climate Change; Cambridge University Press: Cambridge, UK; New York, NY, USA, 2017. [Google Scholar]
- Bozza, F.; Gimelli, A. A Comprehensive 1D Model for the Simulation of a Small-Size Two-Stroke SI Engine. SAE Trans. 2004, 758–770. [Google Scholar] [CrossRef]
- Gimelli, A.; Muccillo, M.; Pennacchia, O. Study of a New Mechanical VVA System. Part I: Valve Train Design and Friction Modeling. Int. J. Engine Res. 2015, 16, 750–761. [Google Scholar] [CrossRef]
- Gimelli, A.; Muccillo, M.; Pennacchia, O. Study of a New Mechanical VVA System. Part II: Estimation of the Actual Fuel Consumption Improvement through 1D Fluid Dynamic Analysis and Valve Train Friction Estimation. Int. J. Engine Res. 2015, 16, 762–772. [Google Scholar] [CrossRef]
- Bozza, F.; Fontanesi, S.; Gimelli, A.; Severi, E.; Siano, D. Numerical and Experimental Investigation of Fuel Effects on Knock Occurrence and Combustion Noise in a 2-Stroke Engine. SAE Int. J. Fuels Lubr. 2012, 5, 674–695. [Google Scholar] [CrossRef]
- Fontanesi, S.; Severi, E.; Bozza, F.; Gimelli, A. Investigation of Scavenging, Combustion and Knock in a Two-Stroke SI Engine Operated with Gasoline and CNG. Int. J. Automot. Eng. 2012, 3, 97–105. [Google Scholar] [CrossRef] [Green Version]
Figure 1.
Schematic representation of the configuration adopted for the 1kW micro-CHP system.

Figure 2.
Experimental test bench.

Figure 3.
Scheme of the experimental test bench (legend in Table 1).
Figure 3.
Scheme of the experimental test bench (legend in Table 1).
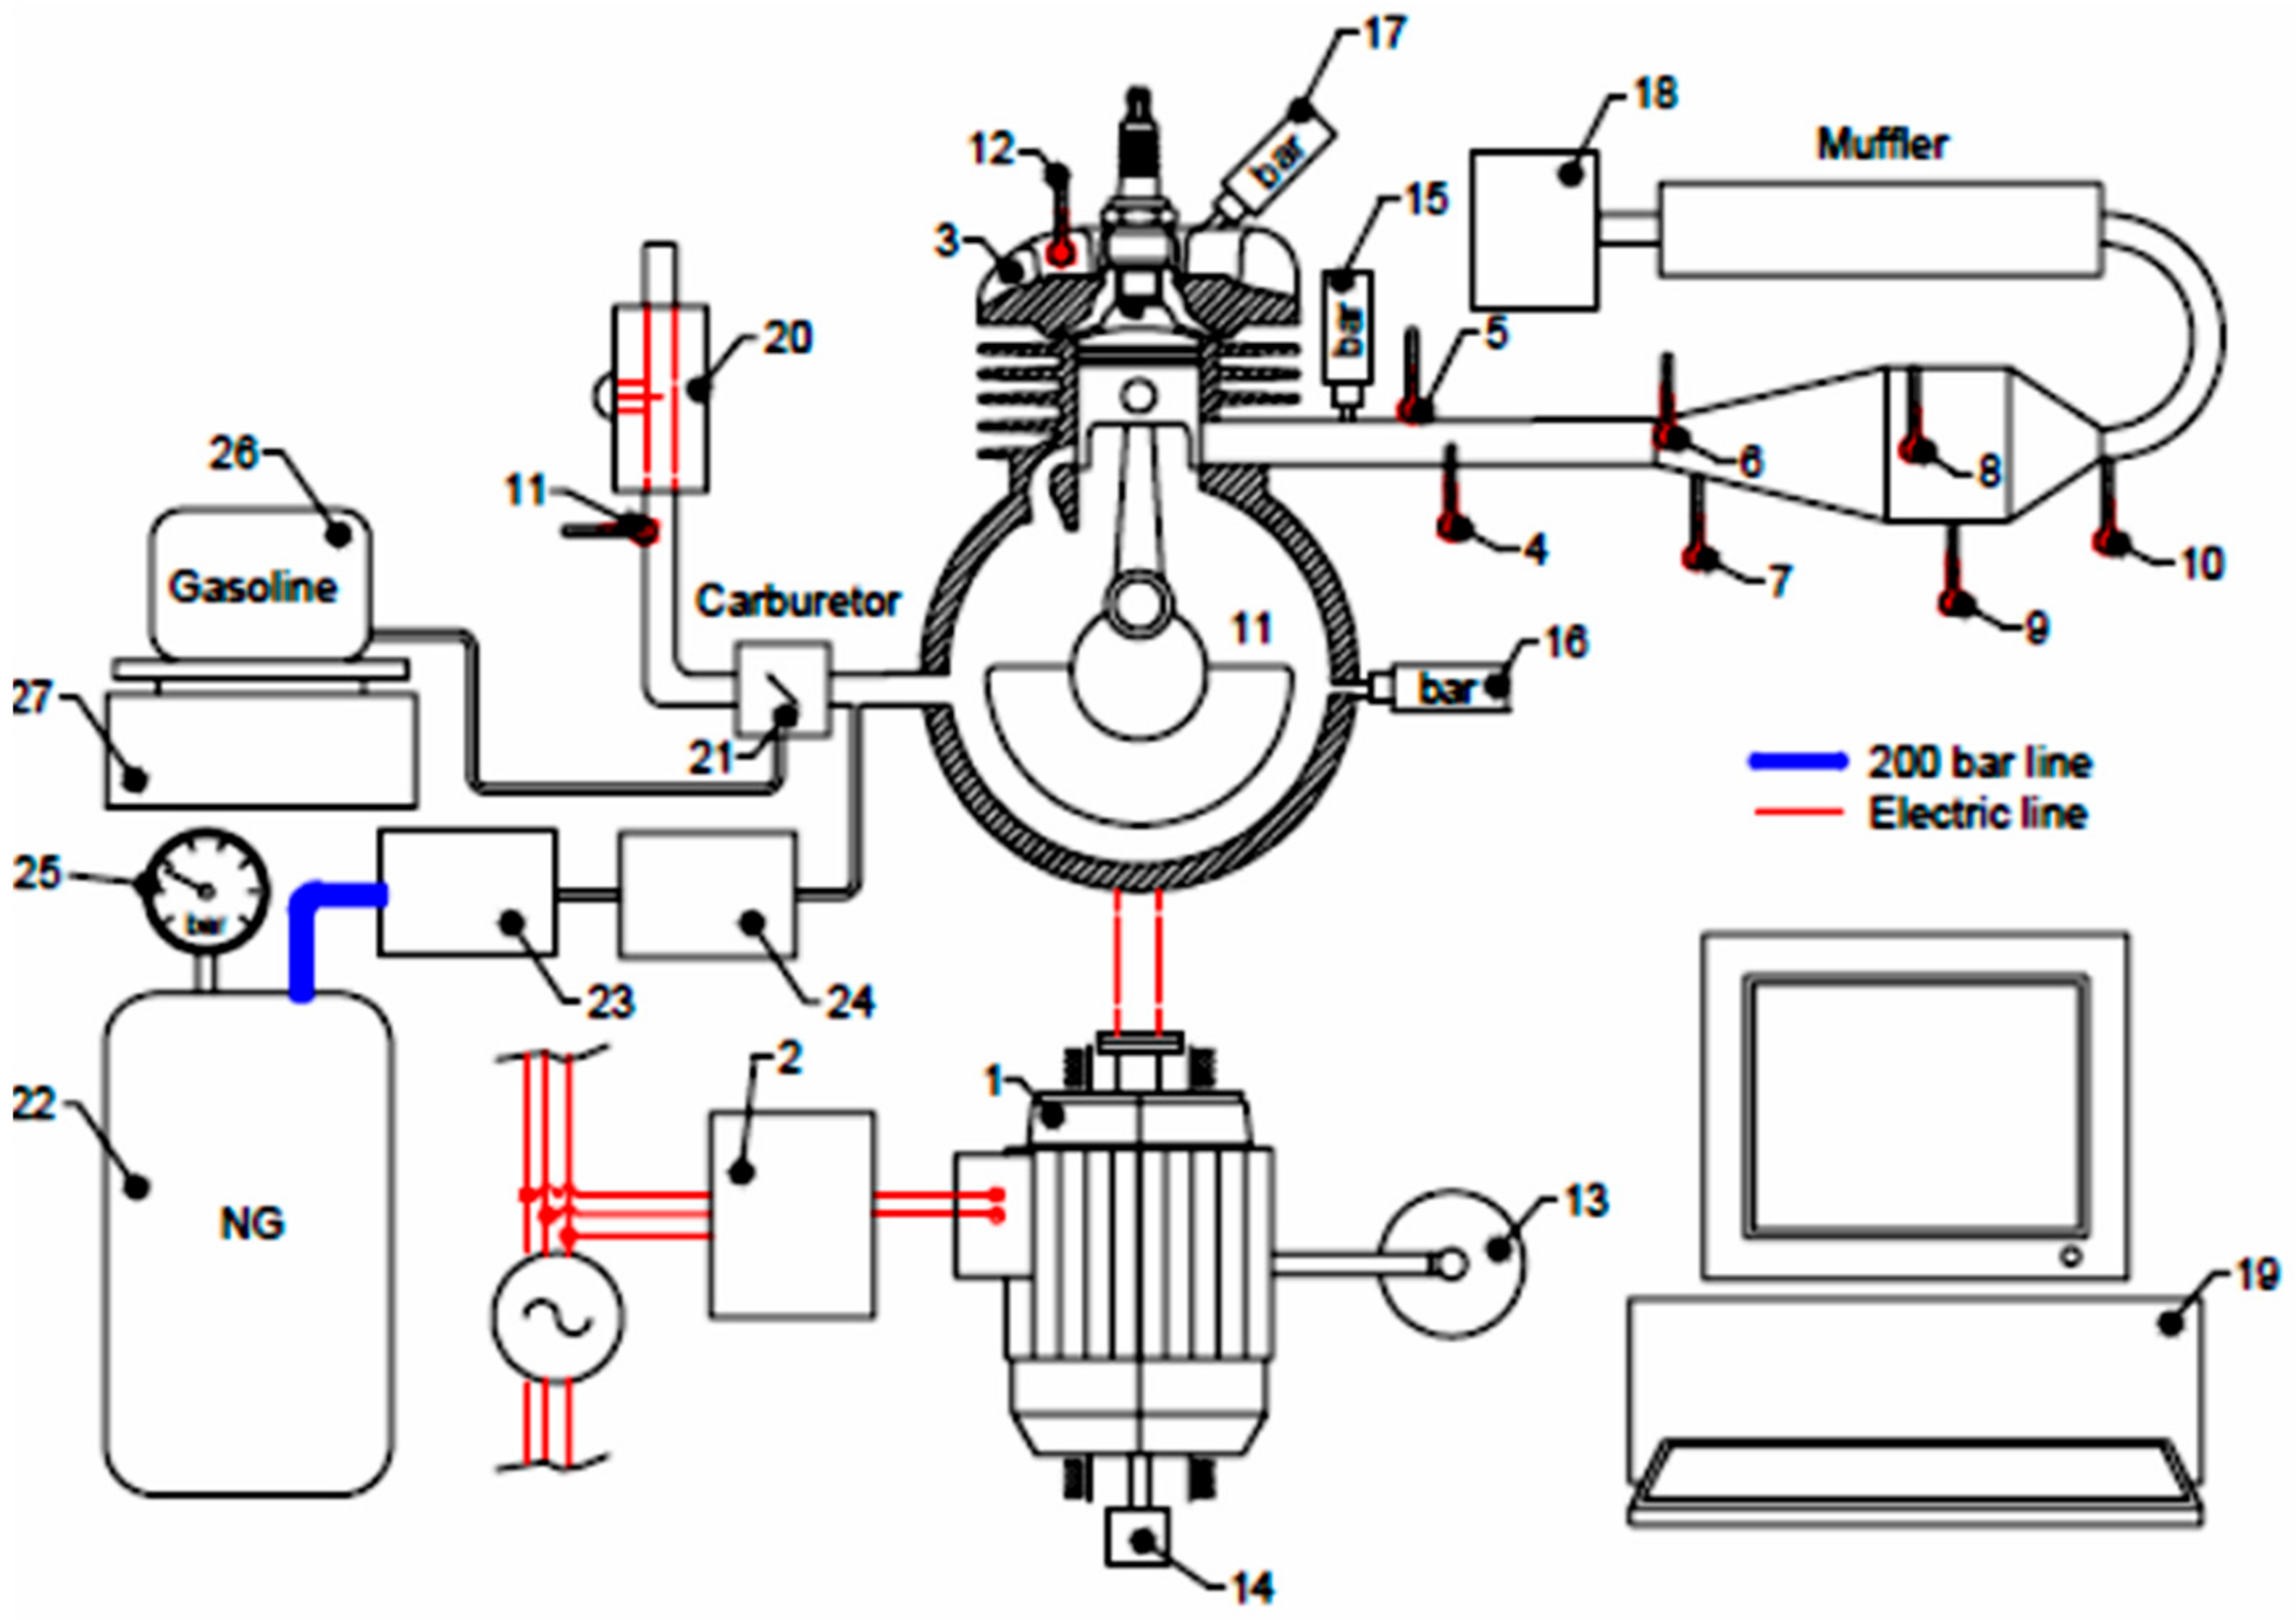
Figure 4.
Experimental values adopted for the air–fuel equivalence ratio over the investigated engine speed range.
Figure 4.
Experimental values adopted for the air–fuel equivalence ratio over the investigated engine speed range.

Figure 5.
Measured values of the engine brake power.
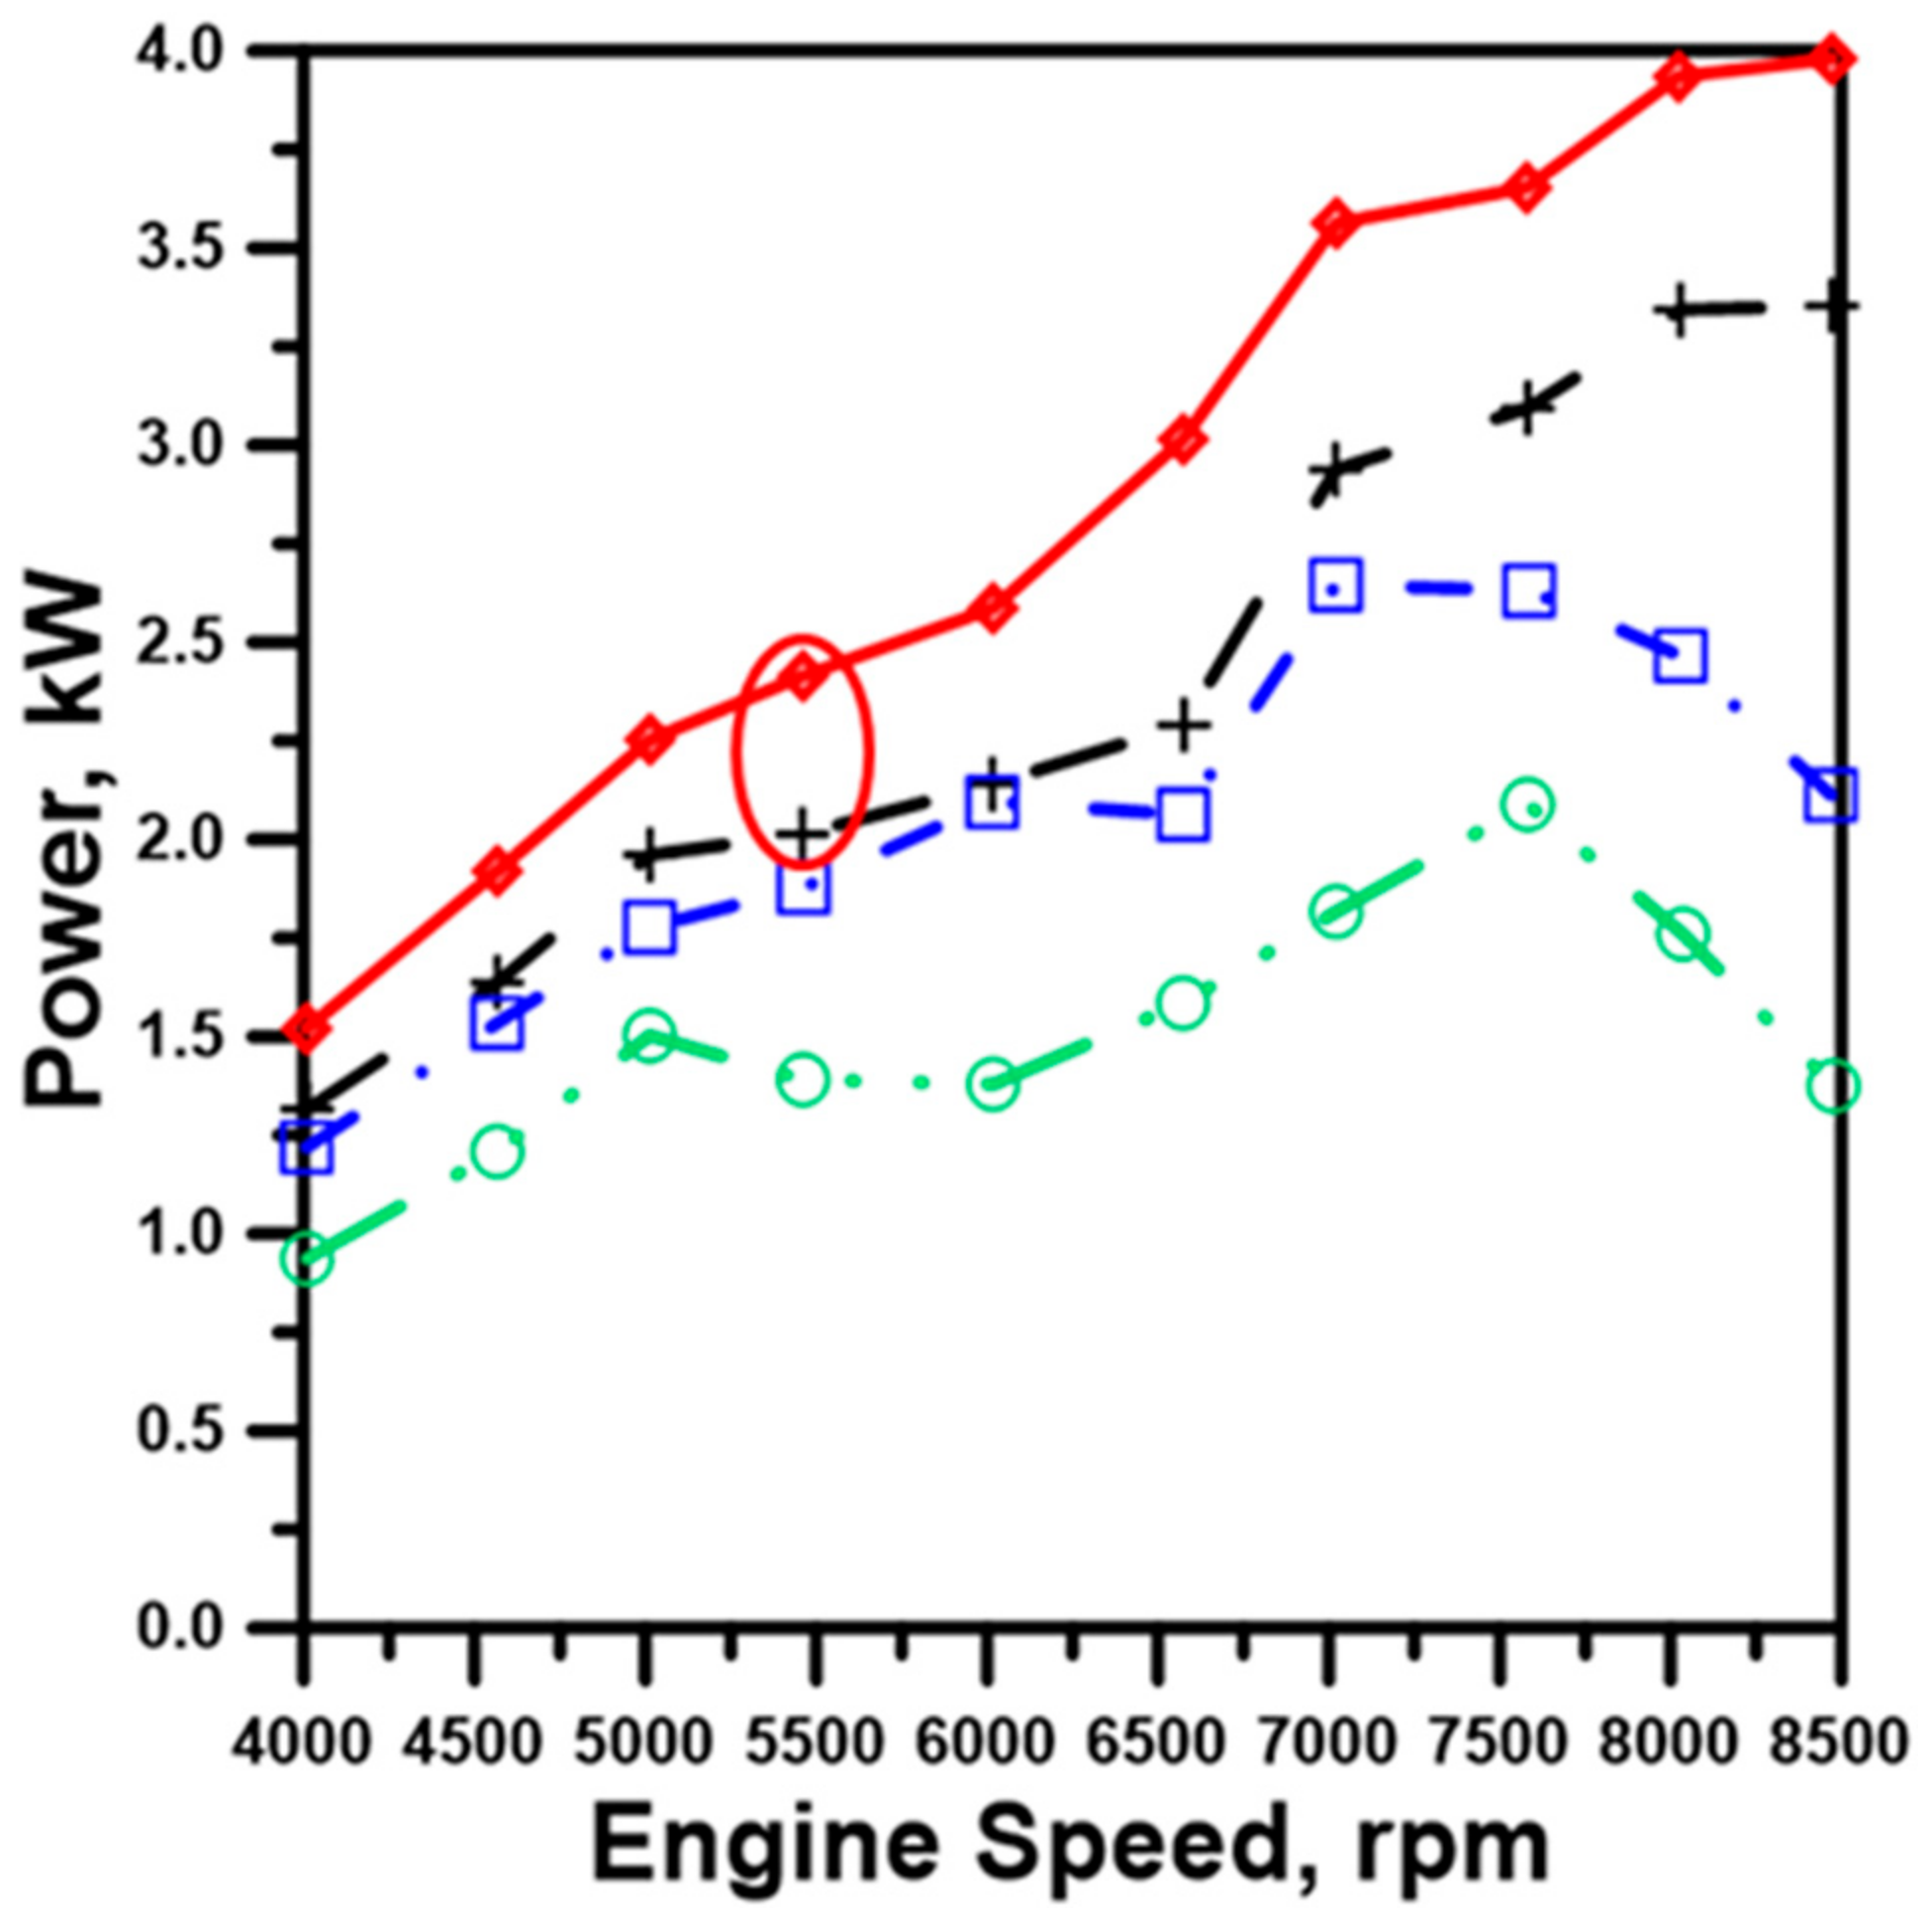
Figure 6.
Air-mass flow rate and delivery ratio vs. engine speed.

Figure 7.
Thermal efficiency.
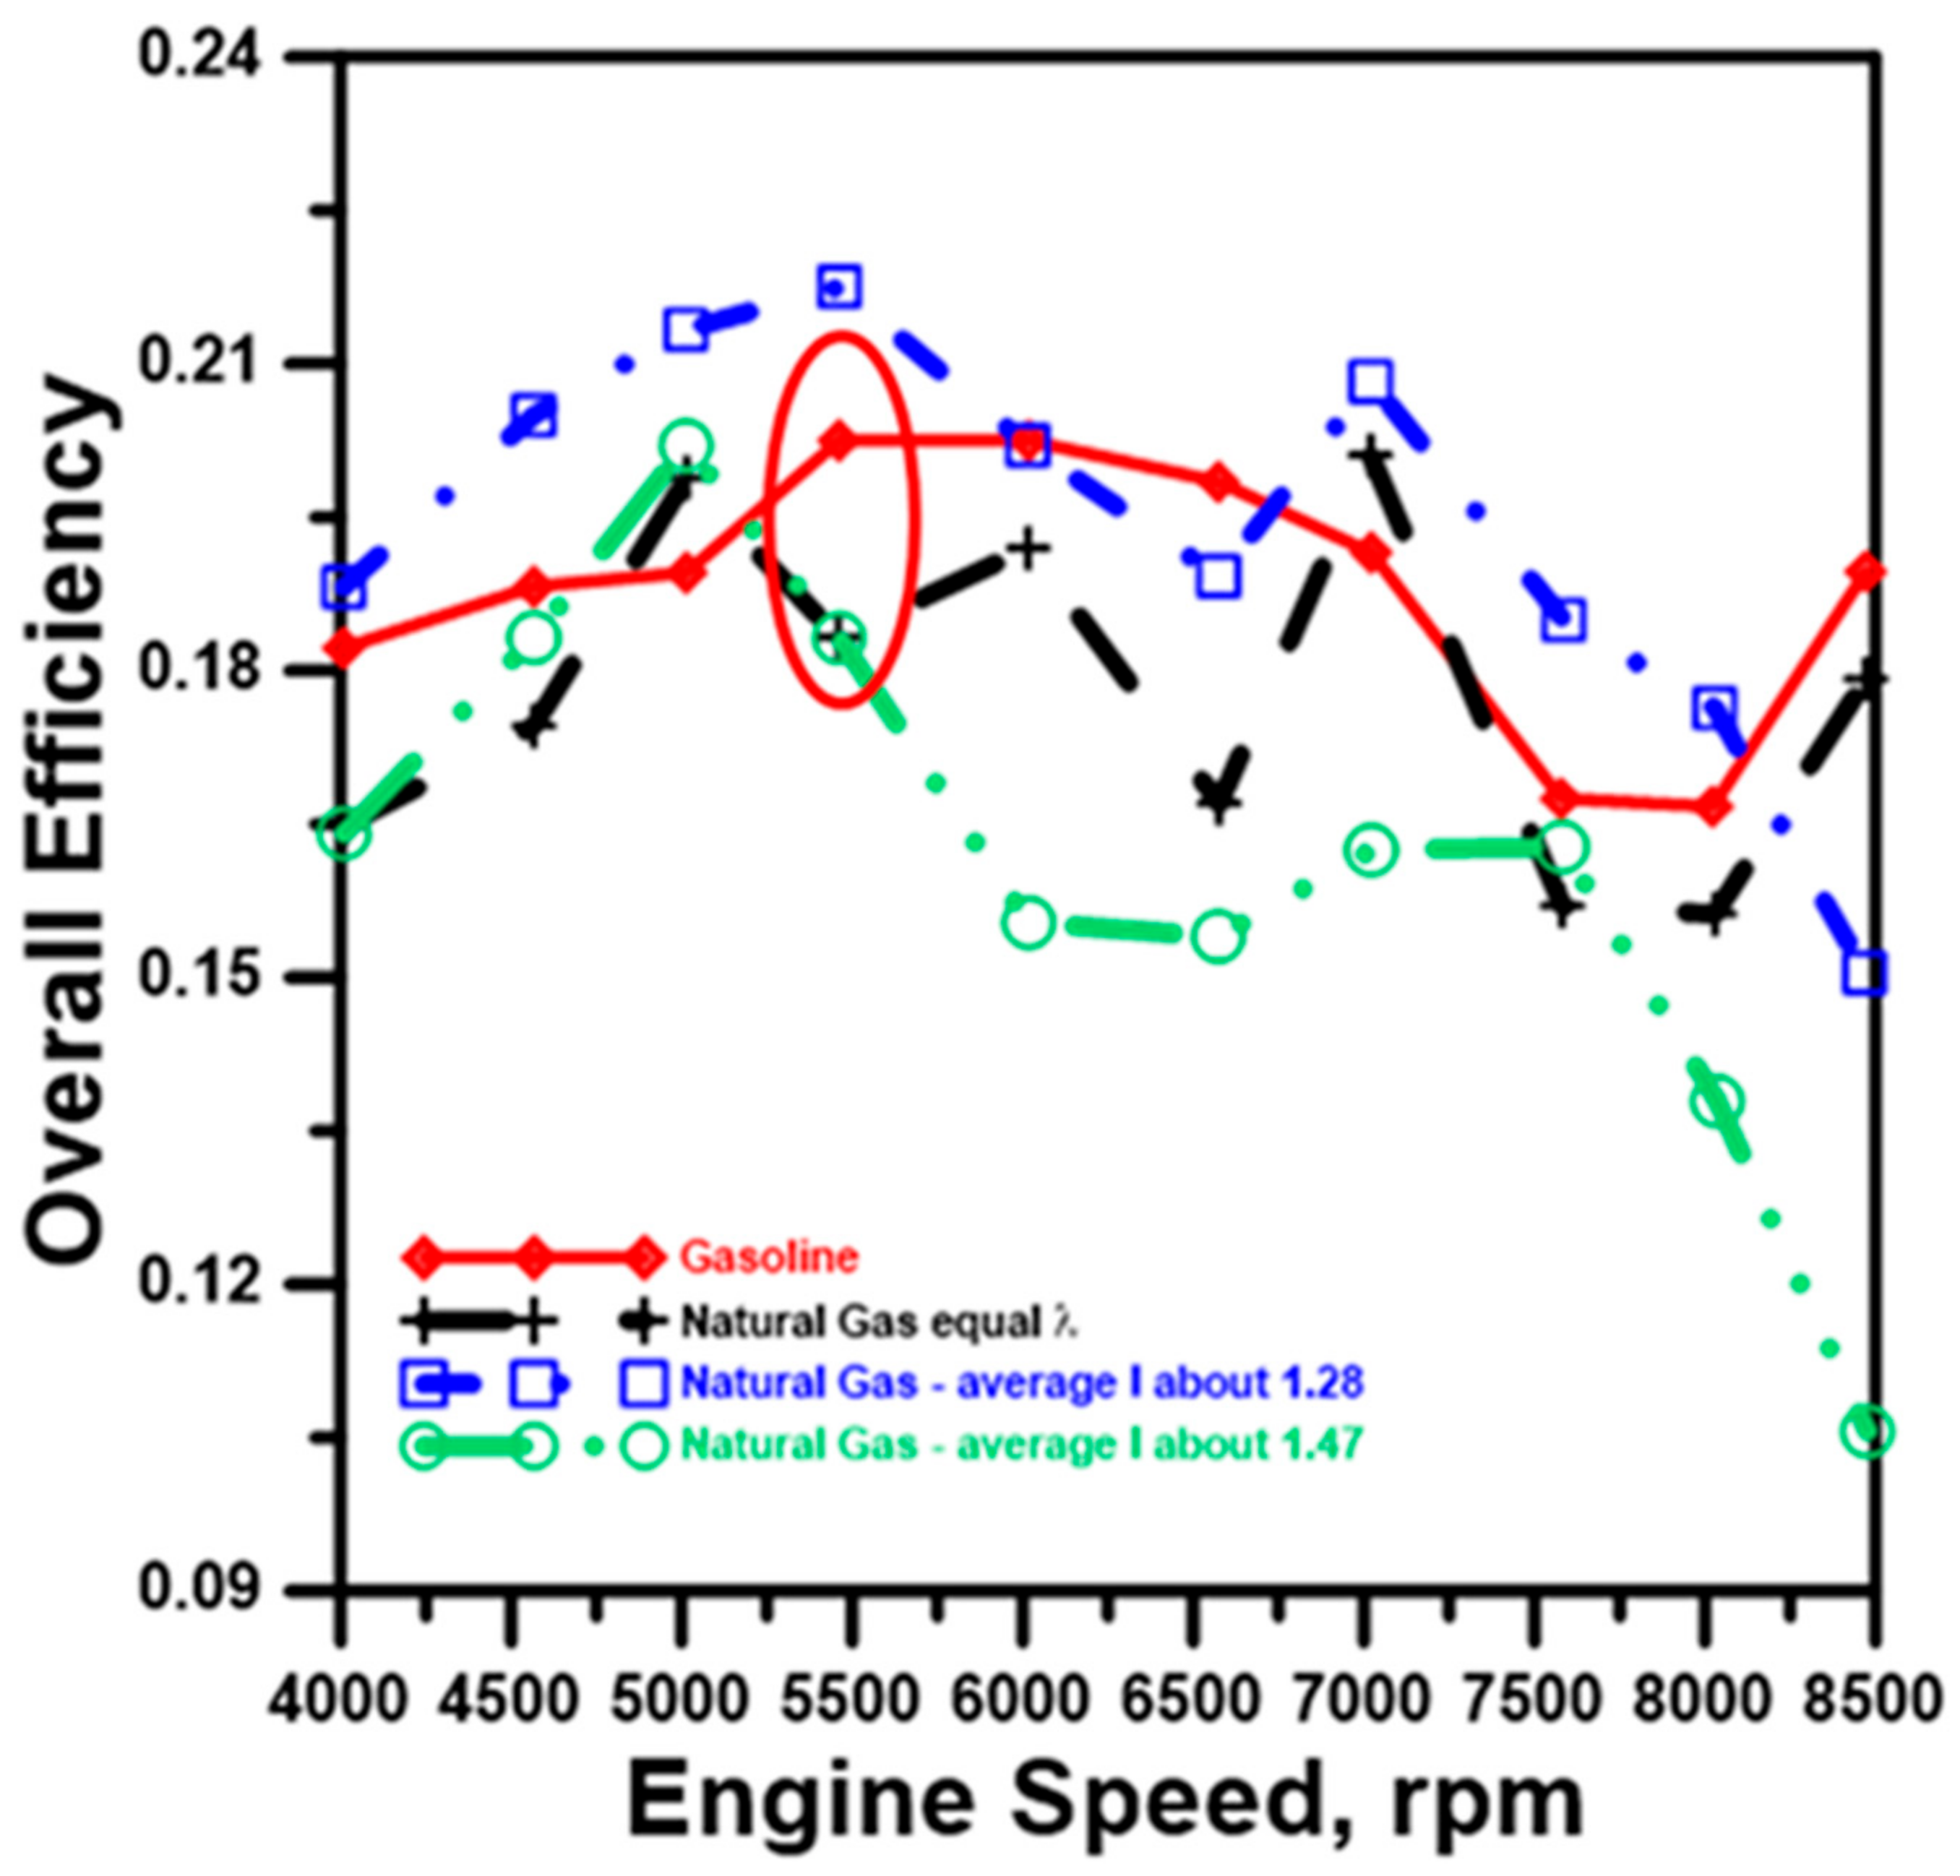
Figure 8.
Heat release rate and burned gas fraction as a function of crankshaft angular position at 5500 rpm (Ignition Timing = 15.5° BTDC).
Figure 8.
Heat release rate and burned gas fraction as a function of crankshaft angular position at 5500 rpm (Ignition Timing = 15.5° BTDC).

Figure 9.
Specific CO emissions.
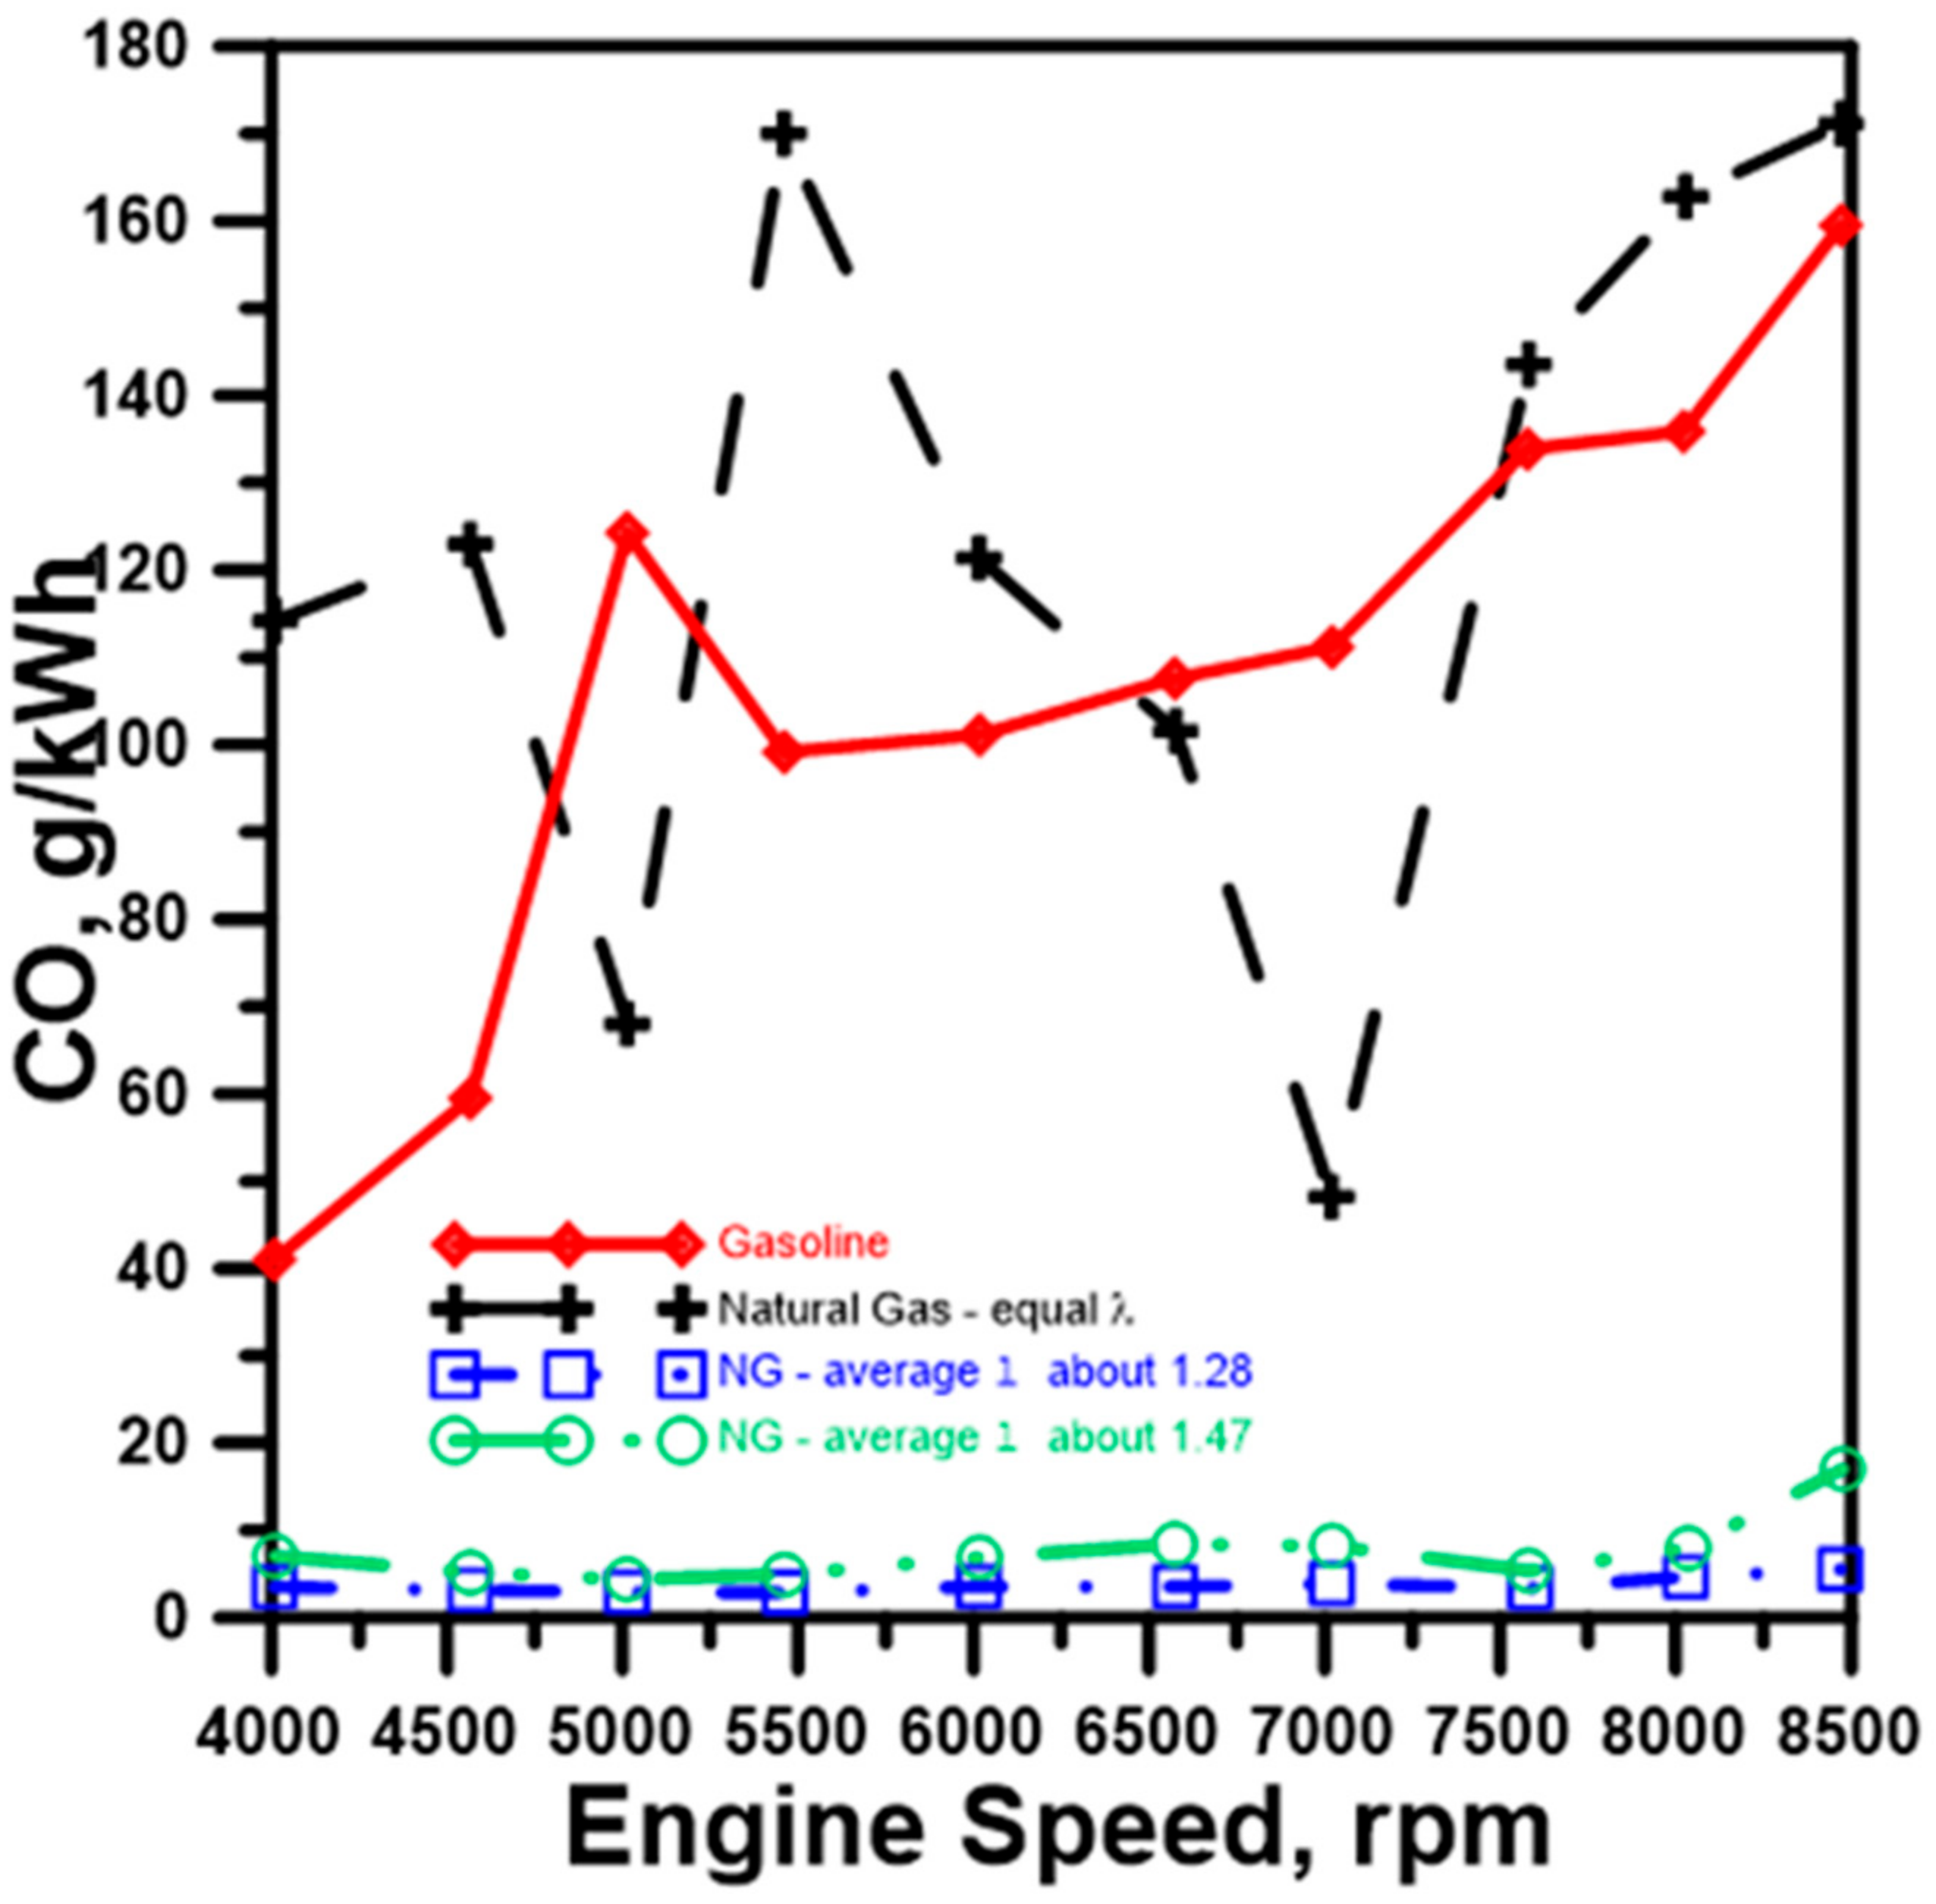
Figure 10.
Specific NOx emissions.
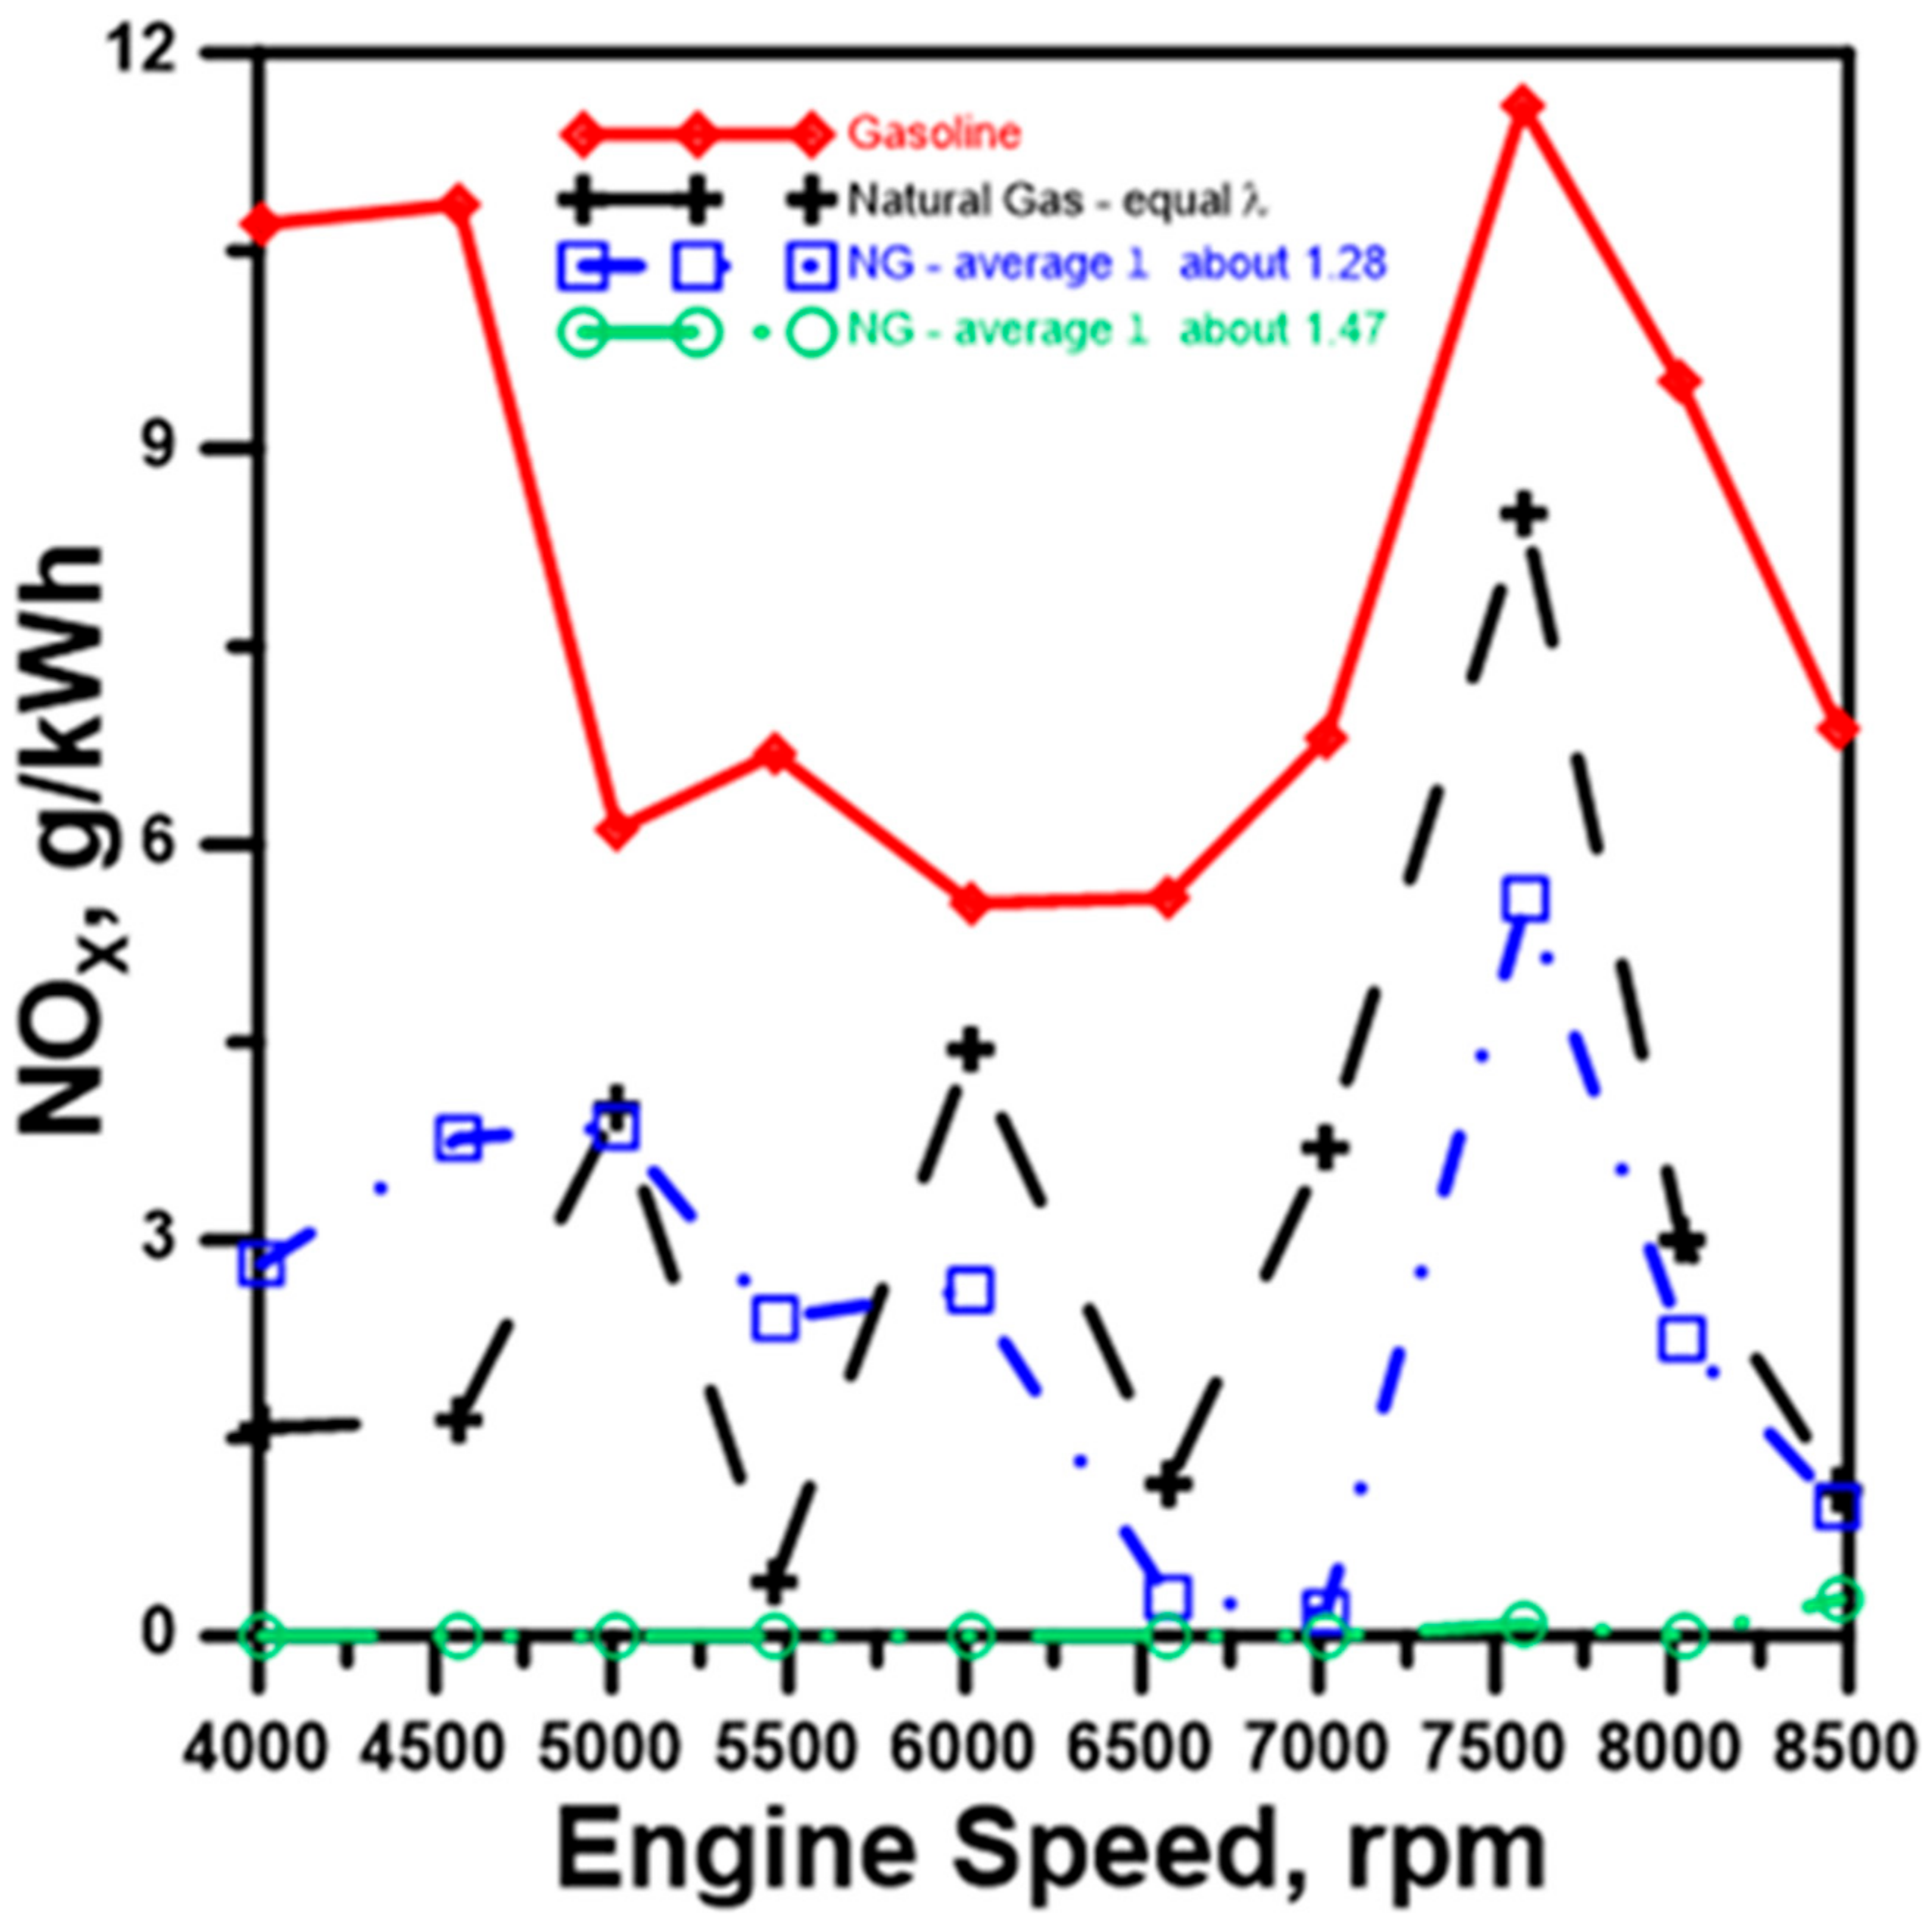
Figure 11.
Specific CO2 emissions.
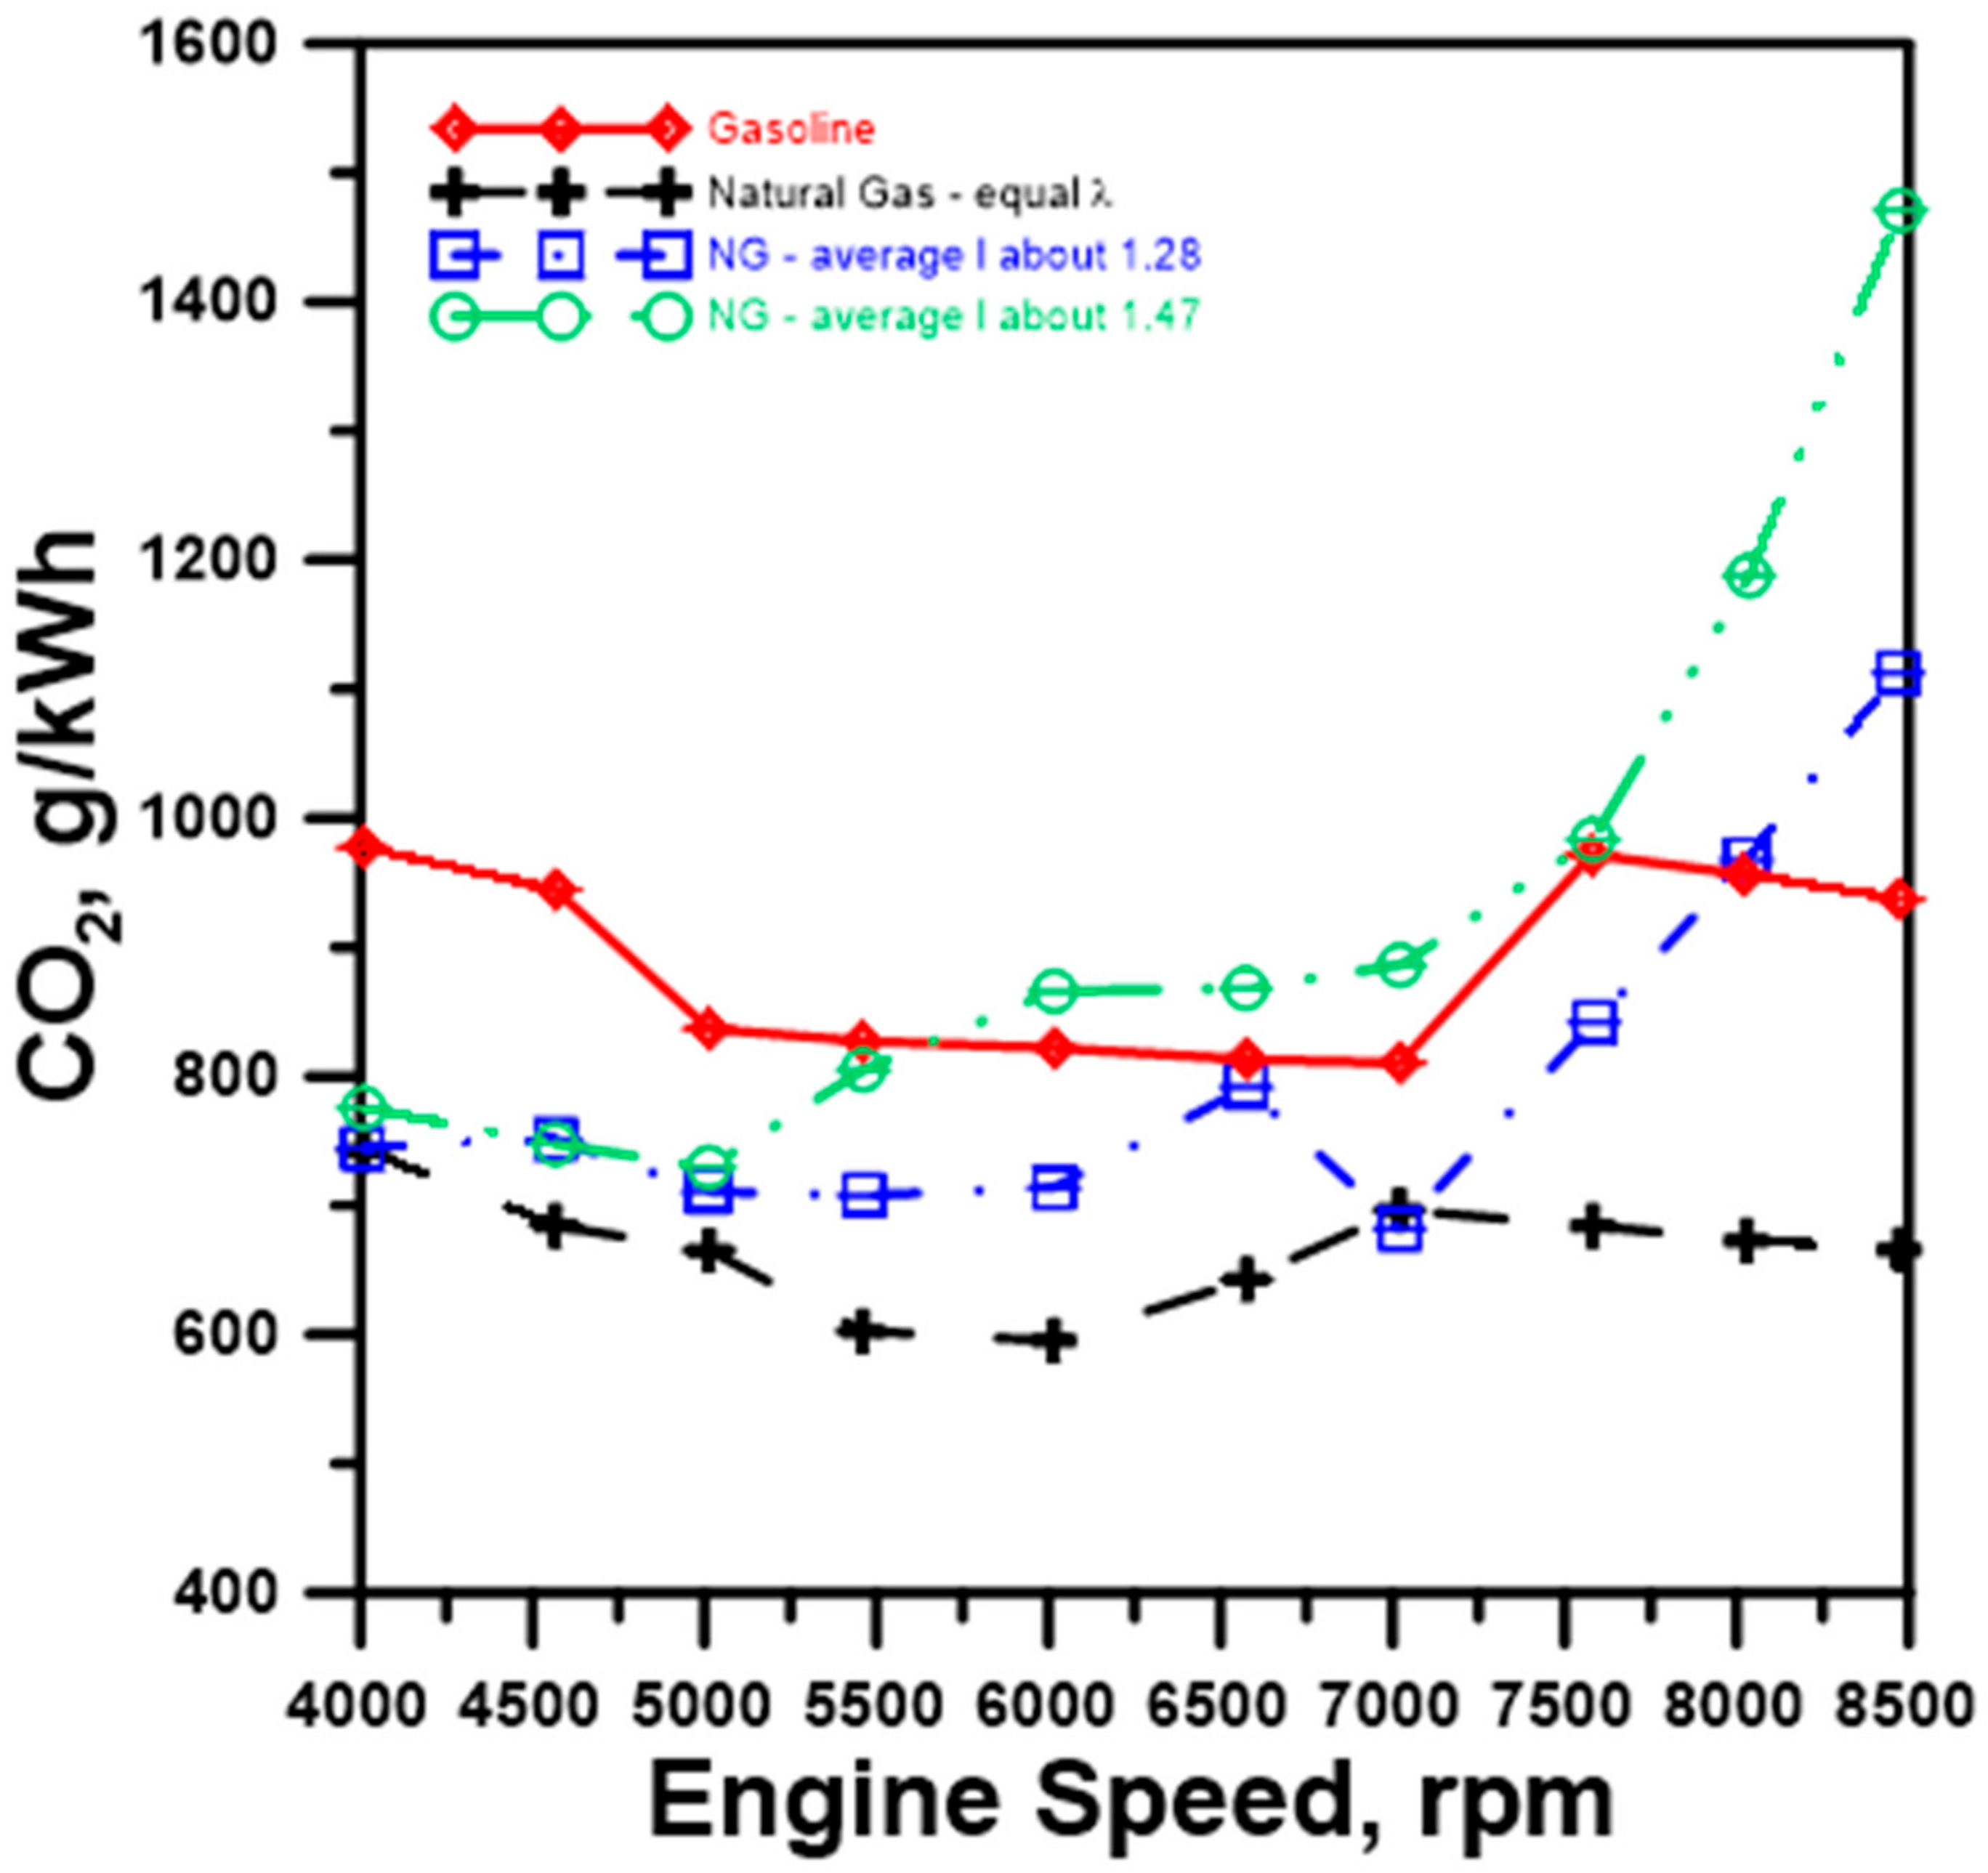
Figure 12.
Unburned Hydrocarbons (ppm).

Figure 13.
Specific HC emissions.

Figure 14.
Total specific greenhouse gases (g/kWh).

Figure 15.
Indicated Mean Effective Pressure & Brake Specific Fuel Consumption (NG equal λ Optimized) [32,33].

Figure 16.
Measured power vs. numerical power (NG equal λ Optimized).

Figure 17.
Measured overall efficiency vs. numerical overall efficiency (NG equal λ Optimized).
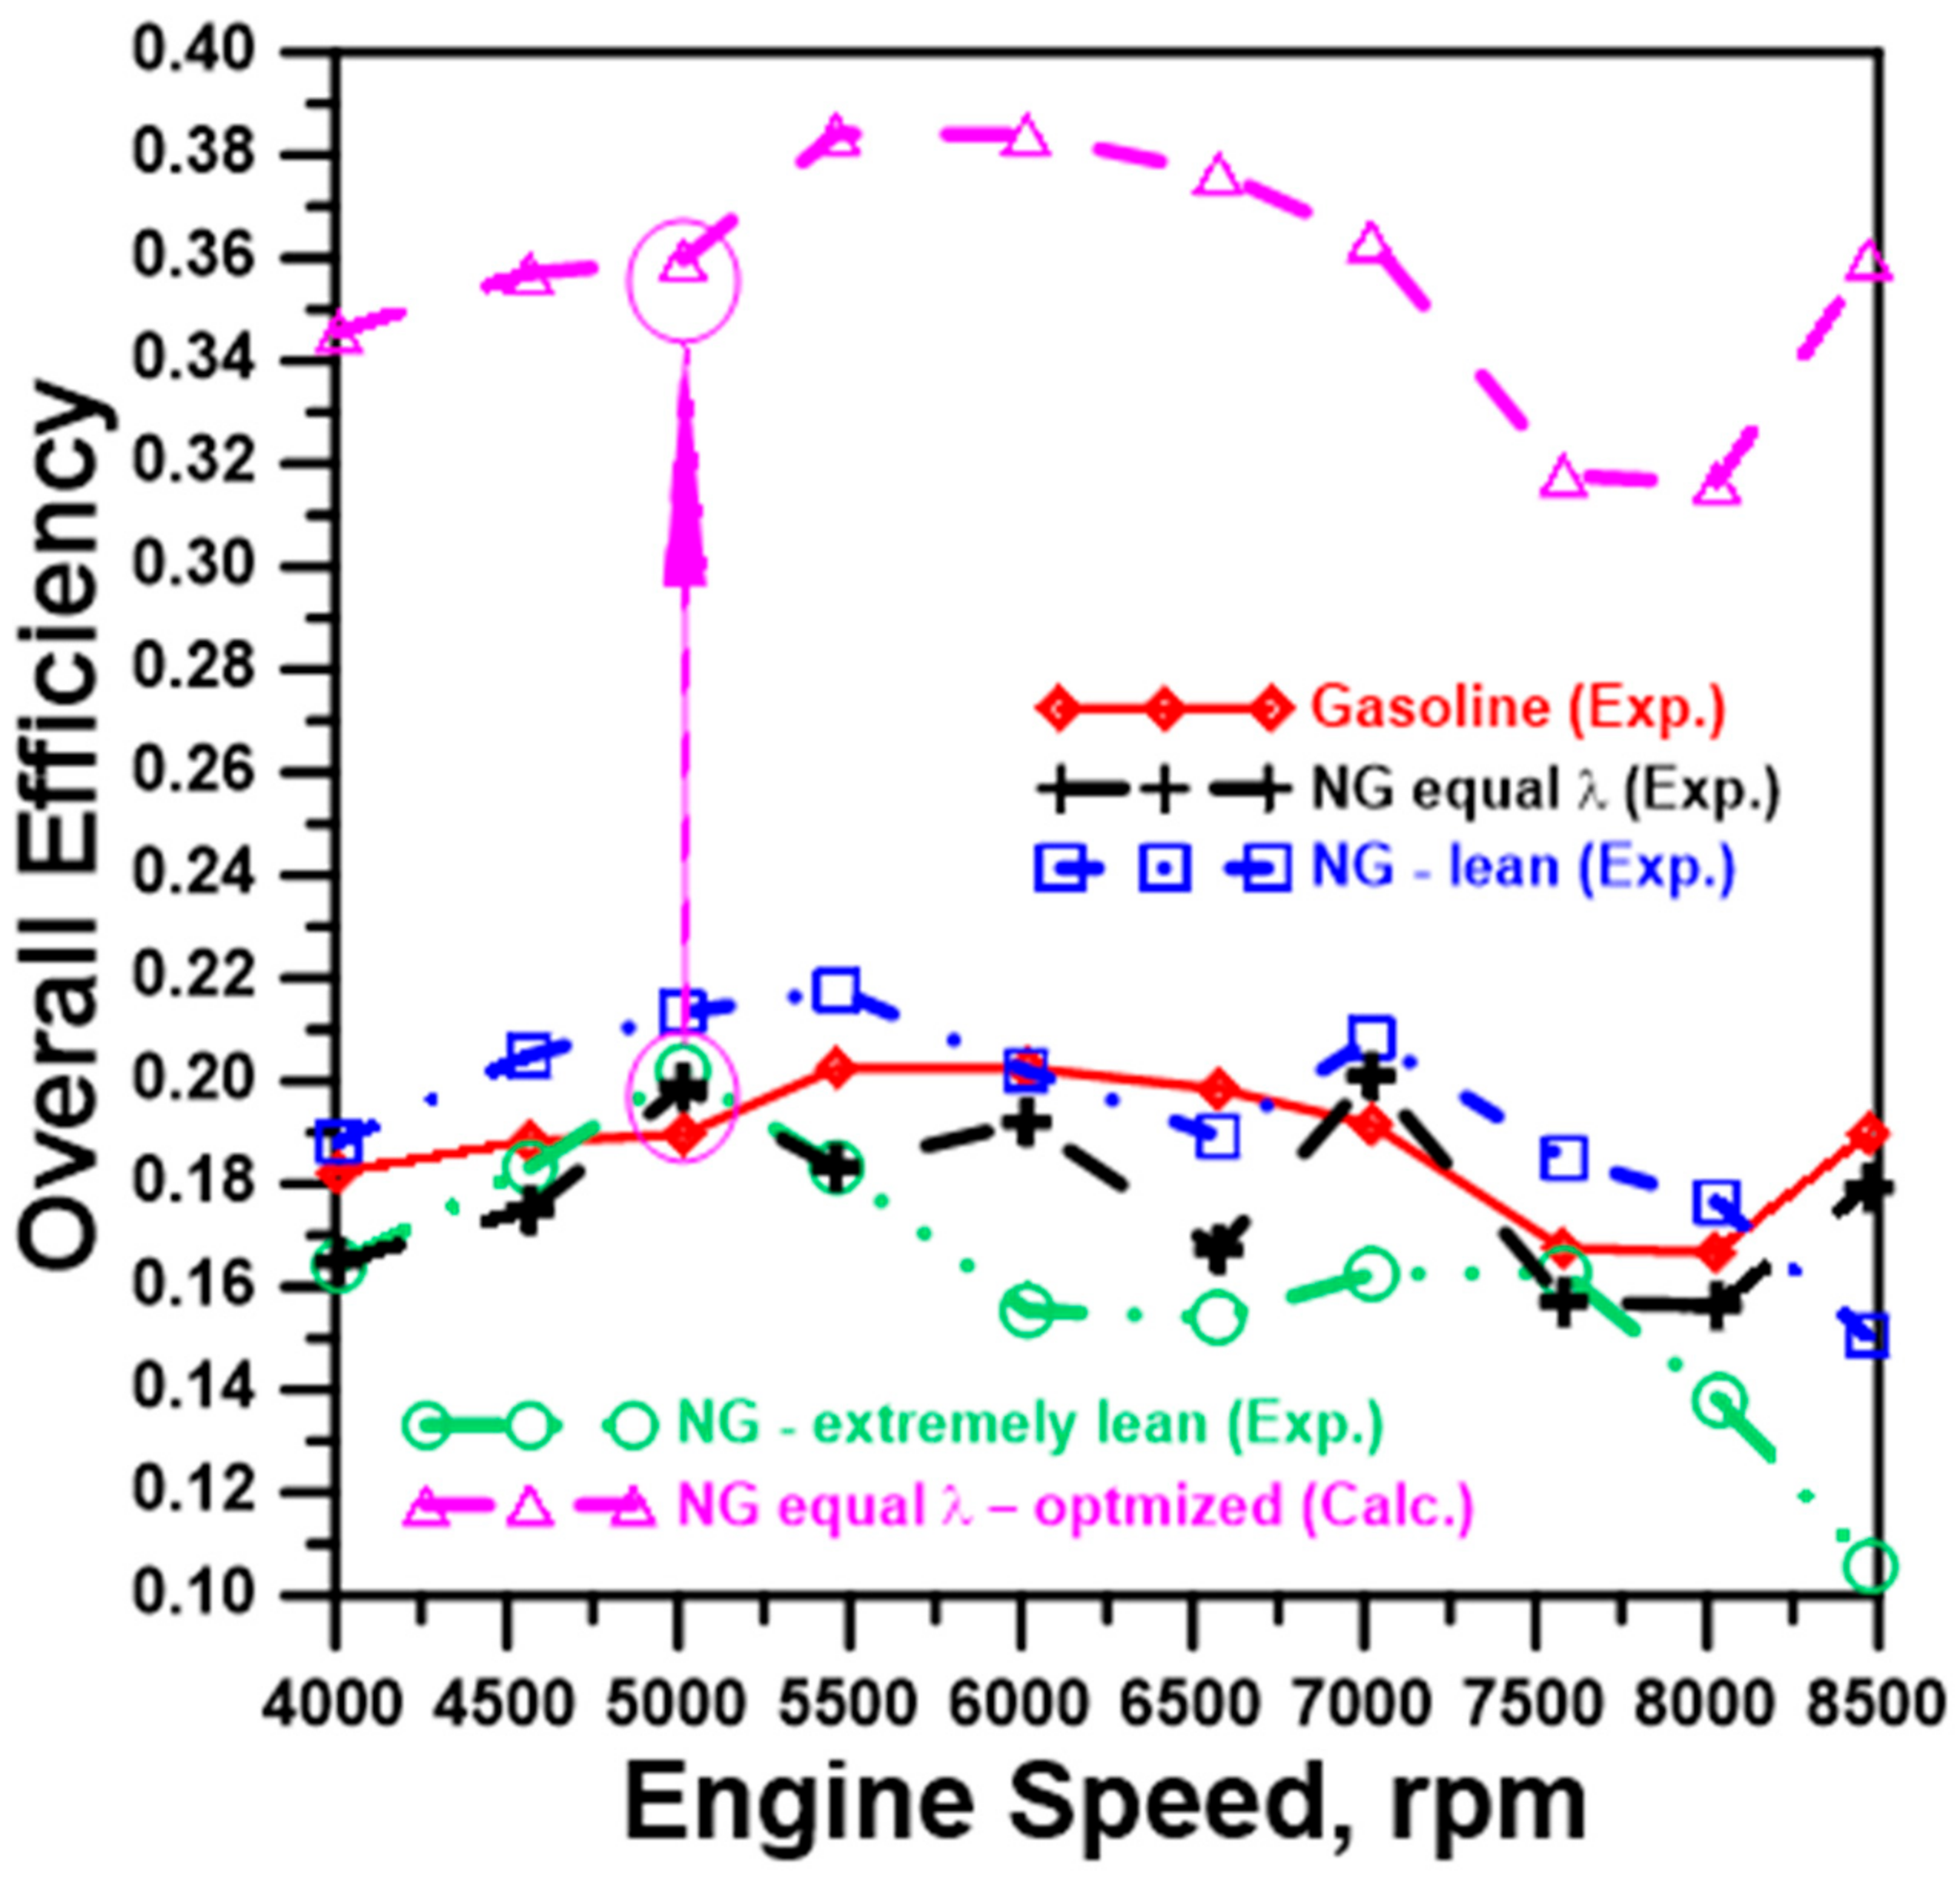
Figure 18.
Specific CO (NG equal λ Optimized).
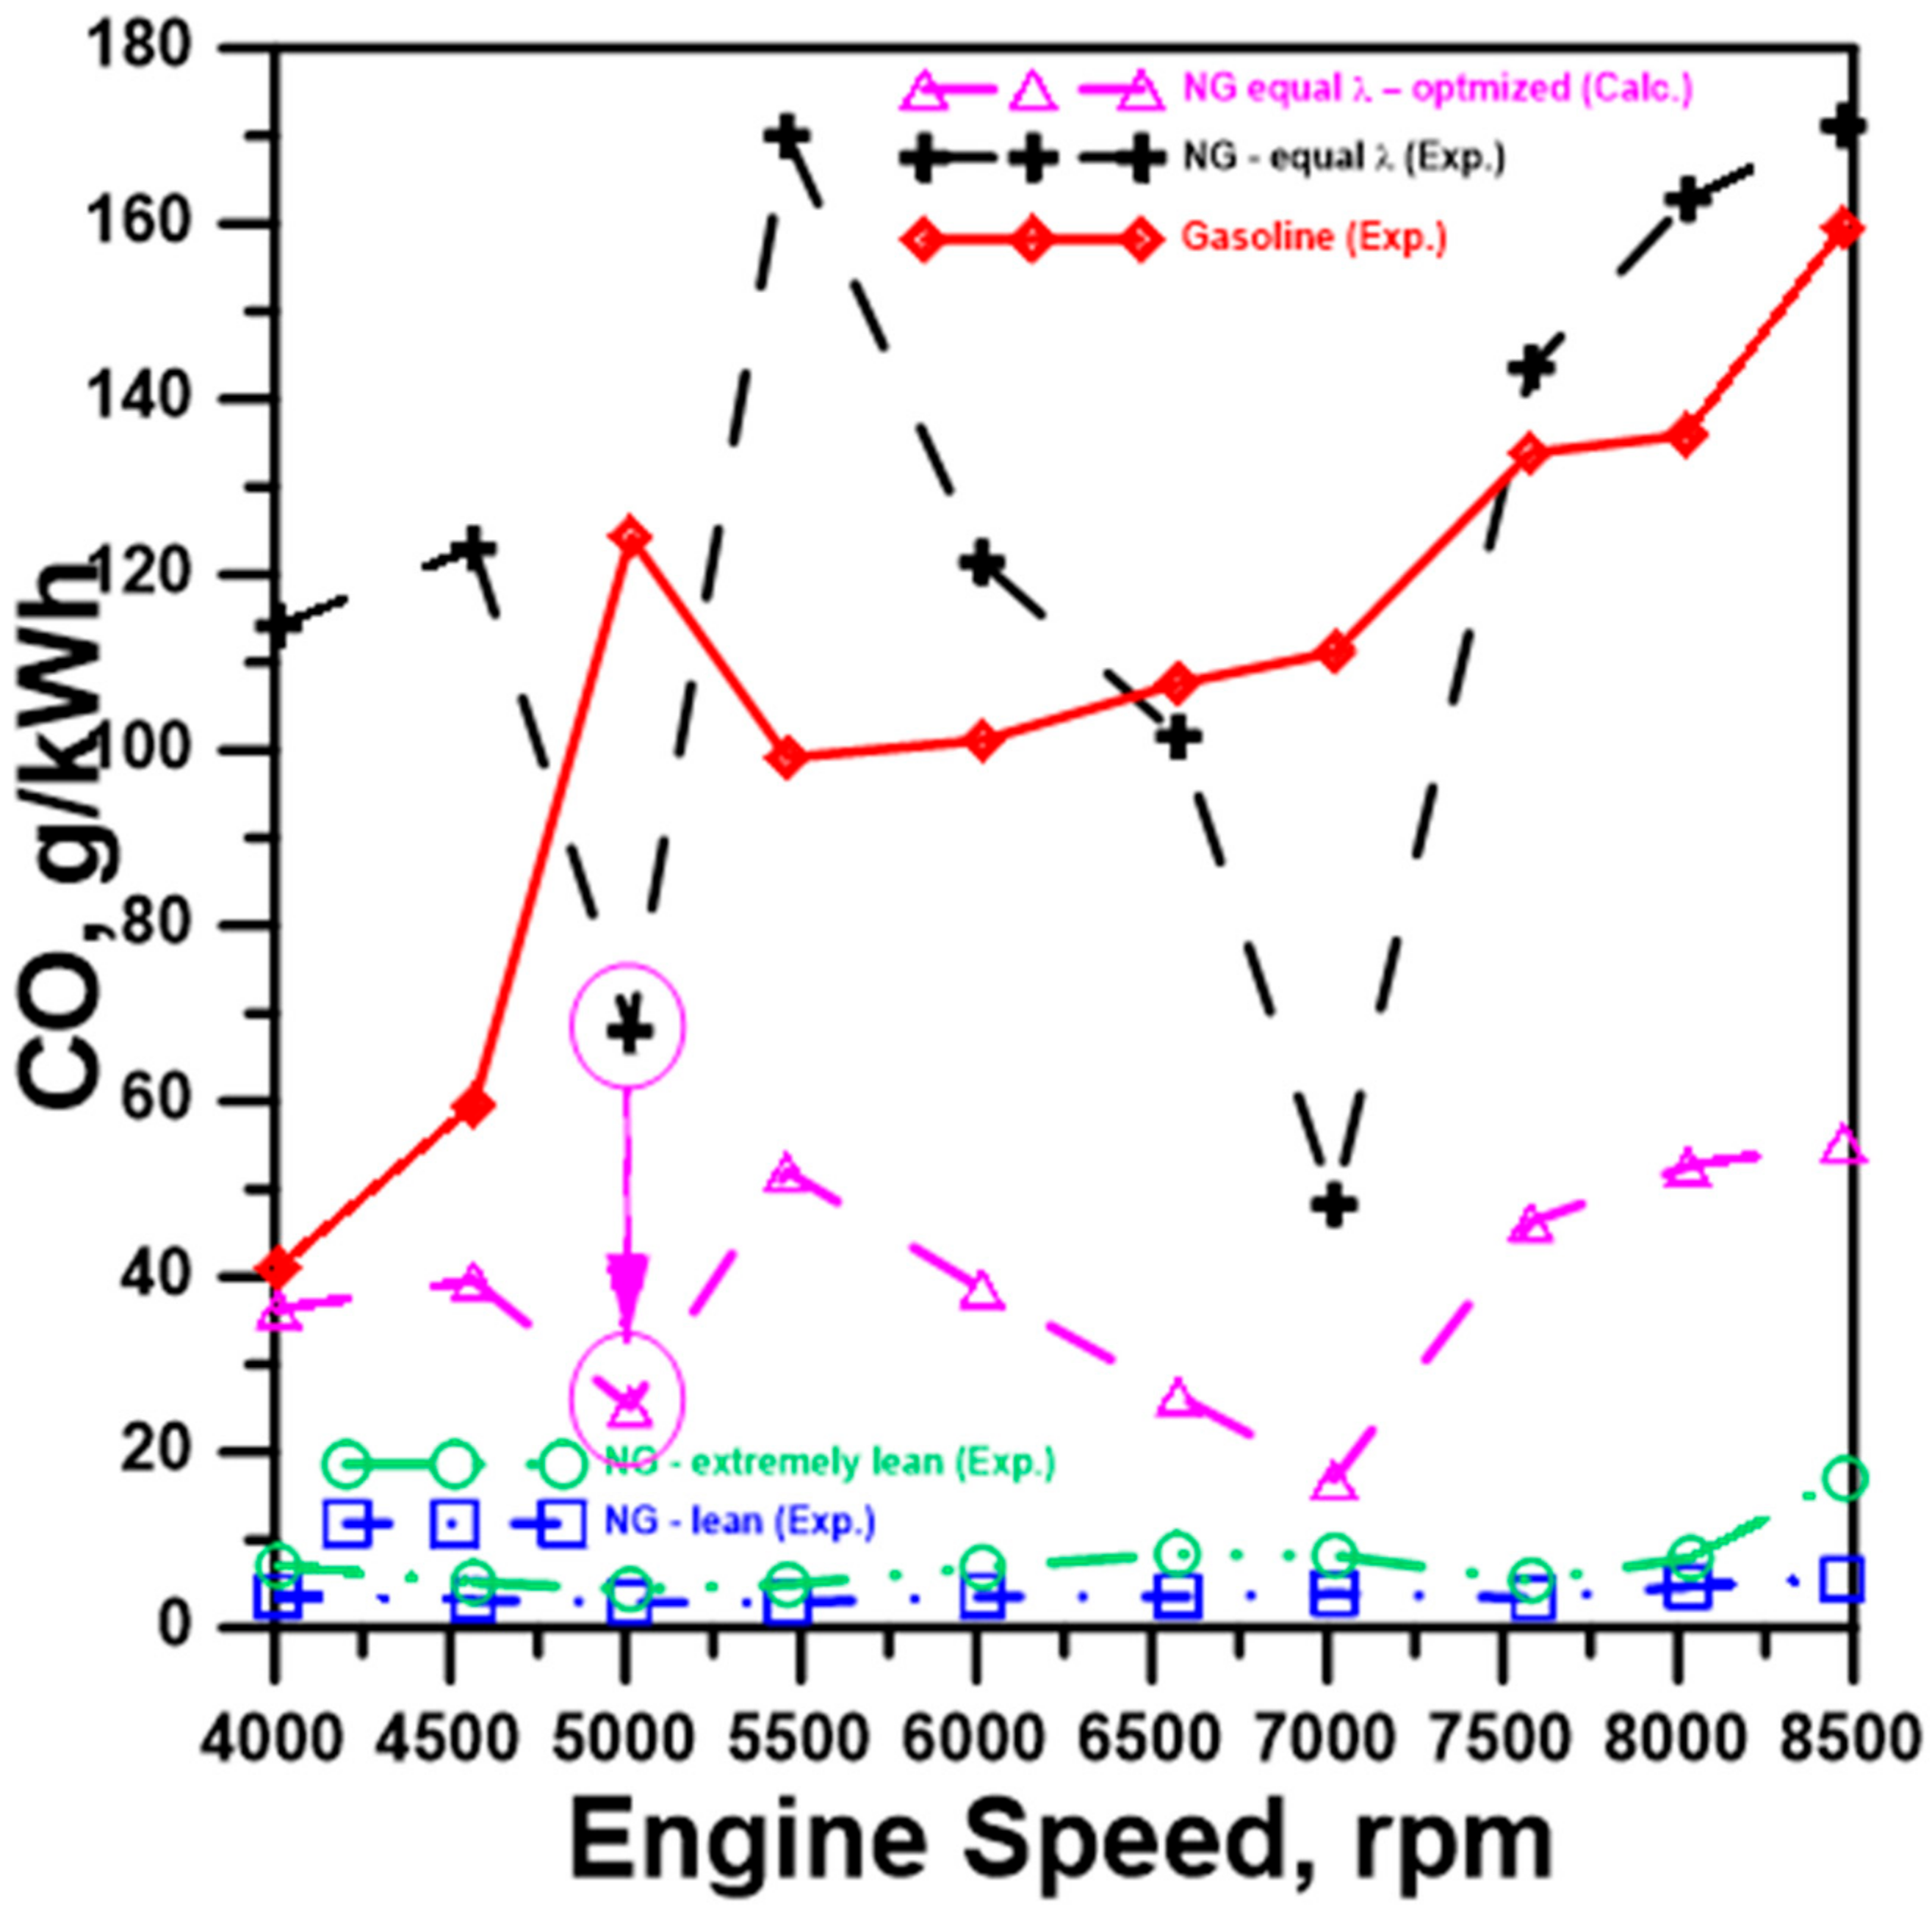
Figure 19.
Specific CO2 (NG equal λ Optimized).
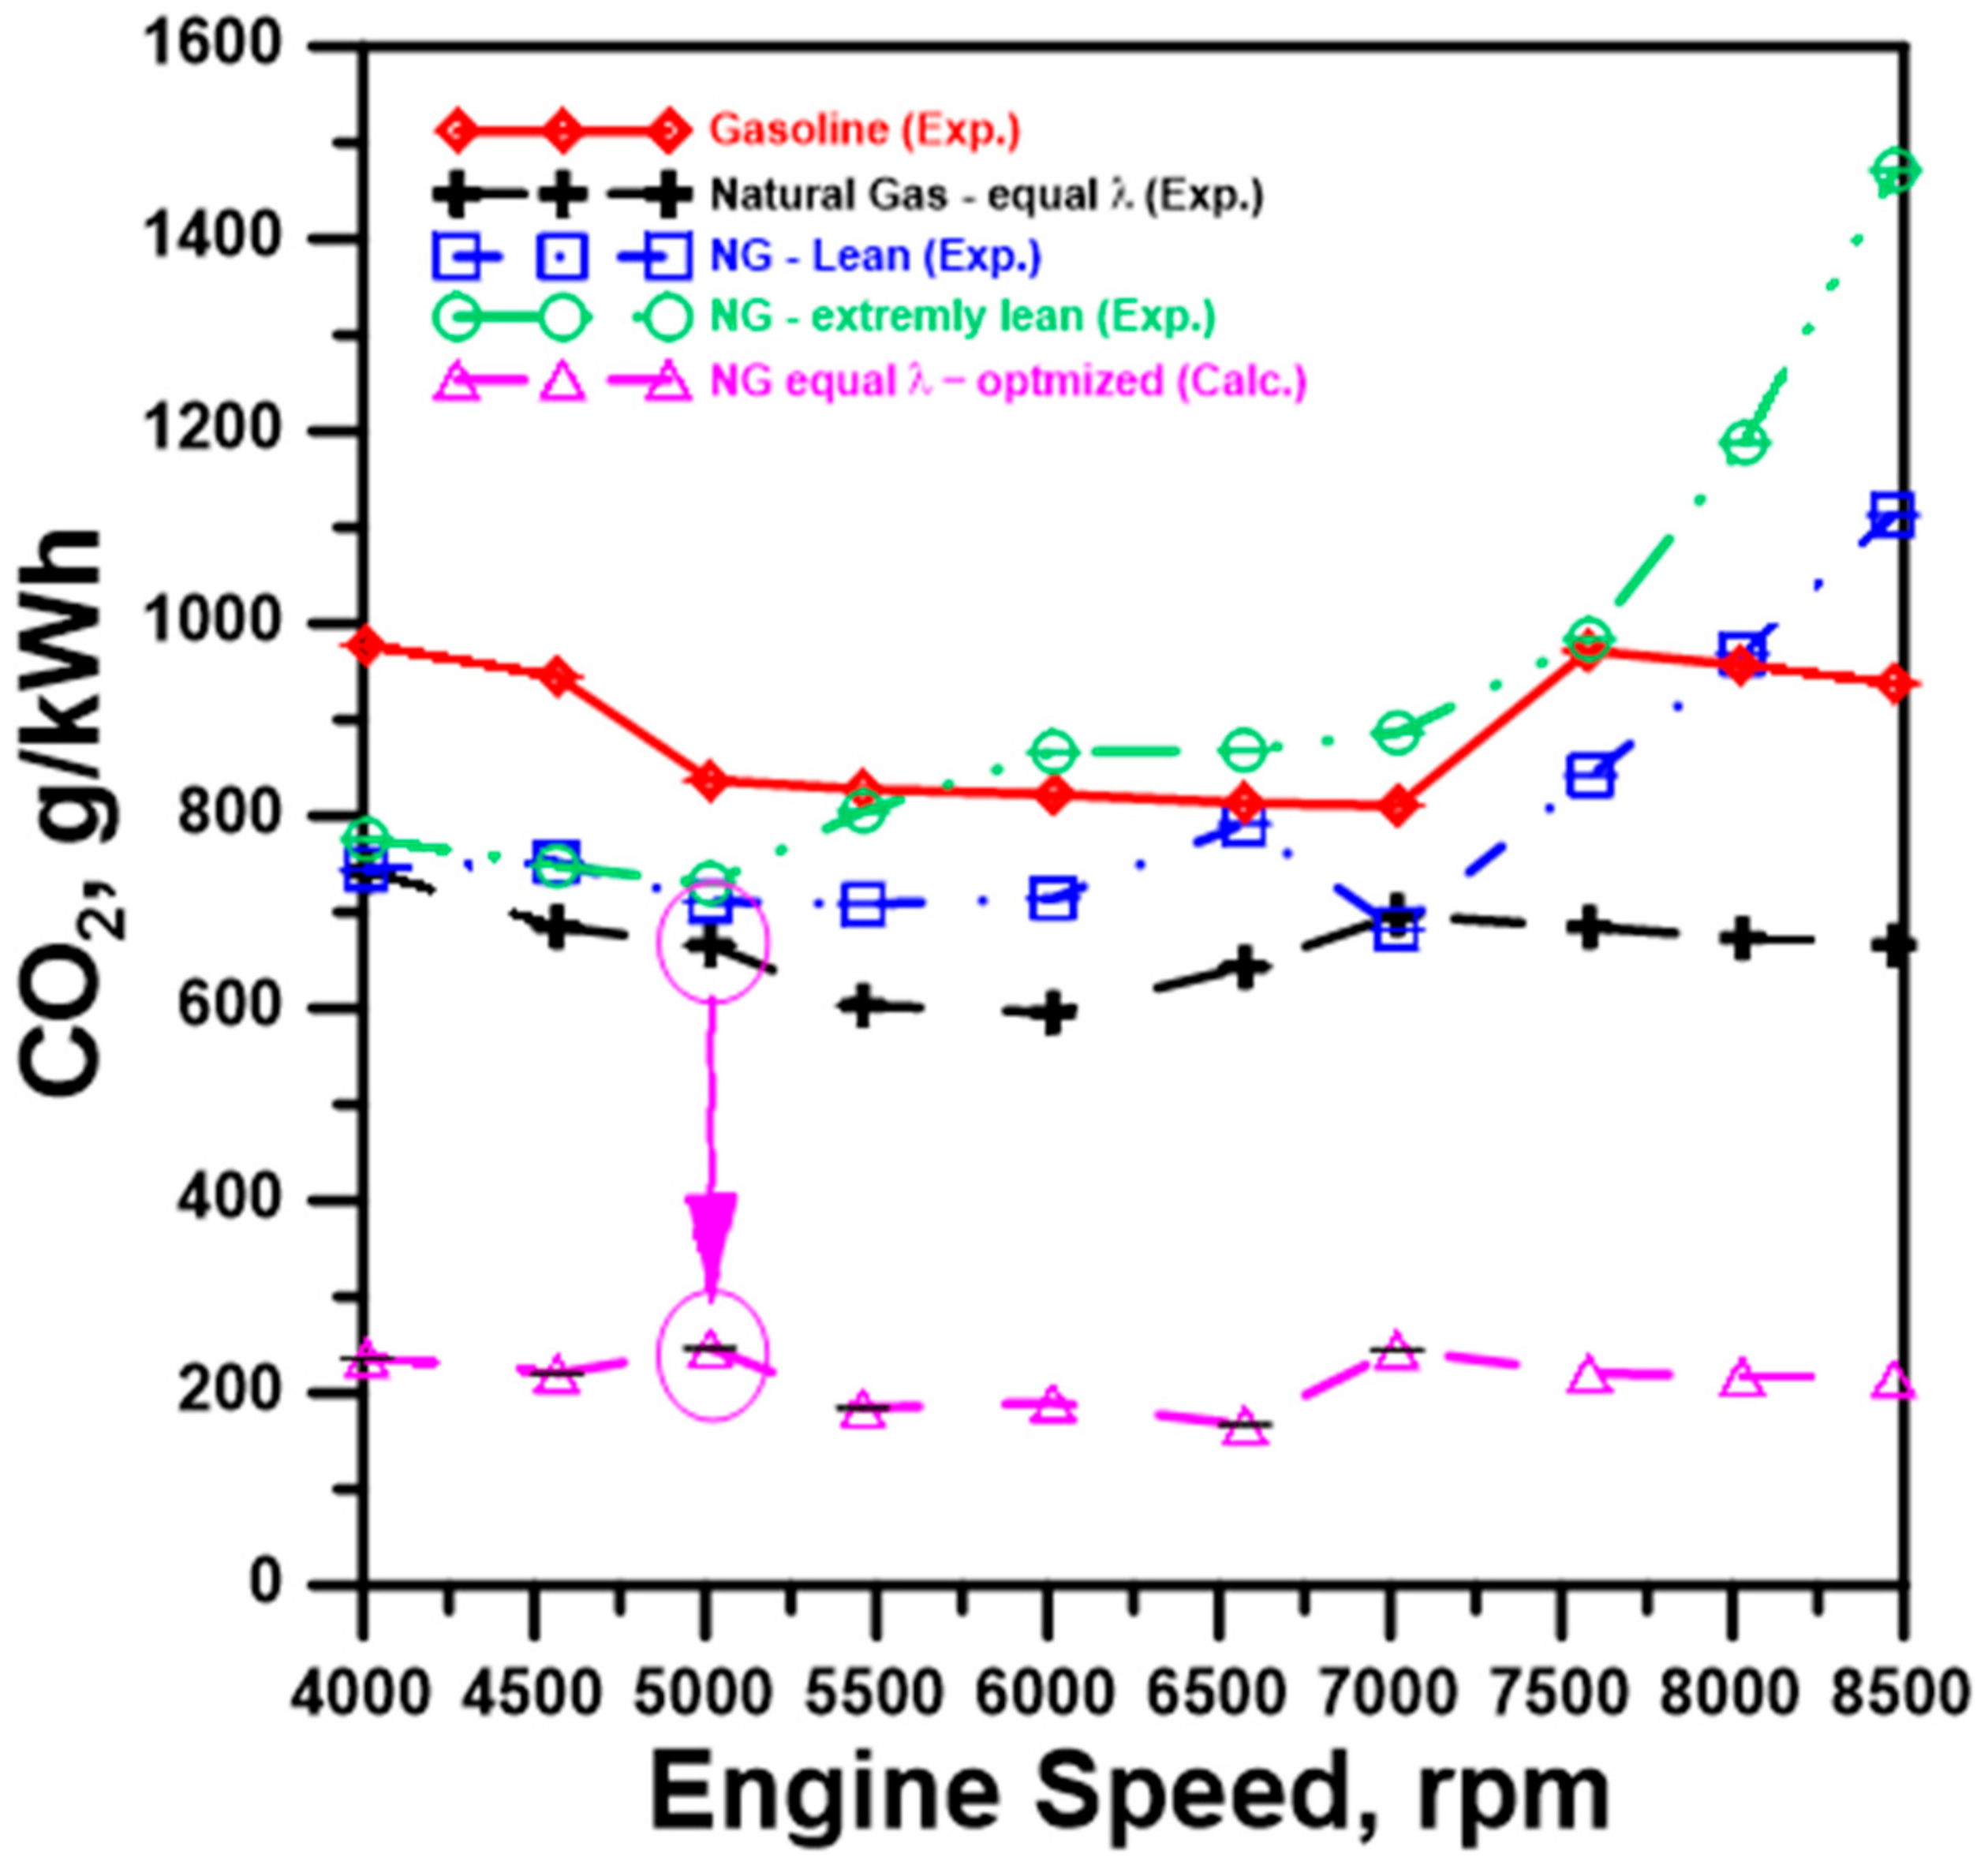
Figure 20.
Specific HC (NG equal λ Optimized).
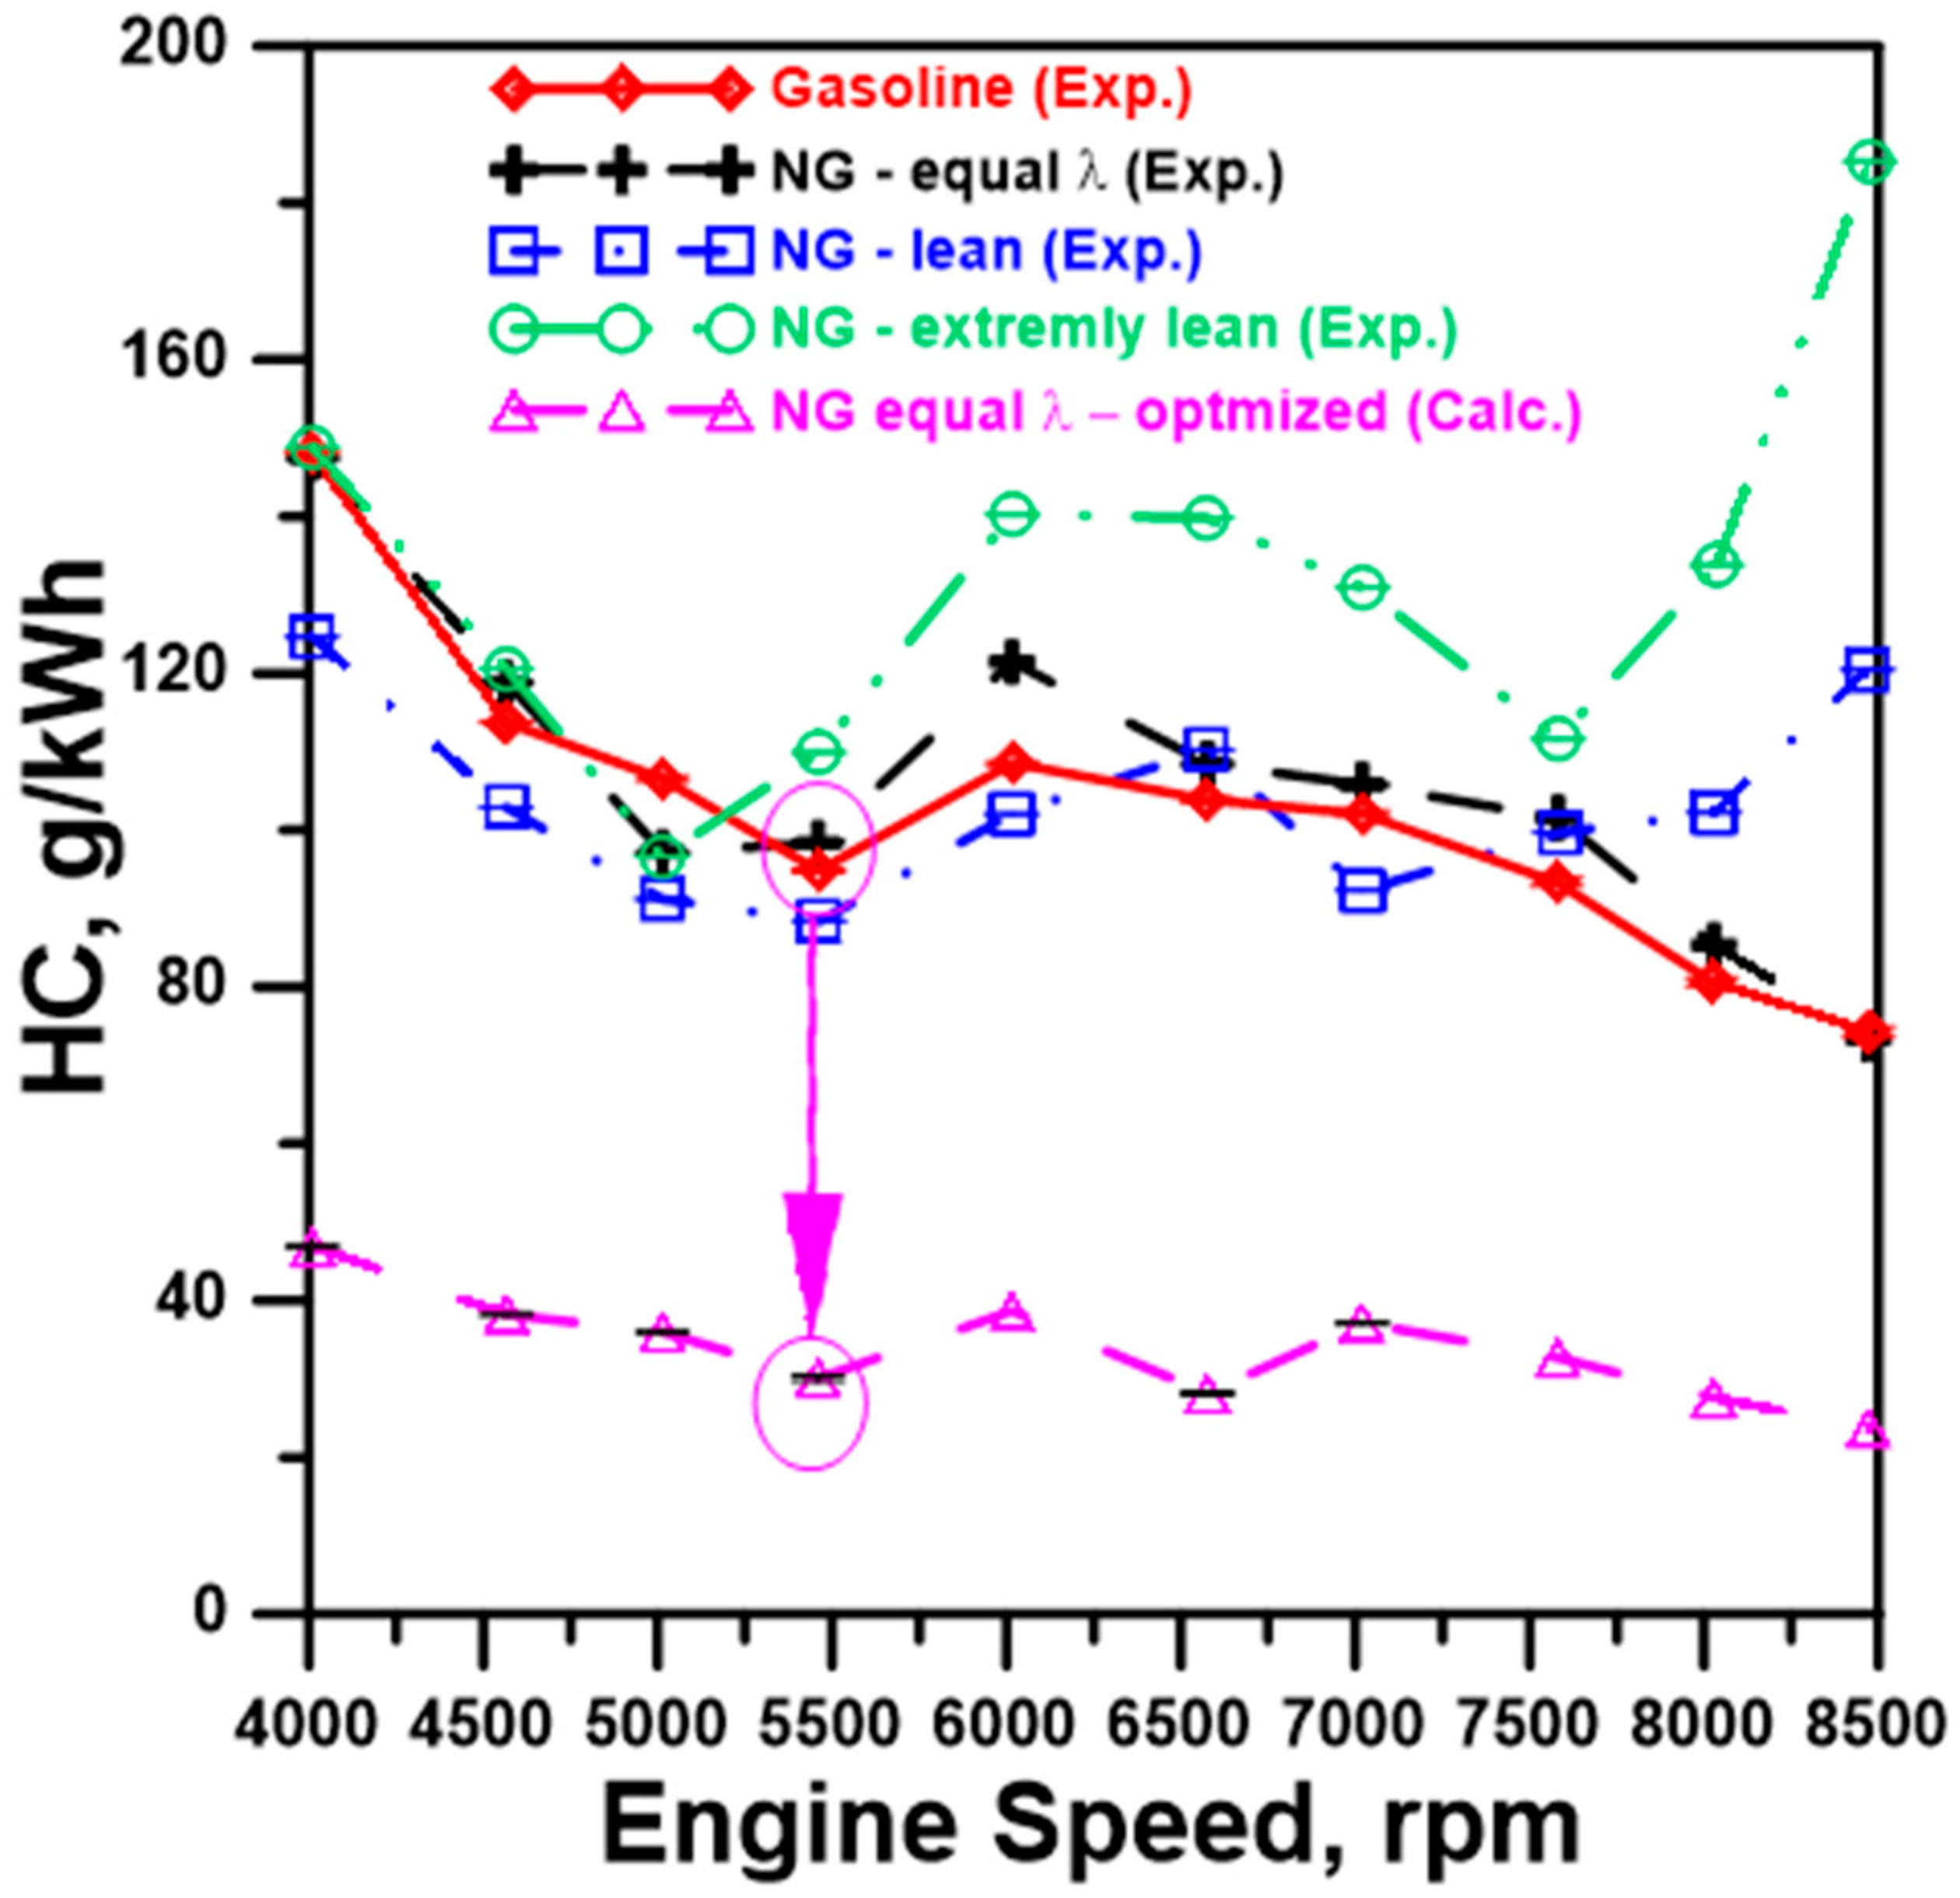
Figure 21.
Total specific greenhouse gases (NG equal λ Optimized).

Table 1.
Legend concerning the experimental apparatus schematized in Figure 3.
Table 1.
Legend concerning the experimental apparatus schematized in Figure 3.
| 1 | DC electric motor/generator | 19 | PC + DAQ cards |
| 2 | DC motor control unit | 20 | Air mass flow meter |
| 3 | Morini 2-stroke engine | 21 | Angular position sensor |
| 4–12 | Thermocouples | 22 | NG tank |
| 13 | Strain gauge | 23 | NG pressure reducer |
| 14 | Encoder | 24 | NG mass flow meter/controller |
| 15–16 | Fast-response piezoresistive pressure transducers | 25 | Pressure gauge |
| 17 | Dynamic pressure transducer | 26 | Gasoline tank |
| 18 | Exhaust gas analyzer | 27 | Electronic scale |
Table 2.
Main engine specifications.
| Engine Model | Ported Two-Stroke SI |
| Number of cylinders | 1 |
| Fuel | Gasoline |
| Scavenging Type | Schnurle |
| Displacement | 50 cm3 |
| Intake | With Reed-Valve assembly |
| Compression Ratio | 11.7 |
| Bore—Stroke | 41.0–37.4 mm |
| Brake Maximum Power | 4.11 kW at 8000 rpm |
| Brake Maximum Torque | 4.7 Nm at 7500 rpm |
| Maximum Rotational Speed | 10,000 rpm |
| Carburetor | Dell’Orto PHVA 12 |
| Intake Port Open/Number/Width | 56° BBDC/5/11 mm |
| Exhaust Port Open/Number/Width | 81° BBDC/1/26 mm |
| Weight | 19 kg |
Table 3.
Natural Gas composition.
| Chemical Species | Molecular Formula | Concentration [Vol%] |
|---|---|---|
| Methane | CH4 | 88.27 |
| Ethane | C2H6 | 4.37 |
| Propane | C3H8 | 1.71 |
| Butane | C4H10 | 0.50 |
| Pentane | C5H12 | 0.15 |
| Hexane | C6H14 | 0.01 |
| Oxygen | O2 | 0.10 |
| Nitrogen | N2 | 4.38 |
| Carbon dioxide | CO2 | 0.51 |
Table 4.
Chemical and physical properties of the adopted natural gas.
| Properties | Natural Gas |
|---|---|
| Mean Molecular Weight | ≈18.12 kg/kmol |
| Stoichiometric Air-Fuel Ratio | ≈15.56 |
| Lower Heating Value | ≈45.471 kJ/kg |
Table 5.
Chemical and physical properties of the adopted gasoline.
| Properties | Gasoline |
|---|---|
| Mean Molecular Weight | ≈110.00 kg/kmol |
| Stoichiometric Air-Fuel Ratio | ≈14.60 |
| Lower Heating Value | ≈43.700 kJ/kg |
Table 6.
Range of values adopted for the air-fuel equivalence ratio and related average values.
| Gasoline | Natural Gas (Equal λ) | Natural Gas (Lean Mixture) | Natural Gas (Extremely Lean Mixture) | |
|---|---|---|---|---|
| 0.82–1.05 | 0.88–1.04 | 1.14–1.34 | 1.41–1.55 | |
| 0.92 | 0.95 | 1.28 | 1.47 |
Table 7.
Comparison between gasoline and CNG operation at equal λ.
| Engine Speed [rpm] | |||||
|---|---|---|---|---|---|
| 4000 | 0.87 | 0.97 | 1.02 | 0.97 | 0.91 |
| 4500 | 0.86 | 0.96 | 0.98 | 0.97 | 0.93 |
| 5000 | 0.87 | 0.95 | 0.90 | 0.97 | 1.05 |
 |  |  |  |  |  |
| 6000 | 0.83 | 0.95 | 1.00 | 0.97 | 0.90 |
| 6500 | 0.76 | 0.89 | 1.04 | 0.97 | 0.84 |
| 7000 | 0.83 | 0.95 | 0.85 | 0.97 | 1.05 |
| 7500 | 0.85 | 0.97 | 0.95 | 0.97 | 0.94 |
| 8000 | 0.85 | 0.97 | 0.93 | 0.97 | 0.94 |
| 8500 | 0.84 | 0.97 | 0.99 | 0.97 | 0.91 |
Table 8.
UHC emission species concentration in the exhaust gas flow at 4000 rpm: (a) Natural Gas; (b) Gasoline.
Table 8.
UHC emission species concentration in the exhaust gas flow at 4000 rpm: (a) Natural Gas; (b) Gasoline.
| Chemical Species | ppm C | Chemical Species | ppm C |
|---|---|---|---|
| Methane (CH4) | 29,000 | Methane (CH4) | 565 |
| Ethane (C2H6) | 2590 | Ethane (C2H6) | 250 |
| Ethylene (C2H4) | 89 | Ethylene (C2H4) | 1250 |
| Propane (C3H8) | 658 | Propane (C3H8) | 20 |
| Propylene (C3H6) | 25 | Propylene (C3H6) | 950 |
| Acetylene (C2H2) | 5 | Acetylene (C2H2) | 295 |
| Butane (C4H10) | 196 | Butane (C4H10) | 1065 |
| Benzene (C6H6) | 11 | Benzene (C6H6) | 2010 |
| HC molecular weight > C6H6 | 426 | HC molecular weight > C6H6 | 34,845 |
| Tot FID meas. | 33,000 | Tot FID meas. | 41,250 |
| (a) | (b) | ||
Publisher’s Note: MDPI stays neutral with regard to jurisdictional claims in published maps and institutional affiliations. |
© 2021 by the authors. Licensee MDPI, Basel, Switzerland. This article is an open access article distributed under the terms and conditions of the Creative Commons Attribution (CC BY) license (https://creativecommons.org/licenses/by/4.0/).
Share and Cite
MDPI and ACS Style
Gimelli, A.; Muccillo, M. Development of a 1 kW Micro-Polygeneration System Fueled by Natural Gas for Single-Family Users. Energies 2021, 14, 8372. https://doi.org/10.3390/en14248372
AMA Style
Gimelli A, Muccillo M. Development of a 1 kW Micro-Polygeneration System Fueled by Natural Gas for Single-Family Users. Energies. 2021; 14(24):8372. https://doi.org/10.3390/en14248372
Chicago/Turabian StyleGimelli, Alfredo, and Massimiliano Muccillo. 2021. "Development of a 1 kW Micro-Polygeneration System Fueled by Natural Gas for Single-Family Users" Energies 14, no. 24: 8372. https://doi.org/10.3390/en14248372
Note that from the first issue of 2016, this journal uses article numbers instead of page numbers. See further details here.