Article

Dynamics of Melting Process in Phase Change Material Windows Determined Based on Direct Light Transmission

by
Dariusz Heim
1,*,
Michał Krempski-Smejda
1,
Pablo Roberto Dellicompagni
2,
Dominika Knera
1,
Anna Wieprzkowicz
1 and
Judith Franco
2
1
Department of Environmental Engineering, Lodz University of Technology, ul. Wolczanska 213, 91-164 Lodz, Poland
2
Instituto de Investigaciones en Energía No Convencional (INENCO), 5150 Bolivia Av., Salta 4400, Argentina
*
Author to whom correspondence should be addressed.
Energies 2021, 14(3), 721; https://doi.org/10.3390/en14030721
Submission received: 18 December 2020 / Revised: 21 January 2021 / Accepted: 28 January 2021 / Published: 30 January 2021
(This article belongs to the Special Issue Phase Change Materials for Thermal Energy Storage Applications)

Abstract

:
Detailed analyses of melting processes in phase change material (PCM) glazing units, changes of direct transmittance as well as investigation of refraction index were provided based on laboratory measurements. The main goal of the study was to determine the direct light transmittance versus time under constant solar radiation intensity and stable temperature of the surrounding air. The experiment was conducted on a triple glazed unit with one cavity filled with a paraffin RT21HC as a PCM. The unit was installed in a special holder and exposed to the radiation from an artificial sun. The vertical illuminance was measured by luxmeters and compared with a reference case to determine the direct light transmittance. The transmittance was determined for the whole period of measurements when some specific artefacts were identified and theoretically explained based on values of refractive indexes for paraffins in the solid and liquid state, and for a glass. The melting process of a PCM in a glass unit was identified as a complex one, with interreflections and refraction of light on semi layers characterized by a different physical states (solid, liquid or mushy). These optical phenomena caused nonuniformity in light transmittance, especially when the PCM is in a mushy state. It was revealed that light transmittance versus temperature cannot be treated as a linear function.

1. Introduction

Investigations into the energy performance of different transparent structures with phase change materials (PCMs) are a relatively new issue. Since the first publication by Ismail and Henriquez in 2002 [1] where the thermal effects were mainly considered, further investigations also concerned the overall analysis of PCM-window performance [2]. It should be stated that the optical properties of glazing elements with PCMs change considerably when the material melts or solidifies [3]. This allows classifying such components as a dynamic envelope system [4] with changeable transmissivity. An alternative solution that does not suffer from periodic non-transparency is a PCM-window concept developed by Lichołai and Musiał [5] and Hu et al. [6]. In any case of a transparent structure filled with a different kind of PCM (paraffins, fatty acids or hydrated salts) the component is non-translucent and low-transmittant when the material is in a solid state and highly transmittant when it is a liquid.
PCMs can be applied in different forms of transparent or translucent structures like glazing units [7] or shading devices [8]. The effect of such a glazing unit on energy performance and thermal comfort was investigated numerically [9] and experimentally [10] under different climatic conditions. Most of the studies were done for double-glazed windows [11,12] and only Shuhong et al. [13] investigated a triple-glazed window filled with a PCM which is highly recommended in a cold climates. The energy performance of PCMs was investigated for a standard window component [10], as well as for unusual applications such as thermotropic glazing [14] or double skin facades [15]. Moreover, some authors showed a beneficial effect on daylight provision [2] and visual comfort [16]. In some cases, the PCM glazing can be treated as an alternative to dynamic shading systems like exterior perforated louvers [17] or other types of blinds [18]. Internal blinds or curtains containing PCMs were further investigated by Silva et al. [19] and Weinlaeder et al. [20]. A wide range of analyses regarding the application of PCMs in external curtains or blinds were done by Bianco et al. [21] and Komerska et al. [22].
Among the many research studies concerning transparent PCM components the majority involved developing a mathematical model and a simulation analysis. In addition to the apparent heat capacity [23] and enthalpy [24] methods implemented in ESP-r and EnergyPlus, respectively, other tools were also refined taking into account heat transfer processes with latent heat accumulation [25]. Both methods were further developed and used for the simulation of transparent PCM structures [26,27] with additional consideration of the optical parameters. Furthermore, optical phenomena were considered using Radiance to analyse the daylight distribution and visual comfort parameters [28]. Regardless of the type of analysis performed, the detailed optical properties are necessary. Many studies were devoted to determining transmissivity and absorptivity in a fully solid and fully liquid states [29,30], including spectral and angular properties [31]. However, the optical properties in the intermediate conditions when the material is partly liquid and partly solid (mushy state) were not determined in the past. The main challenge of such analyses is the heterogeneous nature of the melting or solidification processes as well as spatial differences within the PCM-window unit regarding spatial thermal effects due to internal convection and non-uniform solar radiation on the window surface. In the case of rapid melting or solidification processes, the optical properties change quickly and the effect of an interim stage can be omitted. However, in many cases, especially when the PCM layer is relatively thick, the whole melting process may last even up to between ten and twenty hours. In that case, the PCM layer becomes divided into vertical splits. Thermally, the PCM layer in case of semi-melted state can be compared to the glazing with ultrathin partitions as presented e.g., in [32]. However, based on the results of our investigations the upper PCM layer melts faster than the lower part, and additionally, internal convection effects were noticed. A situation where a PCM melted slowly can be identified for periods of relatively low solar radiation and when the external air temperature was slightly below the melting point. Based on the results of a numerical analysis under cold climatic conditions [33], such a situation can occur in the period from September to May.
The general aim of this study is to identify the melting process of a PCM layer under specific, controlled boundary conditions. The experimental study led us to determine the direct light transmission of a triple glazed PCM window. Experiments were done using the originally developed set-up and an artificial sun as a radiation source. The change in the appearance of the tested samples was additionally recorded by a digital camera. The visual transmission was tested independently in the temperature range from solid to liquid when the PCM layer was located internally and externally to irradiation. It was identified that the PCM melts layer by layer from solid to mushy and further to a liquid part, however at the last step of the process, a solid-mushy core plate can be noticed in the middle part of the PCM. During the experiments, the individual stages of the melting process were also identified and described. It was confirmed that material peels off the glass, a phenomenon that was registered by the camera. In the most complex stage, the investigated component consists of three layers of glass, two layers of liquid PCM, one layer of mushy PCM and one layer of air. To confirm the correctness of the transmissivity changes over time measurements of refractive index [34] in a liquid state were done, and the results were compared with the index in a solid state [35]. Finally, the dynamics of melting process and transmission changes for triple glazed PCM windows under irradiance at the level of 500 and 1000 W/m2 were obtained experimentally. The time needed for the melting process to be completed depends on the irradiation and layer configuration. For 1000 W/m2 it was between 105 and 135 min, while for 500 W/m2 it was between 220 and 250 min.

2. Experimental Methods, Set-up Configuration and Assumptions

2.1. General Assumptions, Material Selection and Prototype Construction

The experimental study was divided into two stages. The first group of measurements was done on the window scale when the whole component was investigated using the originally developed experimental set-up. The second stage concerns sample scale measurements of refractive index using an Abbe refractometer (Krüss, Hamburg, Germany). Both experiments were done for the same type of paraffin (RT21HC). The refractive index measurements were provided to show the differences between the solid and liquid state of the PCM to compare it with the refractive index of the glass.
The experimental set-up developed to determine direct light transmission is described in Section 2.2. The triple glass component containing the PCM is described in Section 2.3, while general information about the refractometer measurements is provided in Section 3.3.

2.2. Experimental Test Stand and Equipement Used in Measurements

The experiment was done on a laboratory scale using our originally developed sample holder and an artificial sun as a radiation source. To avoid the effect of air temperature changes during measurement cycles the installation was located in the large volume (1680 m3), air-conditioned laboratory hall. This allowed us to ignore heat gains from the artificial sun and consider the temperature changes of the PCM sample as only due to solar radiation. The air temperature during the experiments was kept at a level of 21 °C. The hall was completely darkened, without any active sources of light or high temperature radiation. The configuration of the experimental stand is presented in Figure 1. The distance between the artificial sun and sample holder was adjusted to achieve the required vertical irradiation on the PCM glazing. Two distances were considered, providing irradiance at a level of 500 W/m2 and 1000 W/m2. Images of the sample from the outside were recorded by a digital camera throughout the experiment.

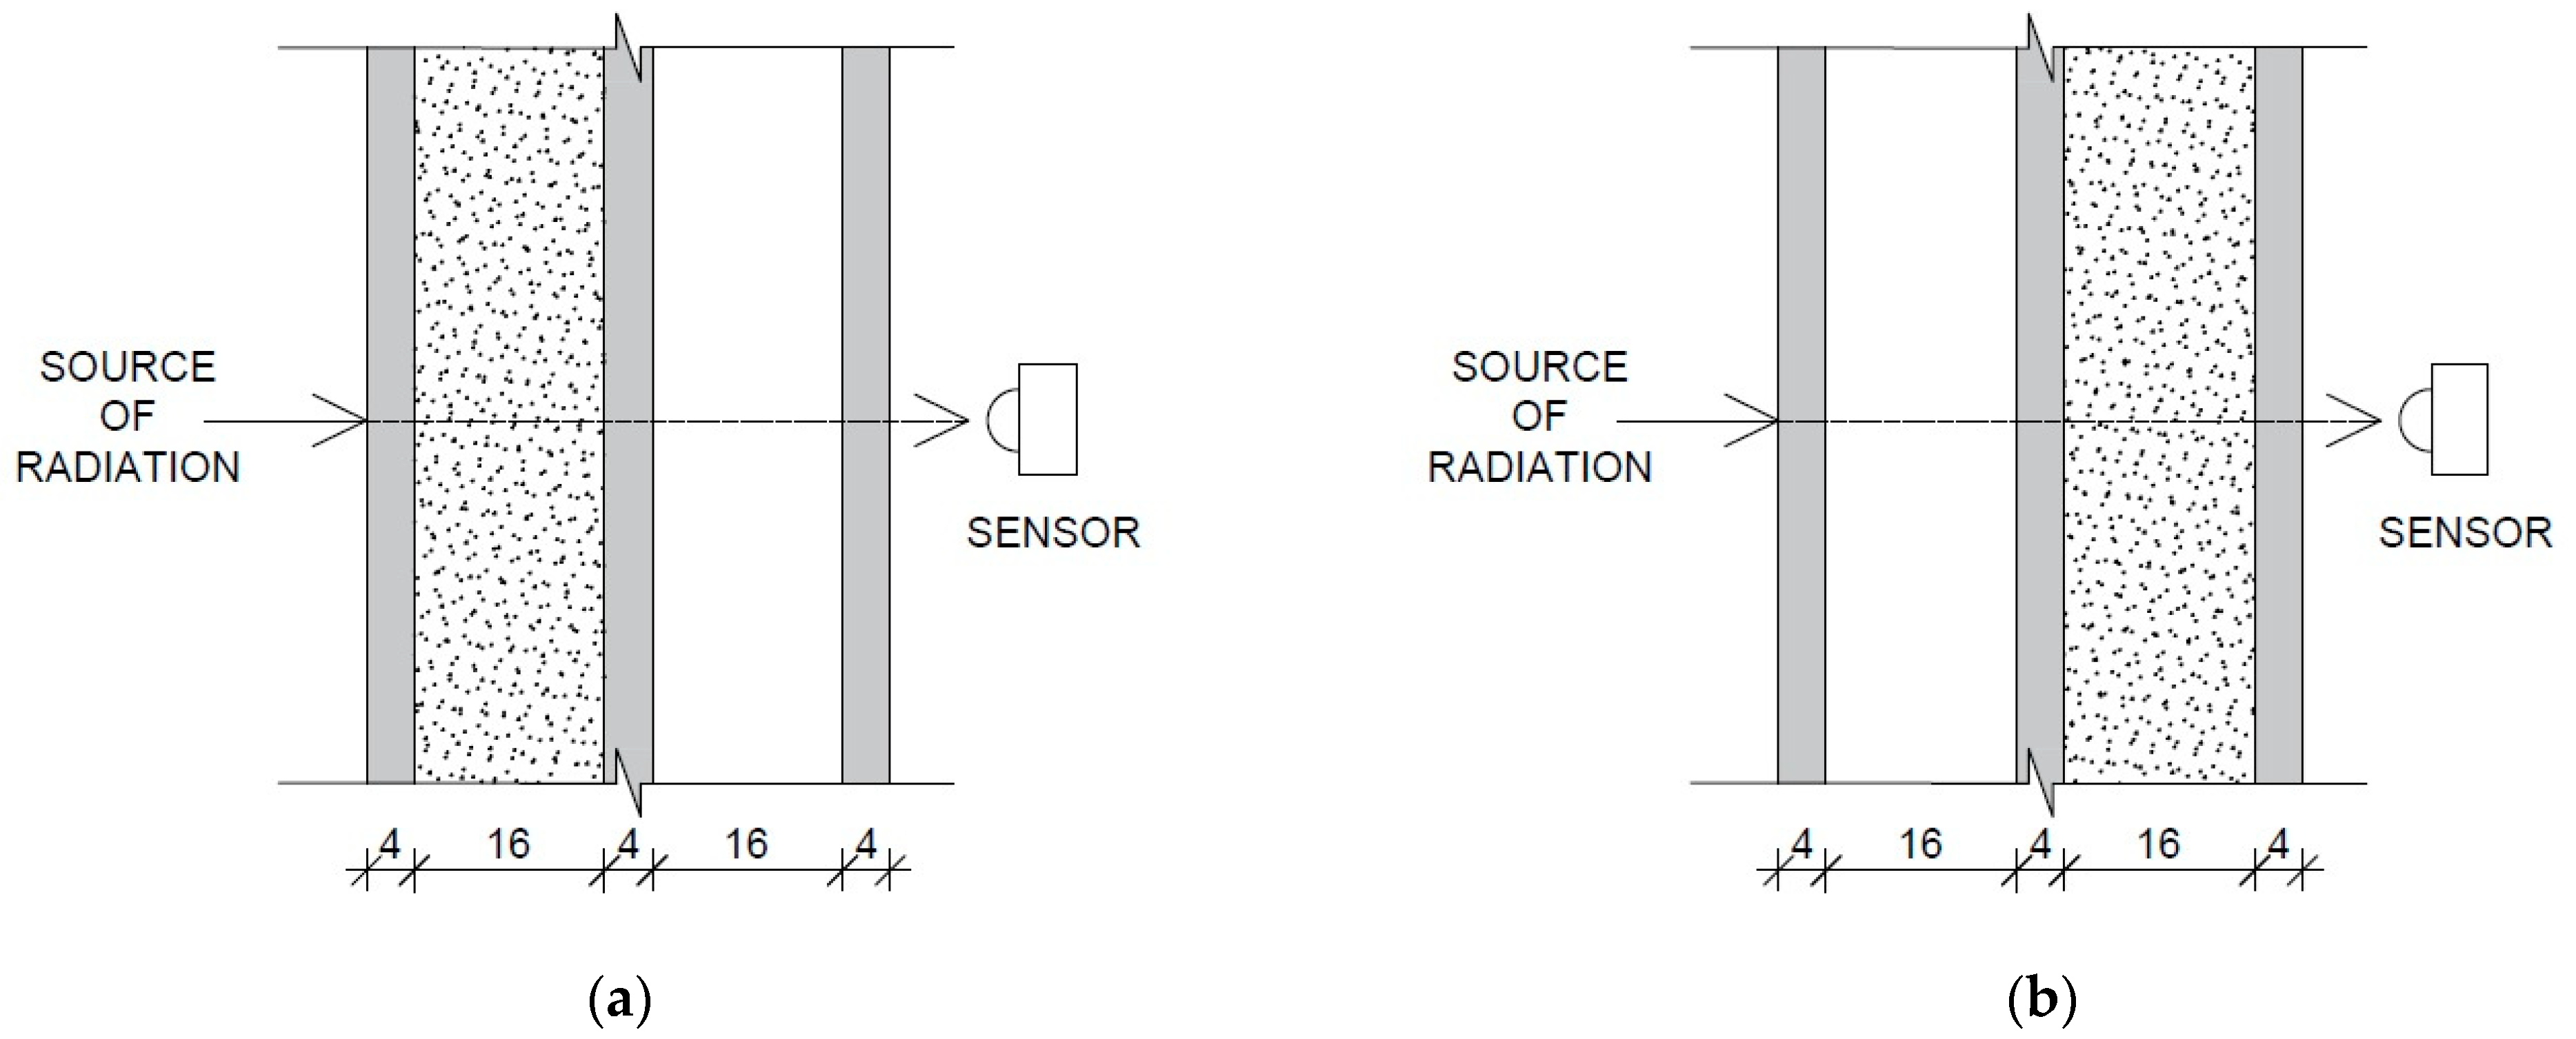
2.3. PCM-Glass Sample Construction and Configuration

The experiment was conducted using a prototype, triple glazed (two cavities) window. The glass component was manufactured according to the standard for window production but was produced in a smaller format than the standard units are. The thickness of the single layers is presented in Figure 2. The glass panes were framed with aluminium backing and a rubber gasket. One cavity was filled with argon gas. For the purposes of the experiments, the second cavity was filled with a phase change material-paraffin, RT21HC. Because of the thermal expansion, the upper level of PCM was 3 mm below the upper edge (Figure 3. The size of the sample was 15 cm × 15 cm. The thickness of PCM layer was 16 mm, while the glass layers were 4 mm each.
The PCM-window was tested in different configurations with respect to the radiation source (the artificial sun). For the first configuration (case A, Figure 2a), the cavity with the PCM was located on the radiation source side, while in the second case (case B, Figure 2b) the configuration was reversed. Both configurations were proposed based on the simulation analysis and numerical model presented in [26]. Case A is used for the cooling period when the additional PCM layer decreases the solar heat gains through the window by latent heat storage and re-radiates energy to the external environment. Case B can play the role of a solar collector with a storage layer closed to the adjacent room and is dedicated mostly for the heating season. For both cases, the reference radiation (500 and 1000 W/m2) was measured on the outer side (from the radiation source) of the glass pane.

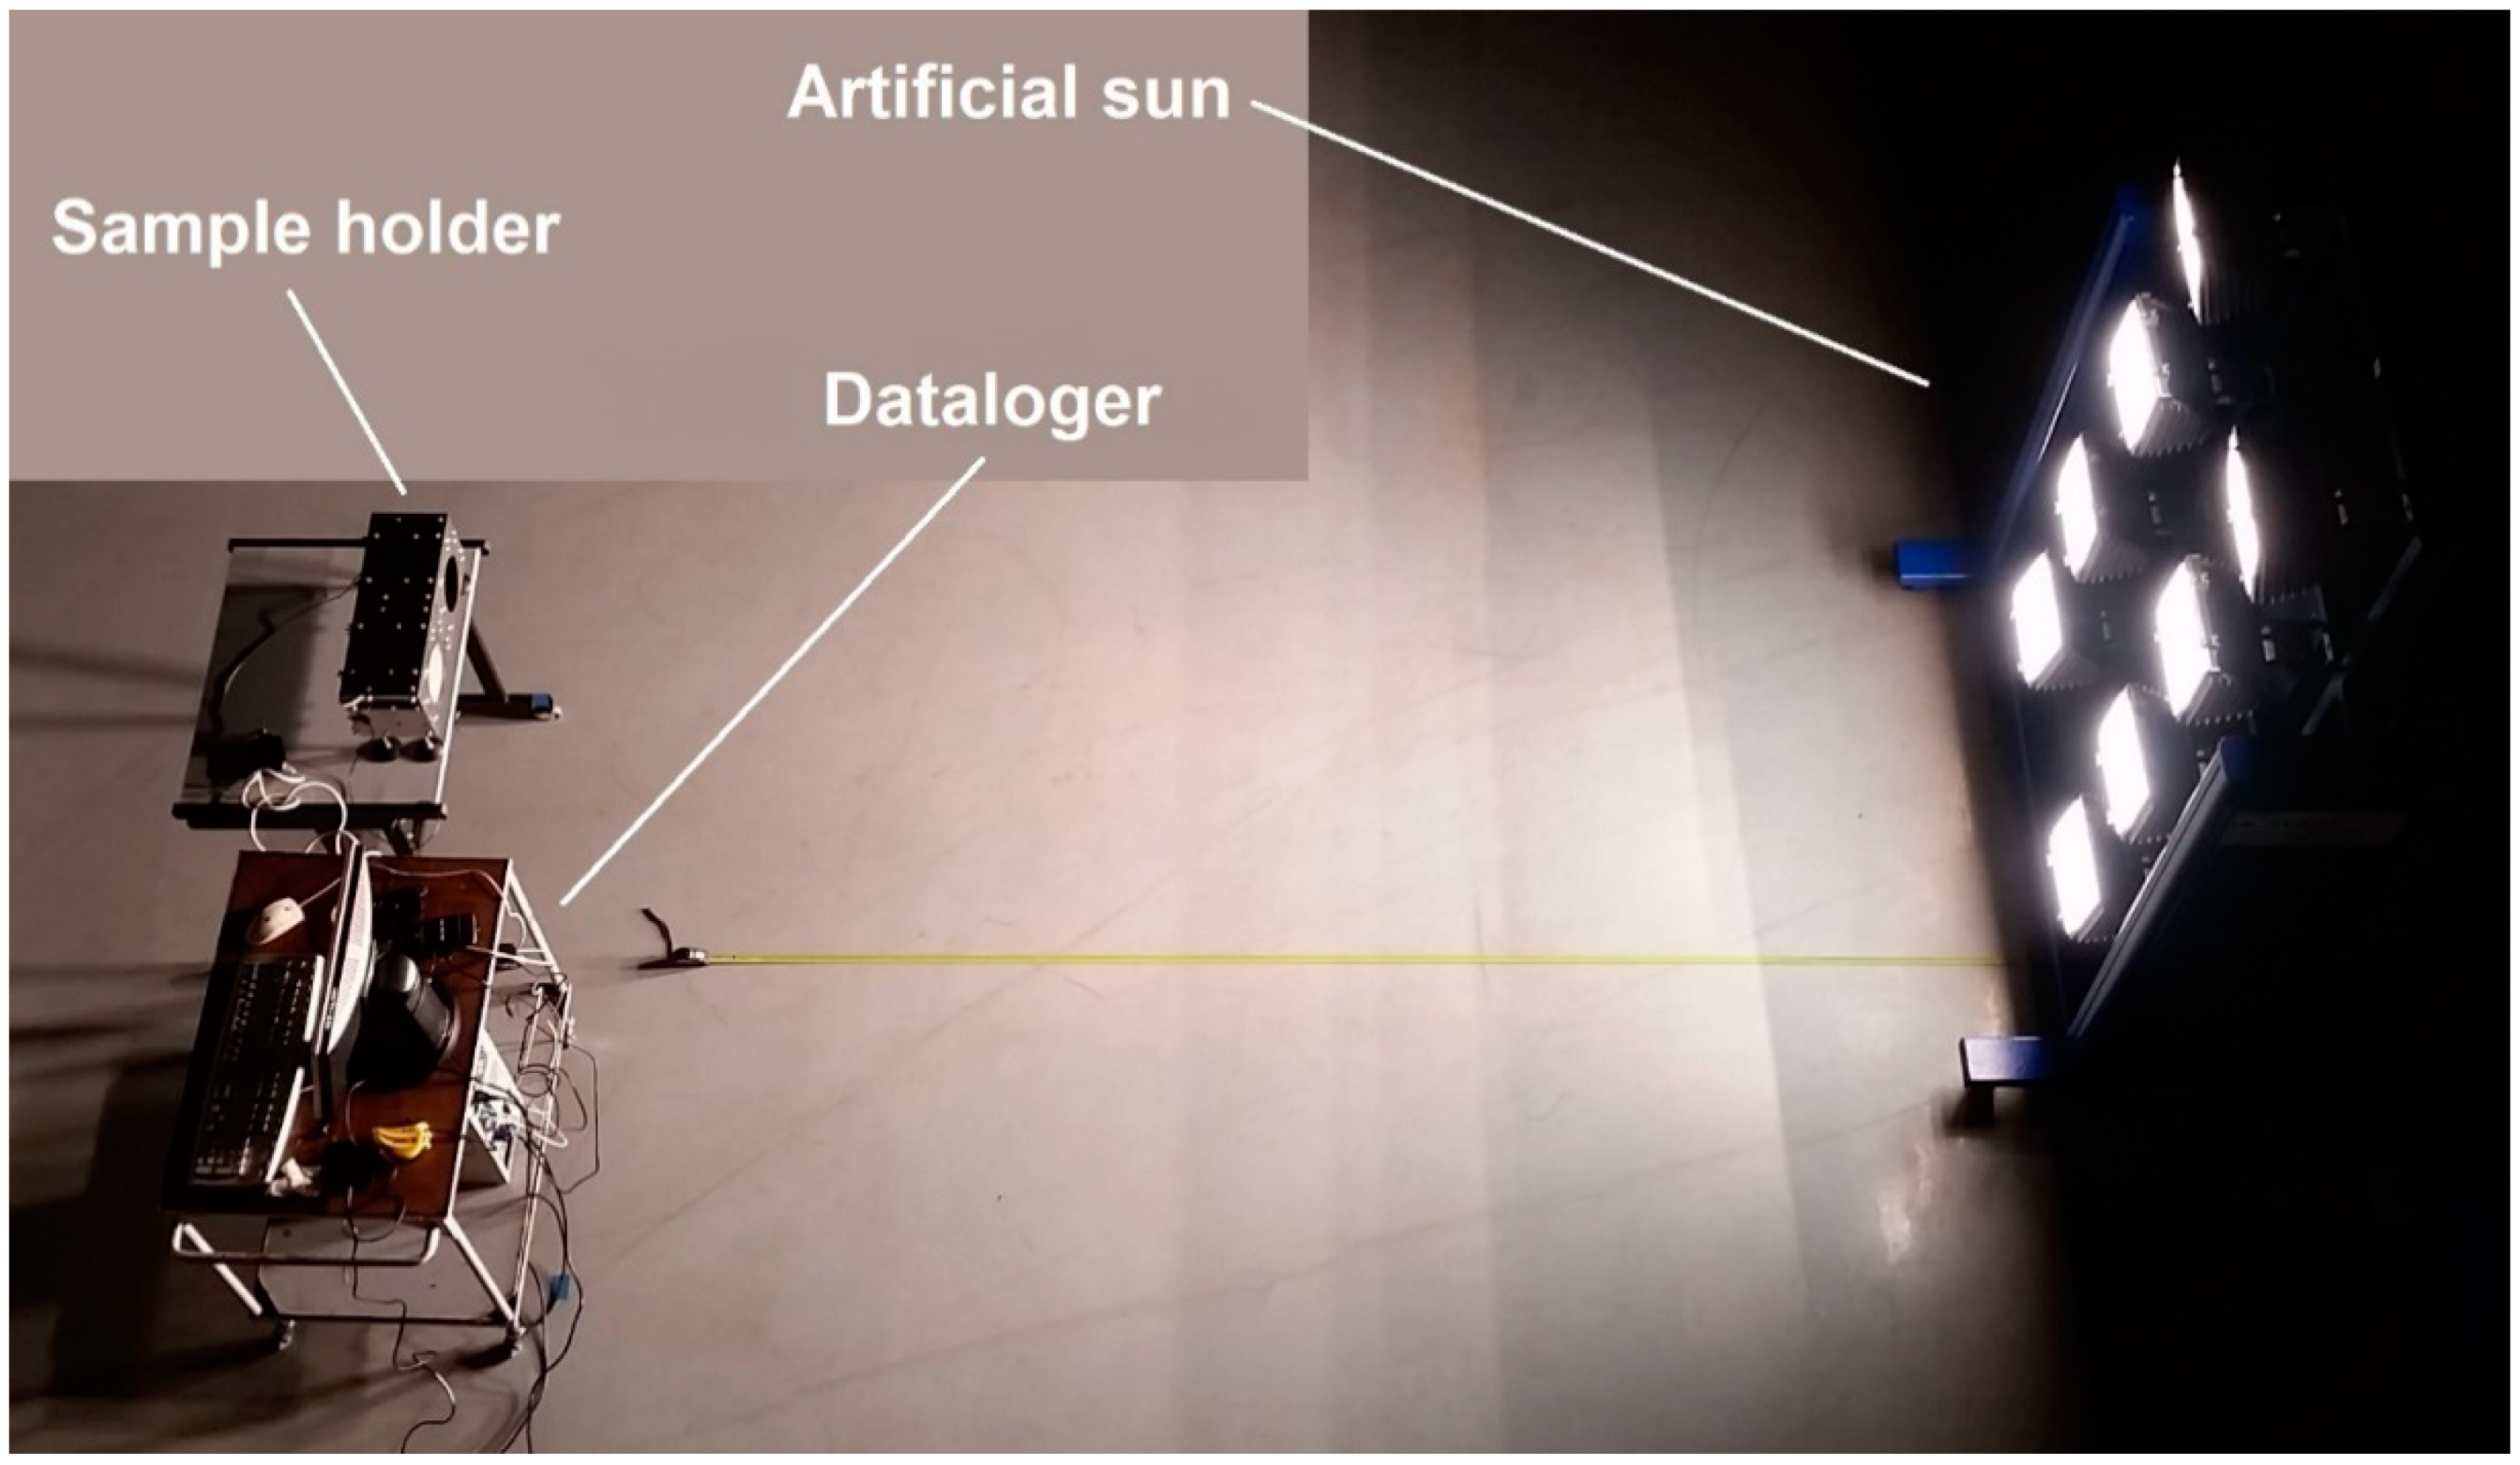
2.4. Small Scale Set-up, Type of Sensors, Artificial Sun

The experiment was conducted under radiation generated by an artificial sun. This light source enables experiments under stable and reproducible irradiation conditions. It comprises eight halogen lamps mounted in two vertical rows (Figure 1). The total power is 8 kW.
The experiments were conducted using two sensors simultaneously. One, covered, with the glass unit and the second one, a reference which was uncovered. One of the crucial issues was how to remove the boundary effect for both sensors. Therefore, we decided to develop and construct the special holder for the glass units and two sensors located in a vertical position. The two cells holder is presented in Figure 4. On the backside of the holder, it was possible to install two pyranometers or luxmeters. One of the sensors was covered with glass unit while the second one is fully exposed to radiation.
The following two sensors were used for calibrations and measurements:
-
LP PYRA 02 pyranometers (Hukseflux, Delft, Netherlands), with a measuring range from 0 to 2000 W/m2;
-
T-10 luxmeters (Konica-Minolta, Osaka, Japan) with a measuring range from 0.01 to 299900 lux.
Before measurements, both sensors were calibrated using a reference light source.

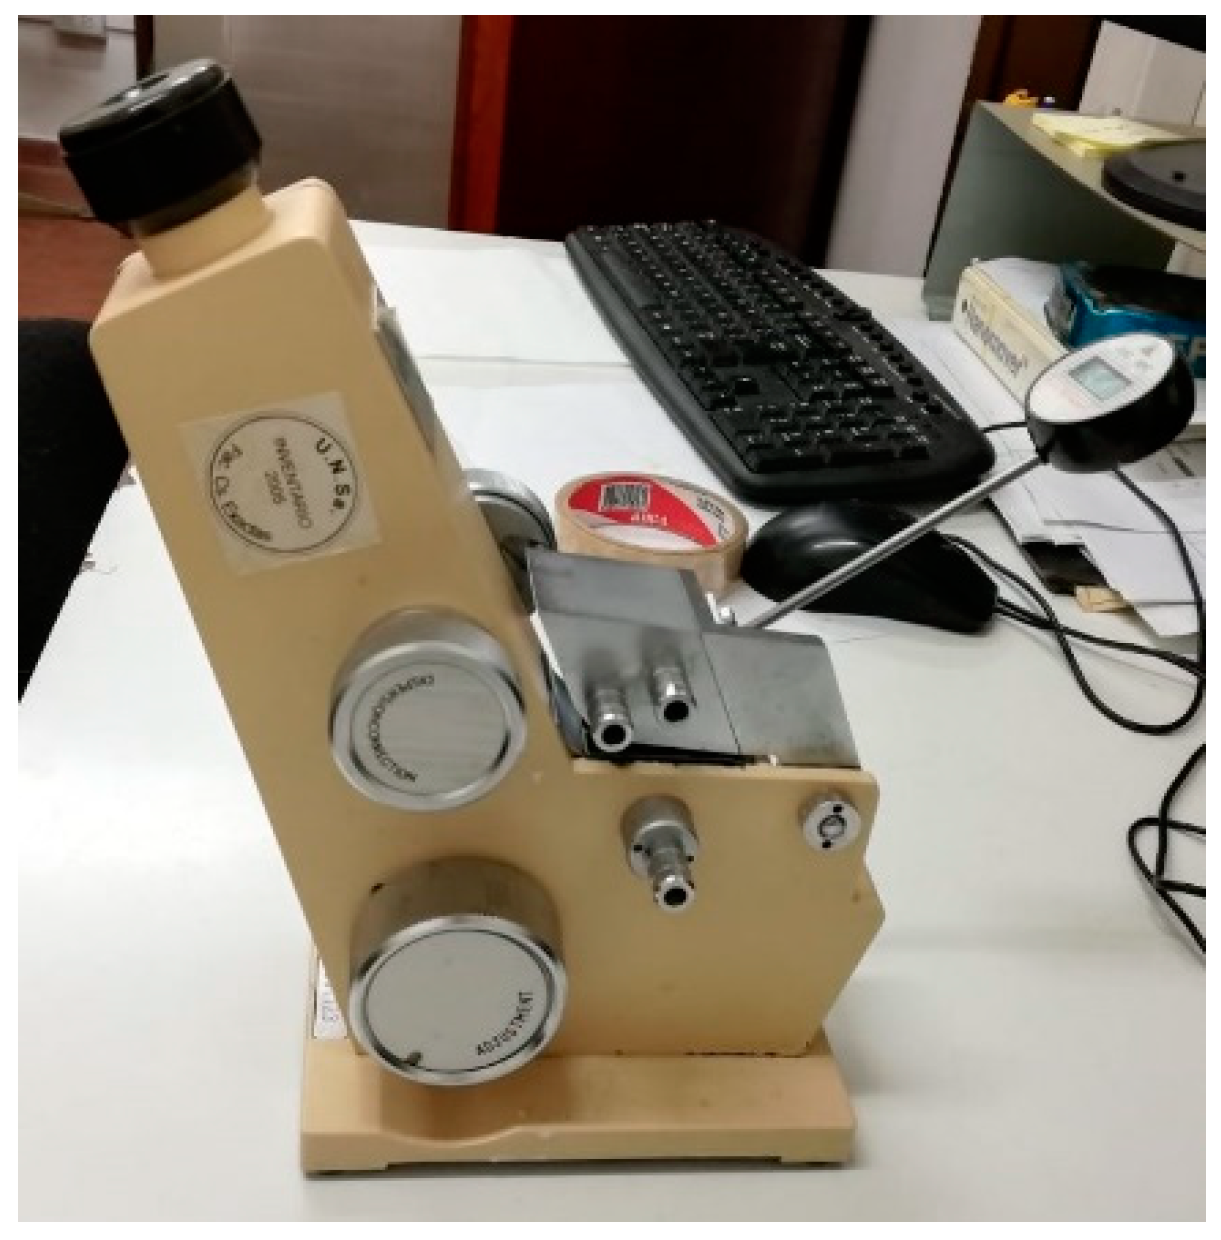
2.5. Refractive Index Measurment Technique

Additionally, the refractive index was investigated to confirm the observations recorded during the first stage of the experiment. Measurements were made by critical angle refractometry, using a Krüss model AR4 Abbe type refractometer (Figure 5), with a resolution of 0.00025 nD. The system temperature was controlled and stabilized by a Thermo Haake brand model DC30 heating circulator (Thermo Electric Corporation, Newington, CT, USA), equipped with a thermostatic bath with distilled water as circulating fluid. The water temperature at the entrance of the refractometer was measured with a digital thermometer, with an uncertainty of 0.2 °C (value obtained from its calibration using a model 9009 industrial calibrator, Hart Scientific, Newington, CT, USA).
Before the tests, the refractometer had been calibrated with distilled water, considering the temperature range to be used. Measurements were also made under monochromatic illumination in the sodium line (~589 nm), with the objective of contrasting the results corresponding to lighting with white light, achieving in all cases a high degree of coincidence (within the limits of resolution of the device). For measurements in the infrared region the methodology described in [34] was followed, under illumination with both an infrared LED (λ ~ 940 nm, σλ ~ 30 nm), and with a broad-spectrum infrared lamp (λ ~ 850 nm, σλ ~ 110 nm, reduced to λ > 900 nm by optical filtering).

3. Results

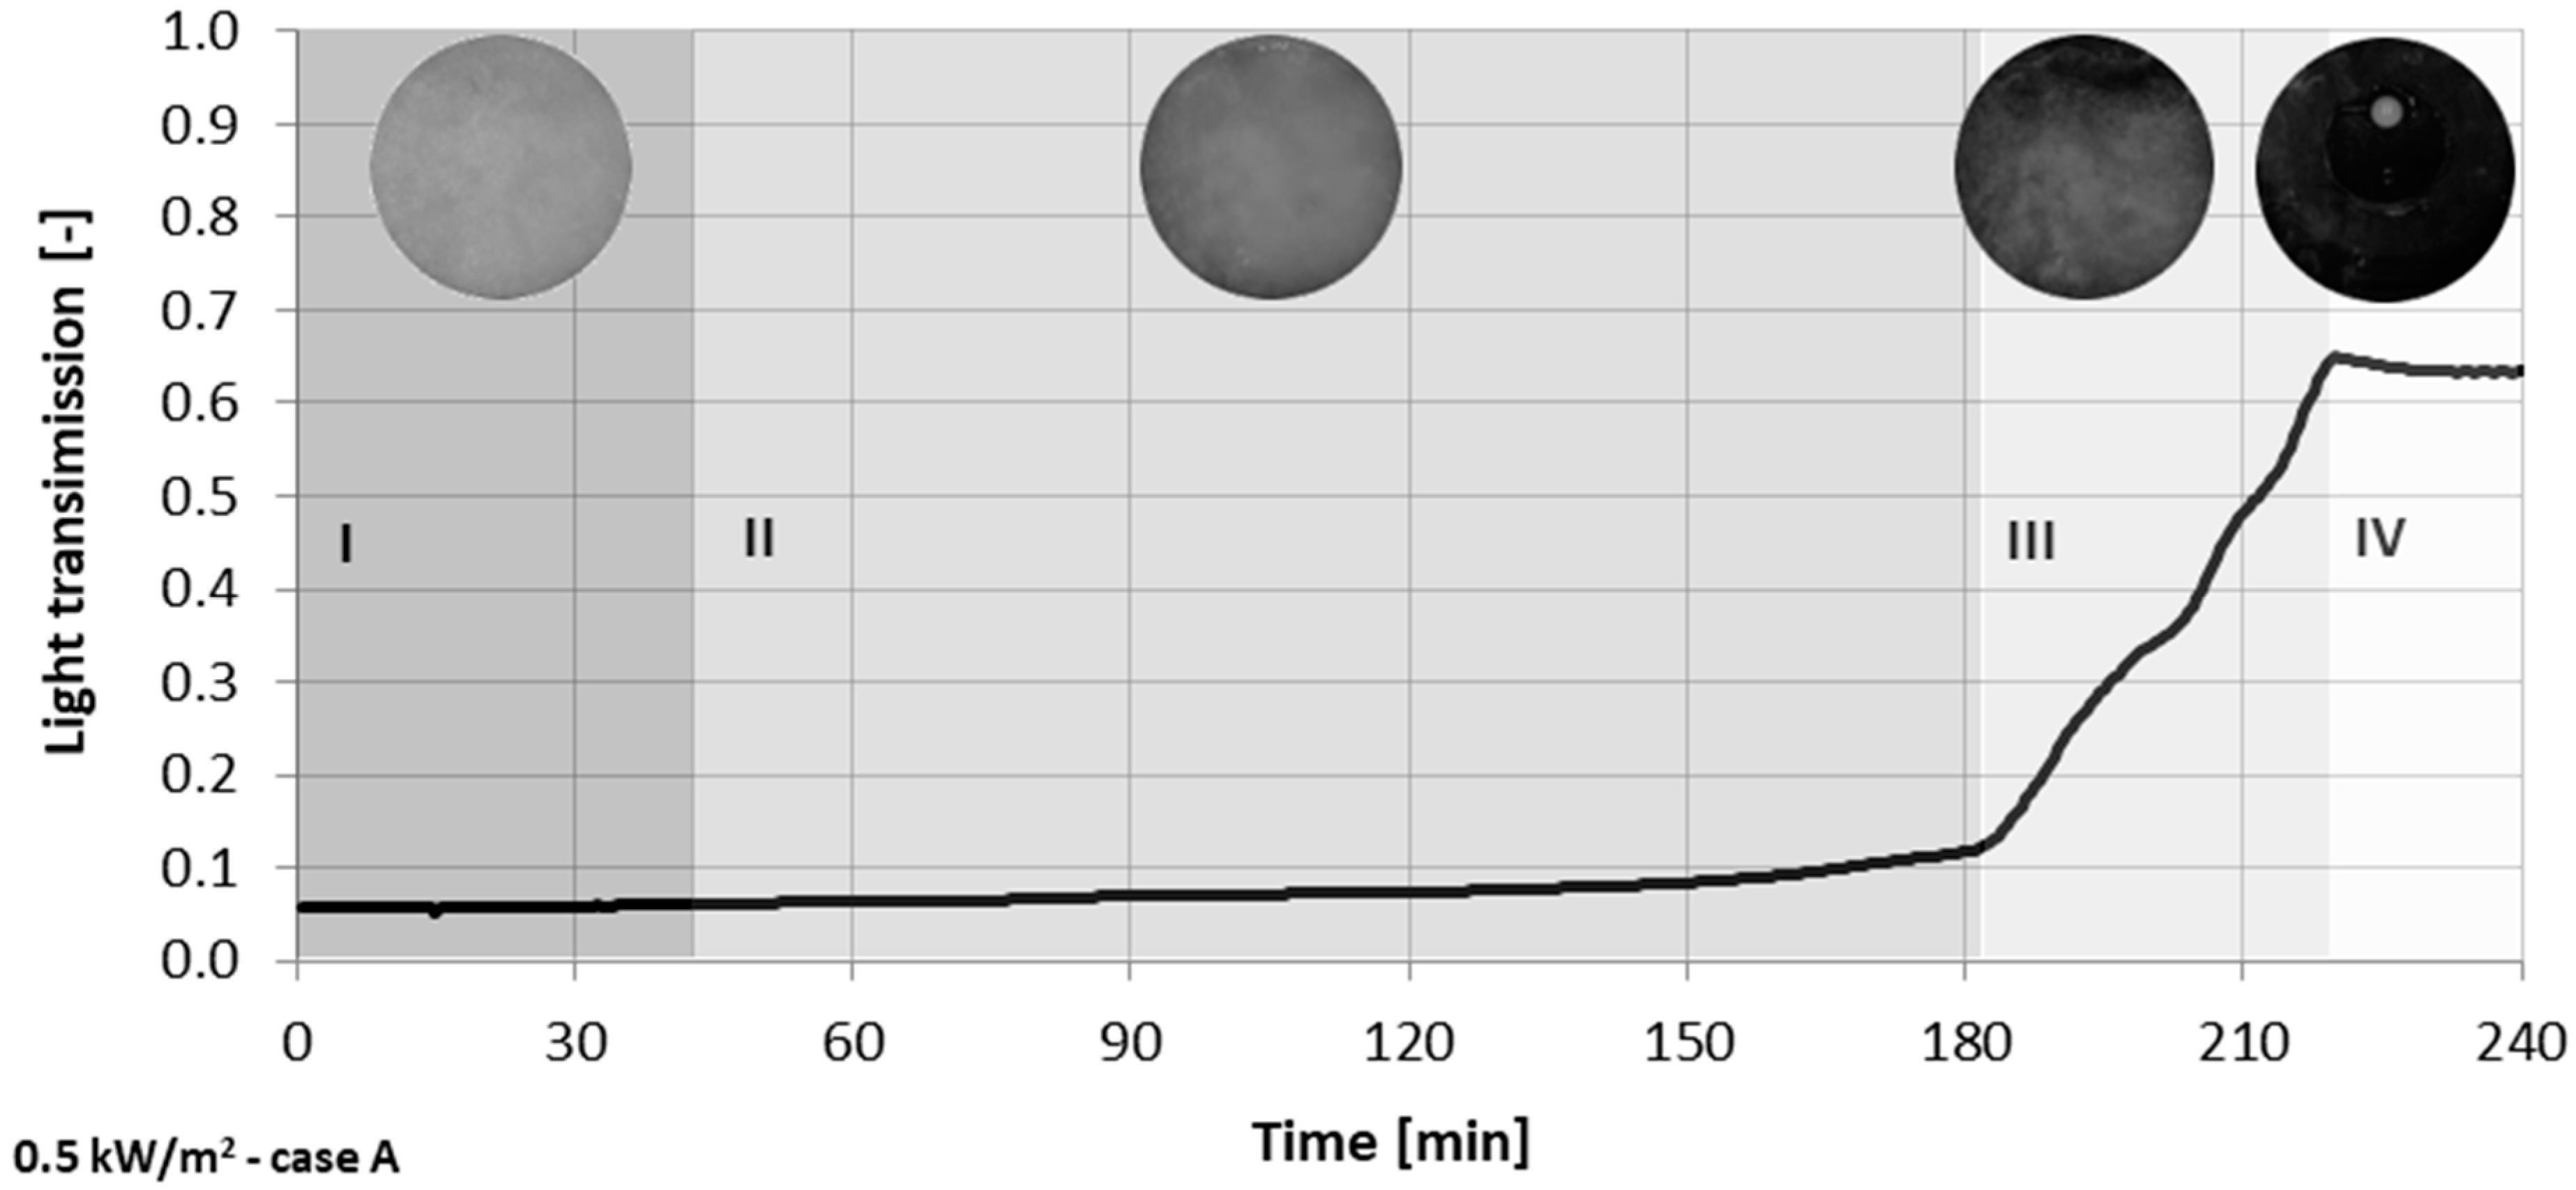
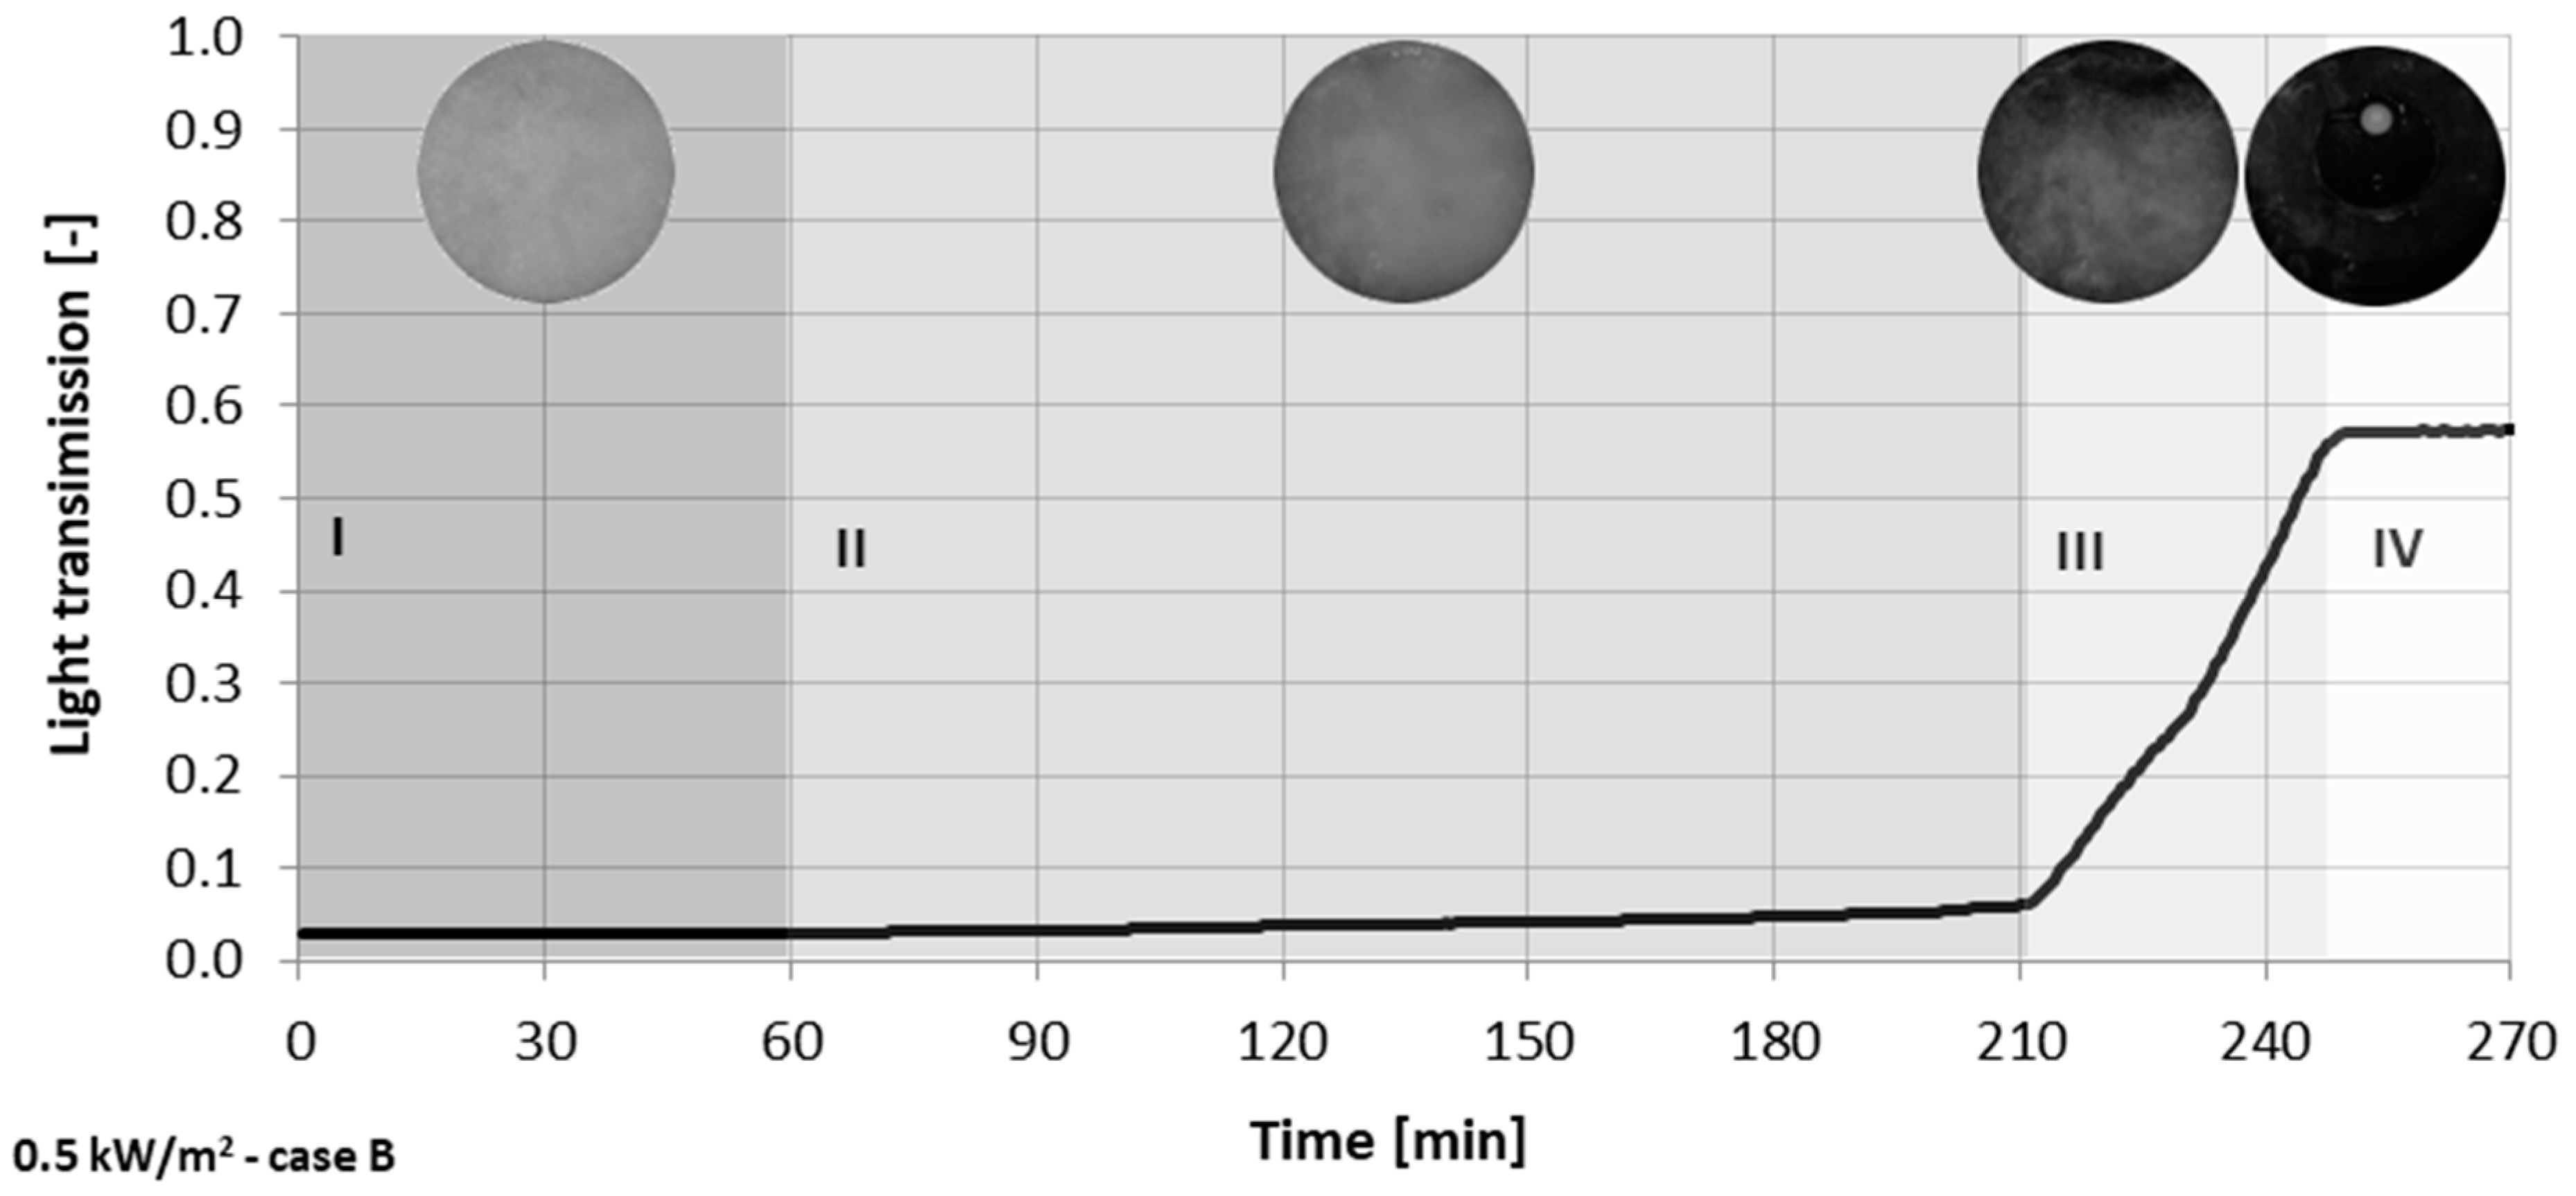
3.1. Dynamics of Melting Process

The following experimental procedure was proposed and executed. The glass unit was cooled down and kept at a constant temperature of 6 °C during 24 h before the experiments started. The artificial sun was turned on 10 min before the experiments to heat it up and stabilize the radiation flux. Irradiance and luminance were measured separately. The holder was at the distance of required irradiance. For the experiment, it was necessary to determine the distance between the sample and the source of radiation (the artificial sun). Using pyranometers two distances from the artificial sun to obtain the irradiance values of 1000 and 500 W/m2 were determined. The glazing sample was tested in two configurations of PCM layer versus radiation source, cases A and B (Figure 2).
The changes of direct light transmission under different irradiance (500 and 1000 W/m2) and two configurations of the glazing component (A and B) are presented in Figure 6. The individual interpretations for selected cases are presented in Figure 7, Figure 8, Figure 9 and Figure 10 including pictures of the glazing taken from outside to display the state of the PCM.

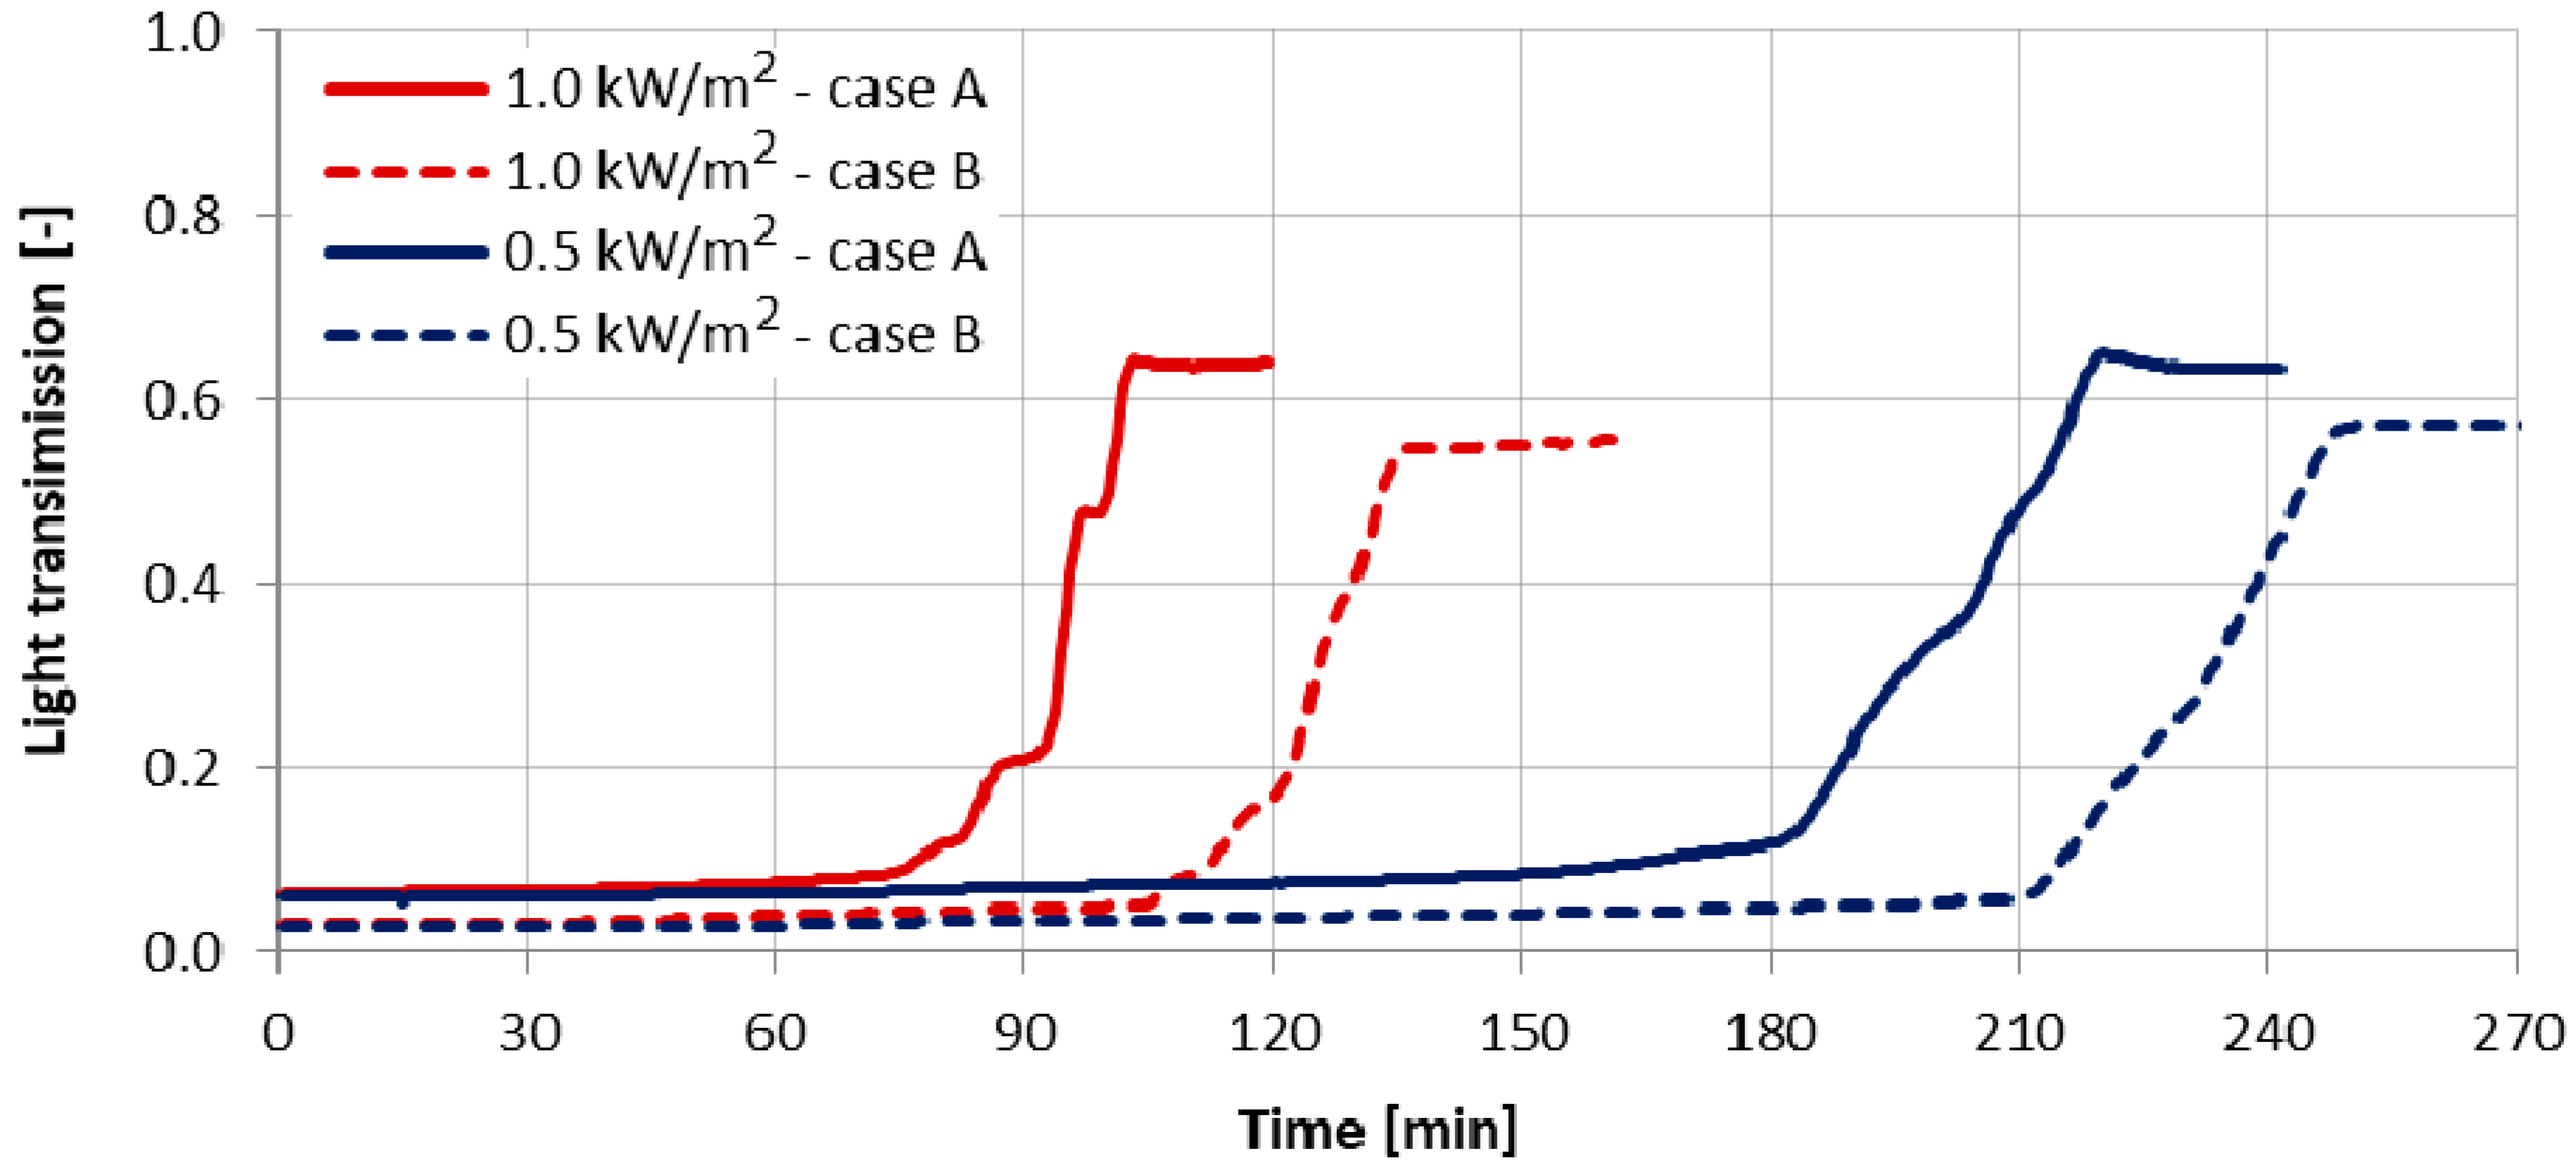
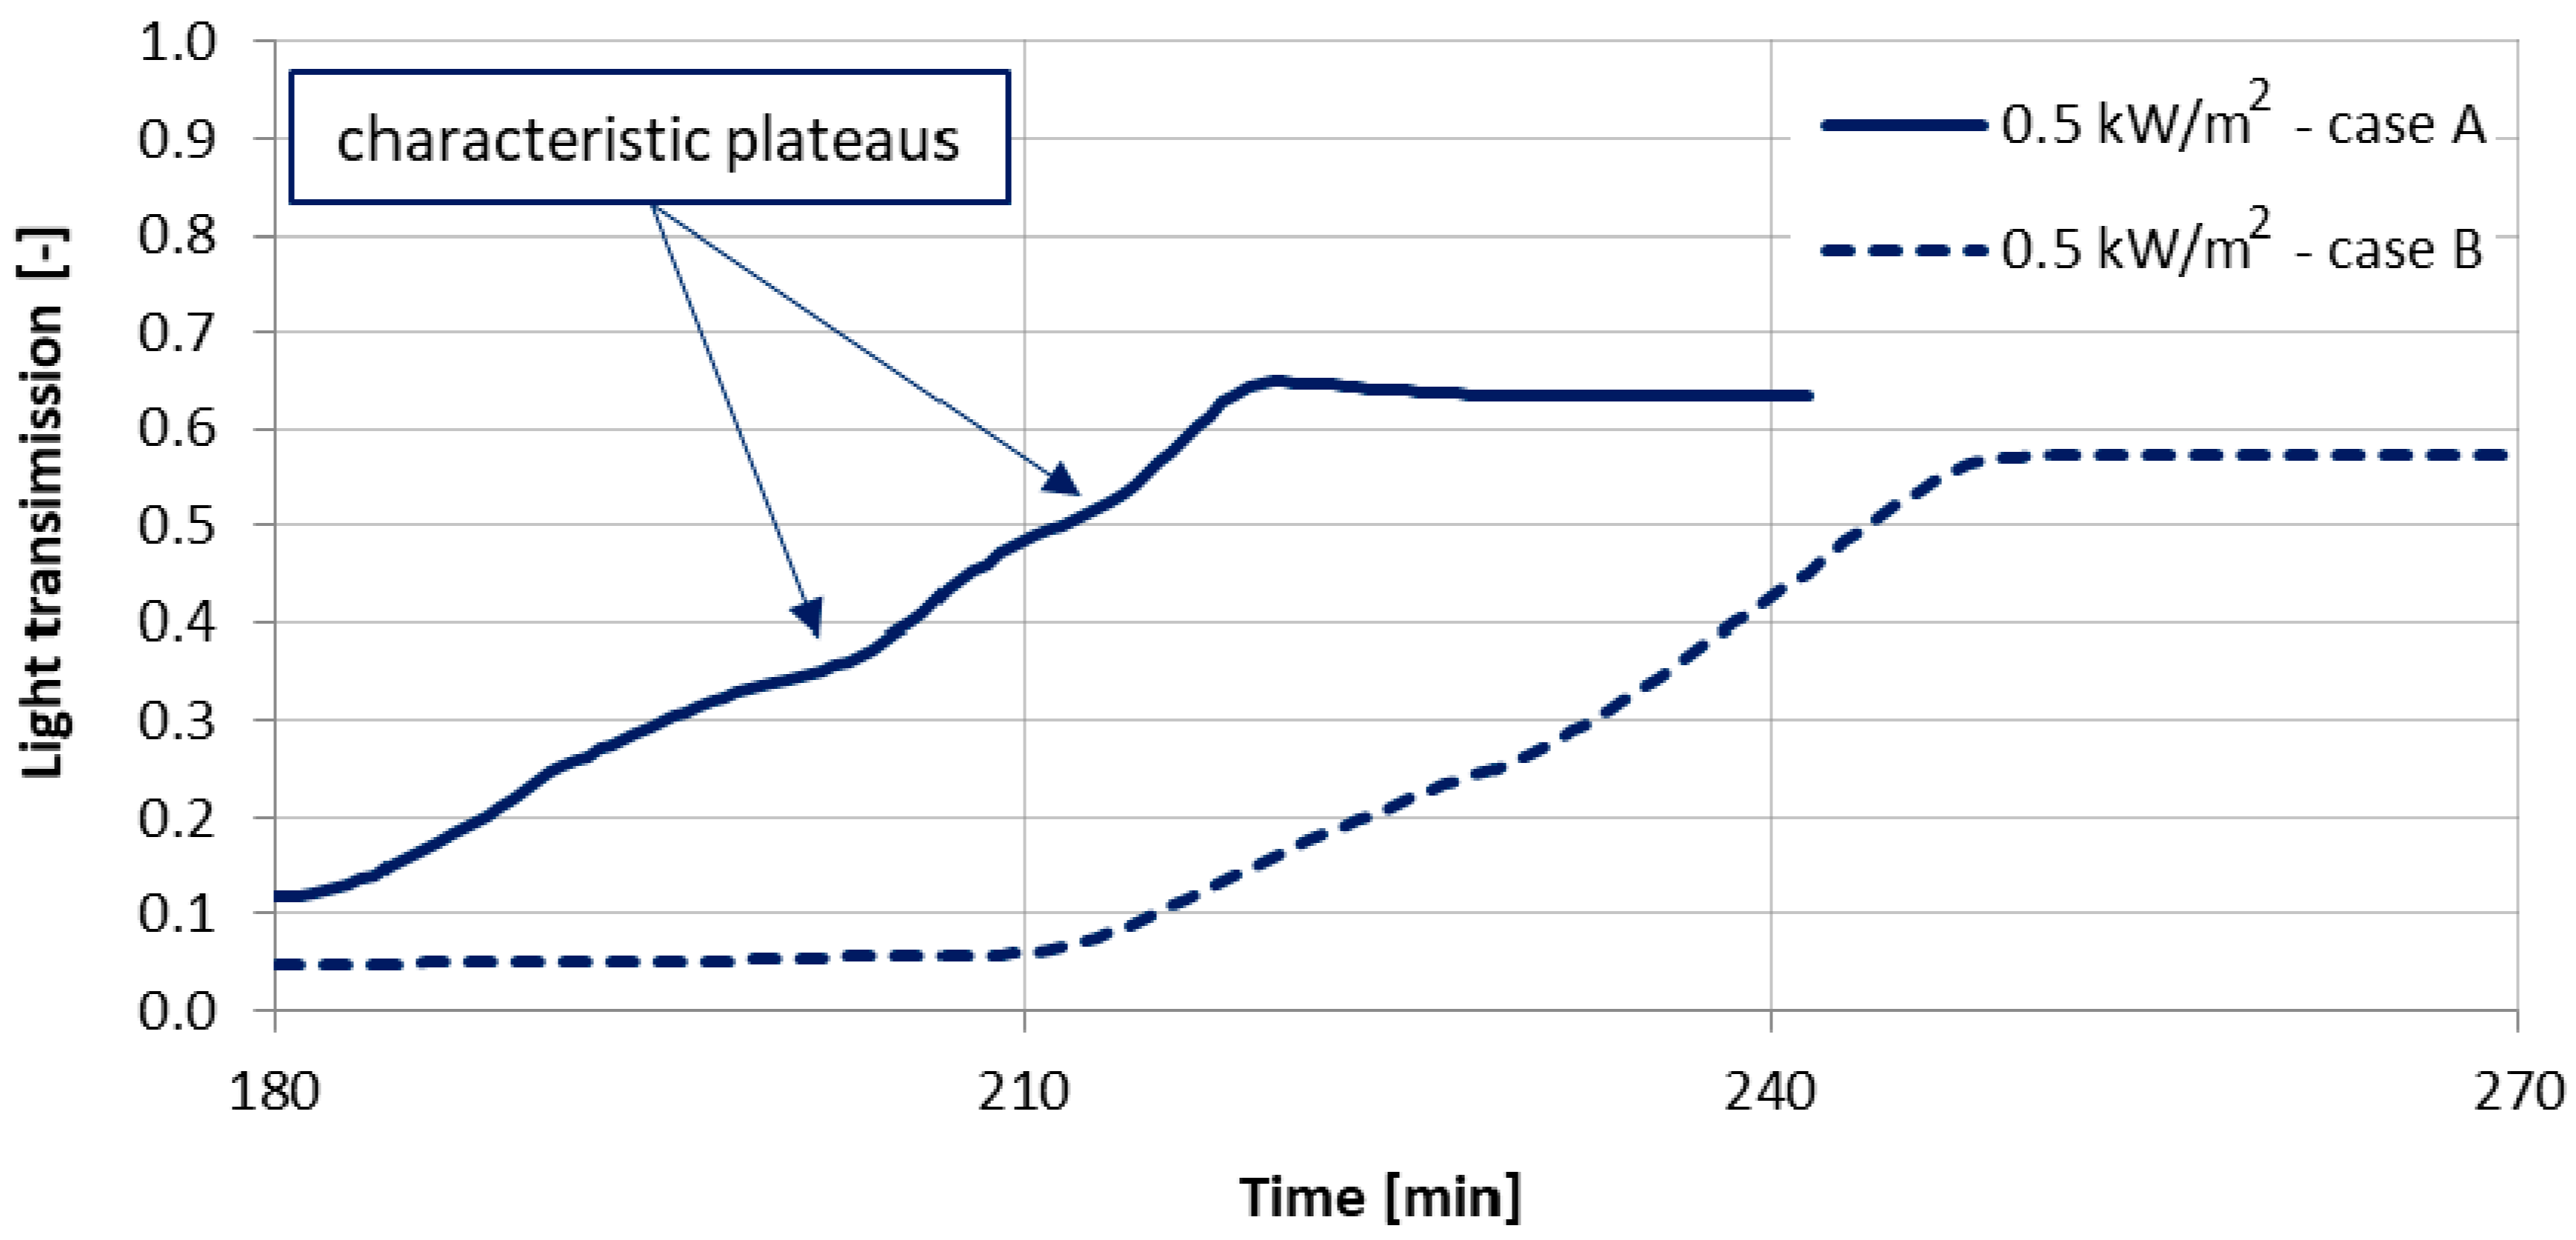
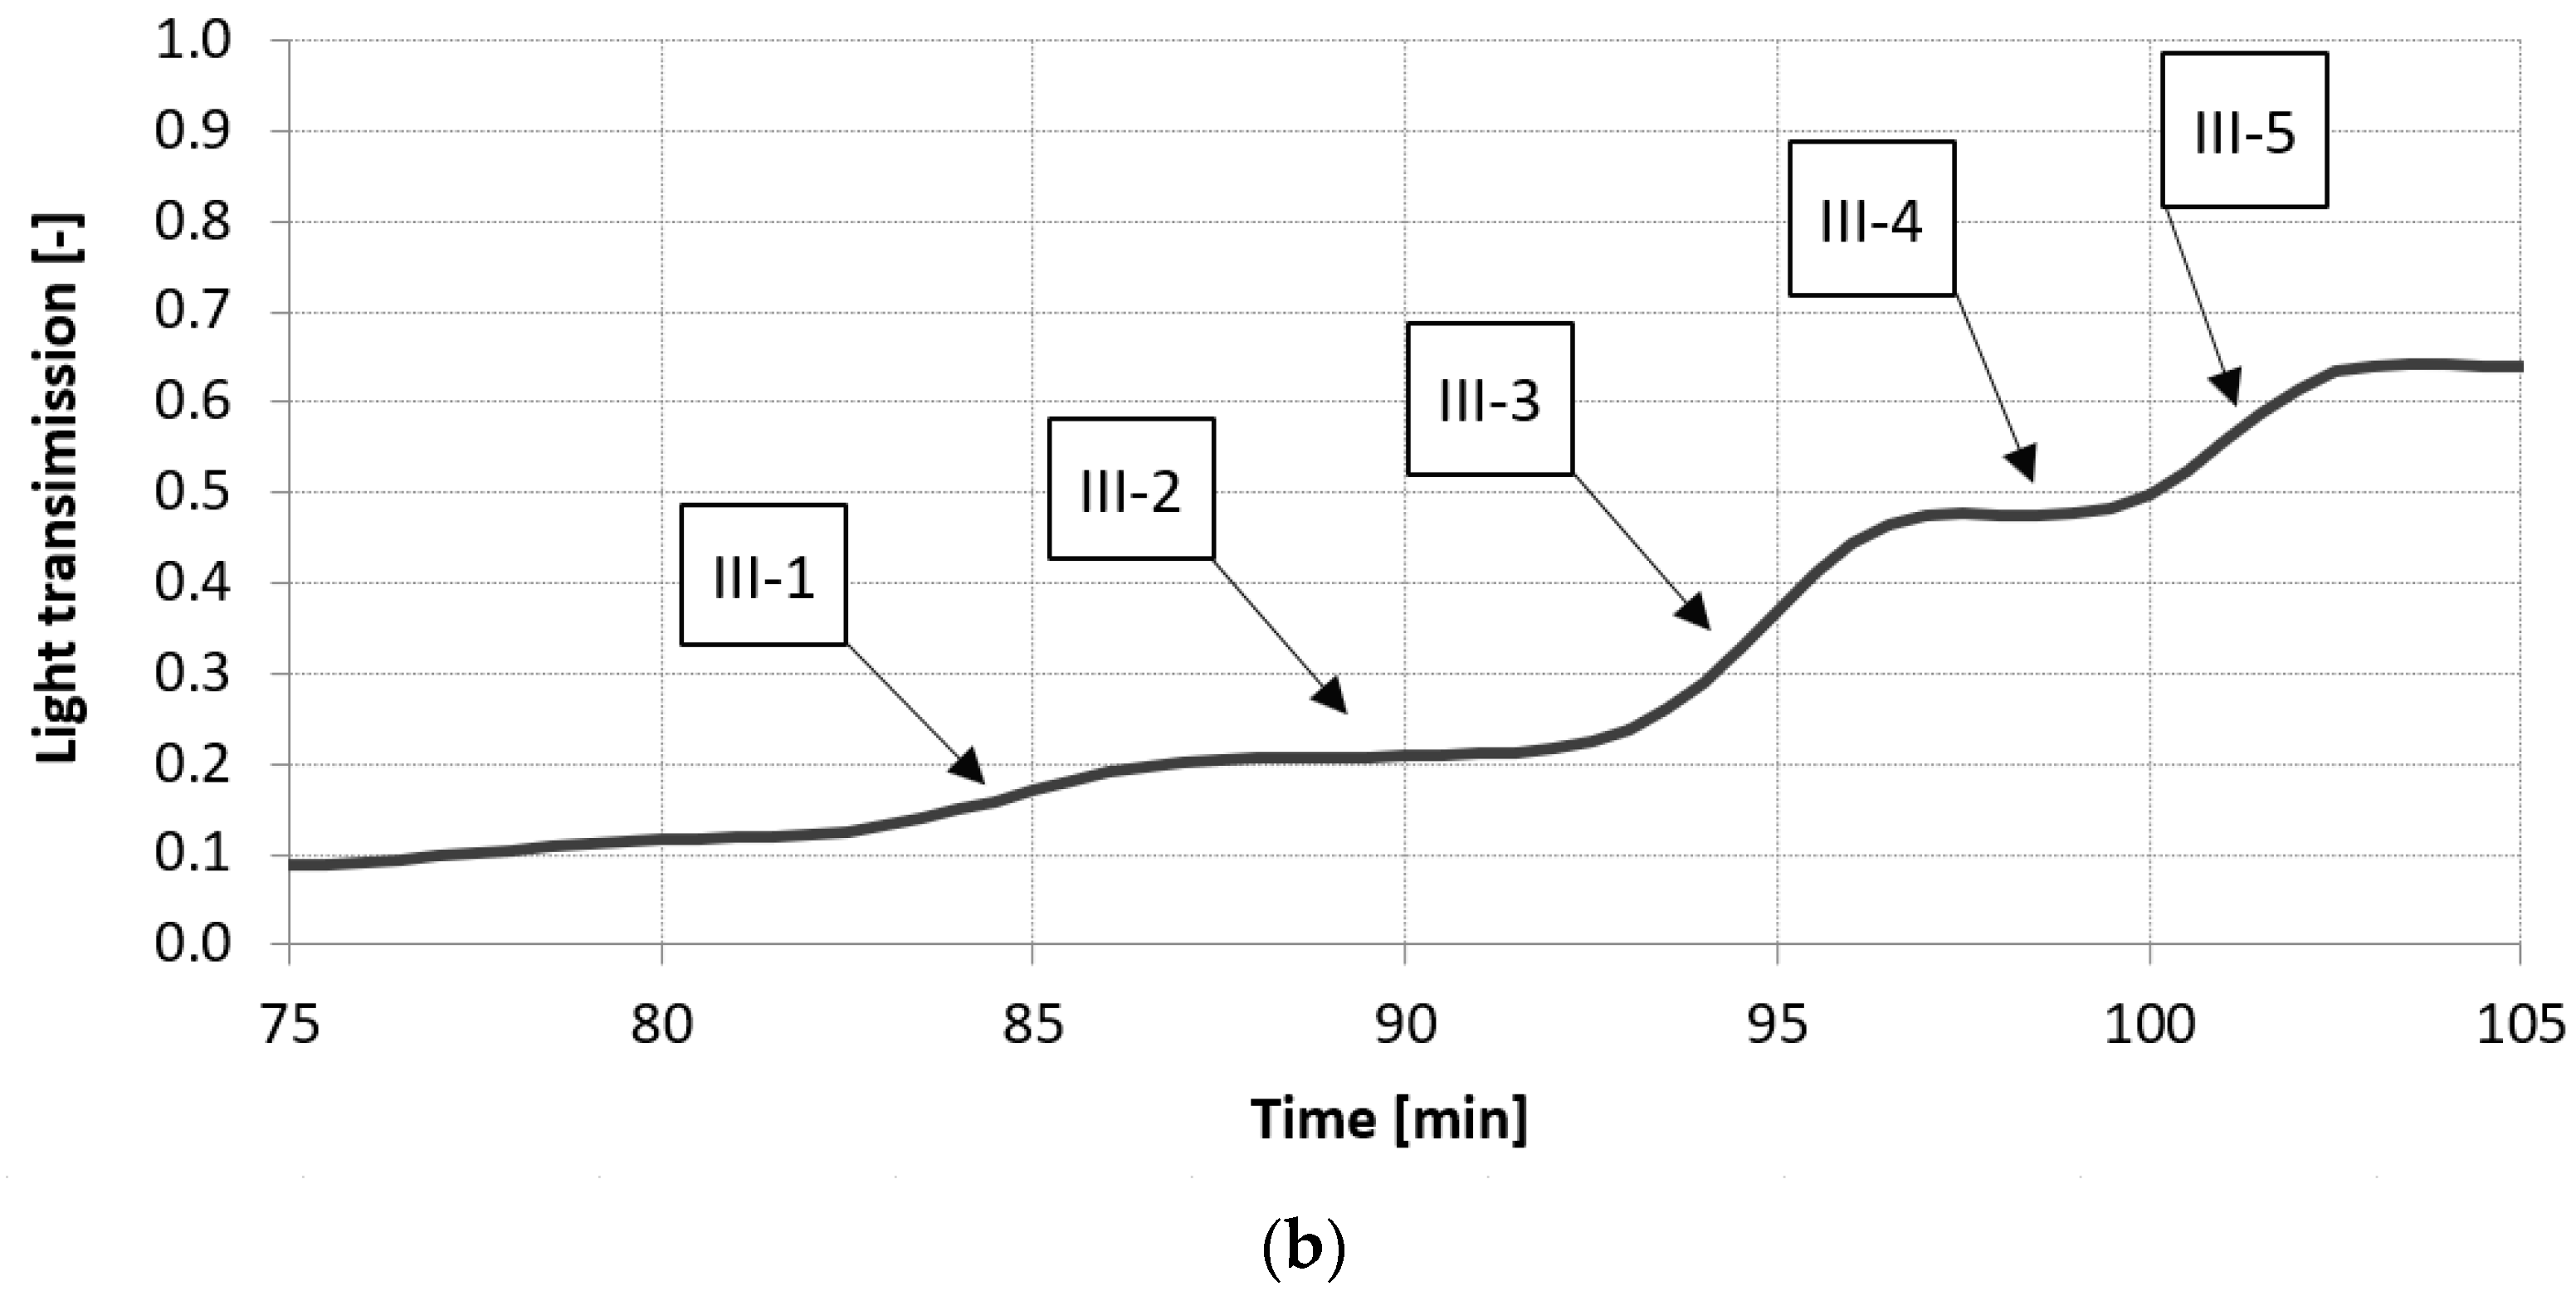
3.2. Direct Light Transmittance during Change of Phase

As it was expected that the phase change dynamics would differ during experiments regarding irradiance. Moreover, the behaviour of the PCM in the transition period depended on the glass configuration (case A and B). To better understand the complex optical/thermal process the results were combined and compared assuming the same time for beginning of melting. The results in the 500 W/m2 case are presented in Figure 11, while those for 1000 W/m2 can be seen in Figure 12. The “plateau” effect can be better seen in the case of higher melting intensity (irradiance of 1000 W/m2) and when the PCM layer is exposed to radiation (case A). In all cases, it can be observed that there is a slight delay in the increase of light transmittance despite the constant radiation intensity (the melting process is still ongoing). The further interpretation and explanation of obtained results are presented in the Results Interpretation and Discussion section below.

3.3. Refractive Index

For further investigation of the optical properties, additional experiments had to be done. It was expected that the characteristic “plateau” presented in Figure 11 and Figure 12, can result from refractive index differences between the glass and PCM in both phases. The same paraffin (RT21HC) was selected for the refractive index measurements. The sample was tested for five different temperatures above its melting point. The temperature was assumed as stabilized when the fluctuations were less than 0.1 °C. The refractive index values reported in the sodium (nD) and dispersion (nF-nC) line correspond to those obtained under white light illumination. The difference nF-nC is called the principal dispersion, where nF and nC are the refractive indexes at the 486.13 nm and 656.27 nm wavelengths, respectively. For all measurements, the dispersion was on the order of 10−3. In some cases, the measurements were repeated (due to observed trends) obtaining the same results (Figure 13). The average value of the refractive index in the liquid state is 1.434. The obtained values are coherent with the literature data (1.419–1.460) [35]. For the solid state the nD was assumed to be 1.531 at 10 °C [35]. The refractive index for glass is assumed to be 1.52 [36].

4. Results Interpretation and Discussion

The analysis of direct light transmission versus time (Figure 6) shows a considerable difference between the solid and liquid state. For the fully solid state of material at a temperature of 6 °C (when the material is highly diffuse), the direct transmittance is very low. When the PCM layer is in solid state the transmittance is 0.06, while when it is fully liquid (translucent) the value reaches 0.64. In both states the transmission depends on the location of the PCM layer with regards to the radiation source (case A – PCM exposed to solar radiation or B – PCM located in the inner cavity). The irradiance does not affect the direct transmittance results.
More detailed analysis of the direct light transmission as well as the state of the material (Figure 7, Figure 8, Figure 9 and Figure 10) shows the physical changes of the PCM layer. The melting process was divided into four periods labelled from I to IV. Period I is the period when the material is fully solid, highly scattering, and presents a light grey colour. In period II the material become mushy, which means the colour changes from light to dark grey but is still highly diffusive. The direct light transmittance during this period changes slightly and does not exceed 0.10. Period III is a time of non-uniform melting when the direct light transmittance is rising rapidly from the level of 0.1 to 0.64 (case A) and 0.57 (case B). Period IV represents a fully melted and highly translucent material. The length of the respective periods depends on the irradiance and PCM configuration within the glass pane. The length of period III (from mushy to fully liquid) is between 30 and 40 min. For all cases, the longest period is II when the material become mushy.
Further analysis of period III shows two characteristic “plateaus”, more intensive for a faster melting process (under 1000 W/m2 irradiance) than for a slower phase change (using 500 W/m2 irradiance). It was observed that the material does not melt in the whole volume but rather layer by layer. The first layer of liquid appears on the irradiated side, between the external glass and the PCM. This period represents the first plateau (Figure 11 and Figure 12). In the fast melting case (Figure 12) the difference in physical state between the mushy and liquid state is higher than in the slow melting case. In that stage, the PCM consists of two layers, liquid from the outside and the mushy form inside. This additional layer of liquid as well as differences in refractive index between the solid and liquid states cause addition interreflections and temporally inhibit the changes of transmittance. This effect is suppressed when the PCM is located from the inside (Case B, Figure 11). A similar process occurs on the inner side of the glass which can be identified as a second plateau in Figure 12. Additional observations of the PCM cavity during the experiments allowed us to identify the characteristics of the process, what are presented in the graphical form in Figure 14a. It should be emphasized that the materials melt intensively in the upper part of the layer due to internal convection. Period III was additionally divided into subperiods III-1 (no liquid state), III-2 & III-3 (liquid layer forms outside) and III-4 & III-5 (two liquid layers, from outside and inside). In Figure 14b the characteristic stages of PCM were identified for case A and the irradiance at the level of 1000 W/m2. The plateaus can be seen in periods II-2 and III-4 and can be explained as an effect of additional interreflections caused by a thin layer of liquids. The differences in refractive index between glass, liquid and solid paraffin additionally intensify these optical phenomena by changing the angle of incidence on the different interfaces.
A schematic representation of the refraction of light on place surfaces during the melting process is presented in Figure 15. The schemes represent the border between the glass and the paraffin without other layers of glazing and the cavity. The refraction indexes n1, n2 and n3 represent the glass, solid and liquid paraffin, respectively. Based on the experiments it can be noted that the presence of additional liquid layers causes bigger refraction, more interreflections, and finally a temporary decrease in the amount of transmitted light.
These effects can justify the temporal stabilization of the light transmission characteristic observed for periods III-2 and III-4. The intensity of the observed optical processes depends on the PCM layer location versus radiation source. In case, when the PCM is exposed to radiation (case A) the effect will be more visible in comparison to when the PCM layer is separated from the light source by an additional glass and cavity layer.
It should be emphasized that the experiments were carried out for a relatively small glazing unit and should be repeated for bigger size ones to confirm the obtained results. However, it is already evident from these experiments that the melting process of a PCM in the window is not a regular one. It can be even much more complicated in case when the PCM does not complete a full transformation cycle.

5. Conclusions

The results of the presented study show that the melting process of a PCM layer in a glazing unit exposed to solar irradiation is complex and dynamic. The analysis done under different irradiance conditions for triple glazed windows shows irregular changes in transmission during the whole process. Melting starts from solid to mushy when the material becomes slightly more transparent, then from mushy to semi-mushy and semi-liquid states. During that period, additional optical interreflections appears with characteristic plateaus which determine the light transmittance dynamics. Finally, the PCM achieves a fully liquid and translucent state. The overall dynamics of the melting process depend on the irradiance and the configuration of the PCM layer in a glazing component regarding radiation source. Some specific artefacts were identified and theoretically explained based on the refractive index values of paraffins in solid and liquid states, and for glass. These optical phenomena cause non-uniformity in the light transmittance, especially when the PCM is in a mushy state. For a more realistic, irregular and incomplete change of phase (when the glazing is exposed to the external environment), it is expected that PCM structure can be even more complicated. It should be highlighted that light transmittance versus temperature cannot be treated as a linear function.

Author Contributions

Conceptualization, D.H.; methodology—light transmittance, D.H., M.K.-S.; methodology—refractive index, J.F., P.R.D.; experimental set-up development and construction—light transmittance, M.K.-S.; formal analysis, D.H., M.K.-S., J.F., P.R.D.; investigation—light transmittance, D.H., M.K.-S., D.K., A.W.; investigation—refractive index, P.R.D., J.F.; data curation, M.K.-S. and P.R.D.; writing—original draft preparation, D.H., P.R.D.; writing—review and editing, M.K.-S., D.K., A.W.; visualization, D.H., D.K., A.W.; supervision, D.H., J.F. All authors have read and agreed to the published version of the manuscript.

Funding

This work was funded in a framework of ERANet-LAC Second Joint Call on Research and Innovation, by NCBiR (Poland) and MINCyT (Argentina) as part of a project entitled: Solar hybrid translucent component for thermal energy storage in buildings (acronym: SOLTREN, EraNet-LAC/SOLTREN/03/2017, ELAC2015/T06-0462). The APC was funded by Lodz University of Technology.

Institutional Review Board Statement

Not applicable.

Informed Consent Statement

Not applicable.

Data Availability Statement

Data sharing not applicable.

Acknowledgments

The authors would like to thank Marcin Piątkowski from Department of Environmental Engineering, Lodz University of Technology for his valuable advice and support during the experiment.

Conflicts of Interest

The authors declare no conflict of interest. The funders had no role in the design of the study; in the collection, analyses, or interpretation of data; in the writing of the manuscript, or in the decision to publish the results.

References

  1. Ismail, K.A.R.; Henríquez, J.R. Parametric study on composite and PCM glass systems. Energy Convers. Manag. 2002, 43, 973–993. [Google Scholar] [CrossRef]
  2. Weinläder, H.; Beck, A.; Fricke, J. PCM-facade-panel for daylighting and room heating. Sol. Energy 2005, 78, 177–186. [Google Scholar] [CrossRef]
  3. Komerska, A.; Ksionek, D.; Rosinski, M. Determination of the solar transmittance for the translucent shutter with PCM in liquid and solid state. E3S Web Conf. 2017, 22, 84. [Google Scholar] [CrossRef] [Green Version]
  4. Zhong, K.; Li, S.; Zhou, Y.; Zhang, X. Dynamic heat transfer characteristics of PCM-filled glass window and hollow glass window. Huagong Xuebao/CIESC J. 2014, 65, 114–123. [Google Scholar]
  5. Lichołai, L.; Musiał, M. Experimental analysis of the function of a window with a phase change heat accumulator. Materials 2020, 13, 3647. [Google Scholar] [CrossRef]
  6. Hu, Y.; Heiselberg, P.K.; Guo, R. Ventilation cooling/heating performance of a PCM enhanced ventilated window-an experimental study. Energy Build. 2020, 214, 109903. [Google Scholar] [CrossRef]
  7. Liu, C.; Wu, Y.; Li, D.; Ma, T.; Hussein, A.K.; Zhou, Y. Investigation of thermal and optical performance of a phase change material–filled double-glazing unit. J. Build. Phys. 2018, 42, 99–119. [Google Scholar] [CrossRef]
  8. Silva, T.; Vicente, R.; Rodrigues, F. Literature review on the use of phase change materials in glazing and shading solutions. Renew. Sustain. Energy Rev. 2016, 53, 515–535. [Google Scholar] [CrossRef]
  9. Liu, C.; Wu, Y.; Li, D.; Zhou, Y.; Wang, Z.; Liu, X. Effect of PCM thickness and melting temperature on thermal performance of double glazing units. J. Build. Eng. 2017, 11, 87–95. [Google Scholar] [CrossRef] [Green Version]
  10. Goia, F.; Perino, M.; Serra, V. Experimental analysis of the energy performance of a full-scale PCM glazing prototype. Sol. Energy 2014, 100, 217–233. [Google Scholar] [CrossRef]
  11. Li, D.; Li, Z.; Zheng, Y.; Liu, C.; Hussein, A.K.; Liu, X. Thermal performance of a PCM-filled double-glazing unit with different thermophysical parameters of PCM. Sol. Energy 2016, 133, 207–220. [Google Scholar] [CrossRef] [Green Version]
  12. Gowreesunker, B.L.; Stankovic, S.B.; Tassou, S.A.; Kyriacou, P.A. Experimental and numerical investigations of the optical and thermal aspects of a PCM-glazed unit. Energy Build. 2013, 61, 239–249. [Google Scholar] [CrossRef] [Green Version]
  13. Li, S.; Zou, K.; Sun, G.; Zhang, X. Simulation research on the dynamic thermal performance of a novel triple-glazed window filled with PCM. Sustain. Cities Soc. 2018, 40, 266–273. [Google Scholar] [CrossRef]
  14. Goia, F.; Bianco, L.; Cascone, Y.; Perino, M.; Serra, V. Experimental analysis of an advanced dynamic glazing prototype integrating PCM and thermotropic layers. Energy Procedia 2014, 48, 1272–1281. [Google Scholar] [CrossRef] [Green Version]
  15. de Gracia, A.; Navarro, L.; Castell, A.; Cabeza, L.F. Energy performance of a ventilated double skin facade with PCM under different climates. Energy Build. 2015, 91, 37–42. [Google Scholar] [CrossRef] [Green Version]
  16. Giovannini, L.; Goia, F.; Lo Verso, V.R.M.; Serra, V. A comparative analysis of the visual comfort performance between a PCM glazing and a conventional selective double glazed unit. Sustainability 2018, 10, 3579. [Google Scholar] [CrossRef] [Green Version]
  17. Vera, S.; Bustamante, W.; Molina, G.; Uribe, D. A flexible and time-efficient schedule-based communication tool for integrated lighting and thermal simulations of spaces with controlled artificial lighting and complex fenestration systems. J. Build. Perform. Simul. 2016, 9, 382–396. [Google Scholar] [CrossRef]
  18. Al-Masrani, S.M.; Al-Obaidi, K.M. Dynamic shading systems: A review of design parameters, platforms and evaluation strategies. Autom. Constr. 2019, 102, 195–216. [Google Scholar] [CrossRef] [Green Version]
  19. Silva, T.; Vicente, R.; Amaral, C.; Figueiredo, A. Thermal performance of a window shutter containing PCM: Numerical validation and experimental analysis. Appl. Energy 2016, 179, 64–84. [Google Scholar] [CrossRef]
  20. Weinlaeder, H.; Koerner, W.; Heidenfelder, M. Monitoring results of an interior sun protection system with integrated latent heat storage. Energy Build. 2011, 43, 2468–2475. [Google Scholar] [CrossRef]
  21. Bianco, L.; Komerska, A.; Cascone, Y.; Serra, V.; Zinzi, M.; Carnielo, E.; Ksionek, D. Thermal and optical characterisation of dynamic shading systems with PCMs through laboratory experimental measurements. Energy Build. 2018, 163, 92–110. [Google Scholar] [CrossRef]
  22. Komerska, A.; Bianco, L.; Serra, V.; Fantucci, S.; Rosiński, M. Experimental analysis of an external dynamic solar shading integrating PCMs: First results. Energy Procedia 2015, 78, 3452–3457. [Google Scholar] [CrossRef] [Green Version]
  23. Heim, D. Phase-Change Material Modeling within Whole Building Dynamic Simulation. ASHRAE Trans. 2006, 112, 518–525. [Google Scholar]
  24. Tabares-Velasco, P.C.; Christensen, C.; Bianchi, M. Verification and validation of EnergyPlus phase change material model for opaque wall assemblies. Build. Environ. 2012, 54, 186–196. [Google Scholar] [CrossRef]
  25. Wijesuriya, S.; Tabares-Velasco, P.C.; Biswas, K.; Heim, D. Empirical validation and comparison of PCM modeling algorithms commonly used in building energy and hygrothermal software. Build. Environ. 2020, 173, 106750. [Google Scholar] [CrossRef]
  26. Wieprzkowicz, A.; Heim, D. Modelling of thermal processes in a glazing structure with temperature dependent optical properties-An example of PCM-window. Renew. Energy 2020, 160, 653–662. [Google Scholar] [CrossRef]
  27. Dellicompagni, P.; Franco, J.; Heim, D.; Wieprzkowicz, A. Numerical modeling of phase change materials using simusol software. Appl. Therm. Eng. 2020, 170, 114772. [Google Scholar] [CrossRef]
  28. Giovannini, L.; Goia, F.; Lo Verso, V.R.M.; Serra, V. Phase Change Materials in Glazing: Implications on Light Distribution and Visual Comfort. Preliminary Results. Energy Procedia 2017, 111, 357–366. [Google Scholar] [CrossRef] [Green Version]
  29. Zhao, D.; Zhang, G.; Zhang, X.; Li, D. Optical properties of paraffin at temperature range from 40 to 80 °C. Optik 2018, 157, 184–189. [Google Scholar] [CrossRef] [Green Version]
  30. Li, D.; Zheng, Y.; Li, Z.; Qi, H. Optical properties of a liquid paraffin-filled double glazing unit. Energy Build. 2015, 108, 381–386. [Google Scholar] [CrossRef]
  31. Goia, F.; Zinzi, M.; Carnielo, E.; Serra, V. Spectral and angular solar properties of a PCM-filled double glazing unit. Energy Build. 2015, 87, 302–312. [Google Scholar] [CrossRef] [Green Version]
  32. Lechowska, A.A.; Schnotale, J.A. Thermal transmittance of multi-layer glazing with ultrathin internal partitions. In Proceedings of the BS2015: 14th Conference of International Building Performance Simulation Association, Hyderabad, India, 7–9 December 2015; pp. 2134–2141. [Google Scholar]
  33. Kulakowski, T.; Heim, D. Modeling of thermal and optical processes in translucent structures filled with PCM layer using moving mushy volume approach. In Proceedings of the 16th IBPSA Conference Rome, Rome, Italy, 2–4 September 2019; pp. 1459–1466. [Google Scholar]
  34. Rheims, J.; Köser, J.; Wriedt, T. Refractive-index measurements in the near-{IR} using an Abbe refractometer. Meas. Sci. Technol. 1997, 8, 601–605. [Google Scholar] [CrossRef]
  35. Chemical, I. Crystallographical and Physical Properties of Liquid Paraffins and Paraffin Waxes. In Paraffin Products; Freund, M., Csikós, R., Keszthelyi, S., Mózes, G.Y., Eds.; Developments in Petroleum Science; Elsevier: Amsterdam, The Netherlands, 1982; Volume 14, pp. 13–140. [Google Scholar]
  36. Davies, M.M.; Dudley, R.J.; Smalldon, K.W. An investigation of bulk and surface refractive indices for flat window glasses, patterned window glasses and windscreen glasses. Forensic Sci. Int. 1980, 16, 125–137. [Google Scholar] [CrossRef]
Figure 1. The general configuration of experimental set-up for direct transmittance measurements.
Energies 14 00721 g001
Figure 2. Two configurations of PCM layer towards solar radiation, (a)—case A (from the front side towards radiation), (b)—case B (from the backside towards radiation), dimensions are given in mm.
Energies 14 00721 g002
Figure 3. Glass sample prepared for experiment, (a) PCM in a liquid state and (b) PCM in solid state. The first cavity is empty, the second cavity is filled with PCM.
Energies 14 00721 g003
Figure 4. PCM glazing sample holder with built-in sensors. Left cell covered with PCM window, right cell as a reference.
Energies 14 00721 g004
Figure 5. Krüss AR4 refractometer used in the experiments.
Energies 14 00721 g005
Figure 6. Direct light transmission versus time for triple glazed window with PCM layer—melting process caused by irradiation from an artificial sun.
Energies 14 00721 g006
Figure 7. Direct light transmission versus time for an irradiance of 1000 W/m2, case A.
Energies 14 00721 g007
Figure 8. Direct light transmission versus time for an irradiance of 1000 W/m2, case B.
Energies 14 00721 g008
Figure 9. Direct light transmission versus time for an irradiance of 500 W/m2, case A.
Energies 14 00721 g009
Figure 10. Direct light transmission versus time for an irradiance of 500 W/m2, case B.
Energies 14 00721 g010
Figure 11. Direct light transmission versus time for a triple glazed window with a PCM layer, 500 W/m2.
Energies 14 00721 g011
Figure 12. Direct light transmission versus time for a triple glazed window with a PCM layer. 1000 W/m2.
Energies 14 00721 g012
Figure 13. Refractive index for RT21HC in liquid state and temperature range 25–35 °C.
Energies 14 00721 g013
Figure 14. Analysis of melting process in PCM cavity from mushy to liquid, (a) graphical representations, (b) changes of transmission.
Energies 14 00721 g014aEnergies 14 00721 g014b
Figure 15. Scheme representation of light refraction during non-uniform melting of PCM.
Energies 14 00721 g015
Publisher’s Note: MDPI stays neutral with regard to jurisdictional claims in published maps and institutional affiliations.

