
Integrating GIS-Based Point of Interest and Community Boundary Datasets for Urban Building Energy Modeling


1
College of Civil Engineering, Hunan University, Changsha 410082, China
2
Key Laboratory of Building Safety and Energy Efficiency of the Ministry of Education, Hunan University, Changsha 410082, China
*
Author to whom correspondence should be addressed.
Energies 2021, 14(4), 1049; https://doi.org/10.3390/en14041049
Submission received: 13 January 2021
/
Revised: 1 February 2021
/
Accepted: 14 February 2021
/
Published: 17 February 2021
(This article belongs to the Special Issue Bottom-Up Urban Building Energy Modelling)
Abstract
:Urban building energy modeling (UBEM) is arousing interest in building energy modeling, which requires a large building dataset as an input. Building use is a critical parameter to infer archetype buildings for UBEM. This paper presented a case study to determine building use for city-scale buildings by integrating the Geographic Information System (GIS) based point-of-interest (POI) and community boundary datasets. A total of 68,966 building footprints, 281,767 POI data, and 3367 community boundaries were collected for Changsha, China. The primary building use was determined when a building was inside a community boundary (i.e., hospital or residential boundary) or the building contained POI data with main attributes (i.e., hotel or office building). Clustering analysis was used to divide buildings into sub-types for better energy performance evaluation. The method successfully identified building uses for 47,428 buildings among 68,966 building footprints, including 34,401 residential buildings, 1039 office buildings, 141 shopping malls, and 932 hotels. A validation process was carried out for 7895 buildings in the downtown area, which showed an overall accuracy rate of 86%. A UBEM case study for 243 office buildings in the downtown area was developed with the information identified from the POI and community boundary datasets. The proposed building use determination method can be easily applied to other cities. We will integrate the historical aerial imagery to determine the year of construction for a large scale of buildings in the future.
1. Introduction
With continuous urbanization, 50% of the global population lived in urban areas in 2019. China’s urbanization rate has risen from 36 to 60% in the past 20 years [1]. Urbanization boosts economic growth with significantly increased energy consumption and greenhouse gas emissions. Buildings in China accounted for 37% of the total energy consumption in 2018 [2]. Building energy efficiency is essential for the sustainable development of cities. Building performance simulation is an efficient tool for evaluating building energy conservation measures for existing buildings and optimizing design schemes for new construction [3].
Urban building energy modeling (UBEM) refers to bottom-up physical-based building energy models from a district-scale to a city-scale [4]. UBEM has become an excellent way to design and optimize city-scale buildings for energy efficiency [5] and evaluate renewable energy technologies for energy planning [6]. Many tools have been developed or are under development that aim to perform UBEM rapidly [7]. Unlike modeling a single building which requires detailed information to be obtained via on-site investigation, UBEM generally uses high-level building information, including series of geometric and non-geometric information. The geometric information typically includes Geographic Information Systems (GIS) based building footprints, number of floors, and building height [8]. The GIS-based building data can be obtained from public sources, remote sensing images, or aerial photogrammetry. The non-geometric information is typically determined based on the archetype/prototype buildings organized by building use, year of construction, climate zone, and building size [9]. Archetype buildings represent the common typologies and technologies in the building stock [10]. Building use information is essential for identifying archetype buildings for UBEM [11].
Currently, there are direct and indirect approaches to acquire building use data. The first direct approach is based on the government or organization’s open data portal, which has been widely used in existing UBEM studies. Many cities worldwide have made their building data publicly available [12], e.g., San Francisco, Los Angeles, Portland, San Jose, Chicago, and Boston. Kontokosta et al. [13] used the Primary Land Use Tax Lot Output database from the New York City Department of City Planning to obtain building uses to be used as the data input for UBEM. Li et al. [14] collected residential and commercial parcel data from the Polk County Assessor Database, including information about building uses, building locations, and year of construction for UBEM. Monteiro et al. [15] reviewed open urban building databases in Europe to support UBEM. Berlin and Helsinki launched open data projects to provide 3D city models for buildings, including features such as building name, height, building materials, and building use. Nouvel et al. [16] collected building usage data from the Municipality of Rotterdam to calculate heating demand at the neighborhood level. Nageler et al. [17] collected data on building uses assigned by the land utilization plan from the State Government of Styria for UBEM. Readily available public building information datasets comprise a good starting point for UBEM; however, many cities do not provide such detailed building information.
Another direct approach is to obtain the building use information from the volunteer GIS platform, OpenStreetMap (OSM). OSM [18] provides building footprints and some customized tags, including building use and building height. Schiefelbein et al. [19] and Fonseca et al. [20] extracted related building data automatically from OSM to create an urban building dataset for UBEM. OSM comprises data that has been collected and shared voluntarily by the general public. Thus, the quality of OSM data, in terms of completeness and accuracy, varies greatly [21]. Building use and height information were missing for most of the buildings. Moreover, University College London launched a web platform, Colouring London [22], to collect building age, size, use type, construction, and energy performance data for buildings in London. It intended to enrich OSM data through the use of volunteer citizens who were involved in editing maps. Furthermore, the University of Saint Joseph [23] conducted an on-site survey for 7122 buildings in Beirut, containing information on building use, number of floors, and construction year. These kinds of volunteered data collections are very time-consuming on a city-scale.
An indirect approach is to infer building uses from related datasets. The first indirect approach is to infer building use or land use based on parcel footprint and building geometry data. Hecht et al. [24] presented a supervised classification approach using the Random Forest algorithm to identify building uses based on five different building footprint information types. The study mainly focused on residential buildings, categorized into eleven types. In contrast, the non-residential buildings were only split into industrial/commercial buildings and special purpose buildings. It is time-consuming to collect labels for supervised learning. Hu and Wang [25] used seven land-use parcel attributes to classify land use into four types: office, industrial, civic, and transportation. The overall accuracy for correctly separating parcels into four land-use classes was 61.68%. Therefore, the accuracy of this geometry-based strategy was slightly low.
A second indirect approach strategy is to obtain building use information from people’s mobility data. Zhong et al. [26] inferred building use using household interview travel survey data and transportation data obtained from the bus smart card system. These survey data were statistically analyzed to classify different trip activities and define correlations between travel activities and building uses. The transportation data were used to obtain the probability distribution of daily activities at each bus stop. The inverse distance weight function was used to calculate the probability of a human flow from a bus stop to a nearby place. The correctness of the proposed methods was around 85%. Niu et al. [27] utilized the WeChat (a social media app) users’ real-time location records, taxi GPS trajectories data, point of interest (POI) data, and building footprint data to infer the functions of urban buildings based on the proposed density-based method. The results showed an overall detection rate of 72.22% and an accuracy rate of 65%. Pei et al. [28] constructed a vector of aggregated mobile phone data to characterize land-use types. The vector was composed of the normalized hourly call volume and the total call volume. Land use was determined with a detection rate of 58.03%. The personal mobility data can help identify building uses for limited areas in a city; however, it is difficult to apply the method to a city-scale due to data shortages.
A third indirect approach strategy is the utilization of GIS-based POI data. The point-of-interest (POI) is a GIS point with several attributes, including the entity name, entity category, and entity sub-category. POI data are widely available and can be provided by many web map services, such as Google Maps, Bing Maps, Baidu Maps, and Gaode Maps. A POI could contain information for a hotel, a school, a shop, or a company. POI has been widely used to extract information related to urban functional areas [29] and land use [30]. Building use is at a smaller spatial scale than land use. There are limited studies on building use determination based on POI. Wang et al. [31] collected POI and building footprint data and then applied a logistic regression method to identify 2275 commercial buildings in Nanjing and classify them into three sub-categories: shopping centers, supermarkets, and specialty stores. Then, dynamic occupant density models were developed for commercial buildings. Compared with the open data portal and OSM, POI data are satisfactory in terms of richness. Furthermore, they are updated frequently to better reflect the latest information about urban buildings, which is convenient. Supervised learning requires a lot of labeling and training for data, which is acceptable for hundreds of buildings. However, it will be time-consuming for thousands of buildings in the whole city.
Most previous UBEM studies obtained building use information from direct approaches, such as the use of datasets or OSM, restricted to specific cities. Some indirect approaches are limited by data collection and processing. Thus, a rapid and universal method of building use determination based on open-source data is a better choice for any city.
This paper introduces a method to determine building use based on building footprint, POI, and community boundary data from a free map service. Some building uses contain multiple commercial POIs inside the building footprint, which were further categorized into subtypes using an unsupervised clustering analysis. A case study was conducted in the city of Changsha using 68,966 building footprint data, 281,767 POI data, and 3367 community boundary data. Identified office buildings downtown were modeled as a UBEM case study.
2. Methods
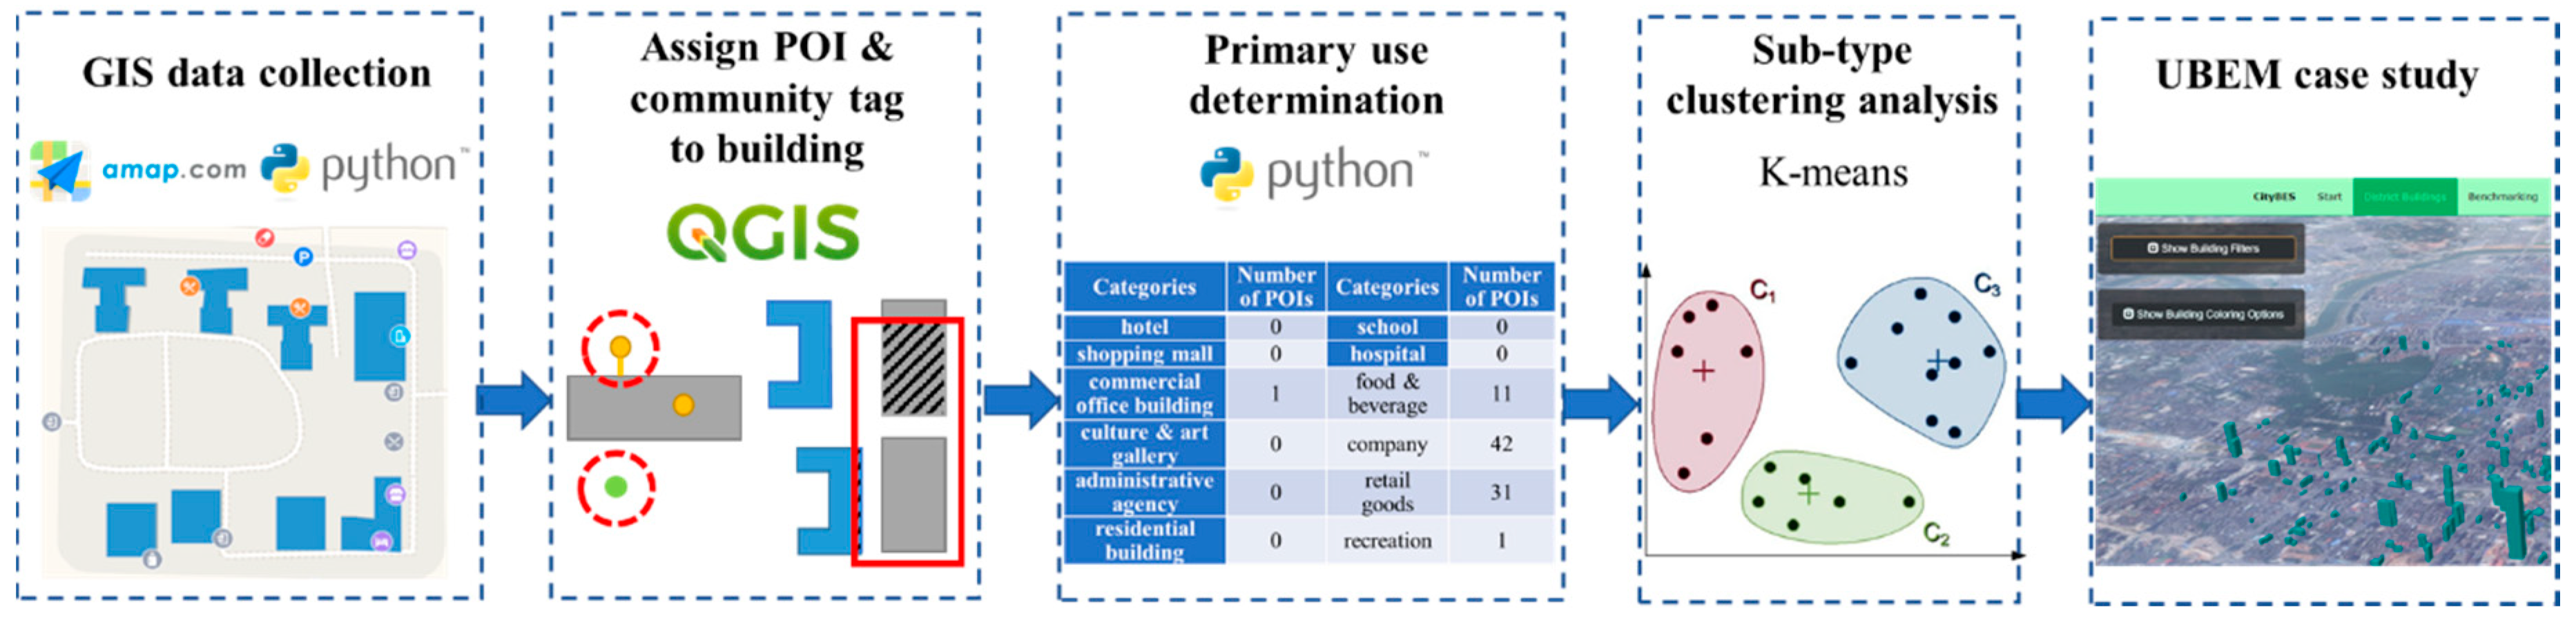
Figure 1 shows the workflow for determining building use based on three GIS-based datasets: (1) GIS-based data for building footprint, point of interest, and community boundary of five Changsha city districts were collected; (2) QGIS (a GIS software) [32] tool was utilized to assign POI and community tags to the building footprint, which joined each dataset’s features by geographical location; (3) the primary use determination algorithm was applied to identify the primary building use based on the main attributes; (4) unsupervised clustering analysis was employed to determine the sub-type of each building use; (5) a UBEM case study was created, integrating the information of year of construction and building energy standards. The details of each step are introduced in the following section.
2.1. Introduction of the Case Study Buildings
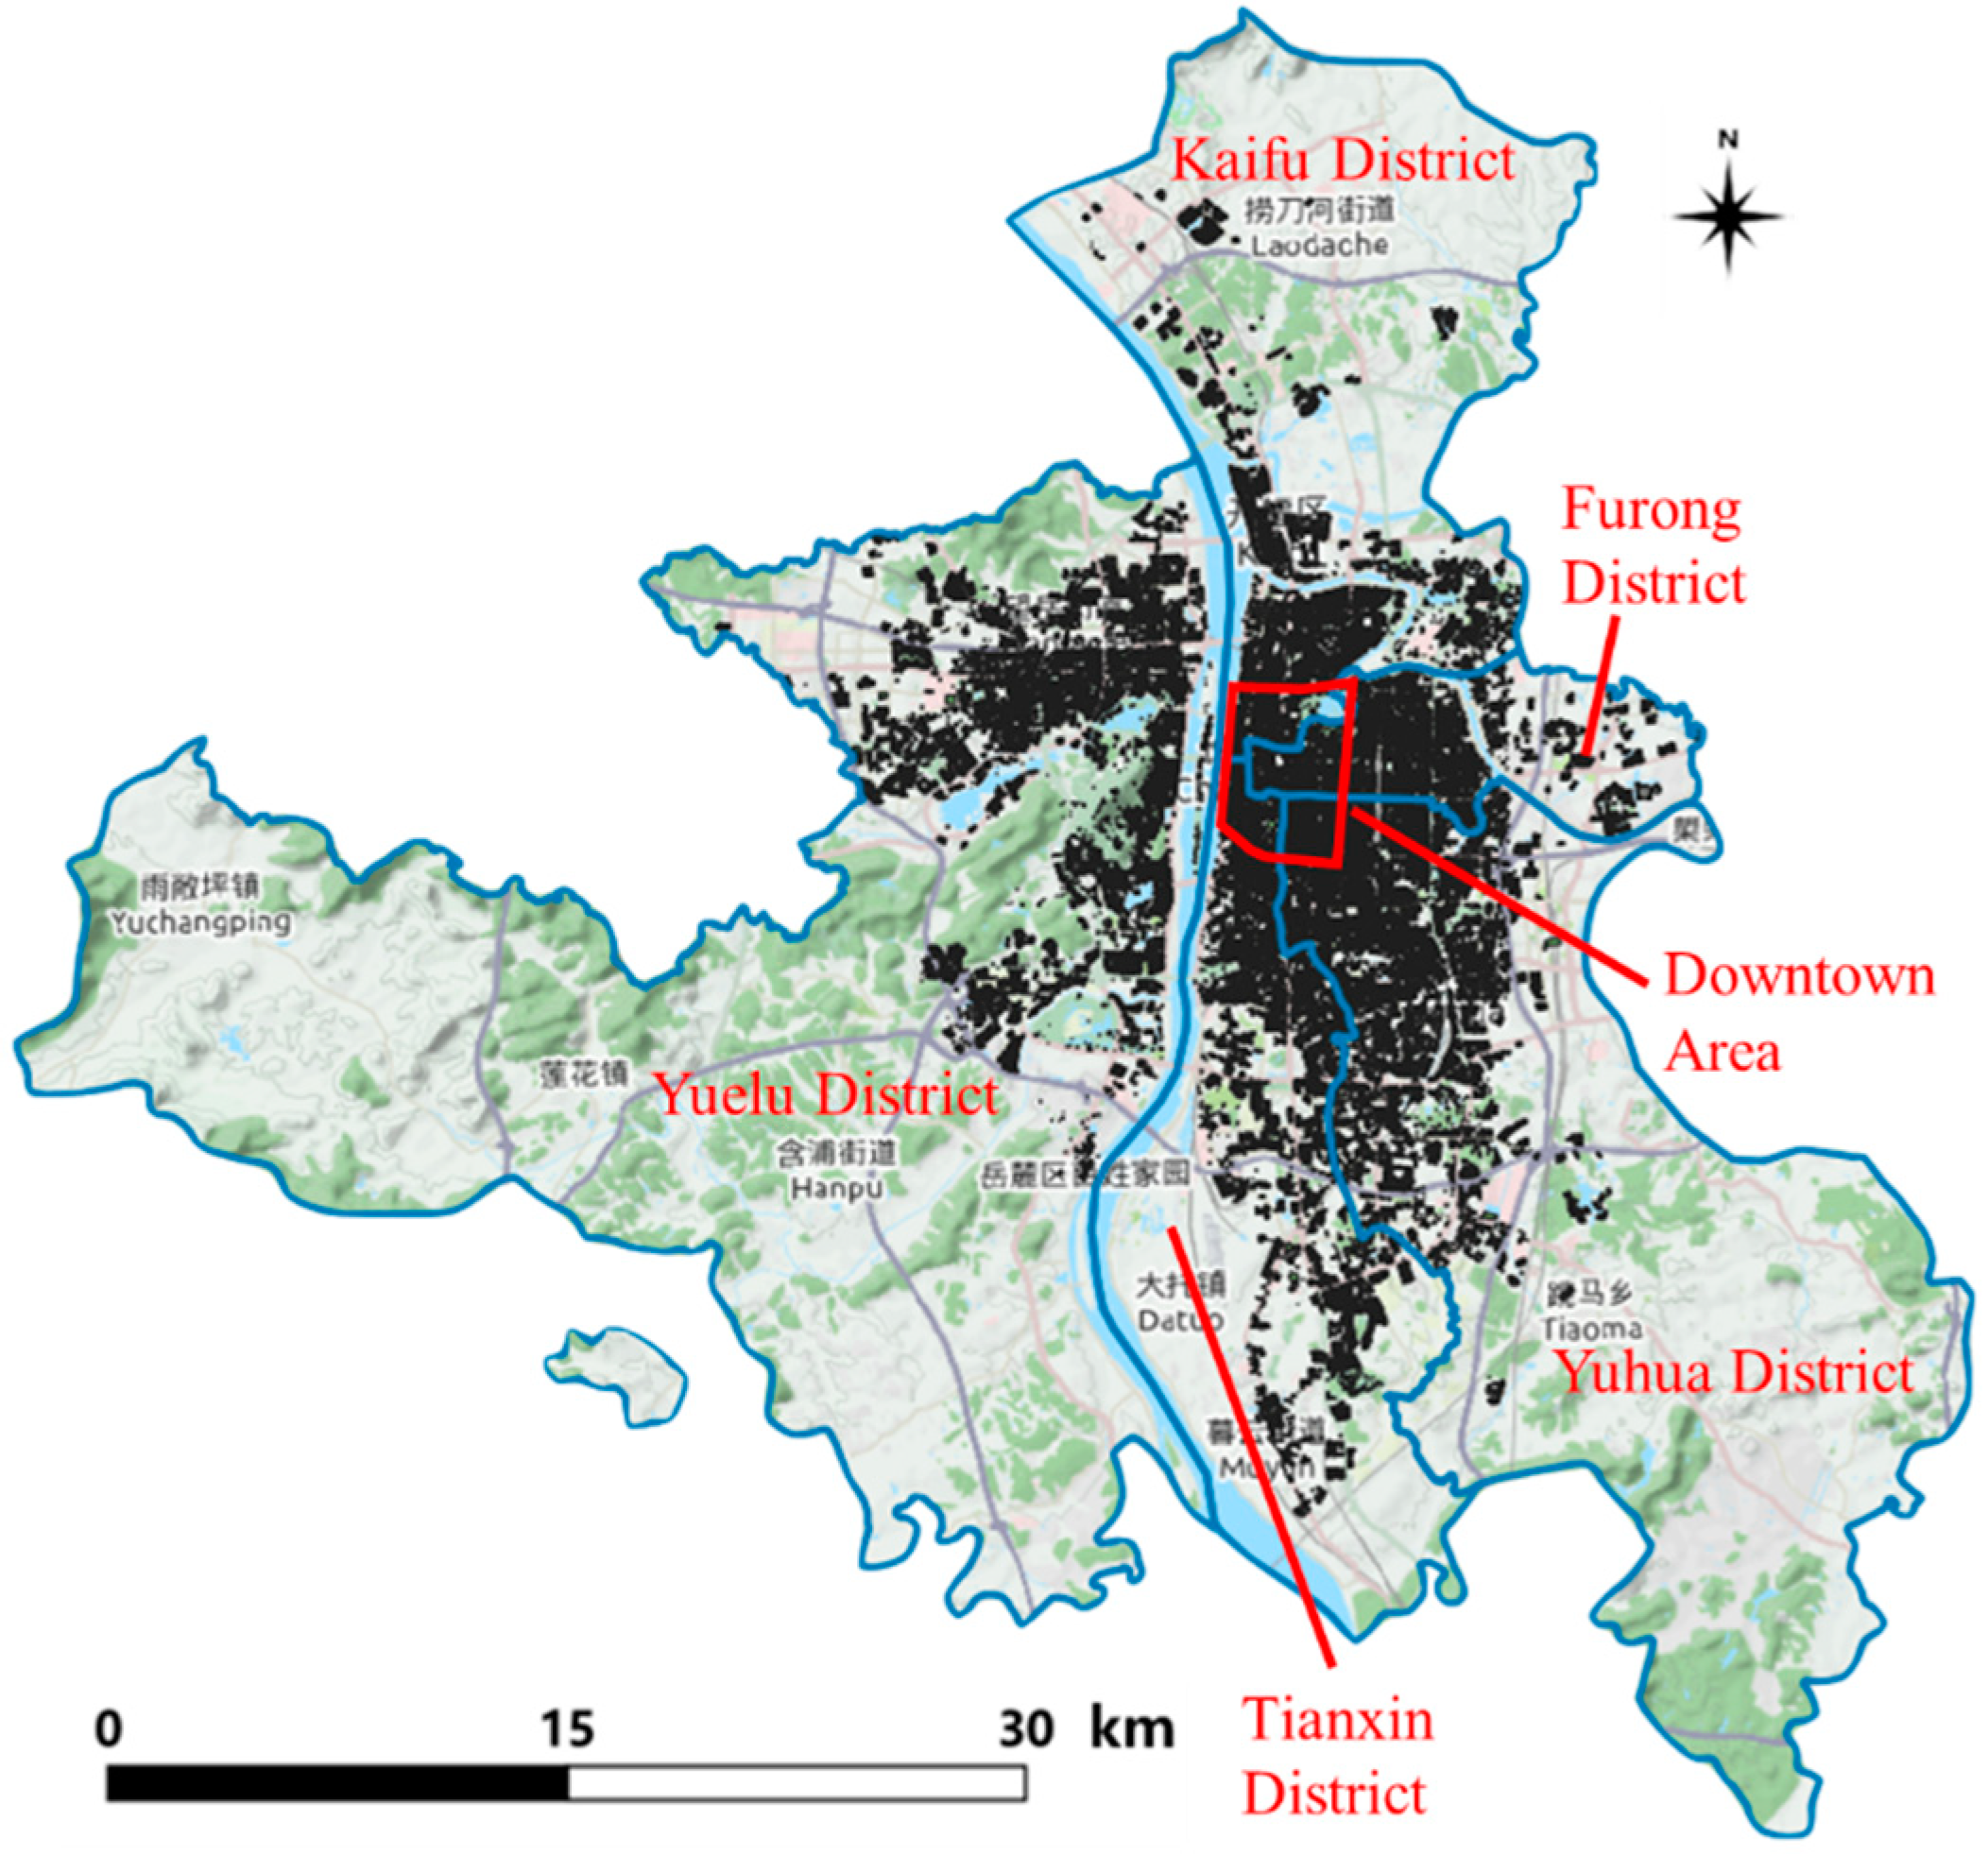
Buildings in five districts of the city of Changsha were selected for the case study. Changsha is the capital of Hunan Province, which is located in the central area of China. Figure 2 shows a topographic map and the building footprints of the case study districts, including Furong District, Tianxin District, Yuelu District, Kaifu District, and Yuhua District. The five districts have a total area of 1227 square kilometers and a population of about 3.5 million. The remote areas of Yuelu District, Kaifu District, and Yuhua District are comprised largely of mountainous and forested areas with few buildings.
Gaode Maps [33] is one of China’s most commonly used digital maps, which provides open Application Programming Interfaces (APIs) to obtain various geographic data. Figure 2 shows the building footprints of five districts in 2018 from Gaode Maps, which has 68,966 polygons, with the number of floors information saved in the shapefile format belonging to geospatial vector data.
POIs of five districts in 2019 were extracted from Gaode Maps by API, resulting in a total number of 281,767 after data cleaning. Table 1 shows the category and amount of original POIs, which were divided into 11 categories. The number of shopping malls was the largest, accounting for 30%. The daily life service, and food and beverage categories accounted for 18.6 and 16.9%, respectively. According to the Gaode Maps developer’s documentation, 11 kinds of POIs were further divided into 104 sub-categories and 450 third-level categories. For example, commercial housing includes second-level categories such as buildings and residential buildings. Then, buildings were divided into third-level categories, such as commercial office buildings and industrial buildings. Each POI has a name, district, address, latitude, longitude, and third-level category.
Community boundary refers to land use, where buildings inside the boundary could be assigned to the corresponding tags. A total of 3367 community boundaries in 2019 were also obtained, including residential districts, schools, hospitals, retail markets for building materials and furniture, and industrial parks.
2.2. Assign POI and Community Tags to Building Footprints
Figure 3a shows POI combinations. For POIs inside the buildings, the POI attributes can be assigned to the buildings directly after a point-polygon intersection, via the function of “join attributes by location” in QGIS. However, for POIs outside the buildings, a tolerance analysis needs to be applied that considers spatial inaccuracies. The shortest distance from the POI to the adjacent polygon boundary was calculated as the distance tolerance. To determine the tolerance, a district was selected to check whether outside POIs belong to the buildings, POI attributes were then combined with the building footprints.
Figure 3b shows the community boundary combinations. For buildings inside the community boundary, the tags were matched to the buildings directly after a polygon-to-polygon intersection in QGIS. It was also necessary to apply a tolerance analysis for building footprints located on the boundaries. The percentage of the building footprint area within the boundary was calculated in a district to obtain the proper percentage that determines buildings belonging to the community boundary.
2.3. Primary Building Use Determination
The original POI category was not streamlined for building use determination due to multilevel sub-categories. Insurance, securities, and law firms were assigned to different categories, which could also be companies. According to the national standard—Design Standard for Energy Efficiency of Public Buildings [34], buildings can be divided into industrial, residential, and public buildings in China. Public buildings are further classified into office buildings, commercial buildings, hotel buildings, education and health sector buildings, etc. Therefore, related POIs were picked out to reorganize the original data in order to identify the abovementioned buildings. The commercial office buildings and residential buildings from Commercial Housing were selected. The administrative agency from Governmental Organization and Social Group was selected. The department store, shopping center, and hypermarket from Shopping were chosen to represent the shopping mall. The museum and art gallery from Science/Culture and Education Services were selected to represent the Culture and Art Gallery category. Lastly, 12 categories of POIs were recombined.
Multiple POIs only have point information without area or volume data. However, the hotel, shopping mall, commercial office building, culture and art gallery, administrative agency, residential building, school, and hospital categories can reflect some large buildings’ primary functions; defined as the main attributes. Primary building use is determined by these main attributes or community tags. As an example, Table 2 shows the number of each type of POI belonging to a single building. This building has one main attribute (commercial office building) and no other main attributes, and can therefore be identified as a commercial office building in terms of its primary building use.
Primary building use determination was conducted when obtaining the number of POIs and tags belonging to each building. Firstly, buildings were separated according to whether they have main attributes. Then, when there was a single main attribute, the primary building uses were determined directly. When there were multiple main attributes, mixed-use building uses were determined. When there was only a community tag and no main attribute, the building use was determined based on the corresponding tag.
2.4. Sub-Type Clustering Analysis
Table 2 shows that commercial buildings generally have many business POIs except for the main attributes. The sub-type clustering analysis is necessary for further building use classification based on the number of POIs. The sub-type clustering was adopted to obtain mixed-use buildings and single type buildings classifications, and was applied when no main attributes and tags were available. The building sub-type refers to buildings with other functional mixed-uses. The building in Table 2 could be an office building with retail stores and restaurants.
Clustering analysis is a concept in data mining in which a set of objects are grouped according to a certain similarity measure. Objects in the same group are similar to those in other groups (clusters). Clustering is a form of unsupervised learning because there are no predefined classes and there is no training process. K-means is a common clustering method which has been widely used in energy use pattern partitioning [35], and archetype building classification [36], etc. It has the advantages of simplicity and fast convergence, while having disadvantages related to the local optimum and sensitivity to initial values. In this paper, K-means was utilized for the numerical dataset.
The Euclidean distance was used as a measure of proximity, as shown in Equation (1). For buildings with only one main attribute, food and beverages, company, retail goods, recreation, and the main attribute are prepared for clustering as inputs. For buildings without main attributes, four other non-main attribute POIs were selected. The number of clusters requires being predefined. This value was selected based on the Davies–Bouldin index, which compares the distance between clusters with the size of the clusters themselves. It can be denoted as displayed in Equation (2).
where si is the average distance between each point of the cluster and the centroid of that cluster, dij is the distance between cluster centroids i and j. It can be seen that the lower the Davies–Bouldin index, the better the separation between the clusters.
2.5. UBEM Case Study
After the completion of the city building use determination, a UBEM case study for office buildings in downtown Changsha was created using City Building Energy Saver (CityBES). CityBES is a web-based platform for urban building energy modeling [37]. CityBES employs EnergyPlus to simulate building energy use and savings from energy efficient retrofits, considering shading impacts [38]. Figure 4 shows the UBEM case study workflow. The archetype’s non-geometric information was obtained from the national building energy standards based on the year of construction. The first comprehensive energy efficiency design standard for public buildings, GB50189-2005 [34], was enforced on July 1, 2005. An updated version, GB50189-2015 [39], was activated from October 1, 2015. Therefore, three year-built periods were defined based on the issue time of standards, namely pre-2005, 2006–2015, and post-2016. Google Earth provides annual historical satellite images over the past 20 years. The year of construction was determined by manually comparing the images in different three year-built periods to check when the building footprints existed.
Apart from building geometric information, general input parameters were set by the standard corresponding to the period of construction, such as envelope, operational schedule, and heating, ventilation and air conditioning (HVAC) system. Other parameter settings were diverse, such as internal loads, to create different models based on the building sub-types clustering results.
3. Results
In this section, GIS data spatial analysis results are first shown to assign POIs to building footprints and connect building footprints with community boundaries. Then, the results of the primary building use determination and sub-type clustering are presented. Lastly, the simulation results of 243 office buildings in downtown Changsha are presented using CityBES.
3.1. GIS Data Spatial Analysis Results
3.1.1. Assign POIs to Building Footprints
There were 165,884 (59%) out of 281,767 POIs inside the building footprints after a point-polygon intersection. With the increase in distance tolerance, more POIs were assigned to nearby building footprints. A few sample blocks were selected to check if outside POIs belonged to nearby building footprints in order to determine proper distance tolerance. Table 3 shows the variation of accuracy with distance tolerance. The accuracy is defined as the correct POIs divided by outside POIs within a certain tolerance. There were 958 POIs outside the building footprints in the selected blocks. The accuracy decreases sharply when the distance tolerance is over 4m. So, a distance tolerance of 4m was used in this study. Then, 200,054 (71%) out of 281,767 POIs were assigned to building footprints in the city. There were 21,364 (31%) out of 68,966 building footprints with one or more POI. However, about 60,000 (21%) POIs were still more than 10m away from the building footprints. Most of these POIs were located in rural areas where building footprint data are incomplete.
3.1.2. Building Footprints within Community Boundaries
After a polygon-to-polygon matching process, there were 40,805 building footprints inside the community boundaries. There were another 5048 building footprints that partially intersected with the community boundaries. The percentage building footprint area within the community boundary was defined. A few sample blocks were selected to determine the proper percentage tolerance. Table 4 shows the variations in accuracy with the percentage tolerance. The accuracy is defined as the correctly individuated buildings divided by intersected buildings within a certain tolerance. There were 675 building footprints intersected with the community boundary in the selected blocks. The accuracy is less than 90% when the percentage tolerance is under 70%. So, a percentage tolerance of 70% was used in this study. Then, 3026 out of 5048 building footprints were considered to be within the community boundaries. Therefore, there are 43,831 building footprints within the community boundaries in total.
3.2. Primary Building Uses
A total of 51,650 out of 68,966 building footprints contained POIs or tags. Table 5 shows the detailed results of building uses through main type determination. Most building uses are residential buildings. Moreover, 35,186 buildings with residential POIs or tags were split into residential buildings and commercial–residential mixed buildings. A total of 835 were identified as commercial–residential buildings as they contained POIs with main attributes, such as commercial office buildings or hotels. A total of 5363 schools were found, representing the majority of commercial buildings. Additionally, there were 960 hotels, 649 hospitals, 602 government office buildings, 393 commercial office buildings, etc. There were 483 building footprints with at least two main attributes, including 288 hotel-office mixed buildings, 53 hotel-shopping mall mixed buildings, 10 office-shopping mall mixed buildings, 18 hotel-office-shopping mall mixed buildings, and 114 other mixed-use buildings.
3.3. Building Sub-Types Clustering
Some buildings only contain a main attribute and one or two other POIs, such as a culture and art gallery, school, hospital, and government office building, which do not require further classification. Sub-type clustering was adopted for residential buildings, commercial office buildings, hotels, buildings without main attributes and tags because they contain numerous business POIs.
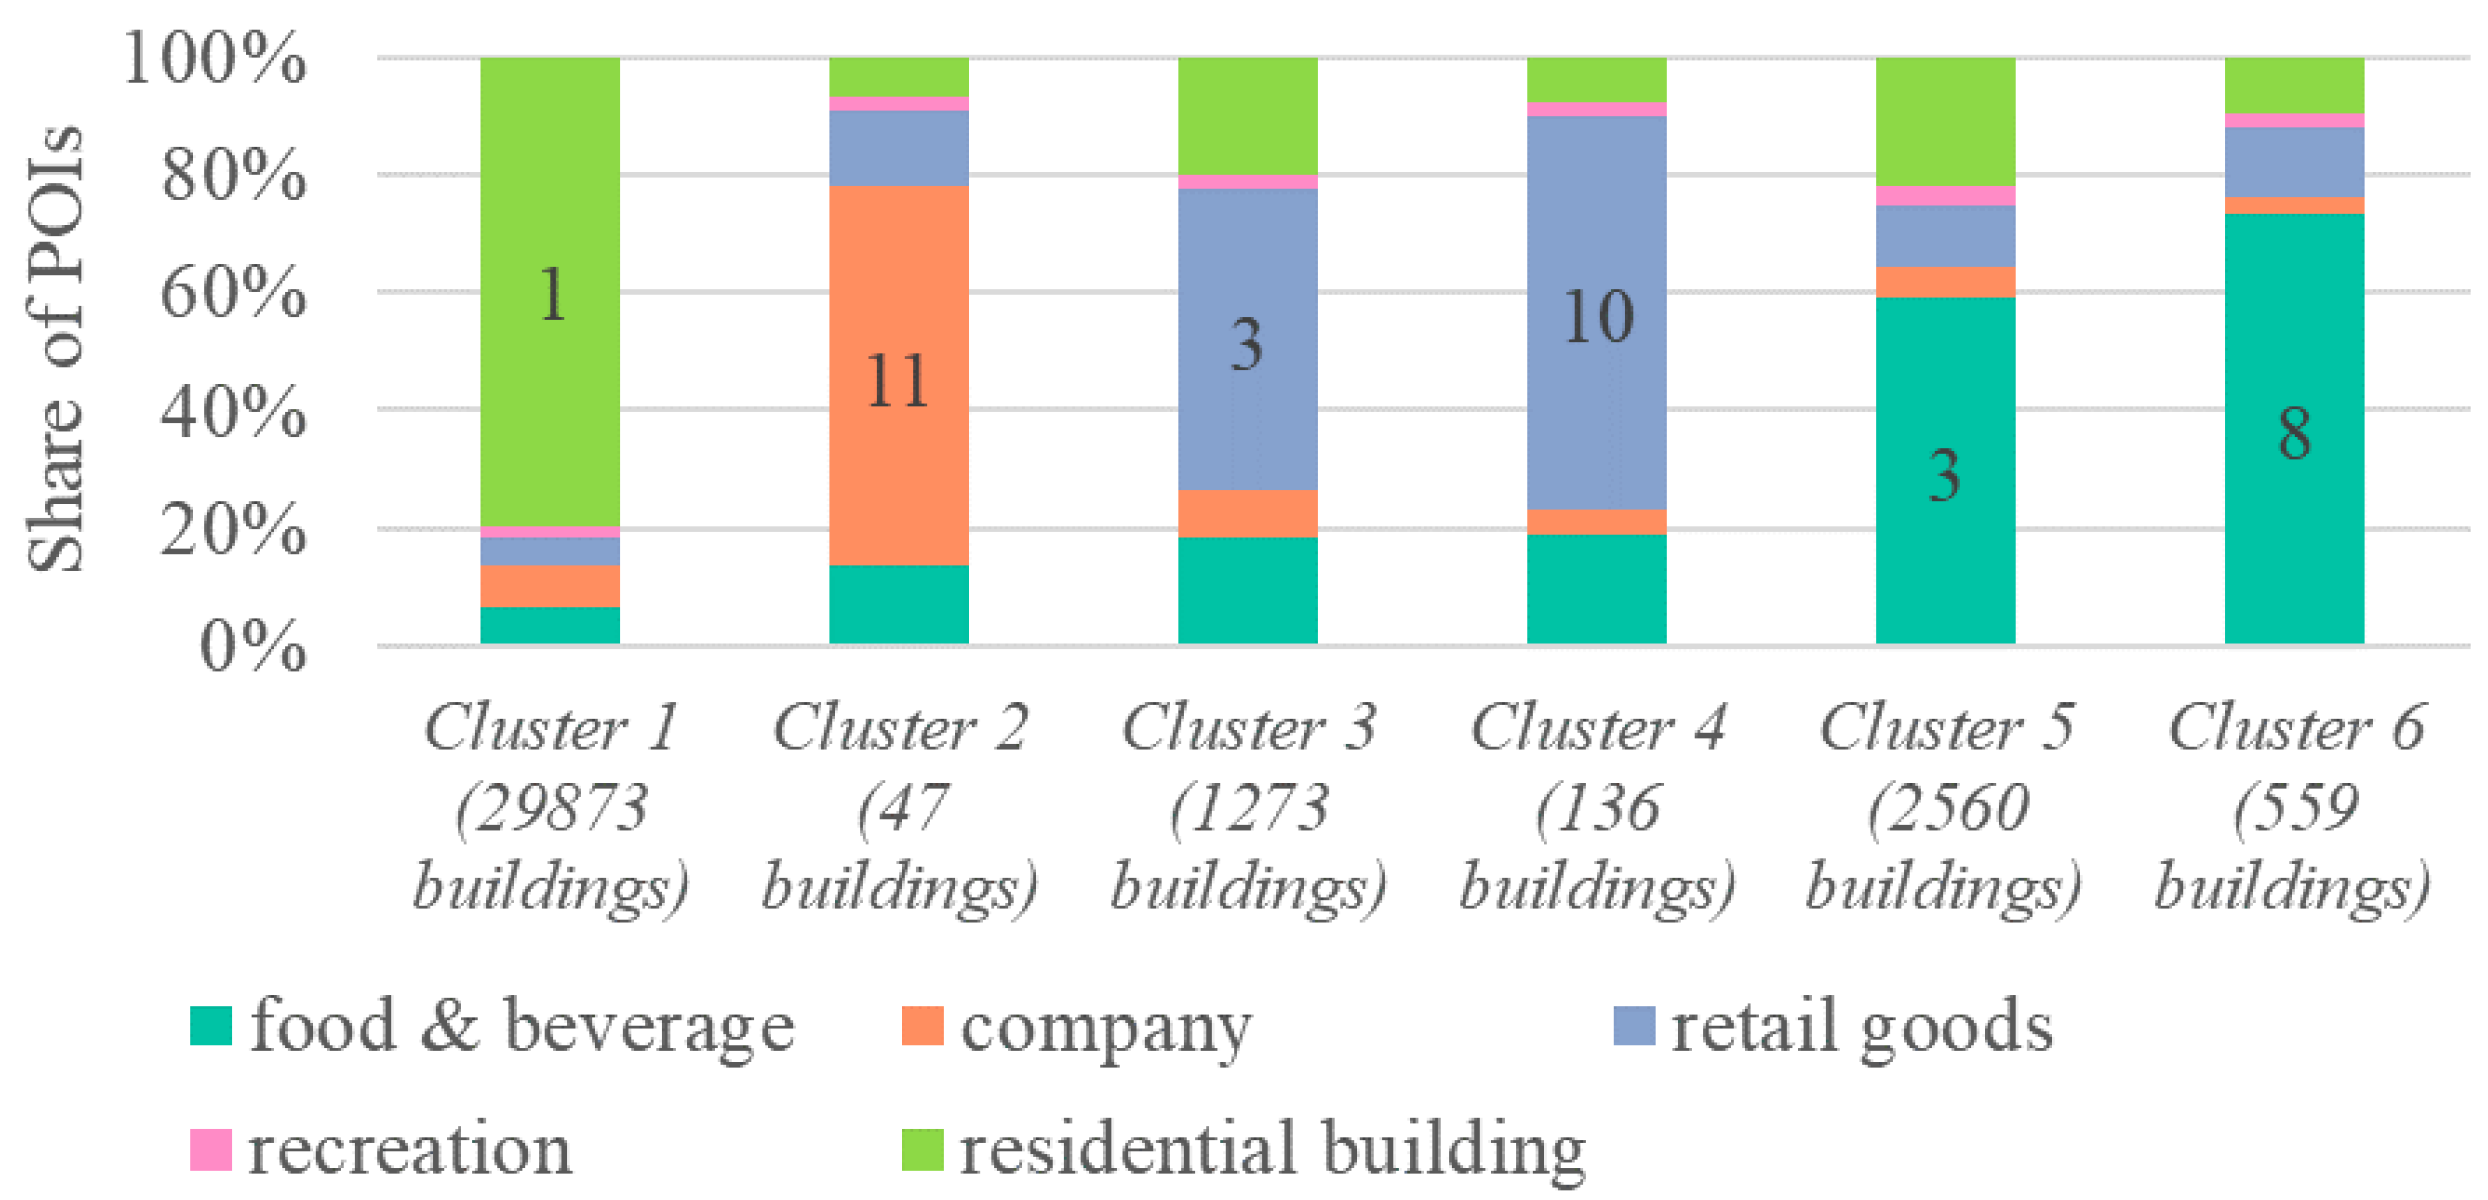
There were 34,448 building footprints for residential sub-type clustering. Figure 5 shows the share of the means of POI categories in each cluster and the number of each group. Five kinds of POIs are listed because of no other POIs. The company’s share is the highest in Cluster 2, so these buildings can be identified as residential–office mixed buildings. The share of retail goods is highest in both Cluster 3 and Cluster 4; these buildings can be identified as residential buildings with retail stores on the first floor. The share of food and beverages is highest in both Cluster 5 and Cluster 6; these buildings can be identified as residential buildings with restaurants on the first floor. The residential building’s share is the highest in Custer 1, showing that these buildings have little commercial activities.
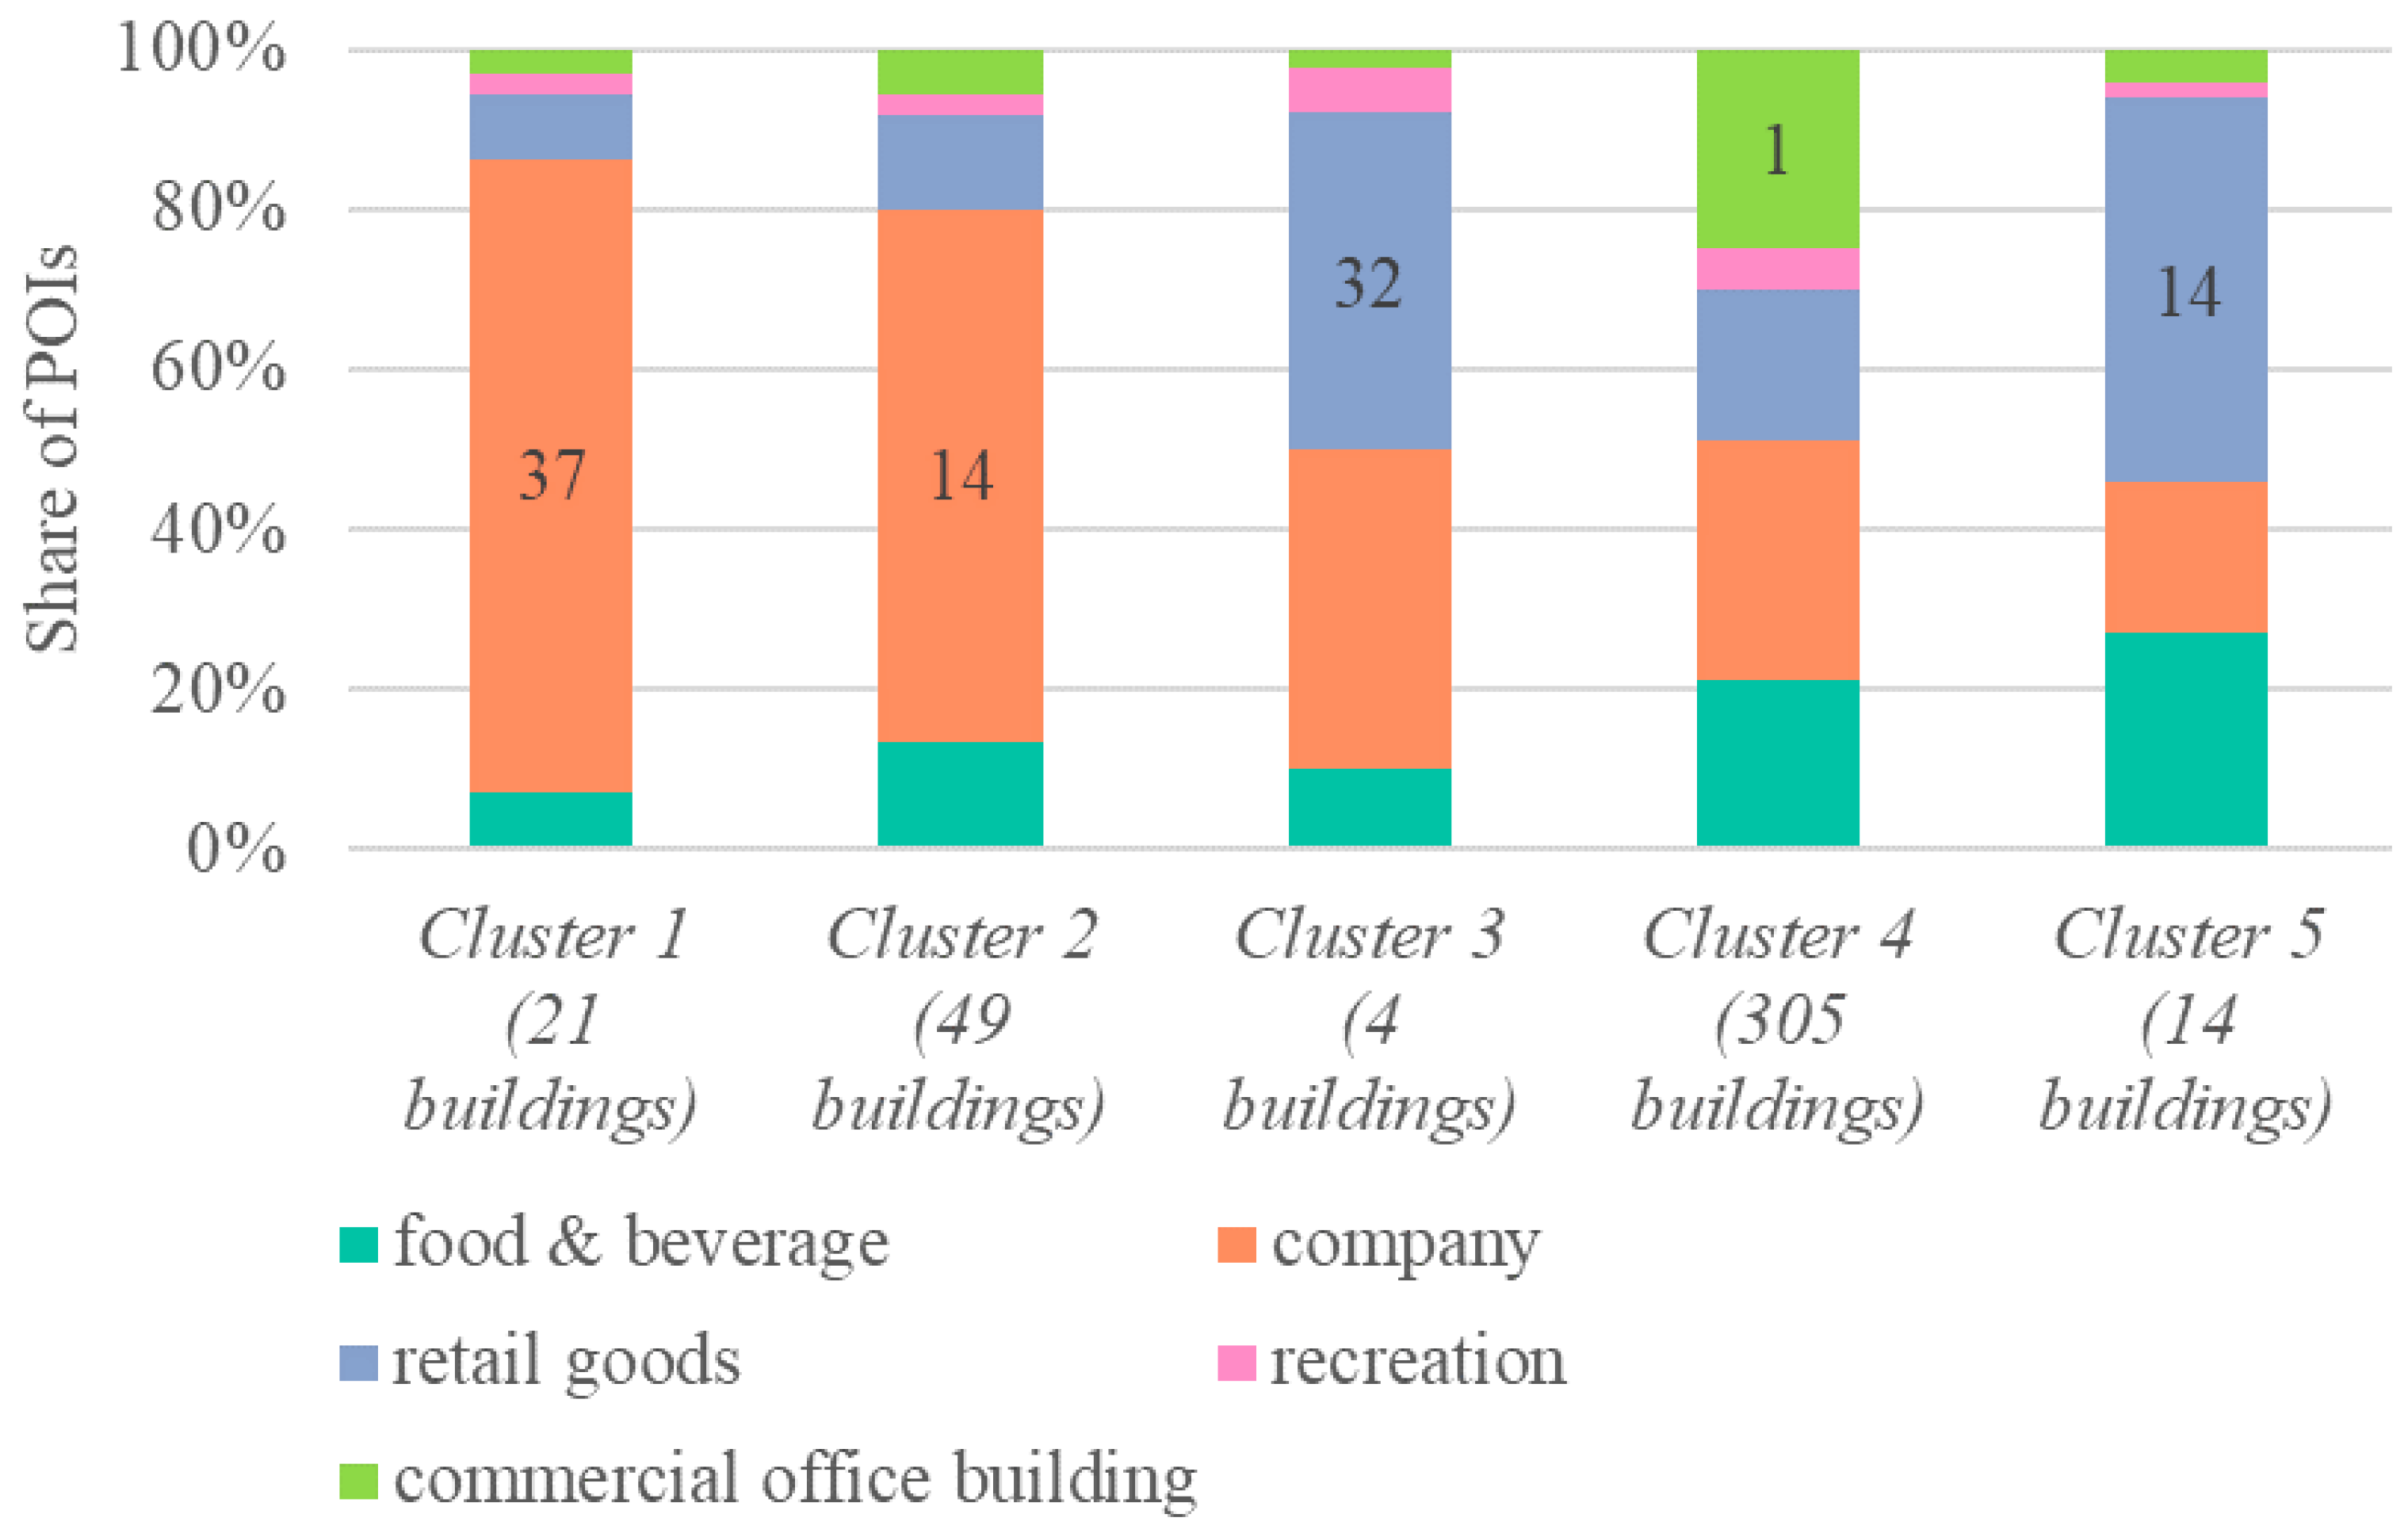
There were 393 building footprints with a single main attribute of commercial office building. Figure 6 shows the results of clustering. The company’s share is highest in Cluster 1 and Cluster 2; these buildings can be identified as office buildings for lease. The share of retail goods is highest in Cluster 3; these buildings can be identified as office buildings with retail stores on the first floor. The share of retail goods and food and beverages is greatest in Cluster 5; these buildings can be identified as office buildings with retail and restaurants on the first floor. The means of each kind of POI are very low in Cluster 4 (value of one), thus, these buildings can be regarded as enterprise office buildings.
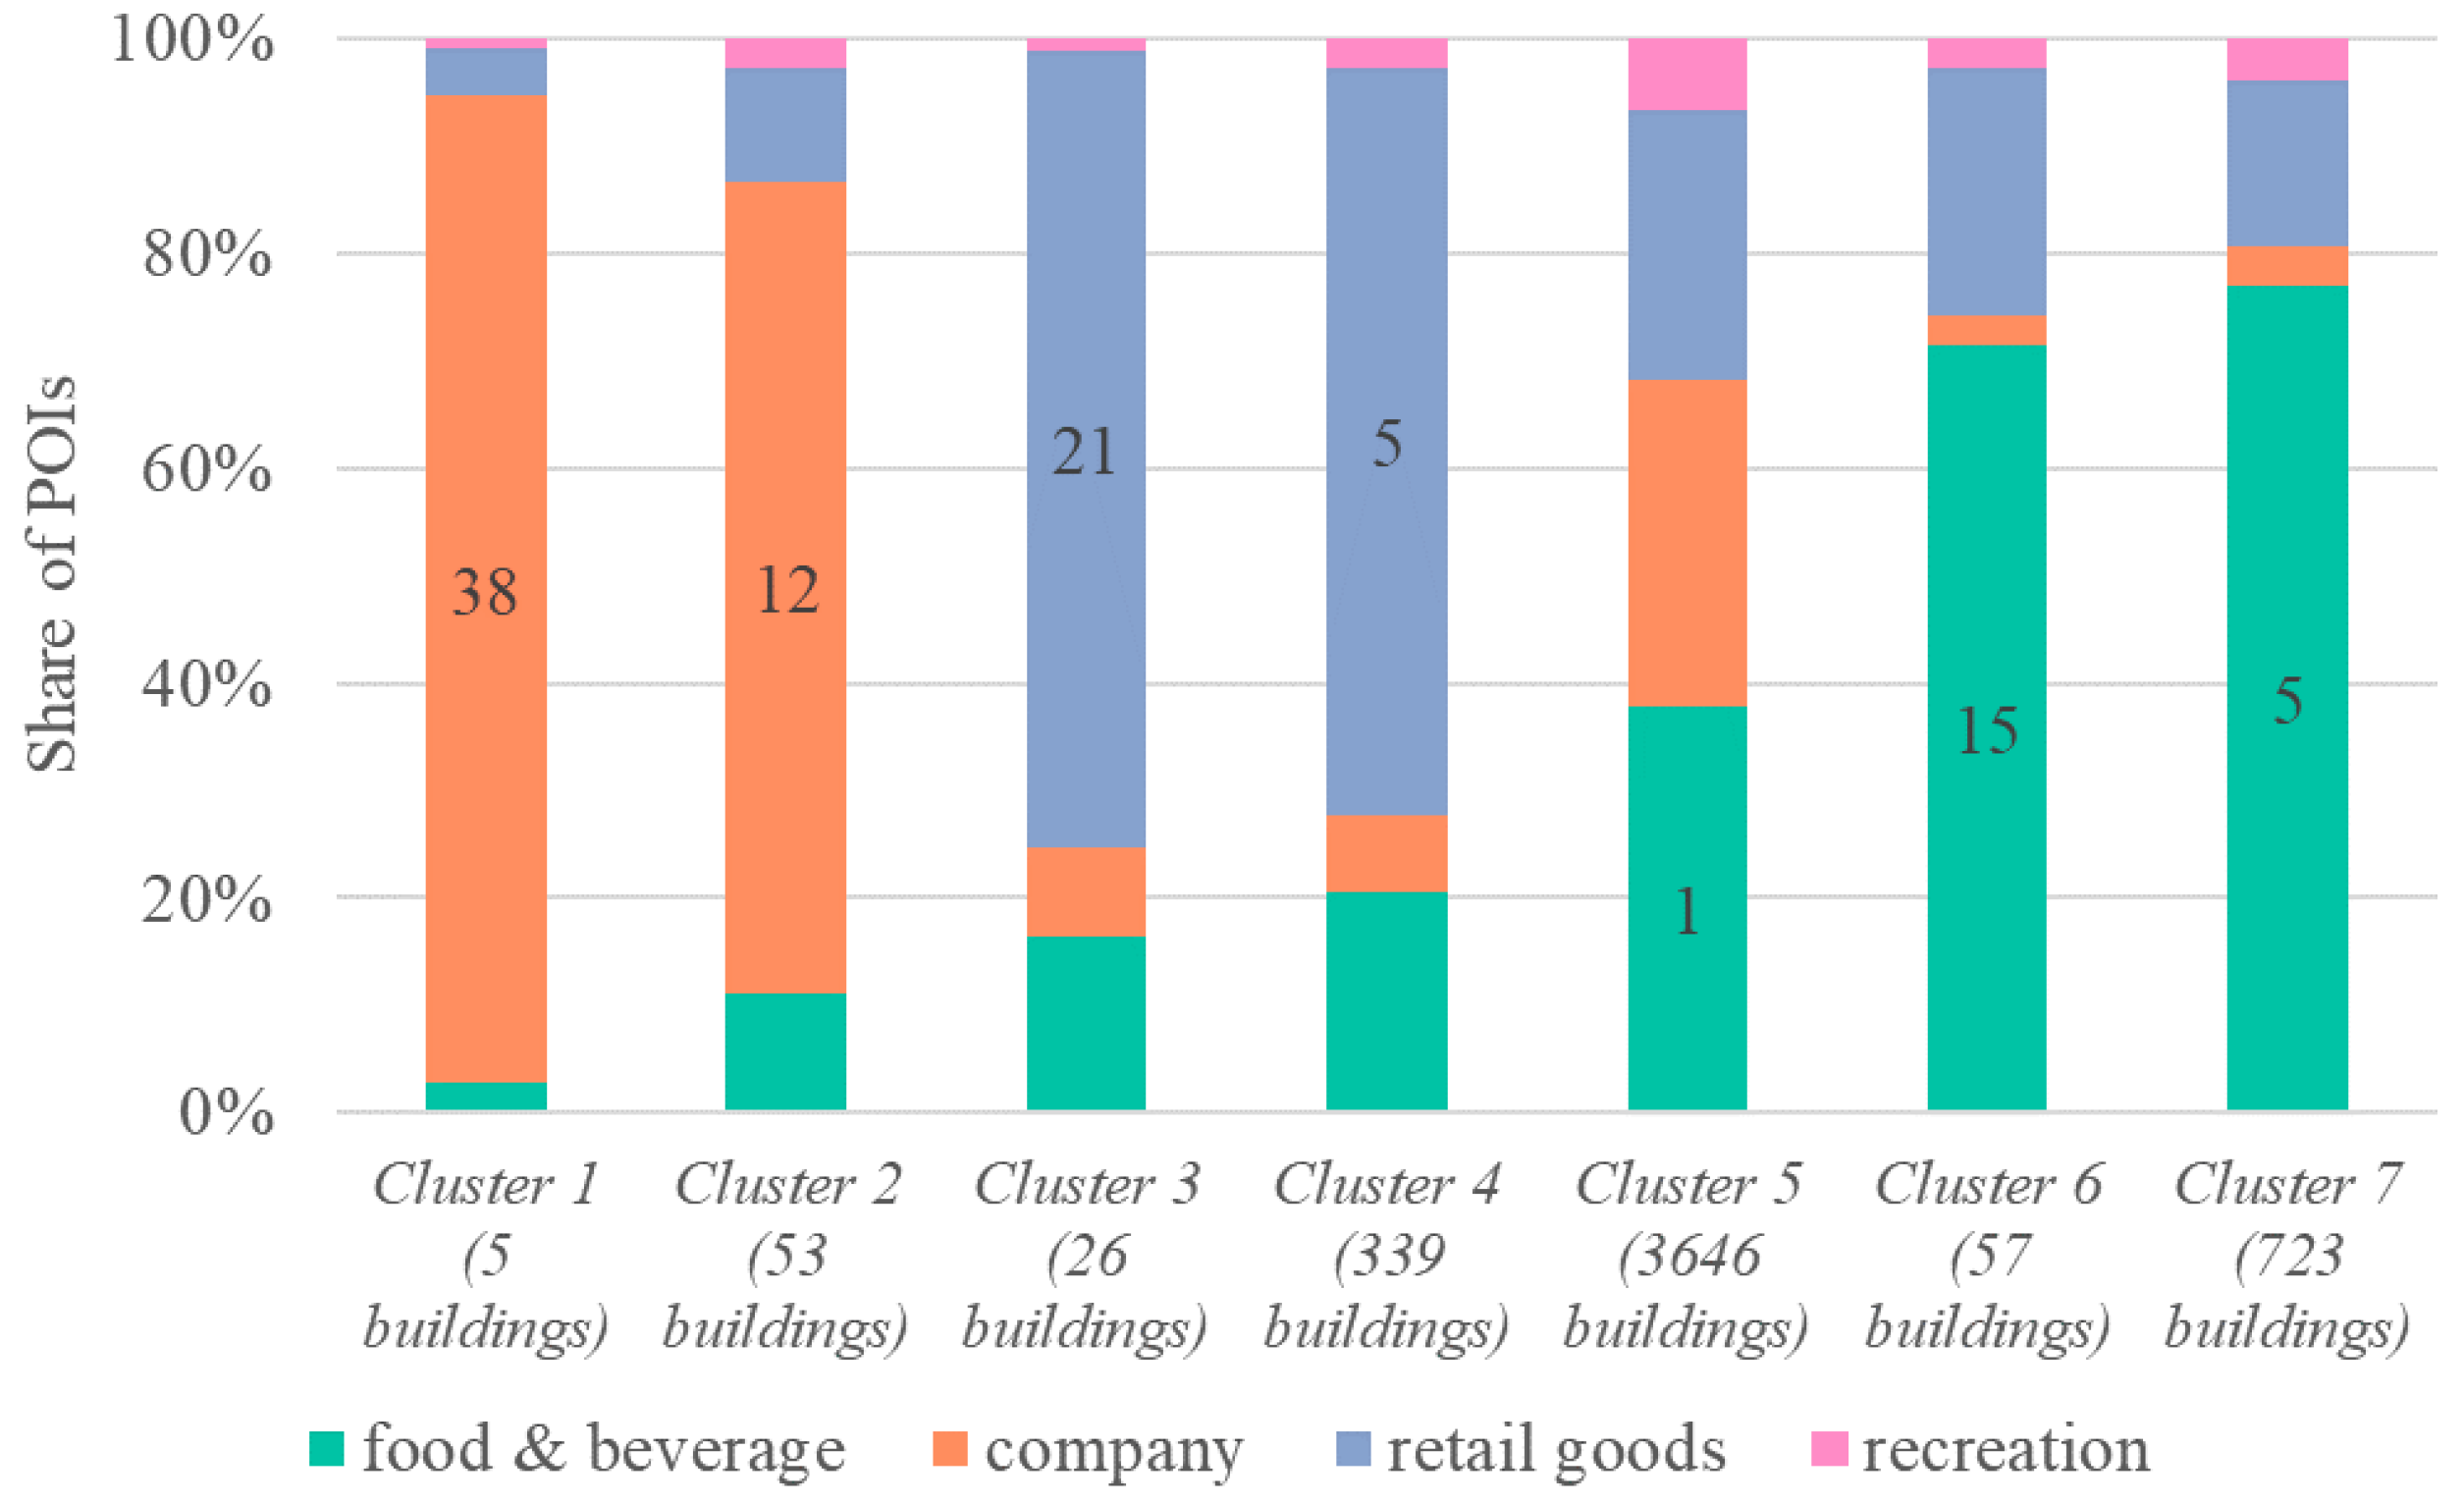
There were 4849 building footprints with no main attributes or tags. Figure 7 shows the results of seven groups. The company’s share is highest in Cluster 1 and Cluster 2; these buildings can be identified as commercial office buildings. The share of retail goods is highest in Cluster 3 and Cluster 4, but the mean of retail goods in Cluster 3 (value of 21) is much higher than Cluster 4 (value of five). Thus, Cluster 3 (26 buildings) can be identified as shopping malls, while 147 buildings from Cluster 4 can be identified as retail stores because the number of floors is less than three. The share of food and beverages is highest in both Cluster 6 and Cluster 7, therefore, 384 of these buildings can be identified as restaurants because the number of floors is less than three. The means of each kind of POI are very low in Cluster 5 (value of one), therefore, 3646 of these buildings remain unidentified due to lack of obvious commercial characteristics.
Table 6 shows the building sub-type results, with the number of clusters based on the Davies–Bouldin index. For residential buildings, Cluster 1 covers most of the residential buildings, with few commercial activities. When residential buildings have a high share of retail or catering activities, retail stores or restaurants on the first floor are assumed, such as Clusters 3 and 5. For commercial office buildings, Clusters 1, 2, and 4 mainly include company and commercial office building POIs, which can be considered as office only buildings; while Clusters 3 and 5 have some retail and food services. For hotel buildings, Cluster 4 has features that are common to hotels. For buildings with no main attributes or tags, office buildings for lease, shopping malls, retail stores, and restaurants were identified based on their characteristics.
3.4. Validation
The method inferred the building use for 47,428 buildings from 51,650 building footprints with POIs or tags information, and the detection rate reached 69% among 68,966 building footprints. A sample area of 7895 building footprints in the downtown area was selected to verify the building use identification accuracy, as shown in Figure 2. The street view from Baidu maps and satellite imagery was used to determine the sample area’s actual building uses. Table 7 shows the validation results of different building uses. The detection rate was defined as the number of identified buildings divided by the actual number of buildings. The accuracy was defined as the number of correct buildings divided by the number of identified buildings. There were 7514 buildings considered among 7895 building footprints after the validation. The other 381 building footprints were not discussed because most of them were parking lots, public toilets, demolished buildings, etc. The method identified 5590 buildings among 7514 buildings, and 4794 buildings had the correct types.
In summary, the overall detection rate was 74%, with an overall accuracy of 86%. The high detection rate of residential buildings, commercial–residential mixed buildings, hotels, shopping malls, schools, hospitals, and mixed-use buildings showed that the method could identify these buildings well. The high accuracy of detection for residential buildings, commercial office buildings, hotels, government office buildings, schools, and hospitals showed that the method was feasible for determining these buildings with POI or tag information. The detection rate and accuracy of others (retail, industrial, restaurant, tourist building) were both low, showing that these building uses could not be identified well. Moreover, there were still 2305 building footprints unidentified. A total of 1407 of them were residential buildings, 154 of them were parking lots, demolished buildings, etc. A total of 122 were retail, industrial, restaurant, and tourist buildings. A total of 133 were government office buildings, 129 were commercial office buildings, 103 were hotels, etc.
3.5. UBEM Case Study
After building use determination and validation had been completed, 129 correct commercial office buildings and 114 correct government office buildings in the downtown sample area were selected as a UBEM case study. Figure 8 shows the distribution of 243 office buildings in the CityBES.
A total of 243 office buildings were divided into three groups for modeling, based on the sub-type clustering; namely, office buildings, office buildings with retail stores on the first floor, office buildings with retail and restaurants on the first floor. Table 8 shows the general input parameters used in the office space, referring to the national standards in different periods. For retail stores and restaurants on the first floor, internal loads were set differently from office spaces, such as lighting power density, occupancy density, electronic and gas equipment power density.
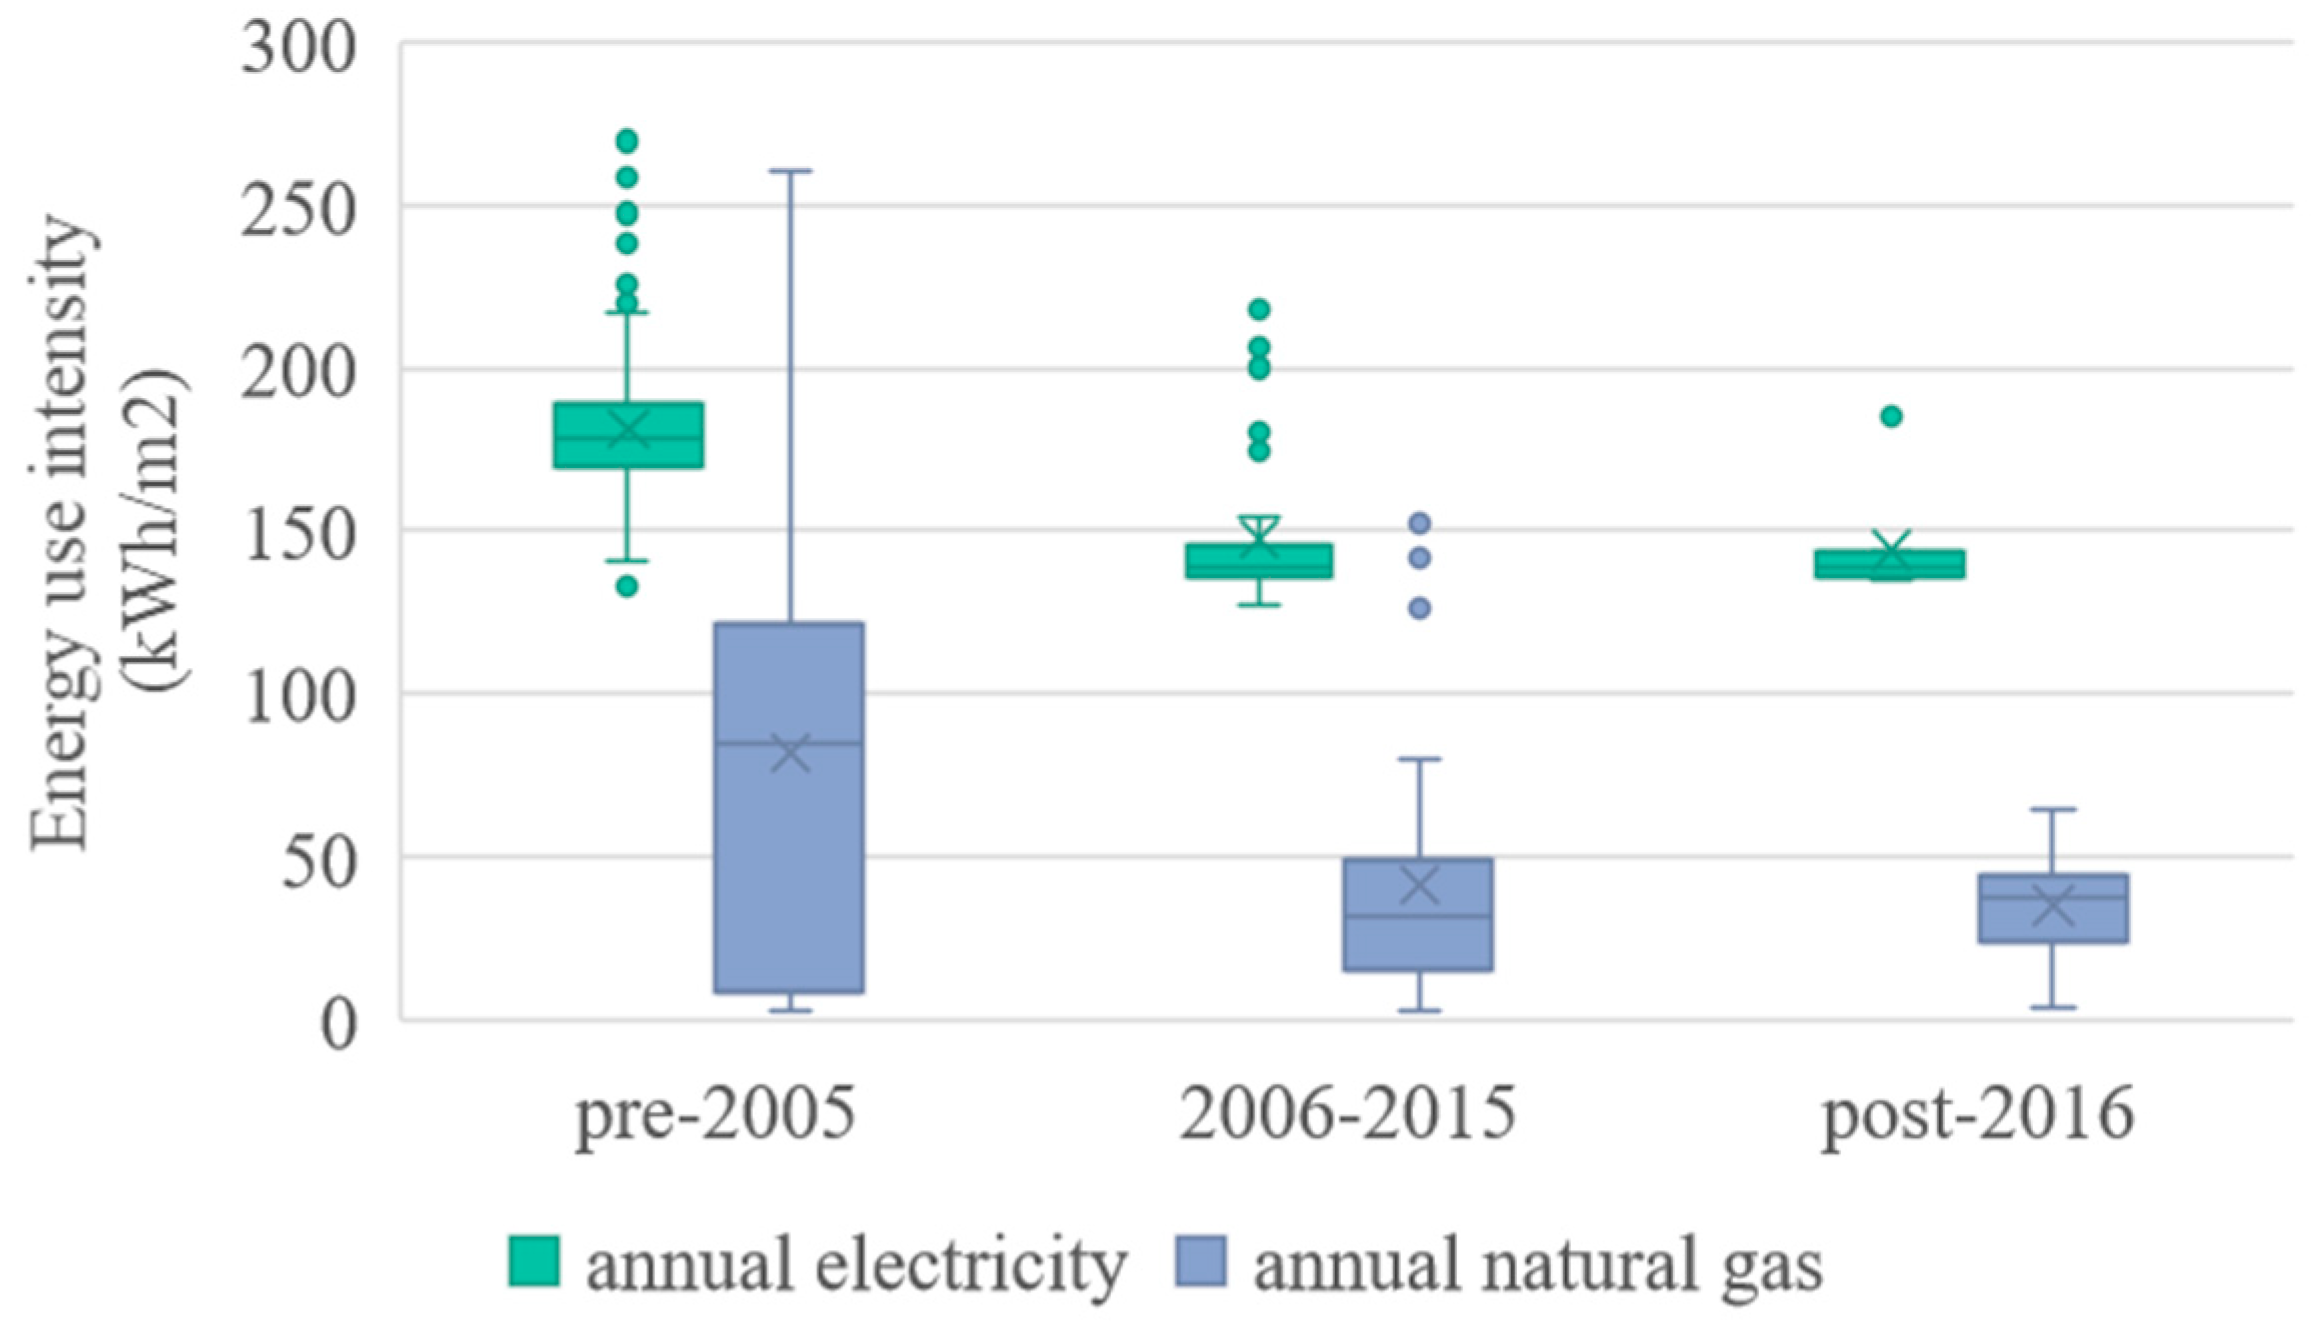
Figure 9 shows the distribution of energy use intensity (EUI) in three periods. For buildings built before 2005, the electricity EUI and natural gas EUI are much higher than others, with an average of 181.5 and 81.9 kWh/m2/year, respectively. Table 9 shows the energy use intensity of specific building uses. The averaged electricity EUI in office buildings with retail stores or restaurants is higher than general office buildings, due to functional mixed use. However, restaurants on the first floor have a relatively small impact on the averaged natural gas EUI, owing to a limited number of buildings.
4. Discussion
According to the determination results, it was concluded that 47,428 buildings were identified successfully by the method, corresponding to about 69% of the 68,966 building footprints. Looking at the other 31% unidentified building footprints through satellite maps, most of them are old residential buildings, having no concept of community boundary at that time. In addition, the POIs provided by Gaode maps contain little data about residential buildings. Given the regular shape of residential buildings, we plan to investigate the geometrical size, number of floors, and floor area, using supervised learning methods to identify these buildings for further detection rate improvement. Changsha Statistical Yearbook [40] reported that—up to 2017—the residential gross floor area was 186,171,900 square meters in five districts. The determination results show that 34,401 residential buildings, and 160,358,596 square meters of the gross floor area is estimated by multiplying building footprint areas by the number of floors, indicating an acceptable result reaching 86% of the statistical data. One reason for the deviation is that many old residential buildings were individually built without the community boundaries and could not be identified in the proposed method. Another reason, is that there are still 565 residential community boundaries located in remote areas, containing no building footprints. We will continue to update building footprints from other sources. For example, Tianditu Map [41] is China’s first official web mapping service, launched by China’s State Bureau of Surveying and Mapping, which has more complete building footprints in remote regions.
According to the sub-type clustering results, some commercial mixed-use buildings were identified in addition to the primary uses of residential buildings, commercial office buildings, and hotels. This step was not introduced in most of the existing building use determination studies. However, the proportion of commercial mixed-use buildings is relatively small, and we will focus on representative buildings as the main survey of archetype buildings. In addition to building use, archetype building identification requires furtehr information, such as building owner, age class, shape, and physical features [42], etc. We will continue to characterize the archetype buildings in future studies.
Based on the validation results, the overall detection rate of the selected sample area is 74%. We found that 61% of the 2305 unidentified buildings are residential buildings that were built very early. For detailed building uses, such as government office buildings, the low detection rate could be due to the fact that some district-level government agencies have many buildings but only one POI. The POI provided is mainly a point representing the entire area. The low detection rate of commercial office buildings and culture and art galleries due to the fact that they contain multiple building footprints. Most of the POIs are within the main parts so that the adjacent parts miss the information. In the future, we will develop the method to determine whether adjacent building footprints belong to the main parts or to other buildings. The overall accuracy of the selected sample area is 86%, which is an acceptable result compared with previous work examined in the literature review (61.68~85%). However, commercial–residential mixed buildings, shopping malls, and other (retail, restaurant, industrial, tourist) types demonstrated a low accuracy. One reason for this is that some POIs provided by the map are wrong. Some outside POIs or community tags were assigned to buildings that—considering the tolerance—do not belong to them.
The year of construction of urban buildings may not be publicly available and is often hard to obtain. Therefore, we used historical satellite images to manually determine 243 buildings at present. In the future research, the high-resolution satellite images (Ikonos, WorldView, QuickBird satellite, etc.), acquired at specific spectral bands and in different years, could be compared automatically by a machine learning algorithm, as a solution to determine the year of construction. Moreover, some housing websites contain the year of construction of residential buildings and some commercial buildings, which are good resources to determine the year of construction for our future research. The simulation results show that for buildings built before 2005, the annual electricity use intensity and the natural gas use intensity are much higher than others as there was no energy saving standard to limit usage in that period. Retail stores or restaurants on the first floor lead to higher energy consumption because of the mixed use nature of these buildings.
5. Conclusions
The case study successfully demonstrated the effectiveness of the novel building use determination method at the city-scale based on POI and community boundary GIS data. The main conclusions are summarized as follows:
- Considering GIS data spatial inaccuracies, it is important to obtain the appropriate tolerance to include more outside POIs or buildings.
- Through primary use determination and sub-type clustering analysis, the building uses of 47,428 buildings were successfully identified; about 69% of the 68,966 building footprints. The validation results of 7895 sampled building footprints showed an overall accuracy of 86%, which was acceptable based on the limited information used.
- A total of 243 office buildings in the downtown area were divided into three groups for UBEM based on the office building sub-type clustering results.
This research styudy tested the proposed method in thousands of buildings in five districts in Changsha. The method effectively provides data support for UBEM and can be applied to other cities. The method will be updated and integrated with supervised learning methods to improve the detection rate and accuracy. The automatic comparison of historical aerial imagery will be completed to determine the year of construction for buildings and energy modeling at a larger scale in the future.
Author Contributions
Conceptualization, Y.C.; methodology, Z.D. and Y.C.; validation, Z.P. and J.Y.; investigation, J.Y.; resources, X.P. and Z.P.; writing—original draft preparation, Z.D.; writing—review and editing, Y.C.; supervision, Y.C.; project administration, X.P. All authors have read and agreed to the published version of the manuscript.
Funding
This research was funded by the National Natural Science Foundation of China (NSFC) under grant number 51908204 and the Natural Science Foundation of Hunan Province of China under grant number 2020JJ3008.
Institutional Review Board Statement
Not applicable.
Informed Consent Statement
Not applicable.
Data Availability Statement
Data sharing is not applicable to this article.
Conflicts of Interest
The authors declare no conflict of interest.
References
- Statistical Communique of the People’s Republic of China on the 2019 National Economic and Social Development. Available online: http://www.stats.gov.cn/english/PressRelease/202002/t20200228_1728917.html (accessed on 28 January 2021).
- Tsinghua University Building Energy Research Centre. 2020 Annual Report on China Building Efficiency; China Architecture & Building Press: Beijing, China, 2020. [Google Scholar]
- Chen, Y.; Yang, C.; Pan, X.; Yan, D. Design and operation optimization of multi-chiller plants based on energy performance simulation. Energy Build. 2020, 222. [Google Scholar] [CrossRef]
- Reinhart, C.F.; Cerezo Davila, C. Urban building energy modeling-A review of a nascent field. Build. Environ. 2016, 97, 196–202. [Google Scholar] [CrossRef] [Green Version]
- Hong, T.; Chen, Y.; Luo, X.; Luo, N.; Lee, S.H. Ten questions on urban building energy modeling. Build. Environ. 2020, 168, 106508. [Google Scholar] [CrossRef] [Green Version]
- Mancini, F.; Nastasi, B. Solar energy data analytics: PV deployment and land use. Energies 2020, 13, 417. [Google Scholar] [CrossRef] [Green Version]
- Ferrando, M.; Causone, F.; Hong, T.; Chen, Y. Urban building energy modeling (UBEM) tools: A state-of-the-art review of bottom-up physics-based approaches. Sustain. Cities Soc. 2020, 62, 104743. [Google Scholar] [CrossRef]
- Chen, Y.; Deng, Z.; Hong, T. Automatic and rapid calibration of urban building energy models by learning from energy performance database. Appl. Energy 2020, 277. [Google Scholar] [CrossRef]
- Cerezo Davila, C.; Reinhart, C.F.; Bemis, J.L. Modeling Boston: A workflow for the efficient generation and maintenance of urban building energy models from existing geospatial datasets. Energy 2016, 117, 237–250. [Google Scholar] [CrossRef]
- Manfren, M.; Nastasi, B.; Groppi, D.; Astiaso Garcia, D. Open data and energy analytics - An analysis of essential information for energy system planning, design and operation. Energy 2020, 213, 118803. [Google Scholar] [CrossRef]
- Monteiro, C.S.; Pina, A.; Cerezo, C.; Reinhart, C.; Ferrão, P. The Use of Multi-detail Building Archetypes in Urban Energy Modelling. Energy Procedia 2017, 111, 817–825. [Google Scholar] [CrossRef]
- Chen, Y.; Hong, T.; Luo, X.; Hooper, B. Development of city buildings dataset for urban building energy modeling. Energy Build. 2019, 183, 252–265. [Google Scholar] [CrossRef] [Green Version]
- Kontokosta, C.E.; Tull, C. A data-driven predictive model of city-scale energy use in buildings. Appl. Energy 2017, 197, 303–317. [Google Scholar] [CrossRef] [Green Version]
- Li, W.; Zhou, Y.; Cetin, K.S.; Yu, S.; Wang, Y.; Liang, B. Developing a landscape of urban building energy use with improved spatiotemporal representations in a cool-humid climate. Build. Environ. 2018, 136, 107–117. [Google Scholar] [CrossRef]
- Monteiro, C.S.; Costa, C.; Pina, A.; Santos, M.Y.; Ferrão, P. An urban building database (UBD) supporting a smart city information system. Energy Build. 2018, 158, 244–260. [Google Scholar] [CrossRef]
- Nouvel, R.; Mastrucci, A.; Leopold, U.; Baume, O.; Coors, V.; Eicker, U. Combining GIS-based statistical and engineering urban heat consumption models: Towards a new framework for multi-scale policy support. Energy Build. 2015, 107, 204–212. [Google Scholar] [CrossRef]
- Nageler, P.; Zahrer, G.; Heimrath, R.; Mach, T.; Mauthner, F.; Leusbrock, I.; Schranzhofer, H.; Hochenauer, C. Novel validated method for GIS based automated dynamic urban building energy simulations. Energy 2017, 139, 142–154. [Google Scholar] [CrossRef]
- OpenStreetMap. Available online: https://www.openstreetmap.org/ (accessed on 28 January 2021).
- Schiefelbein, J.; Rudnick, J.; Scholl, A.; Remmen, P.; Fuchs, M.; Müller, D. Automated urban energy system modeling and thermal building simulation based on OpenStreetMap data sets. Build. Environ. 2019, 149, 630–639. [Google Scholar] [CrossRef]
- Fonseca, J.A.; Nguyen, T.A.; Schlueter, A.; Marechal, F. City Energy Analyst (CEA): Integrated framework for analysis and optimization of building energy systems in neighborhoods and city districts. Energy Build. 2016, 113, 202–226. [Google Scholar] [CrossRef]
- Alhamwi, A.; Medjroubi, W.; Vogt, T.; Agert, C. OpenStreetMap data in modelling the urban energy infrastructure: A first assessment and analysis. Energy Procedia 2017, 142, 1968–1976. [Google Scholar] [CrossRef]
- Colouring London. Available online: https://colouring.london/ (accessed on 28 January 2021).
- Krayem, A.; Al Bitar, A.; Ahmad, A.; Faour, G.; Gastellu-Etchegorry, J.P.; Lakkis, I.; Gerard, J.; Zaraket, H.; Yeretzian, A.; Najem, S. Urban energy modeling and calibration of a coastal Mediterranean city: The case of Beirut. Energy Build. 2019, 199, 223–234. [Google Scholar] [CrossRef]
- Hecht, R.; Meinel, G.; Buchroithner, M. Automatic identification of building types based on topographic databases – a comparison of different data sources. Int. J. Cartogr. 2015, 1, 18–31. [Google Scholar] [CrossRef] [Green Version]
- Hu, S.; Wang, L. Automated urban land-use classification with remote sensing. Int. J. Remote Sens. 2013, 34, 790–803. [Google Scholar] [CrossRef]
- Zhong, C.; Huang, X.; Müller Arisona, S.; Schmitt, G.; Batty, M. Inferring building functions from a probabilistic model using public transportation data. Comput. Environ. Urban Syst. 2014, 48, 124–137. [Google Scholar] [CrossRef]
- Niu, N.; Liu, X.; Jin, H.; Ye, X.; Liu, Y.; Li, X.; Chen, Y.; Li, S. Integrating multi-source big data to infer building functions. Int. J. Geogr. Inf. Sci. 2017, 31, 1871–1890. [Google Scholar] [CrossRef]
- Pei, T.; Sobolevsky, S.; Ratti, C.; Shaw, S.L.; Li, T.; Zhou, C. A new insight into land use classification based on aggregated mobile phone data. Int. J. Geogr. Inf. Sci. 2014, 28, 1988–2007. [Google Scholar] [CrossRef] [Green Version]
- Liu, X.; Long, Y. Automated identification and characterization of parcels with OpenStreetMap and points of interest. Environ. Plan. B Plan. Des. 2016, 43, 341–360. [Google Scholar] [CrossRef]
- Yao, Y.; Li, X.; Liu, X.; Liu, P.; Liang, Z.; Zhang, J.; Mai, K. Sensing spatial distribution of urban land use by integrating points-of-interest and Google Word2Vec model. Int. J. Geogr. Inf. Sci. 2017, 31, 825–848. [Google Scholar] [CrossRef]
- Wang, C.; Wu, Y.; Shi, X.; Li, Y.; Zhu, S.; Jin, X.; Zhou, X. Dynamic occupant density models of commercial buildings for urban energy simulation. Build. Environ. 2020, 169. [Google Scholar] [CrossRef]
- QGIS Development Team, Gossau ZH, Switzerland. Quantum GIS. Available online: https://www.qgis.org/en/site/ (accessed on 28 January 2021).
- Gaode Software Ltd, Beijing, China. Gaode Maps. Available online: https://www.amap.com/ (accessed on 28 January 2021).
- Ministry of Housing and Urban–Rural Development. Design Standard for Energy Efficiency of Public Buildings GB 50189–2005; China Architecture & Building Press: Beijing, China, 2005.
- Qian, M.; Yan, D.; Liu, H.; Berardi, U.; Liu, Y. Power consumption and energy efficiency of VRF system based on large scale monitoring virtual sensors. Build. Simul. 2020, 13, 1145–1156. [Google Scholar] [CrossRef]
- Li, Z.; Lin, B.; Zheng, S.; Liu, Y.; Wang, Z.; Dai, J. A review of operational energy consumption calculation method for urban buildings. Build. Simul. 2020, 13, 739–751. [Google Scholar] [CrossRef]
- Chen, Y.; Hong, T.; Piette, M.A. Automatic generation and simulation of urban building energy models based on city datasets for city-scale building retrofit analysis. Appl. Energy 2017, 205, 323–335. [Google Scholar] [CrossRef] [Green Version]
- Chen, Y.; Hong, T. Impacts of building geometry modeling methods on the simulation results of urban building energy models. Appl. Energy 2018, 215, 717–735. [Google Scholar] [CrossRef] [Green Version]
- Ministry of Housing and Urban–Rural Development. Design Standard for Energy Efficiency of Public Buildings GB 50189–2015; China Architecture & Building Press: Beijing, China, 2015.
- Changsha Bureau of Statistics. 2018 Changsha Statistical Yearbook; China Statistics Press: Changsha, China, 2018.
- Tianditu Map. Available online: https://www.tianditu.gov.cn/ (accessed on 28 January 2021).
- Lucchi, E.; D’Alonzo, V.; Exner, D.; Zambelli, P.; Garegnani, G. A Density-Based Spatial Cluster Analysis Supporting The Building Stock Analysis In Historical Towns. In Proceedings of the Building Simulation 2019, Rome, Italy, 2–4 September 2019. [Google Scholar]
Figure 1.
Research workflow. UBEM: Urban building energy modeling; POI: point-of-interest.

Figure 2.
Case study area: five districts in Changsha.

Figure 3.
(a) Assign POI to the building footprint. (b) Assign community tag to the building footprint.
Figure 3.
(a) Assign POI to the building footprint. (b) Assign community tag to the building footprint.
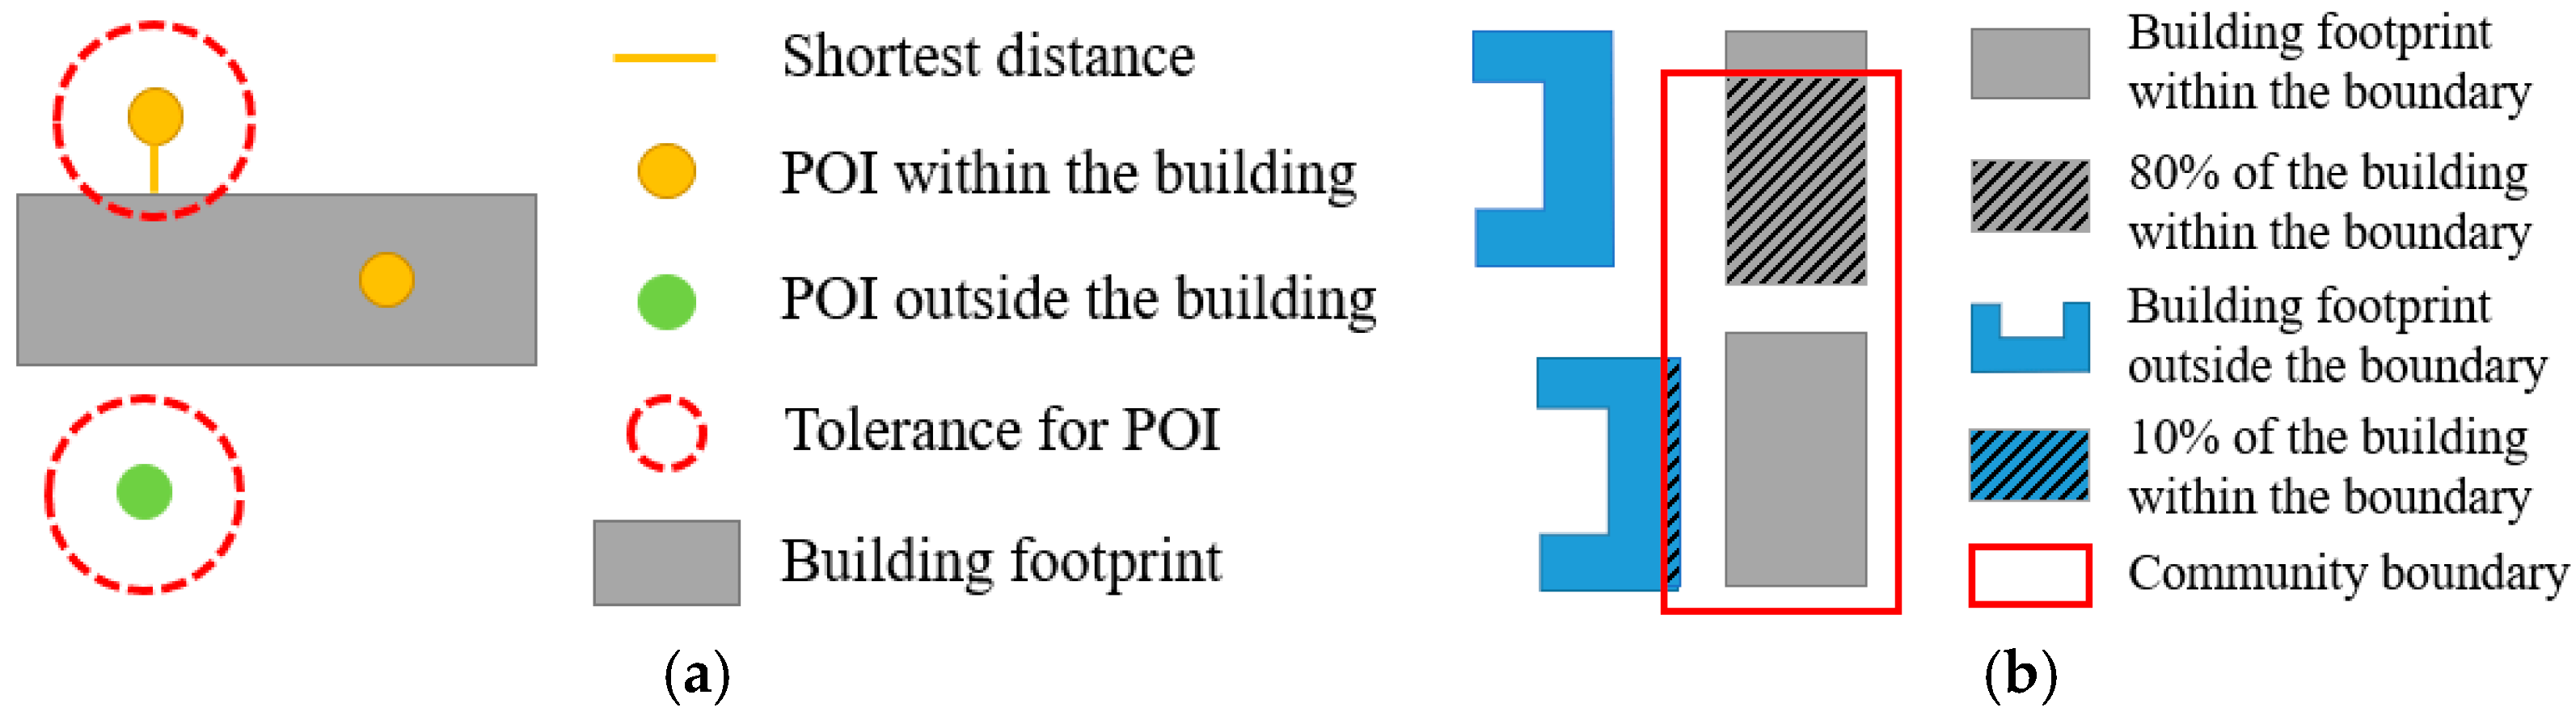
Figure 4.
UBEM case study workflow.
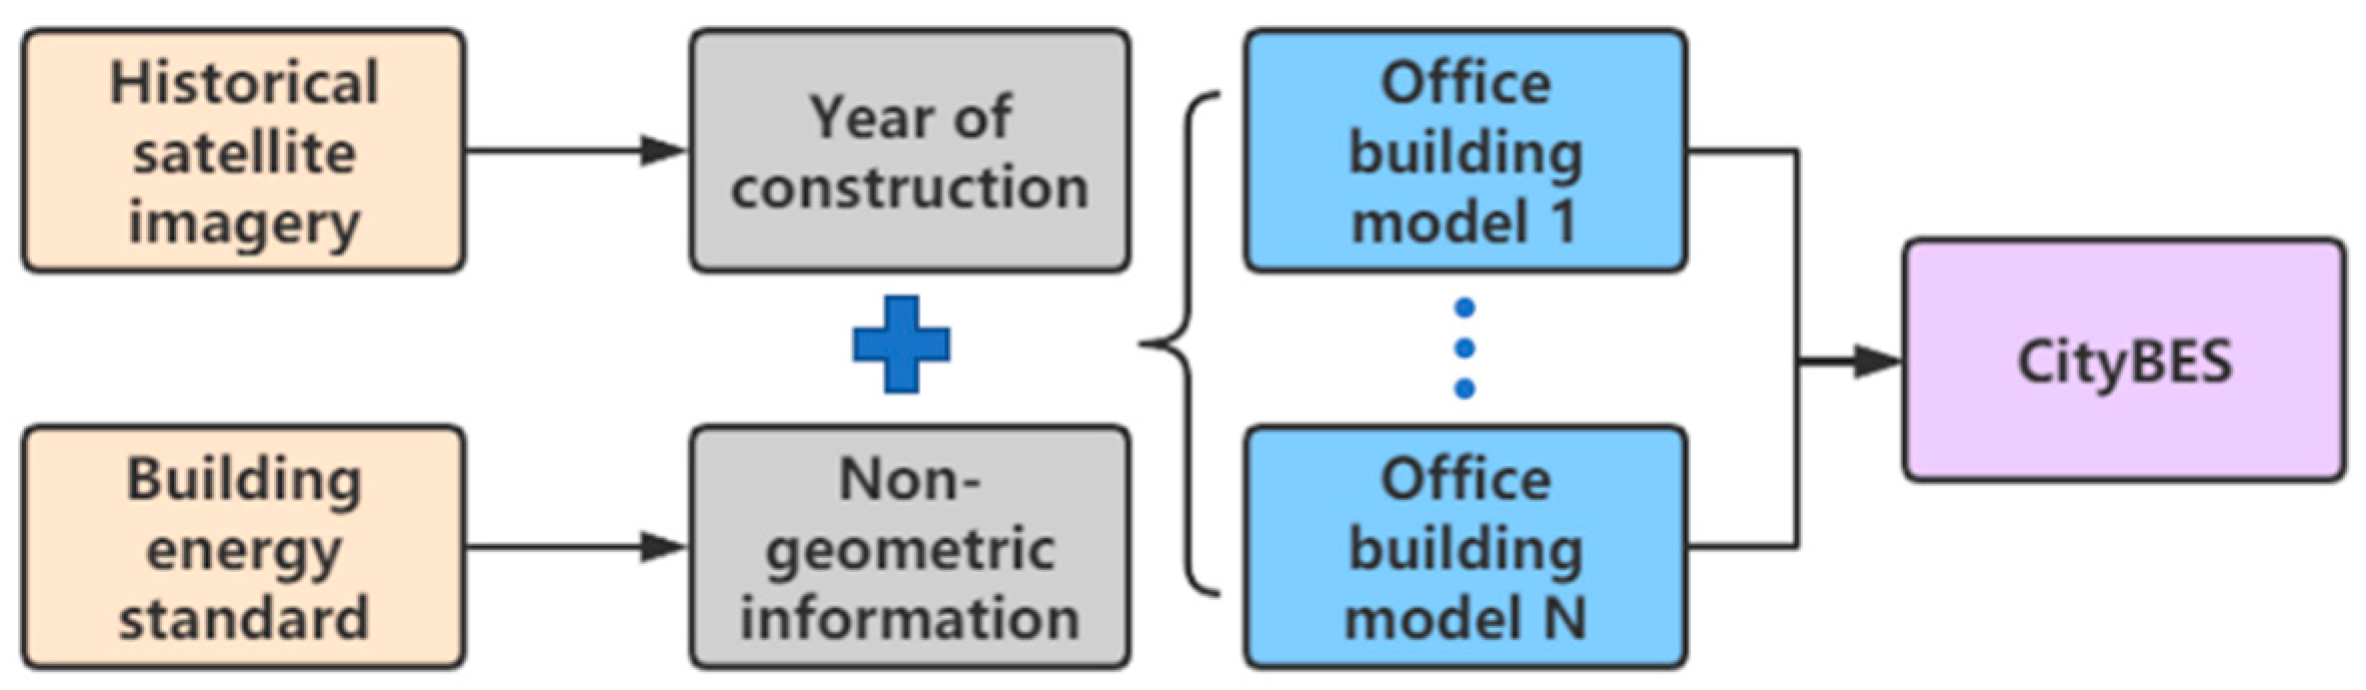
Figure 5.
Residential sub-type clustering.

Figure 6.
Commercial office buildings clustering.

Figure 7.
Buildings with no main attribute clustering.

Figure 8.
Office buildings in downtown Changsha.
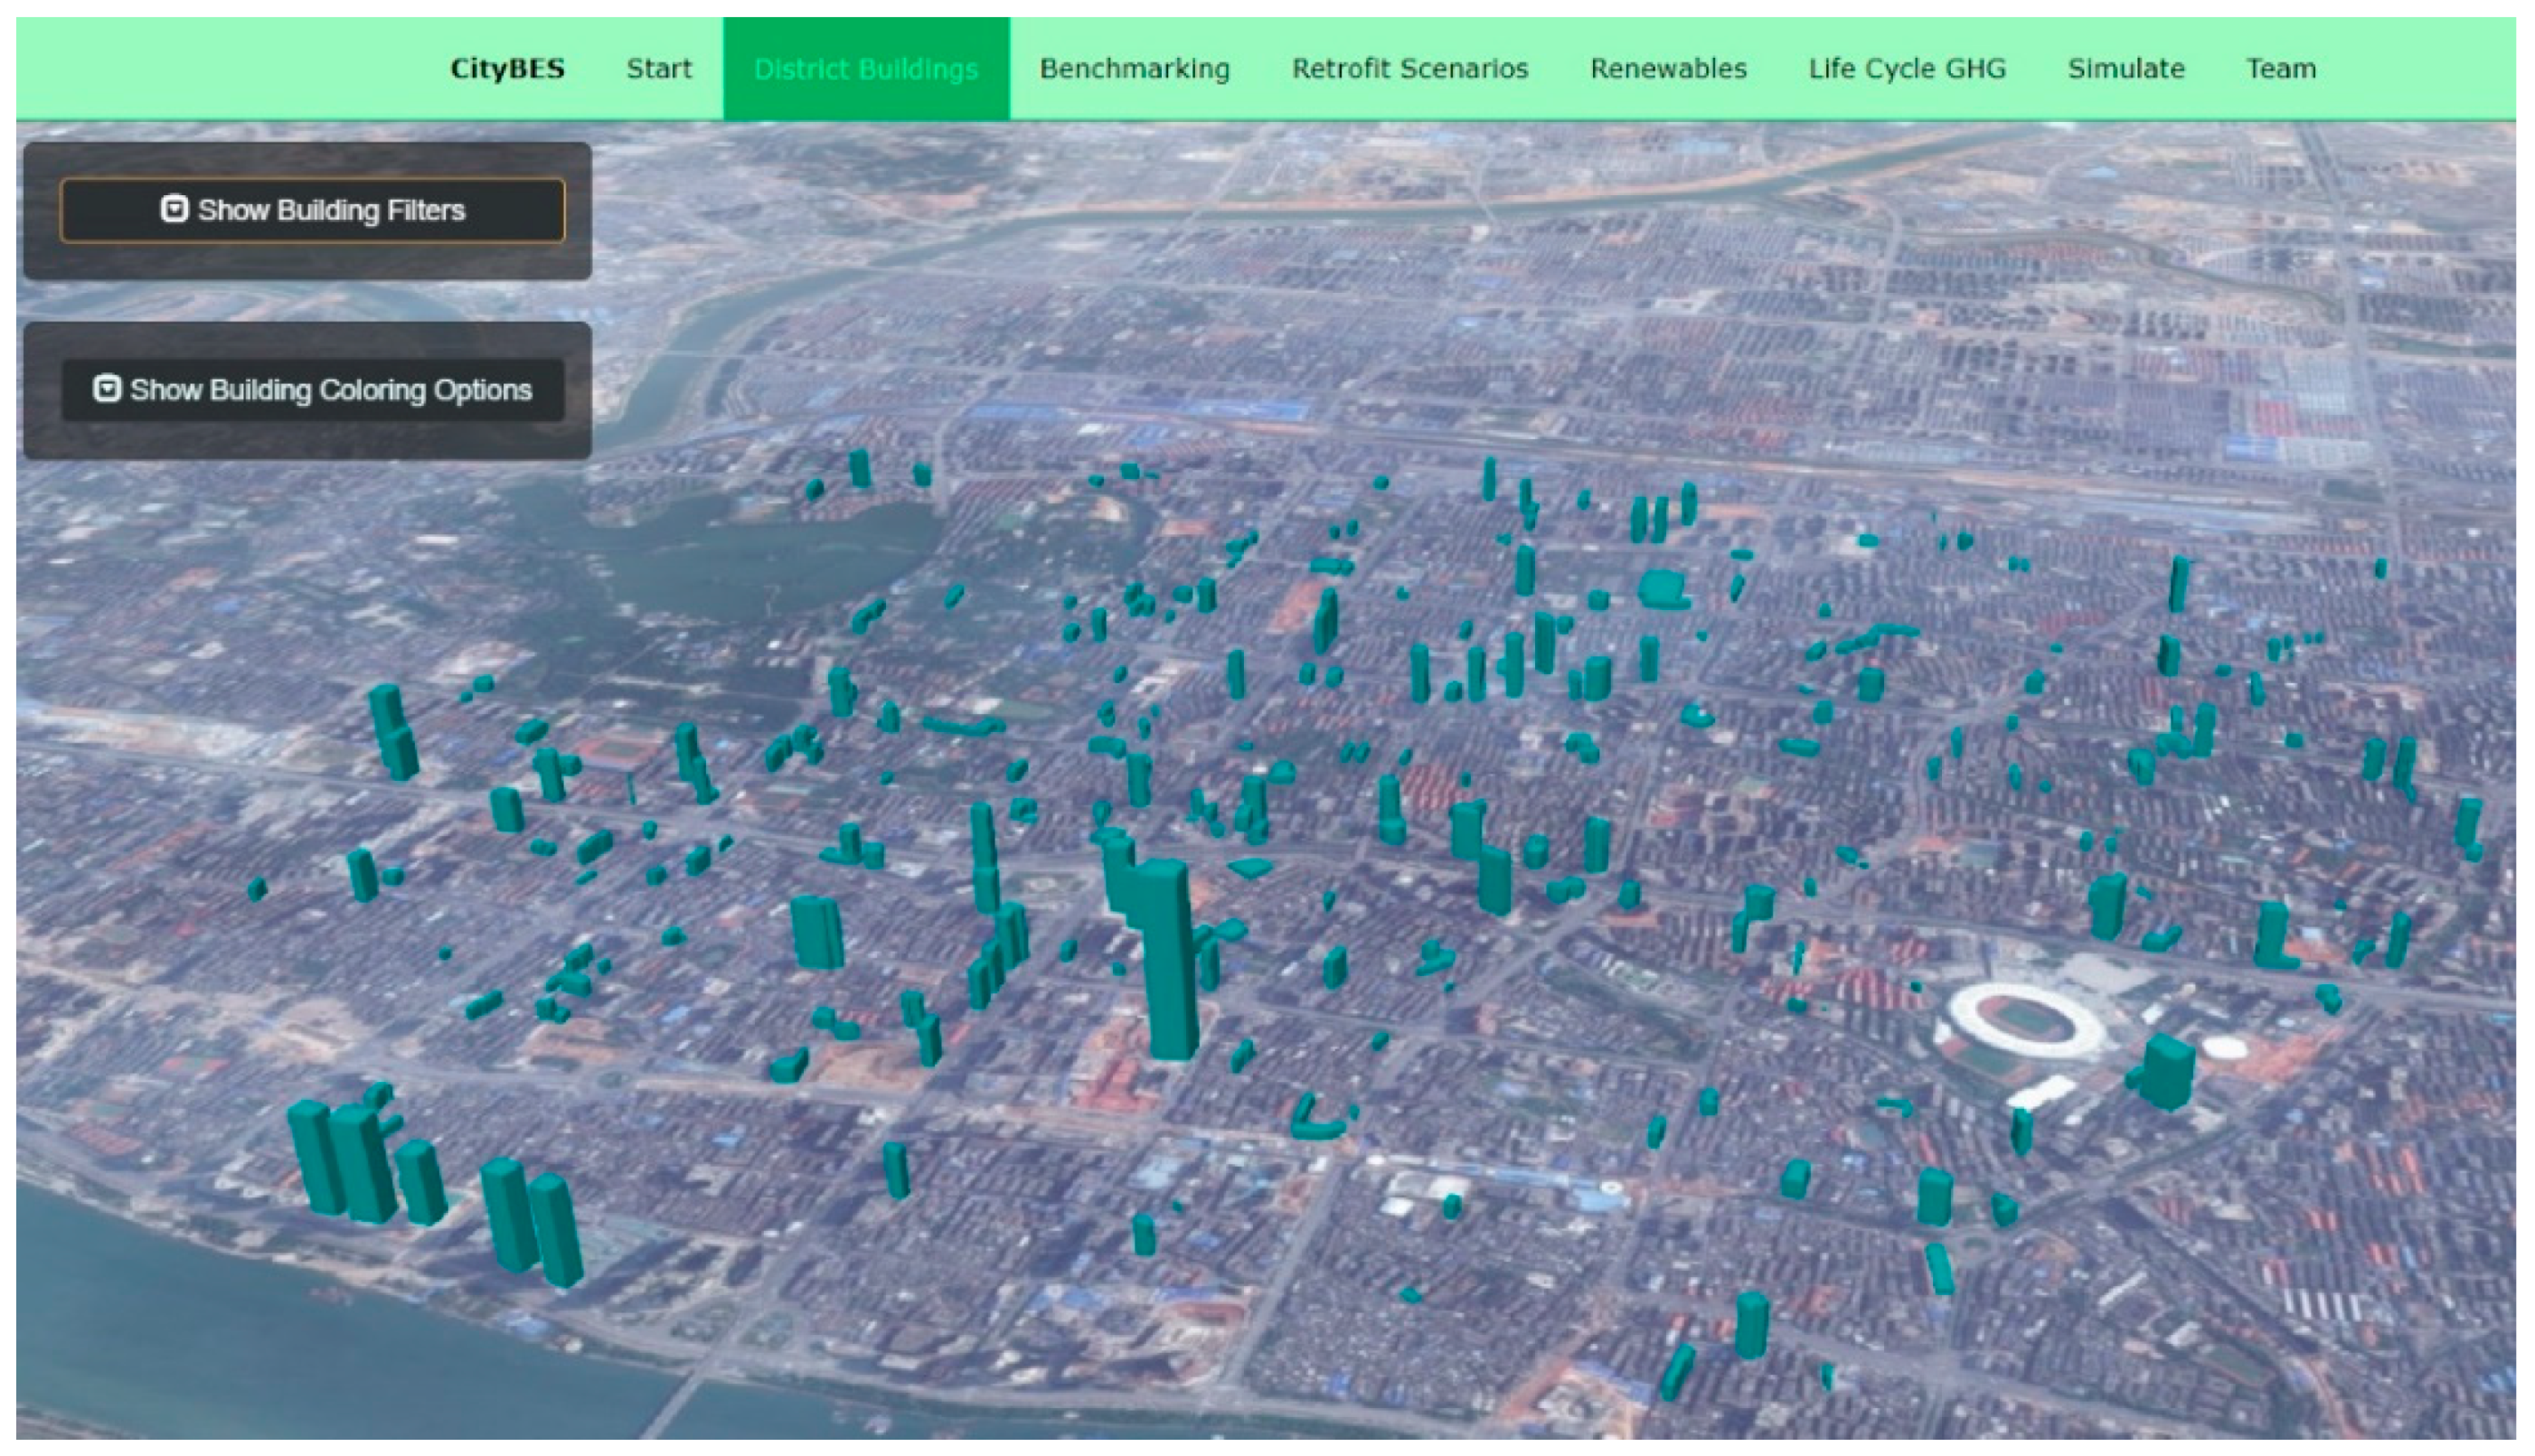
Figure 9.
The distribution of energy use intensity with periods.


Table 1.
The category and amount of original POIs.
| Category | Sub-category | Amount | Percentage |
|---|---|---|---|
| Food and Beverages | Chinese Food Restaurant, Ice Cream Shop, etc. | 47,522 | 16.9% |
| Enterprise | Company, Factory, etc. | 27,802 | 9.9% |
| Shopping | Shopping Center, Supermarket, etc. | 84,615 | 30.0% |
| Finance and Insurance Services | Bank, Insurance Company, etc. | 4227 | 1.5% |
| Science/Culture and Education Services | Museum, School, etc. | 18,933 | 6.7% |
| Commercial Housing | Building, Residential Building, etc. | 8501 | 3.0% |
| Daily Life Services | Travel Agency, Post Office, etc. | 52,476 | 18.6% |
| Sports and Recreation | Sports Stadium, Theatre and Cinema, etc. | 7141 | 2.5% |
| Medical Services | Hospital, Pharmacy, etc. | 9520 | 3.4% |
| Governmental Organization and Social Groups | Governmental Organization, Social Group, etc. | 8976 | 3.2% |
| Accommodation Services | Hotel, Inn, etc. | 12,054 | 4.3% |
| Total | 281,767 | 100% | |
Table 2.
The number of 12 categories of POIs inside one building.
| Categories | Number of POIs | Categories | Number of POIs |
|---|---|---|---|
| hotel | 0 | school | 0 |
| shopping mall | 0 | hospital | 0 |
| commercial office building | 1 | food and beverage | 11 |
| culture and art gallery | 0 | company | 42 |
| administrative agency | 0 | retail goods | 31 |
| residential building | 0 | recreation | 1 |
Table 3.
The accuracy of outside POIs with a distance tolerance.
| Distance Tolerance | Number of POIs within a Distance Tolerance | Number of POIs Belonging to Buildings | Accuracy |
|---|---|---|---|
| 1 m | 226 | 204 | 90.3% |
| 2 m | 386 | 351 | 90.9% |
| 3 m | 473 | 431 | 91.1% |
| 4 m | 540 | 482 | 89.3% |
| 5 m | 592 | 496 | 83.8% |
| 6 m | 631 | 510 | 80.8% |
Table 4.
The accuracy of buildings intersected with the boundary with percentage tolerance.
| Percentage Tolerance | Number of buildings within a Percentage Tolerance | Number of Buildings Belonging to Communities | Accuracy |
|---|---|---|---|
| 90% | 284 | 266 | 93.7% |
| 80% | 321 | 294 | 91.6% |
| 70% | 344 | 311 | 90.4% |
| 60% | 363 | 319 | 87.9% |
Table 5.
Primary building use determination results.
| Building Use | Number of Buildings |
|---|---|
| Residential building | 34,448 |
| Commercial-residential mixed building | 835 |
| Commercial office building | 393 |
| Hotel | 960 |
| Shopping mall | 91 |
| School | 5363 |
| Hospital | 649 |
| Culture & art gallery | 62 |
| Government office building | 602 |
| Hotel-office mixed building | 288 |
| Hotel-shopping mall mixed building | 53 |
| Office-shopping mall mixed building | 10 |
| Hotel-office-shopping mall mixed building | 18 |
| Other mixed-use building | 114 |
| Industrial | 584 |
| Retail | 964 |
| Tourist | 1351 |
Table 6.
Building sub-types summary.
| Primary Building Use | Clusters | Number of Buildings | Building Sub-Type Description |
|---|---|---|---|
| Residential building | Cluster 1 | 29,873 | Residential building |
| Cluster 2 | 47 | Residential–office mixed building | |
| Clusters 3, 4 | 1409 | Residential building with retail stores on the first floor | |
| Clusters 5, 6 | 3119 | Residential building with restaurants on the first floor | |
| Commercial office building | Clusters 1, 2 | 70 | Office building for lease |
| Cluster 3 | 4 | Office building with retail stores on the first floor | |
| Cluster 4 | 305 | Enterprise office building | |
| Cluster 5 | 14 | Office building with retail and restaurants on the first floor | |
| Hotel | Clusters 1, 2 | 28 | Hotel–office mixed building |
| Cluster 3 | 65 | Hotel with retail stores on the first floor | |
| Cluster 4 | 717 | Hotel | |
| Clusters 5, 6 | 150 | Hotel with restaurants on the first floor | |
| Building with no main attributes | Clusters 1, 2 | 58 | Office building for lease |
| Cluster 3 | 26 | Shopping mall | |
| Cluster 4 | 147 | Retail store | |
| Cluster 5 | 3646 | Unidentified | |
| Clusters 6, 7 | 384 | Restaurant |
Table 7.
The validation results of building use determination.
| Building Use | Number of Buildings | Number of Identified Buildings | Number of Correct Buildings | Detection Rate | Accuracy |
|---|---|---|---|---|---|
| Residential building | 5100 | 3947 | 3594 | 77.4% | 91.1% |
| Commercial–residential mixed | 94 | 101 | 55 | 100% | 54.5% |
| Commercial office | 319 | 173 | 129 | 54.2% | 74.6% |
| Hotel | 383 | 301 | 214 | 78.6% | 71.1% |
| Shopping mall | 51 | 39 | 22 | 76.5% | 56.4% |
| Government office | 312 | 153 | 114 | 49.0% | 74.5% |
| School | 287 | 222 | 201 | 77.4% | 90.5% |
| Hospital | 206 | 192 | 179 | 93.2% | 93.2% |
| Culture and art gallery | 37 | 16 | 11 | 43.2% | 68.8% |
| Mixed-use building | 300 | 223 | 146 | 74.3% | 65.5% |
| Others | 425 | 223 | 129 | 52.5% | 57.8% |
Table 8.
The input parameters used in office space.
| Parameters | Pre-2005 | 2006–2015 | Post-2016 |
|---|---|---|---|
| Lighting power density (W/m2) | 25 | 11 | 9 |
| Equipment power density (W/m2) | 25 | 20 | 15 |
| Occupancy density (person/m2) | 0.125 | 0.125 | 0.125 |
| Roof U-value (W/m2·k) | 1.5 | 0.7 | 0.45 |
| Wall U-value (W/m2·k) | 2 | 1 | 0.7 |
| Window U-value (W/m2·k) | 6.4 | 3 | 2.6 |
| Window solar heat gain coefficient (SHGC) | 0.65 | 0.5 | 0.4 |
| Chiller coefficient of performance (COP) | 4.2 | 5.1 | 5.6 |
| Boiler heating efficiency | 0.55 | 0.89 | 0.9 |
| Heating setpoint (℃) | 20 | 20 | 20 |
| Cooling setpoint (℃) | 26 | 26 | 26 |
Table 9.
The energy use intensity of specific building uses.
| Building Use | Number of Buildings | Averaged Electricity EUI* (kWh/m2) | Averaged Natural Gas EUI (kWh/m2) |
|---|---|---|---|
| Office building | 233 | 174.2 | 75.1 |
| Office building with retail stores on the first floor | 4 | 182.5 | 31.5 |
| Office building with retail and restaurants on the first floor | 6 | 186.7 | 45.4 |
Note: EUI–energy use intensity.
Publisher’s Note: MDPI stays neutral with regard to jurisdictional claims in published maps and institutional affiliations. |
© 2021 by the authors. Licensee MDPI, Basel, Switzerland. This article is an open access article distributed under the terms and conditions of the Creative Commons Attribution (CC BY) license (http://creativecommons.org/licenses/by/4.0/).
Share and Cite
MDPI and ACS Style
Deng, Z.; Chen, Y.; Pan, X.; Peng, Z.; Yang, J. Integrating GIS-Based Point of Interest and Community Boundary Datasets for Urban Building Energy Modeling. Energies 2021, 14, 1049. https://doi.org/10.3390/en14041049
AMA Style
Deng Z, Chen Y, Pan X, Peng Z, Yang J. Integrating GIS-Based Point of Interest and Community Boundary Datasets for Urban Building Energy Modeling. Energies. 2021; 14(4):1049. https://doi.org/10.3390/en14041049
Chicago/Turabian StyleDeng, Zhang, Yixing Chen, Xiao Pan, Zhiwen Peng, and Jingjing Yang. 2021. "Integrating GIS-Based Point of Interest and Community Boundary Datasets for Urban Building Energy Modeling" Energies 14, no. 4: 1049. https://doi.org/10.3390/en14041049
Note that from the first issue of 2016, this journal uses article numbers instead of page numbers. See further details here.