1. Introduction
Among all the energy storage technologies, rechargeable batteries have become indispensable since the real success of Lithium-Ion Batteries (LIBs) in the 1990s [
1]. The extensive application of these systems is due to their efficiency to store energy and to provide power for electronic devices. In recent years, two main aspects have driven the development of rechargeable batteries: (1) their implementation in electric vehicles (EVs), and (2) the demand for stationary energy storage systems coupled to renewable power plants [
2]. LIBs will continue to be the best choice for portable electronic devices due to their high energy density and simple maintenance, but the market growing necessity of lithium responds to its shortage of sources with an increasing cost [
3]. To address the need of large amounts of commodities at low costs required for large-scale energy storage, sodium has been recognized as possible substitute for the next generation of power sources [
4]. Therefore, it is increasing attention as a complement and as an alternative to lithium because of its abundance and its consequent low cost, as well as its similar chemical properties [
4]. The commercialization of Sodium-Ion Batteries (SIBs), however, is limited because of the lack of effective host materials to obtain an efficient reversible intercalation of sodium ions [
5,
6,
7].
In the research of positive electrodes for the development of SIBs, among all the possible candidates, remarkable achievements and great progress have been made on layered transition metal oxides (LTMOs) electrodes [
5,
8]. Although these materials show excellent performances, more in-depth investigations need to be done in order to push these cathodes materials onto the battery market. Overall, LTMOs cathodes for rechargeable SIBs are expected to play a pivotal role to promote the effectiveness and prototyping of SIBs for energy storage systems in the near future [
8].
Unlike their Li analogues, where only LiCoO
2 and LiNiO
2 show the ability to reversibly intercalate lithium ion, almost all Na
xTMO
2 compounds (TM = transition metals) can reversibly intercalate sodium ions in batteries [
9,
10]. In fact, the larger size of sodium ions, compared to that of lithium ions, helps to minimize the cation disorder between sodium ions and the transition metal ions [
5,
8,
9]. Most of the studies about Na
xTMO
2 have focused on the improvement of electrochemical properties, such as:
- (1)
eliminating the ordering of sodium ions vacancies to improve rate capability;
- (2)
suppressing detrimental phase transitions or uncontrolled natural surface coatings to achieve long cycling life;
- (3)
exploiting the oxygen ion redox mechanism (O22−/O24−) to achieve high energy density.
However, most Na
xTMO
2 materials are hygroscopic, which limits their practical application because of huge cost on materials synthesis, handling, and storage [
10].
Generally speaking, Na
xTMO
2 compounds are made up of sheets of MO
6 octahedra, which provide two-dimensional transport channels for the extraction/insertion of sodium ions between them [
11]. Typical Na
xTMO
2 crystallize into P2- and O3-phases based on the sodium environment and the number of oxygen stacking sequences, using P2 and O3 codes to identify a specific lattice [
5,
11]. Other structural arrangements of MO
6 octahedra are also possible, leading to a variety of polymorphs [
11].
Among others, the Na
xMnO
2 subclass shows the highest theoretical capacities, abundant and cheap metal precursor minerals, and promising environmental benignity compared to cobalt and nickel oxides [
5,
8]. Several Na
xMnO
2 ternary oxides are thermodynamically stable in the manganese-oxygen-sodium system [
12], and all are characterized by edge-sharing MnO
6 octahedra, forming double or triple chains for small sodium content, and bidimensional layers when the sodium/manganese ratio exceeds 0.7.
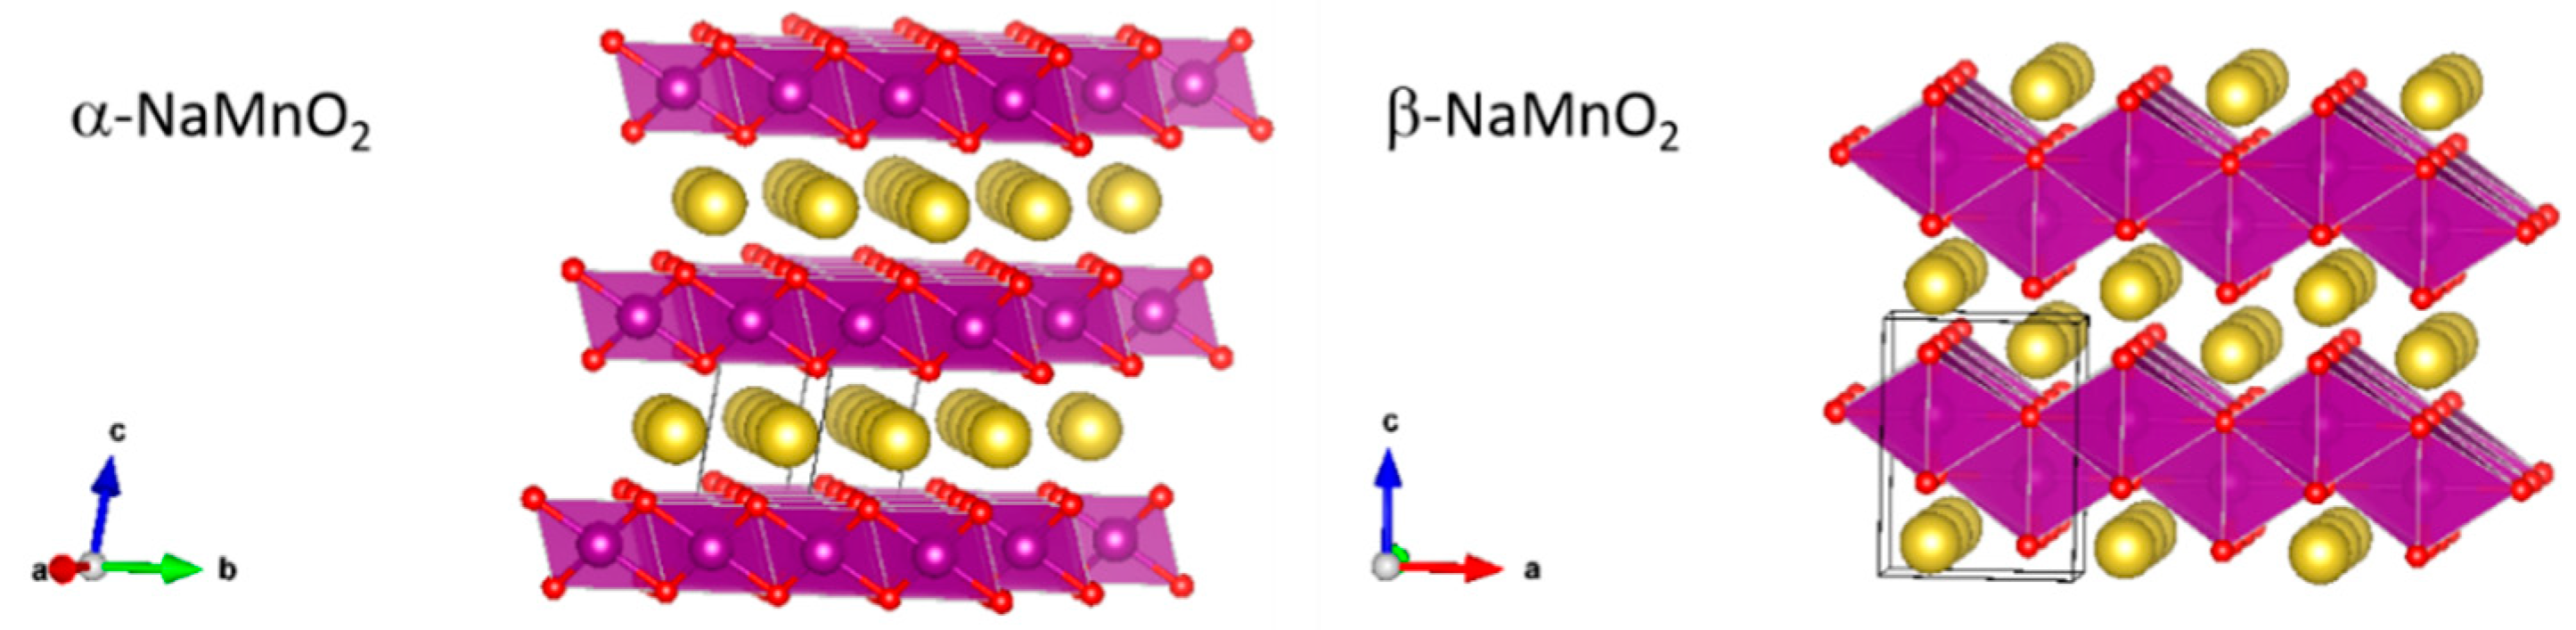
Focusing on the NaMnO
2 stoichiometry, it crystallizes in two different layered phases: (a) the low temperature α-NaMnO
2 one stable between 600 and 850 °C, and (b) the high temperature polymorph β-NaMnO
2 that is thermodynamically stable above 850 °C. Both these materials show the highest theoretical capacity among sodium manganites approaching 243.8 mAhg
−1. The α-NaMnO
2 crystallizes in a monoclinic system (C2/m space group) with cell parameters a = 5.53 ± 0.01, b = 2.860 ± 0.004, c = 5.77 ± 0.01 Å, and β = 112° [
12]. This crystal structure is a classified O3 type: sodium ions occupy octahedral sites and share edges between the MnO
6 octahedra, whereas Mn
3+ ions are six-coordinated by oxygen atoms on planar triads with a stacking AB CA BC [
11]. The β-NaMnO
2 crystallizes in an orthorhombic system with the space group Pmmn and cell parameters a = 4.77 ± 0.01, b = 2.852 ± 0.003, and c = 6.31 ± 0.02 Å. In this structure, the MnO
6 sheets buckle forming a peculiar packed layered structure where sodium ions are hexa-coordinated in the zig-zag interlayers [
12]. The representation of the two sodium manganite structures is shown in
Figure 1.
Despite their promising properties, both from the electrochemical and manufacture points of view, physico-chemical and electrochemical features of both monoclinic and orthorhombic NaMnO
2 have been reported only in few studies [
13,
14,
15]. Here, we illustrate a comparison between the α- and β-polymorphs of the NaMnO
2 compound. In particular, the structure, vibrational properties, and electrochemical performance in sodium batteries are compared to highlight differences and similarities exploiting laboratory techniques, as well as synchrotron radiation experiments. In particular, the Raman and Infrared spectra of these phases are here reported for the first time in the literature as well as the detailed structural analysis from diffraction data. Also, we report first-principles calculations based on Density Functional Theory (DFT) in order to dissect the structure-property relationships of the two polymorphs.
2. Materials and Methods
Sodium manganites have been prepared by a solid-state reaction. Sodium carbonate Na
2CO
3 (10% weight excess, Sigma Aldrich, St. Louis, MO, USA, 99.9%) and manganese oxide (III) Mn
2O
3 (Sigma Aldrich, 99.9%) have been mechanically mixed for 30 min using a shaker with two iron balls (weight ratio 100:1). The mixed powders have been pressed to form a cylindrical pellet (with dimension of approximately 1 cm in diameter and 2 cm thick). The pellet has been transferred onto an alumina boat for the calcination and covered with an equal amount in weight of the same precursor powder to mitigate the possible loss of Na-containing volatile molecules during calcination. The monoclinic α-NaMnO
2 has been obtained by high temperature annealing in air: two consecutive annealing rests (48 h + 48 h) at 700 °C have been performed, both adopting a heating rate of 5 °C/min and quenching to room temperature from the muffle to a vacuum chamber. The orthorhombic β-NaMnO
2 has been obtained by a similar approach: two consecutive annealing rests (24 h + 48 h) at 950 °C have been performed, both adopting a heating rate of 5 °C/min and quenching to room temperature from the muffle to a vacuum chamber. In both cases pellets have been collected and stored, after cooling to room temperature, in a glove box under purified Ar; materials powders have been obtained by hand-grinding in an agate mortar. The final products have been stored and always handled in an Ar-filled glove box due to their moderate sensitivity towards air moisture [
10]. The sacrificial powder used to cover the pellets in the high temperature annealing has been discarded in both cases.
X-ray diffraction (XRD) characterization have been carried out by sealing powders into glass capillaries to avoid air exposure. The pattern of the α-NaMnO
2 material has been recorded by using a Rigaku Ultima+ diffractometer (Cu-Kα radiation source, wavelength λ = 1.54 Å) in the 2θ range of 10–60° with step size of 0.05°. β-NaMnO
2 material has been instead analyzed at the ELETTRA synchrotron radiation source (MCX beamline, X-ray wavelength λ = 1.24 Å) in the same 2θ range with steps of 0.015°. The morphology of the two materials has been investigated by scanning electronic microscopy (SEM) with a Phenom-FEI instrument. Rietveld refinement procedures have been carried out using the GSAS routines [
16].
The Infrared spectra have been collected at the Soleil Synchrotron Radiation facility (AILES beamline) by means of a Bruker Vertex IFS 125 HR using CsI-pelletized samples. Raman spectra have been recorded by using a LabRam HR HORIBA Jobin Yvon spectrophotometer with a He-Ne (632.8 nm) laser source on capillarized samples.
For the electrochemical investigation, electrodes have been prepared in argon atmosphere starting from a hand grinded mixture constituted by the active material (α or β NaMnO2), superP carbon (Timcal), and PVdF-HFP (Kynar Flex 2801) binder in the weight ratio 76:12:12. Both the carbon additive and the co-polymer powders have been previously dried at 110 °C in vacuum overnight. Pelletized electrodes have been obtained by pressing the composite powder at 5 tons using a 13 mm in diameter die set, thus obtaining self-standing mechanically stable pellets with mass loading of active material in the range 8–12 mg cm−2. Also, casted electrodes have been prepared in air by doctor-blading a tetrahydrofurane (THF, Sigma Aldrich) suspension of the composite powder onto pyrolytic graphite foils (MTI corp, Richmond, CA, USA). Graphite foils have been used instead the standard aluminum foils to prevent corrosion of the counter collector at high voltage due to NaTFSI. The filmed foils have been cut in disks with diameter of 10 mm (active material mass loading 1–3 mg cm−2) that have been dried in vacuum overnight at 120 °C and stored in a glove box.
Half sodium cells have been assembled in the glove box using El-Cell Std laboratory cells. Positive electrodes (both pellets and casted disks) have been coupled with fiberglass separators (Whatman, Maidstone, UK) and a sodium metal disks. Different electrolytes have been investigated and soaked onto the separators: 1 M sodium perchlorate NaClO4 (anhydrous, Sigma Aldrich, 98%) in propylene carbonate PC (anhydrous, Sigma Aldrich battery grade), 1 M sodium bis(trifluoromethanesulfonyl)imide NaTFSI in PC (Solvionic, Toulouse, France), 1 M NaTFSI in PC with 3% wt of fluoroethylene carbonate FEC (Solvionic), and 1 M NaTFSI in an ethylene carbonate:dimethyl carbonate (EC:DEC = 1:1 volume ratio) mixture (Solvionic). Flat-type half-cells (ECC-Std EL-CELL) have been assembled by coupling the cathode electrode with a sodium metal foil as a counter electrode and by using a Whatman fiber disk as a separator soaked with the electrolyte. Current rates have been calculated in respect to the mass of the active material. Galvanostatic cycling tests have been carried out by a battery analyzer (MTI Corp).
Spin-polarized DFT calculations [
17,
18] have been performed within periodic boundary conditions by means of plane waves (PW) basis set and projector-augmented wave potentials as implemented in the VASP code [
19]. The rotationally invariant DFT+U approach has been applied to overcome the well-known self-interaction error (SIE) occurring in strong correlated materials [
20]. The Perdew–Burke–Ernzerhof exchange-correlation functional [
21] has been employed, with a (
U-J)
eff value of 4.0 eV for the Mn
d states [
22]. The D3-approach developed by Grimme together with the Becke–Johnson (BJ) damping scheme [
23] has been used to consider dispersion contribution. The PW kinetic energy cut-off was set to 800 eV with a Γ-centered 4 × 8 × 4 k-point mesh sampling. The SCF energy threshold has been set to 10
−5 eV. Lattice parameters and atomic positions have been fully relaxed until forces on each atom were below 0.03 eV/Å.
3. Results
3.1. Synthesis: Phase Identity, Purity, and Morphology
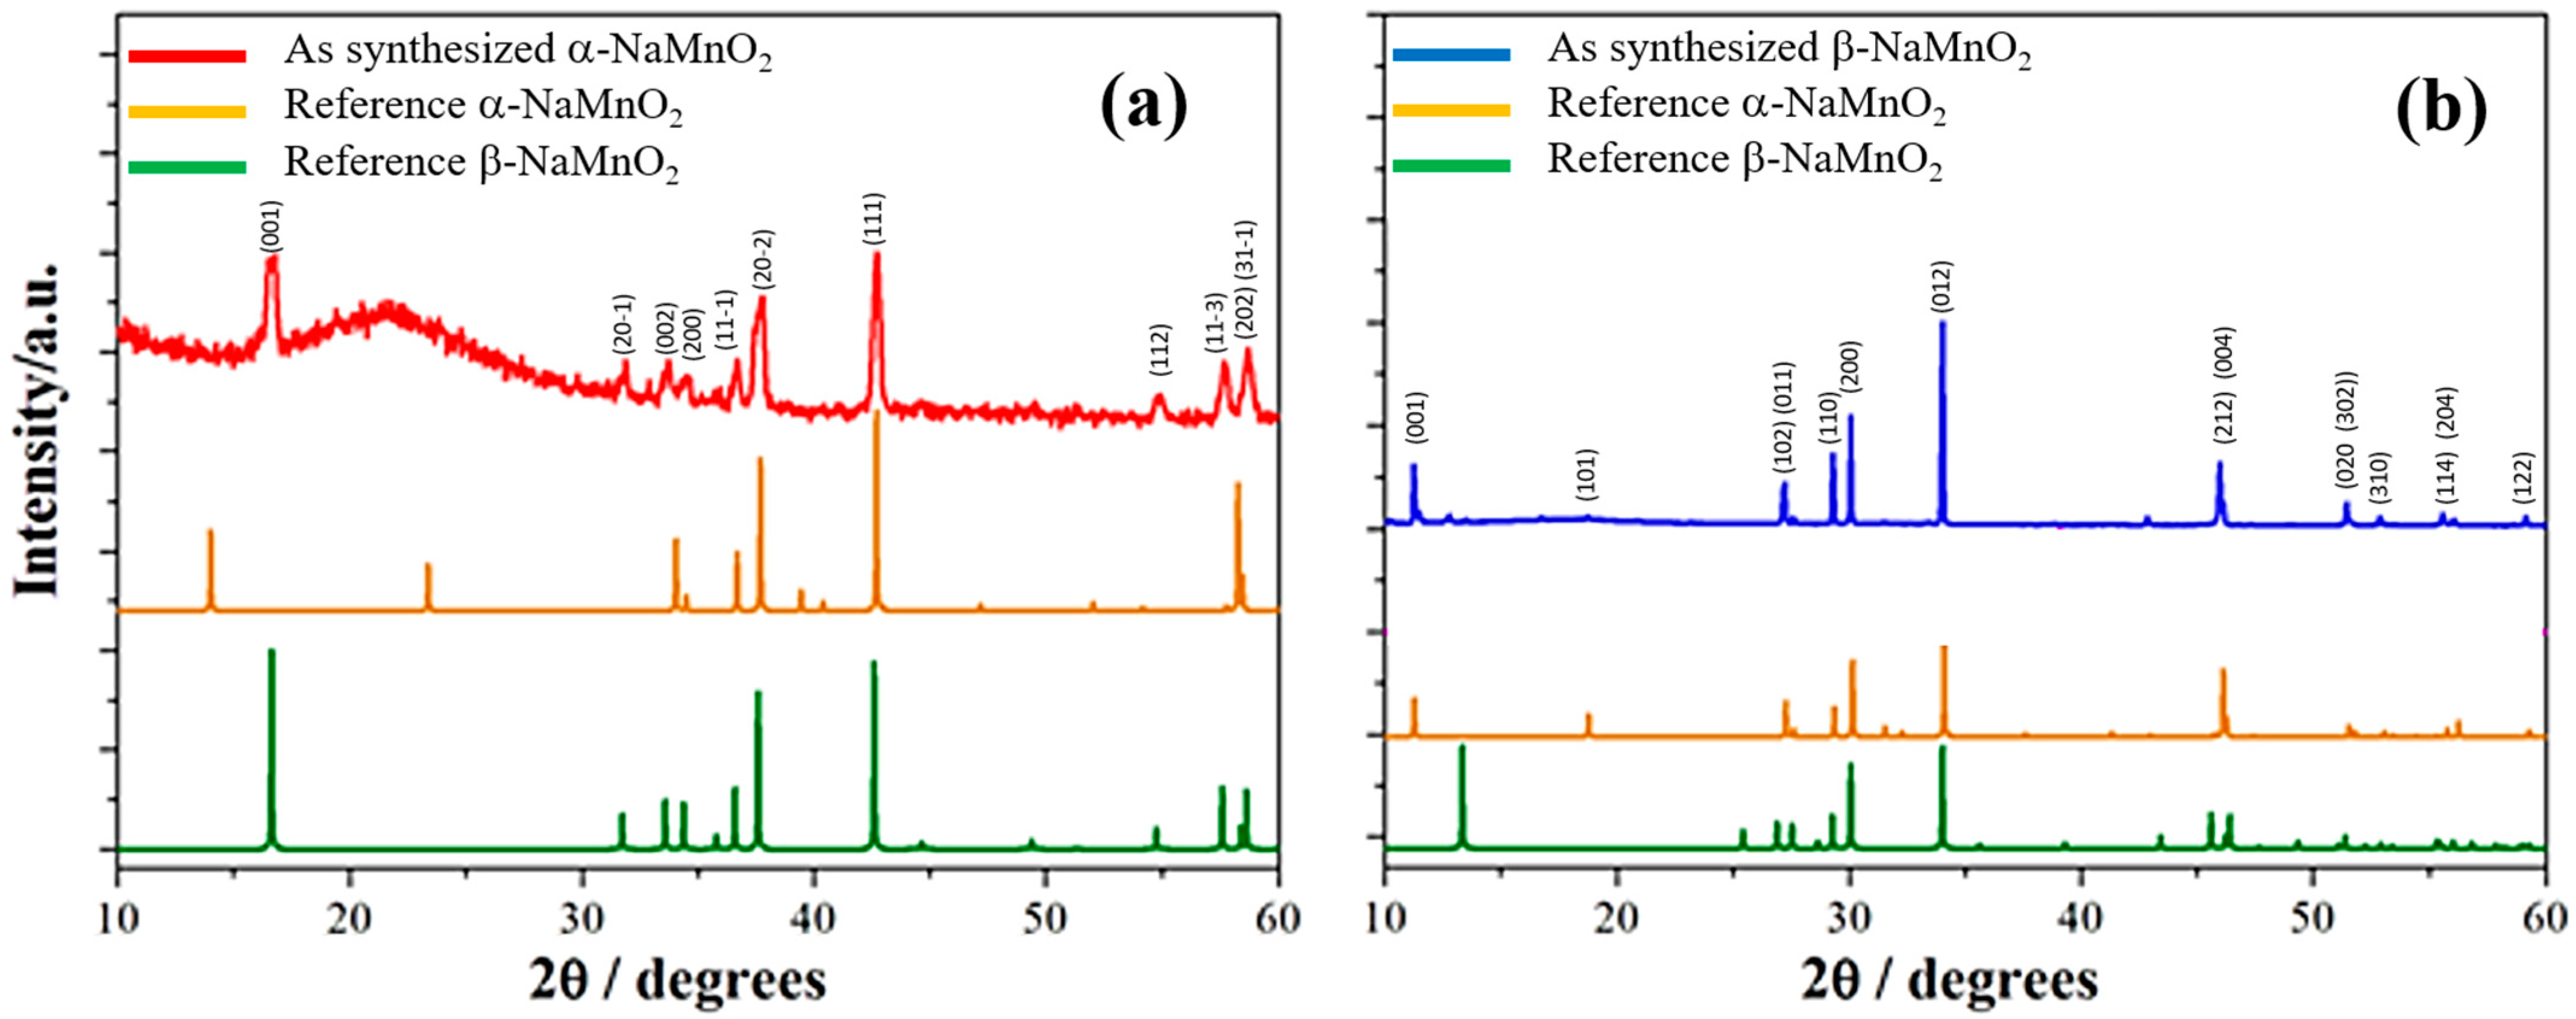
The XRD patterns of the as-synthesized α- and β-NaMnO
2 are shown in
Figure 2, indexed to the respective monoclinic and orthorhombic lattices.
The α-NaMnO
2 sample pattern (
Figure 1a) matches to the monoclinic C2/m alpha phase (ICSD 21028). The background and the broad undulation between 20 and 30° are due to the glass capillary in this region. No contaminations are highlighted by XRD.
In the case of the β-NaMnO
2 (
Figure 1b), all the XRD peaks (see
Figure 1b) can be indexed to an orthorhombic crystal system with Pmmn space group (ICSD 16271); concerning the peak at 2θ ≈ 19.5°, the absence of this reflection in the experimental diffractogram has been already reported in the literature [
13] and it may be due to a possible preferential orientation of the crystallites. In this sample, a minor trace of α-NaMnO
2 can be found, as highlighted by the weak peak at about 14° in the
Figure 1b. This minor contamination is expected since the quenching of the beta phase to room temperature unavoidably crosses the phase stability range of the alpha phase (600–850 °C). A tentative estimate of the contamination by Rietveld refinement suggests a concentration of the alpha-phase lower than 5%.
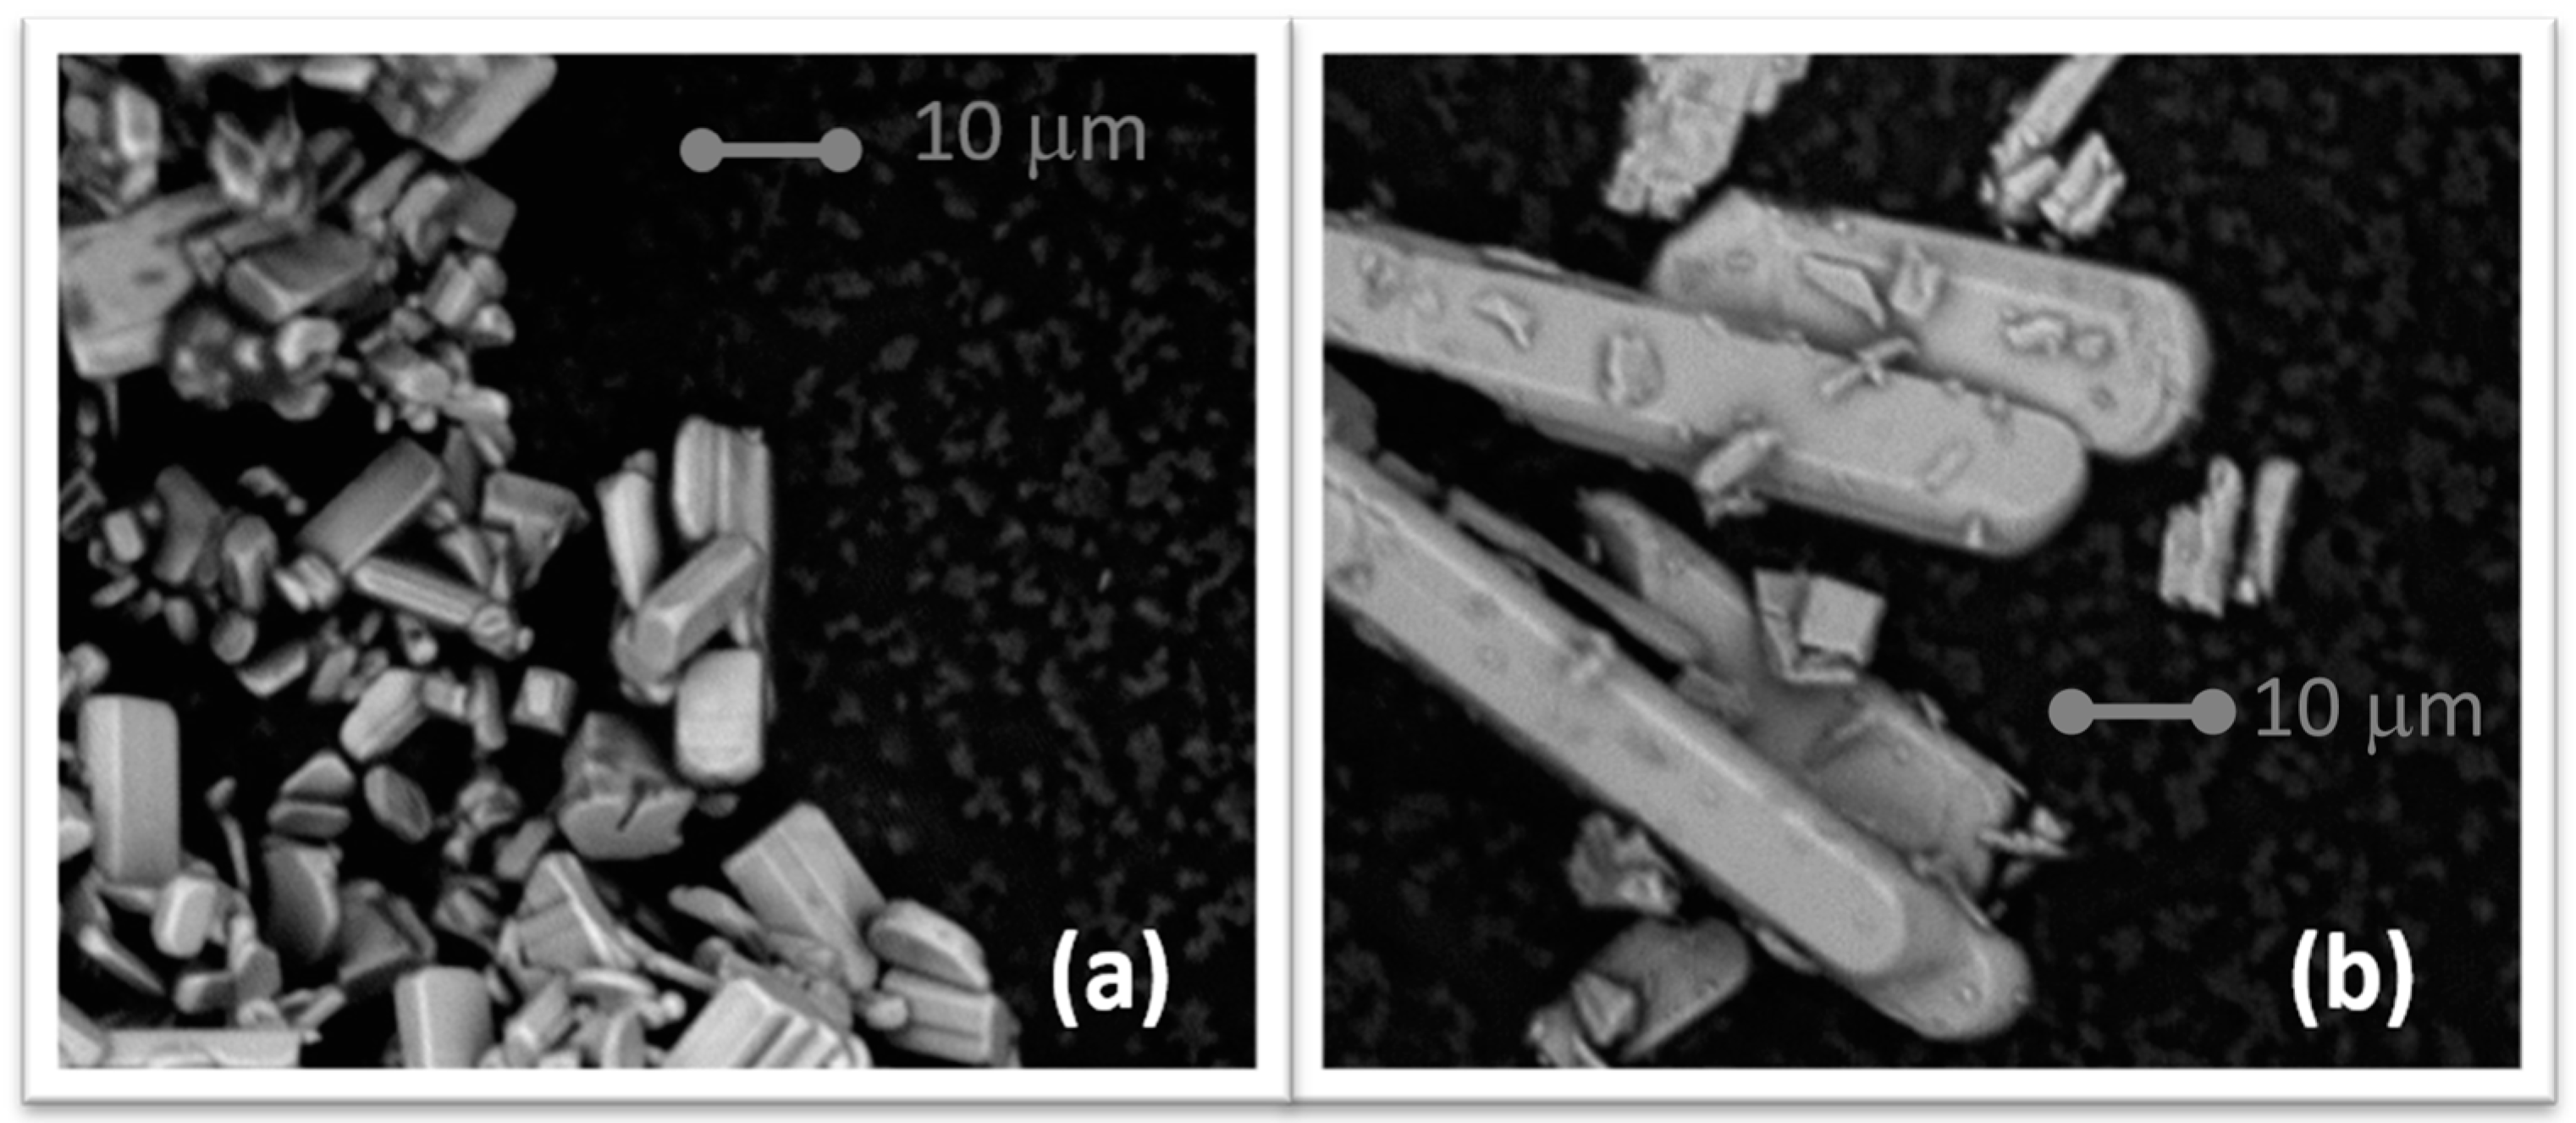
The SEM micrographs of the two samples are shown in the
Figure 3 to highlight their morphologies.
As expected, the size of the crystallites is quite different in the two cases; the monoclinic phase is constituted by regular prisms with a variety of shape and size in the 1–10-micron linear size. The orthorhombic phase is constituted by large anisotropic prismatic crystallites elongated in rod shapes. The dimensions of these rods are 100–200 microns in length and 5–10 microns in lateral size. Also, few minor irregular fragments are observed, possibly originated by the pulverization of the larger rods upon cooling from high temperature. The anisotropy of the crystallite shape in the case of the β-NaMnO2 agrees with the XRD observations (see above).
This difference in size is expected since the synthesis temperature is quite different for the two monoclinic and orthorhombic phases (i.e., 750 vs. 950 °C), thus leading to a very different crystal growth that is likely boosted by the ion diffusion at a higher temperature.
3.2. Structural Analysis of the Monoclinic and Orthorhombic Polymorphs
The crystal structure of the monoclinic a-NaMnO
2 optimized by Rietveld Refinement is summarized in the
Table 1.
Compared to the available experimental structures [
12,
14], our unit cell appears larger by about 2.4% in respect to Parant et al. [
12], or slightly smaller (−0.4%) compared to Ma et al. [
14] and Abakumov et al. [
24]. It is important to underline that the here reported crystal structure of the α-NaMnO
2 is the first complete set of structural parameters including atomic positions. Turning to the metal ions local coordination, both Na and Mn are coordinated by 6 oxygen atoms. The MO
6 octahedra are distorted in the case of the Mn-O coordination 2.44 Å (2×) and 1.95 Å (×4), whereas the NaO
6 polyhedra are almost isotropic in shape 2.31 Å (×4) and 2.36 Å (×2). The possible occurrence of antisite defects have been checked for both alpha and beta polymorphs by simultaneous constrained refinement of the crystal site occupancies of Na and Mn. In the case of the alpha polymorph, the Rietveld refinement converged to a negligible antisite concentration.
The crystal structure optimized by Rietveld Refinement of the orthorhombic β-NaMnO
2 is summarized in the
Table 2.
The here reported crystal structure is remarkably similar to the few available literature data, with the cell volume only 0.3 and 0.1% larger compared to Abakumov et al. [
24] or Parant et al. [
12]. It is important to underline that, also in this case as far as we know, the here reported crystal structure of the β-NaMnO
2 is the first complete set of structural parameters including atomic positions.
Three main structural features are highlight by the Rietveld refinement results:
The MnO
6 octahedra are distorted both in the α- and β-NaMnO
2 phase. The Mn-O distances are in the β-NaMnO
2 phase 1.90 Å (×2), 2.20 Å (×2), and 2.40 Å (×2) and fall in the same range of the alpha-phase. In both cases, octahedra are distorted; this feature is expected since the Mn(III) centers likely undergo Jahn–Teller distortion [
12].
A large antisite defectivity (approximately 9.4%) occurs between Na
+ and Mn
3+ ions in the beta-phase whereas these defects are almost absent in the alpha-polymorph (<0.1%). Both these evaluations are first determinations; in the case of the orthorhombic phase, our result agrees qualitatively with the observation reported by Billaud et al. [
13] concerning the possible extended staking defectivity in the ABAB motifs along the (100) direction.
The refined oxygen Debye–Waller thermal factors are large compared to those of the sodium and manganese. It is likely that the occurrence of antisites disorders the TM-O and Na-O coordination shells. On the other hand, these large thermal factors may also be clue of an unsatisfactory description of the overall crystal structure. A specific structural study about the crystal structure of the beta-polymorph is in progress in our laboratories.
The structures of both polymorphs have been also simulated by DFT. In particular, we carried out the theoretical characterization of α- and β-NaMnO
2 phases focusing on both structural and electronic properties. We exploited the PBE+U scheme that has been widely adopted for TM-based oxides [
25,
26,
27], and we also considered the D3BJ correction for dispersion, which can be crucial for a correct prediction of structure and relative phase stabilities [
28].
Table 3 lists the results of crystal structure predictions by PBE+U calculations with and without the D3BJ term.
Comparison of computed cell parameters with experimental XRD data unveils that the error deviation on each lattice constant is largely decreased when dispersion forces are considered (from 1.66% to 0.77% in α-NaMnO2 and from 1.50% to 0.50% in β-NaMnO2). Thus, the analysis of both structural and electronic features of the two materials is, therefore, performed at the PBE+U-D3BJ level of theory.
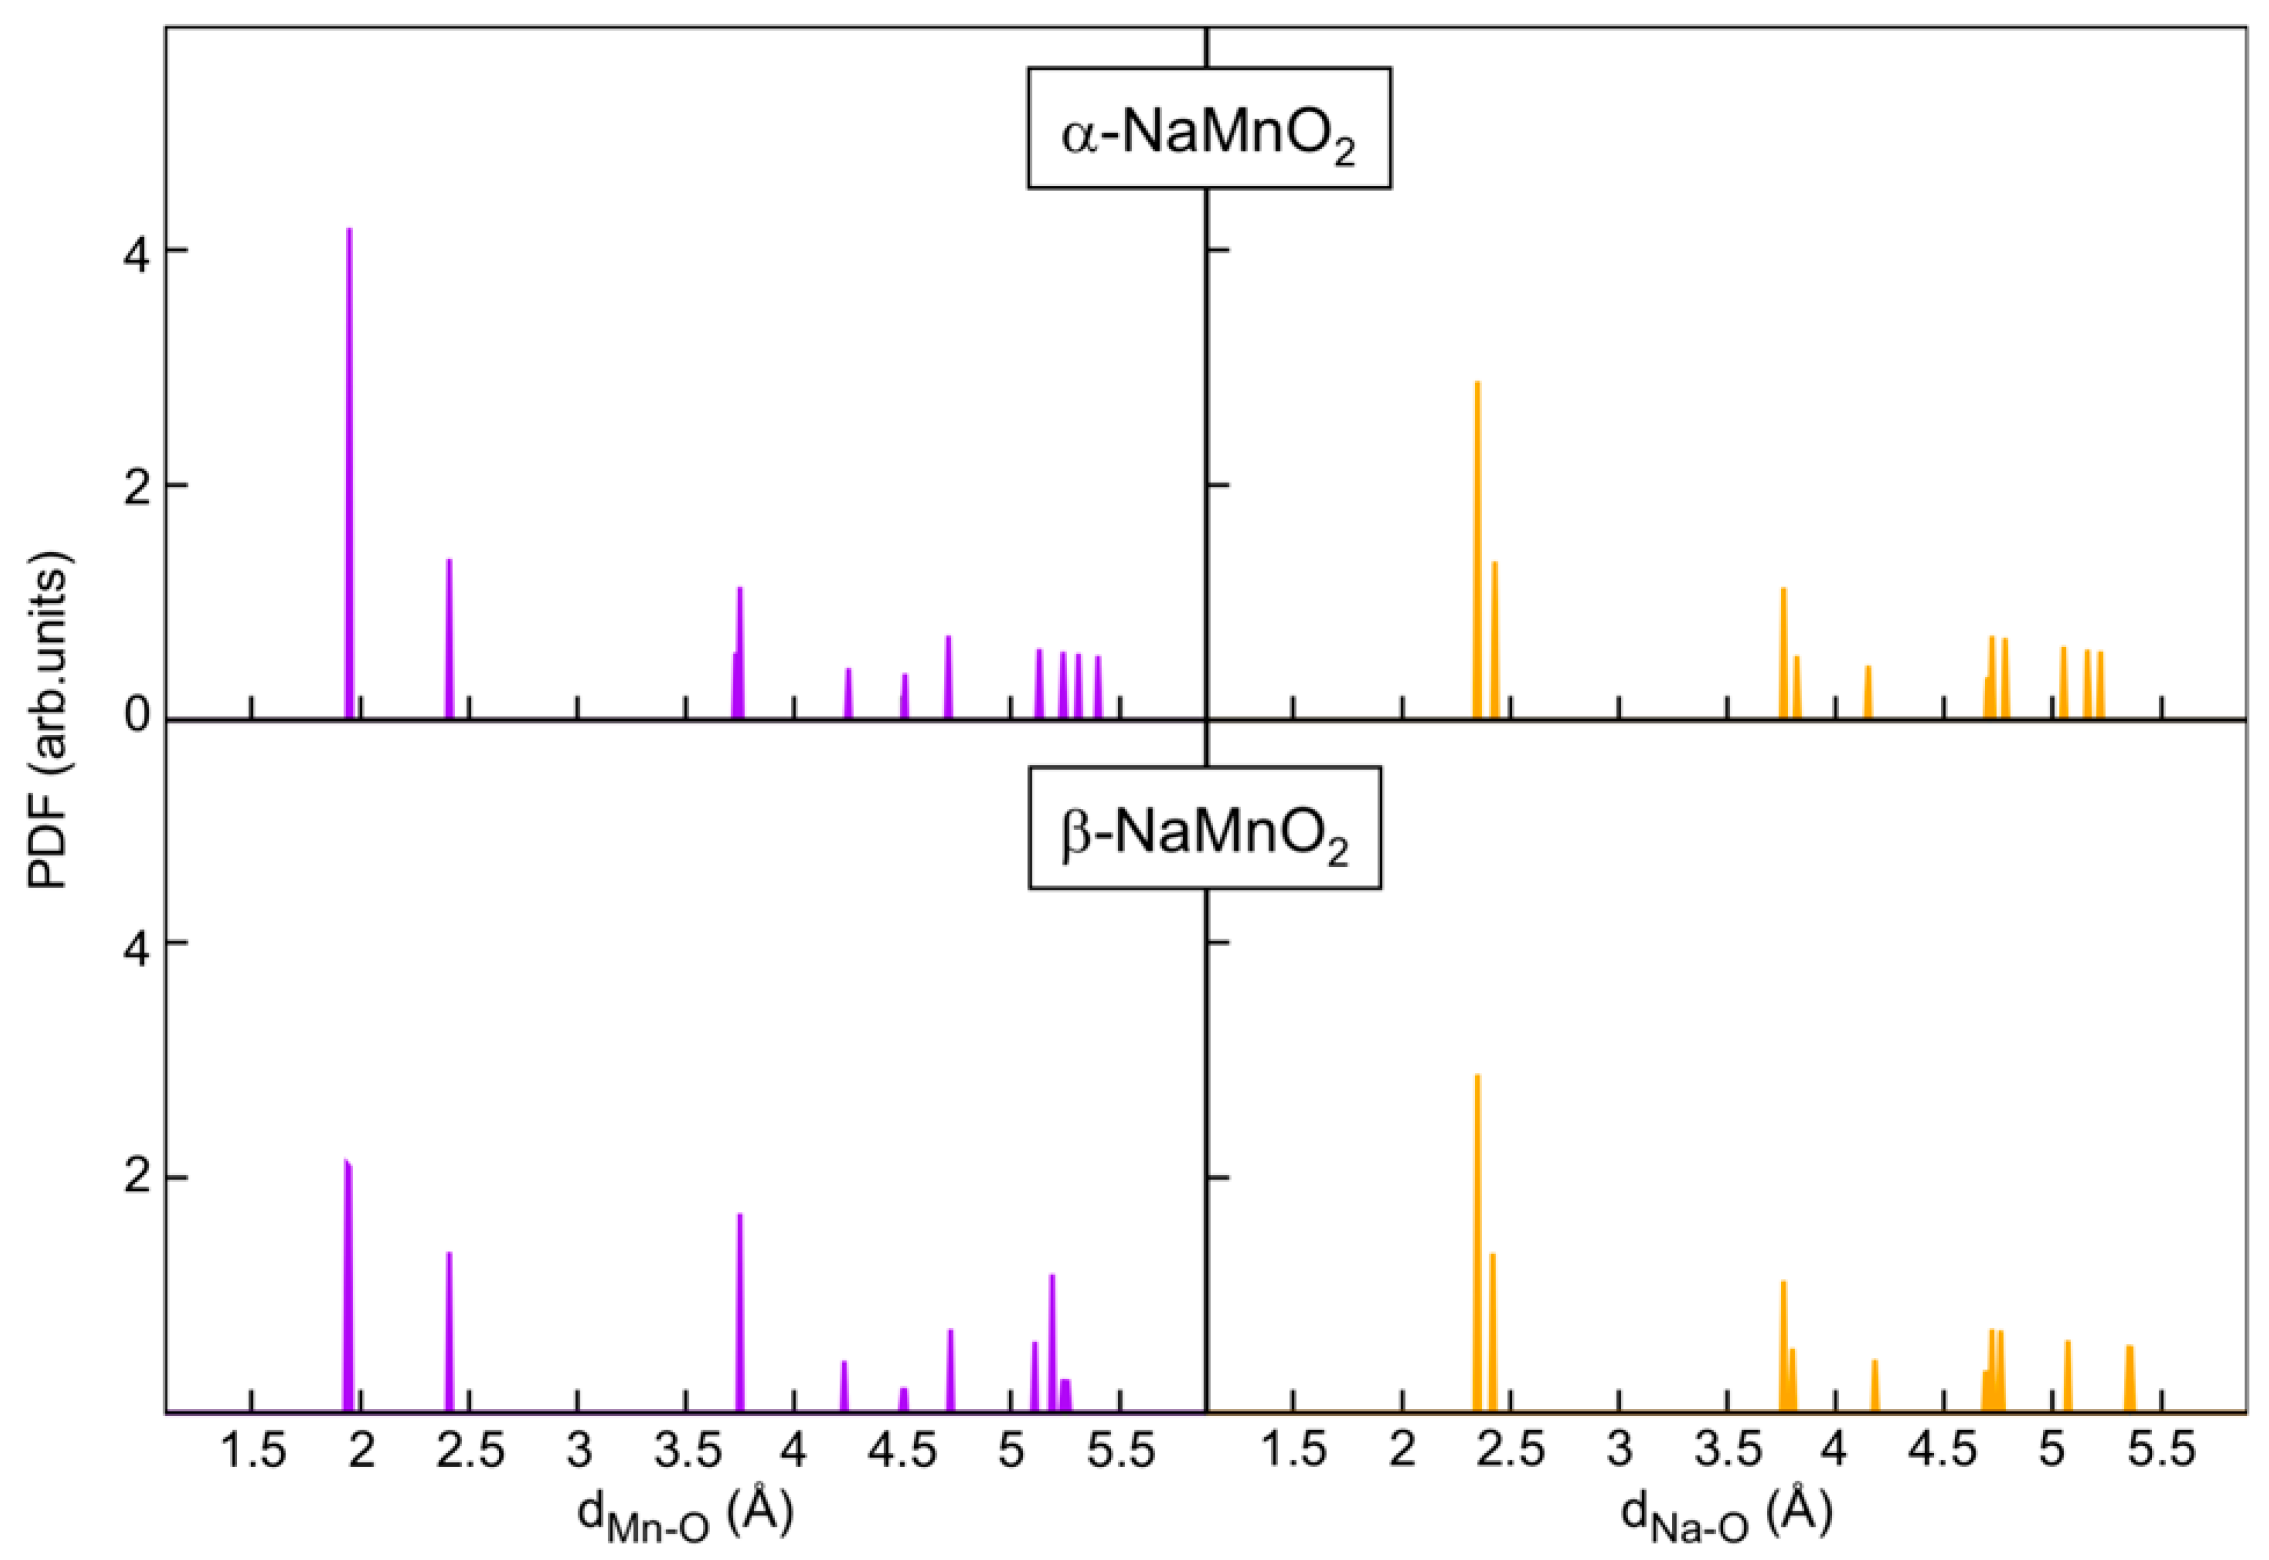
The pair distribution function (PDF) reported in
Figure 4 clearly shows that both structures are affected by Jahn–Teller distortion [
29] in splendid agreement with the experimental data (see above). Predicted Mn-O distances are 1.95 Å (×4) and 2.41 Å (×2) in the case of α-NaMnO
2, and 1.94–1.95 Å (×4) and 2.41 Å (×2) in the case of β-NaMnO
2. Analogously, predicted Na-O bond lengths are 2.36 Å (×4) and 2.43 Å (×2) in both forms. Our DFT predictions matches nicely with the estimates from the Rietveld refinement of the structures.
In it interesting to observe for the beta-phase that the DFT-PDF data show 1.94–1.95 Å (×4) and 2.41 Å (×2) for the MnO6, while the experimental XRD refinement data show the Mn-O atomic distance in the octahedral is 1.90 Å (×2), 2.20 Å (×2), and 2.40 (×2). Unfortunately, based on the experimental and computational basis, this discrepancy is not easy to explain. However, it is possible to speculate about the impact of the antisites. In fact, the DFT optimized structure is free from any defectivity, whereas the Rietveld refined crystal structure incorporate the effect of defects.
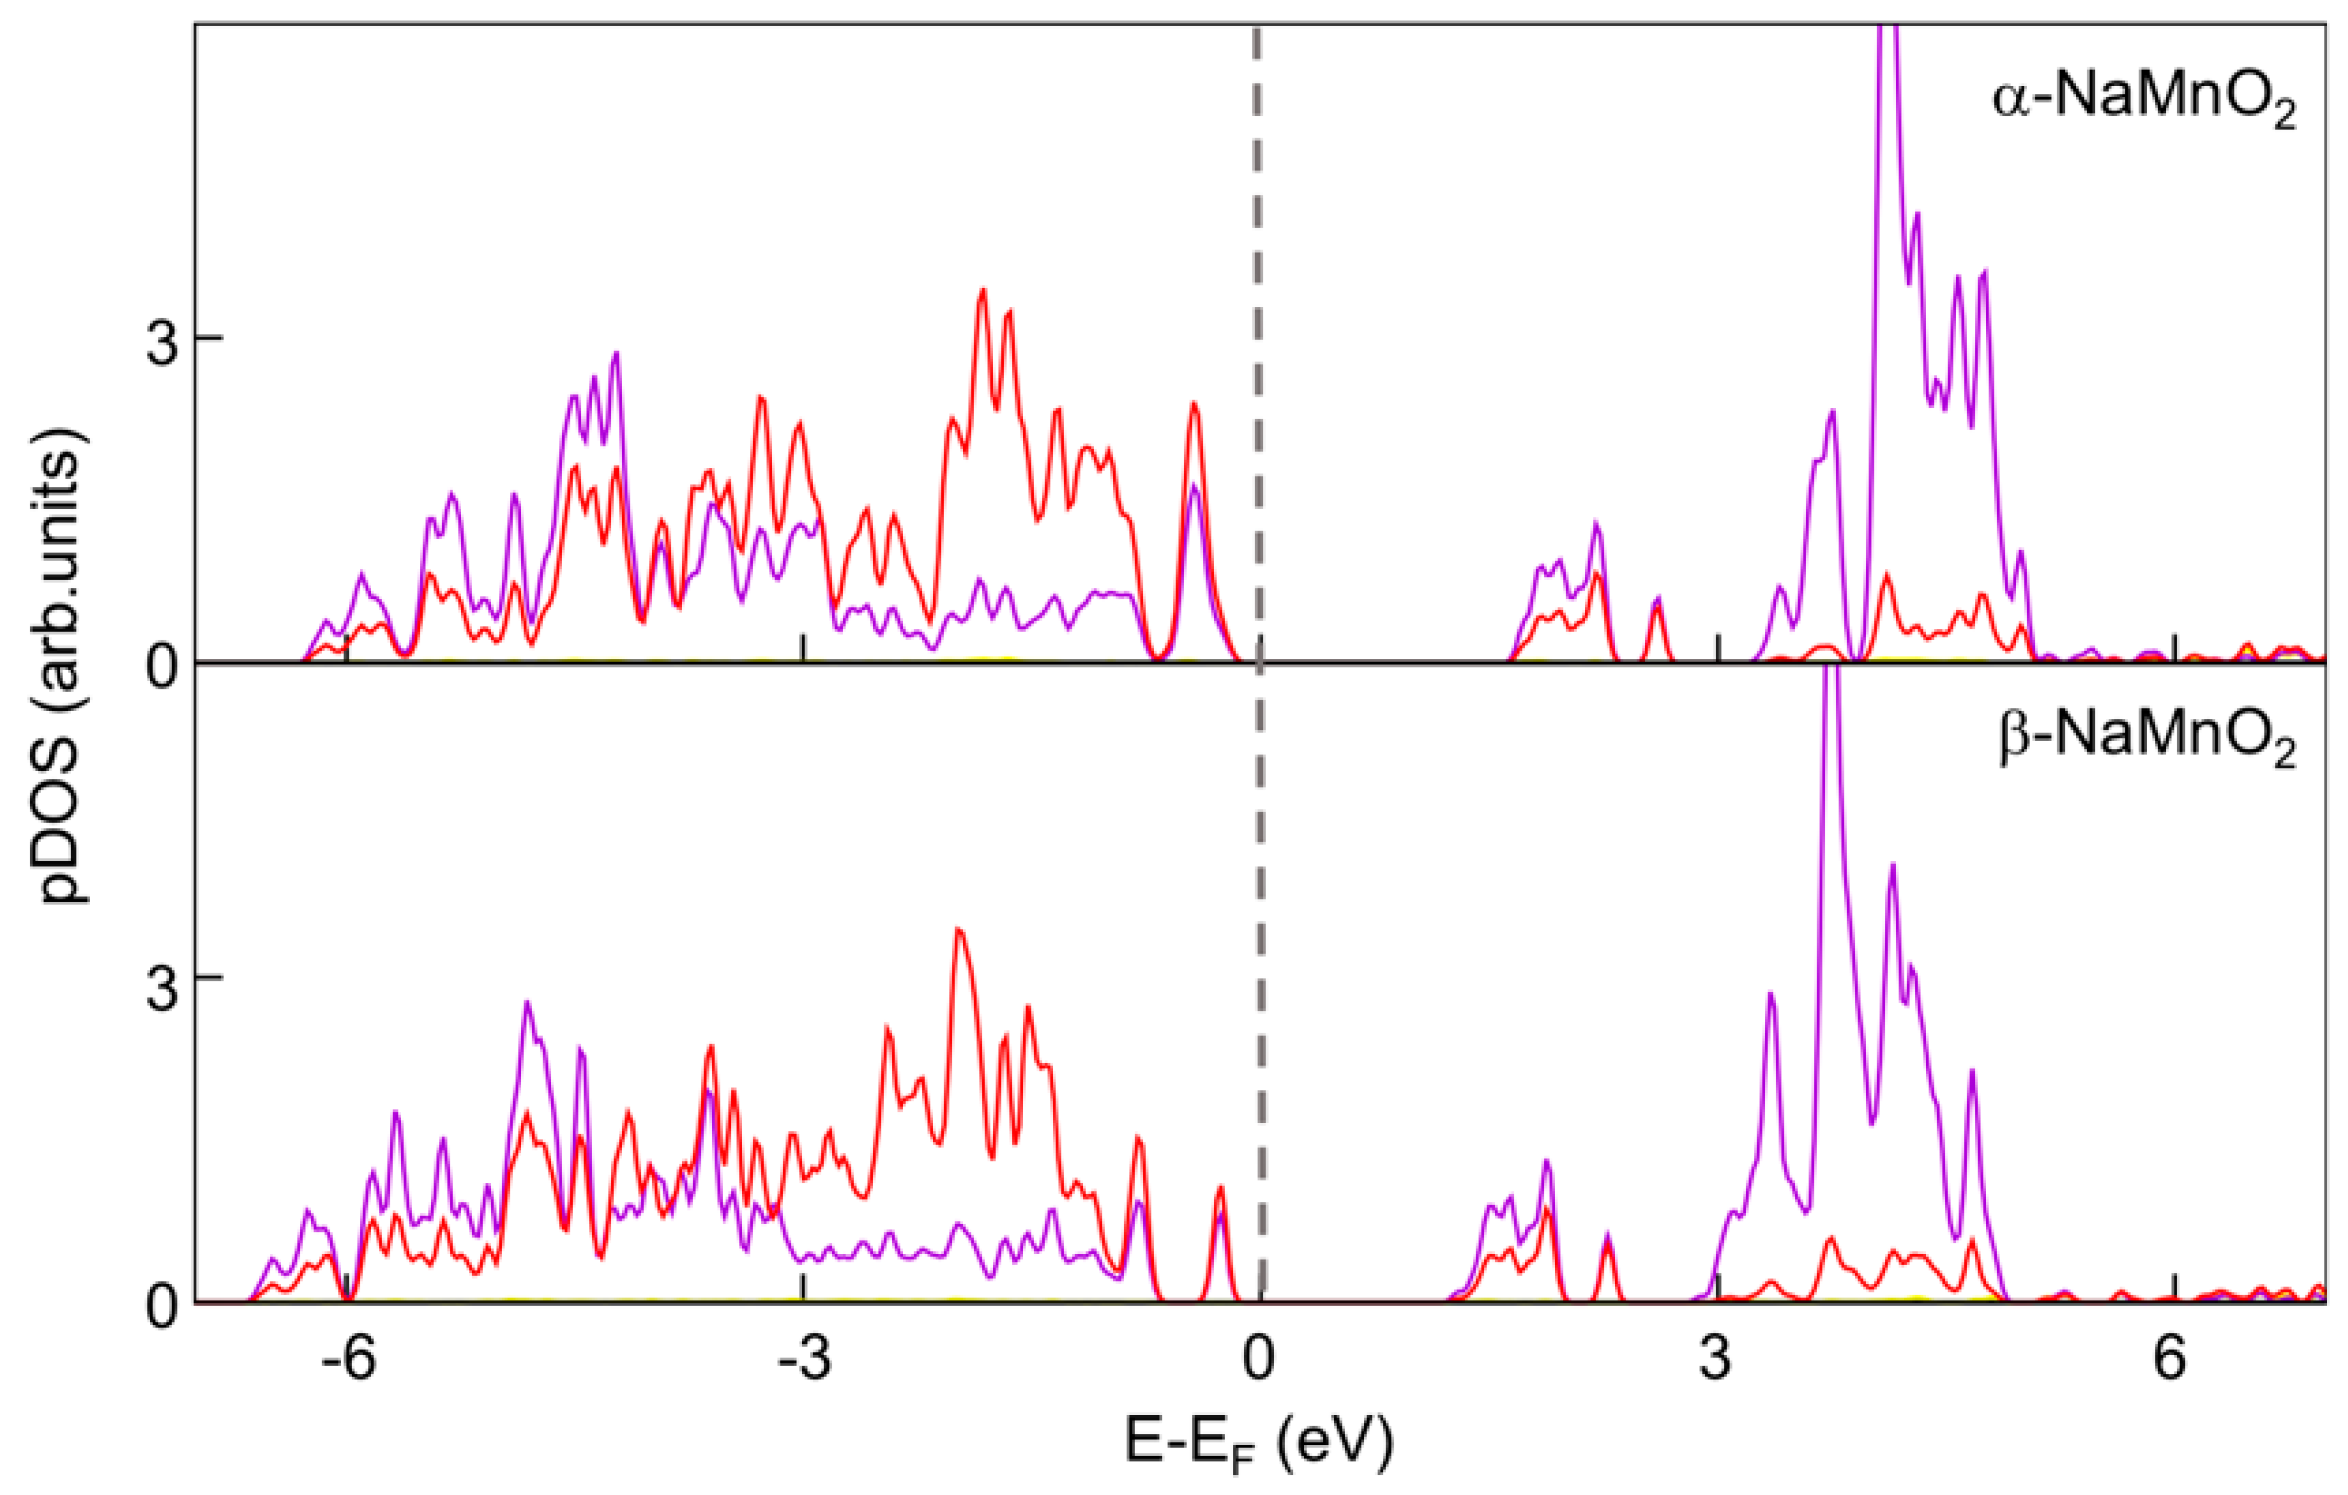
Turning to the electronic structure, it has been investigated by means of projected density of states (pDOS) as shown in the
Figure 5.
Apparently, both phases have an insulating character, with a strong hybridization of Mn d and O p states in both valence and conduction bands and estimated bad gaps between 1 and 2 eV.
3.3. Vibrational Spectroscopy Analysis of the Monoclinic and Orthorhombic Polymorphs
The vibrational spectra of the monoclinic and orthorhombic NaMnO
2 phases have been recorded by Infrared ad Raman spectroscopies, as shown in the
Figure 6. The irreducible representations for the total vibrational modes are 2A
g + 2B
g + 4A
u + 4B
u and 4A
g + 4B
2g + 4B
3g + 4B
1u + 4B
2u + 4B
3u for the monoclinic α-NaMnO
2 and the orthorhombic β-NaMnO
2 phases, respectively. The
gerade modes are Raman active whereas the
ungerade ones are IR active [
30].
First of all, it is important to observe that both vibrational techniques allow to discriminate between the two phases. In the FTIR spectra, the α-NaMnO
2 shows the expected convolution of the A
u bands at 642 cm
−1 and the complex doublet at 475 and 524 cm
−1 due to the monoclinic A
u+B
u modes for the Mn-O arrangements, while the low frequency peaks are associated to Na-O bonding [
31,
32,
33,
34]. A similar picture is observed also in the Raman spectra of the same phase where Mn-O vibrations (2A
g + 2B
g) are assigned to bands observed at 416, 495, 600, and 639 cm
−1 whereas the low-frequency mode at 266 cm
−1 is likely due to Na-O vibrations/librations. The vibrational spectra of the β-NaMnO
2 phase are mode complex (see above for the irreducible representation). In the case of the orthorhombic polymorph, it is possible to nicely identify four main intense modes in the Raman spectra (i.e., 276 cm
−1 due to the Li-O bonds whereas vibrations at 423, 574, and 673 cm
−1 are likely assigned to the Mn-O modes), whereas the FTIR spectra, besides the isolated absorption at 180, 243, and 647 cm
−1, shows a convoluted broad band between 300 and 500 cm
−1. It is important to underline that the here reported analysis if the first identification of the vibrational features of the α- and β-NaMnO
2 phases; in consideration of the phase purity level quantified by XRD, our observations allow us to establish both techniques as valuable analytical tools to discriminate between these two polymorphs.
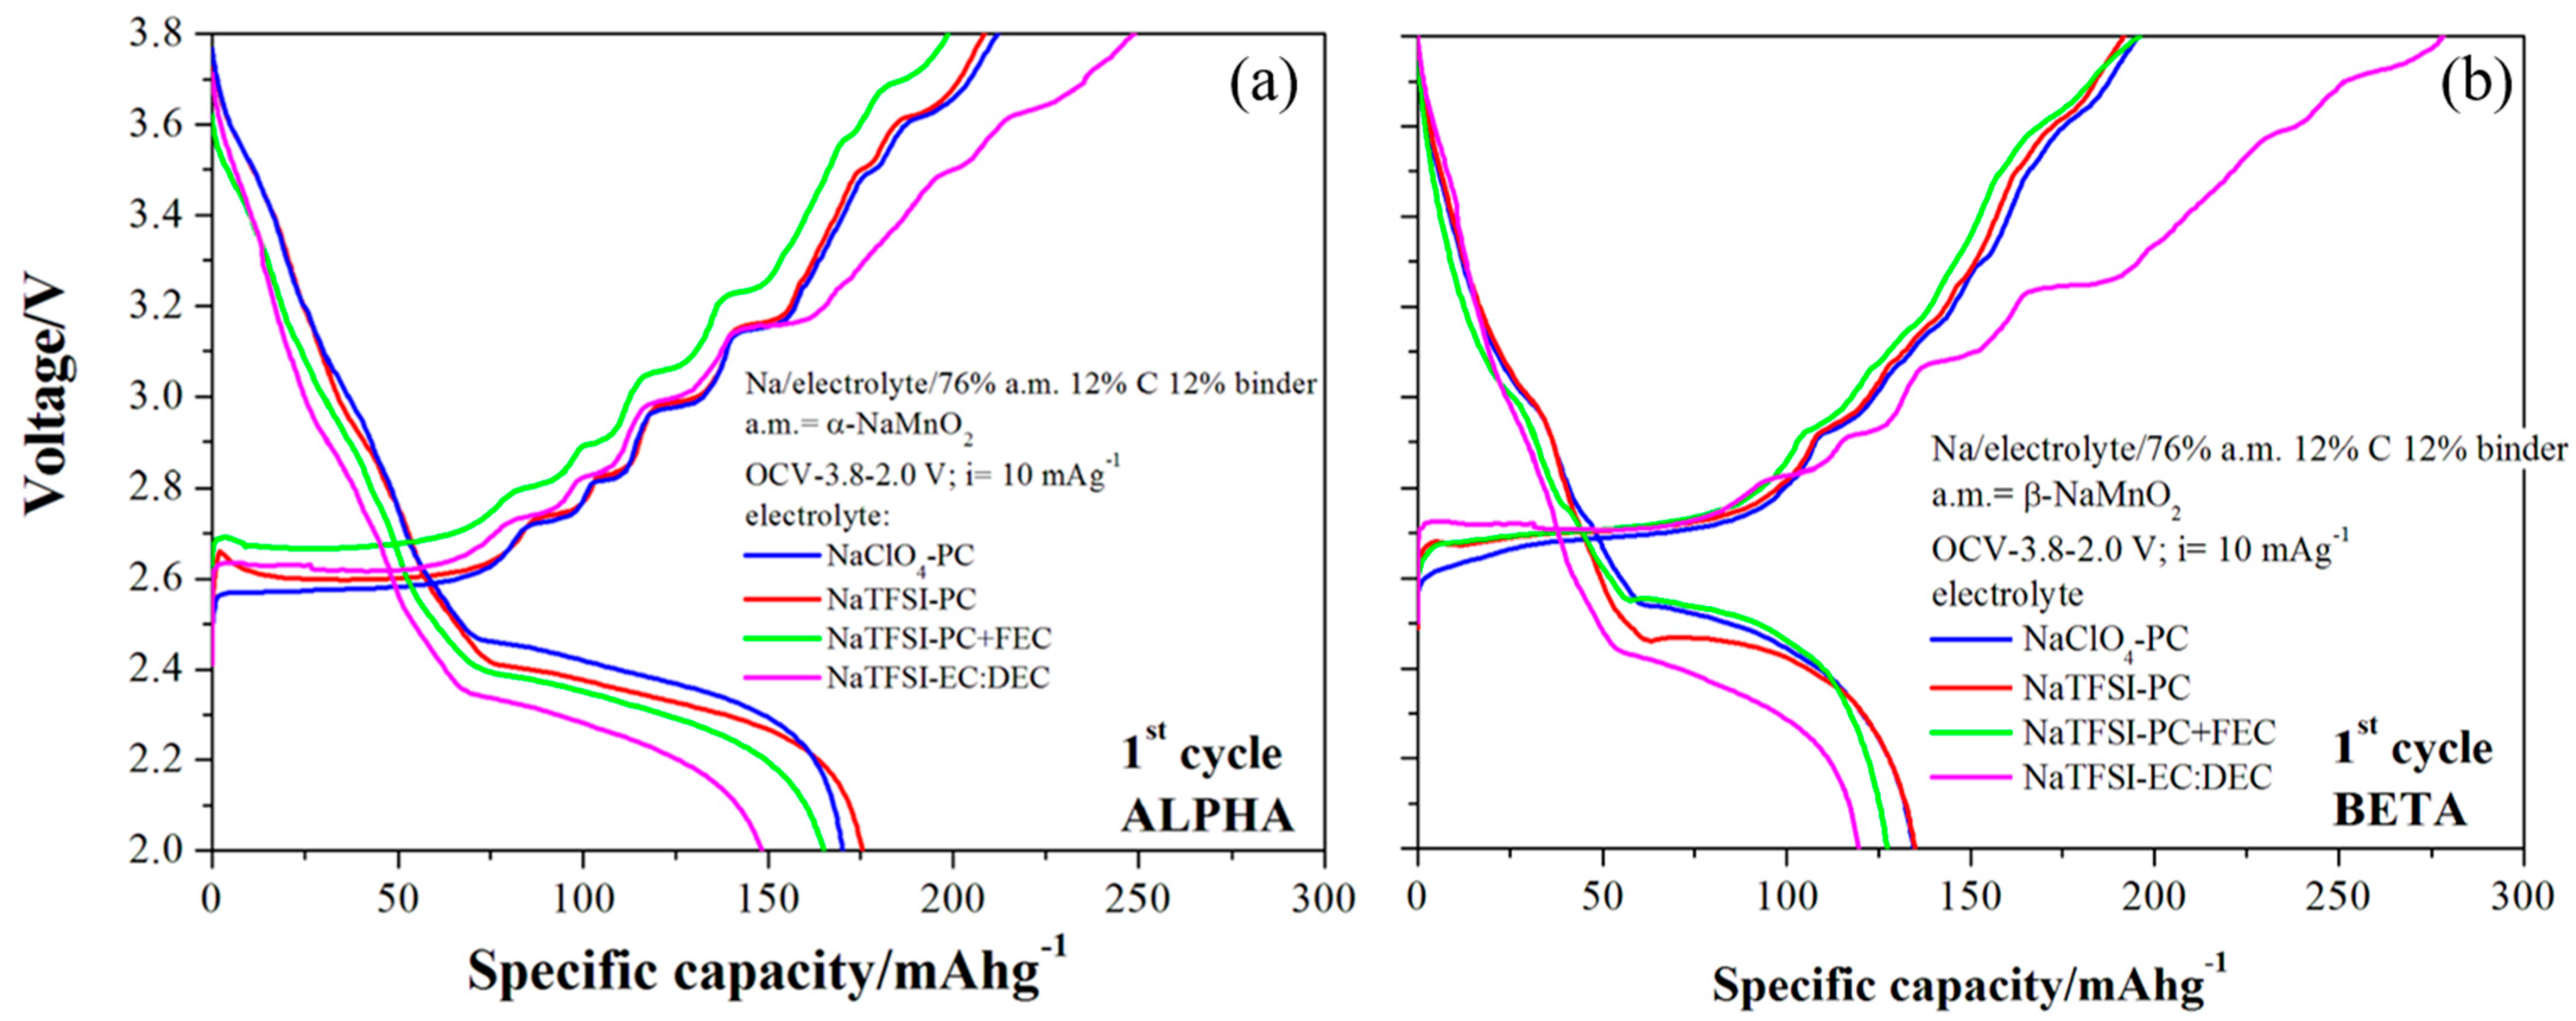
3.4. Electrochemical Analysis of the De-Insertion/Insertion Reactions in Sodium Half-Cells
The ability of both monoclinic and orthorhombic NaMnO
2 to reversibly de-intercalated/intercalate sodium ions in aprotic batteries has been studied by galvanostatic cycling at 10 mAg
−1. The corresponding experimental voltage profiles are shown in the
Figure 7, where the impact of different liquid electrolytes on the electrochemical performance has been also discriminated.
Both materials show reversible electrochemical sodium de-intercalation/intercalation reactions in half batteries in agreement with the available literature [
12,
13,
14]. Electrolytes apparently are able to enhance or hinder the reversibility of the sodium intercalation reaction; the NaClO
4-PC and NaTFSI-PC formulations outperform the NaTFSI-PC+FEC and NaTFSI-EC:DEC ones. In consideration of the electrochemical robustness of the NaClO
4 and NaTFSI salts [
35], it is likely that the carbonate blends and the FEC additive tune the formation of stable/unstable solid-electrolyte layers over the active materials, thus supporting or damaging the ability of the lattices to give intercalation reactions. This feature is commonly observed in the literature on similar materials as already discussed by Passerini and co-workers [
36]. Overall, for both materials, the NaTFSI:PC electrolyte supports the best performance in sodium half cells.
Focusing on the redox reactions, the α-NaMnO2 can de-intercalate 0.85 Na equivalents, corresponding to a 208 mAhg−1 specific capacity, whereas the beta polymorph is less active, giving 0.78 sodium equivalents and 191 mAhg−1. The monoclinic phase also outperforms the orthorhombic one from the point of view of the reversibility of the intercalation reaction, with the coulombic efficiencies 84 and 70% for α-NaMnO2 and β-NaMnO2, thus corresponding to 0.71 and 0.55 sodium equivalents reversibly cycled.
Turning to the shape of the voltage profiles, both materials show two different ranges: a stable plateau in charge in the 2.5–2.7 V vs. Na range, and a steep slope between 2.7 and 3.8 V Vs Na. The mean working potential between charge/discharge are 2.635 and 2.655 V vs. Na for the α-NaMnO2 and β-NaMnO2, respectively, with a voltage hysteresis of 0.41 and 0.23 V. It is likely that the layered monoclinic lattice suffers from more difficult sodium ion diffusion kinetics possibly due to the slightly more packed lattice compared to the beta-phase (cells volumes 86.1 vs. 86.8 Å3, for the alpha and beta phases, respectively). In fact, hindrances in the ion diffusion may induce the increase of electrode/electrolytes resistances and, thus, large overpotentials.
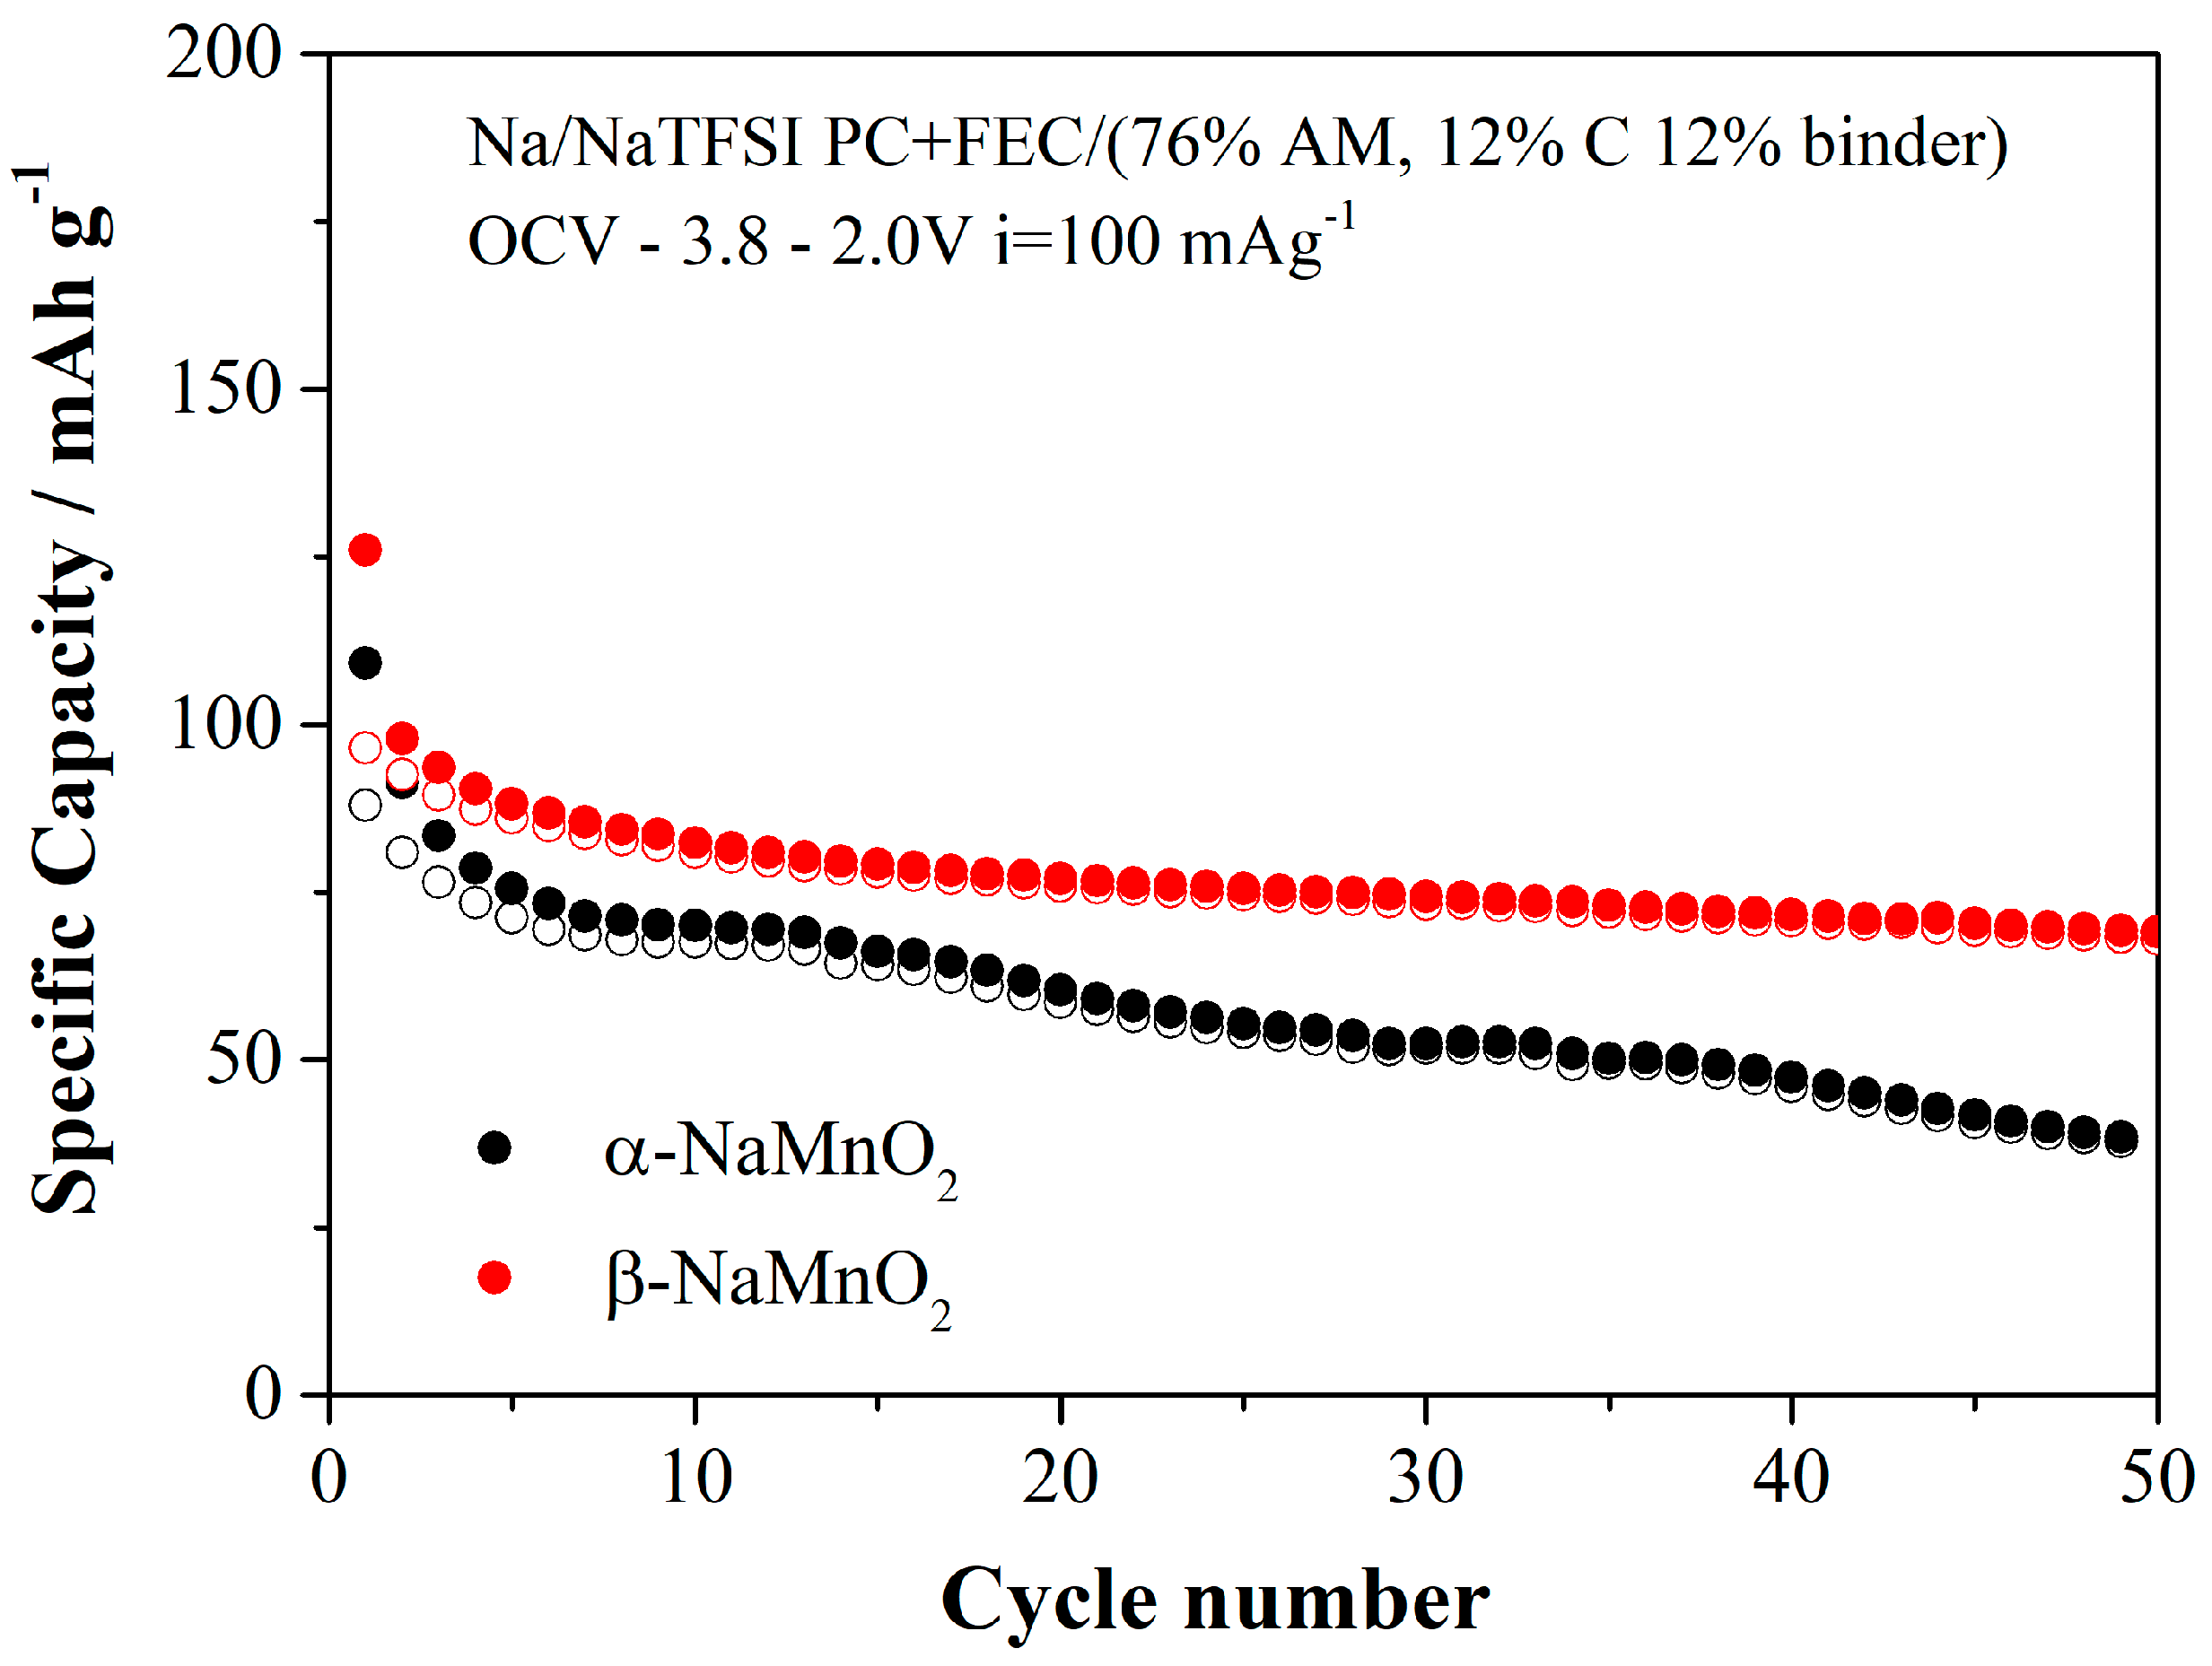
The performance in repeated charge/discharge cycles at 100 mAg
−1, C/2.4 in terms of C-rate, are shown for the two polymorphs in the
Figure 8.
In both cases, the specific capacities are smaller compared to the value obtained at 10 mAg−1, thus suggesting poor ionic transport in both materials However, we would like to stress that an applied current of 10 mAg−1 corresponding to C/24 in terms of C-rate mimics a quasi-thermodynamic regime, whereas the cycling data at 100 mAg−1 are closer to a practical application. Apparently, the performance of the beta phase overcomes those of the alpha polymorph in terms of specific capacity and capacity retention. This trend is in line with the observations related to the overvoltages that are smaller in the beta phase compared to the α-NaMnO2. These parallel trends suggest an easier sodium transport kinetic in the orthorhombic lattice compared to the monoclinic one.
4. Conclusions
In this manuscript, we tackled the study of the structural, vibrational, and electrochemical features of the two polymorphic phases of the NaMnO2 compound by coupling experimental and computational methods. We exploited laboratory techniques (Raman spectroscopy, electrochemical methods) and synchrotron radiation experiments (Fast-Fourier Transform Infrared spectroscopy, and X-ray diffraction), as well as density functional theory calculations. The two phases have been synthesized in excellent purity by solid state methods with annealing in air followed by quenching to room temperature. The α-NaMnO2 crystallizes on a monoclinic system (C2/m space group), whereas the β-NaMnO2 is in an orthorhombic system with the space group Pmmn. From XRD data, we obtained by Rietveld Refinement the crystal structures of the two polymorphs; our analysis is the first ever reported in the literature. Computational results strongly agree with the experimental determinations. The two phases have been also studied by Infrared and Raman spectroscopy; our determinations are, as far as we know, the first ever reported analysis of the vibrational features of these two materials. Furthermore, both vibrational spectroscopies are valuable analytical tools to discriminate between the two phases. From the functional point of view, we evaluated the electrochemical performance in aprotic reversible sodium batteries. Overall, the monoclinic phase shows better electrochemical reversibility of the sodium intercalation reaction compared to the orthorhombic beta-phase. Noticeably, the here reported analysis is the first direct comparison of the electrochemical features of these two polymorphs in sodium cells.


 ,
, 


