
The Trend and Status of Energy Resources and Greenhouse Gas Emissions in the Malaysia Power Generation Mix

 , , ,
, , ,
Abstract
:1. Introduction
2. Background Study

3. Energy Mix
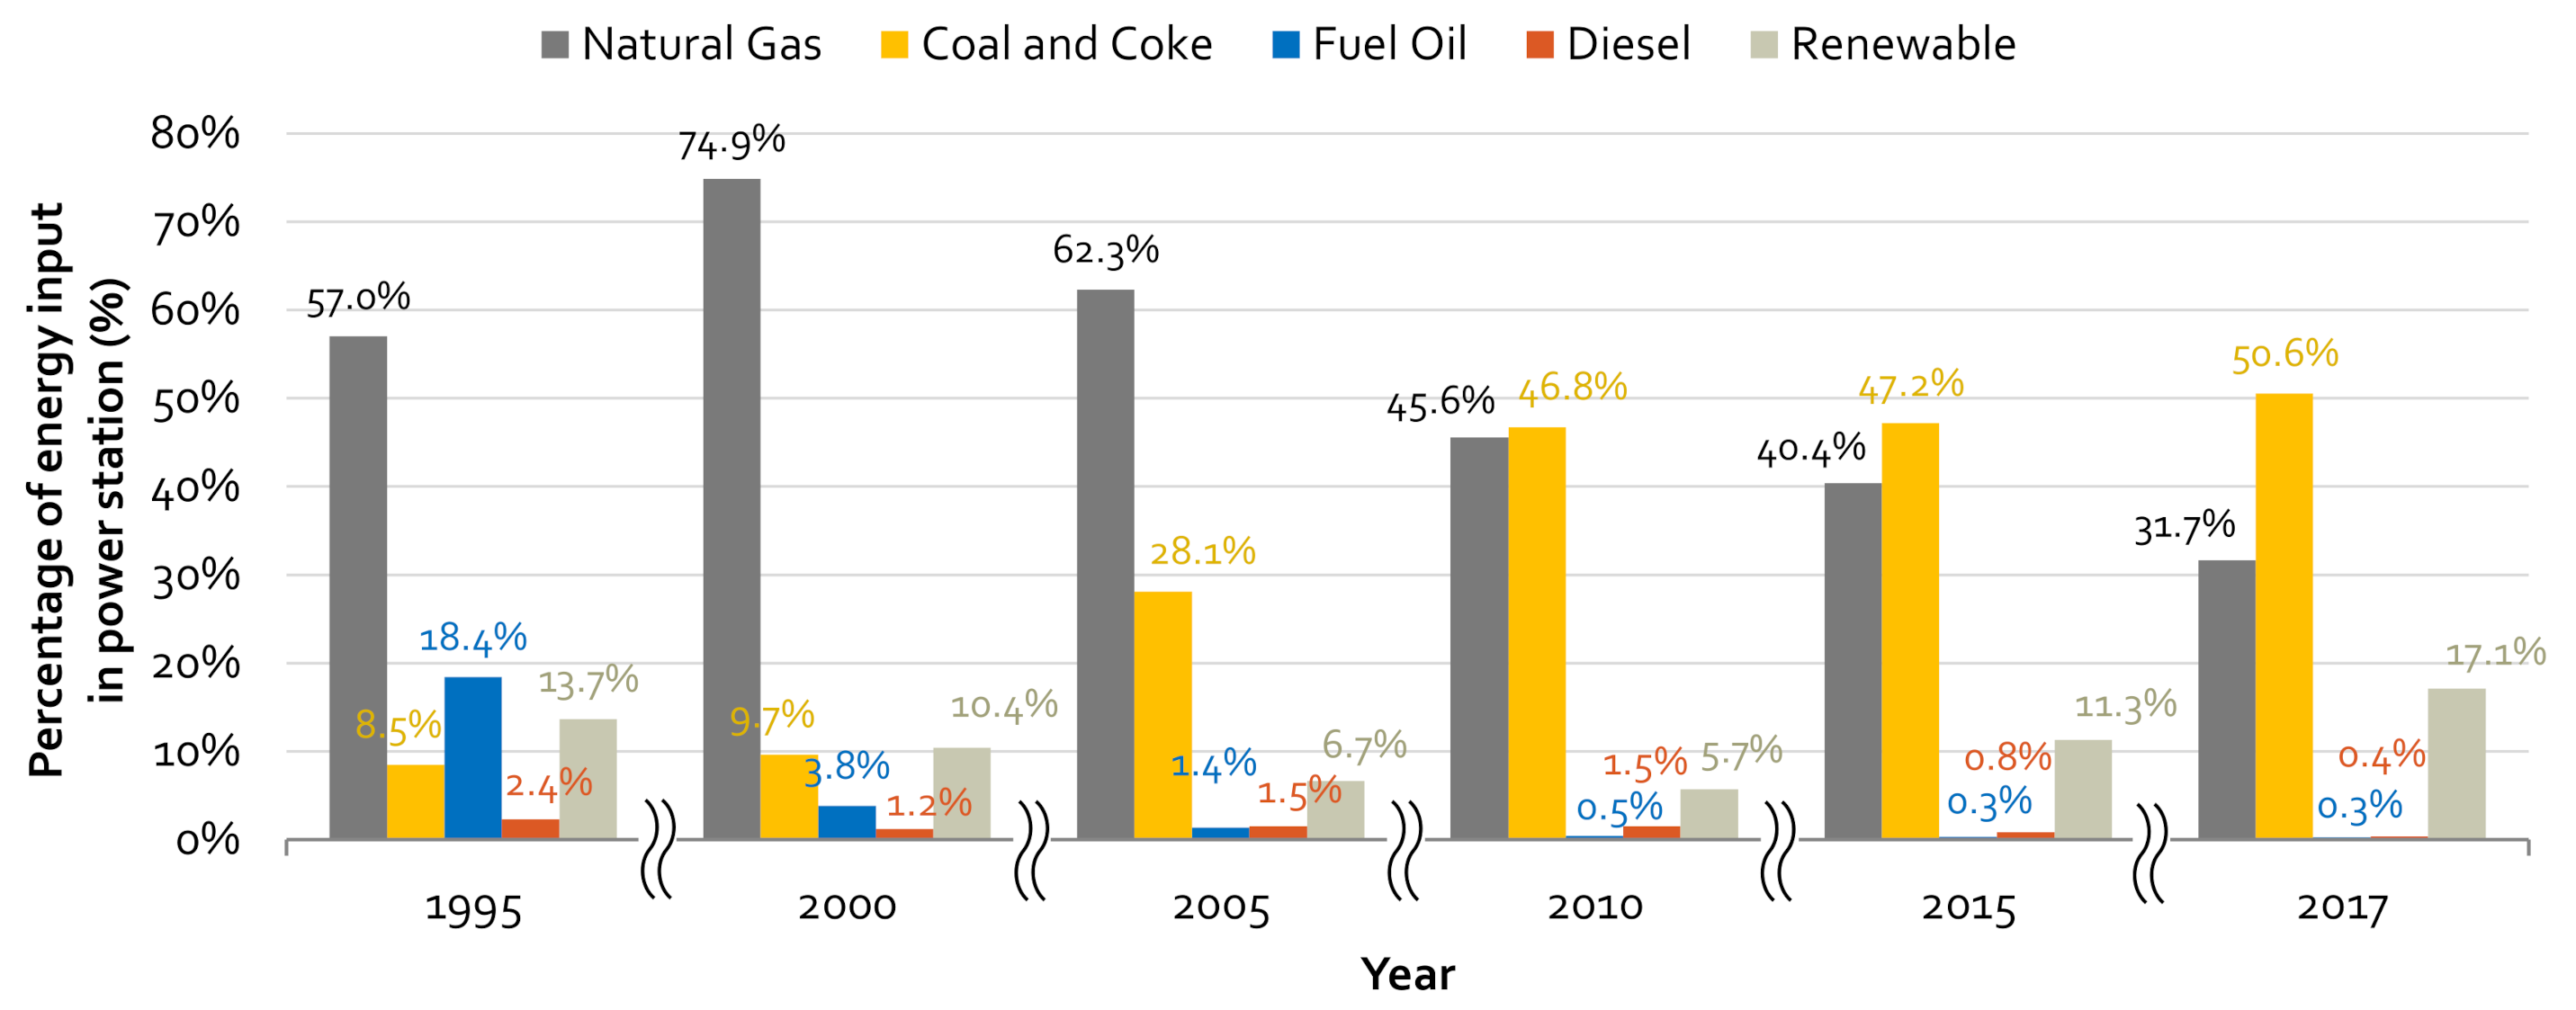
3.1. Energy Input in Power Stations
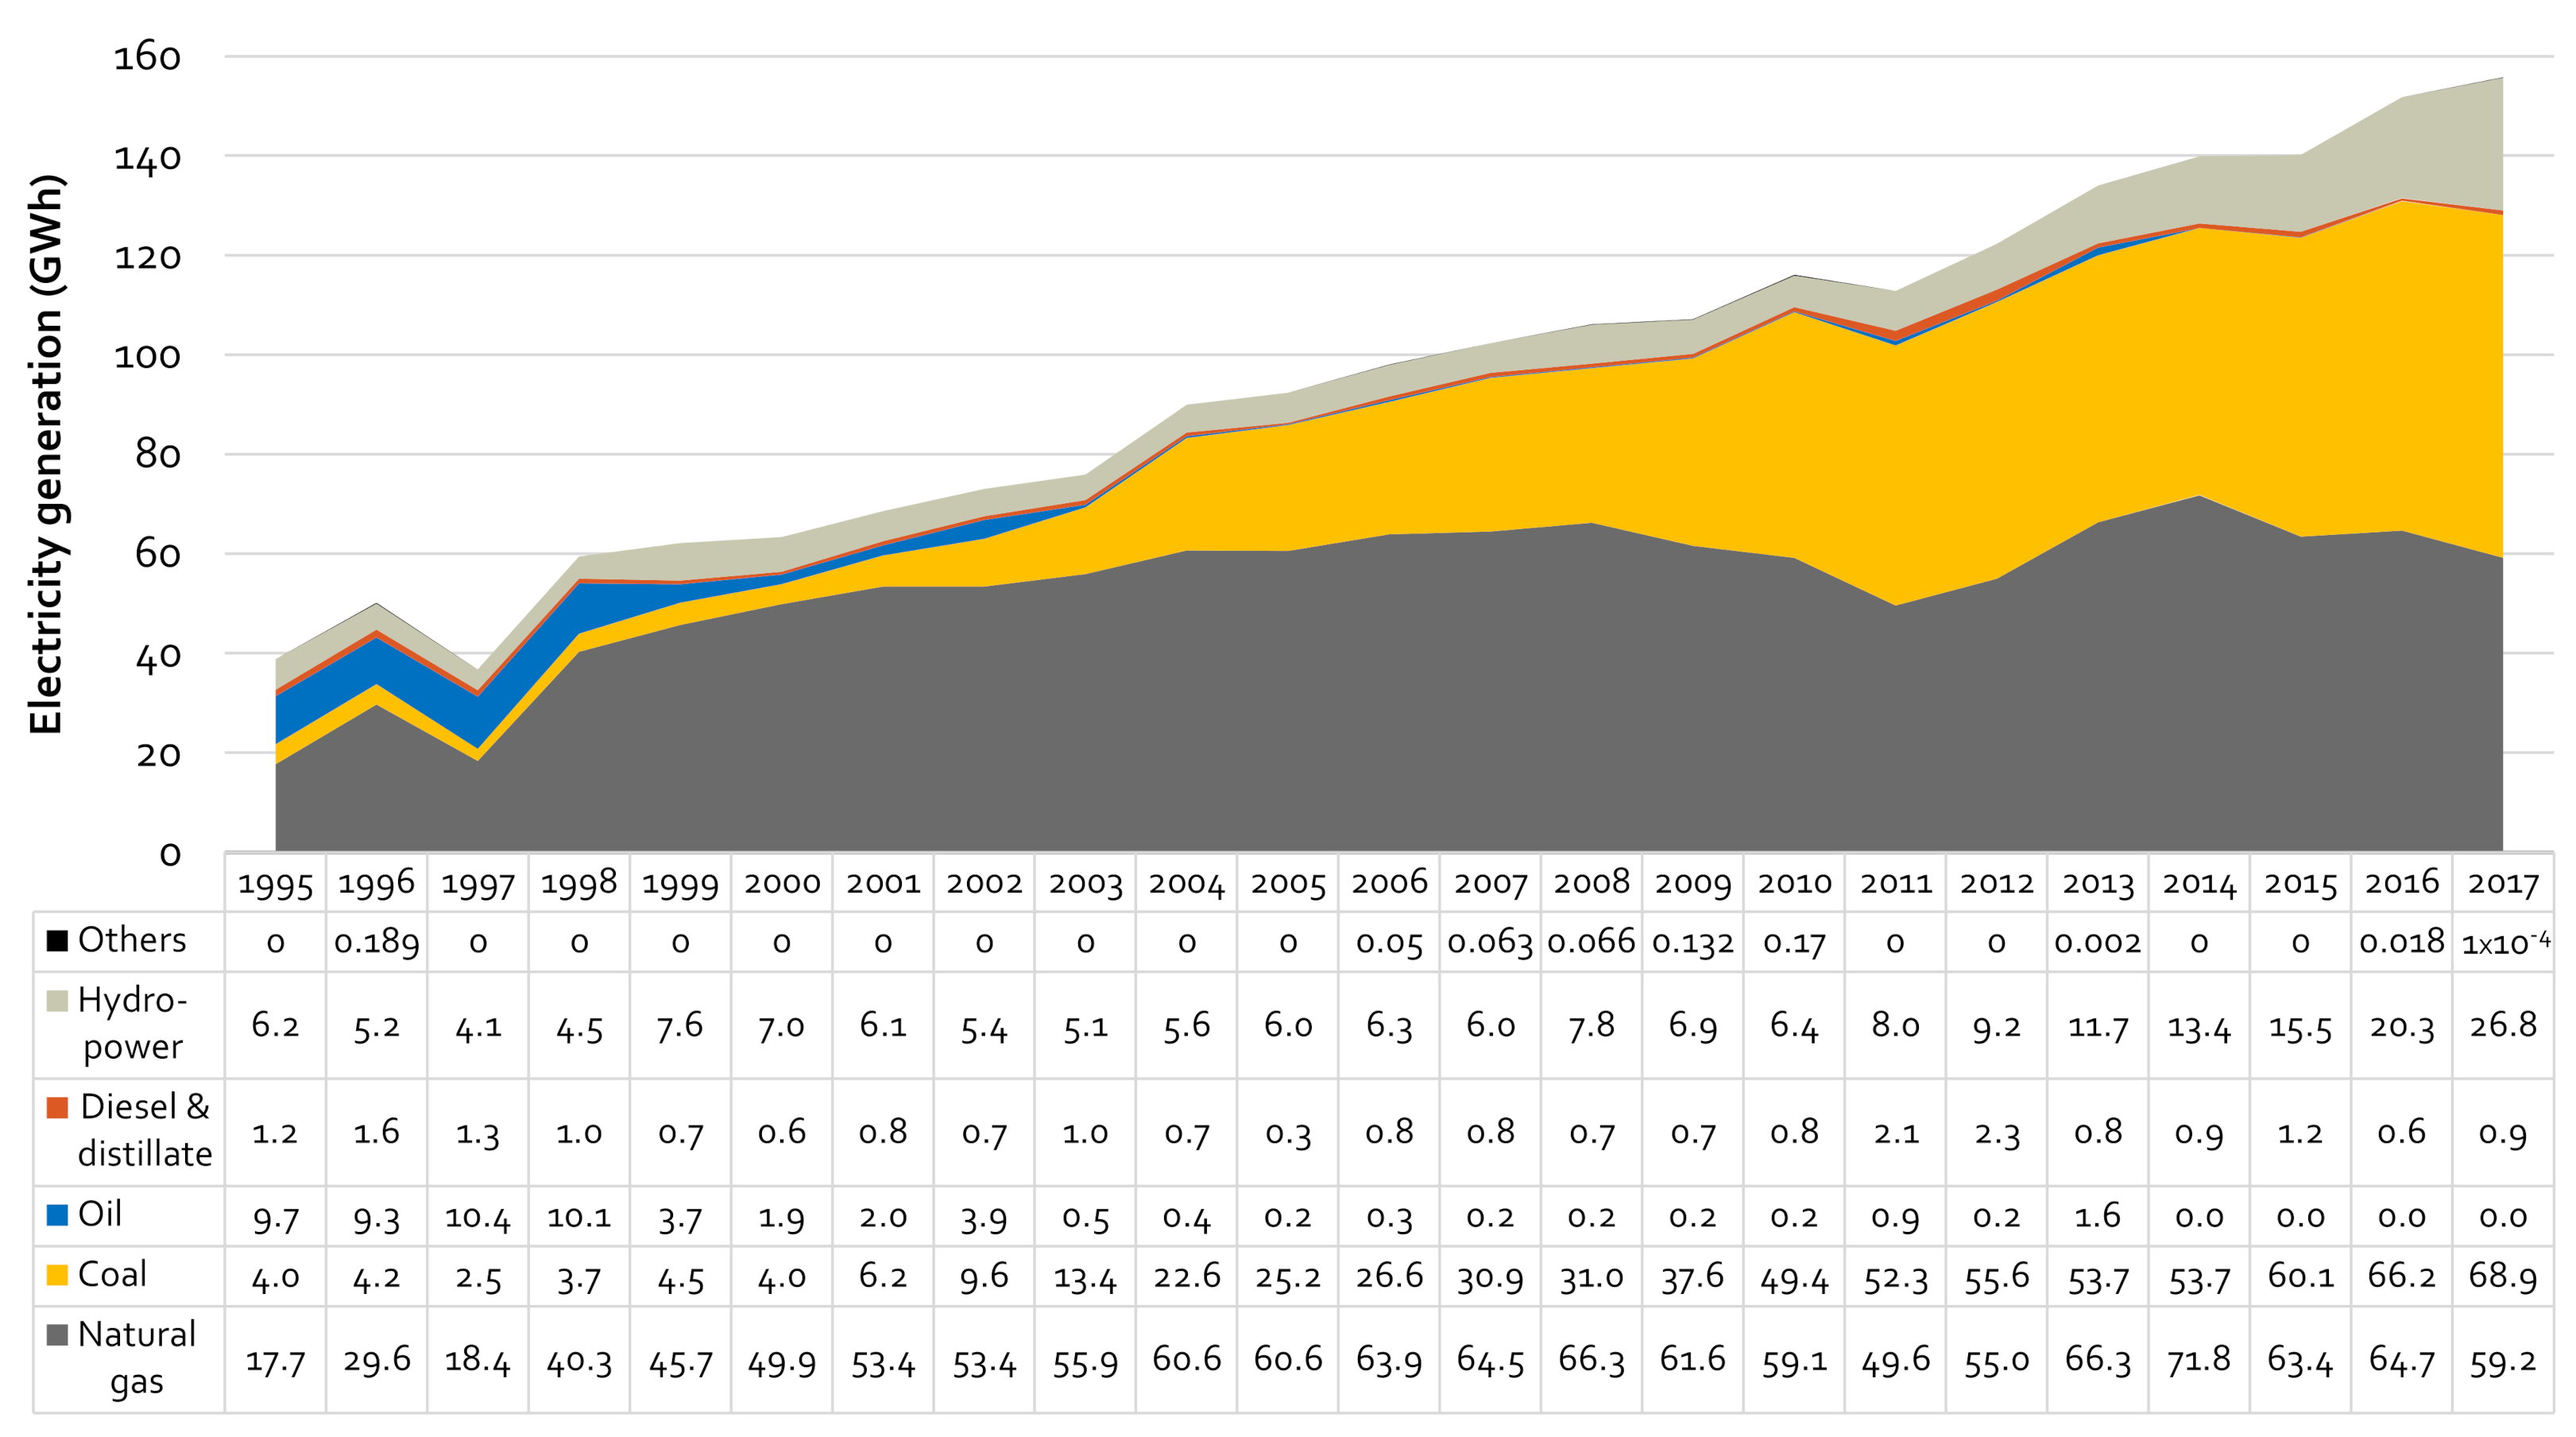
3.2. Electricity Generation
3.3. Status of Energy Resources in the Power Generation Mix
3.3.1. Energy Policies
3.3.2. Natural Gas
3.3.3. Coal
3.3.4. Renewable Energy
4. Greenhouse Gas (GHG) Emissions
4.1. Carbon Dioxide, Emission
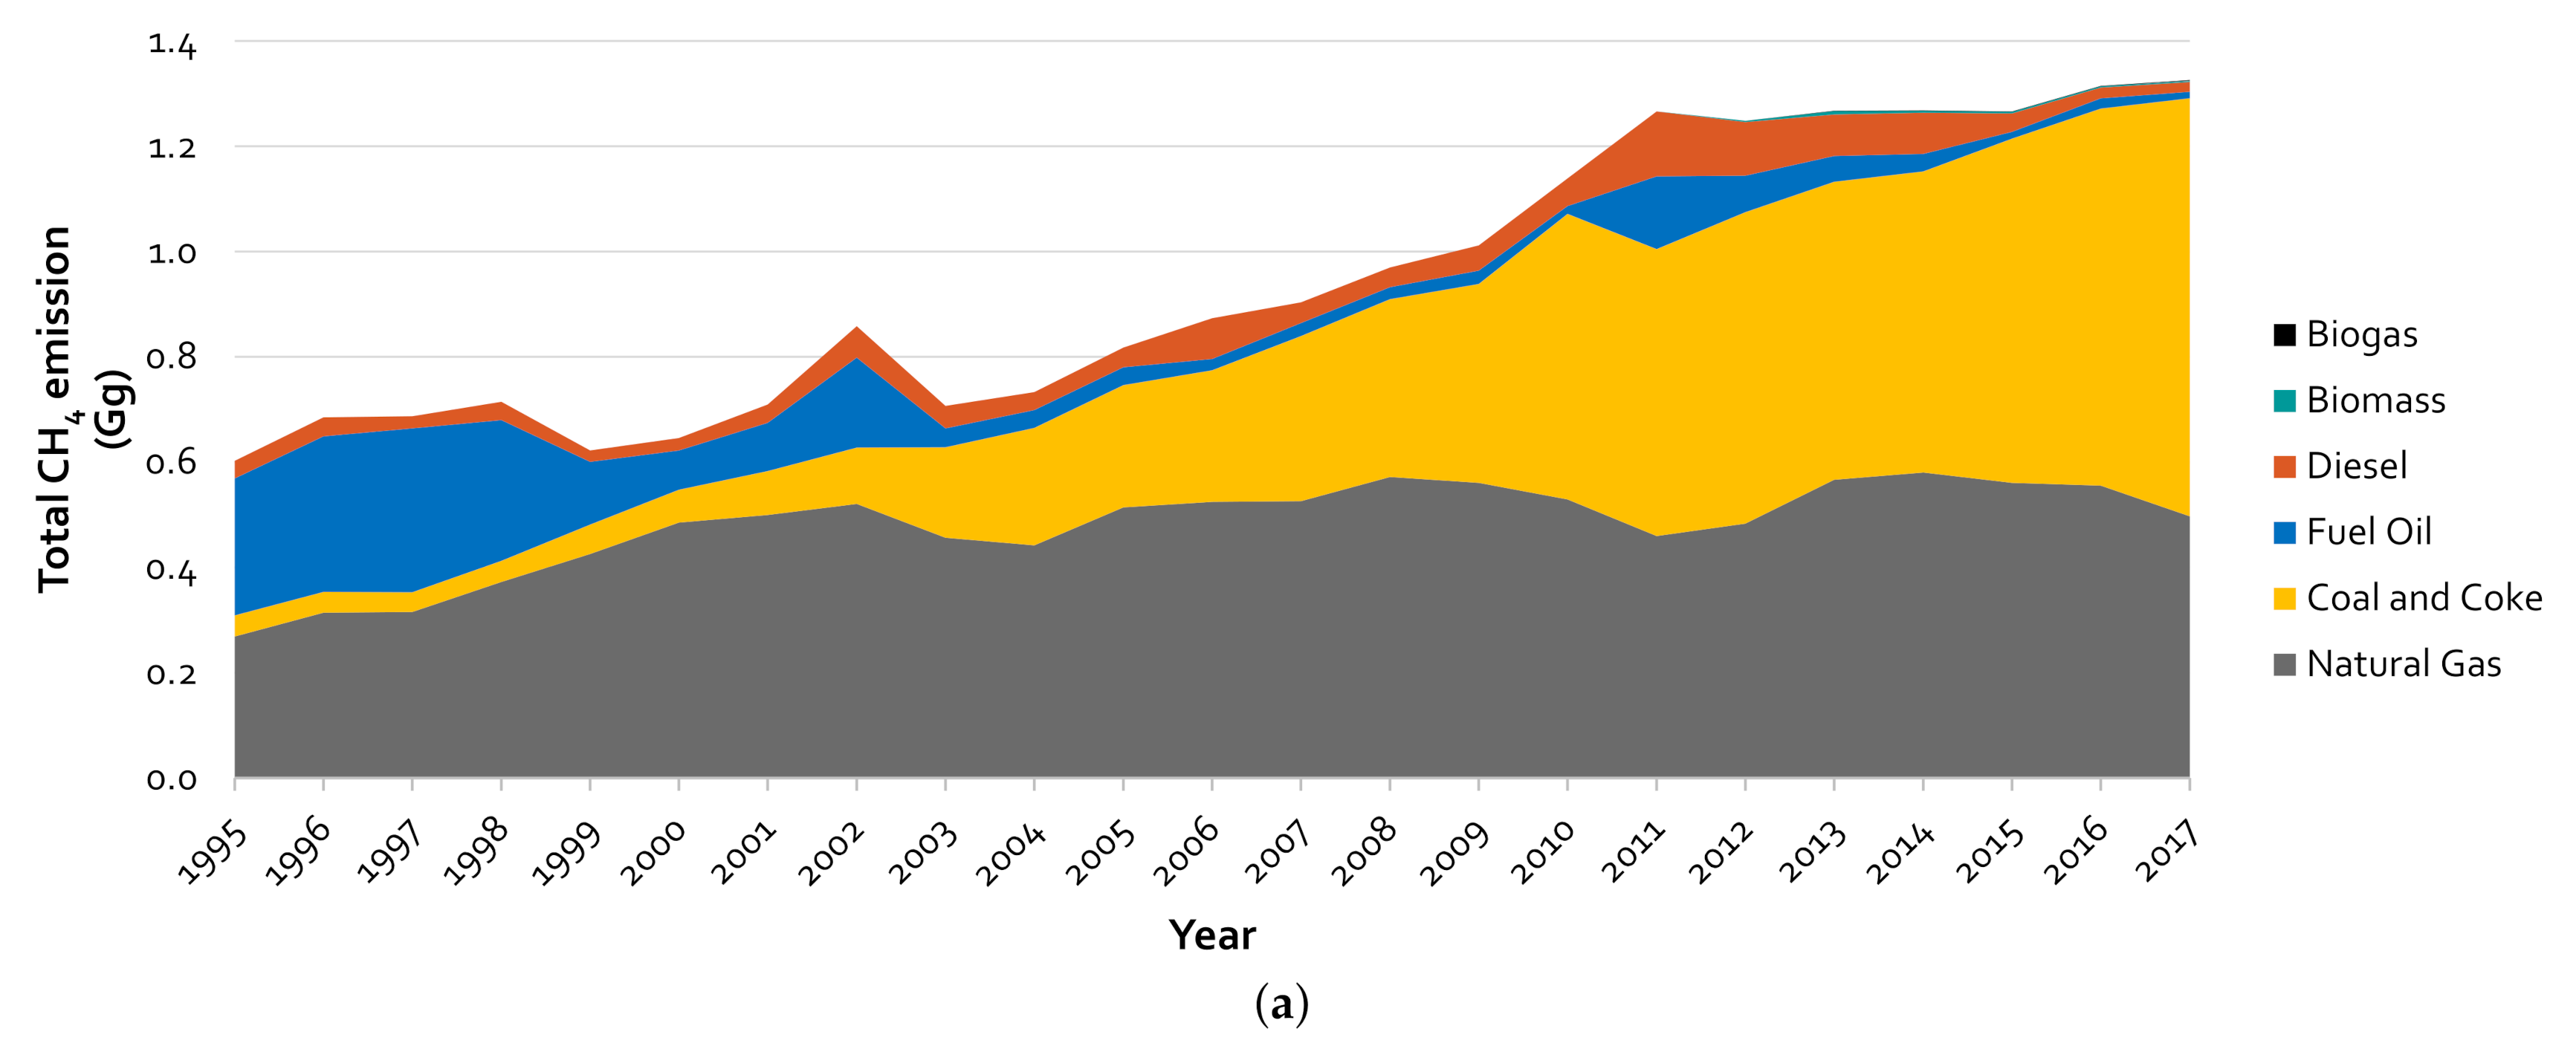
4.2. Methane, CH Emission
4.3. Nitrous Oxide, NO Emission
4.4. Indirect GHG Emissions
4.5. Combined Specific GHG Emission
5. Discussion and Limitations
6. Conclusions and Recommendations
Author Contributions
Funding
Institutional Review Board Statement
Informed Consent Statement
Data Availability Statement
Acknowledgments
Conflicts of Interest
References
- BP. Statistical Review of World Energy; 2013. Available online: http://large.stanford.edu/courses/2013/ph240/lim1/docs/bpreview.pdf (accessed on 14 April 2021).
- Ellabban, O.; Abu-Rub, H.; Blaabjerg, F. Renewable energy resources: Current status, future prospects and their enabling technology. Renew. Sustain. Energy Rev. 2014, 39, 748–764. [Google Scholar] [CrossRef]
- IEA. Electricity Information Overview; Technical Report; IEA: Paris, France, 2019. [Google Scholar]
- World Meteorological Organization. Statement by WMO Secretary-General Petteri Taalas. 2019. Available online: https://public.wmo.int/en/media/news/statement-wmo-secretary-general-petteri-taalas (accessed on 1 June 2020).
- Masson-Delmotte, V.; Zhai, P.; Pörtner, H.O.; Roberts, D.; Skea, J.; Shukla, P.R.; Pirani, A.; Moufouma-Okia, W.; Péan, C.; Pidcock, R.; et al. IPCC, 2018: Global Warming of 1.5 °C. an IPCC Special Report on the Impacts of Global Warming of 1.5 °C above Pre-Industrial Levels and Related Global Greenhouse Gas Emission Pathways, in the Context of Strengthening the Global Response to the Threat of Climate Change, Sustainable Development, and Efforts to Eradicate Poverty; Technical Report; IPCC: Geneva, Switzerland, 2018. [Google Scholar]
- EPA. Overview of Greenhouse Gases. 2020. Available online: https://www.epa.gov/ghgemissions/overview-greenhouse-gases (accessed on 1 June 2020).
- Demirbas, A. Carbon dioxide emissions and carbonation sensors. Energy Sources Part A Recover. Util. Environ. Eff. 2008, 30, 70–78. [Google Scholar] [CrossRef]
- Abdallah, L.; El-Shennawy, T. Reducing carbon dioxide emissions from electricity sector using smart electric grid applications. J. Eng. 2013, 2013, 845051. [Google Scholar] [CrossRef] [Green Version]
- Moazzem, S.; Rasul, M.; Khan, M.M.K. A Review on Technologies for Reducing CO2 Emission From Coal Fired Power Plants; InTech: London, UK, 2012; Chapter 11; pp. 227–254. [Google Scholar]
- Krivolapchuk, I.A. Energy-supply of the muscular activity at boys of 13–14 years in dependence from rates of puberty. Fiziol Cheloveka 2011, 37, 85–96. [Google Scholar]
- Smith, M.S.; Cook, C.; Sokona, Y.; Elmqvist, T.; Fukushi, K.; Broadgate, W.; Jarzebski, M.P. Advancing sustainability science for the SDGs. Sustain. Sci. 2018, 13, 1438–1487. [Google Scholar] [CrossRef]
- Fonseca, L.M.; Domingues, J.P.; Dima, A.M. Mapping the sustainable development goals relationships. Sustainability 2020, 12, 3359. [Google Scholar] [CrossRef] [Green Version]
- Zimon, D.; Tyan, J.; Sroufe, R. Drivers of sustainable supply chain management: Practices to alignment with unsustainable development goals. Int. J. Qual. Res. 2020, 14. [Google Scholar] [CrossRef]
- Fonseca, L.M.; Domingues, J.P.; Pereira, M.T.; Martins, F.F.; Zimon, D. Assessment of circular economy within Portuguese organizations. Sustainability 2018, 10, 2521. [Google Scholar] [CrossRef] [Green Version]
- C2ES. Getting to Zero: A U.S. Climate Agenda. Executive Summary. 2019. Available online: https://www.c2es.org/site/assets/uploads/2019/11/getting-to-zero-a-us-climate-agenda-11-13-19.pdf (accessed on 11 November 2020).
- Dooley, B.; Inoue, M.; Hida, H. Japan’s New Leader Sets Ambitious Goal of Carbon Neutrality by 2050. 2020. Available online: https://www-nytimes-com.cdn.ampproject.org/c/s/www.nytimes.com/2020/10/26/business/japan-carbon-neutral.amp.html (accessed on 11 November 2020).
- Sengupta, S. China, in Pointed Message to U.S., Tightens Its Climate Targets. 2020. Available online: https://www.nytimes.com/2020/09/22/climate/china-emissions.html (accessed on 11 November 2020).
- Mohamed, A.R.; Lee, K.T. Energy for sustainable development in Malaysia: Energy policy and alternative energy. Energy Policy 2006, 34, 2388–2397. [Google Scholar] [CrossRef]
- Jamaludin, A.F.B. Energy mix and alternatives energy for sustainable development in Malaysia. In Proceedings of the The 9th International Students Summit on Food, Agriculture and Environment in the New Century, Tokyo, Japan, 8–9 October 2009. [Google Scholar]
- Ong, H.C.; Mahlia, T.M.I.; Masjuki, H.H. A review on energy scenario and sustainable energy in Malaysia. Renew. Sustain. Energy Rev. 2011, 15, 639–647. [Google Scholar] [CrossRef]
- Sahid, E.J.M.; Siang, C.C.; Peng, L.Y. Enhancing energy security in Malayia: The challenges towards sustainable environment. IOP Conf. Ser. Earth Environ. Sci. 2013, 16. [Google Scholar] [CrossRef] [Green Version]
- Ali, R.; Daut, I.; Taib, S. A review on existing and future energy sources for electrical power generation in Malaysia. Renew. Sustain. Energy Rev. 2012, 16, 4047–4055. [Google Scholar] [CrossRef]
- Samsudin, M.S.N.; Rahman, M.M.; Wahid, M.A. Power generation sources in Malaysia: Status and prospects for sustainable development. J. Adv. Rev. Sci. Res. 2016, 25, 11–28. [Google Scholar]
- VGB Powertech. Electricity Generation 2019|2020. 2019. Available online: https://www.vgb.org/en/data_powergeneration.html?dfid=98054 (accessed on 11 April 2021).
- C2ES. Global Emissions. Energy/Emissions Data. 2020. Available online: https://www.c2es.org/content/international-emissions/ (accessed on 11 November 2020).
- Ritchie, H.; Roser, M. Emissions by Sector. 2020. Available online: .https://ourworldindata.org/emissions-by-sector (accessed on 30 November 2020).
- EIA. Global Natural Gas Markets Overview: A Report Prepared by Leidos, Inc., under Contract to EIA. Working Paper Series. 2014. Available online: https://www.eia.gov/workingpapers/pdf/global_gas.pdf (accessed on 10 April 2021).
- Sandu, S.; Yang, M.; Mahlia, T.M.I.; Wongsapai, W.; Ong, H.C.; Putra, N.; Rahman, S.M.A. Energy-related CO2 emissions growth in ASEAN countries: Trends, drivers and policy implications. Energies 2019, 12, 4650. [Google Scholar] [CrossRef] [Green Version]
- Beeson, M. Contemporary Southeast Asia: Regional Dynamics, National Differences; Palgrave Macmillan: Basingstoke, UK, 2009. [Google Scholar]
- ASEAN Centerfor Energy; Deutsche Gesellschaft für Internationale Zusammenarbeit GmbH. The 5th ASEAN Energy Outlook. 2017. Available online: https://aseanenergy.org/the-5th-asean-energy-outlook/ (accessed on 11 April 2021).
- Silitonga, A.S.; Mahlia, T.M.I.; Ong, H.C.; Riayatsyah, T.M.I.; Kusumo, F.; Ibrahim, H.; Dharma, S.; Gumilang, D. A comparative study of biodiesel production methods for Reutealis trisperma biodiesel. Energy Sources Part A Recover. Util. Environ. Eff. 2017, 39, 2006–2014. [Google Scholar] [CrossRef]
- Mofijur, M.; Mahlia, T.M.I.; Silitonga, A.S.; Ong, H.C.; Silakhori, M.; Hasan, M.H.; Putra, N.; Rahman, S.M.A. Phase Change Materials (PCM) for solar energy usages and storage: An overview. Energies 2019, 12, 3167. [Google Scholar] [CrossRef] [Green Version]
- Ong, H.C.; Masjuki, H.H.; Mahlia, T.M.I.; Silitonga, A.S.; Chong, W.T.; Yusaf, T. Engine performance and emissions using Jatropha curcas, Ceiba pentandra and Calophyllum inophyllum biodiesel in a CI diesel engine. Energy 2014, 69, 427–445. [Google Scholar] [CrossRef]
- Silitonga, A.S.; Masjuki, H.H.; Mahlia, T.M.I.; Ong, H.C.; Chong, W.T. Experimental study on performance and exhaust emissions of a diesel engine fuelled with Ceiba pentandra biodiesel blends. Energy Convers. Manag. 2013, 76, 828–836. [Google Scholar] [CrossRef]
- Silitonga, A.S.; Masjuki, H.H.; Ong, H.C.; Sebayang, A.H.; Dharma, S.; Kusumo, F.; Siswantoro, J.; Milano, J.; Daud, K.; Mahlia, T.M.I.; et al. Evaluation of the engine performance and exhaust emissions of biodiesel-bioethanol-diesel blends using kernel-based extreme learning machine. Energy 2018, 159, 1075–1087. [Google Scholar] [CrossRef]
- IEA. Southeast Asia Energy Outlook 2019; Technical Report; IEA: Paris, France, 2019. [Google Scholar]
- Energy Commission. National Energy Balance 2017. 2017. Available online: https://meih.st.gov.my/documents/10620/f85ba3ae-fd44-4ea4-a69d-400c5f96b3ea (accessed on 1 June 2020).
- Kumar, S.; Abdul Salam, P.; Shrestha, P.; Ackom, E.K. An assessment of thailand’s biofuel development. Sustainability 2013, 5, 1577–1597. [Google Scholar] [CrossRef] [Green Version]
- Chong, C.; Ni, W.; Ma, L.; Liu, P.; Li, Z. The use of energy in Malaysia: Tracing energy flows from primary source to end use. Energies 2015, 8, 2828–2866. [Google Scholar] [CrossRef]
- Anwar, A.; Taib, S.; Mujeebu, M.A.; Salah, W.A. Analysis of sectoral energy conservation in Malaysia. Energy 2009, 34, 733–739. [Google Scholar]
- European Commission. ILCD Handbook: General Guidefor Life Cycle Assessment—Detailed Guidance; Technical Report; Joint Research Centre, Institute for Environment and Sustainability: Luxembourg, 2010. [Google Scholar] [CrossRef]
- Corbetta, P. Social Research: Theory, Methods and Techniques; SAGE Publications: Southend Oaks, CA, USA, 2003. [Google Scholar]
- Energy Commission. Malaysia Energy Information Hub. 2011. Available online: https://meih.st.gov.my/statistics (accessed on 1 June 2020).
- Oh, T.H.; Hasanuzzaman, M.; Selvaraj, J.; Teo, S.C.; Chua, S.C. Energy policy and alternative energy in Malaysia: Issues and challenges for sustainable growth—An update. Renew. Sustain. Energy Rev. 2018, 81, 3021–3031. [Google Scholar] [CrossRef]
- Khor, C.S.; Lalchand, G. A review on sustainable power generation in Malaysia to 2030: Historical perspective, current assessment, and future strategies. Renew. Sustain. Energy Rev. 2014, 29, 952–960. [Google Scholar] [CrossRef]
- Rahim, K.A.; Liwan, A. Oil and gas trends and implications in Malaysia. Energy Policy 2012, 50, 262–271. [Google Scholar] [CrossRef]
- MOSTI. Intended Nationally Determined Contribution of the Government of Malaysia. 2019. Available online: https://www.mosti.gov.my/web/wp-content/uploads/2019/04/18.Malaysia-Intended-Nationally-Determined-Contributions-to-UNFCCC.pdf (accessed on 1 June 2020).
- Wong, T.S. Renewable Energy Policy in Malaysia. Presentation Slide. 2015. Available online: https://www.google.com/url?sa=t&rct=j&q=&esrc=s&source=web&cd=&ved=2ahUKEwiQlZ2dyP7vAhVMzzgGHSHBDnUQFjAAegQIBhAD&url=http%3A%2F%2Foverseas.mofa.go.kr%2Fmy-ko%2Fbrd%2Fm_1929%2Fdown.do%3Fbrd_id%3D1591%26seq%3D1240972%26data_tp%3DA%26file_seq%3D1&usg=AOvVaw0WTwGD6P46HSrZbpWr9HMU (accessed on 5 June 2020).
- Hosseini, S.E.; Wahid, M.A.; Aghili, N. The scenario of greenhouse gases reduction in Malaysia. Renew. Sustain. Energy Rev. 2013, 28, 400–409. [Google Scholar] [CrossRef]
- Thaddeus, J. Complementary roles of natural gas and coal in Malaysia. In Proceedings of the Joint 8th APEC Coal Flow Seminar and the 9th APEC Clean Fossil Energy Technical Seminar: Coal in Sustainable Development in the 21st Century, Kuala Lumpur, Malaysia, 4–5 March 2020. [Google Scholar]
- Minerals and Geoscience Department Malaysia. Malaysian Minerals Yearbook 2013; Minerals and Geoscience Department Malaysia: Terengganu, Malaysia, 2014.
- Johnston, R.J.; Blakemore, R.; Bell, R. The Role of Oil and Gas Companies in the Energy Transition. 2020. Available online: https://www.atlanticcouncil.org/wp-content/uploads/2020/07/OGT-final-web-version.pdf (accessed on 14 April 2021).
- De Oliveira, R.L. Powering the Future: Malaysia’s Energy Policy Challenges; Techreport 55; Institute for Democracy and Economic Affairs: Kuala Lumpur, Malaysia, 2018. [Google Scholar]
- Baruya, P. Prospects for Coal and Clean Coal Technologies in Malaysia; Techreport CCC/171; IEA Clean Coal Centre: London, UK, 2010. [Google Scholar]
- Mushtaq, F.; Maqbool, W.; Mat, R.; Ani, F.N. Fossil fuel energy scenario in Malaysia-prospect of indigenous renewable biomass and coal resources. In Proceedings of the 2013 IEEE Conference on Clean Energy and Technology (CEAT), Langkawi, Malaysia, 18–20 November 2013.
- EIA. Subbituminous and Bituminous Coal Dominate U.S. Coal Production. 2011. Available online: https://www.eia.gov/todayinenergy/detail.php?id=2670# (accessed on 5 June 2020).
- Weise, E. On World Environment Day, Everything You Know About Energy in the US Might Be Wrong. 2019. Available online: https://www.usatoday.com/story/news/2019/06/04/climate-change-coal-now-more-expensive-than-wind-solar-energy/1277637001/ (accessed on 31 December 2020).
- Nikkei Asia. Contracts for $537 Million to Secure Long-Term Coal Supply to Malaysia. 2016. Available online: https://asia.nikkei.com/Business/Contracts-for-537-million-to-secure-long-term-coal-supply-to-Malaysia (accessed on 31 December 2020).
- Energy Commission. Peninsular Malaysia Electricity Supply: Outlook 2017. 2017. Available online: https://www.st.gov.my/en/contents/publications/outlook/Peninsular%20Malaysia%20Electricity%20Supply%20Outlook%202017.pdf#:~:text=In%20the%202017%20Federal%20budget,%25%20to%205.0%25%20in%202017.&text=Therefore%2C%20electricity%20sales%20is%20projected,%25%20to%202.5%25%20in%202017. (accessed on 11 November 2020).
- Shamsuddin, A.H. Development of renewable energy in Malaysia—Strategic initiatives for carbon reduction in the power generation sector. Procedia Eng. 2012, 49, 384–391. [Google Scholar] [CrossRef] [Green Version]
- Kailasam, K. Community Water Quality Monitoring Programme in Malaysia; Technical Report; International Forum on Water Environmental Governance in Asia; Global Environment Centre: Petaling Jaya, Malaysia, 2007. [Google Scholar]
- Scott, J.C. Seeing Like a State: How Certain Schemes to Improve the Human Condition Have Failed; Yale University Press: London, UK, 1999. [Google Scholar]
- Creţan, R.; Vesalon, L. The political economy of hydropower in the communist space: Iron Gates revisited. Tijdschr. Voor Econ. Soc. Geogr. 2017, 108, 688–701. [Google Scholar] [CrossRef]
- Swyngedouw, E. Technonatural revolutions: The scalar politics of Franco’s hydro-social dream for Spain, 1939–1975. Trans. Inst. Br. Geogr. 2007, 32, 9–28. [Google Scholar] [CrossRef]
- Wahby, W. The Three Gorges Dam of China: Technology to bridge two centuries. J. Technol. Stud. 2003, 29, 19–25. [Google Scholar] [CrossRef]
- Li, K.; Zhu, C.; Wu, L.; Huang, L. Problems caused by the Three Gorges Dam construction in the Yangtze river basin: A review. Environ. Rev. 2013, 21, 127–135. [Google Scholar] [CrossRef]
- Mekhilef, S.; Saidur, R.; Safari, A.; Mustaffa, W.E.S.B. Biomass energy in Malaysia: Current state and prospects. Renew. Sustain. Energy Rev. 2011, 15, 3360–3370. [Google Scholar] [CrossRef]
- Goh, C.S.; Tan, K.T.; Lee, K.T.; Bhatia, S. Bio-ethanol from lignocellulose: Status, perspectives and challenges in Malaysia. Bioresour. Technol. 2010, 101, 4834–4841. [Google Scholar] [CrossRef]
- National Geographic. Biomass Energy. 2012. Available online: https://www.nationalgeographic.org/encyclopedia/biomass-energy/#:~:text=Biomass%20energy%20is%20energy%20generated,heat%20or%20converted%20into%20electricity (accessed on 31 December 2020).
- Hanafiah, M.M. Biogas production from different substrates under anaerobic conditions. In Proceedings of the 3rd lnternational Conference on Chemical, Agricultural and Medical Sciences (CAMS-2015), Singapore, 10–11 December 2015. [Google Scholar]
- Tan, Z.Y. Green Technology: Time to Tap Biomass. 2020. Available online: https://www.theedgemarkets.com/article/green-technology-time-tap-biomass (accessed on 31 December 2020).
- Seljak, T.; Pavalec, K.; Buffi, M.; Valera-Medina, A. Challenges and solutions for utilization of bioliquids in microturbines. J. Eng. Gas Turbines Power 2018, 141, 031401. [Google Scholar] [CrossRef] [Green Version]
- Cheng, S.; Li, Z.; Mang, H.; Neupane, K.; Wauthelet, M.; Huba, E. Application of fault tree approach for technical assessment of small-sized biogas systems in Nepal. Appl. Energy 2014, 113, 1372–1381. [Google Scholar] [CrossRef]
- Chang, I.; Zhao, J.; Yin, X.; Wu, J.; Jia, Z.; Wang, L. Comprehensive utilizations of biogas in Inner Mongolia, China. Renew. Sustain. Energy Rev. 2011, 15, 1442–1453. [Google Scholar] [CrossRef]
- Hamid, M.R.; Haque, M.N.; Rouf, M.A.; Islam, M.S. Dissemination of domestic biogas plants in Bangladesh—Current state, problems faced and barriers. Int. J. Sci. Eng. Res. 2013, 4, 45000. [Google Scholar]
- Roubík, H.; Mazancová, J.; Banout, J.; Verner, V. Addressing problems at small-scale biogas plants: A case study from central Vietnam. J. Clean. Prod. 2016, 112, 2784–2792. [Google Scholar] [CrossRef]
- Hall, D.O.; Rosillo-Calle, F.; de Groot, P. Biomass energy: Lessons from case studies in developing countries. Energy Policy 1992, 20, 62–73. [Google Scholar] [CrossRef]
- Mekhilef, S.; Safari, A.; Mustaffa, W.E.S.; Saidur, R.; Omar, R.; Younis, M.A.A. Solar energy in Malaysia: Current state and prospects. Renew. Sustain. Energy Rev. 2012, 16, 386–396. [Google Scholar] [CrossRef]
- Naam, R. Solar’s Future Is Insanely Cheap. 2020. Available online: https://rameznaam.com/2020/05/14/solars-future-is-insanely-cheap-2020/ (accessed on 31 December 2020).
- Niranjan, A. Falling Solar Panel Prices Spell Sunny Future for Clean Energy. 2020. Available online: https://www.dw.com/en/cheap-solar-energy-prices-explained/a-53590607 (accessed on 31 December 2020).
- Panos, K. The Dark Side of Solar Power. 2020. Available online: https://hackaday.com/2020/12/02/the-dark-side-of-solar-power/ (accessed on 31 December 2020).
- Gomesh, N.; Daut, I.; Irwanto, M.; Irwan, Y.M.; Fitra, M. Study on Malaysian’s perspective towards renewable energy mainly on solar energy. Energy Procedia 2013, 36, 303–312. [Google Scholar] [CrossRef] [Green Version]
- Solar Panel Malaysia. An Overview of the Feed-In Tariff in Malaysia. 2019. Available online: https://www.solarpanelmalaysia.com/fit/an-overview-of-the-feed-in-tariff-in-malaysia/ (accessed on 5 June 2020).
- Barrock, J. Response to 1400 mw Solar Jobs Could Be Lukewarm. 2020. Available online: https://www.theedgemarkets.com/article/response-1400mw-solar-jobs-could-be-lukewarm (accessed on 31 December 2020).
- Good, C.S.; Lobaccaro, G.; Hårklau, S. Optimization of solar energy potential for buildings in urban areas—A Norwegian case study. Energy Procedia 2014, 58, 166–171. [Google Scholar] [CrossRef] [Green Version]
- Zhang, J.; Xu, L.; Shabunko, V.; Tay, S.E.R.; Sun, H.; Lau, S.S.Y.; Reindl, T. Impact of urban block typology on building solar potential and energy use efficiency in tropical high-density city. Appl. Energy 2019, 240, 513–533. [Google Scholar] [CrossRef]
- Sarralde, J.J.; Quinn, D.J.; Wiesmann, D.; Steemers, K. Solar energy and urban morphology: Scenarios for increasing the renewable energy potential of neighbourhoods in London. Renew. Energy 2015, 73, 10–17. [Google Scholar] [CrossRef] [Green Version]
- Amado, M.; Poggi, F. Solar urban planning: A parametric approach. Energy Procedia 2014, 48, 1539–1548. [Google Scholar] [CrossRef] [Green Version]
- Lin, A.; Lu, M.; Sun, P. The influence of local environmental, economic and social variables on the spatial distribution of photovoltaic applications across China’s urban areas. Energies 2018, 11, 1986. [Google Scholar] [CrossRef] [Green Version]
- Lundgren, M.; Dahlberg, J. Approaches, methods and tools for solar energy in urban planning. Report. 2018. Available online: http://task51.iea-shc.org/Data/Sites/1/publications/Task51_ReportB2_180815.pdf (accessed on 11 April 2021).
- Kanters, J.; Wall, M.; Dubois, M. Typical values for active solar energy in urban planning. Energy Procedia 2014, 48, 1607–1616. [Google Scholar] [CrossRef] [Green Version]
- Babatunde, K.A.; Said, F.F.; Nor, N.G.M. Reducing carbon dioxide emissions from Malaysian power sector: Current issues and future directions. J. Kejuruter. SI 2018, 1, 59–69. [Google Scholar]
- Wasiu, O.I.; Alasinrin, B.K. Growth thresholds and environmental degradation in sub-Saharan African countries: An exploration of kuznets hypothesis. Int. J. Manag. Account. Econ. 2015, 2, 858–871. [Google Scholar]
- IPCC. Stationary Combustion: Sectoral Approach. 2006. Available online: https://www.ipcc-nggip.iges.or.jp/public/2006gl/pdf/2_Volume2/V2_2_Ch2_Stationary_Combustion.pdf (accessed on 5 June 2020).
- MESTECC. Malaysia Third National Communication and Second Biennial Update Report to the UNFCCC. Technical Report; Ministry of Energy, Science, Technology, Environment and Climate Change: Putrajaya, Malaysia, 2018.
- Huda, M.; Okajima, K.; Suzuki, K. CO2 emission from electricity generation in Malaysia: A decomposition analysis. J. Energy Power Eng. 2017, 11, 779–788. [Google Scholar]
- Othman, M.R.; Zakaria, R.; Fernando, W.J.N. CO2 emission and carbon capture for coal fired power plants in Malaysia and Indonesia. In Proceedings of the International Conference on Environment 2008 (ICENV 2008), Penang, Malaysia, 15–17 December 2008. [Google Scholar]
- IndexMundi. Commodity Prices. 2020. Available online: https://www.indexmundi.com/commodities/ (accessed on 7 June 2020).
- Zhang, X.; Yu, L.; Wang, S. The impact of financial crisis of 2007–2008 on crude oil price. In Proceedings of the International Conference on Computational Science, Baton Rouge, LA, USA, 25–27 May 2009; pp. 643–652. [Google Scholar]
- DiChristopher, T. The Financial Crisis Crushed Record Oil Prices but the Market Is Still Gripped by Boom and Bust. 2012. Available online: https://www.cnbc.com/2018/09/12/financial-crisis-crushed-record-oil-prices-but-another-boom-looms.html (accessed on 7 June 2020).
- EIA. Natural Gas Prices Drop Following Strong Production Growth. 2015. Available online: https://www.eia.gov/todayinenergy/detail.php?id=19751 (accessed on 7 June 2020).
- Farrington, S. Diesel Prices Hit Five-Year Low. 2015. Available online: https://www.bbc.com/news/business-33920826 (accessed on 14 April 2021).
- Heilig, G.K. The greenhouse gas methane (CH4): Sources and sinks, the impact of population growth, possible interventions. Popul. Environ. A J. Interdiscip. Stud. 1994, 16, 109–137. [Google Scholar] [CrossRef] [Green Version]
- Wigley, T.M.L. Coal to gas: The influence of methane leakage. Clim. Chang. 2011, 108, 601–608. [Google Scholar] [CrossRef] [Green Version]
- Shindell, D.T.; Faluvegi, G.; Koch, D.M.; Schmidt, G.A.; Unger, N.; Bauer, S.E. Improved attribution of climate forcing to emissions. Science 2009, 326, 716–718. [Google Scholar] [CrossRef] [Green Version]
- Spath, P.L.; Mann, M.K.; Kerr, D.R. Life Cycle Assessment of Coal-Fired Power Production; Techreport; National Renewable Energy Laboratory: Jefferson County, CO, USA, 1999. [Google Scholar]
- Lavoie, T.N.; Shepson, P.B.; Gore, C.A.; Kaeser, B.H.S.; Wulle, B.; Lyon, D.; Rudek, J. Assessing the methane emissions from natural gas-fired power plants and oil refineries. Environ. Sci. Technol. 2017, 51, 3373–3381. [Google Scholar] [CrossRef]
- McGlade, C.; Michaels, K.C.; Gould, T. Global Methane Emissions From Oil and Gas. 2020. Available online: https://www.iea.org/articles/global-methane-emissions-from-oil-and-gas# (accessed on 1 June 2020).
- EIA. Emissions of Greenhouse Gases in the United States 2009; Techreport; Energy Information Administration, U.S. Department of Energy: Washington, DC, USA, 2011.
- Waxman, A.R.; Khomaini, A.; Leibowicz, B.D.; Olmstead, S.M. Emissions in the stream: Estimating the greenhouse gas impacts of an oil and gas boom. Environ. Res. Lett. 2020, 15, 1–12. [Google Scholar] [CrossRef] [Green Version]
- Shankman, S. What Is Nitrous Oxide and Why Is It a Climate Threat? 2019. Available online: https://insideclimatenews.org/news/11092019/nitrous-oxide-climate-pollutant-explainer-greenhouse-gas-agriculture-livestock (accessed on 1 June 2020).
- Hao, W.M.; Wofsy, S.C.; McElroy, M.B.; Farmayan, W.F.; Togan, M.A.; Beér, J.M.; Zahniser, M.S.; Silver, J.A.; Kolb, C.E. Nitrous oxide concentrations in coal, oil, and gas furnace flames. Combust. Sci. Technol. 1987, 55, 23–32. [Google Scholar] [CrossRef]
- EPA. Nitrogen Oxides (NOx), Why and How They Are Controlled; Techreport; United States Environmental Protection Agency Clean Air Technology Center: Washington, DC, USA, 1999.
- EPA. Greenhouse Gas Inventory Guidance: Direct Emissions From Stationary Combustion Sources; Technical Report; United States Environmental Protection Agency Center for Corporate Climate Leadership: Washington, DC, USA, 2016.
- Wójtowicz, M.A.; Pels, J.R.; Moulijn, J.A. N2O emission control in coal combustion. Fuel 1994, 73, 1416–1422. [Google Scholar] [CrossRef]
- IPCC. Special Report: Global Warming of 1.5 °C. 2018. Available online: https://www.ipcc.ch/sr15/ (accessed on 11 November 2020).
- Shindell, D. Understanding Carbon Monoxide as Pollutant and as Agent of Climate Change. 2007. Available online: https://www.giss.nasa.gov/research/briefs/shindell_09/ (accessed on 1 June 2020).
- De Gouw, J.A.; Parrish, D.D.; Frost, G.J.; Trainer, M. Reduced emissions of CO2, NOx, and SO2 from U.S. power plants owing to switch from coal to natural gas with combined cycle technology. Earth’s Future 2014, 2, 75–82. [Google Scholar] [CrossRef]
- IEA. Asia Is Set to Support Global Coal Demand for the Next, Five Years. 2019. Available online: https://www.iea.org/news/asia-is-set-to-support-global-coal-demand-for-the-next-five-years (accessed on 9 April 2021).
- Bekhet, H.A.; Yasmin, T. Rapid economic growth and natural gas consumption nexus: Looking forward from perspective of 11th Malaysian plan. IOP Conf. Ser. Earth Environ. Sci. 2016, 32, 012051. [Google Scholar] [CrossRef]
- GE. Manjung 4: Powering Malaysia with Clean Coal Technology. 2017. Available online: https://www.ge.com/news/reports/manjung-4-powering-malaysia-clean-coal-technology (accessed on 10 April 2021).
- Shah, S.A. TNB Makes Its Mark With 2nd Cleaner Coal-Fired Power Plant. 2017. Available online: https://www.tnb.com.my/assets/newsclip/12052017b.pdf (accessed on 10 April 2021).
- Zhang, C.; Romagnoli, A.; Kim, J.; Mohd Azli, A.A.; Rajoo, S.; Lindsay, A. Implementation of industrial waste heat to power in Southeast Asia: An outlook from the perspective of market potentials, opportunities and success catalysts. Energy Policy 2017, 106, 525–535. [Google Scholar] [CrossRef]
- Jouhara, H.; Khordehgah, N.; Almahmoud, S.; Delpech, B.; Chauhan, A.; Tassou, S.A. Waste heat recovery technologies and applications. Therm. Sci. Eng. Prog. 2018, 6, 268–289. [Google Scholar] [CrossRef]
- Agathokleous, R.; Bianchi, G.; Panayiotou, G.; Aresti, L.; Argyrou, M.C.; Georgiou, G.S.; Tassou, S.A.; Jouhara, H.; Kalogirou, S.A.; Florides, G.A.; et al. Waste heat recovery in the EU industry and proposed new technologies. Energy Procedia 2019, 161, 489–496. [Google Scholar] [CrossRef]
- Jin, Y.; Gao, N.; Zhu, T. Techno-economic analysis on a new conceptual design of waste heat recovery for boiler exhaust flue gas of coal-fired power plants. Energy Convers. Manag. 2019, 200, 112097. [Google Scholar] [CrossRef]
- Rajoo, S. Energy Recovery in Petroleum Processing via Integrated High Performance Technology. In Proceedings of the Professionals in Energy Series: SPE Malaysia-Thailand JDA Summit, Putrajaya, Malaysia, 2–3 December 2019; The Society for Professionals in Energy: Putrajaya, Malaysia, 2019. [Google Scholar]
- Mustapa, S.I.; Peng, L.Y.; Hashim, A.H. Issues and challenges of renewable energy development: A Malaysian experience. In Proceedings of the PEA-AIT International Conference on Energy and Sustainable Development: Issues and Strategies (ESD 2010), Chiang Mai, Thailand, 2–4 June 2010. [Google Scholar]
- Wright, C. GreenD+: Sustainable Diesel Alternatives for the Reduction of Carbon Emissions. 2020. Available online: https://www.azocleantech.com/article.aspx?ArticleID=1111 (accessed on 11 November 2020).
- Brown, J. Alternative Fuels: The Future of Zero Emissions Shipping. 2018. Available online: https://www.edfeurope.org/news/2018/31/07/alternative-fuels-future-zero-emissions-shipping (accessed on 11 November 2020).
- Rice, M. Producing Clean Hydrogen with Near-Zero Carbon Emissions Using the Hazer Process. 2016. Available online: https://www.azocleantech.com/article.aspx?ArticleID=611 (accessed on 11 November 2020).


| Fuel Type | CO (kg/TJ) | CH (kg/TJ) | NO (kg/TJ) |
|---|---|---|---|
| Natural gas | 56,100 | 1 | 0.1 |
| Residual fuel oil | 77,400 | 3 | 0.6 |
| Diesel oil | 74,100 | 3 | 0.6 |
| Other bituminous coal | 94,600 | 1 | 1.5 |
| Sub-bituminous coal | 96,100 | 1 | 1.5 |
| Industrial waste (Biomass) | 143,000 | 30 | 4 |
| Other biogas | 54,600 | 1 | 0.1 |
Publisher’s Note: MDPI stays neutral with regard to jurisdictional claims in published maps and institutional affiliations. |
© 2021 by the authors. Licensee MDPI, Basel, Switzerland. This article is an open access article distributed under the terms and conditions of the Creative Commons Attribution (CC BY) license (https://creativecommons.org/licenses/by/4.0/).
Share and Cite
Abdul Latif, S.N.; Chiong, M.S.; Rajoo, S.; Takada, A.; Chun, Y.-Y.; Tahara, K.; Ikegami, Y. The Trend and Status of Energy Resources and Greenhouse Gas Emissions in the Malaysia Power Generation Mix. Energies 2021, 14, 2200. https://doi.org/10.3390/en14082200
Abdul Latif SN, Chiong MS, Rajoo S, Takada A, Chun Y-Y, Tahara K, Ikegami Y. The Trend and Status of Energy Resources and Greenhouse Gas Emissions in the Malaysia Power Generation Mix. Energies. 2021; 14(8):2200. https://doi.org/10.3390/en14082200
Chicago/Turabian StyleAbdul Latif, Siti Norasyiqin, Meng Soon Chiong, Srithar Rajoo, Asako Takada, Yoon-Young Chun, Kiyotaka Tahara, and Yasuyuki Ikegami. 2021. "The Trend and Status of Energy Resources and Greenhouse Gas Emissions in the Malaysia Power Generation Mix" Energies 14, no. 8: 2200. https://doi.org/10.3390/en14082200