Article

HVAC Operation Schemes and Commissioning Process Resolving Stack Effect Problem and Adjusting According to Changes in the Environment: A Case Study in High-Rise Building in South Korea

1
Indoor Air Quality Research Center, Korea Institute of Civil Engineering and Building Technology, Goyang-Si 10223, Korea
2
Department of Biology, Amherst College, 220 South Pleasant Street, Amherst, MA 01002, USA
3
Department of Living and Built Environment Research, Korea Institute of Civil Engineering and Building Technology, Goyang-Si 10223, Korea
4
Department of Architectural Engineering, University of Ulsan, Ulsan 44610, Korea
*
Author to whom correspondence should be addressed.
Energies 2021, 14(8), 2299; https://doi.org/10.3390/en14082299
Submission received: 9 February 2021 / Revised: 12 April 2021 / Accepted: 14 April 2021 / Published: 19 April 2021
(This article belongs to the Special Issue Energy-Saving, Comfort, and Healthier Strategies for Smart Buildings)

Abstract

:
Various problems often arise in high-rise buildings during the winter months due to the stack effect. In this study, the high-rise building of interest, located in South Korea, was experiencing constant loud noises in the winter due to the stack effect. Thus, we created a noise level reduction plan by creating a method for pressurizing the high-rise zones of the building according to outdoor conditions. To discover the appropriate pressurization operating modes, we applied a two-year commissioning process to the 50-story building of interest. The 1st- and 47th-floor elevator halls were identified to have the highest noise levels of all other floors. Prior to applying the reduction plan, the maximum noise level on the first floor with the HVAC system turned off was 85 dB(A) and with the HVAC system turned on it was 70 dB(A). Both values exceeded the criteria of 57 dB(A) for a lobby space of a commercial building. In the case of the 47th floor, the maximum noise level with the HVAC system turned off was 58.7 dB(A) and with the HVAC system turned off was 56.0 dB(A), despite the latter having increased airtightness performance and applying preliminary pressurization (i.e., HVAC operation mode 2). These values exceeded the criteria of 48 dB(A) for an elevator hall in a commercial building. Following this initial data, we determined to pressurize the high/mid-rise zones of the building according to the outdoor air temperature and wind velocity conditions, which we categorized into four types (i.e., HVAC operation mode 4). To this effect, the first-floor elevator hall’s maximum noise level was 56.6 dB(A), meeting the criteria, and the 47th-floor elevator hall’s maximum noise level was 49.5 dB(A), still exceeding the criteria but by an insignificant amount. Although the HVAC pressurization operation we utilized resulted in favorable results for the target building A, it may not be as effective in other new high-rise buildings, creating changes to the indoor air environment or to the energy costs in maintaining a building. However, for the purposes of resolving the stack effect, we believe that the commissioning process we took to optimize the HVAC operation that is presented here can be applied to other new and existing high-rise commercial buildings.

1. Introduction

With the increasing migration of people to cities, there has been a greater demand for high-rise buildings. Although there have been refinements in construction technology over the years, problems that are unique to high-rise buildings continue to persist. Many of these problems are related to the stack effect.
The stack effect is the vertical movement of air throughout a high-rise building driven by thermal buoyancy that occurs due to temperature differences between indoor and outdoor air [1,2,3]. In other words, the heated air inside a building moves upward through vertical spaces that are not perfectly sealed, such as elevator shafts or stairwells, before escaping outside. The resulting air current then draws cold air from outside and into the low-rise zones of the building in the winter. The opposite air movement occurs during warmer weather, called the reverse-stack effect. However, this is less apparent because temperature differences between the indoor and outdoor of buildings are generally greater during the winter.
The air movement in high-rise buildings also creates pressure differences across building components. In the winter months, the floors below the neutral pressure level (NPL) of a building experience a net negative, inward-acting pressure while the floors above the NPL experience a net positive, outward-acting pressure [4]. The floors furthest away from the NPL experience the largest pressure differences. As such, the magnitude of the stack effect is proportional to the height of a building and the indoor and outdoor temperature difference. In other words, higher temperature differences and taller buildings experience larger stack effects.
The vertical air movement and pressure difference caused by the stack effect produces several problems in high-rise buildings. Malfunctioning elevator doors, unpleasant whistling noises, uncomfortable drafts, and increased heating loads [5] may result. The stack effect also contributes to hazardous conditions when a fire breaks out by enabling the rapid spread of fire and smoke [6]. Furthermore, indoor air quality is significantly impacted by the stack effect, allowing pollutants [7,8] and viruses [9,10] to infiltrate buildings, which then results in reduced heating, ventilation, and air-conditioning (HVAC) performance [11].
Many countermeasures have been proposed for the stack effect. These can be categorized as architectural and mechanical methods [12]. Architectural methods aim to relieve the stack effect through construction or improving building design. For instance, increasing the number of walls between the building envelope and the elevator shaft, or compartmentalizing [6], has been shown to help reduce the stack effect. Improving airtightness of existing compartments, like the internal walls of the building envelope on each floor, is also known to mitigate the stack effect [13,14]. Furthermore, because stack pressure difference acts on internal walls rather than the exterior façade of a high-rise building [15], a method to reduce such pressure differences across the elevator zone is by partitioning the interior core and shaft, consequently improving airtightness [16]. On the other hand, mechanical methods look to utilize existing HVAC systems or install new systems. That is, the stack effect could be reduced by attempting to re-distribute and transfer pressure from one building compartment to another [12].
While both methods have their own limitations, architectural methods are especially limited in that they are feasible only in the early design stages of high-rise buildings. This is mostly because there are many difficulties that come with applying such countermeasures while a building is occupied. Furthermore, our study is specifically focused on commercial buildings in South Korea. Many high-rise buildings in South Korea were first built without regards to proper architectural and mechanical methods until the early 2000s [17] and thus are occupied at the time of our study. Additionally, architectural methods of reducing the stack effect are more appropriate for residential high-rise buildings because they are already divided into individual household units. It is difficult to apply these same architectural methods to commercial high-rise buildings that require open spaces.
In recent years, airtightness has been enhanced to resolve the stack effect in high-rise buildings as they are being constructed. However, the average height of buildings has increased and gradual changes in climate have caused sudden drops in outdoor air temperature and increases in wind velocity, all of which heightens the severity of the stack effect in high-rise buildings. Thus, measures in addition to improved airtightness are needed to respond to such changes once construction of buildings are completed. Of the mechanical methods, pressurizing the interior of buildings through the HVAC system, with adjustments made according to outdoor air temperature and wind velocity, appears to be a method that holds promise. To deduce the optimal HVAC operation scheme for a certain high-rise building, a commissioning process should be performed and documented. By doing so, building managers can be educated on when different HVAC operation modes should be operated to efficiently pressurize the building, thereby reducing any issues caused by the stack effect. As a result, creating an appropriate commissioning process as well as understanding the theory behind HVAC pressurization to reduce the stack effect problem is essential.
After exploring different commissioning processes, we wanted to streamline our own commissioning process (as noted in Section 2.3) before applying it to the building of interest in our study. Once we applied the streamlined commissioning process, we determined the optimal HVAC operation schemes and a process to adjust the schemes according to environmental factors to resolve the stack effect.

2. Reducing Stack Effect Using HVAC Pressurization through a Building Commissioning Process

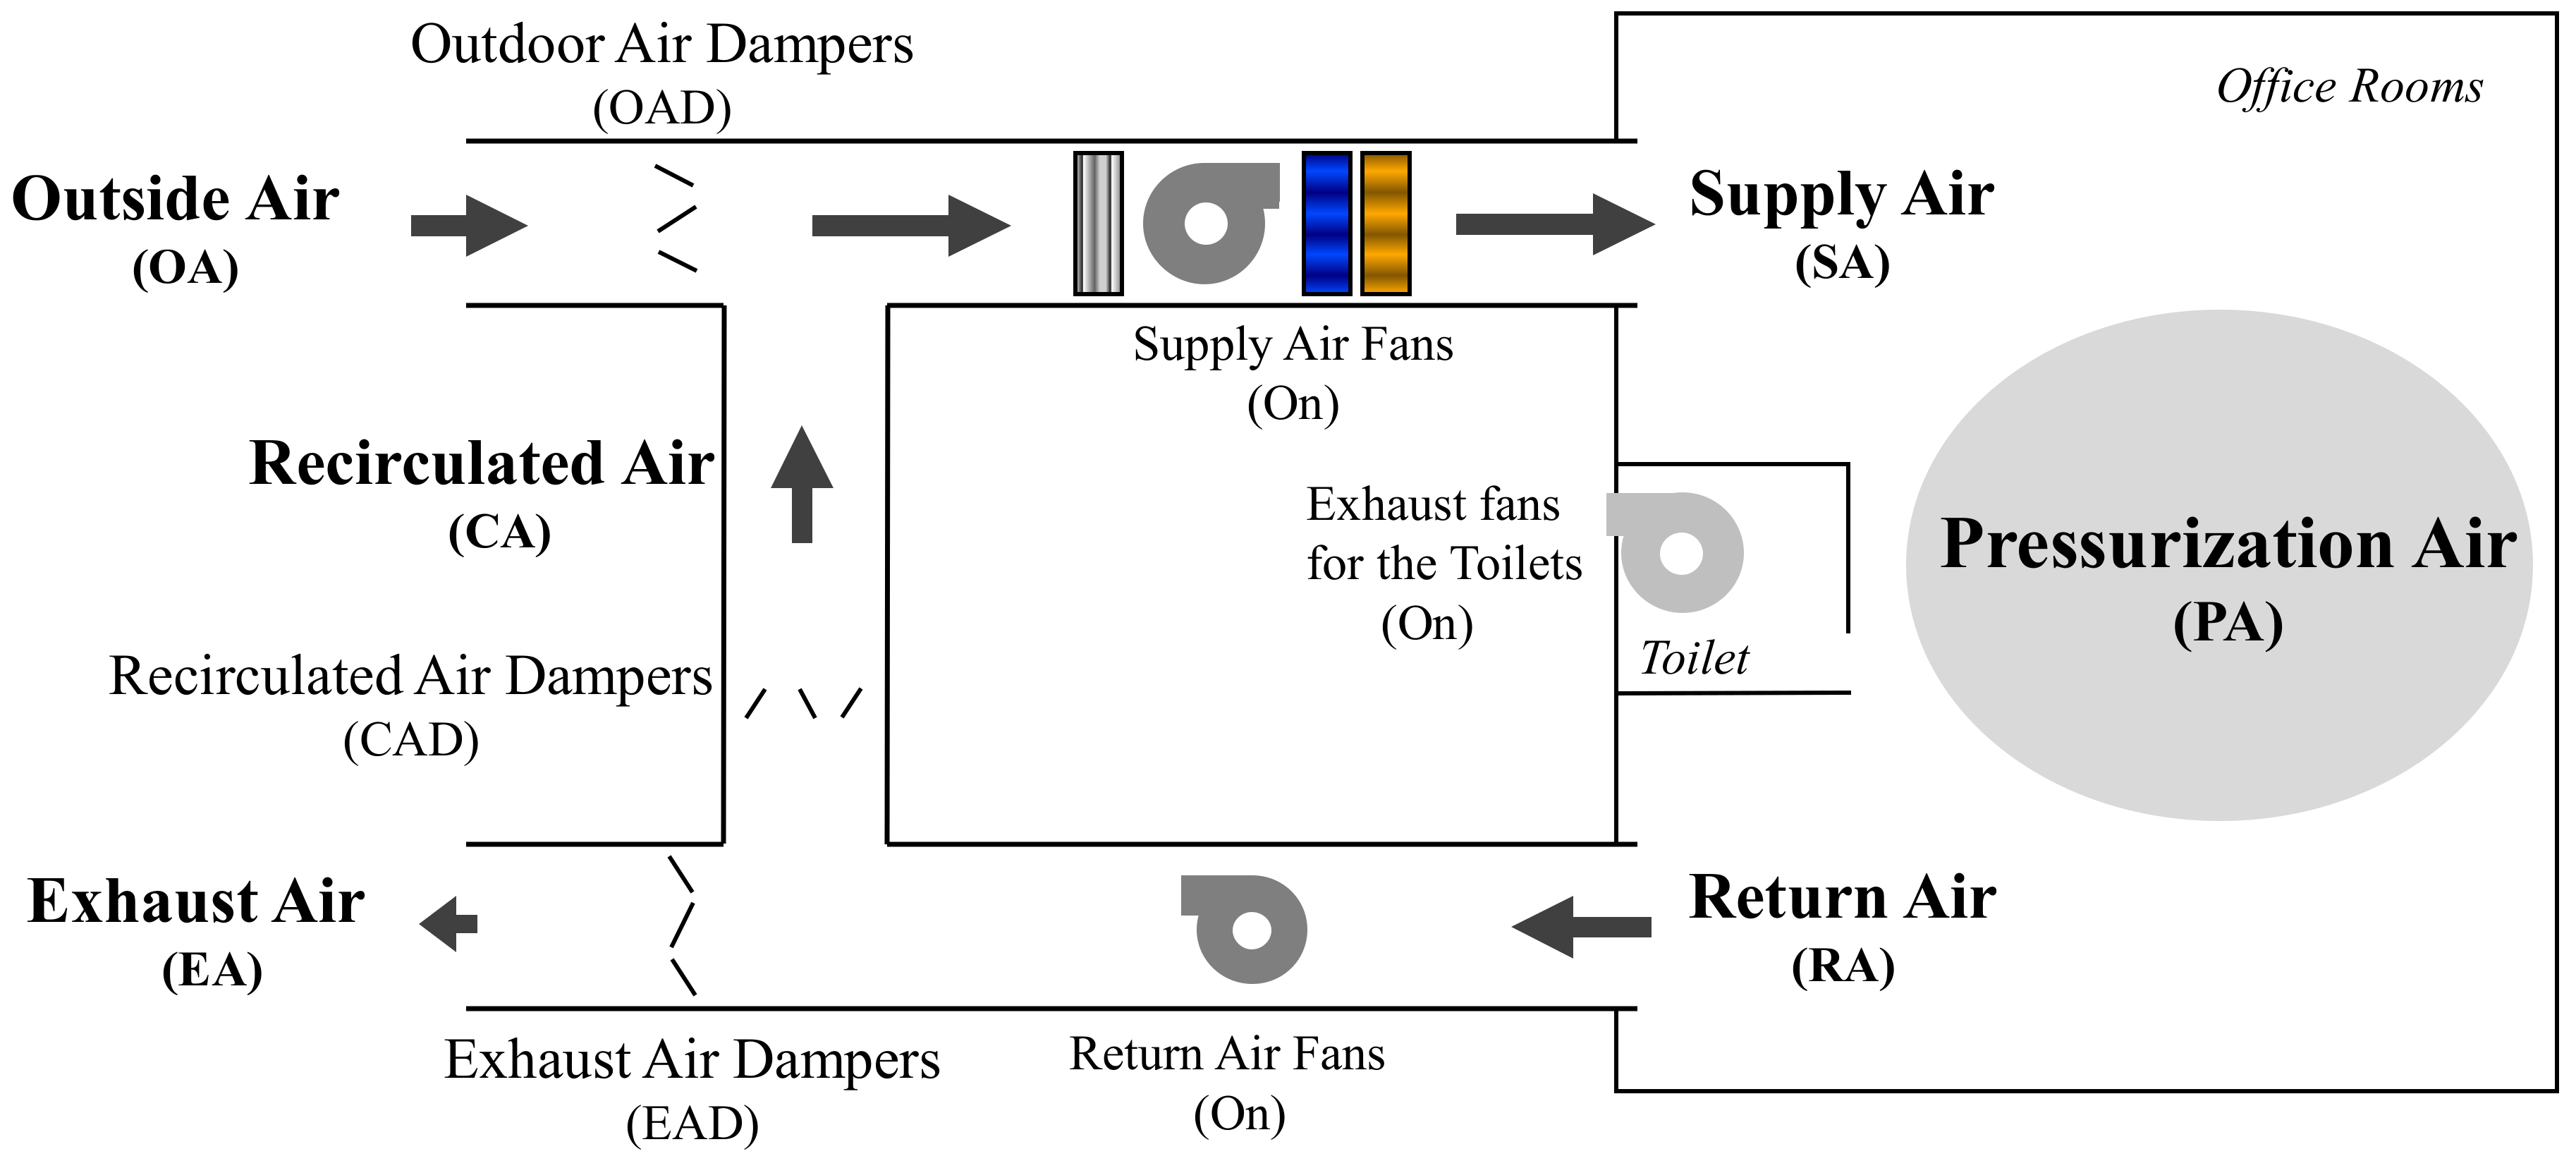
2.1. Principles of HVAC Pressurization

When the stack effect occurs in a high-rise, open-plan office building, the greatest pressure differences are examined across elevator doors located on the first and top floors [18]. As such, mechanical methods that utilize new or existing HVAC systems can be used to distribute pressure throughout a high-rise building in an attempt to resolve the stack effect. Thus, it appears, at least in principle, that mechanically pressurizing the high-rise zone of a building could diminish the net positive pressure acting across the elevator doors and the building envelope, preventing indoor air from leaking out [17]. This can be done by reducing the return air volume (VRA) and the exhaust air volume (VEA) of an HVAC system to a minimum while maintaining (or increasing, according to the outdoor air temperature) the outdoor air volume (VOA) and the supply air volume (VSA) as shown in Figure 1.
This method of mechanical pressurization via the HVAC system will also increase the absolute pressure of the office spaces in the high-rise floors and the pressure inside the elevator shaft simultaneously (Figure 2). Consequently, the pressure difference on the elevator door (ΔPE2) would decrease whereas the pressure difference on the building envelope (ΔPB2) would increase in the high-rise zone. In contrast, ΔPE2 and ΔPB2 are simultaneously reduced in the low-rise zone because mechanical pressurization of the high-rise zone lowers the NPL of the building [17].
The overall effect of mechanical pressurization of the high-rise zone by reducing VRA is the reduction of air flow rate from the elevator shaft to the office spaces in the high-rise zone. This then weakens the ensuing air current in the lobby area of the first floor that draws outdoor air into the elevator shaft. With the pressure difference in the elevator shaft reduced, other problems such as malfunctioning elevator doors or elevator doors that create unpleasant noises can be alleviated as well.

2.2. Applications of HVAC Pressurization

Many studies have investigated mechanical countermeasures based on the principles of HVAC pressurization [12,15,17,18,19,20,21]. For instance, one study investigated whether the mechanical depressurization of the high-rise zones and pressurization of the low-rise zones of a high-rise commercial building via HVAC system could help reduce infiltration [6]. The study’s findings depicted that such operation reduces the infiltrated air volume by decreasing the pressure difference across the building envelope. Yet, this was at the expense of increasing pressure differences across vertical shafts, such as elevators and stairwells, and thus exacerbated problems related to the stack effect. Tamblyn and Eng [19], on the contrary, explored the opposite phenomenon: They pressurized the high-rise zones and depressurized the low-rise zones of a commercial high-rise building. This effectively reduced pressure differences across the elevator shafts, but also resulted in increased infiltration of air through the low-rise zones of the building envelope. Subsequently, the importance of increasing airtightness of the building envelope was re-emphasized.
In terms of utilizing HVAC systems as a means to resolve the pressure differences and the stack effect, Yu et al. [17] proposed an operation schematic to pressurize an indoor space (Figure 3). The VSA supplied to the room is maintained as is or increased based on outdoor temperature, such that the sum of VRA and the corresponding toilet exhaust air volume (VEA_T) is smaller than the VSA. Additionally, the outdoor air dampers (OAD) and recirculated air dampers (CAD) of the HVAC system are kept as is while the exhaust air dampers (EAD) are closed off to maintain a pressurized state. The volume of pressurization air of a particular zone (VPA) can be calculated using Equations (1) and (2), and the volume of pressurization air for each floor (VPAi) in the zone is given by Equation (3):
V P A = V S A V R A + V E A _ T
= V O A V E A + V E A _ T
V P A i = V P A / n
where n is the number of floors in a zone.
This HVAC operation schematic resolved the stack effect as well as related issues such as elevator door malfunctioning in the commercial high-rise building. Despite resolving these problems, however, the expected increase of total VOA flowing into the entire building can lead to an infiltration problem at the lower zone elevator doors, much like Tamblyn and Eng’s study results [19].
Based on these previous studies that utilized mechanical pressurization to resolve the stack effect in high-rise buildings, there is a need to optimize the HVAC operation schematic proposed by Yu et al. [17]. In Yu et al.’s [17] study, the optimum method for pressurization of vertical floors was examined for a building designed such that the elevator door had no problems opening or closing at an outdoor temperature of −11.3 °C and a pressure of less than 100 Pa. To do so, simulations of pressurizing all floors of the building, the mid- and high-rise zones of the building, and only the high-rise zone of the building were conducted before moving to field experiements. The study found that pressurizing 0.89% of the air volume in the high-rise zone (Floors 40–60) approached the required pressure of 100 Pa on the elevator doors. However, this pressure difference across elevator doors occurs due to the stack effect and thus varies with outdoor air temperature. As a result, HVAC operation modes used to retain a certain internal pressure should be adjusted according to the outdoor air temperature. Although Yu et al. [17] was able to resolve issues related to elevator doors opening and closing, they were unable to resolve the whistling noises that occurred in the elevator hall.

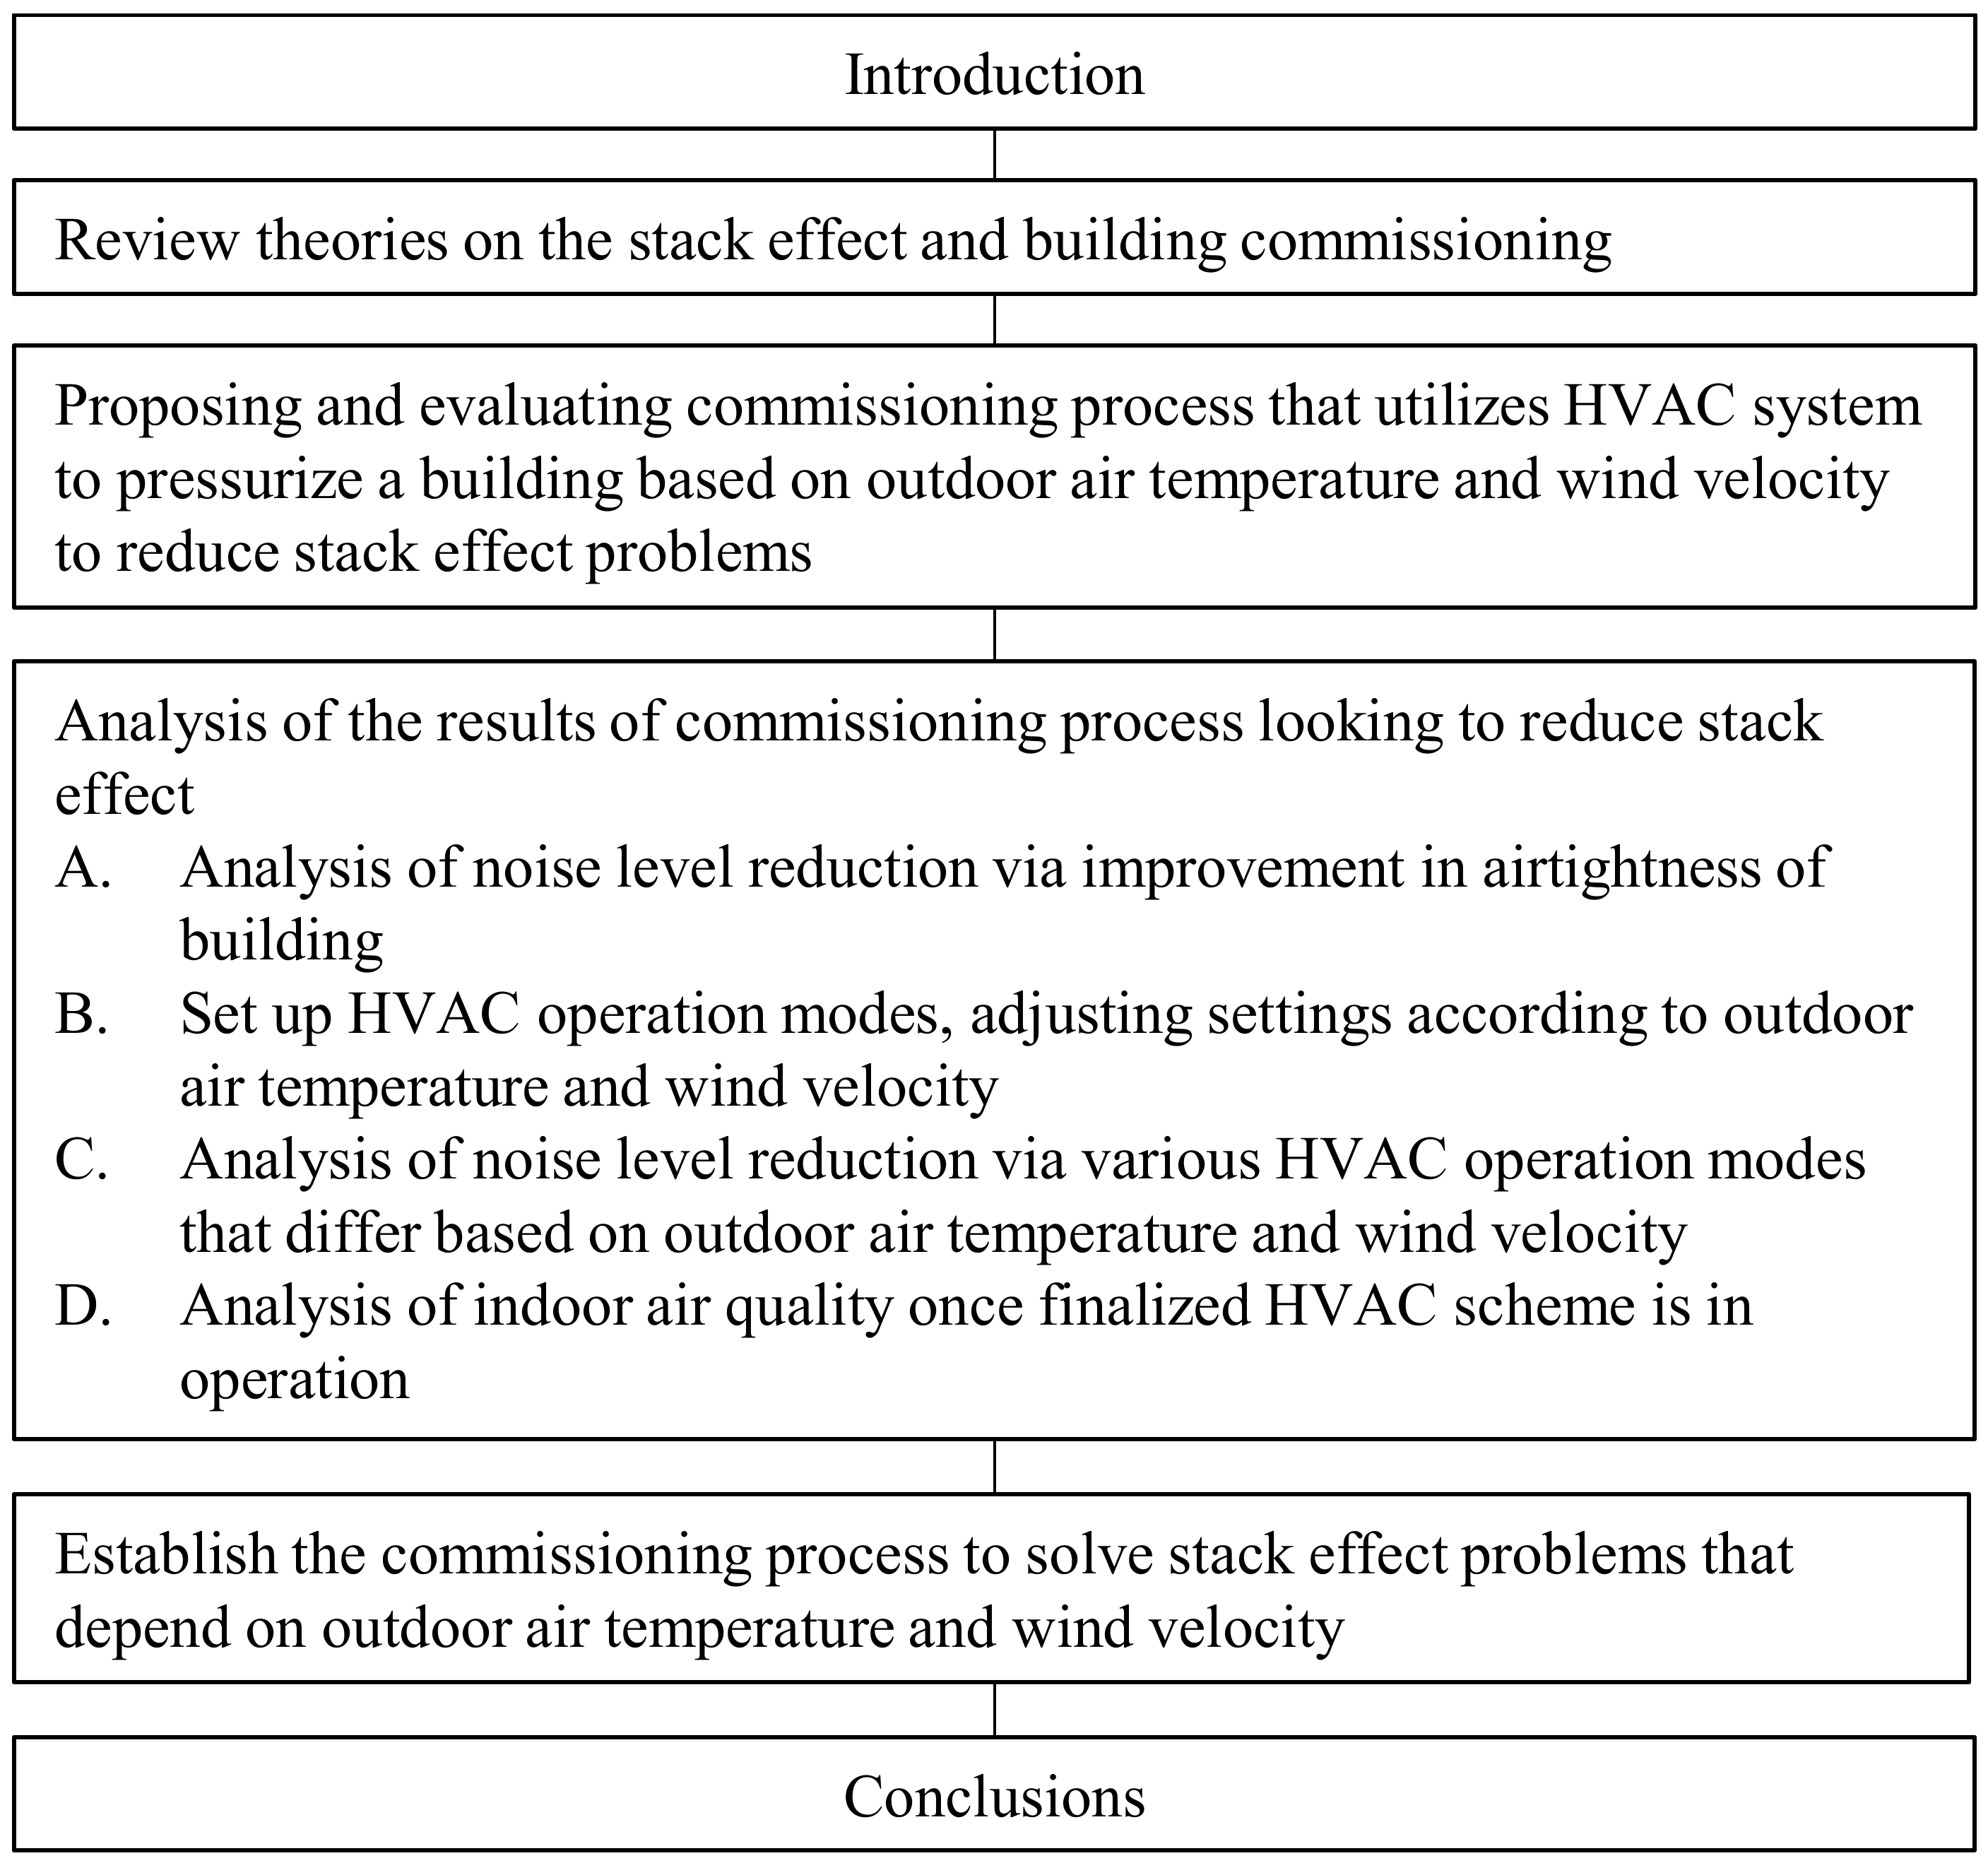
2.3. Building Commossioning Process Focused on Stack Effect Problems

Upon the completion of a building with a HVAC system installed, commissioning occurs in order to deduce the appropriate scheme for operating the HVAC system. Similarly, retro-commissioning (RC) is commissioning on an existing building that has been in use. Through retro-commissioning, any issues in building design or architecture can be resolved [22], a pleasant and productive working space for building occupants can be guaranteed, education for proper building management can be provided, and the building’s assets can be raised [23]. In this study, we introduce and utilize a preliminary commissioning process focused on stack effect problems, which was derived from the RC technique and applied to the building of interest to resolve complaints of loud noises and to secure pleasant working conditions for the occupants. The commissioning process that we are suggesting here is based on David E. Claridge et al. [24]’s proposed six-step RC process: (1) Initial survey, (2) install monitoring, (3) survey facility, (4) commissioning major equipment, (5) commissioning entire building, and (6) ongoing monitoring/analysis. Additionally, the specifics of our commissioning process can be referenced from Haasl, T. and T. Sharp’s “The phases and activities of the RC process” [25] and Haasl and Heinemeier’s “RC Process Overview” [26] where a four-step RC process was proposed. This four-step process involves a planning phase, an investigation phase, an implementation phase, and a hand-off phase.
The preliminary commissioning process we are introducing is comprised of six steps. In step 1, a team is created to plan a method for reducing the stack effect in a building. Step 2 involves establishing a method of assessing and measuring the degree of reduction. Then follows identifying, receiving the client’s approval, and implementing airtightness measures to the building (step 3) before doing the same with other commissioning measures while evaluating their effectiveness (step 4). If, upon evaluation, airtightness or commissioning measures do not lead to the desired results, then step 3 or 4 may need to be repeated. Through step 5, all effective methods for reducing the stack effect are documented. In step 6, the commissioning process is ongoing.
In this study, our goal was to develop an effective HVAC operation method as well as streamline the building commissioning process to resolve complaints of unpleasant noises, a consequence of the stack effect, in a fully functional building. Specifically, we wanted to determine the appropriate amount of air required for pressurization at each vertical floor ranges of the high-rise building of interest given various outdoor conditions. By determining methods for operating the HVAC system effectively to different vertical zones of the building and utilizing those methods as commissioning measures in the building commissioning process, we hoped to resolve the stack effect and any resulting issues. Although malfunctioning elevator doors is the usual stack effect problem, the occupants of the building in this study especially complained of the annoying whistling noises in the elevator halls. Thus, we explored different mechanical methods to reduce the noises due to the stack effect in a commercial high-rise building in South Korea, eventually deciding on developing effective HVAC operation schemes. To this end, we applied the building commissioning process outlined above to the high-rise building of interest for two years. Figure 4 shows a flowchart of how our study was conducted.

3. Methods

3.1. Overview of Target Building A

Target building A is a 50-story (246 m) high-rise commercial building located in Seoul, South Korea (2626.8 Heating Degree Days and 881.2 Cooling Degree Days). The facade faces northwest and is greatly influenced by the northwest wind in the winter. The building is made of an all-glass curtain wall. The height of the lobby floor is 13.5 m, and the reference floor is 4.6 m. Figure 5A shows the elevation of the target building, and Figure 5B shows the floor plans of the 1st floor and 47th floor. As shown in Figure 5A, the first and second floors of the building consist of a lobby, and the 3rd to 47th floors consist of offices. Mechanical rooms for the mid-rise and low-rise zones are located on the 18th and 19th floors, and mechanical rooms for the high-rise zones are located on the 48th and 49th floors. Elevator mechanical rooms for the high-rise zones are located on the first and second floors of the rooftops. The 50th floor, or the top floor, is expected to be occupied by restaurants, but not occupied during the commissioning. There are five types of elevators: Elevators from the underground parking lots (Floors B6–3), elevators for the low-rise zones (Floors 1, 4–17), elevators for the mid-rise zones (Floors 1, 20–33), elevators for the high-rise zones (Floors 1, 34–50), and the evacuation elevator (Floors 1–50). The elevator shaft is zoned so that there is no transfer floor between the mid-rise and low-rise zones and the mid-rise and high-rise zones.
There are four HVAC systems that provide air conditioning and ventilation to the target building A, which is divided into three zones. Two HVAC systems located on the 18th and 19th floors of the building serve the low-rise and mid-rise zones, and two HVAC systems located on the 48th and 49th floors serve the high-rise zones of the building. The heating and cooling loads of the perimeter zone in the office are covered by fancoil units on each floor. The interior zone is required to be cooled all year round. In contrast, heating only occurs in the winter, where most of the preheating is done before working hours. Afterwards, cooling is supplied to the interior zone because of the heat generated by the occupants and the untreated radiant heat from the perimeter zone. Cooling occurs as low temperature air is supplied from the HVAC system. Thus, a certain amount of outdoor air is also supplied in the winter, and a method of pressurizing the building is applied.

3.2. Evaluation Method and Criteria of Stack Effect for the Building A

The pressure differences (ΔP) across the elevator door were also obtained as an additional measure because it is generally used to evaluate the stack effect in high-rise buildings [19]. Moreover, these high ΔP typically lead to elevator doors being unable to close properly. In the recently constructed target building A, however, the latest elevator model is installed. Thus, the elevator can close properly even when the ΔP exceeds 25 Pa, which Tamblyn suggests is the limit at which elevator doors are able to operate sufficiently [19]. Instead, the noise levels of the elevator halls increased when ΔP increased beyond Tamblyn’s suggested limit (Figure 6 and Figure 7).
In target building A, complaints of the high noise levels of the elevator halls, especially on the 1st and 47th floors, were of major concern. The unpleasant noises were first heard in the middle of October 2014 (Figure 8), which was when construction was completed. Sound caused by air infiltrating through the main entrance and between the elevator doors on the first floor was constant throughout the day. Furthermore, the noise level on first floor elevator hall was recorded to exceed 60 dB(A), creating a noisy environment. At this point, there was no heating in the building, although ventilation through HVAC systems was in operation. However, once heating was in operation in November 2014, noise levels increased to around 70 dB(A). Consequently, noise levels were brought down to appropriate levels during work hours (i.e., 7 a.m. to 9 p.m.) through HVAC pressurization of high-rise zones starting in November 2014 (Figure 9). Despite this, the loud noises persisted outside of work hours and during the weekend when HVAC systems were turned off. Although air tightness of the building envelope was enhanced in 2015 (Figure 10), unpleasant sounds continued to manifest throughout the day when outdoor air temperatures fell below 10 °C and wind velocity was high between November 2015 and February 2016.
As a result, we took measurements of the ΔP across the elevator door and noise level (NL) of the 1st-floor elevator hall and the 47th-floor elevator hall simultaneously in order to analyze the relationship between the two (Figure 6). Utilizing Minneapolis’s DG-700 Pressure and Flow Gauge, we measured the ΔP of a chosen elevator when it was stationary with its doors closed for a duration of 5 min before calculating and recording the average value. The chosen elevator served floors 1 through 50 and is for emergency evacuation use.
Elevator hall NL measurements were conducted using a sound level meter from RION, NL-52, in the center of the elevator hall and at a height of 1.5 m from the bottom while the elevator door was closed, in accordance with ISO 1996-1 [27]. We ensured that all measurements were made when there was very little or no background noise that occurred due to, for instance, people moving in the space, by taking measurements after work hours while the HVAC system was in operation. NL was measured over a period of 10 days for 5 min each day, and we recorded the average value.
According to Beranek [28], the recommended A-Weight Sound-Level Criteria in a public space with an HVAC system in operation, such as the 1st-floor elevator hall, is 48–57 dB(A) whereas in open spaces, such as the 47th-floor elevator hall of target building A, is 44–48 dB(A). As shown in Figure 6, the maximum elevator hall NL for the 1st floor was 60 dB(A) and for the 47th floor 51 dB(A), both exceeding the criteria noted prior. Because the predominant issue in the building of interest was the constant unpleasant noises resulting from the stack effect, we put more emphasis on measuring NL. Thus, for the purposes of our study, we utilized noise level (NL) to evaluate the severity of stack effect in the building of interest. After measuring both ΔP and NL of the 1st and 47th elevator halls, we found that as ΔP across the elevator doors increased, the NLs of the elevator hall also increased (Figure 6).
All measurements in our study were conducted during the winter seasons from October 2014 to March 2015 and from October 2015 to March 2016. We measured the NL of the 1st-floor elevator hall (i.e., low-rise zone) and 47th-floor elevator hall (i.e., high-rise zone) a total of four different times per day as noted above. When the HVAC system was in operation, measurements were typically taken at 7 a.m. or 8 a.m. on weekdays and whenever noise increased at a perceptible rate due to increased outdoor wind velocity. When the HVAC system was not in operation, measurements were taken at midnight, 3 a.m., and 6 a.m. during the weekdays and holidays.
Furthermore, as presented in Figures 7–12, outdoor air temperature (TOA) and outdoor wind velocity (VW) affected the HVAC operation mode and stack effect, which then influenced the noise level. To further explore this, we also obtained TOA and VW measurements from published meteorological data pertaining to the region in which the target building A was located.

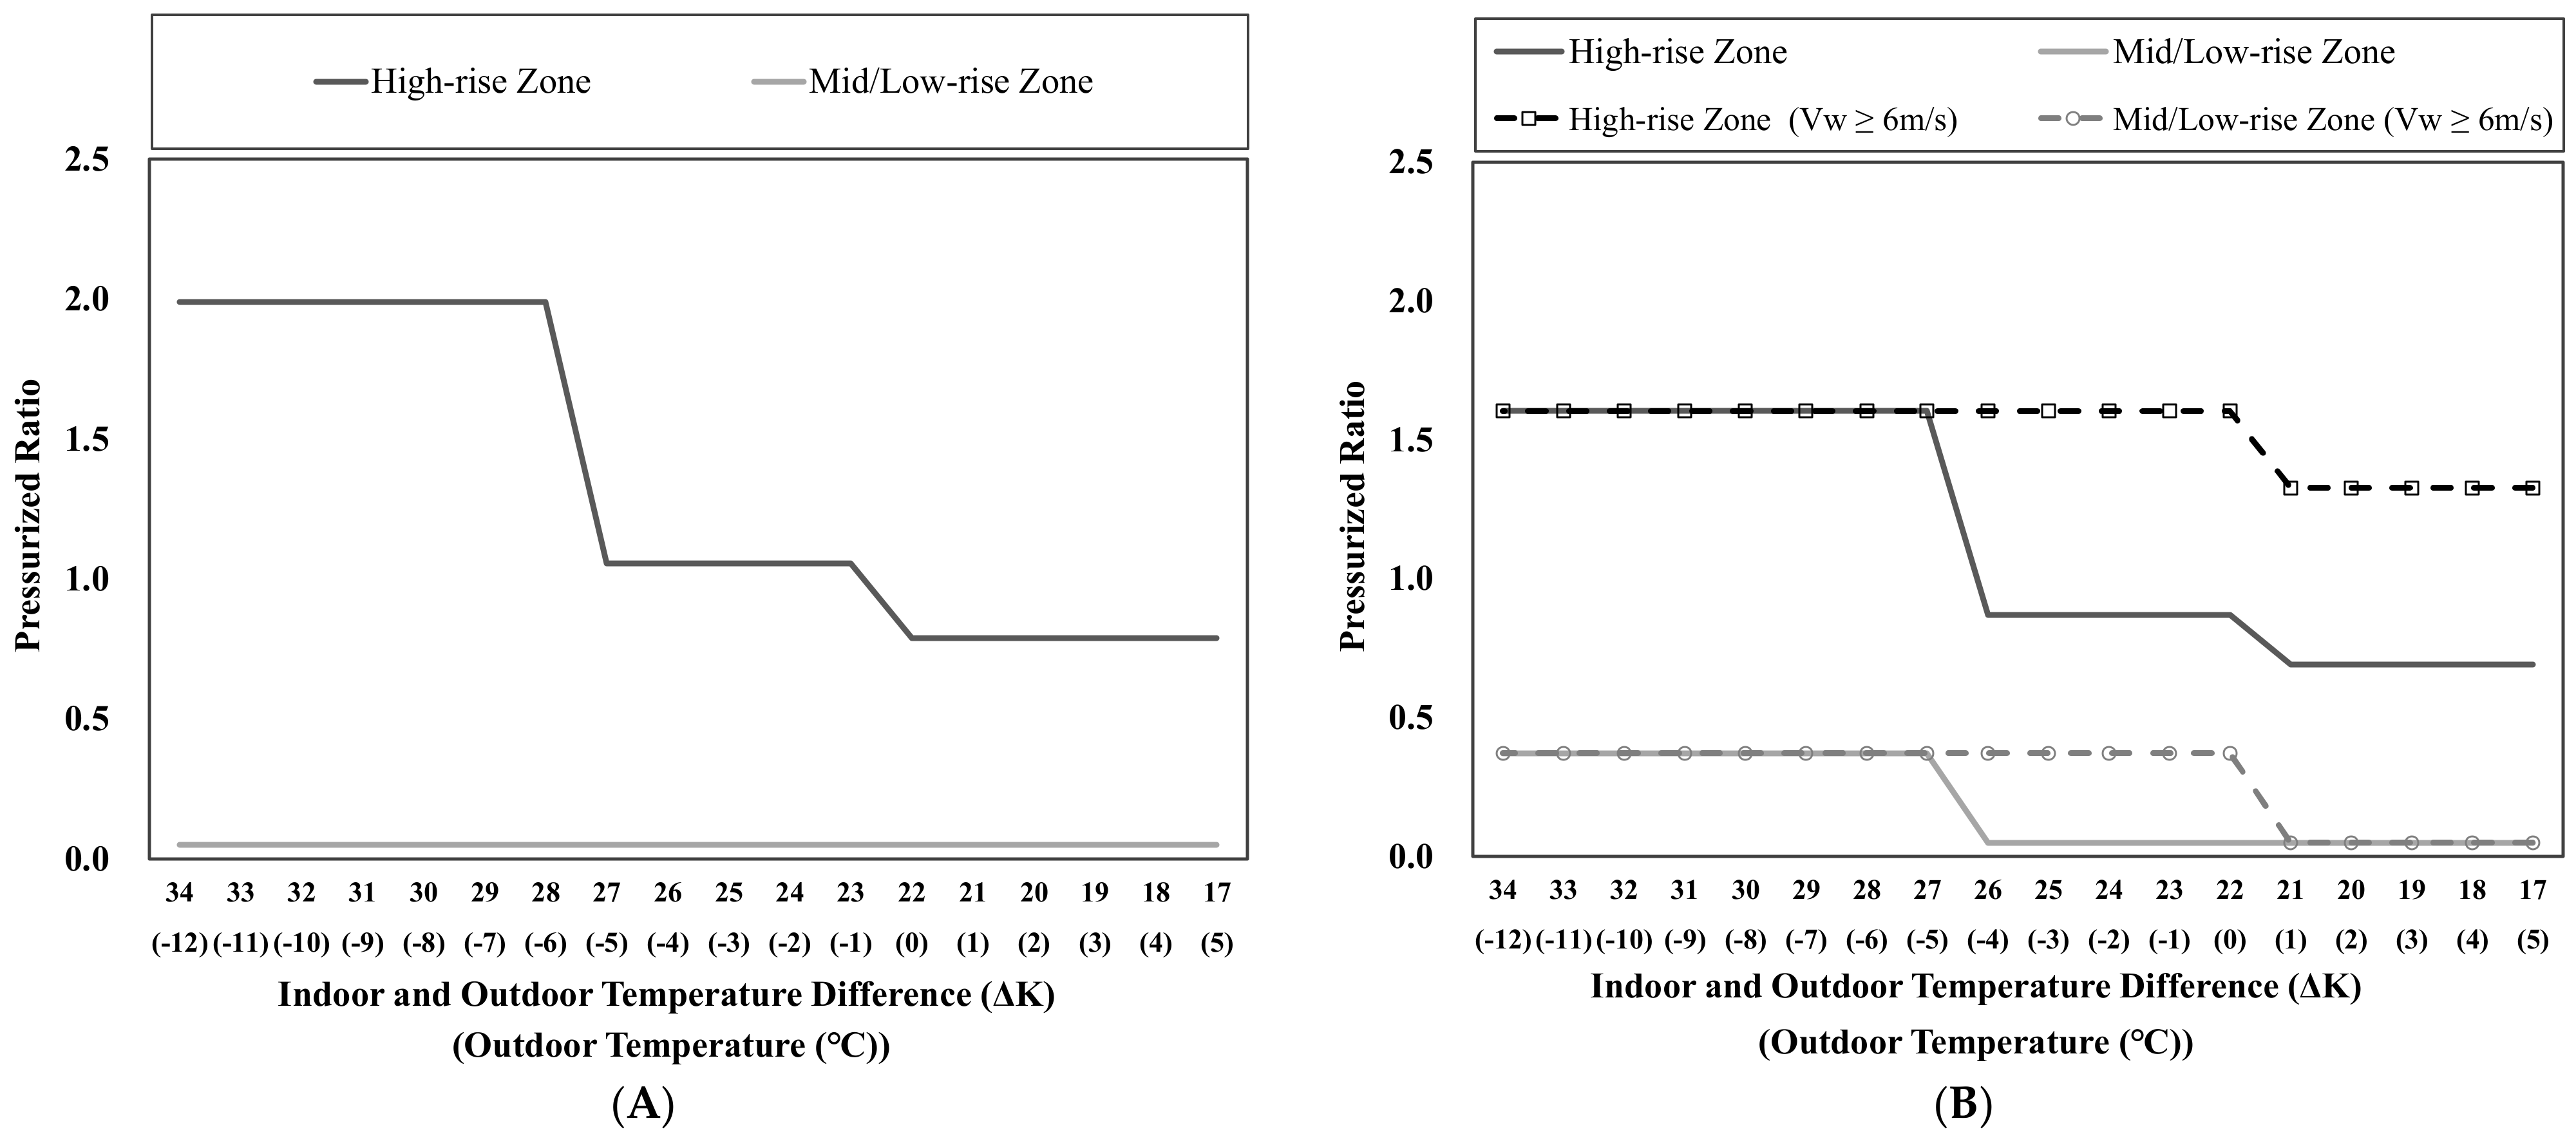
3.3. Operation Modes Utilized To Reduce Stack Effect

Commissioning measures to reduce the stack effect that are applied to the building can be largely divided into four modes that have been utilized over the course of two winters. Mode 1 refers to the general operation mode that was utilized when we first examined the building in winter 2014. Then, as a part of mode 2, we utilized the HVAC operation to pressurize the high-rise zones of the building as a means to resolve the stack effect before examining the consequent issues that occurred. In response to these issues, we controlled air volume pressurization according to TOA in mode 3 such that different HVAC system settings are used for when TOA is above 0 °C, between 0 and −5 °C, or below −5 °C. Generally, as TOA decreased, air volume was increased to pressurize the high-rise zones of the building. Additionally, during mode 3, improvement of the building’s airtightness was completed.
In the winter of 2015, HVAC pressurization operation mode 4 was developed and applied based on both TOA and VW. We differentiated wind velocity as above and below 6 m/s. Operation mode 4 was set up such that pressurization increased in the high-rise zones as TOA decreased (from above 0 °C, between 0 and −5 °C, to below −5 °C) when wind velocity was below 6 m/s. When TOA was below −5 °C with wind velocity below 6 m/s, the mid-rise zones of the building was further pressurized. When wind velocity was above 6 m/s, we utilized different HVAC system settings for when TOA was above and below 0 °C. When TOA was below 0 °C and wind velocity was above 6 m/s, mid-rise zones of the building were also pressurized. Table 1 summarizes the operation modes we investigated.

4. Application and Evaluation of Building Commissioning Process

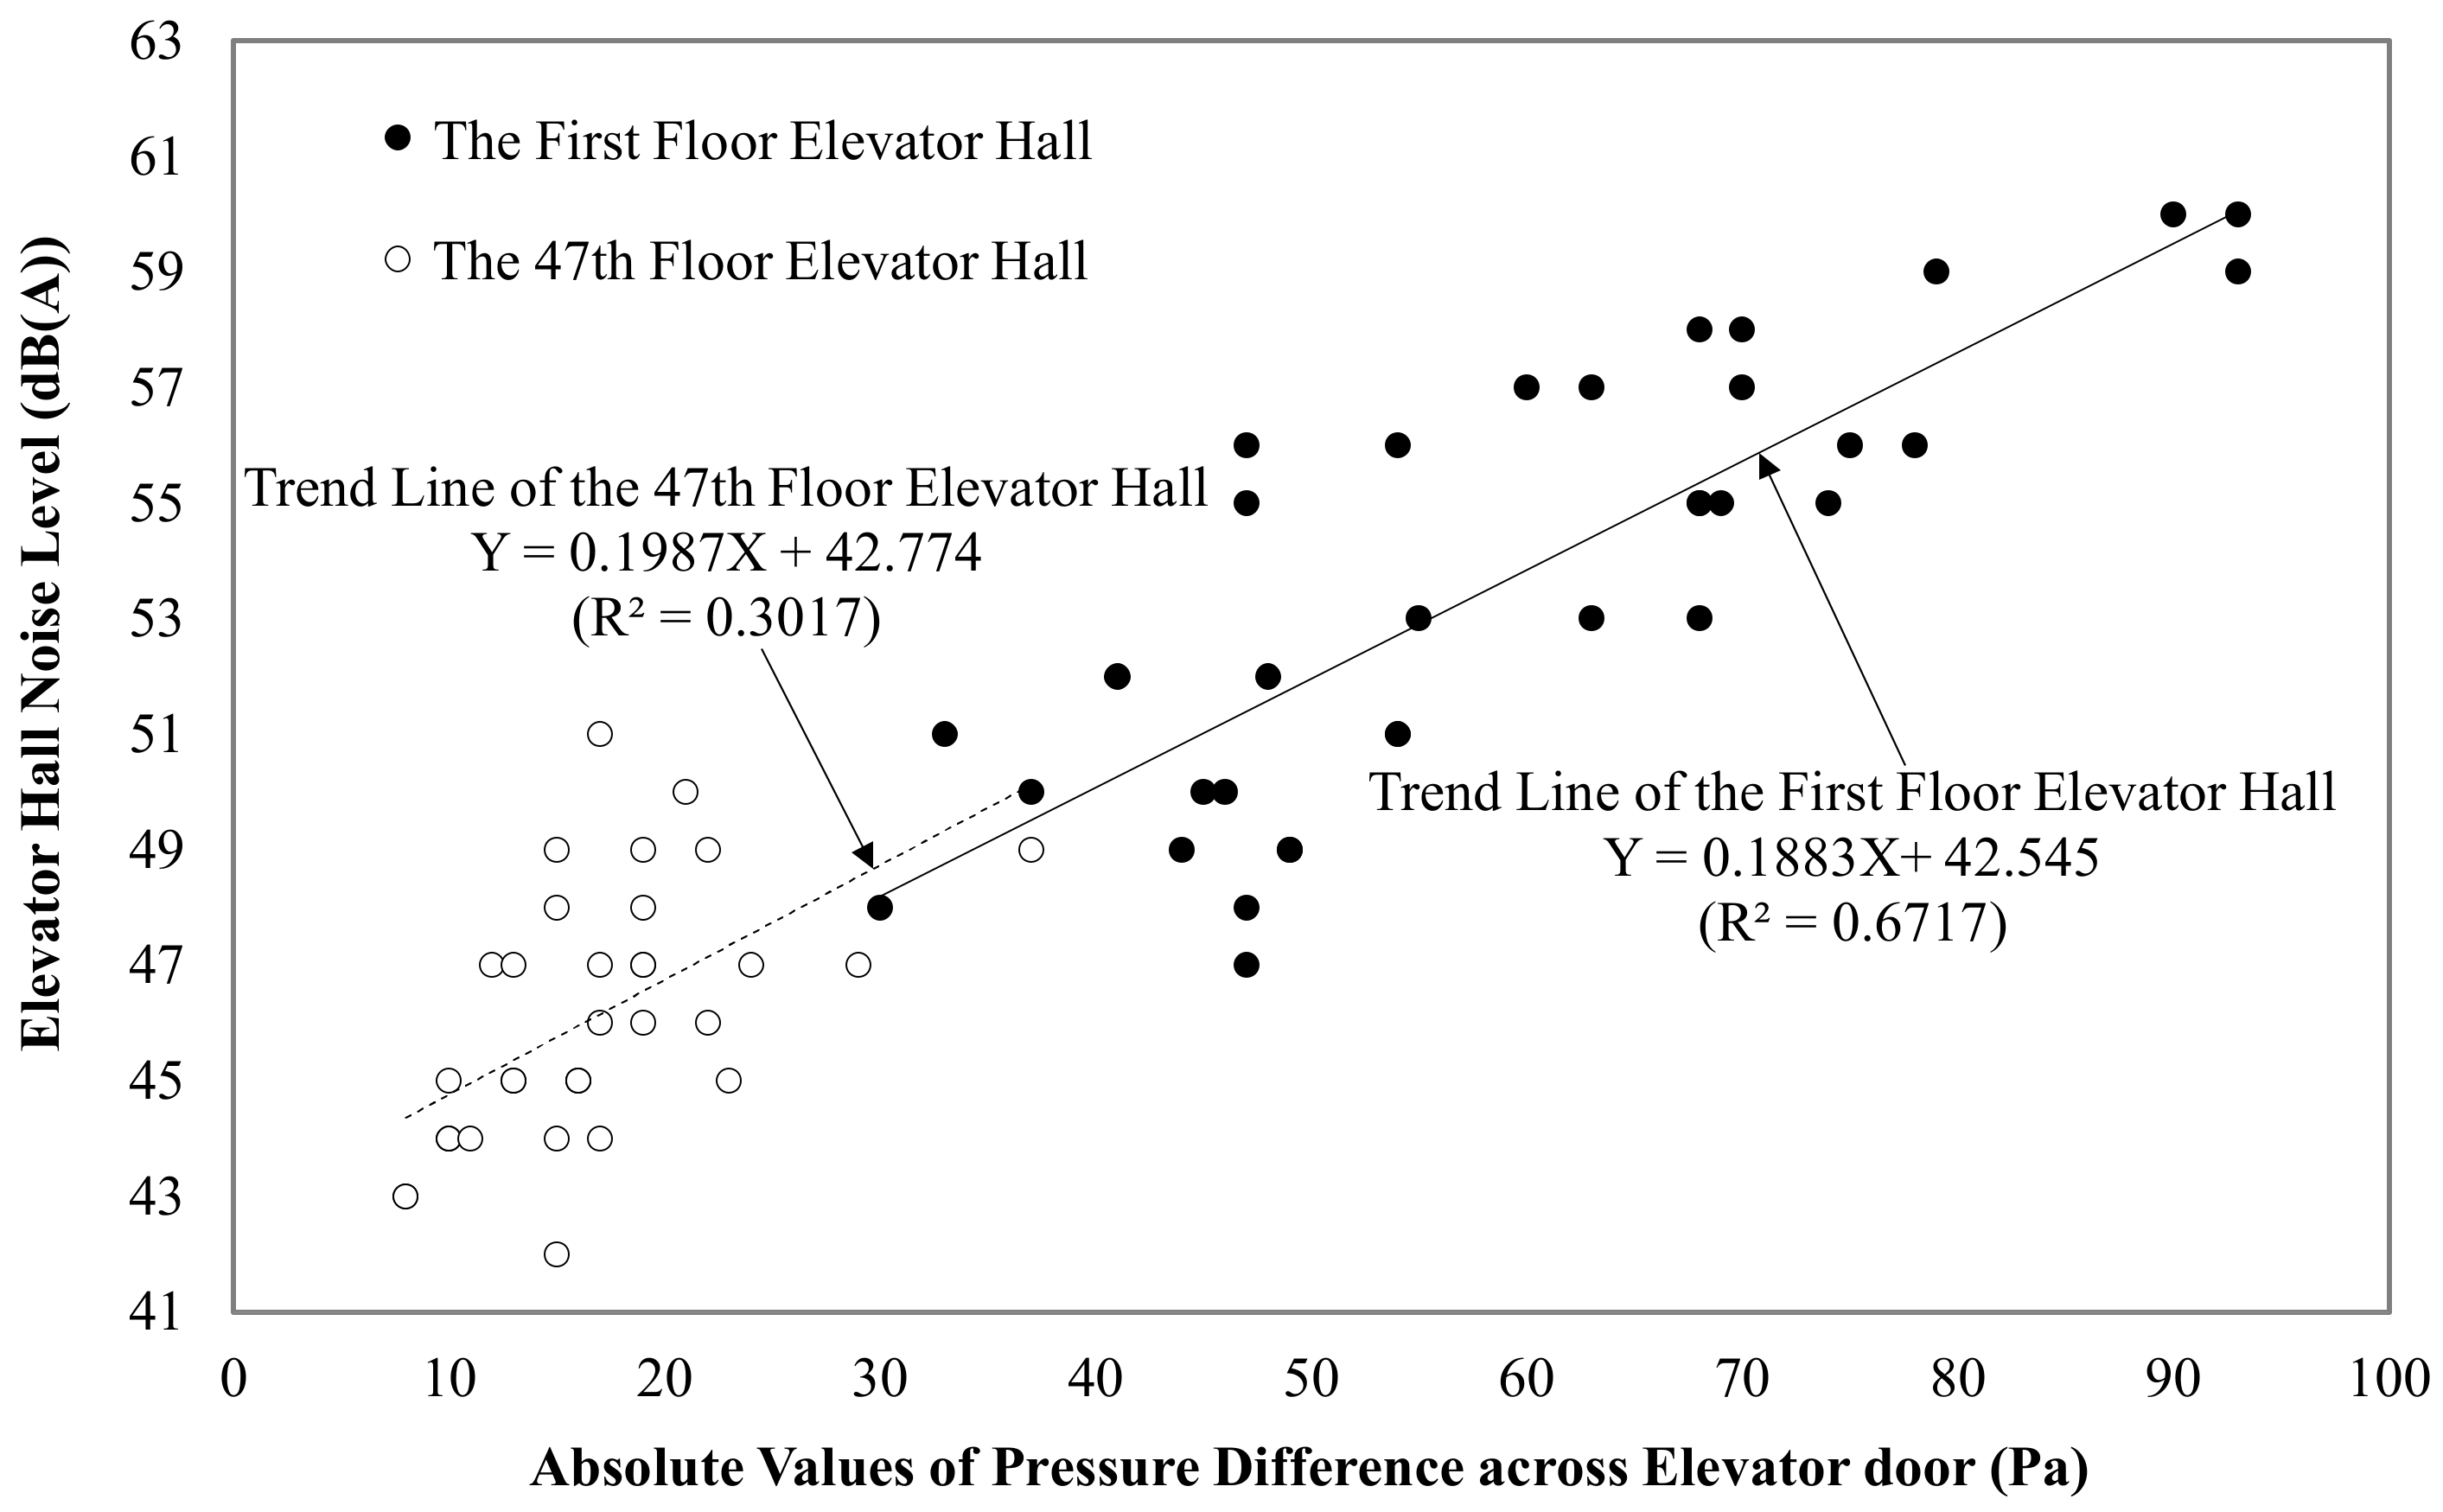
4.1. Relationship between NL and Pressure Differences as Stack Effect Measures

The stack effect in a high-rise building often manifests itself through unpleasant noises from elevator shafts and pressure differences across elevator doors. As stated above, the pressure difference across elevator doors is used more commonly to measure the degree to which stack effect is occurring in a building. Since we put more emphasis on reducing NL on the 1st and 47th elevator halls of target building A, we analyzed the relationship between elevator hall NLs and pressure differences across elevator doors on these floors (Figure 6). Evaluation was done in winter 2015 outside of work hours to ensure that noises due to employees moving in the building were not included in our measurements. At the time of the measurement, the outdoor air temperature was −4.8–3.5 °C while the interior of the building was at a temperature of 21.3–22.6 °C. The wind velocity was 1.9–7.8 m/s. Figure 6 shows that absolute values of pressure difference across elevator doors is positively related to elevator hall NL for both the 1st and 47th floors. When the pressure difference across the elevator doors on the 47th floor varied from 8 to 37 Pa, giving an average of 17 Pa, the NL of the 47th-floor elevator hall increased to values between 42 and 51 dB(A) and an average of 46 dB(A). For the first floor, the NL increased to 47–60 dB(A) with an average of 54 dB(A) when the absolute values of pressure difference across the elevator doors varied between 30 and 93 Pa, giving an average of 59 Pa.

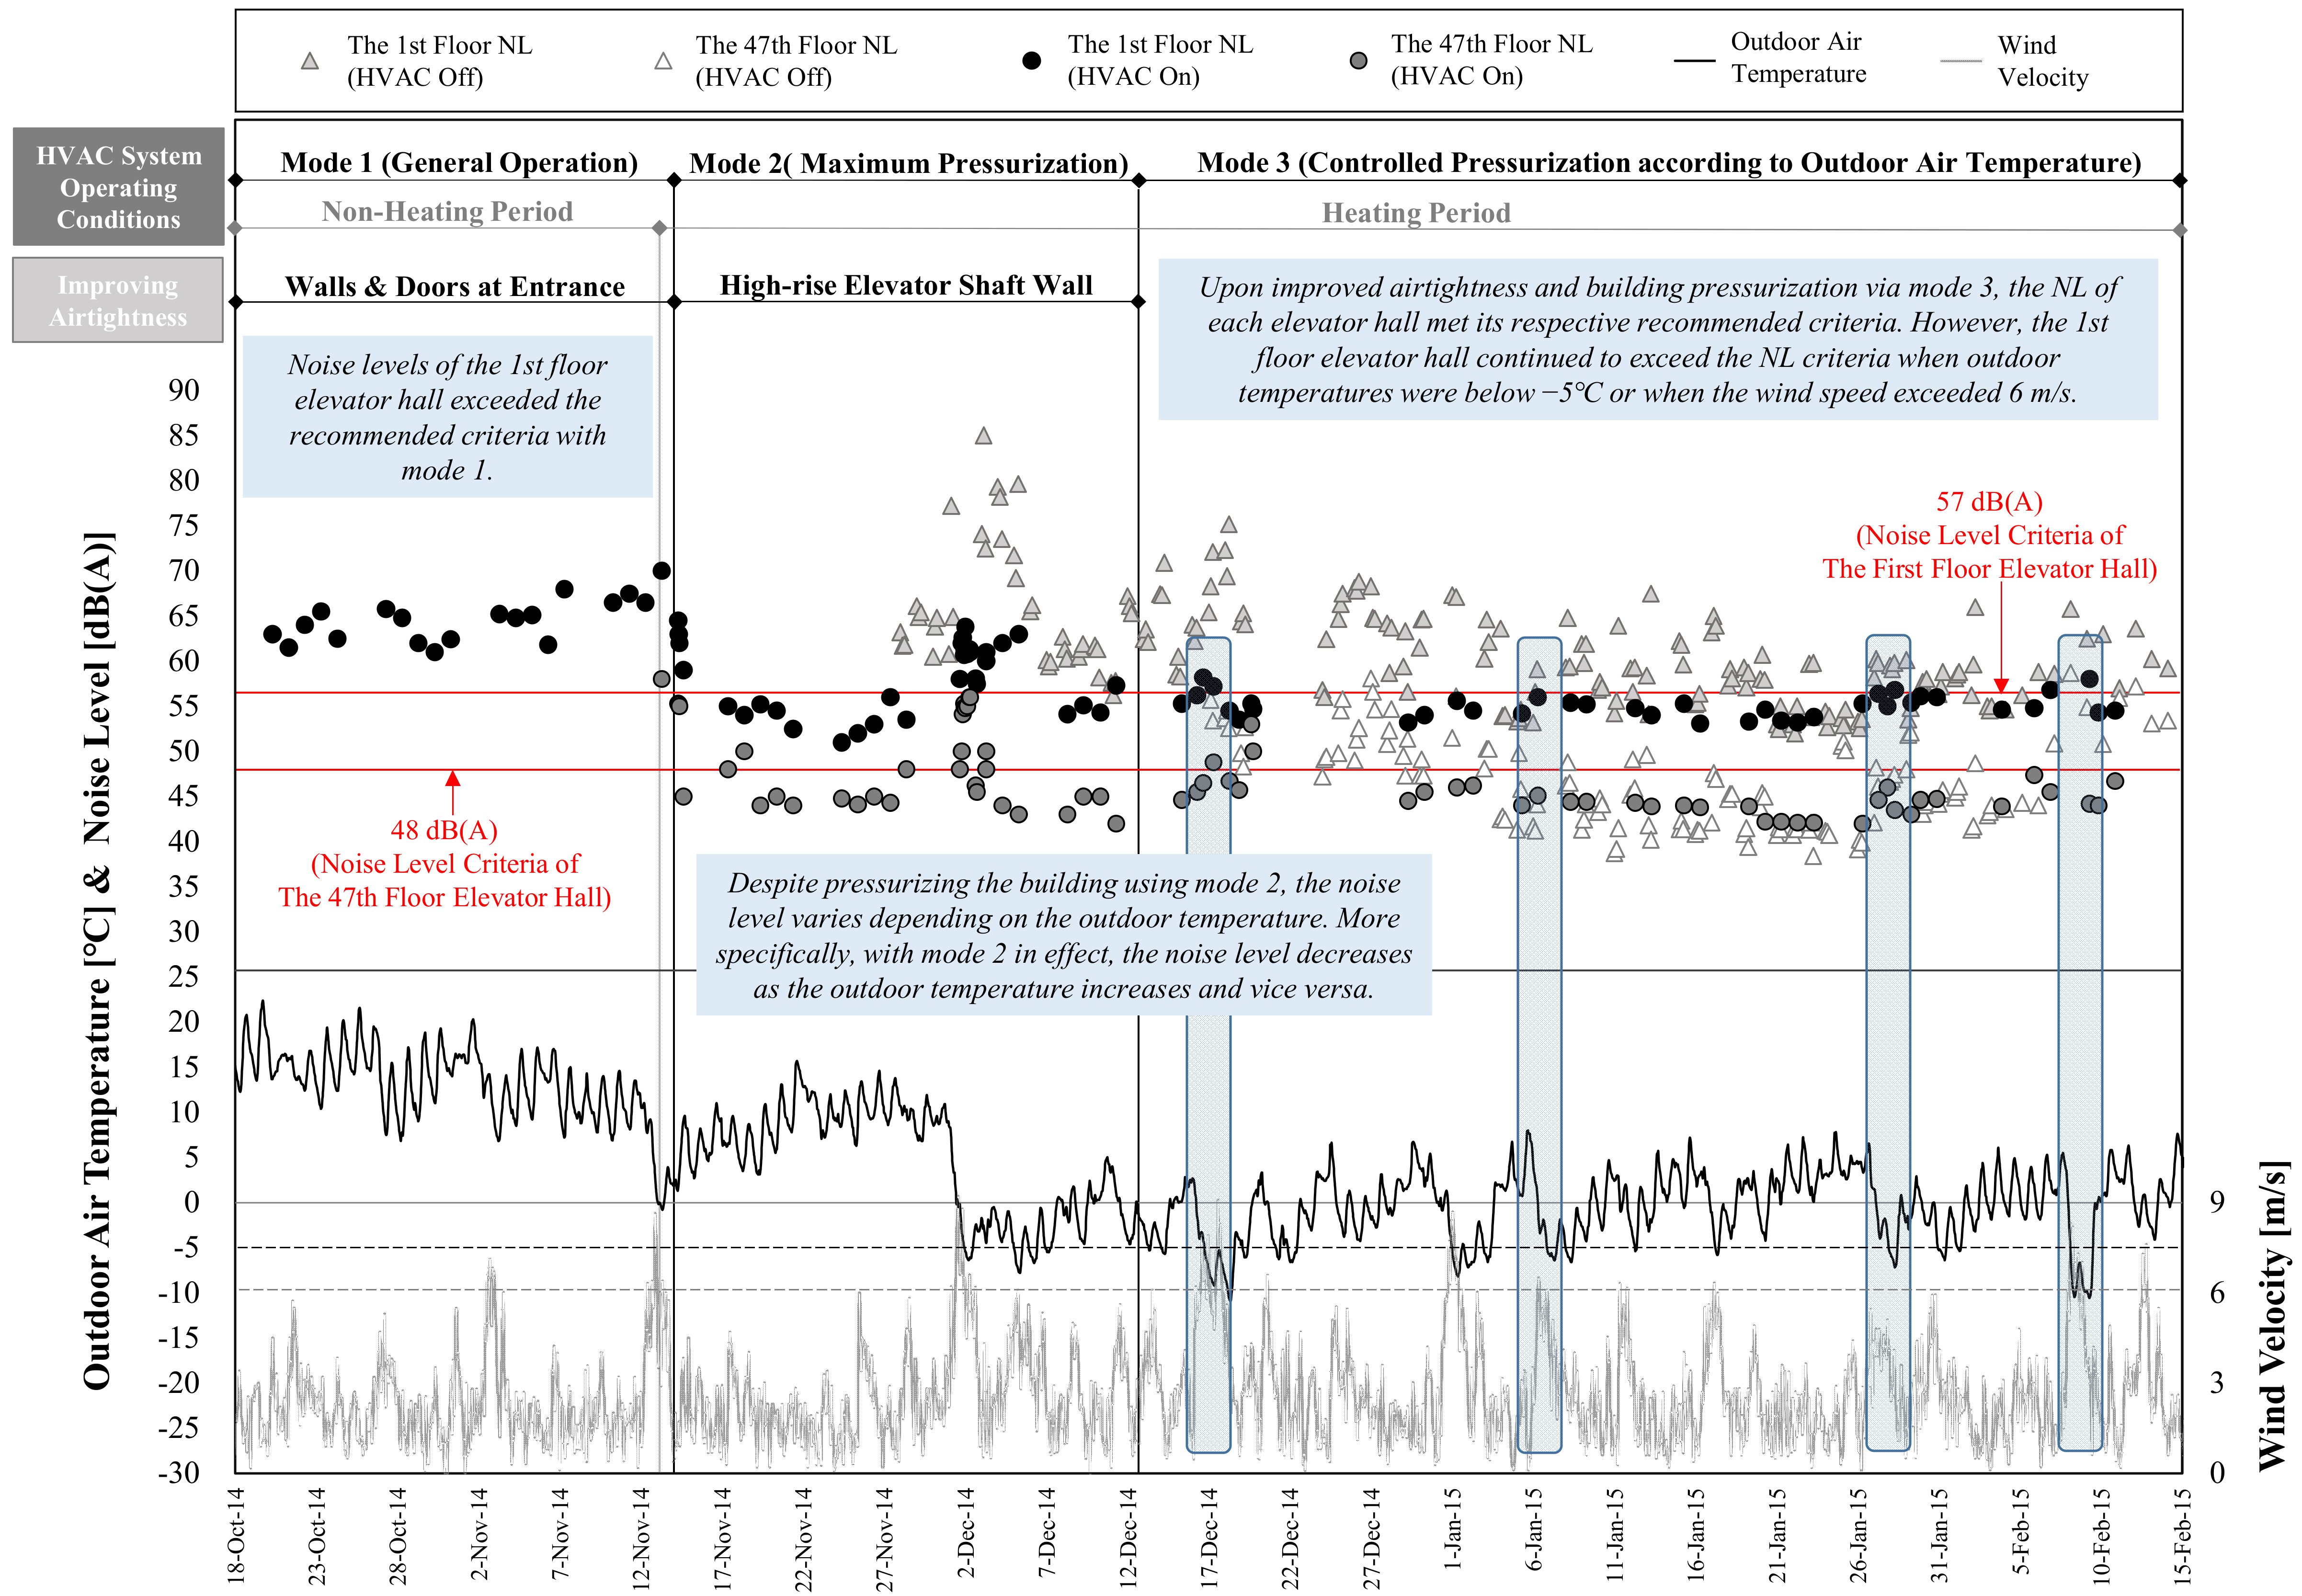
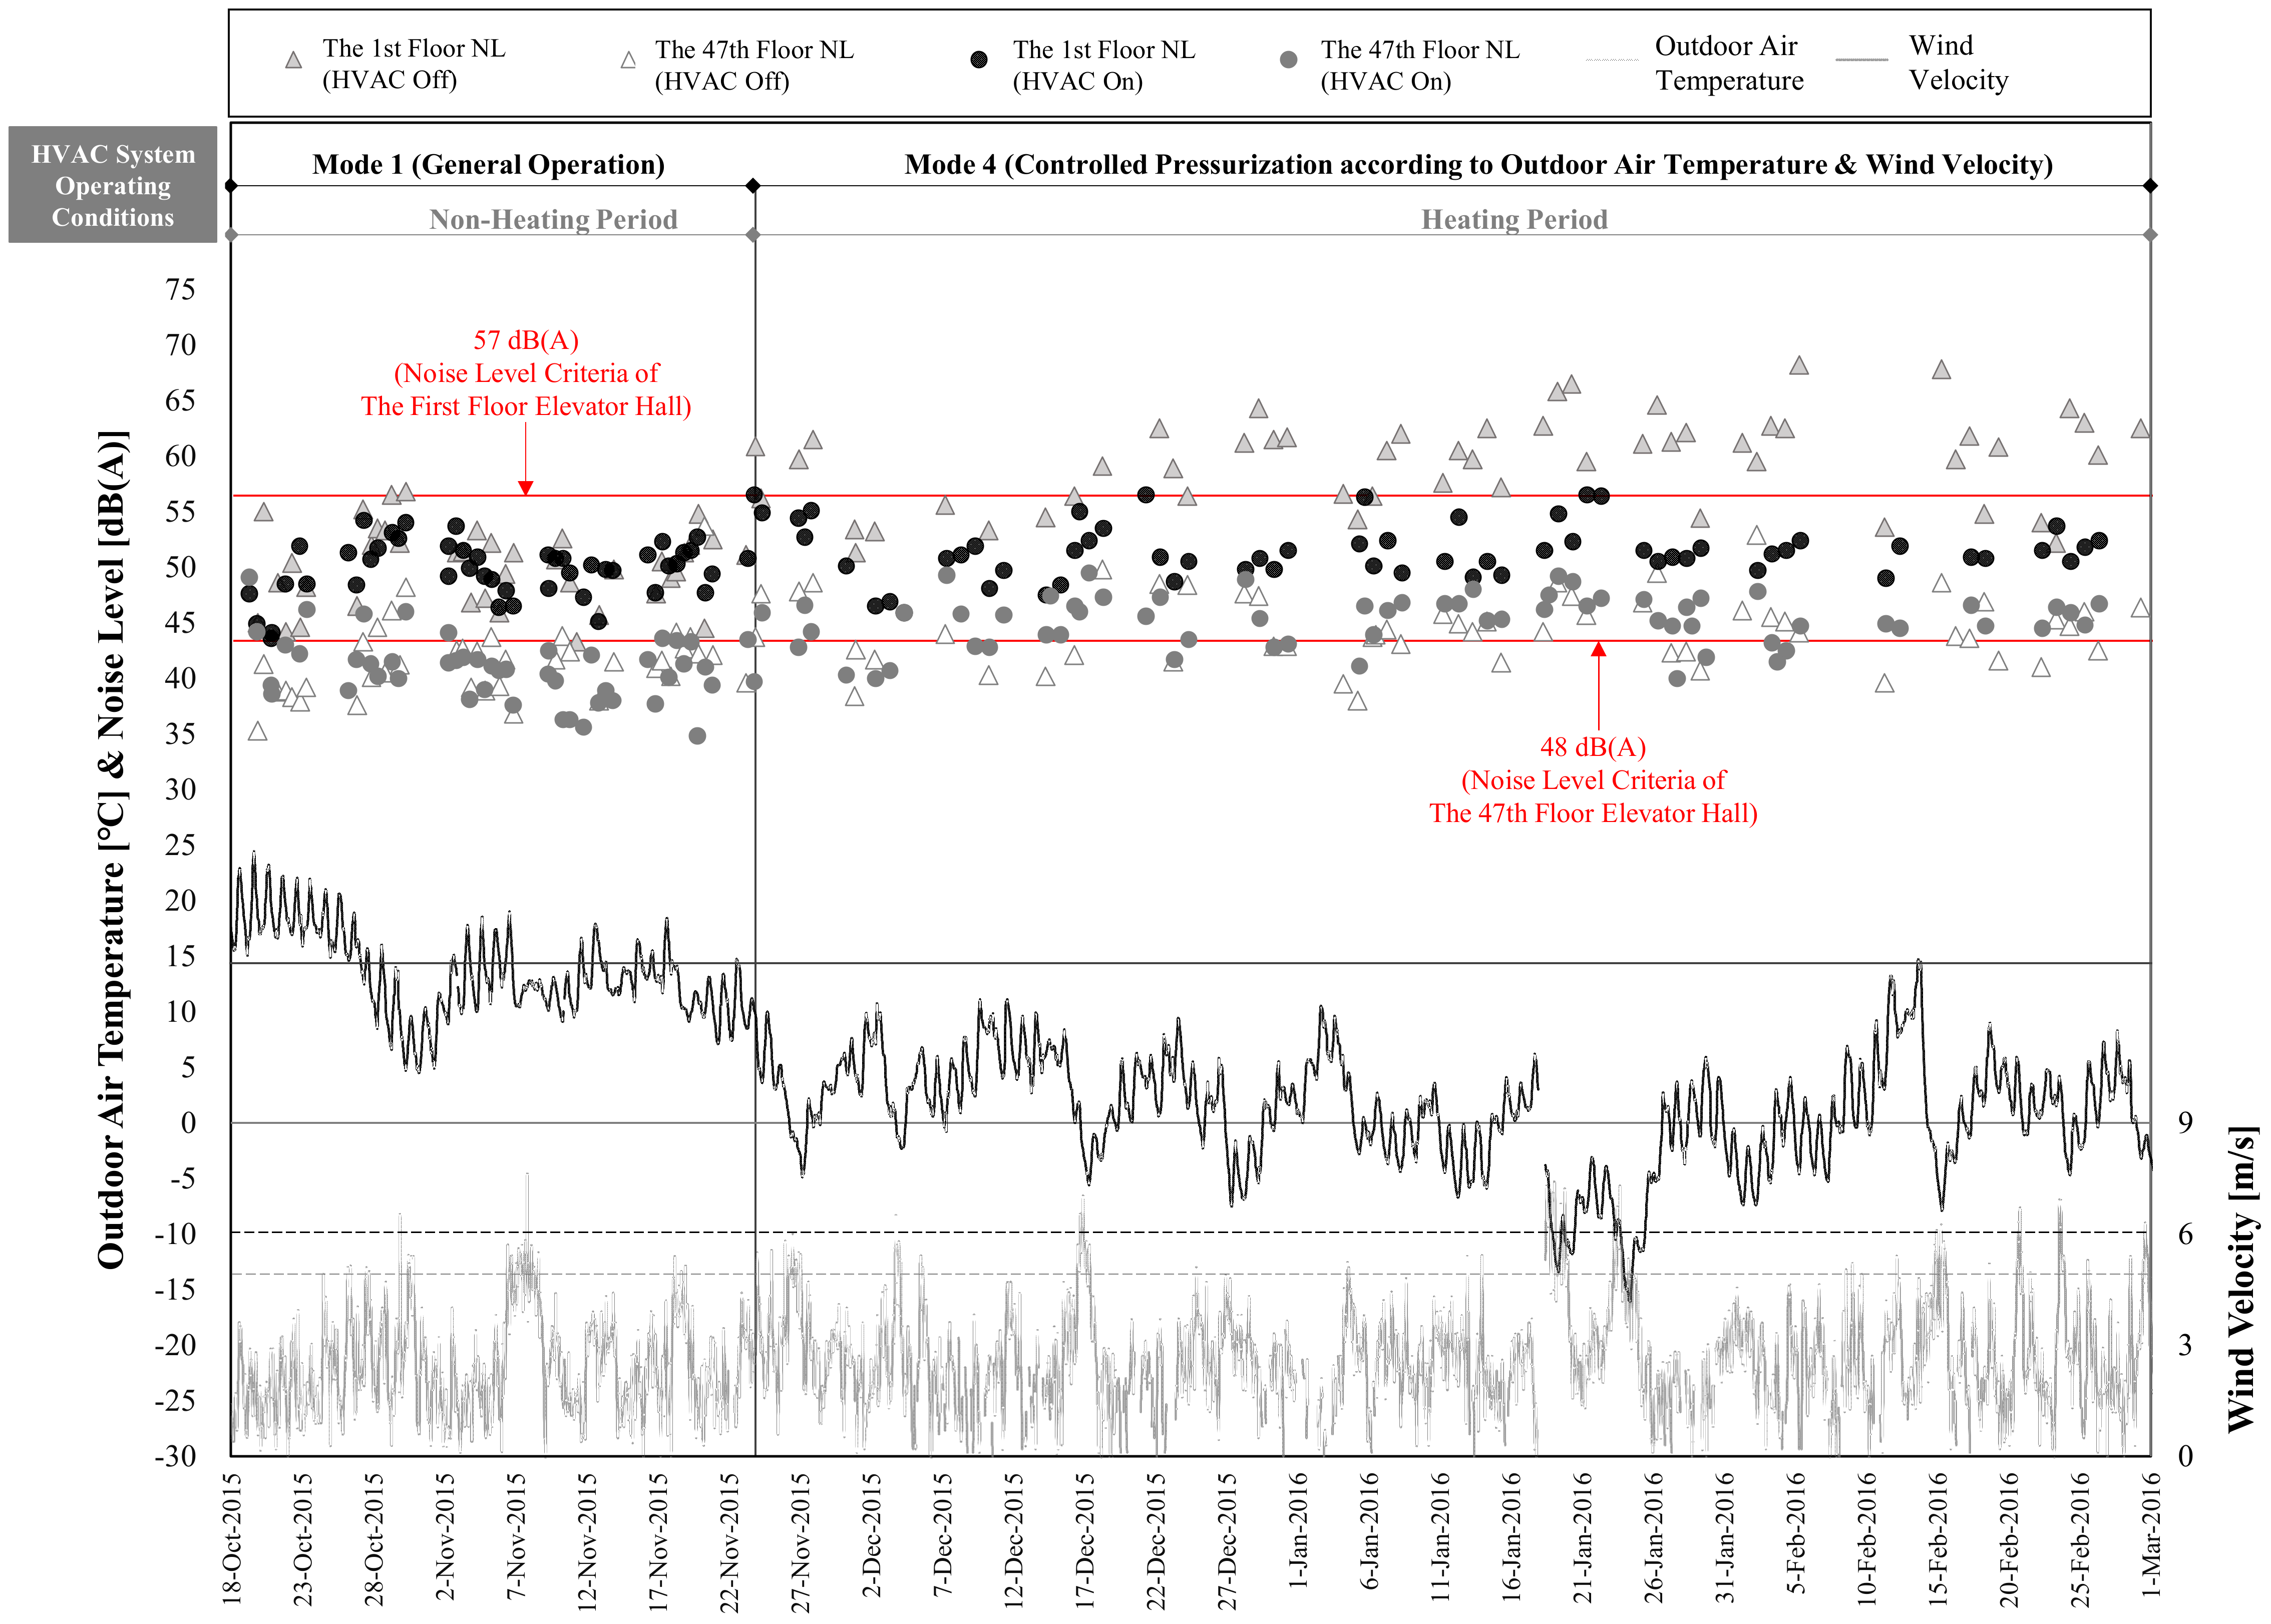
4.2. The Noise Distribution in Elevator Halls Due to Varying Outdoor Air Temperature and Wind Velocity

To understand the extent in which noise caused by the stack effect is a problem in target building A, we analyzed how noise levels change as TOA and VW vary. We categorized the main wind directions of Korea’s winter season into NW, NNW, and N. Through this analysis, we found that when the TOA is less than 4 °C, the first-floor elevator hall’s NL began to exceed the recommended criteria of 57 dB(A), reaching a NL of 75 dB(A) once TOA became −11 °C with the HVAC system turned off (Figure 7a). In other words, problems of noise distribution became much more severe in target building A as TOA dropped. In terms of VW, NLs generally began to increase as VW increased. Specifically, once VW exceeded 4 m/s, NLs on the 1st- and 47th-floor elevator halls started to exceed their recommended criteria.

4.3. Initial Application and Evaluation of Building Commissioning for Reducing Stack Effect (Winter 2014)

During winter 2014, operation modes 1 through 3 were utilized in the target building A (Table 2). During this time, we measured the inverter settings and damper openings of the supply fans (SF), return fans (RF), and exhaust fans in the HVAC system as well as VPAi and RPAi achieved using the improved operation method. In the high-rise zone, the damper opening rates of OAD and EAD is 30%, whereas that of CAD is 70%. In the mid-rise and low-rise zones, the damper opening rates for OAD and EAD is 20% and for CAD is 80%.
VPAi was calculated using Equations (1) and (3). Then, VSA and VRA were measured by the building automation system during HVAC operation on the weekdays. VEA_T, which is the toilet exhaust air volume of each zone, was applied based on the designed value. The VEA_T in the high-rise zone (Zone H) was 21,600 m3/h, and the VEA_T in the mid-rise and low-rise zones (Zone M/L) were both 55,800 m3/h. In addition, the pressurization rate RPAi was calculated as shown in Equation (4), where the designed volume for the air conditioning of the reference floor of the high-rise building was 5106 m3. This volume is based on a designed value and thus considered constant across all floors and zones. The HVAC system responsible for pressurizing the high-rise zone operates based on the TOA values measured by the temperature sensor installed at the OAD of the HVAC system and the VW values measured by a wind velocity sensor installed on building’s rooftop.
R P A i = V P A i V o l u m e   f o r   a i r   c o n d i t i o n i n g     o f   a   f l o o r

4.3.1. Operation Mode 1

The HVAC system was operated in normal mode without additional pressurization from October to mid-November 2014, and baseline measures were obtained during this time. The inverters of the air supply and return air fans of the high-rise zone were both kept at 35 Hz, and VPAi and RP of the high-rise zone were calculated to be 1044 m3/h and 0.20, respectively (Table 2). However, as the outdoor temperature gradually decreased, the NL of the first-floor elevator hall for the high-rise floors began to rise above the recommended criteria of 57 dB(A) (Figure 8).

4.3.2. Operation Mode 2

In mid-November 2014, the outdoor air temperature dropped below 0 °C and heating air was supplied to the interior spaces. As a consequence, the NL on the 1st and 47th floors became much higher than the recommended criteria of 57 and 48 dB, respectively (Figure 7). To resolve this problem, the operation method was changed to the maximum pressure mode to achieve maximum pressurize inside the building in the high-rise zone (i.e., mode 2). The air supply fan inverter of the high-rise zone was increased from 35 Hz to 45 Hz, and the inverter of the return air fan was reduced from 35 Hz to 25 Hz. At this time, the VPAi and RP of the high-rise layer zone were calculated to be 10,155 m3/h and 1.98, respectively (Table 2).

4.3.3. Operation Mode 3

Improvement of airtightness of the target building A was completed by mid-December 2014 at which point mode 3 was operated. This improvement was first done by determining the leakage area using an infrared camera and anemometer. Then, a method of improving the airtightness of the leakage area was derived. Approval of the method was obtained through consultation with the contractor, and the improvement results were applied to the building. The airtightness improvement work performed in building A involved increasing the airtightness of the exterior doors located in the basement and first floor lobby. In underground parking lots, any unintentional gaps of the inner wall of the elevator shaft for the high-rise floors, the horizontal pipes, and electrical wiring penetrations in the walls surrounding the elevator halls, and the penetrations through which each floor pipe passes in the shaft, were also eliminated. Once the building’s airtightness was improved, the noise level was slightly reduced, and the pressurized operation of the high-rise zone was applied in three stages according to the outdoor temperature (i.e., mode 3). In mode 3-A, The HVAC system of the high-rise zone operated the inverter of the air supply fan at 40 Hz, and the inverter of the return air fan was operated at 30 Hz when the outdoor air temperature was higher than 0 °C. At this point, VPAi and RP were calculated to be 4033 m3/h-floor and 0.79, respectively. When the outdoor air temperature was between 0 and −5 °C in mode 3-B, the inverter of the air supply fan was operated at 40 Hz, and the inverter of the return air fan was operated at 25 Hz, and VPAi was calculated to be 5385 m3/h-floor, and the RP was 1.05. When the outdoor air temperature was lower than −5 °C in mode 3-C, the inverter of the air supply fan was operated at 45 Hz, and the inverter of the return air fan was operated at 25 Hz. At this time, VPAi was calculated to be 10,155 m3/h-floor, and RP was 1.98 (Table 2). Furthermore, most of the 1st and 47th floor NLs met the recommended criteria once the HVAC pressurization was in operation according to outdoor temperature of the building in which airtightness was increased (Figure 8).
Furthermore, we also observed that there was a need for increased amount of pressurization in the high-rise zones as outdoor air temperatures decreased (Figure 9A). However, because NL increased as outdoor temperature decreased and wind velocity increased as seen in Figure 8, we believed that increased pressurization was needed in the mid-/low-rise zones as well, especially under conditions of high VW (Figure 9B). Thus, HVAC operation mode was revised and applied in winter 2015. In addition, excessive vibration occurred in the CAD when the pressure in the duct increased during mode 3 when the outdoor air temperature was 0 °C or lower. This was because of the pressure differences between the supply air fan and the return air fan in the HVAC of the high-rise zone. Thus, the OAD, EAD, and CAD were adjusted as described in Section 4.3 to resolve the vibration in the CAD.

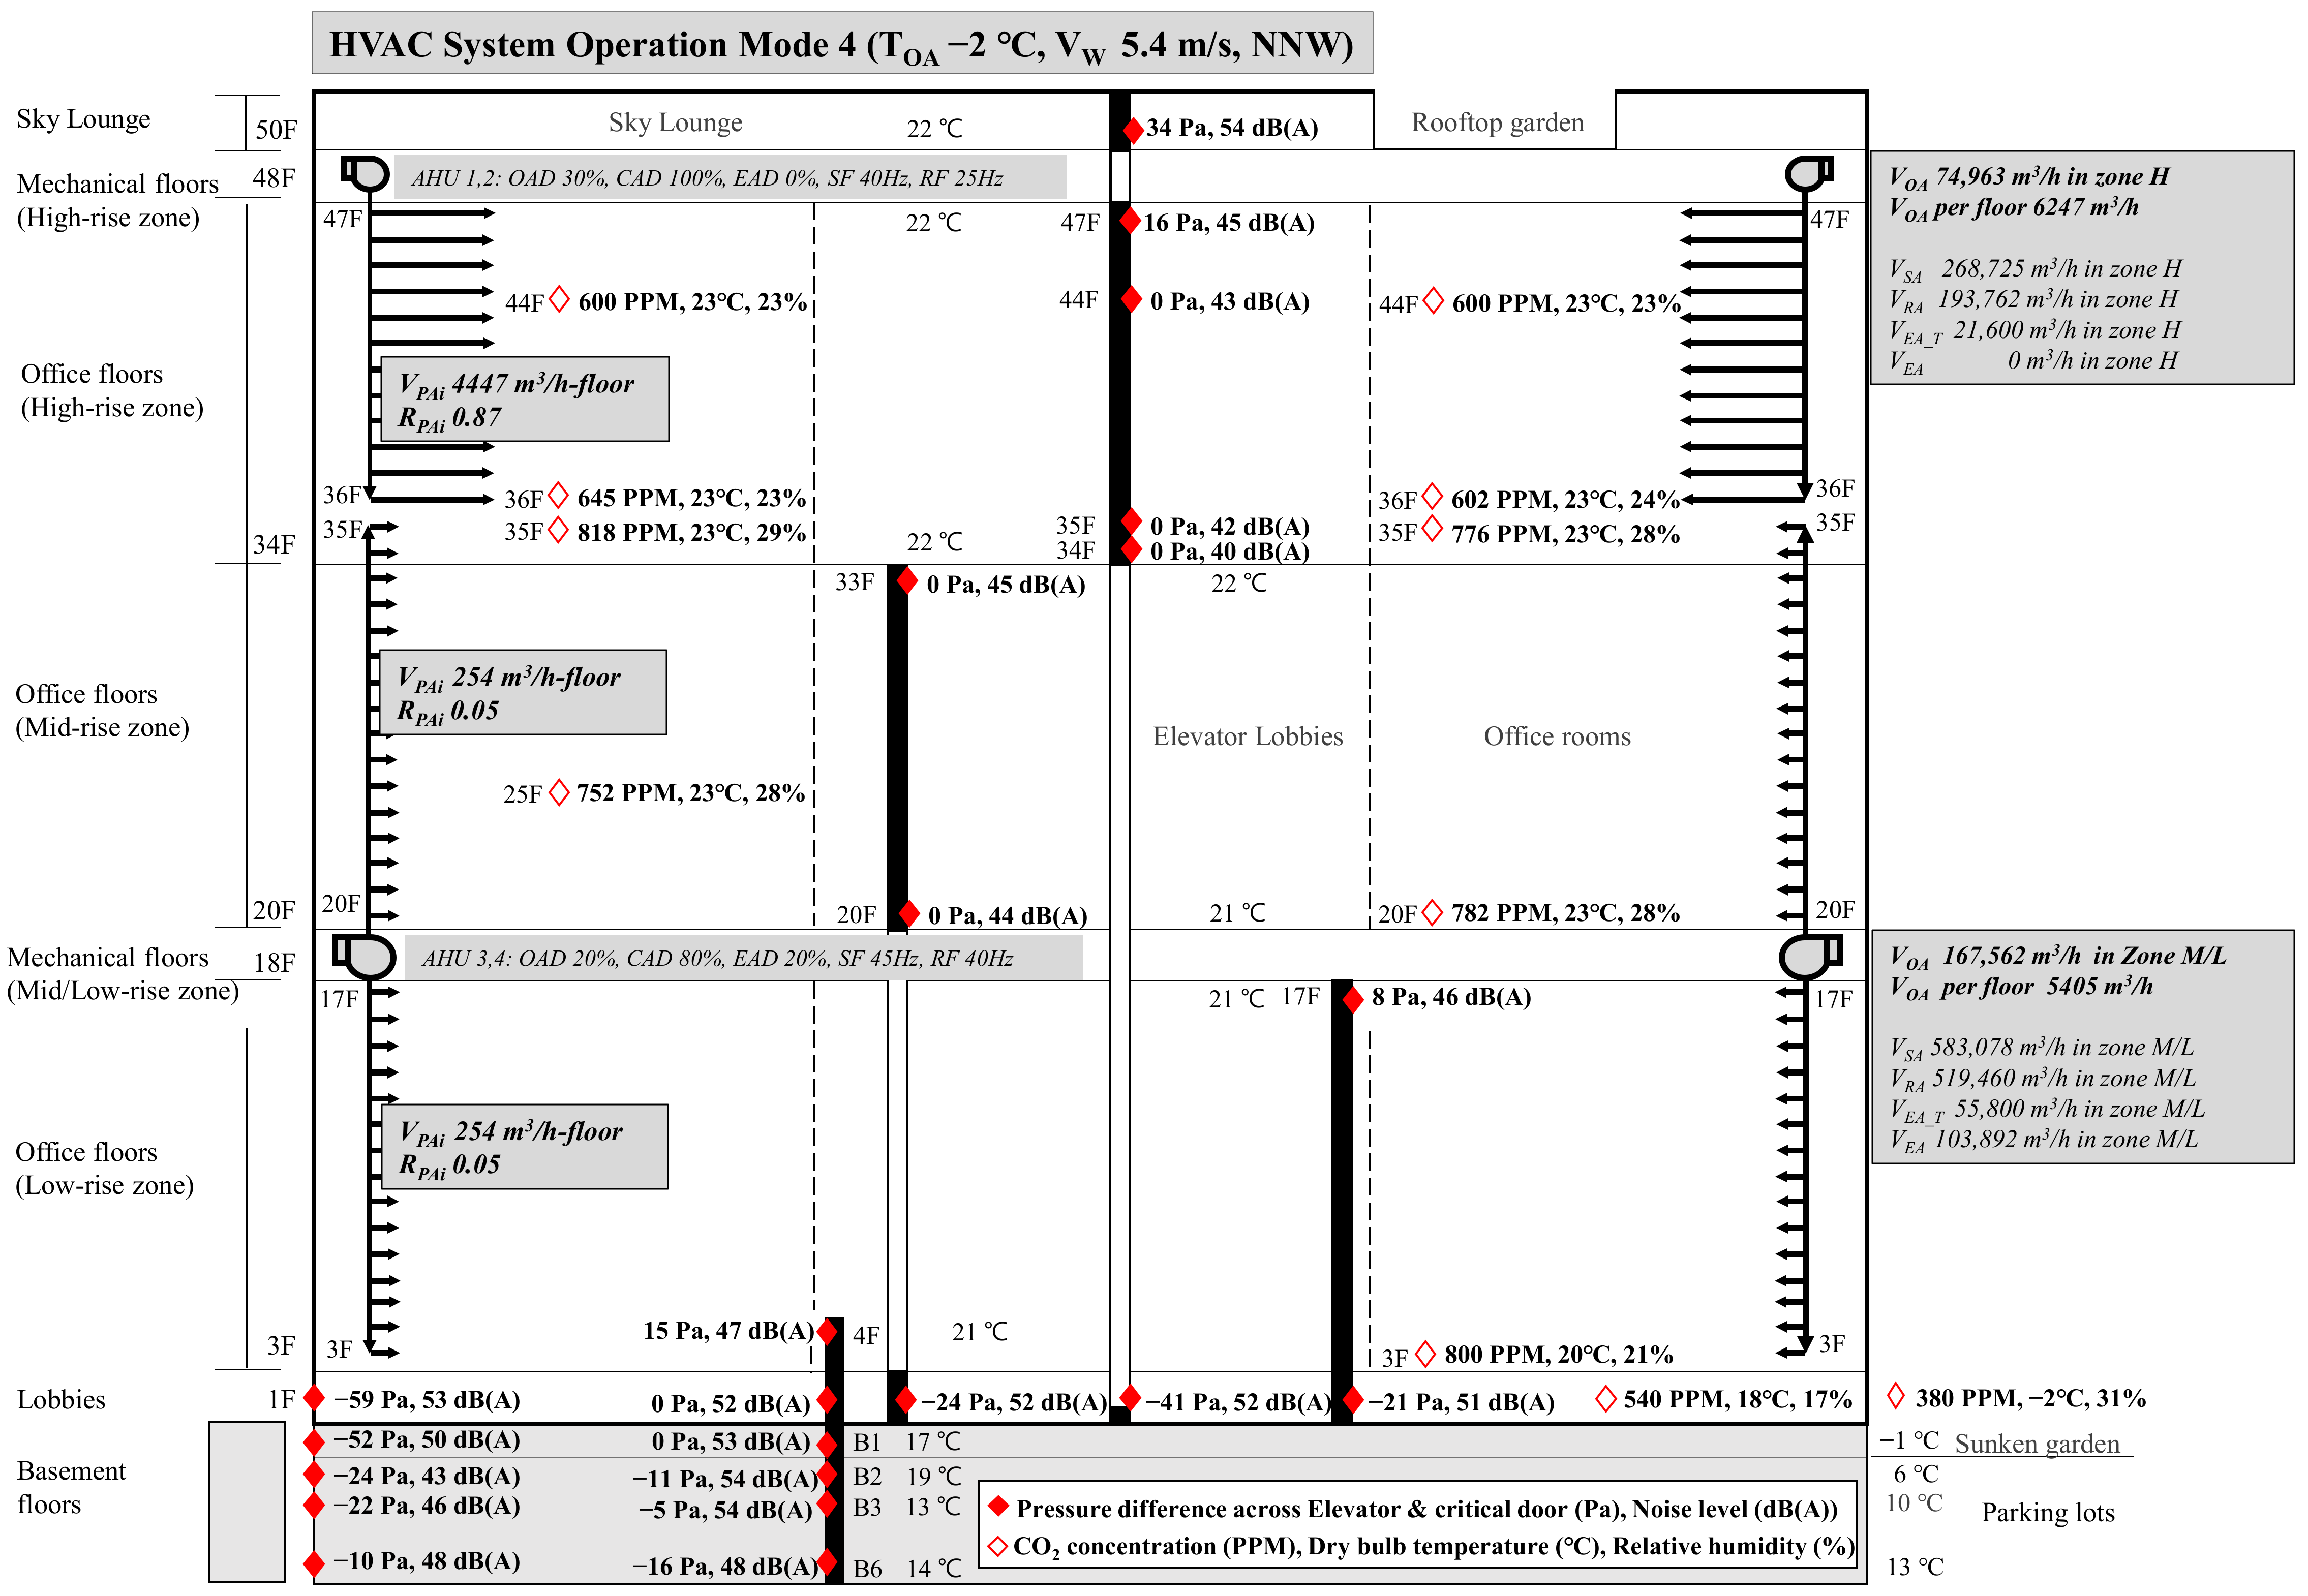
4.4. Final Application and Evaluation of Building Commissioning for Reducing Stack Effect (Winter 2015)

As stated above, HVAC operation mode 3, which was applied to the target building A in winter 2014, helped to resolve the stack effect as determined by the reduction of NL. However, depending on outdoor wind velocity (VW), the NL of the 1st and 47th elevator halls continued to deviate away from the recommended criteria. In particular, when VW exceeded 6 m/s, or the outdoor air temperature (TOA) was lower than −5 °C, the NL exceeded the recommended criteria. Thus, we proposed HVAC operation mode 4 as a revised HVAC operation method in which the amount of pressurization depended on both TOA and VW (Table 3). The damper setting conditions for the HVAC pressurization method utilized in winter 2015 were selected based on the 2014 winter improvement experiment. The high-rise zone (Zone H) had 30%, 100%, and 0% damper opening rates for OAD, CAD, and EAD in Figure 3, respectively, and the mid-/low-rise zone(zone M/L) had 20%, 80%, and 20% damper opening rates for OAD, CAD, and EAD, respectively, which were the same as before.
In mode 4-A, when VW was less than 6 m/s and TOA was higher than 0 °C, the inverters of the supply air fans (SF) and return air fans (RF) for Zone H operate at 40 Hz and 30 Hz, respectively (Table 3). In this case, the VPAi and RPAi were calculated to be 3513 m3/h-floor and 0.69, respectively. In mode 4-B, when VW was less than 6 m/s and TOA was between 0 and −5 °C, the inverter of the supply and return air fans for high-rise zone operated at 40 Hz and 25 Hz, respectively. In this case, the VPAi and RPAi were calculated to be 4447 m3/h-floor and 0.87, respectively. In mode 4-C, when VW was more than 6 m/s and TOA was above 0 °C, the inverter of the supply and return air fan for the high-rise zone operated at 45 Hz and 35 Hz, respectively, where the VPAi and RP were calculated to be 6776 m3/h-floor and 1.33, respectively. In modes 4-A through 4-C, the inverters of the supply and return air fan for the mid/lower zone were operated at 45 Hz and 40 Hz, respectively, with no pressurization, where the VPAi and RP were calculated to be 254 m3/h-floor and 0.05, respectively. In mode 4-D, when VW was less than 6 m/s and TOA was lower than −5 °C or VW was more than 6 m/s and TOA was lower than 0 °C, the inverter of the supply and return air fans for the high-rise zone operated at 45 Hz and 30 Hz, respectively, where the VPAi and RPAi were calculated to be 8191 m3/h-floor and 1.60, respectively. Additionally, the mid/low-rise zone was further pressurized in mode 4-D, and the inverters of the supply and the return air fans were operated at 45 Hz and 30 Hz, respectively, and VPAi and RPAi were calculated as 1894 m3/h-floor and 0.37, respectively.
As a result of the HVAC pressurization based on TOA and VW, most of the NL on the 1st- and 47th-floor elevator halls for the high-rise zone met the recommended criteria when pressurized during the heating period with mode 4 (Figure 10). The NL on the 47th-floor elevator hall peaked at 49.5 dB(A). Although this exceeded the criteria as 1.5 dB(A), it was to a lesser degree than the other proposed modes. On the other hand, when HVAC systems are off, most of the NLs were higher than the recommended criteria despite completion of airtightness improvement work.

4.5. Effects of Improvements on Target Building A

4.5.1. Changes in NL Due to Improved Airtightness Only

As a result of applying the building commissioning process to reduce the stack effect for two winter seasons in 2014 and 2015, the most severe noise levels (NL) of the first-floor elevator hall were reduced as shown in Figure 11A. Before improving airtightness, the average NL of the elevator hall located on the first floor was 65.6 dB(A) in winter 2014. Once airtightness was improved, the average decreased by about 6 dB(A) to 59.7 dB(A) in winter 2014 and 59.8 dB(A) in winter 2015 (Table 4). Although the NL improved upon the completion of the airtightness improvement work, it did not meet the recommended criteria of 57 dB(A) particularly when HVAC systems were not operating.
On the other hand, the NL of the 47th-floor elevator hall averaged 46.6 dB(A) after the improving airtightness in 2014, and it decreased by 2.5 dB(A) to an average NL value of 44.1 dB(A) in 2015 after additional work on enhancing airtightness (Table 4). This average satisfies the recommended NL criteria; however, the maximum NL exceeds the recommended criteria.

4.5.2. Changes in NL Due to HVAC Pressurization Methods Only

The overall effects of noise reduction due to improved HVAC pressurization methods of the target building A are shown in Figure 11B. The NL gradually decreased for the first floor elevator as HVAC pressurization modes became optimized over time (i.e., modes 1–4). In normal operation mode 1 in winter 2014, the NL of the first floor elevator hall averaged 64.3 dB(A). In mode 2, NL decreased to 58.6 dB(A), but did not reach the 57 dB NL criteria for the first floor. The NL for the first floor elevator hall then reduced to 55.0 dB(A) after using mode 3 before reaching a final value of 51.4 dB(A) after using mode 4, which is well below the NL criteria (Table 5). For the 47th-floor elevator hall, the average NL was 49.3 dB(A) upon applying mode 2, which then decreased to 44.9 dB(A) and 45.5 dB(A) for modes 3 and 4, respectively (Table 5). The average NL for modes 3 and 4 were below the criteria of 48 dB. However, the maximum NL obtained during both modes exceeded the recommended criteria.

4.5.3. Changes in NL Due to Improved Airtightness and Increased HVAC Pressurization

To reduce high noise levels due to the stack effect, we improved the overall airtightness of the target building A and pressurized its high-rise zones simultaneously. We utilized the commissioning process proposed in Section 2.3 to the building for two years in order to find the appropriate operation scheme that would lead to the desired reduction in noise level. As a result, we were able to identify that majority of the unpleasant noises due to the stack effect were concentrated on the 1st- and 47th-floor elevator halls.
In the case of the first floor, prior to any application of methods for stack effect reduction, the maximum noise level was 85 dB(A) with the HVAC system turned off. When the HVAC system was in operation, the noise level peaked at 70 dB(A). Both of these values significantly exceeded the recommended sound criteria of 57 dB(A) for a lobby space (Table 4 and Table 5). On the 47th floor, the maximum noise level was 58.7 dB(A) and 56.0 dB(A) with the HVAC system turned off and on, respectively, despite having improved airtightness and utilizing a preliminary pressurization scheme (i.e., HVAC operation mode 2). These measurements also showed that noise levels on the 47-floor elevator hall exceeded the sound criteria of 48 dB(A) for a public space in a commercial building to a critical degree (Table 4 and Table 5).
As we finished the commissioning process, we were able to establish that the most appropriate HVAC operation scheme pressurized high- and mid-rise zones. This scheme, labeled as operation mode 4, depends on outdoor air temperature and wind velocity conditions, which were categorized into four different types. By applying this HVAC operation mode, we found that the first-floor elevator hall had a maximum NL of 56.5 dB(A) which met the recommended sound criteria. The NL on the 47th-floor elevator hall peaked at 49.5 dB(A). Although this exceeded the criteria, it was to a lesser degree than that of without the application of operation mode 4.

4.6. Effects of Applying HVAC Pressurization

By applying the building commissioning process that uses primarily HVAC pressurization to reduce the stack effect in the winter of 2015, we wanted to ensure that the unpleasant noises throughout target building A was solved. To this effect, ΔP of doors, NL, and temperature were measured at the elevator halls of the main floor and the entrance of the low-rise floor of the building. Additionally, we wanted to discover any new problems of the indoor environment that may have arisen due to the increased VOA of the commissioning process we utilized. Consequently, we examined CO2 concentration (CCO2), indoor temperature (Ti), and relative humidity (RH) of indoor air in the high-rise and mid-/low-rise floor offices (Figure 12).
In the high-rise zone, measurements were taken on the 44th- and 36th-floor office spaces to the left and right of the elevator shaft. In the mid-rise zone, data were collected on both the left and right office spaces of the 35th floor, the right office space on the 25th floor, and the left office space on the 20th floor. For the low-rise zone, measurements were taken in the right office space on the third floor. These indoor air measurements were compared to those taken outside on the ground floor. All data were collected using Testo’s IAQ probe 0632 1535. The probe was placed in the middle of the target space at a height of 1.2 m from the floor for 5 min from which average values were calculated and recorded. All measurements were taken on 4 March 2016 at 2–3 pm with the building in operation mode 4, with an outdoor temperature of −2 °C and a wind velocity of 5.4 m/s.
Additionally, NLs and pressure differences were measured at each elevator in the building at their starting, ending, and midpoint transfer floors. The method in which the measurement was conducted is as noted in Section 3.2, and the location at which measurements were conducted is shown in Figure 12.
The NLs and pressure differences across exits were also measured for first and basement floors since they are directly exposed to the outdoor air. These measurements were conducted after ensuring that all elevators moving between the first and 50th floors were halted, and the movement of building occupants was restricted. However, the elevator for shuttle-use was unable to be stopped at the time of the data collection. Furthermore, there was some background noise resulting from the HVAC systems installed on the ceilings of elevator halls on B1 (connected to the outdoor environment), B2, and B3 floors, the latter two of which the underground parking lot is located. Vehicles moving in the underground parking lot also contributed to background noise.
The NL of the basement, 1st and 50th floor elevator halls, and entrances of the public spaces was less than 57 dB(A), and the NL of the high-rise and mid-/low-rise floor elevator halls of the office space was 48 dB(A), which satisfied the recommend criteria (Figure 12). The loudest noise occurred at the main entrance of the lobby on the first floor, with a NL of 53 dB(A) and a pressure difference of −59 Pa. In terms of the effects of increased VOA, we compared the indoor air environment of the high-rise, pressurized zone to that of the mid-/low-rise, non-pressurized zone. In the high-rise zone, VOA was 6247 m3/h·floor, where CCO2 was 612 PPM, Ti was 23 °C, and RH was 23%. In contrast, VOA was 5405 m3/h·floor, in the mid-/low-rise zones, where CCO2 was 729 PPM, Ti was 22 °C, and RH was 26%.
Additionally, 850 m3/h·floor of outdoor air that has a temperature of −2 °C and RH of 30% was supplied into the building through the HVAC systems. As a result, the RH of the indoor air decreased by 3%, resulting in drier indoor air, and the CCO2 decreased by 117 PPM, resulting in improved indoor air quality. However, because the Ti is kept constant by the HVAC systems in operation, it can be presumed that more energy is consumed in high-rise zones where air needs to be heated to maintain constant Ti.

5. Commissioning Process to Reduce Stack Effect Problems

In order to find the optimal HVAC operation mode that would have a synergistic effect with improved airtightness for the purposes of reducing stack effect, we utilized a commissioning process on target building A for two years. As this study took place, we also realized a need to streamline the initial commissioning process we had introduced in Section 3.2. Thus, the commissioning process we recommend for future studies to identify methods for reducing the stack effect and its ensuing problems was further developed into a seven-step process. As shown in Figure 13, each step is as follows:
(1)
Step 1: Establish stack effect reduction project commissioning plan and project team.
As the construction of a high-rise building is established, configure a building commissioning team that is dedicated to reducing the stack effect. The team should consist of a commissioning project manager (either a law enforcer or constructor), an expert on the stack effect, HVAC system, and firefighting equipment expert. The team will need to establish a commissioning plan that evaluates the stack effect of a building starting from its design stage to its functional stage.
(2)
Step 2: Preliminary review and establishment of evaluation criteria at design stage.
The team will need to confirm the building’s characteristics with regards to the stack effect at the design stage. By examining blueprints and books related to the building’s construction, the team will need to create check lists with elements related to airtightness of the building and possible airflow patterns throughout the building. This would include the building’s height, area of each floor, vertical zoning of the building, elevator zoning, elevator shafts, and the location of the main entrance or any entrances that is directly exposed to the outdoor environment. It is also important to note any possible leakage areas for the basement and first floors (that is, openings in entrance doors, elevators in basement floors that are more exposed to outdoor environment, any empty spaces between horizontal pipes or wires that infiltrate vertical elevator shaft spaces, etc.). Attributes of the building’s HVAC system is also examined and recorded. The team should also take note of the outdoor air temperature distribution during the winter season of the region in which the building is located. Thus, the differential pressure distribution within the building can be roughly estimated through which the impact of the stack effect and airflow can be calculated. Doing so will help to establish a way to evaluate the target building. All of this information will help the team to deduce an appropriate and efficient plan to reduce the stack effect in a building that will be applied to the field once selected and approved by the client.
(3)
Step 3: Supervision of the method for reducing stack effect at the construction phase.
Airtightness, one of the most important factors in reducing the stack effect in a building, largely depends on the initial design and construction of a building. Thus, it is important to ensure that the building is being constructed under constant supervision. More specifically, duct sizes, fan specifications, dampers, and so on will need to be noted carefully so that unnecessary leakage areas do not develop.
(4)
Step 4: Initial and continuous measurement of the target building after completion.
Once the construction of the building is completed, a HVAC system operator and facility manager should be added to the project team. The team should do a final review of the building’s characteristics that are related to the stack effect. Any new information on airflow or airtightness of the building discovered through field experiments should be added to the existing check lists. Characteristics of the HVAC system after a trial run should also be taken note of. Additionally, the team should educate the building manager on how to evaluate and measure the stack effect by taking note of any of its related issues such as unpleasant noises.
(5)
Step 5: Identify, approve, and implement airtightening measures after checking leakage areas.
Using infrared ray cameras and wind gauges, the project team should examine any possible leakage areas based on the checklists made in step 2. If leakage areas are discovered, a method for decreasing or eliminating the area should be discussed and carried out upon receiving the client’s approval.
If the stack effect continues to be unresolved even after enhancing the airtightness of the building, the HVAC system will need to be utilized to pressurize the high-rise zones of the building as a method for resolving the stack effect. To do so, different HVAC operation modes need to be tested out before applying to the building long-term. Tests will be carried upon approval from the building’s agent and undergo strict monitoring so that additional airtightness improvements and/or pressurization schemes are implemented until all issues are resolved. Only after all issues related to the stack effect are resolved will the team continue to the next step.
(6)
Step 6: Document commissioning improvements and stack effect reductions.
The team should document the airtightness improvements and pressurization schemes that they applied to the building to reduce the stack effect. Any issues related to the stack effect, such as noise, differential pressure, or air infiltration, should also be recorded. Generalizations about the impact of the commissioning should also be made by analyzing, for instance, differences in noise levels based on outdoor air temperature, which can be found through published meteorological data. Results from utilizing HVAC operation modes to pressurize the building also need to be analyzed and recorded. The team should take note of the energy costs of maintaining the HVAC operation mode, the amount of supply air needed, and any impact the mode may have on indoor air quality. Finally, the team should educate the facility operator on how to pressurize the building using the HVAC system to resolve the stack effect.
(7)
Step 7: Continuous commissioning.
Commissioning is a continuous process. Thus, even though a method for reducing the stack effect was deduced after the first commissioning, it is important to go through the process again the next year in case new issues related to the stack effect arise due to, for instance, development of new leakage areas. As a result, the facility operator or building manager will need to be familiar with evaluating the degree to which the stack effect is causing problems in the building. A stack effect expert should also be continuously collecting and analyzing data so that he/she will be able to resolve any spontaneous issues related to the stack effect.

6. Conclusions

In this study, we conducted a series of experiments to find an effective HVAC operation scheme, adjusting according to changes in the environment when needed, that would resolve the stack effect problem in a 50-story commercial building located in Seoul, South Korea. The stack effect can result in various problems including strong airflow through the main entrance, loud and unpleasant noises, malfunctioning elevator doors, and so on. Although the stack effect manifested similarly in target building A, the occupants’ main complaint was the loud noises in the elevator halls, leading us to use noise level (NL) as the primary measure of the severity of the stack effect. Normally, pressure differences at the elevator doors are utilized to gauge the stack effect in a high-rise building, but since this measure is positively related to the NL in the same building, we concluded that NL was an appropriate measure for our study.
Various countermeasures have been used to resolve the stack effect in high-rise buildings over the years. For target building A, we decided that improving the airtightness of the building envelope and developing an effective HVAC operation would be best able to resolve the stack effect. In this study, increasing airtightness mainly involved identifying any leakage areas and eliminating them. Developing an effective HVAC operation scheme for the building required a more sophisticated approach outlined in Figure 13.
To do so, we first conducted a series of field measurements during the 2014–2015 winter season. Through these adjustments, we found that, in addition to the improvement in airtightness, an HVAC operation mode that pressurized the high-rise zone of the building according to the outdoor air temperature and wind velocity (i.e., mode 4) substantially reduced the noise level. Furthermore, we observed that enhancing airtightness along with the HVAC operation mode 4 showed a synergistic effect on reducing NL and, thus, the stack effect. This is plausible because both methods involve moving the pressure difference inside a building to the high-rise zone through which the increased air volume cannot escape due to enhanced airtightness.
As a result, when we utilized the HVAC operation mode 4 for target building A, we found that the noise levels decreased. In the case of the first-floor elevator hall, the maximum NL reduced from 85 dB(A), with the HVAC system turned off, and 70 dB(A), with the HVAC system turned on, to 56.6 dB(A) at which point airtightness was enhanced and operation mode 4 was used. This reduced NL was below the recommended criteria for lobby spaces in a commercial building (i.e., 57 dB(A)). As for the 47th-floor elevator hall, the noise level peaked at 58.7 dB(A) and 56.0 dB(A) with the HVAC system turned off and on, respectively, even though airtightness was improved and HVAC operation mode 2 was utilized. This was reduced to 49.5 dB(A) upon the application of HVAC operation mode 4. Although the NL continued to exceed the recommended criteria, the difference is negligible.
Although these two countermeasures, airtightness improvement and pressurization, were able to resolve the stack effect in the target building A, they also affected the indoor air environment as well as the energy costs. Optimizing the HVAC operation scheme implies that the volume of air supplied into the interior space varies. Consequently, there is a general tendency for increased CO2 levels, especially if airtightness improvement work has been accomplished. In the case of utilizing operation mode 4, the high-rise zone experienced an overall increase in volume of outdoor air infiltrating the area, resulting in lower concentrations of CO2 and relative humidity but similar indoor air temperature in comparison to the mid-/low-rise zones. However, these changes to indoor air environment are within safe limits, indicating that ventilation was adequate. On the other hand, the energy costs of maintaining the optimized HVAC operation mode 4 increased by 64 MWh/year (19%) and 33 MWh/year (4%) for both the high-rise and mid-/low-rise zones, respectively. Overall, this indicates a heating cost increase of 8% for the whole building, thus applying the HVAC operation scheme may not be the most efficient.
While we have come up with an effective way of resolving the stack effect in target building A, it should be noted that this combination of airtightness enhancement and HVAC operation scheme cannot be applied to every new or existing high-rise commercial building. Each building has its own set of characteristics that may need to be taken into consideration before improving airtightness or applying a HVAC operation scheme. In other words, there may be other architectural or mechanical methods that are more suitable to a building’s conditions. It is also important to note that some combinations of stack effect countermeasures have an antagonistic or negative effect [12]. Additionally, there needs to be a balance in reducing the overall stack effect and solving problems at local points.
Regardless, we believe that the process by which we approached to determine commissioning process for reducing the stack effect in target building A is comprehensive and can be applied to other high-rise commercial buildings (Figure 13). Although the results of the building commissioning process may vary depending on the characteristics of a building and the scope and scale of the stack effect countermeasures, the methodology we used can be adapted to create a new plan. This can then be evaluated, applied, and modified to reach a final, comprehensive building commissioning procedure for any high-rise commercial building. We hope that the guideline we proposed and followed here for managing target building A can be generalized to provide insights and find effective ways to manage other high-rise buildings.
This study focused on discovering building commissioning process for target building A to effectively reduce the stack effect. Although we took certain environmental conditions under consideration, more specifically outdoor air temperature and wind velocity, further work should be conducted to look into other ways of incorporating different boundary layer conditions, such as humidity, to create an even more effective HVAC operation scheme. Future investigations should also consider other methods for resolving the stack effect in combination with what we have already applied to target building A that will result in a synergistic and positive effect.

Author Contributions

Investigation, A.K.; supervision, K.H.K.; writing—original draft, J.Y.; writing—review and editing, S.B., D.C., A.K., and K.H.K. All authors have read and agreed to the published version of the manuscript.

Funding

This work was supported by the 2020 Research Fund of the University of Ulsan, South Korea.

Data Availability Statement

Not applicable.

Conflicts of Interest

The authors declare no conflict of interest.

Abbreviations

NPLThe neutral pressure level (m)
HVACHeating, Ventilation, and Air-conditioning
VSAThe supply air volume of a particular zone (m3/h)
VRAthe return air volume of a particular zone (m3/h)
VOAThe outdoor air volume of a particular zone (m3/h)
VEAthe exhaust air volume of a particular zone (m3/h)
VEA_TThe corresponding toilet exhaust air volume of a particular zone (m3/h)
OADThe outdoor air dampers in HVAC systems of a particular zone
CADThe recirculated air dampers in HVAC systems of a particular zone
EADThe exhaust air dampers in HVAC systems of a particular zone
VPAThe volume of pressurization air of a particular zone (m3/h)
VPaiThe volume of pressurization air for each floor (m3/h·floor)
RPaiThe pressurization rate for each floor
ΔPThe pressure differences (Pa)
NLNoise Level (dB(A))
TOAOutdoor air temperature (°C)
TiIndoor air temperature (°C)
VWOutdoor wind velocity (m/s)
RHRelative humidity (%)
CCO2CO2 concentration (ppm)
SFSupply fans
RFReturn fans
Zone M/LThe mid-rise and low-rise zones
Zone HThe high-rise zones
FFloor
Ave.Average
MaxMaximum

References

  1. Khoukhi, M.; Al-Maqbali, A. Stack Pressure and Airflow Movement in High and Medium Rise buildings. Energy Procedia 2011, 6, 422–431. [Google Scholar] [CrossRef] [Green Version]
  2. Kosonen, R.; Jokisalo, J.; Ranta-Aho, I.; Koikkalainen, E.-P. Methods to Reduce Stack Effect and Improve Energy Efficiency in a Nordic High Rise Residential Building. Procedia Eng. 2017, 205, 2311–2317. [Google Scholar] [CrossRef]
  3. Mijorski, S.; Cammelli, S. Stack Effect in High-Rise Buildings: A Review. Int. J. High-Rise Build. 2016, 5, 327–338. [Google Scholar] [CrossRef] [Green Version]
  4. Dennis, S.; Brenda, B. Commercial Building Pressurization. Trane 2002, 31, 1–8. [Google Scholar]
  5. Lovatt, J.; Wilson, A. Stack effect in tall buildings. ASHRAE Trans. 1994, 100, 420–431. [Google Scholar]
  6. Tamura, G. Smoke Movement and Control in High-Rise Buildings; National Fire Protection Association: Quincy, MA, USA, 1994. [Google Scholar]
  7. Khoukhi, M.; Yoshino, H.; Liu, J. The effect of the wind speed velocity on the stack pressure in medium-rise buildings in cold region of China. Build. Environ. 2007, 42, 1081–1088. [Google Scholar] [CrossRef]
  8. Suh, H.; Kim, B.S.; Kim, T.; Lim, J. Influence analysis of stack effect on odor dispersion from unit to core in the high-rise residential buildings. In Proceedings of the Building Sumulation 2007, Beijing, China, 3 September 2007; pp. 1062–1068. [Google Scholar]
  9. Jiang, Y.; Zhao, B.; Li, X.; Yang, X.; Zhang, Z.; Zhang, Y. Investigating a safe ventilation rate for the prevention of indoor SARS transmission: An attempt based on a simulation approach. Build. Simul. 2009, 2, 281–289. [Google Scholar] [CrossRef] [PubMed]
  10. Lim, T.; Cho, J.; Kim, B.S. Predictions and measurements of the stack effect on indoor airborne virus transmission in a high-rise hospital building. Build. Environ. 2011, 46, 2413–2424. [Google Scholar] [CrossRef] [PubMed]
  11. Feustel, H.E.; Diamond, R.C. Diagnostics and measurements of infiltration and ventilation systems in high-rise apartment buildings. In Proceedings of the 1996 ACEEE Summer Study on Energy Efficiency in Buildings; American Council for an Energy Efficient Economy: Washington, DC, USA, 1996; pp. 1–95. [Google Scholar]
  12. Lim, H.; Seo, J.; Song, D.; Yoon, S.; Kim, J. Interaction analysis of countermeasures for the stack effect in a high-rise office building. Build. Environ. 2020, 168, 106530. [Google Scholar] [CrossRef]
  13. Hayakaya, S.; Togari, S. Study on the stack effect of tall office building (Part1). J. Archit. Inst. Jpn. 1988, 387, 42–52. [Google Scholar]
  14. Man, X.; Lu, Y.; Li, G.; Wang, Y.; Liu, J. A study on the stack effect of a super high-rise residential building in a severe cold region in China. Indoor Built Environ. 2019, 29, 255–269. [Google Scholar] [CrossRef]
  15. Jo, J.H.; Lim, J.H.; Song, S.Y.; Yeo, M.S.; Kim, K.W. Characteristics of pressure distribution and solution to the problems caused by stack ef-fect in high-rise residential buildings. Build. Environ. 2007, 42, 263–277. [Google Scholar] [CrossRef]
  16. Lstiburek, J. Understanding air barriers. ASHRAE J. 2005, 47, 24–30. [Google Scholar]
  17. Yu, J.-Y.; Song, K.-D.; Cho, D.-W. Resolving Stack Effect Problems in a High-Rise Office Building by Mechanical Pressurization. Sustainability 2017, 9, 1731. [Google Scholar] [CrossRef] [Green Version]
  18. Song, D.; Lim, H.; Lee, J.; Seo, J. Application of the mechanical ventilation in elevator shaft space to mitigate stack effect under operation stage in high-rise buildings. Indoor Built Environ. 2014, 23, 81–91. [Google Scholar] [CrossRef]
  19. Tamblyn, R. Coping with air pressure problems in tall buildings. ASHRAE Trans. 1991, 97, 824–827. [Google Scholar]
  20. Shinomiya, N.; Takada, S.; Ushio, T. Study on Ventilation in High-Rise Building Based on Pressure Differences Measured at Elevator Doors. Energy Procedia 2015, 78, 2712–2716. [Google Scholar] [CrossRef] [Green Version]
  21. Strege, S.; Ferreira, M. Characterization of Stack Effect in High-Rise Buildings Under Winter Conditions, Including the Impact of Stairwell Pressurization. Fire Technol. 2017, 53, 211–226. [Google Scholar] [CrossRef]
  22. Haasl, T.; Heinemeier, K. California Commissioning Guide: New Buildings; California Commissioning Collaborative: Sacramento, CA, USA, 2006; pp. 2–3. [Google Scholar]
  23. Claridge, D.E.; Turner, W.D.; Liu, M.; Deng, S.; Wei, G.; Culp, C.; Chen, H.; Cho, S. Is Commissioning Once Enough? Energy Eng. 2004, 101, 7–19. [Google Scholar] [CrossRef]
  24. Claridge, D.E.; Liu, M. Commissioning of existing buildings—State of the technology and its implementation. In Proceedings of the International Short Symposium on HVAC Commissioning, Kyoto, Japan, 8 April 2003; pp. 4–50. [Google Scholar]
  25. Haasl, T.; Sharp, T. A Practical Guide for Commissioning Existing Buildings; Office of Scientific and Technical Information (OSTI): Portland, OR, USA, 1999; pp. 42–43. [Google Scholar]
  26. Haasl, T.; Heinemeier, K. California Commissioning Guide: Existing Buildings; California Commissioning Collaborative: Sacramento, CA, USA, 2006; p. 5. [Google Scholar]
  27. ISO. ISO 1996-1:2003, Acoustics—Description, Measurement and Assessment of Environmental Noise—Part 1: Basic Quantities and Assessment Procedures; ISO: Geneva, Switzerland, 2003. [Google Scholar]
  28. Beranek, L.L. Noise and Vibration Control Engineering: Principles and Applications. J. Acoust. Soc. Am. 1995, 97, 1358–1359. [Google Scholar] [CrossRef]
Figure 1. Pressure distribution when pressurizing the high-rise zone by reducing exhaust air volume of an HVAC system. (a) Before pressurization; (b) after pressurization.
Energies 14 02299 g001
Figure 2. Absolute pressure changes when pressurizing high-rise zone by reducing return air volume.
Energies 14 02299 g002
Figure 3. HVAC system settings when pressurized.
Energies 14 02299 g003
Figure 4. A flowchart of our study.
Energies 14 02299 g004
Figure 5. (A) Vertical zoning of elevators and HVAC systems in the building A; (B) floor plans and measurement locations on the 1st floor and 47th floor in the building A.
Energies 14 02299 g005
Figure 6. The pressure difference across the elevator doors is positively related to the NL on the 1st and 47th elevator halls. The measured values of pressure difference across the first-floor elevator door were as negative values.
Energies 14 02299 g006
Figure 7. NL of the first-floor elevator hall is associated with both (a) the outdoor air temperature and (b) the wind velocity. Measurements were taken between 1 December 2014 and 15 February 2015, when HVAC systems are off, and the wind direction is NW, NNW, N.
Energies 14 02299 g007
Figure 8. Noise distribution on 1st- and 47th-floor elevator halls (Winter 2014). The distribution of NL with and without HVAC pressurization is shown, and improvements in the pressurization method to resolve the problem are shown as a function of the outdoor temperature. The wind speed distribution was also checked, and the resulting NL change was also reviewed. Here, the recommended NL criteria for the elevator hall for the 1st floor were 57 dB(A) and 48 dB (A) for the 47th-floor elevator hall.
Energies 14 02299 g008
Figure 9. (A) Pressurized ratio in mode 3 based on outdoor air temperature for each zone in winter 2014. (B) Pressurized ratio in mode 4 based on outdoor air temperature and wind velocity for each zone in winter 2015.
Energies 14 02299 g009
Figure 10. Noise distribution on 1st- and 47th-floor elevator halls (Winter 2015).
Energies 14 02299 g010
Figure 11. (A) Changes in NL for the first floor elevator hall with improved airtightness. (B) Noise distribution of elevator hall on the first floor according to different HVAC pressurization modes.
Energies 14 02299 g011
Figure 12. Distribution of indoor air environment in HVAC pressurization of high-rise zone (Operation Mode 4-B).
Energies 14 02299 g012
Figure 13. Flowchart of the building commissioning process to resolve the stack effect.
Energies 14 02299 g013
Table 1. Summary of operation modes utilized to develop a method for reducing stack effect.
YearOperation PeriodOperation Mode No.Operation Mode Description
2014 Winter1 October–13 November 20141General operation (non-heating period)
14 November–14 December 20142Operation of maximum air volume pressurization
15 December 2014–27 February 20153Operation of controlled air volume pressurization according to TOA (≥0; 0 to −5; <−5 °C) Airtightness increased
2015 Winter24 November 2015–10 March 20164Operation of controlled air volume pressurization according to TOA (≥0; 0 to −5; <−5 °C) and VW (<6; ≥6 m/s)
Table 2. HVAC system operating conditions in winter 2014.
Operation Mode No.TOA [°C]ZoneSF [Hz]RF [Hz]VPai [m3/h∙floor]RPAi
1-H353510440.20
2-H452510,1551.98
3-A≥0H403040330.79
3-B0 to −5H402553851.05
3-C<−5H452510,1551.98
M/L45402540.05
Table 3. HVAC system operating conditions in winter 2015. The HVAC pressurization method was classified into four operation modes according to the outdoor temperature and the wind speed.
Operation ModeMode No.VW [m/s]TOA [°C]ZoneSF [Hz]RF [Hz]OAD [%]CAD [%]EAD [%]VPai [m3/h·floor]RPAi
Mode 4
Operation of controlled air volume pressurization according to TOA and VW
4-A<6≥0H403030100035310.69
M/L45402080202540.05
4-B0 to −5H402530100044470.87
M/L45402080202540.05
4-D<−5H453030100081911.60
M/L453520802018940.37
4-C≥6≥0H453530100067761.33
M/L45402080202540.05
4-D<0H453030100081911.60
M/L453520802018940.37
Table 4. Average NL on the 1st and 47th elevator halls before and after completion of airtightness improvement work, when HVAC systems are off.
Operation ModeMeasurement PeriodTOA (Ave.) [°C]1st Floor Noise Level (Ave.) [dB(A)]47th Floor Noise Level (Ave.) [dB(A)]
HVAC OFF2014 WinterBefore airtightness improvement10 November 2014–14 December 2014−7.3–10.7 (−0.3)56.2–85.0 (65.6)Not measured
After airtightness improvement15 December 2014–10 March 2015−10.9–4.9 (−1.3)52.0–75.2 (59.7)38.4–58.7 (46.6)
2015 WinterAfter airtightness improvement2 December 2015–10 March 2016−13.0–8.4 (−1.2)52.2–68.2 (59.8)37.3–52.9 (44.1)
Table 5. Average NL on the 1st and 47th elevator halls according to different HVAC pressurization schemes in operation.
Operation ModeMeasurement PeriodTOA (Ave.) [°C]1st Floor Noise Level (Ave.) [dB(A)]47th Floor Noise Level (Ave.) [dB(A)]
HVAC ON2014 winterMode 1
General operation (non-heating period)
10 October 2014–13 November 2014−0.4–18.9 (11.3)60.9–70.0 (64.3)Not measured
Mode 2
Operation of maximum air volume pressurization
14 November 2014–14 December 2014 −7.7–10.1 (0.7)51.0–64.5 (58.6)43.0–56.0 (49.3)
Mode 3
Operation of controlled air volume pressurization according to TOA
15 December 2014–10 March 2015−10.8–3.5 (−1.9)50.0–58.2 (55.0)42.0–53.0 (44.9)
2015 winterMode 4
Operation of controlled air volume pressurization according to TOA & VW
2 December 2015–10 March 2016−13.4–6.4 (−1.3)45.9–56.5 (51.4)40.0–49.5 (45.5)
Publisher’s Note: MDPI stays neutral with regard to jurisdictional claims in published maps and institutional affiliations.

