
Vacuum System Optimization for EAST Neutral Beam Injector


1
School of Mechanical Engineering, Hefei University of Technology, Hefei 230009, China
2
Institute of Plasma Physics, Chinese Academy of Sciences, Hefei 230031, China
3
Science Island Branch of Graduate School, University of Science and Technology of China, Hefei 230052, China
*
Author to whom correspondence should be addressed.
Energies 2022, 15(1), 264; https://doi.org/10.3390/en15010264
Submission received: 19 November 2021
/
Revised: 21 December 2021
/
Accepted: 24 December 2021
/
Published: 31 December 2021
(This article belongs to the Topic Nuclear Energy Systems)
Abstract
:The neutral beam injector (NBI) generates a high-energy ion beam and neutralizes it, and then relies on drift transmission to inject the formed neutral beam into the fusion plasma to increase the plasma temperature and drive the plasma current. In order to better cooperate with the Experimental Advanced Superconductive Tokamak (EAST), part of the Chinese major national scientific and technological infrastructure, in carrying out long-pulse high-parameter physics experiments of 400 s and above, this paper considers the optimization of the current design and operation of the NBI beam line with a pulse width of 100 s. Based on an upgraded and optimized NBI vacuum chamber and the structure of the beam-line components, the gas-source characteristics under the layout design of the NBI system are analyzed and an NBI vacuum system that meets relevant needs is designed. Using Molflow software to simulate the transport process of gas molecules in the vacuum chamber, the pressure gradient in the vacuum chamber and the heat-load distribution of the low-temperature condensation surface are obtained. The results show that when the NBI system is dynamically balanced, the pressure of each vacuum chamber section is lower than the set value, thus meeting the performance requirements for the NBI vacuum system and providing a basis for subsequent implementation of the NBI vacuum system upgrade using engineering.
1. Introduction
In order to realize the high-parameter, steady-state operation of a tokamak nuclear fusion device, the support of a high-power auxiliary heating system is required. Neutral beam injection is one of the main methods used for external heating and maintenance of plasma in tokamak nuclear fusion devices. It is the auxiliary heating method with the highest heating efficiency and the clearest physical mechanism. The neutral-beam injector (NBI) is an equipment system that implements Neutral beam injection in a fusion device. It generates a high-energy neutral ion beam and then relies on drift transmission to inject the formed neutral beam into fusion plasma to increase the plasma temperature and drive the plasma current. In the process of generating and transmitting the high-energy neutral beam, a vacuum pressure-gradient distribution is required. Therefore, the performance of the NBI vacuum system has a great impact on the efficiency of the Neutral beam injection and the service life and safety of related components in the beam line [1,2,3].
The Experimental Advanced Superconductive Tokamak (EAST), which is part of the Chinese national major science and technology infrastructure, was designed to carry out long-pulse, high-parameter physics experiments of 400 s and above. In order to better cooperate with physical testing, internal analysis and discussion concluded that it would be best to upgrade and optimize the current NBI (hereinafter referred to as the EAST-NBI) with a maximum pulse width of 100 s. The key objective was to increase the magnetic pole gap by shifting the bending magnet toward the neutralizers and relieve the excessive pressure of the local energy deposition of the bending-magnet pole guard plate caused by beam divergence under long-pulse operation conditions. At the same time, the heat exchange capacity of the calorimeters and the ion dumps under high heat-flow conditions could be enhanced. With this consideration, the existing beam-line vacuum chamber was changed from a cylindrical shape to a square shape to facilitate better implementation and maintenance in the future.
2. Overall Design of EAST-NBI Vacuum System
2.1. Requirements for EAST-NBI Vacuum System
To obtain optimal neutralization efficiency, the pressure in the EAST-NBI neutralized area, or vacuum chamber, is generally required to be in the order of Pa. In theory, the lower the pressure is in the drift section of the neutral beam, the lower the loss of the neutral beam should be. In actual situations, in order to reduce the re-ionization loss of the high-energy neutral beam and obtain higher heating efficiency, the NBI drift-pipe-area pressure is generally required to be in the order of Pa.
The working gas of the EAST-NBI is deuterium gas. In order to obtain a vacuum environment that meets the requirements of an NBI, considering the limited space of the experimental hall and the harsh electromagnetic environment, this vacuum system must fulfill the following conditions [4]: (1) a pumping speed for deuterium of one million liters per unit in seconds or higher and as small a geometric size as possible; (2) a completely clean vacuum without any pollution of the vacuum system; (3) long-term stable operation in a magnetic-field and neutron-irradiation environment; (4) easy installation and maintenance and low setup and operating costs.
2.2. Layout of EAST-NBI Vacuum System
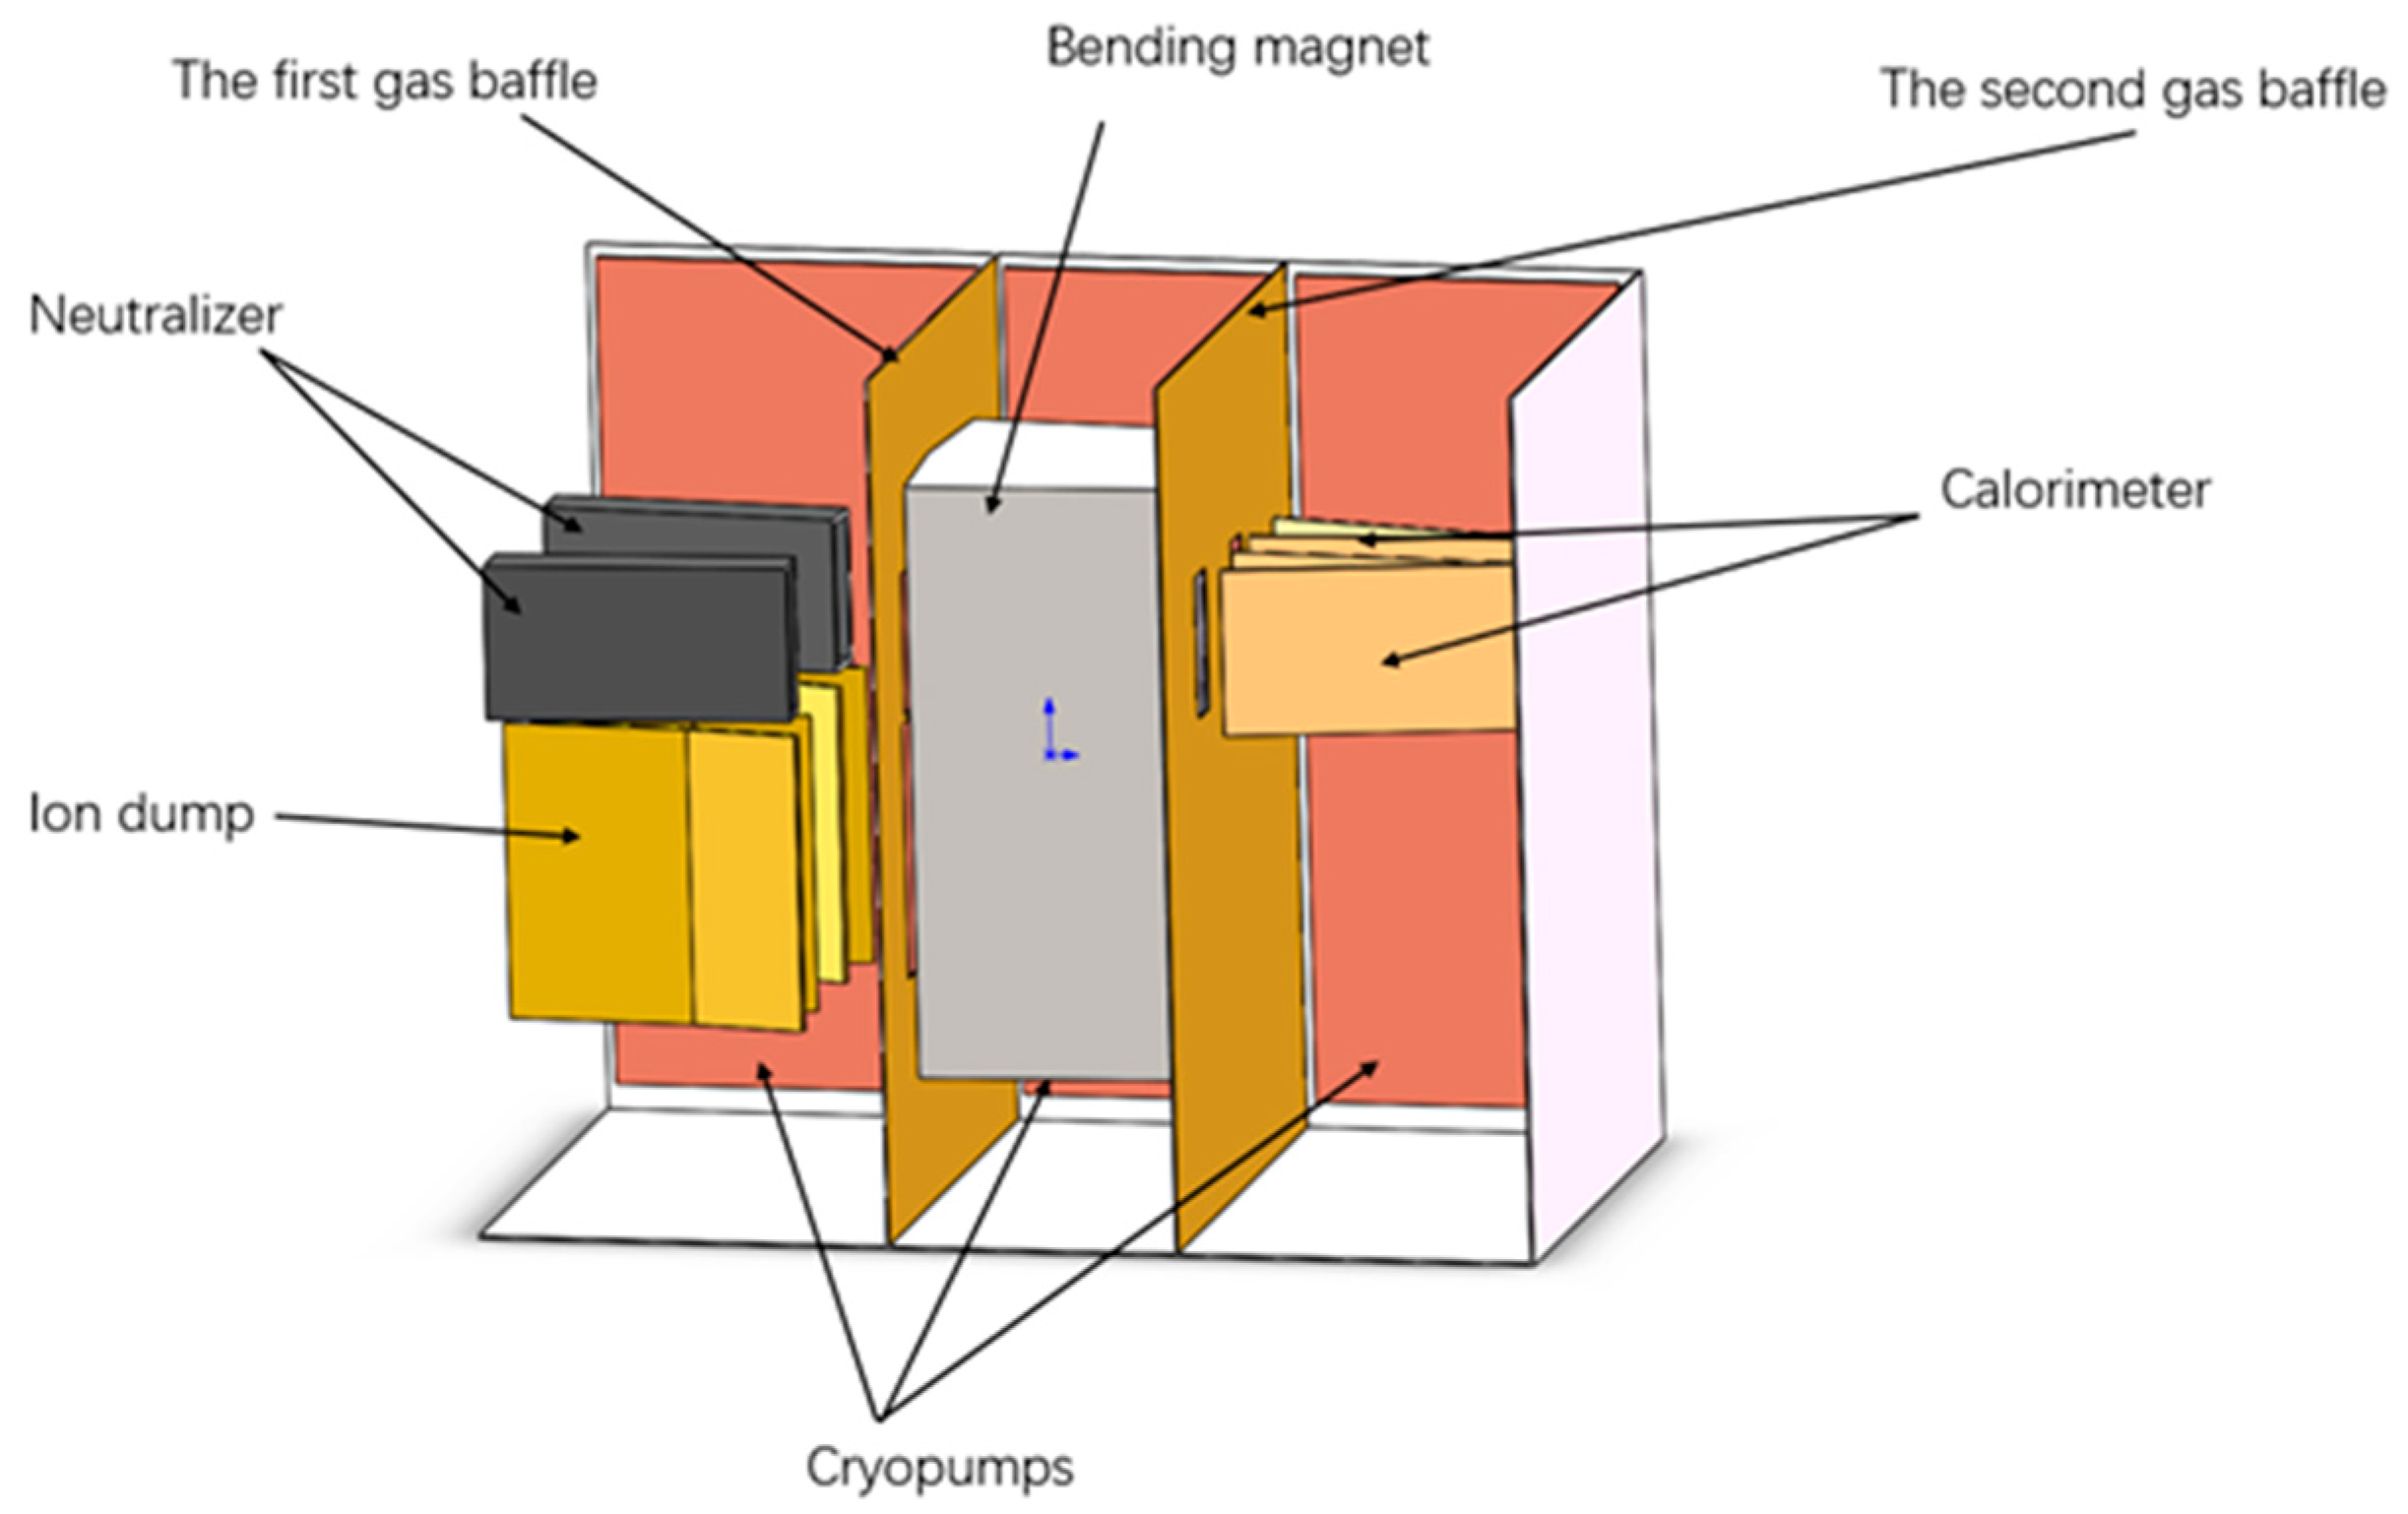
In the layout for the upgraded EAST-NBI vacuum system, the concept described above was adopted after internal consideration and the differential structure was maintained. The layout of the existing EAST-NBI vacuum system is shown in Figure 1 [5], where the vacuum chamber is divided into three sections by setting two gas baffles. The first gas baffle is located between the neutralizers and the bending magnets and divides the cylindrical rear cryogenic-condensate pump into two parts. The disc-shaped frontal cryogenic-condensate pump assumes the role of the second gas baffle, leaving calorimeters in the middle and a beam channel for the high-energy neutral beam to pass through.
The upgraded NBI is equipped with two gas baffles to enable differential pumping. A schematic diagram of the structure is shown in Figure 2. After internal consideration, the first gas baffle was placed in the same position as the existing NBI, and the second gas baffle was set between the bending magnets and the calorimeters. The NBI vacuum chamber could then divided into three areas with different vacuum pressures due to the action of the gas baffle: a neutralization area, a bending-magnet area, and a drift-pipe area.
Compared with the existing NBI, the positions of the upgraded NBI bending magnets were shifted towards the neutralizers by 490 mm, and the beam transmission direction length of the drift-pipe area was increased by 240 mm in order to place the optimized calorimeters. Due to the optimization of the bending magnet structure and the change in position, the size of the beam limiter on the first gas baffle had to be increased to allow the deflected high-energy ion beam to pass. The main parameter changes of the beam-line vacuum chamber after the upgrade are shown in Table 1. These changes would cause changes in the location and size of the gas source in the NBI vacuum chamber and in the flow conductance between each area, which would affect the cryopump pumping speed requirements in each area of the vacuum chamber. Therefore, the existing NBI vacuum system needs to be optimized.
2.3. EAST-NBI System Gas Source Analysis
The upgrading of the NBI vacuum chamber and the beam-line components would result in changes in the location and size of the gas source in the vacuum chamber. It is thus necessary to reanalyze the gas source of the NBI system. Since the positions of the bending magnets are moved to the first gas baffle, it can be considered that the beam power deposition share at the beam current limiter at the exit of the neutralized area increases from 1.3% to 2.6% and that the beam power deposition at the magnetic pole guard plate of the bending magnets increases from 9% to 12.3%.
According to relevant theoretical analyses and calculations [6,7], the EAST-NBI vacuum system has two main sources of gas load: the gas entering the neutralized area of the vacuum chamber from the outlet of the neutralizers and the gas generated by the collision of particles in the beam with the beam limiter, ion dumps, etc. The EAST-NBI two-ion source head intake air volume = 4.464 , the total equivalent gas volume under normal conditions corresponding to the three ions in the total extracted beam = 2.232 , the total supplementary gas volume of the two neutralizers = 2.66 , and the amount of gas entering the neutralized area of the vacuum chamber from the outlet of the neutralizers = 4.892 .
The amount of gas generated by the collision of particles in the beam with the beam limiter, ion dumps, etc., can be mainly divided into the following five parts:
- The amount of gas produced by the beam collision at the beam limiter at the exit of the neutralizers = 0.058 ;
- The amount of gas produced by the ion dumps due to beam collision = 0.58 ;
- The amount of gas produced by the beam collision at the exit of the bending magnet = 0.089 ;
- The amount of gas produced by the bending-magnet pole guard plate due to beam collision = 0.275 ;
- The amount of gas produced by the beam collision at the entrance of the drift pipe = 0.022 .
2.4. Determination of EAST-NBI Vacuum System Parameters
Due to the optimized structure of the bending magnets, the gap in the bending-magnet pole guard and the height of the beam channel increase. To ensure that the deflected high-energy ion beam can pass through the gas baffle smoothly, the cross-sectional size of the flow guide-hole in the first gas baffle was increased from 0.65 m 0.22 m to 0.86 m 0.22 m. Since the beam channel for the calorimeters is no longer needed in the middle of the second gas baffle, in order to reduce the conductance of the baffle, the baffle was changed from a single large-beam channel-hole to two small-beam channel-holes. The cross-sectional size was reduced from 1.05 m 0.565 m to 2 × (0.48 m 0.22 m), thereby reducing the gas flow from the bending-magnet area into the drift-pipe area and improving the vacuum degree of the drift section. The change in the flow conductance of the gas baffle in the vacuum chamber leads to differences in the gas load in each area, which directly affects the pumping speed of the cryopump and which thus needs to be configured in each area of the vacuum chamber. It was therefore necessary to re-determine the EAST-NBI vacuum system parameters. The pumping speed for each area of the vacuum chamber was calculated by balancing it according to the value of the internal pressure setting of each area of the EAST-NBI, based on the analysis results of the gas-source location and gas volume of each area.
The gas load of the low-temperature condensation surface in the neutralized area of the vacuum chamber is equal to the amount of gas entering the vacuum chamber of the neutralized area minus the amount of gas leaving the neutralized area to the bending-magnet zone of the vacuum chamber. The part of the gas entering the neutralized area of the vacuum chamber is the amount of gas that enters the neutralized area of the vacuum chamber from the outlet of the neutralizers, the amount of gas generated by the beam collision at the beam limiter at the outlet of the neutralizers , and the amount of gas produced by the ion dumps due to beam collision. The amount of gas leaving the neutralized area of the vacuum chamber and entering the bending-magnet area depends on the dynamic vacuum pressures and in the neutralized area of the vacuum chamber, the bending-magnet area, and the conductance of the corresponding holes on the gas baffle set between the two sections. The size of the beam limiter at the outlet of the two neutralizers on the first gas baffle is a = 0.48 m, b = 0.22 m, and L = 0.054 m; the size of the beam limiter at the entrance of the ion dumps is a = 0.86 m, b = 0.22 m, and L = 0.007 m. The conductance of the beam limiter can be calculated using Equation (1):
In this equation, is the shape factor of the beam limiter, which is 0.8362; T is the gas temperature, which is 300 K; and M is the relative molecular mass of deuterium gas.
The amount of gas entering the bending-magnet area from the neutralized area of the vacuum chamber can be calculated with Equation (2):
In this equation, is the pressure in the neutralized area of the vacuum chamber, which is taken as Pa; is the pressure in the bending magnet area of the vacuum chamber, which is taken as Pa.
The gas load of the low-temperature condensation surface in the neutralized area of the vacuum chamber can be calculated using Equation (3):
After calculation, the gas load of the low-temperature condensation surface in the neutralized area of the vacuum chamber is 4.621 .
The gas entering the bending-magnet area of the vacuum chamber consists of the amount of gas generated by the beam collision at the exit of the bending magnets, the amount of gas generated by the beam collision of the bending-magnet pole guard, and the amount of gas entering the bending-magnet area from the neutralized area of the vacuum chamber . The size of the beam limiter on the second gas baffle is a = 0.48 m, b = 0.22 m, and L = 0.054 m. The amount of gas leaving the bending-magnet area of the vacuum chamber and entering the drift-pipe area can be calculated using Equation (4):
In this equation, is the pressure in the drift-pipe area of the vacuum chamber, taking Pa.
The gas load of the low-temperature condensation surface in the bending-magnet area of the vacuum chamber can be calculated using Equation (5):
After calculation, the gas load of the low-temperature condensation surface in the bending magnet area of the vacuum chamber 1.159 .
The amount of the gas entering the drift-pipe area of the vacuum chamber is the amount of gas generated by the beam collision at the drift-pipe entrance beam-limiter and the amount of gas that enters the drift-pipe area from the bending-magnet area of the vacuum chamber. The size of the beam limiter at the drift pipe is a = 0.48 m, b = 0.3 m, and L = 0.05 m, and the amount of gas leaving the drift-pipe area of the vacuum chamber and entering the EAST through the drift pipe can be calculated using Equation (6):
In this equation, is the pressure in the drift-pipe area of the vacuum chamber, which is Pa.
The gas load of the low-temperature condensation surface in the drift-pipe area of the vacuum chamber can be calculated using Equation (7):
After calculation, the gas load of the low-temperature condensation surface in the drift-pipe area of the vacuum chamber is 0.116 .
The pumping speed can be calculated using Equation (8):
The dynamic vacuum pressure in the EAST-NBI vacuum chamber is set at Pa, Pa, and Pa and calculated as L/s, L/s, and L/s. Considering the space of the vacuum chamber and actual operating experience with the NBI, square cryogenic-condensate pumps should be arranged on both sides of the NBI vacuum chamber. The size of the low-temperature condensation surface in the neutralized area of the vacuum chamber is (2.8 m 1.3 m), the pumping area is 7.28 , and the deuterium pumping speed is L/s. The size of the low-temperature condensation surface in the bending-magnet area of the vacuum chamber is (2.8 m 0.9 m) the pumping area is 5.04 , and the deuterium pumping speed is L/s. The size of the low-temperature condensation surface in the drift-pipe area of the vacuum chamber is (2.8 m 1.1 m), the pumping area is 6.16 , and the deuterium pumping speed is L/s.
A comparison of the EAST-NBI vacuum system parameters before and after the upgrade is shown in Table 2.
3. Simulation Analysis of NBI Vacuum System Pumping Performance
3.1. NBI System Gas Molecule Transport Model
Some of the gas molecules in the NBI system enter the vacuum chamber from the outlet of the neutralizers and some of them are generated by the collision of the beam with the beam limiter, ion dumps, etc. The gas inlet rate at the outlet of the neutralizers can be expressed by Equations (9)–(11):
In these equations, is the inlet gas velocity at the outlet of the neutralizers; f is the inlet plane; is the gas source temperature; k is the Boltzmann constant; is the gas pressure; is the gas volume; and is the volume in —that is, the total number of molecules.
The flow state of gas molecules in the NBI vacuum chamber is a free molecular flow, and collisions between gas molecules can be ignored. Only the collisions between gas molecules and the walls of the vacuum chamber were considered. It was assumed that when gas molecules collide with the walls, the gas molecules stay on the walls for a very short time, and the residence time is exponentially distributed:
In this equation, is the period of molecular vibration; is the molar absorption heat of gas molecules; is the molar gas constant; and is the wall temperature.
The velocity distribution of the gas leaving the wall follows the Maxwell–Boltzmann distribution, which can be expressed by the following equation:
In this equation, is the velocity of the gas molecules after colliding with the wall and is the mass of the gas molecules.
The direction in which the gas molecules fly away from the wall of the vacuum chamber has nothing to do with the direction before the collision and is distributed according to the cosine of the angle with the normal direction of the surface. Set as a molecule, the probability that it will be at the solid angle (the angle with the normal surface) when it leaves the surface is
In this equation, is the solid angle in the direction of the gas molecule’s movement and is the angle between the direction of the gas molecule’s movement and the normal wall.
3.2. Simulation Parameter Setting
The gas source distribution position and gas load in the vacuum chamber are the key factors that affect the pressure distribution in the vacuum chamber. Therefore, when simulating the transport process of gas molecules in the NBI vacuum chamber, the gas source had to be set strictly according to the analysis and calculation results. The two most important gas sources are the outlet of the neutralizers and the ion dumps. The outlet gas molecules from the two neutralizers are arranged in a cosine distribution and the gas flow rate is 4.892 . The amount of gas generated by the beam power deposition at the two ion dumps is 26% and the gas flow rate is 0.58 . The gas generated by beam collision everywhere in the vacuum chamber is also arranged in the form of a cosine distribution according to the analysis results.
Under actual working conditions, the low-temperature condensation surface is surrounded by an 80 K radiation baffle. The gas molecules first collide with the radiation baffle and then are condensed by the low-temperature surface. Therefore, the temperature of the gas molecules that collide with the simplified low-temperature condensation surface was set at 80 K. The cryopump adopts a classic chevron radiation baffle, and the transmission probability for gas molecules on the surface of the cryogenic condensation surface is 0.23 [8,9]. Since the beam collides with the ion dumps, calorimeters, etc., there is a significant rise in temperature, and the temperature has a greater impact on the movement of gas molecules in the vacuum environment. Therefore, the temperature for the inner wall of the neutralizers, the inner wall of the ion dumps, the inner surface of the calorimeters, the inner wall of the bending magnets, and the surface of the gas baffle was set at 600 K. The temperature of the surfaces of the outer walls of the neutralization chamber, ion dumps, calorimeters, and bending magnets is 400 K [10,11,12].
3.3. Simulation Results and Analysis
When simulating the pressure distribution in the vacuum chamber, a plane 200 mm away from the low-temperature condensation surface was selected in each area of the vacuum chamber, and the average pressure of this plane was used to represent the pressure in the three areas of the vacuum chamber. To simulate the pressure change in the vacuum chamber under the conditions of a 400 s long-pulse operation, the gas intake time of each gas source was set to 400 s, and the pressure situation of each area of the vacuum chamber over time was obtained, as shown in Figure 3, Figure 4 and Figure 5.
In the figure below, the abscissa is time with the unit s and the ordinate is the selected plane pressure with the unit mbar. We had to calculate the average pressure of the selected plane every 0.4 s. It can be observed from Figure 3, Figure 4 and Figure 5 that, during the entire 400 s long-pulse, as the cryopump continues to pump out the gas load, the gas condensation and desorption in the NBI vacuum chamber are in dynamic equilibrium and the pressure fluctuation is small. The pressure in the neutralized area, bending-magnet area and drift-pipe area are maintained at 4.2 Pa, 7 Pa, and 2.7 Pa.
In order to better observe the changes in the pressure in the vacuum chamber in a short period of time after intake, the intake time was set to 1 s and the plane 200 mm away from the low-temperature condensation surface in the vacuum chamber was also selected as the representative plane. The average pressure on this plane represents the pressure of each area in the vacuum chamber, and the software was set to calculate the average pressure of the selected representative plane every 0.001 s. The simulation results are shown in Figure 6, Figure 7 and Figure 8. The abscissa in the figure is time with the unit s and the ordinate is the average pressure of the selected plane with the unit mbar. It can be observed from Figure 6, Figure 7 and Figure 8 that, within 0.1 s after gas intake, the pressure in each area of the vacuum chamber reaches a dynamic equilibrium, indicating that the pumping speed of the designed vacuum system fully meets the requirements of the NBI for a vacuum environment.
Similarly, a plane with a distance of 200 mm from the low-temperature condensation surface in each area of the vacuum chamber was selected to simulate the pressure situation at each position of the entire vacuum chamber after dynamic equilibrium had been reached. In the pressure distribution diagrams shown in Figure 9, Figure 10 and Figure 11, the abscissa is 100 equal parts of the selected plane along the beam transmission direction, the ordinate is the average pressure of the small plane of each equal part, and the unit is mbar. Figure 9 shows that the maximum pressure in the neutralized area of the vacuum chamber is located near the first gas baffle and the maximum value is 7 Pa. This is due to a large number of gas molecules colliding with the gas baffle during differential pumping, which changes the direction of movement and means that the molecules cannot enter the bending-magnet area of the vacuum chamber, resulting in the highest pressure near the gas baffle. It can be observed from Figure 10 and Figure 11 that the maximum pressure in the bending-magnet zone of the vacuum chamber is located at the gas baffles on both sides and the maximum value is 1.1 Pa. The maximum pressure in the drift-pipe area of the vacuum chamber is located at the left gas baffle and the maximum value is 4.3 Pa.
The distribution of the gas load at different positions in the vacuum chamber affects the heat-load distribution on the low-temperature condensation surface. The heat load is evenly distributed, which is beneficial to the long-term stable operation of the cryopump. The arithmetic average velocity of the gas molecules is used to replace the collision velocity of the gas molecules and the wall of the low-temperature condensation surface. The greater the density of the gas molecules is, the greater the thermal load is on the low-temperature condensation surface, and the gas density distribution nephogram of the low-temperature condensation surface on the side of the vacuum chamber can be obtained from this relation. Figure 12 shows that the gas density in the neutralized area of the vacuum chamber is the largest and that in the drift-pipe area is the smallest. Since the outlet of the neutralizers is the main gas source, the density of the low temperature condensation surface near the outlet of the neutralizers is the largest, reaching 1.112 . The heat-load distribution on the low-temperature condensation surface of each area of the vacuum chamber is relatively uniform, which is conducive to the steady-state operation of the cryopump.
From the above simulation analysis of the gas molecule transport process in the vacuum chamber, it can be concluded that, under the 400 s long-pulse operation condition, as the low-temperature condensation surface is continuously pumped, the pressure in the vacuum chamber reaches dynamic equilibrium at about 0.1 s. The maximum pressure in the neutralized area of the vacuum chamber is 7 Pa, the maximum pressure in the bending-magnet area is 1.1 Pa, and the maximum pressure in the drift-pipe area is 4.3 Pa, lower than the values of 1 Pa, 4 Pa, and 1 Pa set. Therefore, the designed vacuum system can obtain a suitable vacuum pressure gradient and meet the requirements of the vacuum environment during the beam generation and transmission process.
4. Conclusions
Assessing the upgraded EAST-NBI structure, Molflow software was used to simulate the transport phenomenon of gas molecules in the vacuum chamber. Test planes were selected in the three regions of the vacuum chamber. According to the transient average pressure of the selected plane and the equilibrium pressure distribution, the pressure distribution of the entire vacuum chamber was obtained, and the gas density distribution of the low-temperature condensation surface was simulated to obtain the heat-load distribution. The simulation results were as follows: the vacuum system based on the upgraded NBI design could ensure that the neutralized area, bending-magnet area, and drift-pipe area of the NBI vacuum chamber resulted in pressures of 4.2 Pa, 7 Pa, and 2.7 Pa within about 0.1 s, and the heat loads on the low-temperature condensation surfaces on both sides of the vacuum chamber were evenly distributed.
Compared with the existing NBI vacuum system, the most notable feature of the upgraded vacuum system is that the pumping speed in the drift-pipe area was increased from to and the gas flow rate was reduced from 0.194 to 0.116 . This greatly reduced the dynamic vacuum pressure in the drift-pipe area of the vacuum chamber during intake. According to the simulation analysis, it could be reduced from about 8 Pa to 3 Pa under the same parameter conditions. The reduction of the vacuum pressure in the drift pipe area would greatly reduce the re-ionization of the high-energy neutral beam and improve the efficiency of neutralization and Neutral beam injection. Therefore, the optimization of the design of the EAST-NBI vacuum system provides a basis for subsequent engineering to realize the upgrade of the NBI vacuum chamber and vacuum system. At the same time, the vacuum system design and analysis methods used in this paper can also provide references for subsequent vacuum system design for the same type of device.
Author Contributions
Conceptualization, G.W., C.C., N.T., J.L. and Y.X.; Methodology, Y.X.; Software, S.Z.; Verification, S.Z. and Y.X.; Formal analysis, S.Z.; Investigation, S.Z.; Resources, S.Z.; Data management, S.Z.; Writing-manuscript preparation, S.Z.; writing—Review and edit, Y.X.; visualization, S.Z.; supervision, Y.X.; project management, Y.X.; fund acquisition, Y.X. All authors have read and agreed to the published version of the manuscript.
Funding
This research was funded by EAST Performance Improvement grant number E05AH105l1. And The APC was funded by Hefei institutes of Physical Science Chinese Academy of Sciences.
Institutional Review Board Statement
Not applicable.
Informed Consent Statement
Not applicable.
Data Availability Statement
The data that support the findings of this study are available from the corresponding author upon reasonable request. The data that supports the findings of this study are available within the article.
Conflicts of Interest
The authors declare no conflict of interest.
References
- Hu, C. Conceptual Design of Neutral Beam Injection System for East. Plasma Sci. Technol. 2012, 14, 567–572. [Google Scholar] [CrossRef]
- Simonin, A.; Blondel, C.; Chaibi, W.; Dechelle, C.; Drag, C.; Villedieu, E. Towards a maintainable and high efficiency neutral beam system for future fusion reactors. Nucl. Fusion 2021, 61, 046003. [Google Scholar] [CrossRef]
- Zhang, X.; Wang, X.; Hu, C.; Jiang, C.; Xie, Y.; Zhao, Y. The development of data acquisition and processing application system for RF ion source. Plasma Sci. Technol. 2017, 19, 075602. [Google Scholar] [CrossRef]
- Chang, D.; In, S.; Lee, K.; Jin, J.; Chang, D.; Jeong, S.; Oh, B.; Bae, Y.; Park, Y.; Yang, H.J.F. Design of neutral beam injection system for KSTAR tokamak. Fusion Eng. Des. 2011, 86, 244–252. [Google Scholar] [CrossRef]
- Hu, C.; Xie, Y.; Xie, Y.; Liu, S.; Xu, Y.; Liang, L.; Jiang, C.; Sheng, P.; Gu, Y.; Li, J.; Liu, Z. Overview of Development Status for EAST-NBI System. Plasma Sci. Technol. 2015, 17, 817–825. [Google Scholar] [CrossRef]
- Xiang, L.; Yongjian, X.; Ling, Y.; Yu, C.; Chundong, H.; Ling, T. Analysis of power distribution on beamline components at different neutralization efficiencies on NBI test stand. Plasma Sci. Technol. 2016, 18, 1215. [Google Scholar]
- Lizhen, L.; Chundong, H.; Yuanlai, X.; Qiang, G.; Yahong, X. Calculation of beam intensity distribution for the neutral beam injection in EAST. Plasma Sci. Technol. 2011, 13, 502. [Google Scholar]
- Lang, J.; Hu, C.; Xie, Y.; Tong, Y. Optimization Analysis of the Structural Design of NNBI Cryosorption Pumps. Energies 2021, 14, 3628. [Google Scholar] [CrossRef]
- Kovari, M.; Clarke, R.; Shephard, T. Compound cryopump for fusion reactors. Fusion Eng. Des. 2013, 88, 3293–3298. [Google Scholar] [CrossRef] [Green Version]
- Kim, K.; Park, H.; Kim, H.; Lee, K.; Song, N.; Kwag, S.; Chang, Y.; Cho, W.; Kim, J.; Jeong, J. Commissioning of vacuum pumping devices of the second KSTAR neutral beam injection system. Fusion Eng. Des. 2019, 146, 1786–1789. [Google Scholar] [CrossRef]
- Hirai, T.; Barabash, V.; Carrat, R.; Chappuis, P.; Durocher, A.; Escourbiac, F.; Merola, M.; Raffray, R.; Worth, L.; Boscary, J. Examinations for leak tightness of actively cooled components in ITER and fusion devices. Phys. Scr. 2017, 2017, 014045. [Google Scholar] [CrossRef]
- Tao, L.; Xie, Y.; Hu, C.; Liu, Z.; Team, N. Numerical analysis of a cooling system for high heat flux components in the neutral beam injection system. Fusion Eng. Des. 2010, 85, 2095–2099. [Google Scholar] [CrossRef]
Figure 1.
Three-dimensional schematic diagram of the existing EAST-NBI vacuum chamber and components.
Figure 1.
Three-dimensional schematic diagram of the existing EAST-NBI vacuum chamber and components.
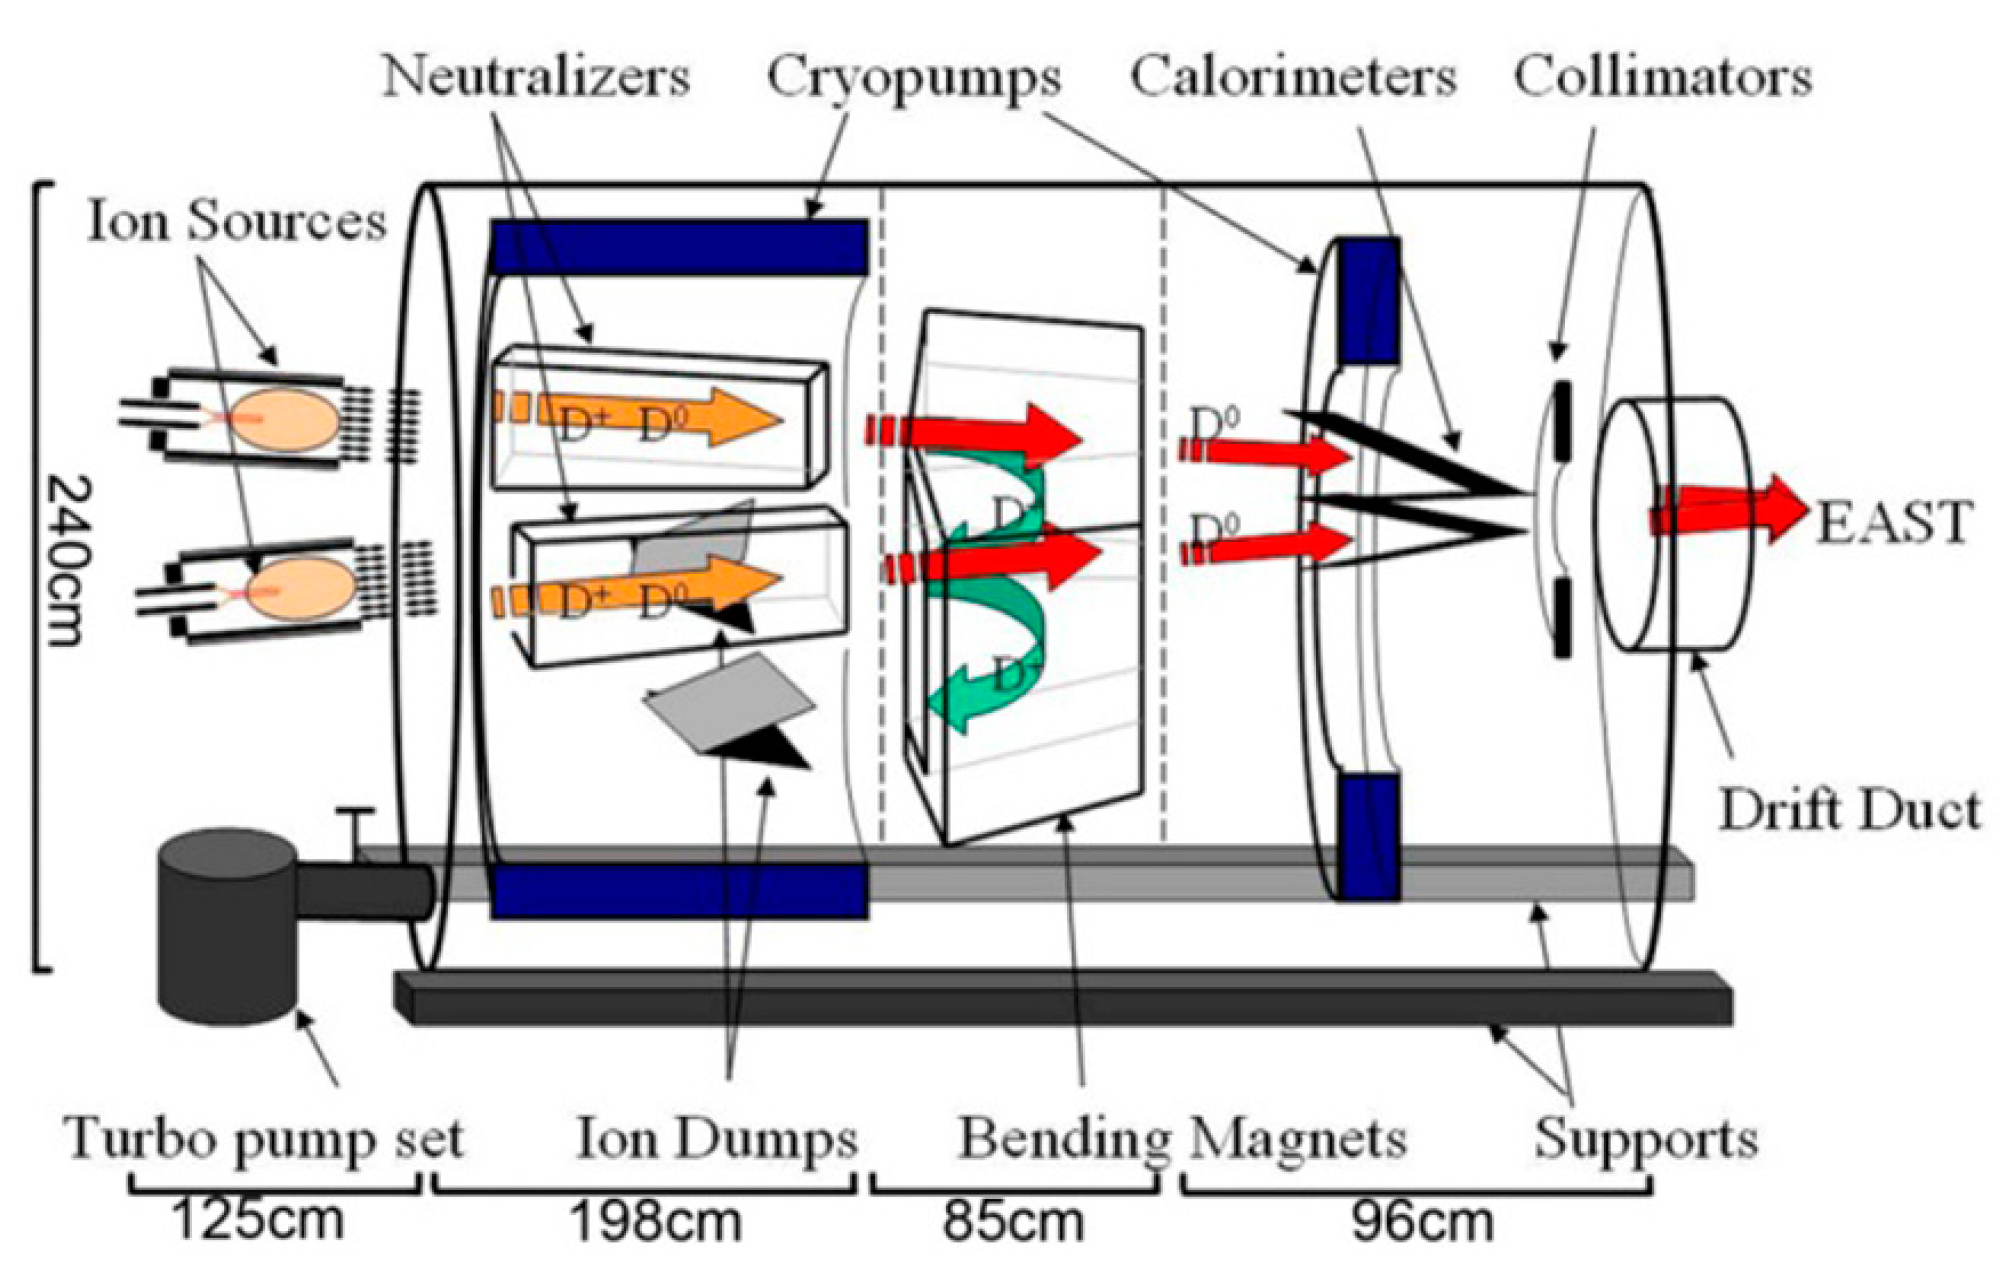
Figure 2.
Three-dimensional schematic diagram of the upgraded NBI vacuum chamber and components.

Figure 3.
The change in the average pressure of the neutralized area of the vacuum chamber over time during the 400 s long-pulse.
Figure 3.
The change in the average pressure of the neutralized area of the vacuum chamber over time during the 400 s long-pulse.

Figure 4.
The change in the average pressure of the bending-magnet area of the vacuum chamber over time during the 400 s long-pulse.
Figure 4.
The change in the average pressure of the bending-magnet area of the vacuum chamber over time during the 400 s long-pulse.

Figure 5.
The change in the average pressure of the drift-pipe area of the vacuum chamber over time during the 400 s long-pulse.
Figure 5.
The change in the average pressure of the drift-pipe area of the vacuum chamber over time during the 400 s long-pulse.
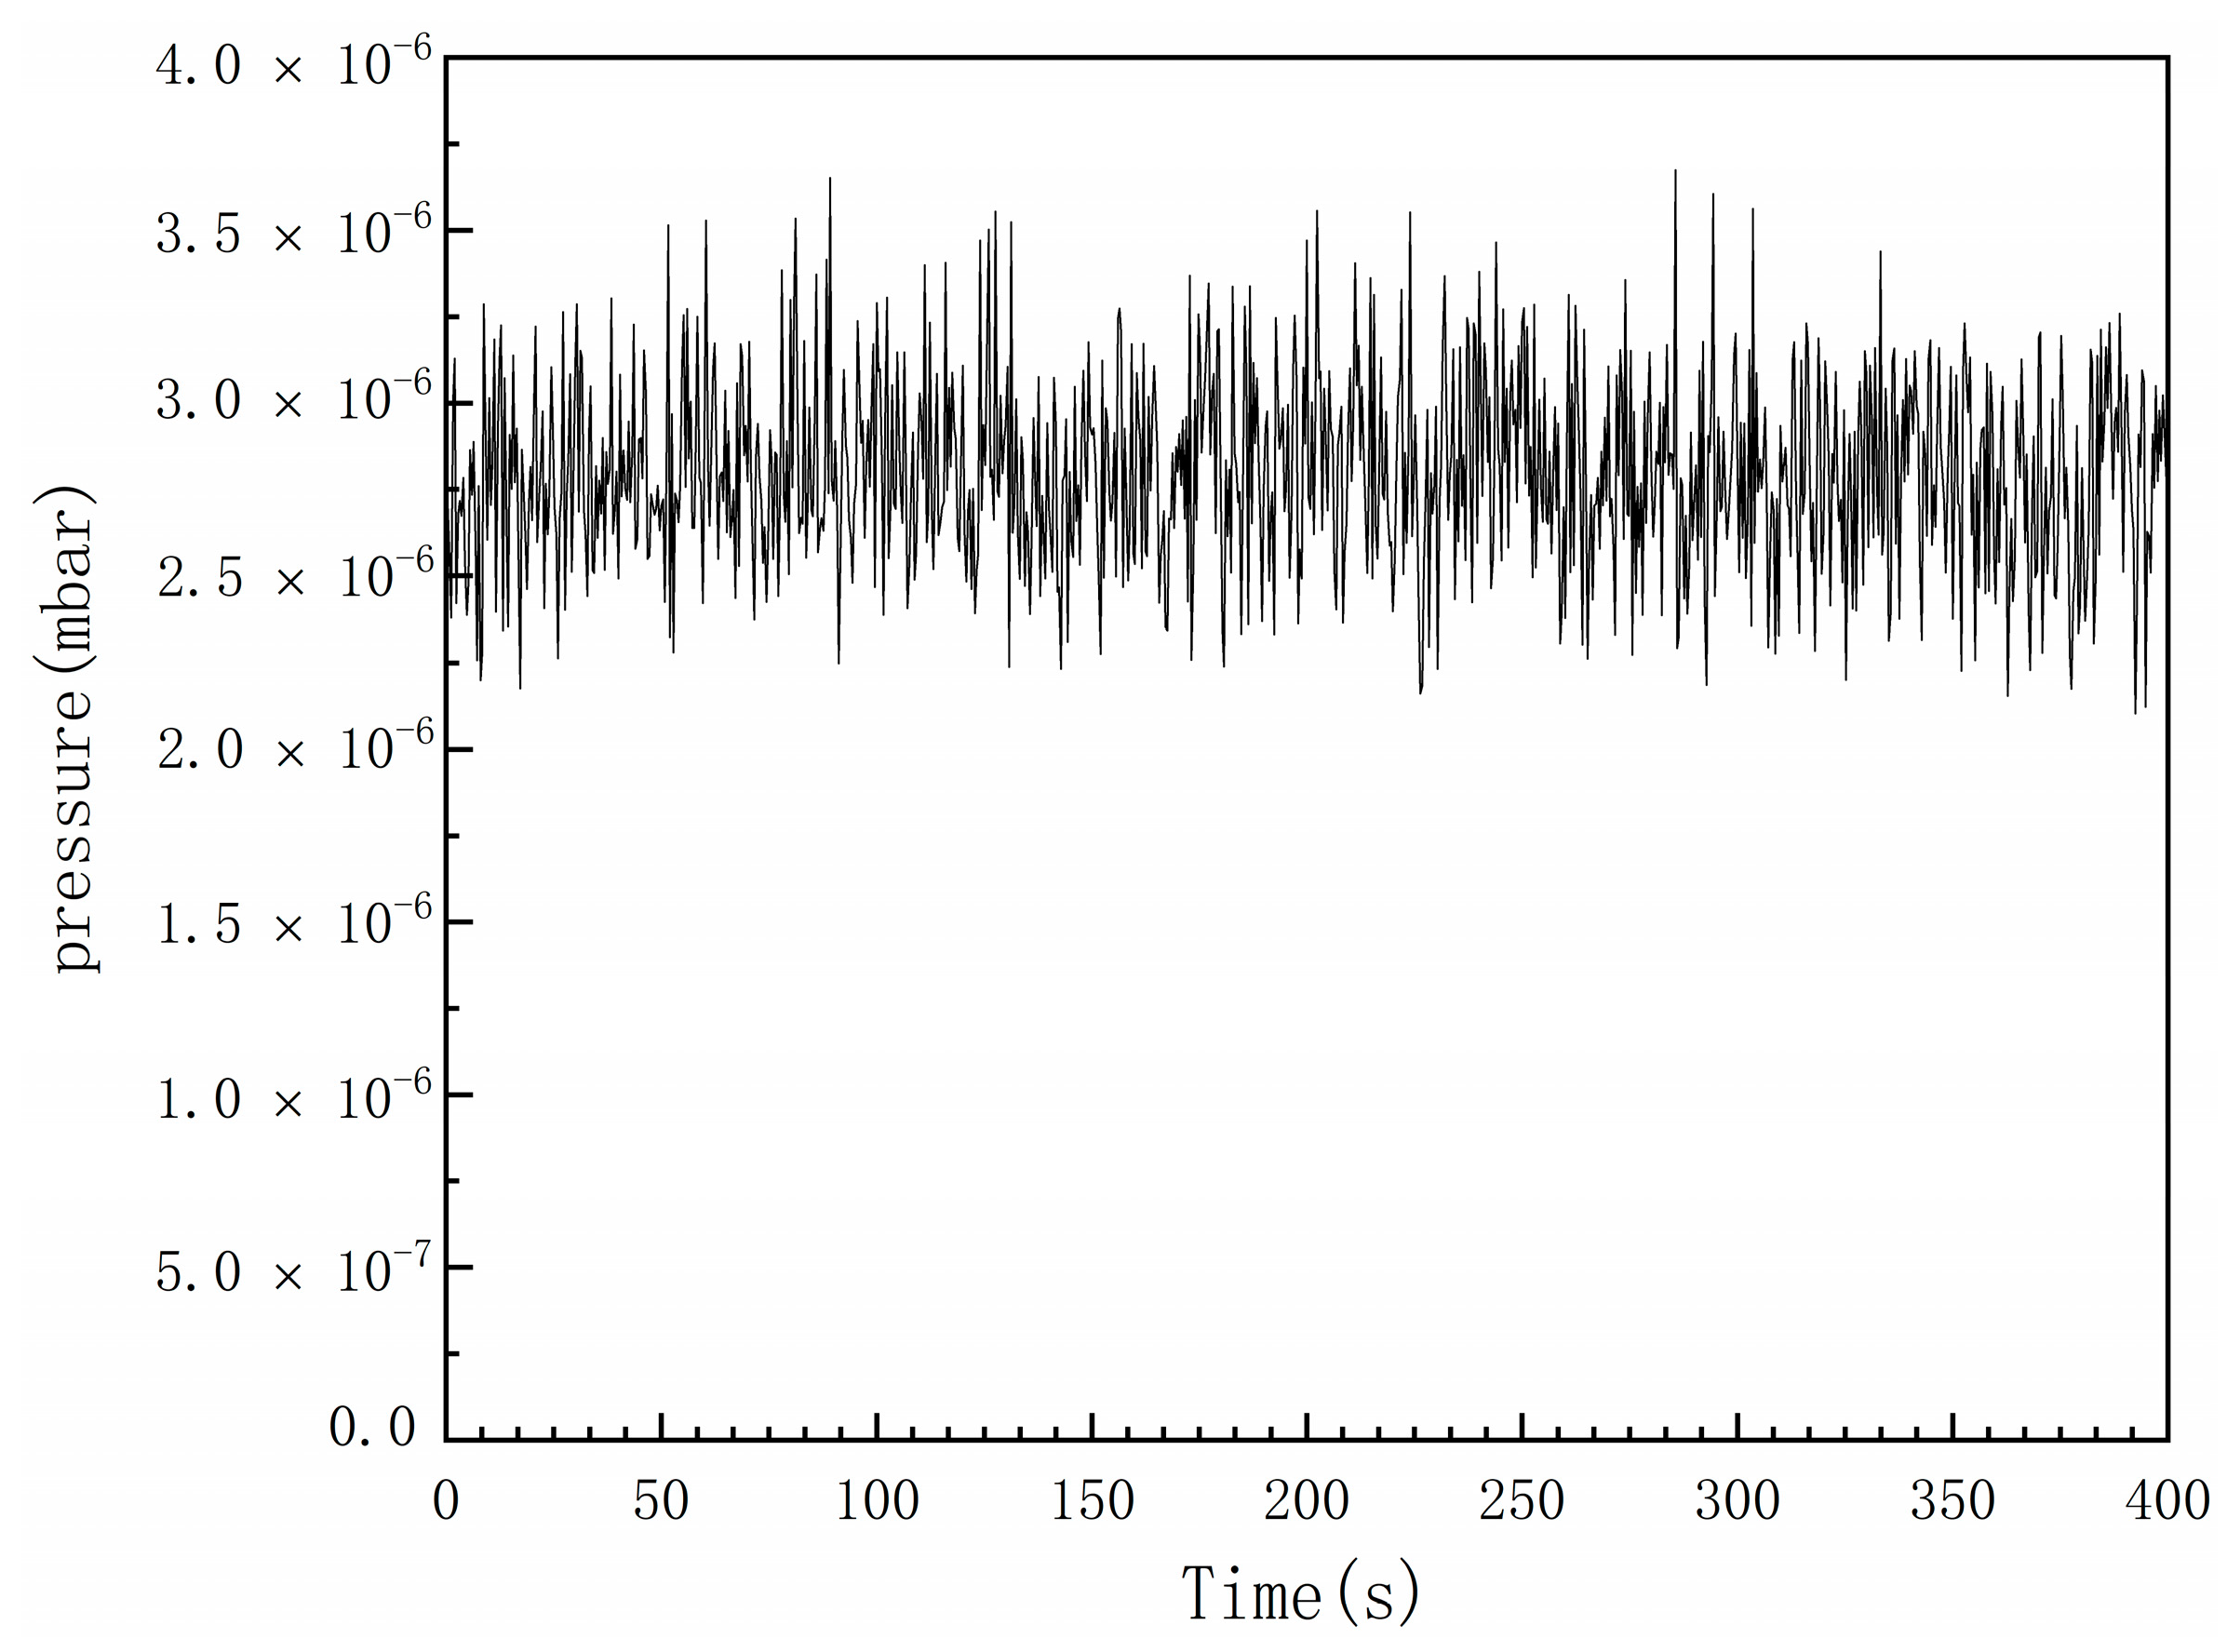
Figure 6.
The change in the average pressure of the neutralized area of the vacuum chamber over time during the 1 s pulse.
Figure 6.
The change in the average pressure of the neutralized area of the vacuum chamber over time during the 1 s pulse.
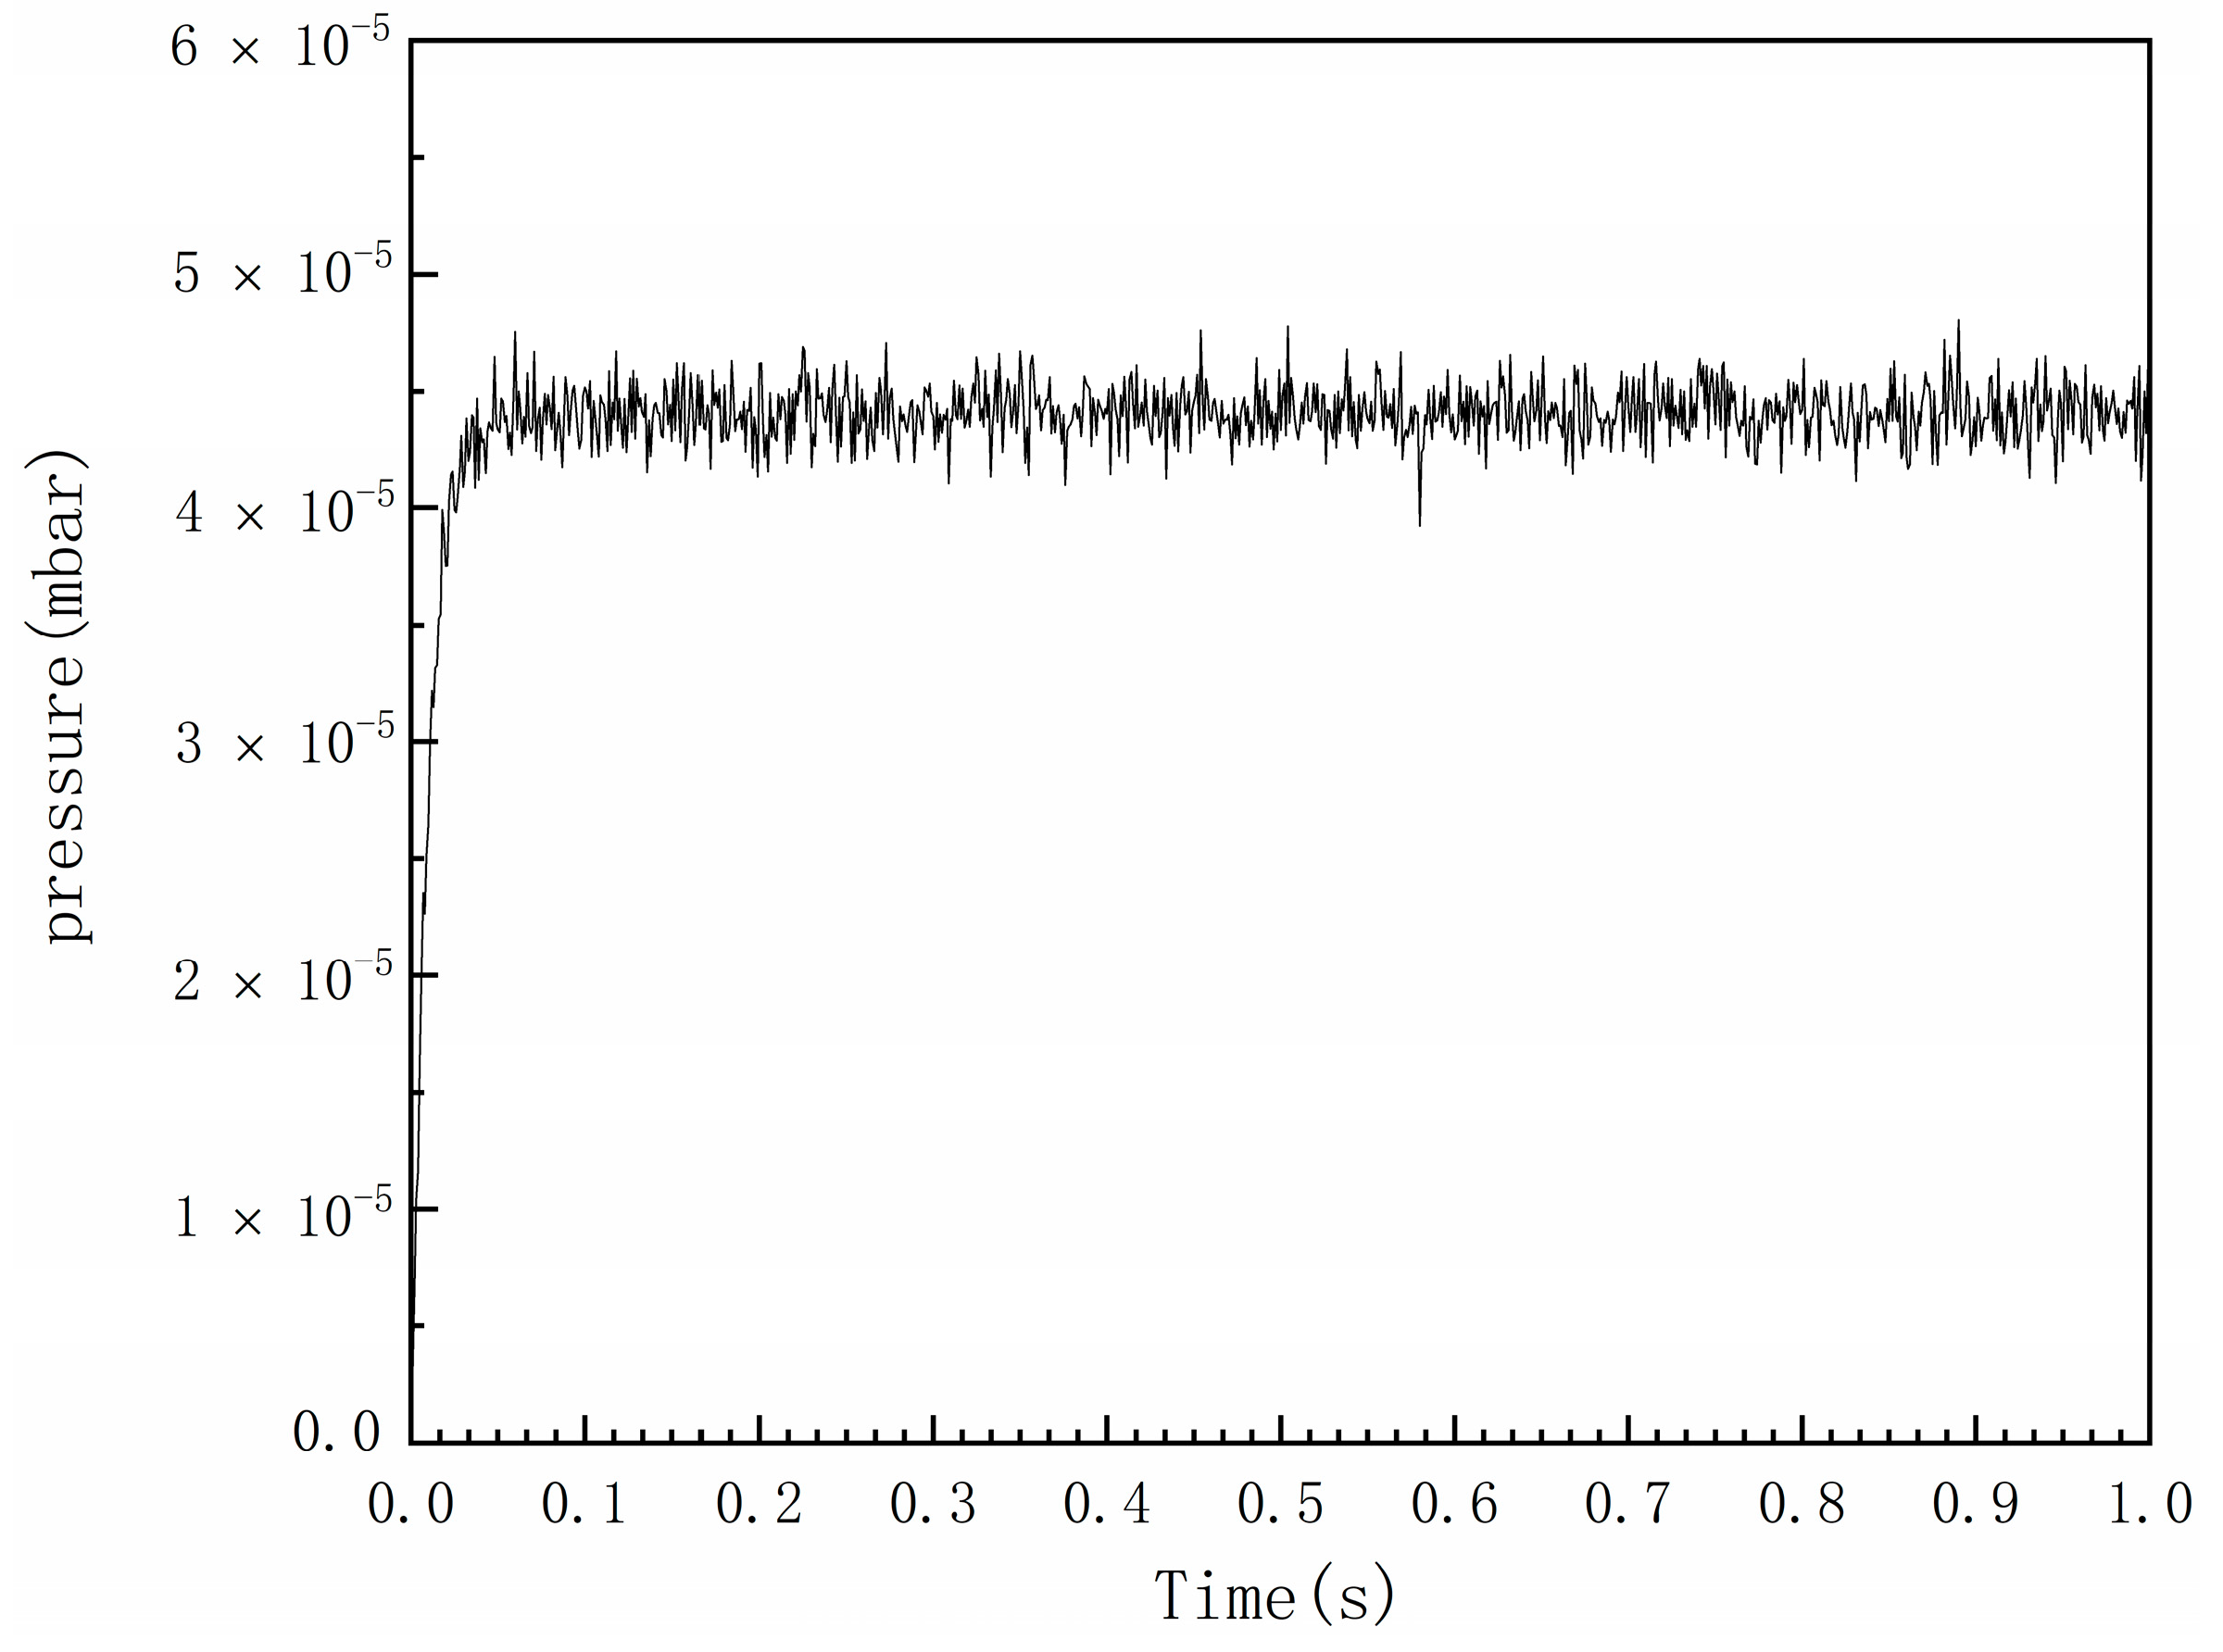
Figure 7.
The change in the average pressure of the bending-magnet area of the vacuum chamber over time during the 1 s pulse.
Figure 7.
The change in the average pressure of the bending-magnet area of the vacuum chamber over time during the 1 s pulse.
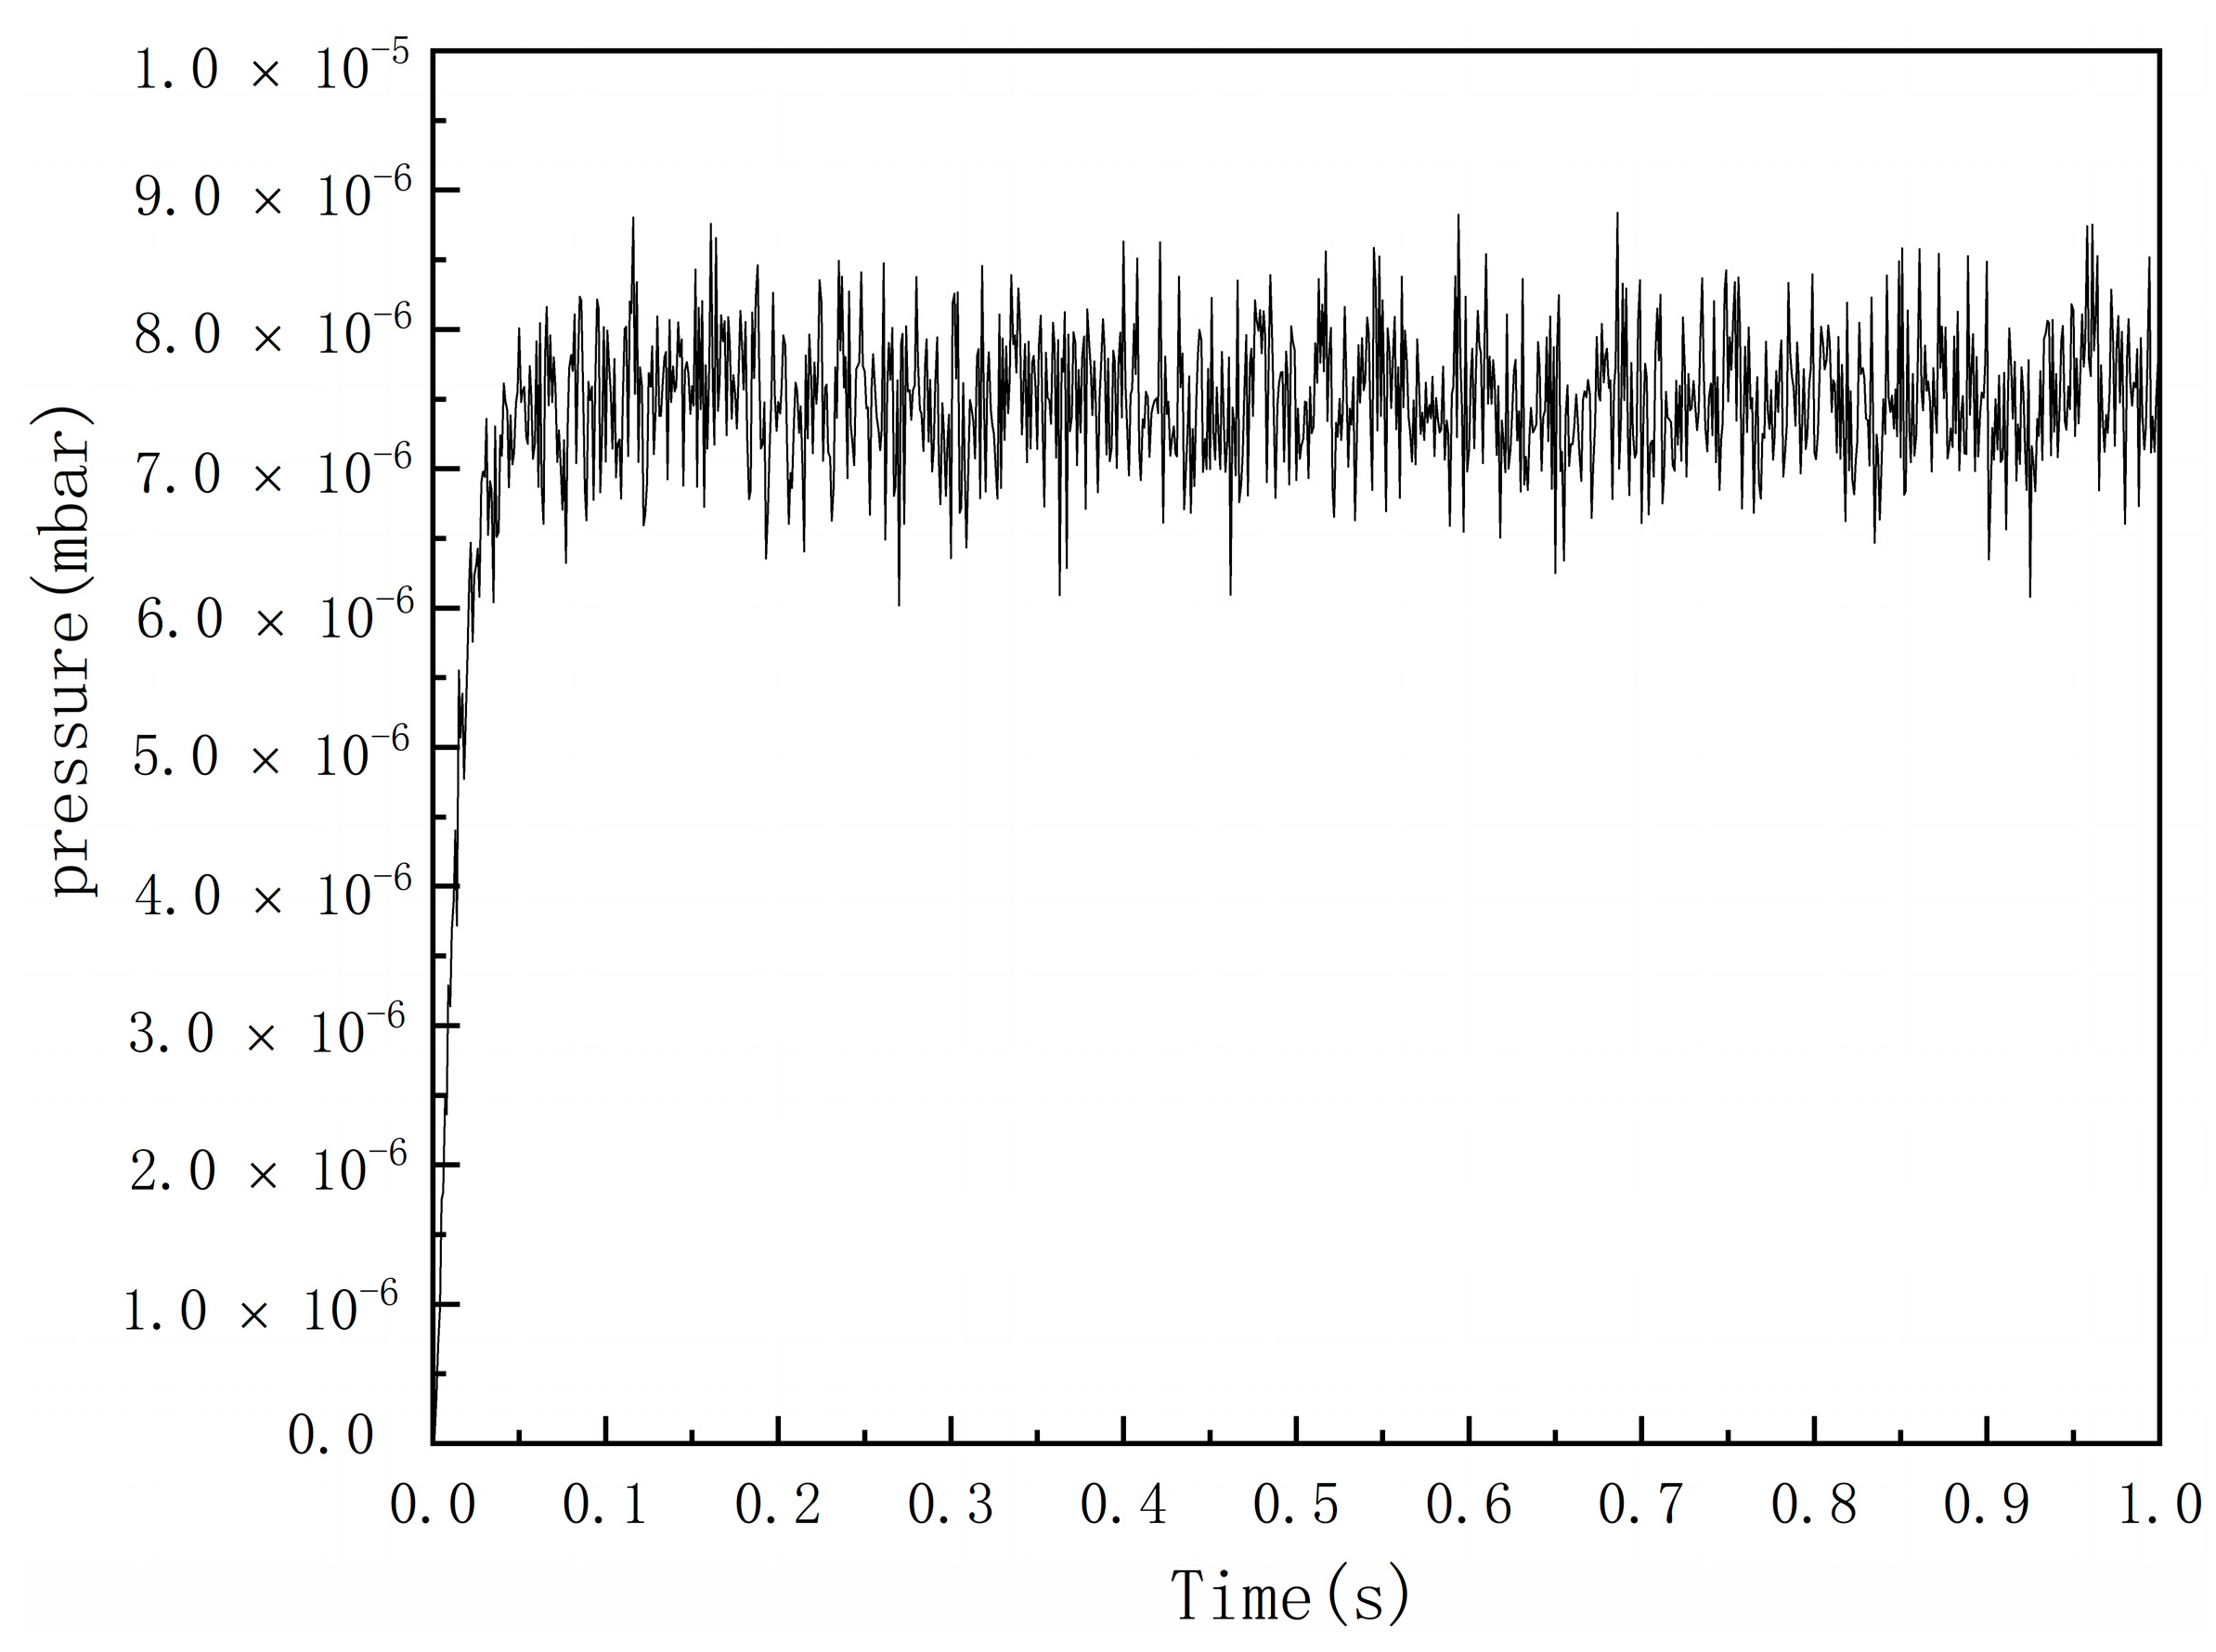
Figure 8.
The change in the average pressure of the drift-pipe area of the vacuum chamber over time during the 1 s pulse.
Figure 8.
The change in the average pressure of the drift-pipe area of the vacuum chamber over time during the 1 s pulse.
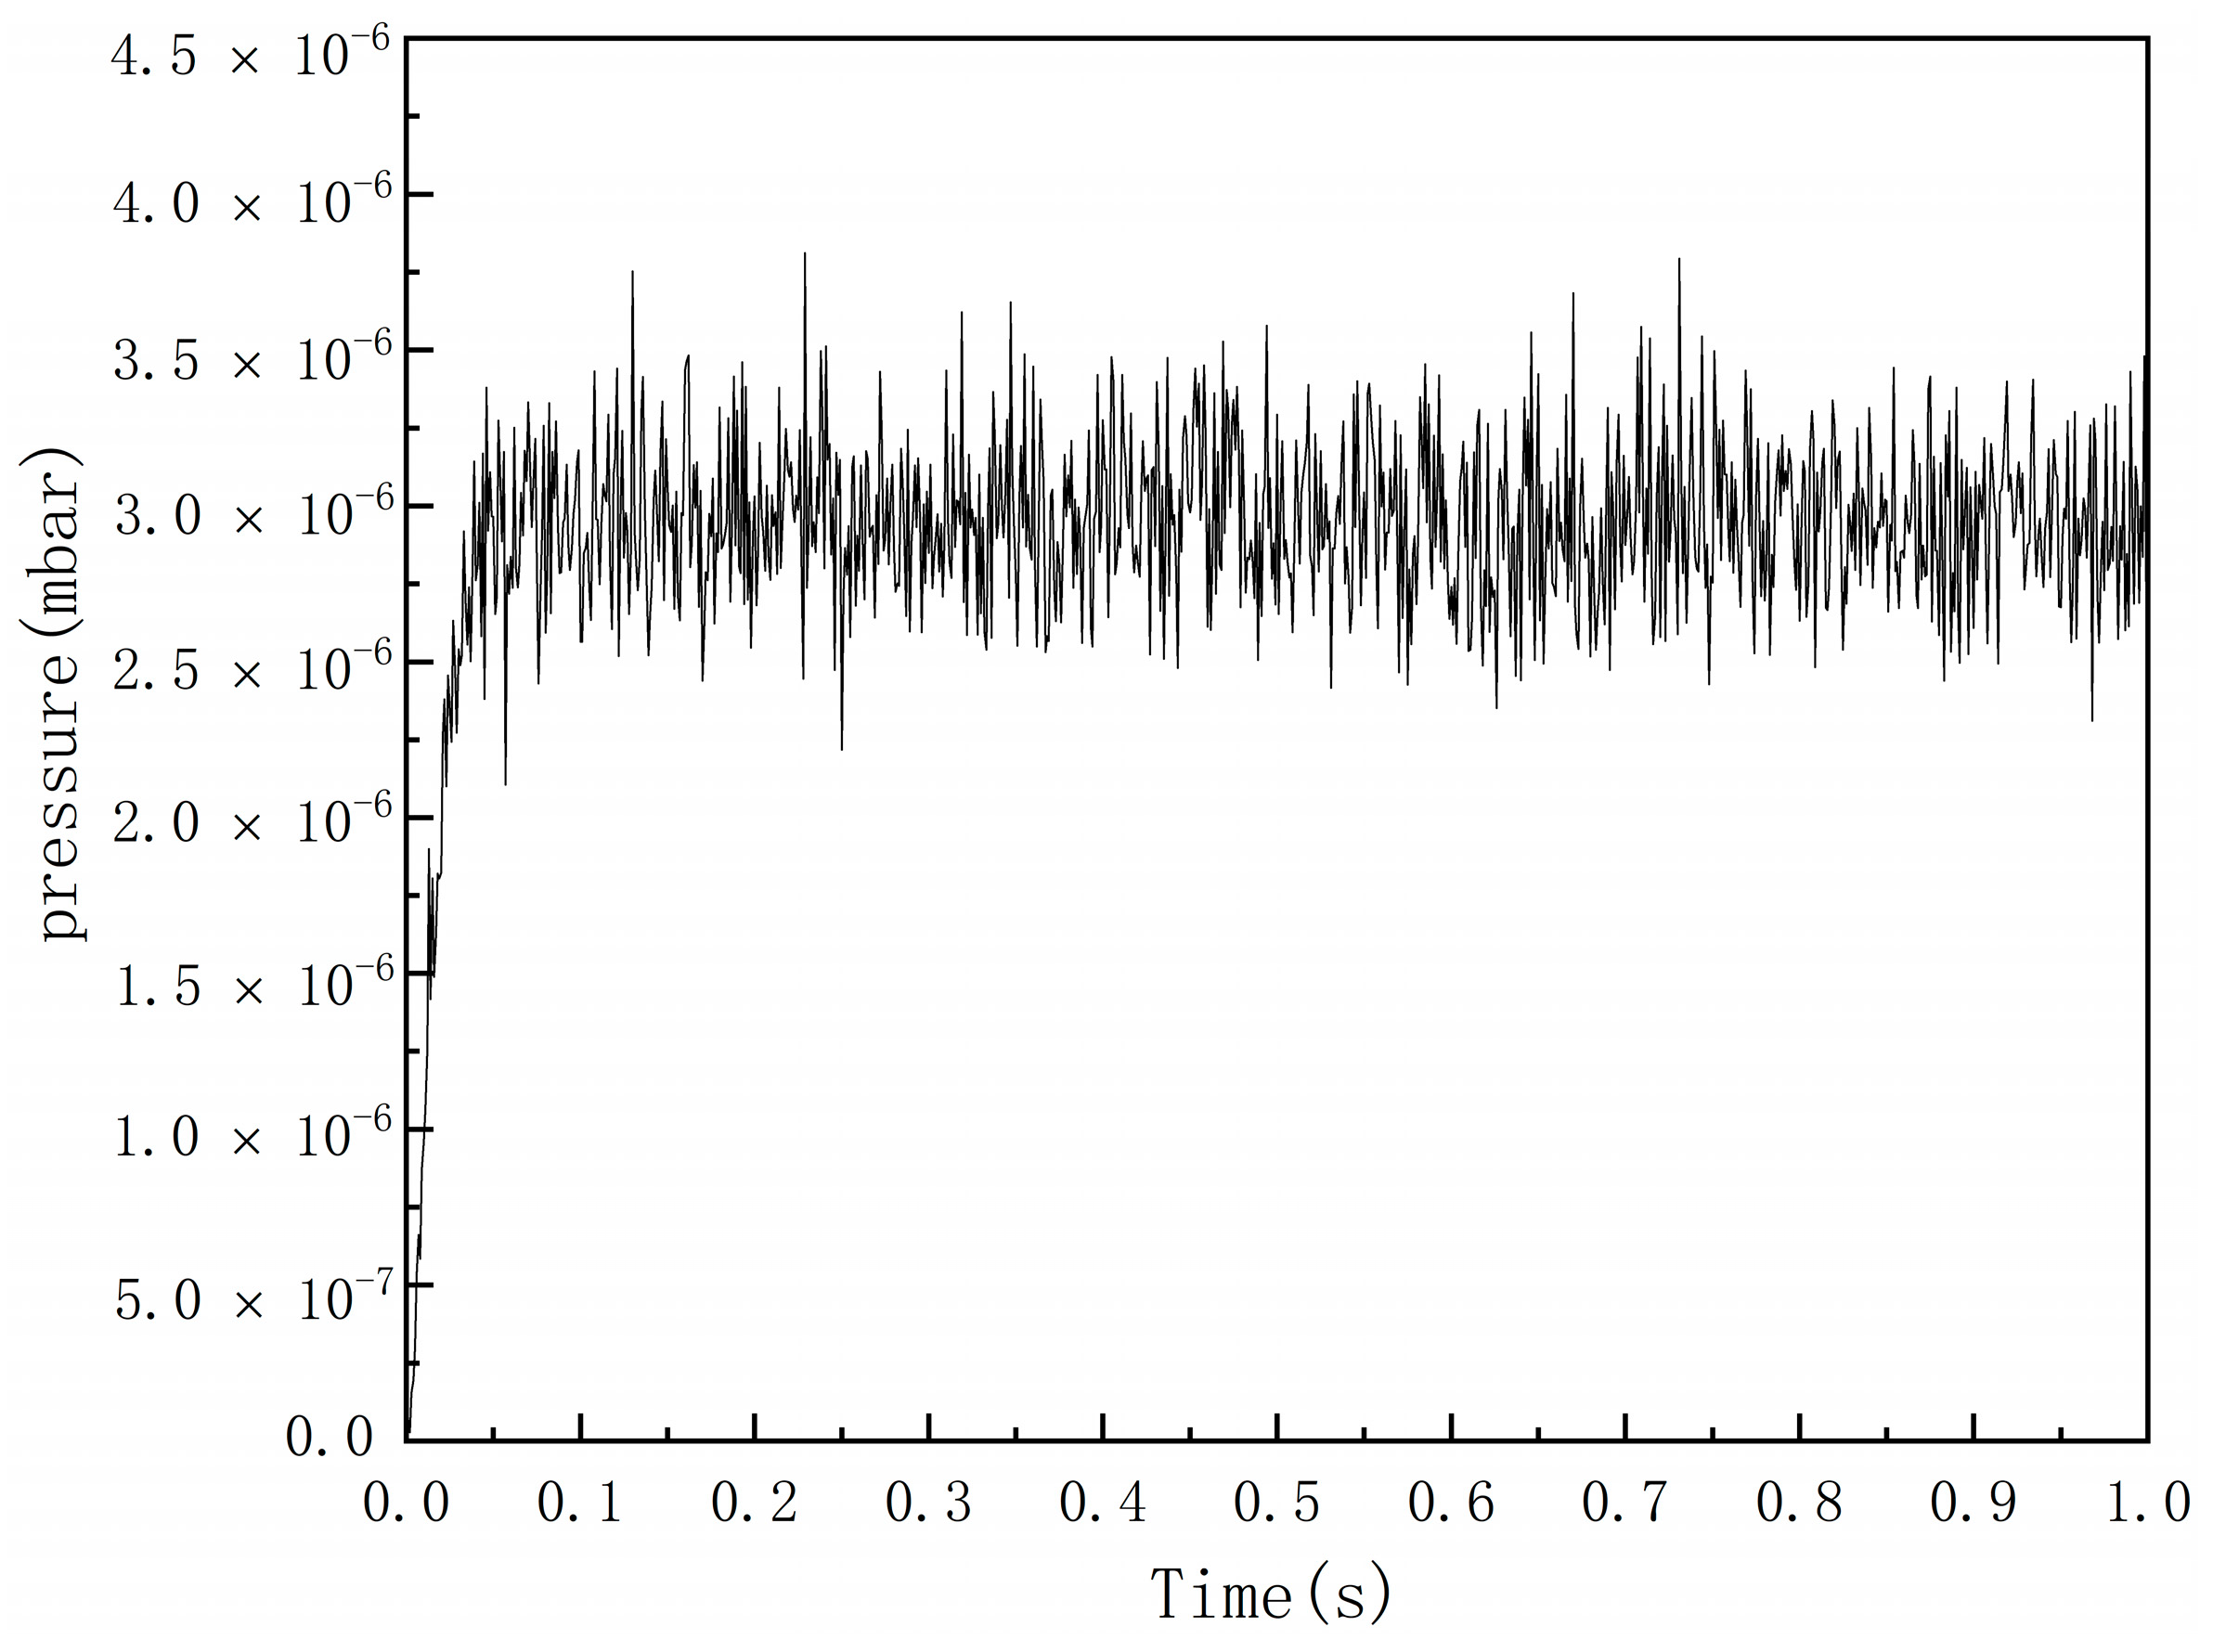
Figure 9.
Pressure distribution in the neutralized area after the vacuum chamber is dynamically balanced.
Figure 9.
Pressure distribution in the neutralized area after the vacuum chamber is dynamically balanced.
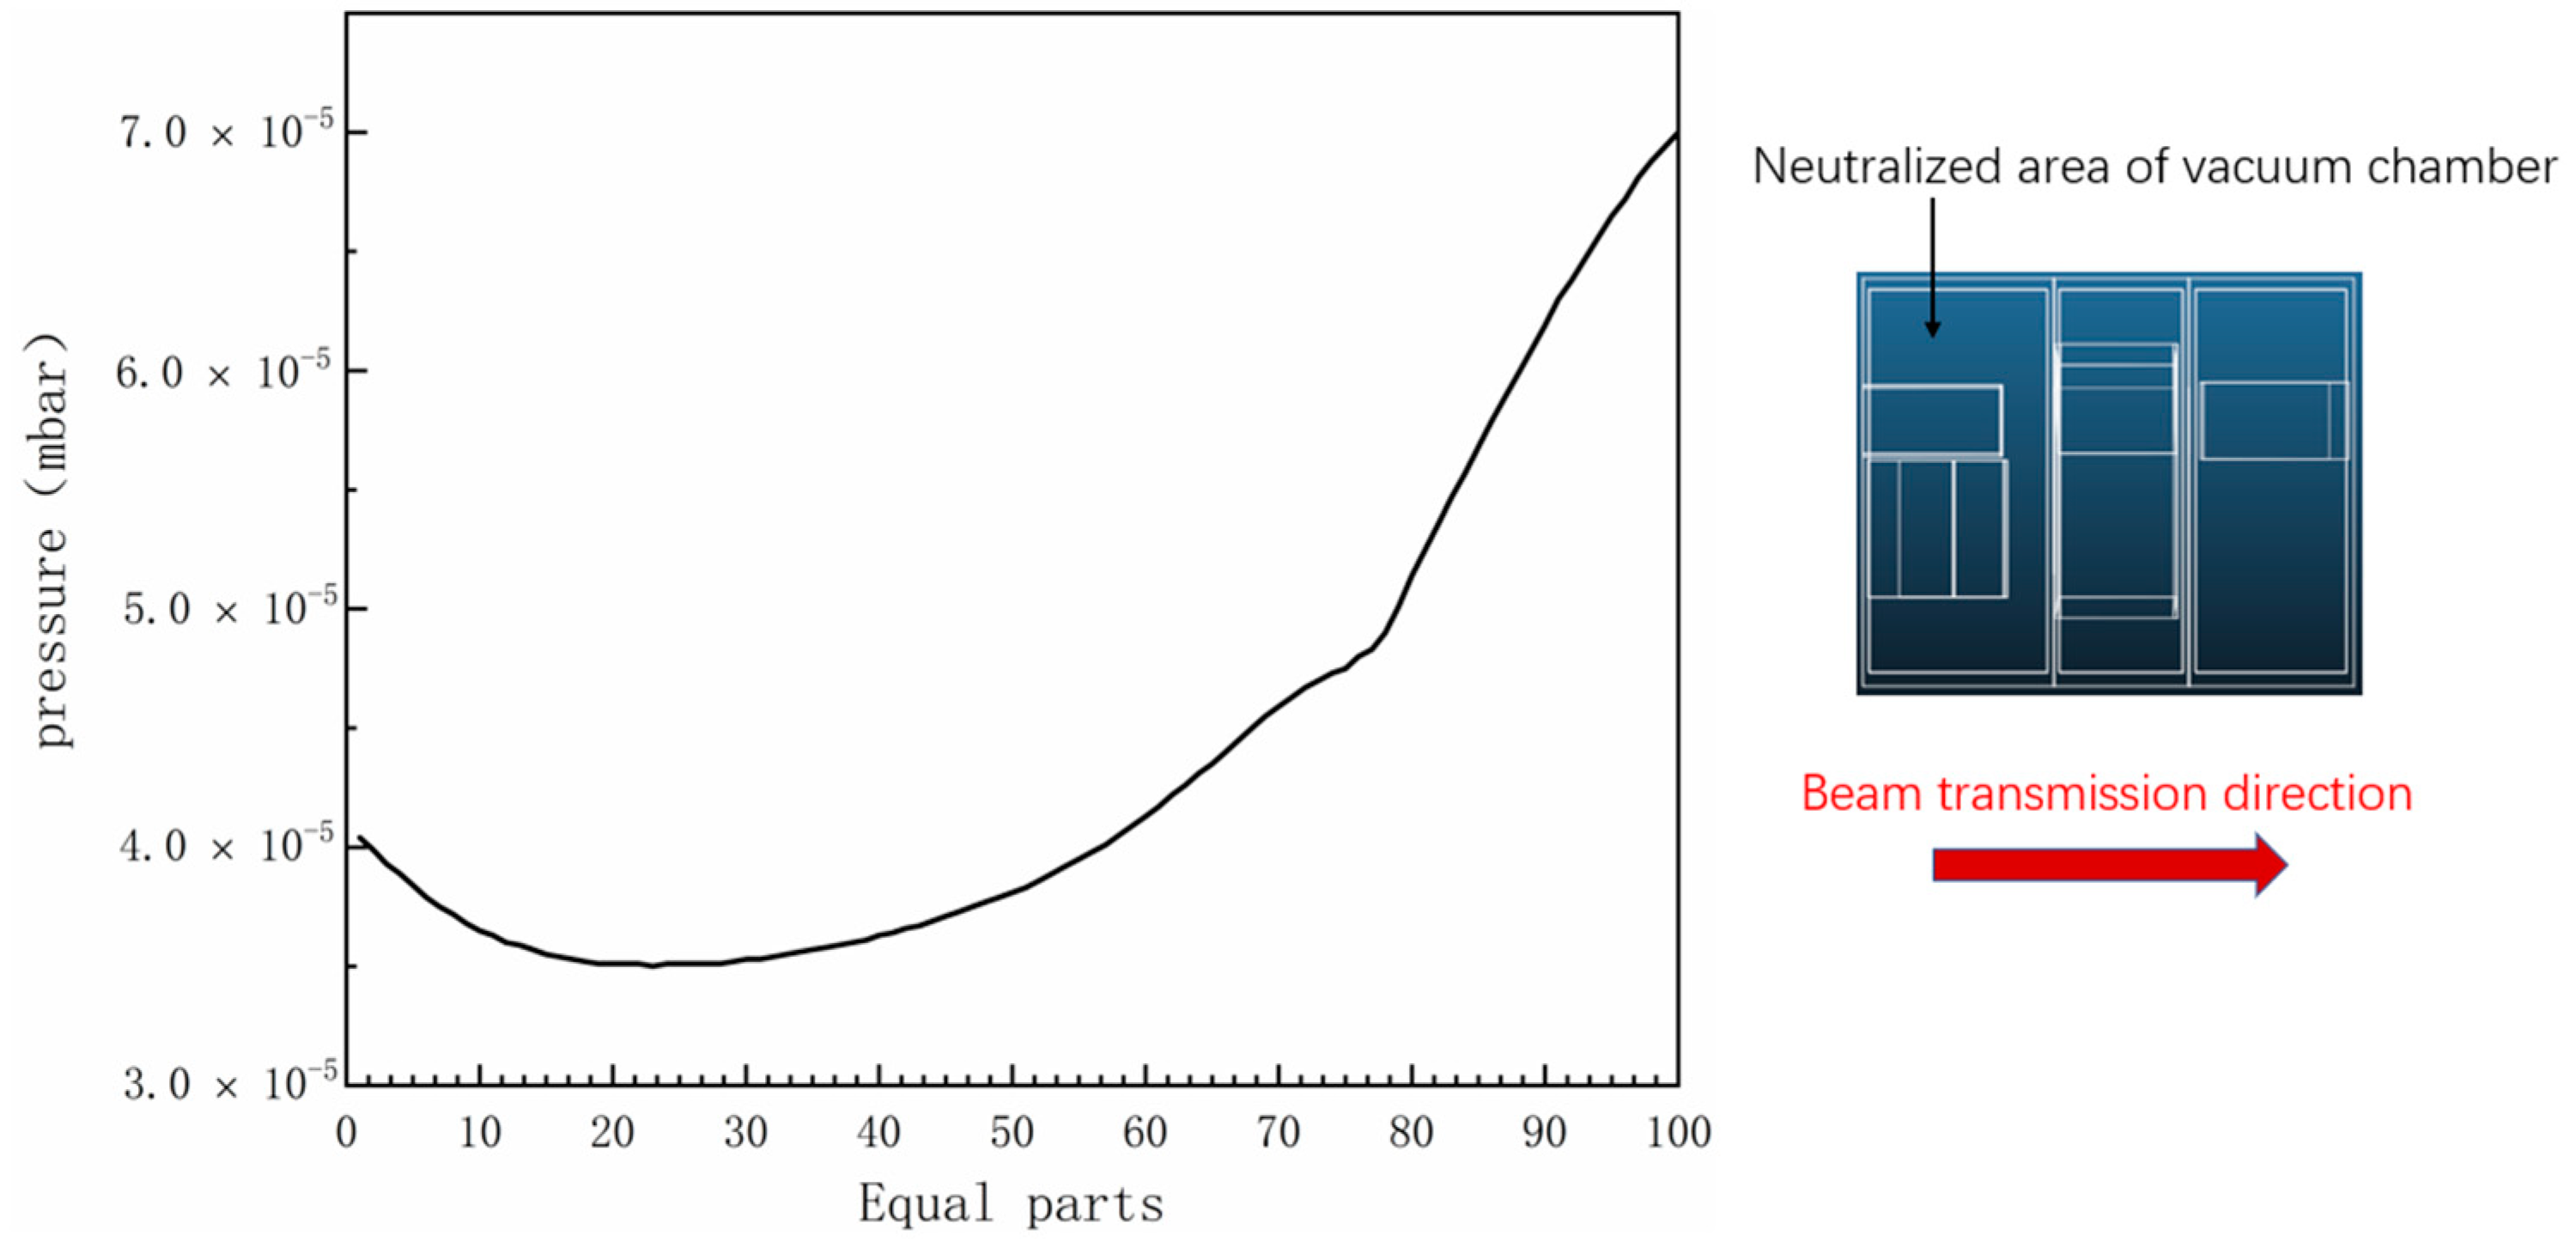
Figure 10.
Pressure distribution in the bending-magnet area after the vacuum chamber is dynamically balanced.
Figure 10.
Pressure distribution in the bending-magnet area after the vacuum chamber is dynamically balanced.
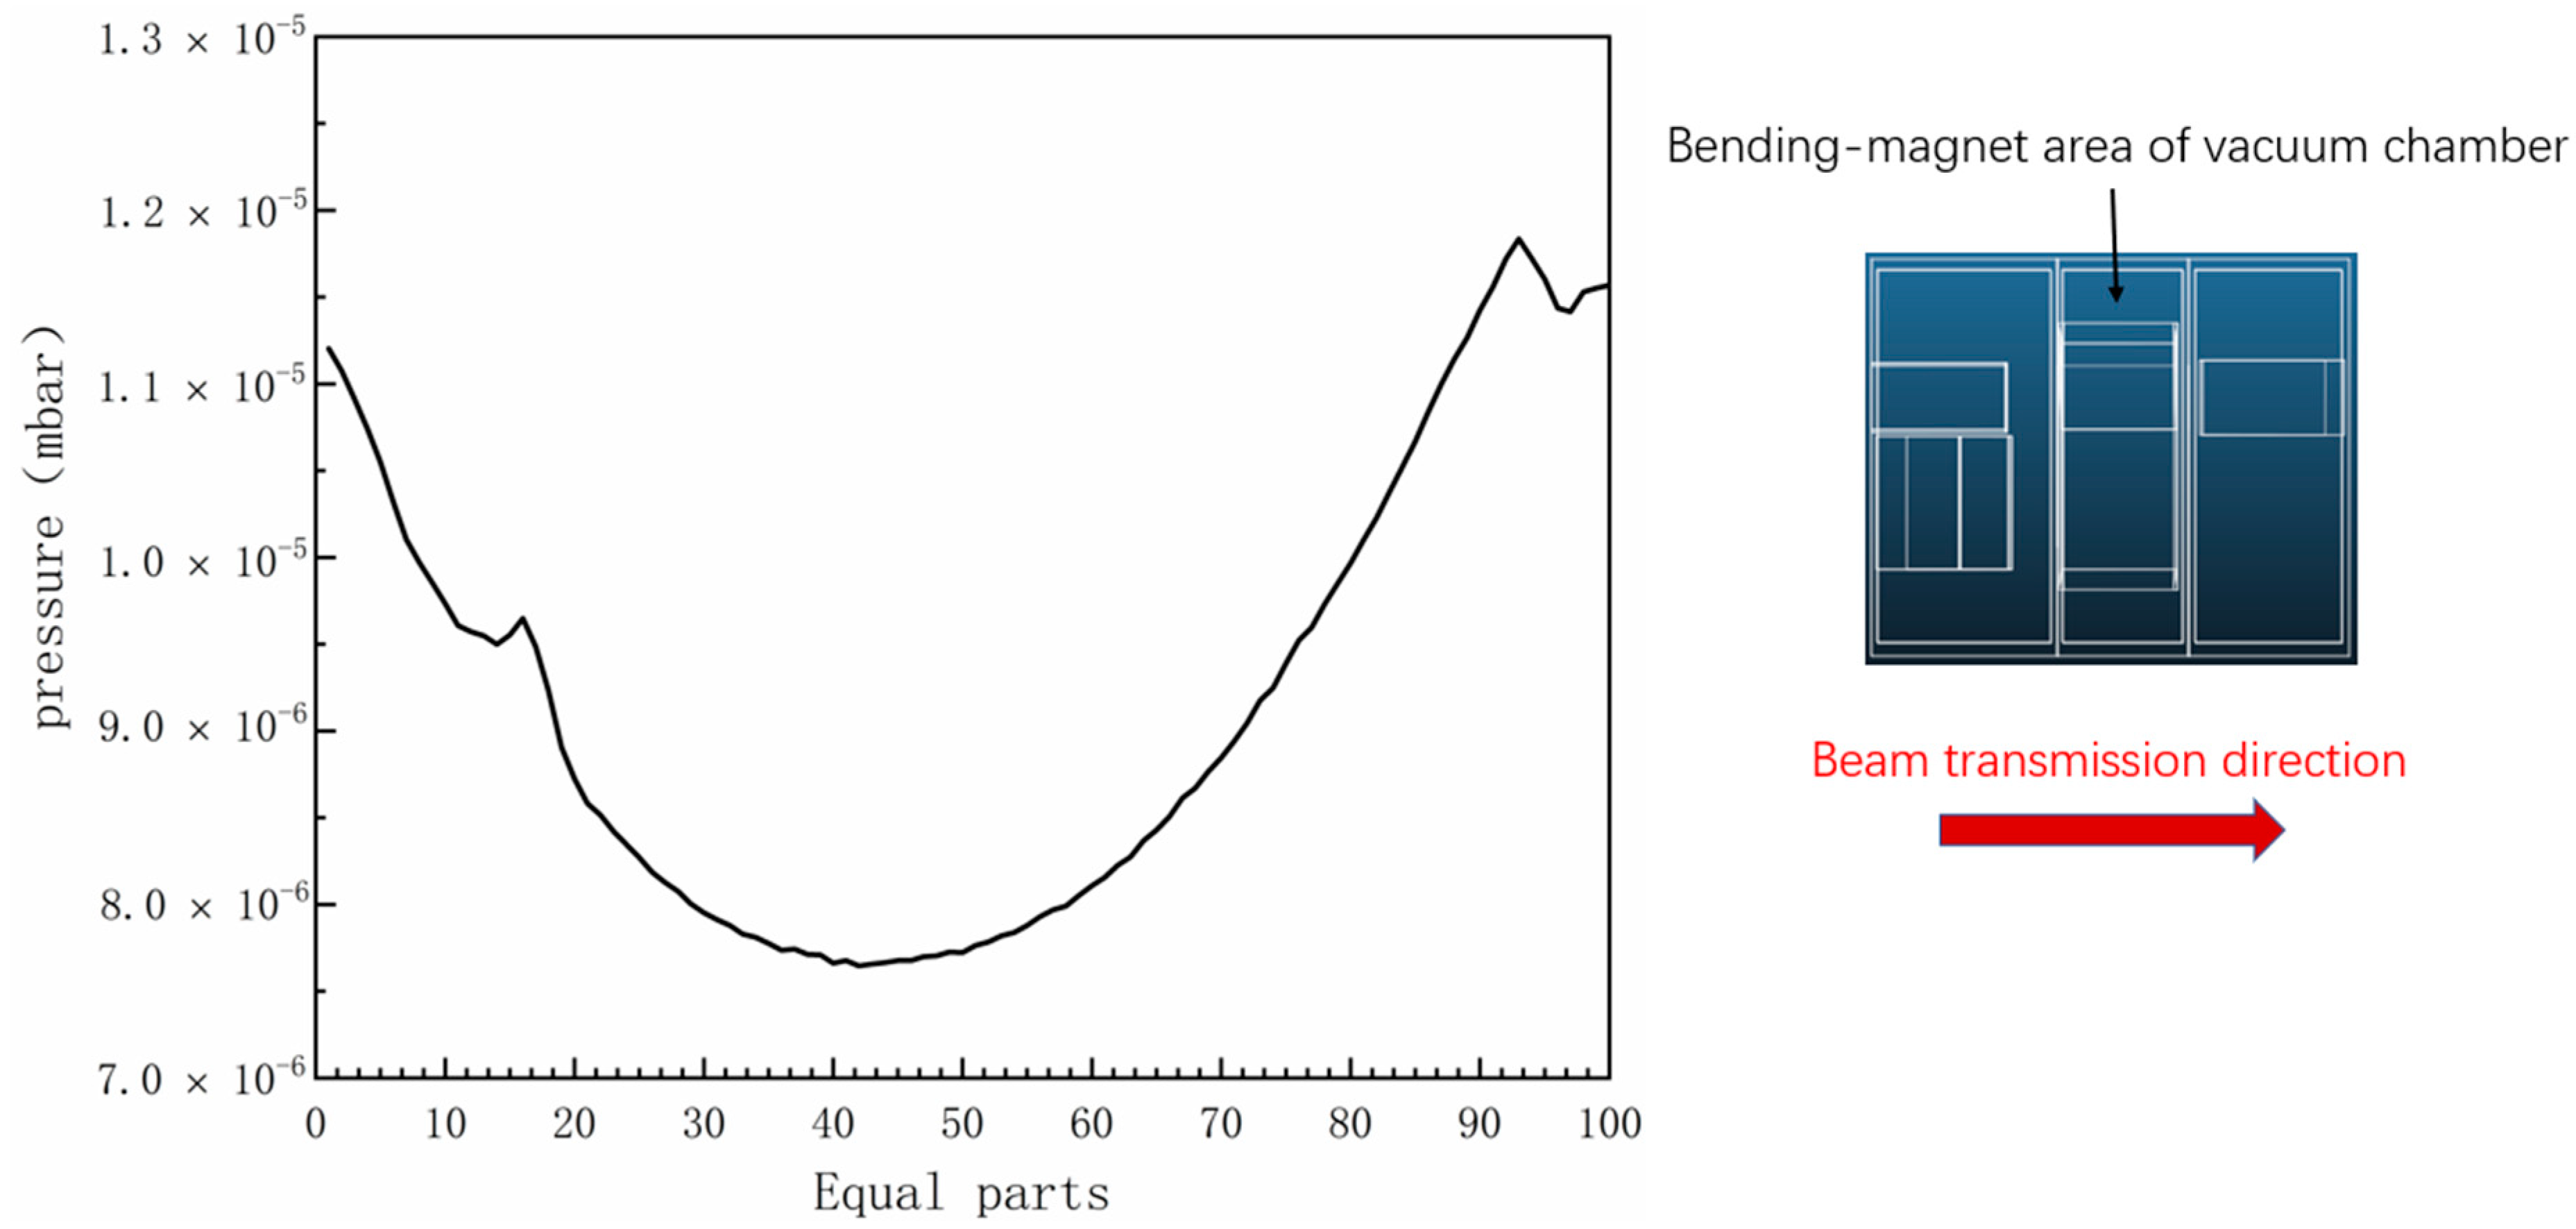
Figure 11.
Pressure distribution in the drift-pipe area after the vacuum chamber is dynamically balanced.
Figure 11.
Pressure distribution in the drift-pipe area after the vacuum chamber is dynamically balanced.
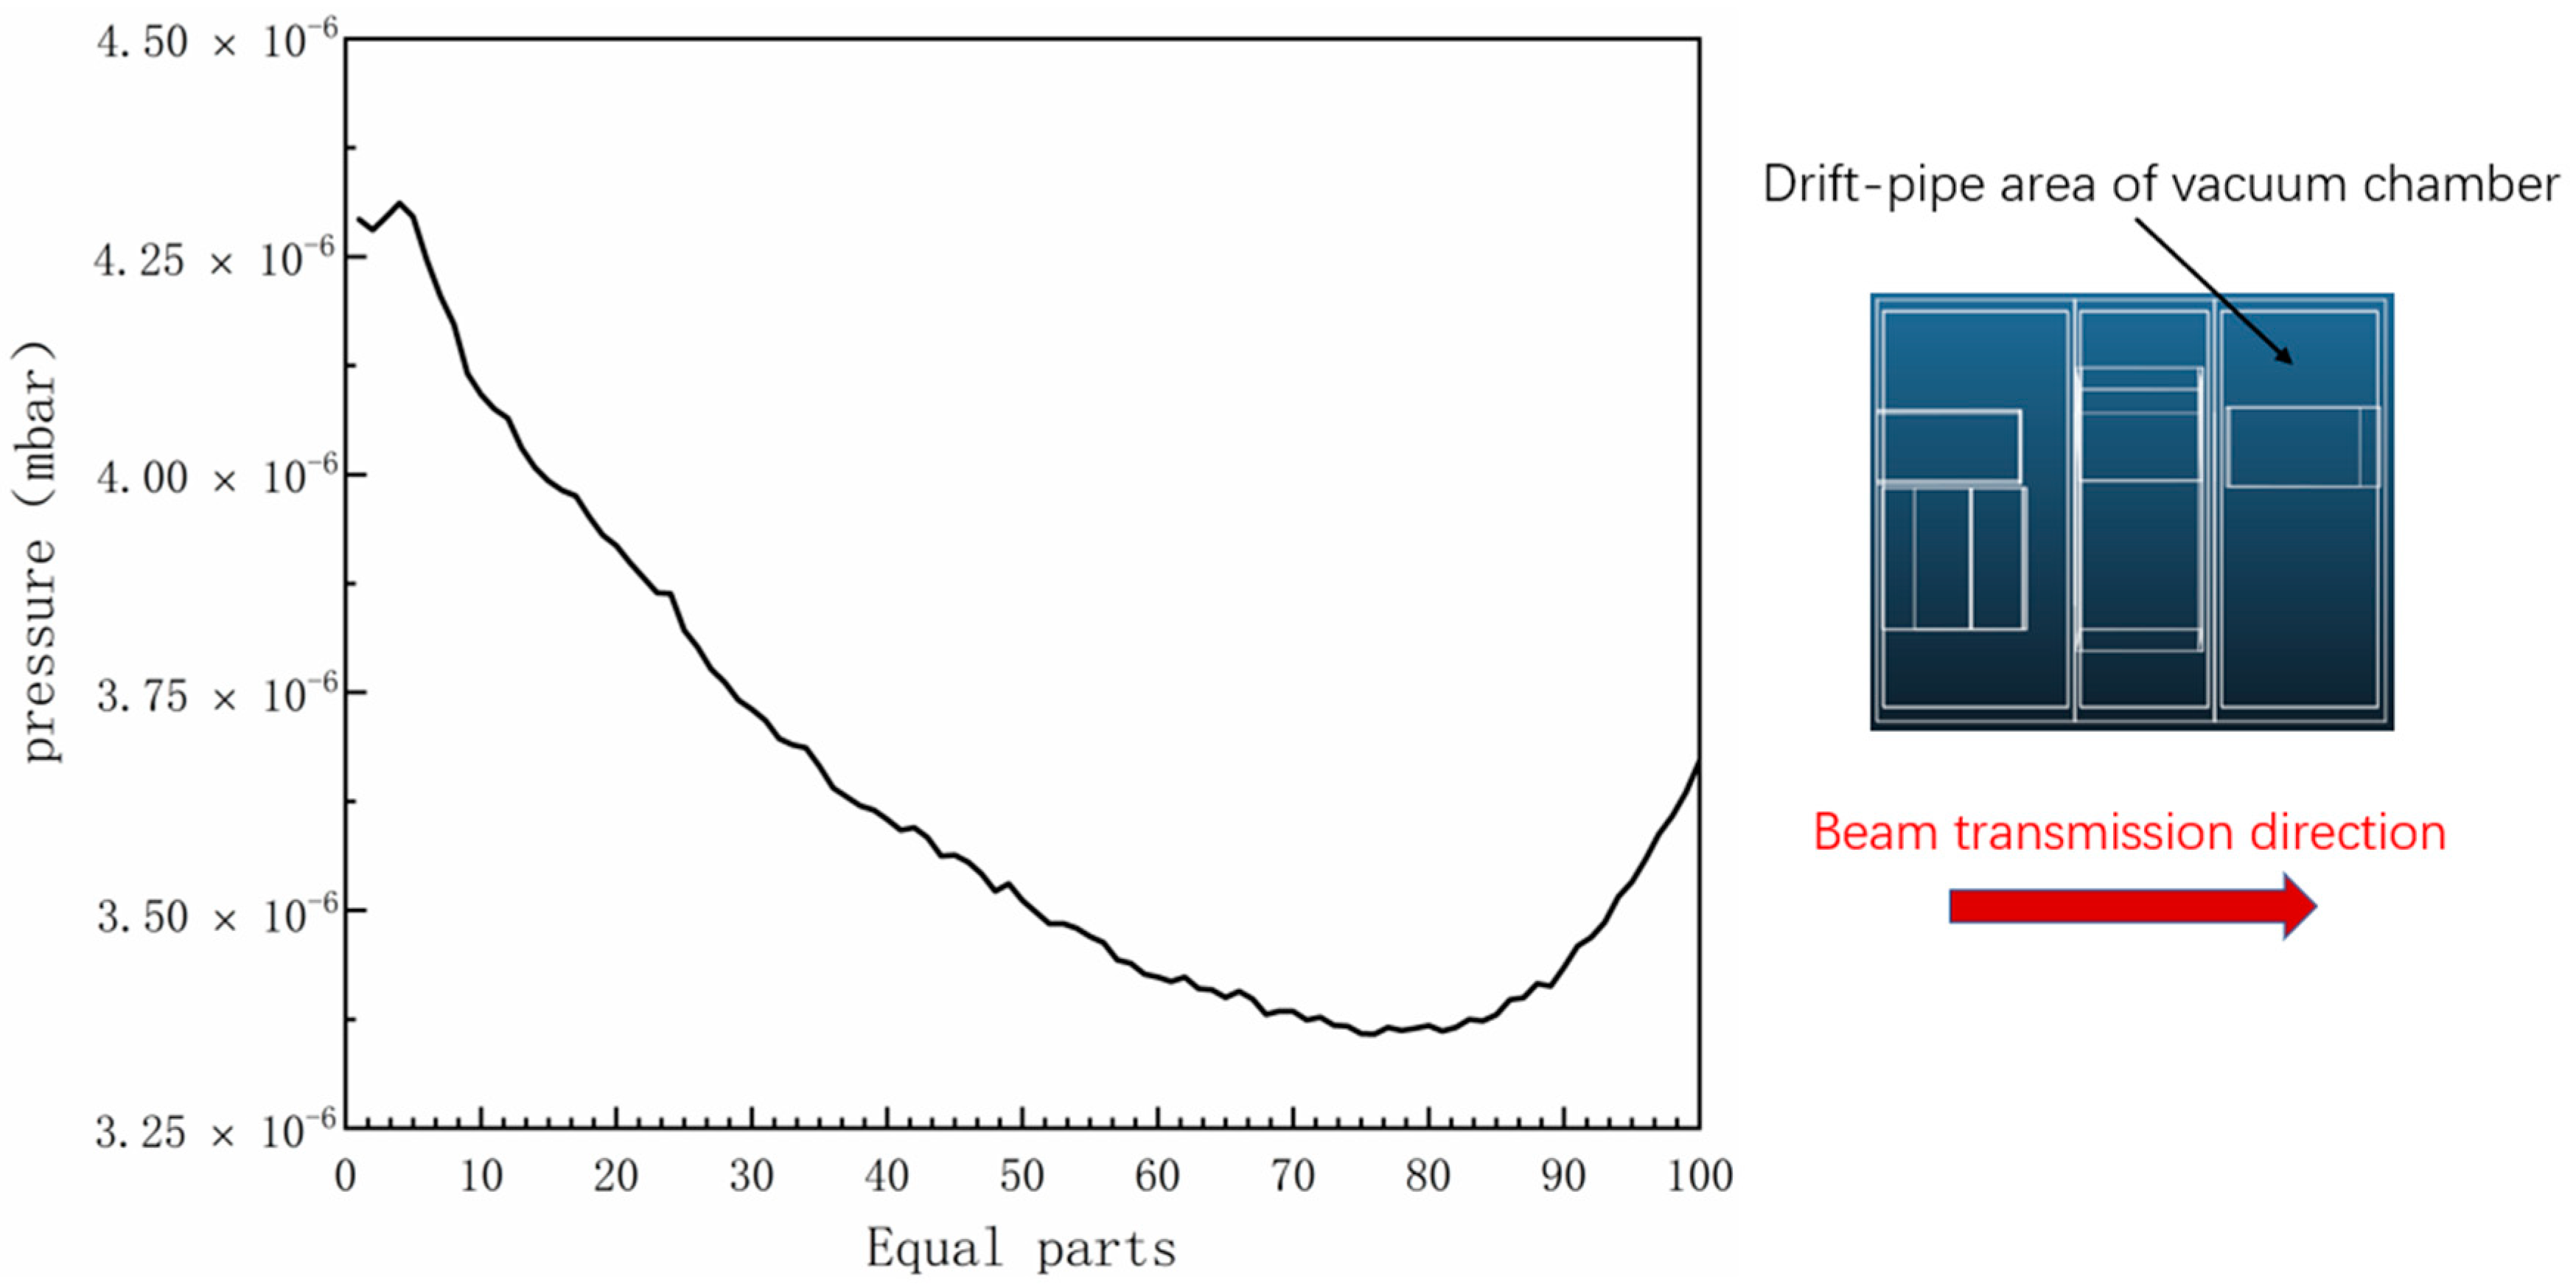
Figure 12.
Cloud diagram of the heat-load distribution on the low-temperature condensation surface of each area after the vacuum chamber has been dynamically balanced.
Figure 12.
Cloud diagram of the heat-load distribution on the low-temperature condensation surface of each area after the vacuum chamber has been dynamically balanced.


Table 1.
Comparison of the dimensions of the beam-line vacuum chamber before and after the upgrade.
| NBI Section Name | Quantity | |
|---|---|---|
| Existing NBI | Upgraded NBI | |
| Cryogenic pump shape | Cylindrical shape | Rectangular shape |
| Vacuum chamber shape | Cylindrical shape | Rectangular shape |
| Neutralized area of the vacuum chamber | 1900 mm | 1390 mm |
| Bending magnet area of the vacuum chamber | 889 mm | 978 mm |
| Drift pipe of the vacuum chamber | 860 mm | 1120 mm |
Table 2.
NBI vacuum system parameters before and after upgrade.
| Parameter Name | Design Parameters | |
|---|---|---|
| Existing NBI Cryogenic Vacuum System | Upgraded NBI Cryogenic Vacuum System | |
| First gas baffle conductance | ||
| Second gas baffle flow conductance | ||
| Neutralized area gas flow | ||
| Bending-magnet area gas flow | ||
| Drift-pipe area gas flow | ||
| Low-temperature condensation surface area of neutralized area | ||
| Low-temperature condensation surface area of bending-magnet area | ||
| Low-temperature condensation surface area of drift-pipe area | ||
| Pumping speed in neutralized area for D2 | ||
| Pumping speed in bending-magnet area for D2 | ||
| Pumping speed in drift-pipe area for D2 | ||
| Ultimate vacuum | ||
Publisher’s Note: MDPI stays neutral with regard to jurisdictional claims in published maps and institutional affiliations. |
© 2021 by the authors. Licensee MDPI, Basel, Switzerland. This article is an open access article distributed under the terms and conditions of the Creative Commons Attribution (CC BY) license (https://creativecommons.org/licenses/by/4.0/).
Share and Cite
MDPI and ACS Style
Wang, G.; Zhang, S.; Chen, C.; Tang, N.; Lang, J.; Xie, Y. Vacuum System Optimization for EAST Neutral Beam Injector. Energies 2022, 15, 264. https://doi.org/10.3390/en15010264
AMA Style
Wang G, Zhang S, Chen C, Tang N, Lang J, Xie Y. Vacuum System Optimization for EAST Neutral Beam Injector. Energies. 2022; 15(1):264. https://doi.org/10.3390/en15010264
Chicago/Turabian StyleWang, Guodong, Si Zhang, Changqi Chen, Ning Tang, Jiaqi Lang, and Yuanlai Xie. 2022. "Vacuum System Optimization for EAST Neutral Beam Injector" Energies 15, no. 1: 264. https://doi.org/10.3390/en15010264
Note that from the first issue of 2016, this journal uses article numbers instead of page numbers. See further details here.