
Effect of Loading Rate and Confining Pressure on Strength and Energy Characteristics of Mudstone under Pre-Cracking Damage


School of Mining, Guizhou University, Guiyang 550025, China
*
Author to whom correspondence should be addressed.
Energies 2022, 15(10), 3545; https://doi.org/10.3390/en15103545
Submission received: 18 April 2022
/
Revised: 6 May 2022
/
Accepted: 10 May 2022
/
Published: 12 May 2022
(This article belongs to the Topic Mining Safety and Sustainability)
Abstract
:In order to explore the deformation and failure law of deep surrounding rock roadway disturbed by strong dynamic pressure, the triaxial mechanical properties of mudstone samples under pre-cracking damage conditions were tested to study the deformation and failure characteristics and energy evolution mechanism in the damage process, under different loading rates and confining pressures. In the mechanical experiment, the specimen is pre-cracked to simulate the damage and failure of surrounding rock during roadway excavation, and the damage degree model of rock specimen is established. The results show that the loading rate and confining pressure have significant effects on the peak strength and energy characteristics of mudstone at the average damage degree of 0.12, and the peak strength increases with the increase in confining pressure and loading rate. Under the same confining pressure, the energy increases first, and then decreases with the increase in loading rate, and the loading rate at the turning point is called the critical loading rate. Under the same confining pressure, the closed stress of mudstone gradually increases with the increase in loading rate, and the closed stress and loading rate show a good linear relationship. Through the fitting relationship, it is found that the fitting correlation coefficient between the closed stress of mudstone and the loading rate is as high as 0.99. The elastic strain energy ratio presents a composite function of exponential function with natural constant e, which is a nonlinear process.
1. Introduction
In recent years, with the depletion of shallow coal resources, mining has gradually turned to deep mining. However, due to the high ground stress environment of deep mining, deep surrounding rock is often disturbed by roadway blasting excavation and high strength mining of the working face, which leads to the aggravation of rock damage and a decrease in strength. Accidents of roof caving and two-side shrinkage occur frequently, which will lead to the overall instability and failure of the roadway. In underground mining engineering, the influence of high ground stress surrounding the rock properties of the roadway, and artificial mining [1,2,3,4] has become the main reason for roadway failure.
Mudstone is the most widely distributed rock in the world, and mudstone is also a common rock type in coal mines. Mud soft rock roadway deformation is a process of the slow release of deformation energy induced by coal mining or other dynamic loads. At present, many scholars have carried out a large number of mechanical test studies on the failure disasters and support of coal and rock roadways under static and dynamic loads [5,6,7,8,9]. Bai et al. [10], by theoretical analysis and numerical methods, studied the temporal and spatial distribution law of mining stress and dynamic disturbance in the process of dynamic pressure roadway excavation, and proposed the sectional dynamic support technology. Zang et al. [11] studied the variation law of surrounding rock under a static load and different disturbances of intensity by numerical simulation, and proposed the combined support of shotcrete anchor net and reinforced anchor cable. Du et al. [12] studied a new test system coupled with true triaxial static load and local dynamic disturbance with regard to the strength characteristics and crushing law of rock under different dynamic and static combined loads. Su and Gao [13], through field investigation, numerical simulation and field testing, studied the stress and deformation evolution characteristics of surrounding rock under the influence of multiple excavation and mining. The mating support technology of high pre-stressed bolt and short anchor cable was proposed. From the above research contents, it can be seen that a large number of scholars have carried out in-depth research on the influence of the dynamic load strain rate on roadways, but the study of coal mine dynamic disturbance (10−5/s < strain rate < 10−3/s) on the mechanical properties and failure law of argillaceous rock mass is lacking. In particular, there is a lack of research on the mechanical behavior and engineering dynamic response characteristics of an argillaceous rock mass under static load and then under different disturbance loads. Therefore, it is of great significance to study and analyze the deformation and instability mechanism of roadways under dynamic disturbance.
In addition, from the perspective of energy, the material failure process is essentially a state instability phenomenon driven by energy. Many scholars at home and abroad have done a lot of research on rock failure processes. Zhang et al. [14] carried out failure tests on marble under different unloading confining pressure, to study the variation law between deformation and failure of marble and energy. Wen et al. [15] redefined the damage variable from the perspective of energy dissipation, and analyzed the damage evolution based on a triaxial test. Wang et al. [16] analyzed the energy, energy dissipation and energy conversion mode in the process of rock failure by cyclic loading and unloading. Based on the theory of damage mechanics, rock mechanics and energy conservation, the quantification of the rock failure degree was discussed. The study from Zhao et al. [17], combined with the experimental results, theoretical analysis and numerical simulation, demonstrated that the energy conversion characteristics in the process of rock deformation and failure are summarized according to the energy storage, release and dissipation mechanism of the rock. Hou et al. [18] studied the influence of the loading rate on the energy dissipation characteristics of shale, and discussed the variation in the strain energy conversion rate with the loading rate.
In summary, this paper adopts the method of axial loading pre-compression to produce certain micro-fracture damage inside the rock sample, to simulate the mining influence process of deep rock excavation and artificial mining in the roadway, which is called pre-cracking damage. The triaxial mechanical properties under different confining pressures and loading rates are tested, and the failure characteristics, strength characteristics and deformation characteristics, under different loading rates and confining pressures, are studied. The internal relationship between deformation and failure, pre-cracking damage and energy dissipation of specimens is analyzed, which has important research significance for roadway support and disturbance dynamic disaster analysis.
2. Test Materials and Test Schemes
2.1. Sample Preparation
The test rock samples were taken from the roof rock block of 1200 transport roadway in the Shanjiaoshu Coal Mine. The Z1Z-GT-230 core drilling rig was used to drill the core of the rock block. At the same time, the STJ2500-1-4 track trimming machine and SHM-200 double face leveling machine were used to process the core specimens. The core is shown in Figure 1. In order to better meet the test requirements, the standard specimen developed by the International Society of Rock Mechanics was adopted. The specimen was a cylinder with a diameter of 50 mm and a height of 100 mm. At the same time, the flatness of the two ends of the rock was controlled within 0.02 mm, and the non-parallelism of the two ends was less than 0.05 mm.
2.2. Test Scheme
The test loading equipment adopts a DSZ-1000 stress–strain controlled triaxial shear test system, as shown in Figure 2. The maximum static main pressure of the test machine is 1000 kN, the force resolution is 10 N, the measurement accuracy is ±0.5% FS, the maximum vertical main pressure moving step distance is 300 mm, and the maximum static confining pressure is less than 60 MPa. The system control mode has three kinds: force control, displacement control, axial strain and transverse strain control, which can ensure the reliability of the experimental loading process data and the authenticity of the simulation of the roadway dynamic disturbance.
In order to study the influence of the loading rate and confining pressure on the strength and energy characteristics of rock samples after pre-cracking damage, three groups of different confining pressures were set in this experiment, representing the different stress environments of rock. There were three different confining pressures W (1 MPa, 2 MPa, 3 MPa). Under each group of confining pressure, there are three different loading rates S (0.3 mm/min, 0.6 mm/min, 1.8 mm/min). Due to too many specimens, this paper only selected nine representative specimens for research and analysis.
The surrounding rock on the surface of the deep mine roadway is broken due to mine pressure and artificial mining. The surrounding rock is in a low confining pressure state or zero confining pressure state (uniaxial compressive state). The maximum principal stress of the surrounding rock is axial stress, and the minimum principal stress is circumferential stress. In the process of coal mining, the stress will transfer, the surrounding rock has been damaged or failed and the rock will be further in three-dimensional stress or a uniaxial loading state. In order to study the whole influence process of deep rock excavation and artificial mining, the rock mass is divided into three main stages. The first stage: high-stress triaxial loading stage, which simulates the original rock stress state and original rock damage process of deep rock mass. The second stage: stress unloading process, which simulates the unloading process of deep rock mass after excavation under the stress state of the original rock. The third stage: loading stage of low confining pressure and different rate, this stage simulates the peak stress transfer under dynamic disturbance, and then loading a low confining pressure and high vertical stress on pre-cracking damaged rock specimens in the unloading stage. The confining pressure and the loading rate in the vertical direction after the unloading stage affect the failure factors of the deep rock mass.
The main process of pre-cracking damage is as follows: (1) The testing machine σ3 is set to 20 MPa by the stress control mode, and the stress point moves from O point to A point, which simulates the real stress state of the roadway before excavation. (2) When the stress point reaches A, stress control is used to unload σ3 at A certain rate, to a confining pressure of 15 MPa. In this process, σ1 is continuously increased, and the increase in σ1 is 50–70% of the peak strength. This process simulates the stress adjustment after roadway excavation (sections A–B). (3) When the stress point value reaches point B, the stress control reduces σ1 to the same value as σ3 (to prevent specimen failure), and then the specimen is unloaded to 0 MPa at the same time. In this process, the specimen forms cracks (B–O segment). The loading path was shown in Figure 3.
3. Pre-Cracking Damage Analysis
3.1. Principle of Energy Dissipation
In the process of the rock experiment, the test machine inputs energy to the specimen through mechanical work, and the energy will exist in the form of accumulation and dissipation in the rock. The energy accumulated by the specimen is mainly divided into potential energy and thermal energy. In general, the energy conversion into heat energy is relatively small, which has little effect on the strength of the specimen, and can be attributed to the dissipation energy. The potential energy is mainly converted into elastic potential energy and also becomes elastic strain energy. The dissipation of energy is mainly manifested in the friction between the structural planes inside the rock and the extrusion between microscopic particles, and finally the thermal energy forms in the process of forming new microscopic cracks. Assuming that the specimen does not have other forms of energy exchange, the work done by the testing machine on the specimen is denoted as U, Ue as the elastic potential energy of the specimen during the test, and Ud as the dissipation energy of the internal damage of the rock, from the literature (Wen et al. [15]):
For elastomers, the total energy provided by the testing machine will be converted into elastic potential energy. For an elastic–plastic body under triaxial compression, its energy input can be expressed by the following formula:
Among them: σ1 indicates that the specimen is subjected to axial stress, MPa. σ2 and σ3 represent the confining pressure of the specimen, MPa. ε1 denotes the axial strain of the rock specimen. ε2 and ε3 represent the circumferential strain of the rock specimen.
For pseudo-triaxial compression, when confining pressure σ2 = σ3, the energy absorbed by the rock specimen is:
For the calculation, it can release elastic strain energy Ue of the unit rock mass, the unloading elastic modulus Eu can be replaced by the elastic modulus E of the elastic section before the peak. The released elastic strain energy at any point on the stress–strain curve can be calculated according to the formula:
For the triaxial stress state, the released elastic energy is composed of axial and circumferential parts. By consulting the literature [19,20], the energy released by the circumferential elastic strain energy is small, and the elastic strain energy released by the axial is negligible, so only the axial elastic strain energy is considered.
3.2. Establishment of Damage Degree Model Based on Energy Dissipation
The deformation and failure of the rock is essentially the process of generation, expansion, connection, penetration and slippage of micro-cracks inside the rock. When new cracks are generated, the rock needs to absorb energy, and the slippage friction between cracks will consume energy. Therefore, the deformation and failure process of rock is the process of energy accumulation and dissipation. According to the law of thermodynamics, energy dissipation is the essential attribute of rock deformation and failure. Therefore, the dissipation and release of energy eventually lead to the deformation and failure of the rock, and the dissipation of energy is the main reason for the damage of the internal structure of the specimen. Considering the damage of mudstone in different degrees during deformation and failure, the damage degree D is defined, which can be expressed as:
Formula: U is the total energy absorbed by the specimen, MJ/m3. Ud is the energy consumed in the simulated unloading process, MJ/m3.
Because this experiment is carried out by the pseudo-triaxial test, therefore, using the pseudo-triaxial formula analysis, the synthesis of Formulas (1), (3), (4), and (5), obtained in the process of deformation and failure of mudstone damage, with regard to mathematical expression is:
Figure 4 shows the stress–strain curves of some rock specimens under pre-cracking damage. Since there are many test rocks, some rocks are selected to analyze the damage degree of the pre-cracking stage. As can be seen from the figure, when the stress is loaded to the set load and then unloaded, the unloading curve does not return along the path of the original loading curve, but is lower than the loading curve. The area below the loading curve is the work done by the external load, while the area below the unloading curve is the elastic energy released by the rock, that is, the elastic deformation energy of the rock under the current load. In addition to the increase in elastic deformation energy of the rock sample, another part of the total work is dissipated, and the dissipated energy will not be released from the rock sample with unloading, so the unloading curve is lower than the loading curve. The total work minus the elastic deformation energy of the rock sample is the dissipated energy, namely the area between the loading and unloading curves. The damage degree D of each rock sample can be calculated by calculating the area, which proves that the greater the dissipation area, the greater the damage degree. According to Equation (7) and the test results, the damage degrees under pre-cracking conditions are 0.13, 0.11 and 0.12, respectively. It can be seen that this process is mainly to simulate the fracture specimens formed by roadway excavation, so it has little effect on the damage degree of the rock specimens at this stage. There is an inflection point in the curve in Figure 4c, indicating that there are cracks in the specimen before the pre-cracking test. During the test, the cracks need to absorb energy when they close slowly, and the energy absorbed in the pre-cracking stage after closure will be less than that before.
4. Strength Characteristics under Pre-Cracking Damage Condition
4.1. Strength Characteristics Analysis
The stress–strain curves of mudstone rock samples under different loading rates and confining pressures are shown in Figure 5, by sorting out and analyzing the triaxial compression test results under pre-cracking damage conditions, and the main mechanical index parameters of the test results are given in Table 1. It can be seen from Figure 5 that, with the increase in confining pressure, the stress–strain curves of mudstone samples show different degrees of strain characteristics. The deformation and failure process of rock samples can be roughly divided into four stages, namely, the compaction stage, elastic deformation stage, elastic–plastic deformation stage and post-peak failure stage. In the initial compaction stage, the cracks in the rock specimens are continuously compacted with the increase in stress. In the elastic deformation stage, the stress–strain curve is linear, and the elastic modulus E remains constant. In the elastic–plastic deformation stage, the internal cracks of the rock samples begins to expand and is accompanied by a large number of cracks. In the post-peak failure stage, with the increase in strain, the stress gradually drops and the ability to continue bearing is lost. At the same loading rate, the peak strength of the rock samples increases with the increase in confining pressure. When the loading rate S is 0.3 mm/min, the confining pressure increases W from 1 MPa to 3 MPa, and the peak strength increases from 110.96 MPa to 138.7 MPa, with an increase of 25%. When the loading rate S was 0.6, the confining pressure increased W from 1 MPa to 3 MPa, and the peak strength increased from 169.18 MPa to 229.15 MPa, with an increase of 35.5%. When the loading rate was S 1.8, the confining pressure increased W from 1 MPa to 3 MPa, and the peak strength increased from 138.7 MPa to 265.86 MPa, with an increase of 91.7%.
It can be seen from Table 1 that under the same confining pressure, the faster the loading rate is, the greater the strength of the specimen will be. When the confining pressure is 1 MPa, the loading rate increases from 0.3 mm/min to 1.8 mm/min, and the strength increases from 110.96 MPa to 171.83 MPa, with an increase of 54.8%. When the confining pressure was 2 MPa, the loading rate increased from 0.3 mm/min to 1.8 mm/min, and the strength increased from 117.67 MPa to 245.45 MPa, with an increase of 108.5%. When the confining pressure is 3 MPa, the loading rate increases from 0.3 mm/min to 1.8 mm/min, and the strength increases from 138.7 MPa to 265.86 MPa, with an increase of 91.6%.
Figure 6 shows the deformation and failure characteristics of the specimens and the binary treatment. It can be seen from the figure that the failure cracks of the specimen are mainly longitudinal in development, showing shear failure. The surface cracks of the specimen were relatively small at a small loading rate until after the failure. With the increase in the loading rate, the number of cracks in the specimen gradually increased, and cones were generated at both ends. Rock blocks with uneven sizes fell off, on to the surface, and most of them were detritus, indicating that, with the increase in the loading rate, a large amount of elastic energy accumulated in the specimen after the failure was transformed into the plastic dissipation energy that broke the rock.
4.2. Characteristic Stress Analysis
Martin [21,22] and others conducted a more in-depth study of rock mechanics experiments, which found that the fracture development of rock in the failure process will be divided into four stages, namely, the closure stage, the initiation stage, the expansion stage and the interactive penetration stage. Cracks in the four stages of the development process will have a great correlation with the overall strength and mechanical properties of the specimen. In the process of specimen crack closure compaction, due to the rock specimen, it has its own defects and the test machine loading first crack closure compaction, will produce a stress threshold denoted as crack closure stress σcc. When the testing machine is loaded to the stress threshold, it indicates that the specimen has been completely closed and will enter the elastic deformation stage. The change in this stage is mainly controlled by the mechanical parameters such as the elastic modulus E and Poisson’ s ratio V of rock. With the increase in the stress of the specimen, there will be stable new cracks in the specimen. This process is a stable crack propagation stage. The stress of the specimen at the beginning of the crack is recorded as the initiation stress σci. According to the research results of a large number of scholars, the initiation stress is roughly 30–60% of the peak strength of the specimen. When the stress of the specimen continues to increase, unstable crack propagation will occur inside the rock. At this time, the corresponding stress is denoted as the damage stress σcd. After the specimen reaches the damage stress, the internal crack will always be in an unstable state. Academia also regards the damage stress σcd as the long-term strength of the rock. After the damage stress, the internal cracks of the specimen continuously interact with each other, and gradually develop from a large number of surrounding cracks to macroscopic cracks and shear bands. Finally, the macroscopic failure of the specimen occurs, and the specimen reaches the peak strength σp.
In summary, the specimen has four main characteristic stresses in the compression process, including closure stress σcc, initiation stress σci, damage stress σcd and peak strength σp. The stress threshold of each stage corresponds to different stages in the failure process of the test specimen. Therefore, the study of the stress eigenvalue has important guiding significance for the strength damage of the specimen under different confining pressures and different loading rates.
There is the volumetric strain method and acoustic emission method for determining characteristic stress values. The conventional mechanical experiments can be approximately calculated by the volume strain εv curve:
In the formula, ε1 represents the circumferential strain measured during the test and ε2 represents the axial strain. When the specimen is subjected to external force, the internal cracks will be closed, and crack initiation, expansion stage and interactive penetration occur. The volumetric strain curve will occur at an offset inflection point, damage stress σcd and peak strength σp. The stress points corresponding to the circumferential strain curve are closed stress σcc and crack initiation stress σci, as shown in Figure 7.
In this paper, the closed stress σcc, crack initiation stress σci, damage stress σcd and peak strength σp of rock specimens under different loading rates and confining pressures in triaxial tests, are obtained by using volumetric strain and circumferential strain. Figure 7 is the characteristic stress curve of the specimen. It can be seen from Figure 7 that, with the increase in confining pressure, the characteristic stress increases in varying degrees, indicating that the expansion of rock specimens will require higher stress after the confining pressure increases. From another aspect, confining pressure has an inhibitory effect on the expansion of specimens. At high confining pressure, the inflection point of the volumetric strain will be delayed, so the crack initiation stress and damage stress will be increased.
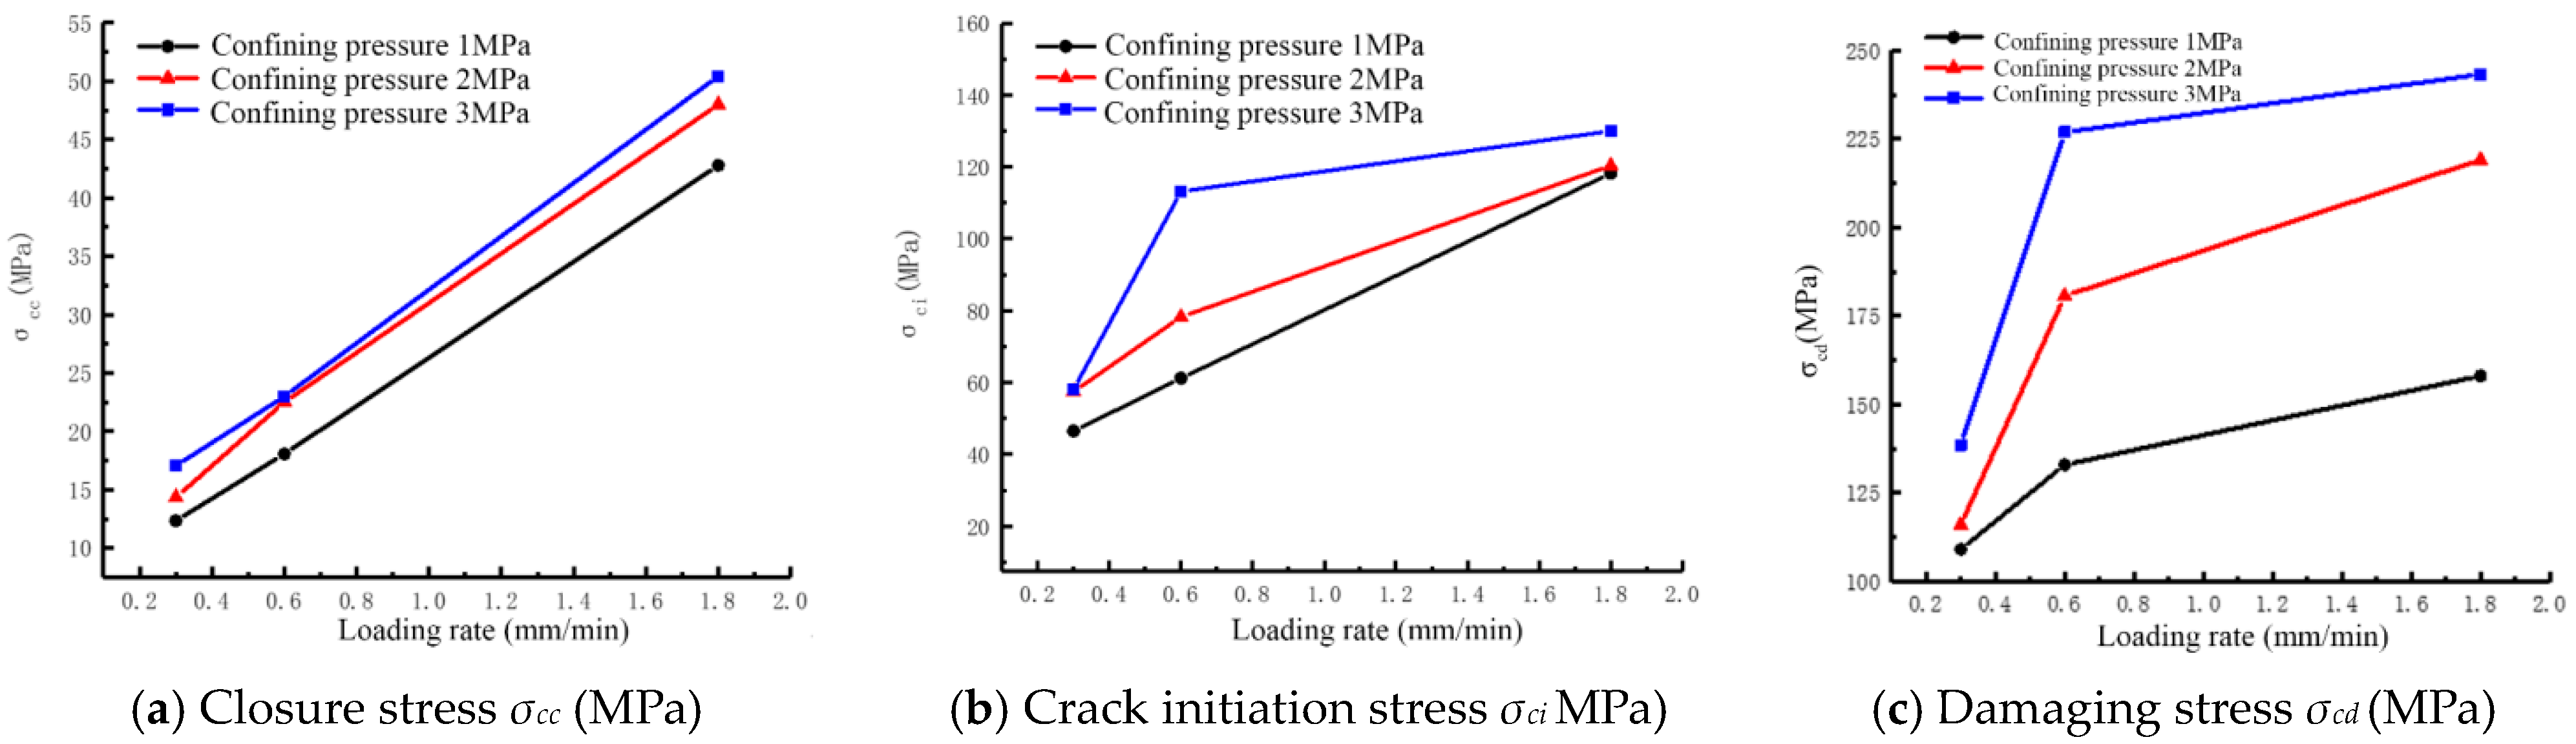
It can be seen from the closed stress σcc in Figure 8a that, under the same confining pressure, the closed stress of mudstone gradually increases with the increase in loading rate, and the closed stress has a good linear relationship with the loading rate. It is found that the closed stress and loading rate of mudstone can be described by a linear relationship:
When the confining pressure W is 1 MPa, the loading rate S increases from 0.3 mm/min to 1.8 mm/min, and the closure stress increases from 12.5 MPa to 42.5 MPa, with an increase of 240%. The fitting relationship is y = 20.925x + 6.715, and the fitting correlation coefficient between the two is as high as 0.998.
When the confining pressure W is 2 MPa, the loading rate S increased from 0.3 mm/min to 1.8 mm/min, and the closure stress increases from 14.2 MPa to 48.2 MPa, with an increase of 239%. The fitting relationship is y = 23.475x + 9.758, and the fitting correlation coefficient between the two is as high as 0.996.
When the confining pressure W is 3 MPa, the loading rate S increases from 0.3 mm/min to 1.8 mm/min, and the closure stress increases from 16.8 MPa to 50.5 MPa, with an increase of 201%. The fitting relationship is y = 22.78x + 10.133, and the fitting correlation coefficient between the two is as high as 0.999.
When the loading rate is low, the reaction time for the deformation of mudstone mineral particles is sufficient, and the crack propagation can be coordinated with the increase in load. At a high loading rate, the crack propagation in the material lags behind the increase in the load, and the absorbed energy is accumulated inside the material, which shows that the closure stress increases with the increase in the loading rate.
From Figure 8b, the initiation stress will increase with the increase in loading rate. The initiation stress of confining pressure 1 MPa and 2 MPa can still maintain a significant linear relationship. When the specimen is 3 MPa, the increase rate of initiation stress will decrease. It can be seen from Figure 8c that under three confining pressures, the damage stress of the specimen increases with the increase in the loading rate, but the increase rate slows down.
5. Energy Characteristic under Pre-Cracking Damage Condition
5.1. Energy Evolution Characteristics under Different Loading Rates and Confining Pressures
Figure 9 shows the energy evolution curves of rock specimens under different loading rates and confining pressures after pre-cracking damage. It can be seen from the figure that the energy change characteristic curves have similar characteristics. Before the peak strength of the rock specimen was reached, most of the energy absorbed by the specimen at this stage was converted into elastic energy E, accounting for about 75.5–93.4% of the total energy, and only a small part of the energy was converted into plastic dissipation energy. With the increase in confining pressure, the elastic energy increases, indicating that confining pressure can inhibit the circumferential deformation of the specimen, forcing the axial specimen to accumulate large elastic strain energy, As shown in Figure 9, when the confining pressure W was 1 MPa, the accumulated elastic energy was 18.78 kJ·m−3. When the confining pressure W increased to 3 MPa, the accumulated elastic energy was 47.06 kJ·m−3, and the elastic energy increased by 150.58%. When the specimen was damaged, the plastic dissipation strain energy accounted for more than 99% of the total energy, and almost all the energy was consumed in the form of plastic dissipation energy, such as the energy consumed by friction between cracks.
It can be seen from Figure 10 that, under the same confining pressure, when the loading rate increases to a certain value, the absorbed energy no longer increases with the increase in the loading rate, on the contrary, it decreases. For this rock sample, the loading rate S at a turning point is 0.6 mm/min, and the total strain energy absorbed by the specimen at the loading rate of 0.6 mm/min is the largest. This loading rate is called the critical loading rate; on the one hand, the faster loading rate S limits the development of cracks, which is conducive to bearing, but on the other hand, it also makes the load-bearing part of the micro-element store more deformation energy so that it is closer to failure, which is not conducive to bearing. Therefore, there is an optimal loading rate S that makes the energy absorbed by the specimen reach the maximum value. The confining pressure W was 1 MPa, and the absorbed total strain energy was 33.46 kJ·m−3. When the confining pressure W increased by 2 Mpa, the total strain energy absorbed was 54.21 kJ·m−3, which increased by 62.01%. When the confining pressure W increased by 3 Mpa, the total strain energy absorbed was 54.71 kJ·m−3, which increased by 63.51%. With the increase in confining pressure W, the total strain energy absorbed by the rock is increasing.
From the elastic strain energy conversion, it can be seen that when the confining pressure W is 1 MPa and the loading rate S is 0.3 mm/min, the elastic strain energy conversion is 83.5%. When the loading rate S increases to 0.6 mm/min, the elastic strain energy conversion rate reaches 87.1%. When the loading rate S increases to 1.8 mm/min, the elastic strain energy conversion rate decreases to 75.5%. When the confining pressure W is 2 MPa and the loading rate S is 0.3 mm/min, 0.6 mm/min and 1.8 mm/min, the elastic strain energy is transformed by 94.57%, 81.61% and 78.42%, respectively. When the confining pressure W is 3 MPa and the loading rate S is 0.3 mm/min, 0.6 mm/min and 1.8 mm/min, the elastic strain energy is transformed by 93.45%, 86.01% and 82.39%, respectively. With the increase in the axial loading rate of the specimen, the conversion rate of the elastic strain energy of the specimen decreases continuously, which indicates that the elastic deformation of the rock cannot occur within the specimen at a high loading rate, thus the accumulation of elastic strain energy is small. The parenthesis in Figure 10 is the loading rate under the current confining pressure.
5.2. Proportion of Elastic Strain Energy
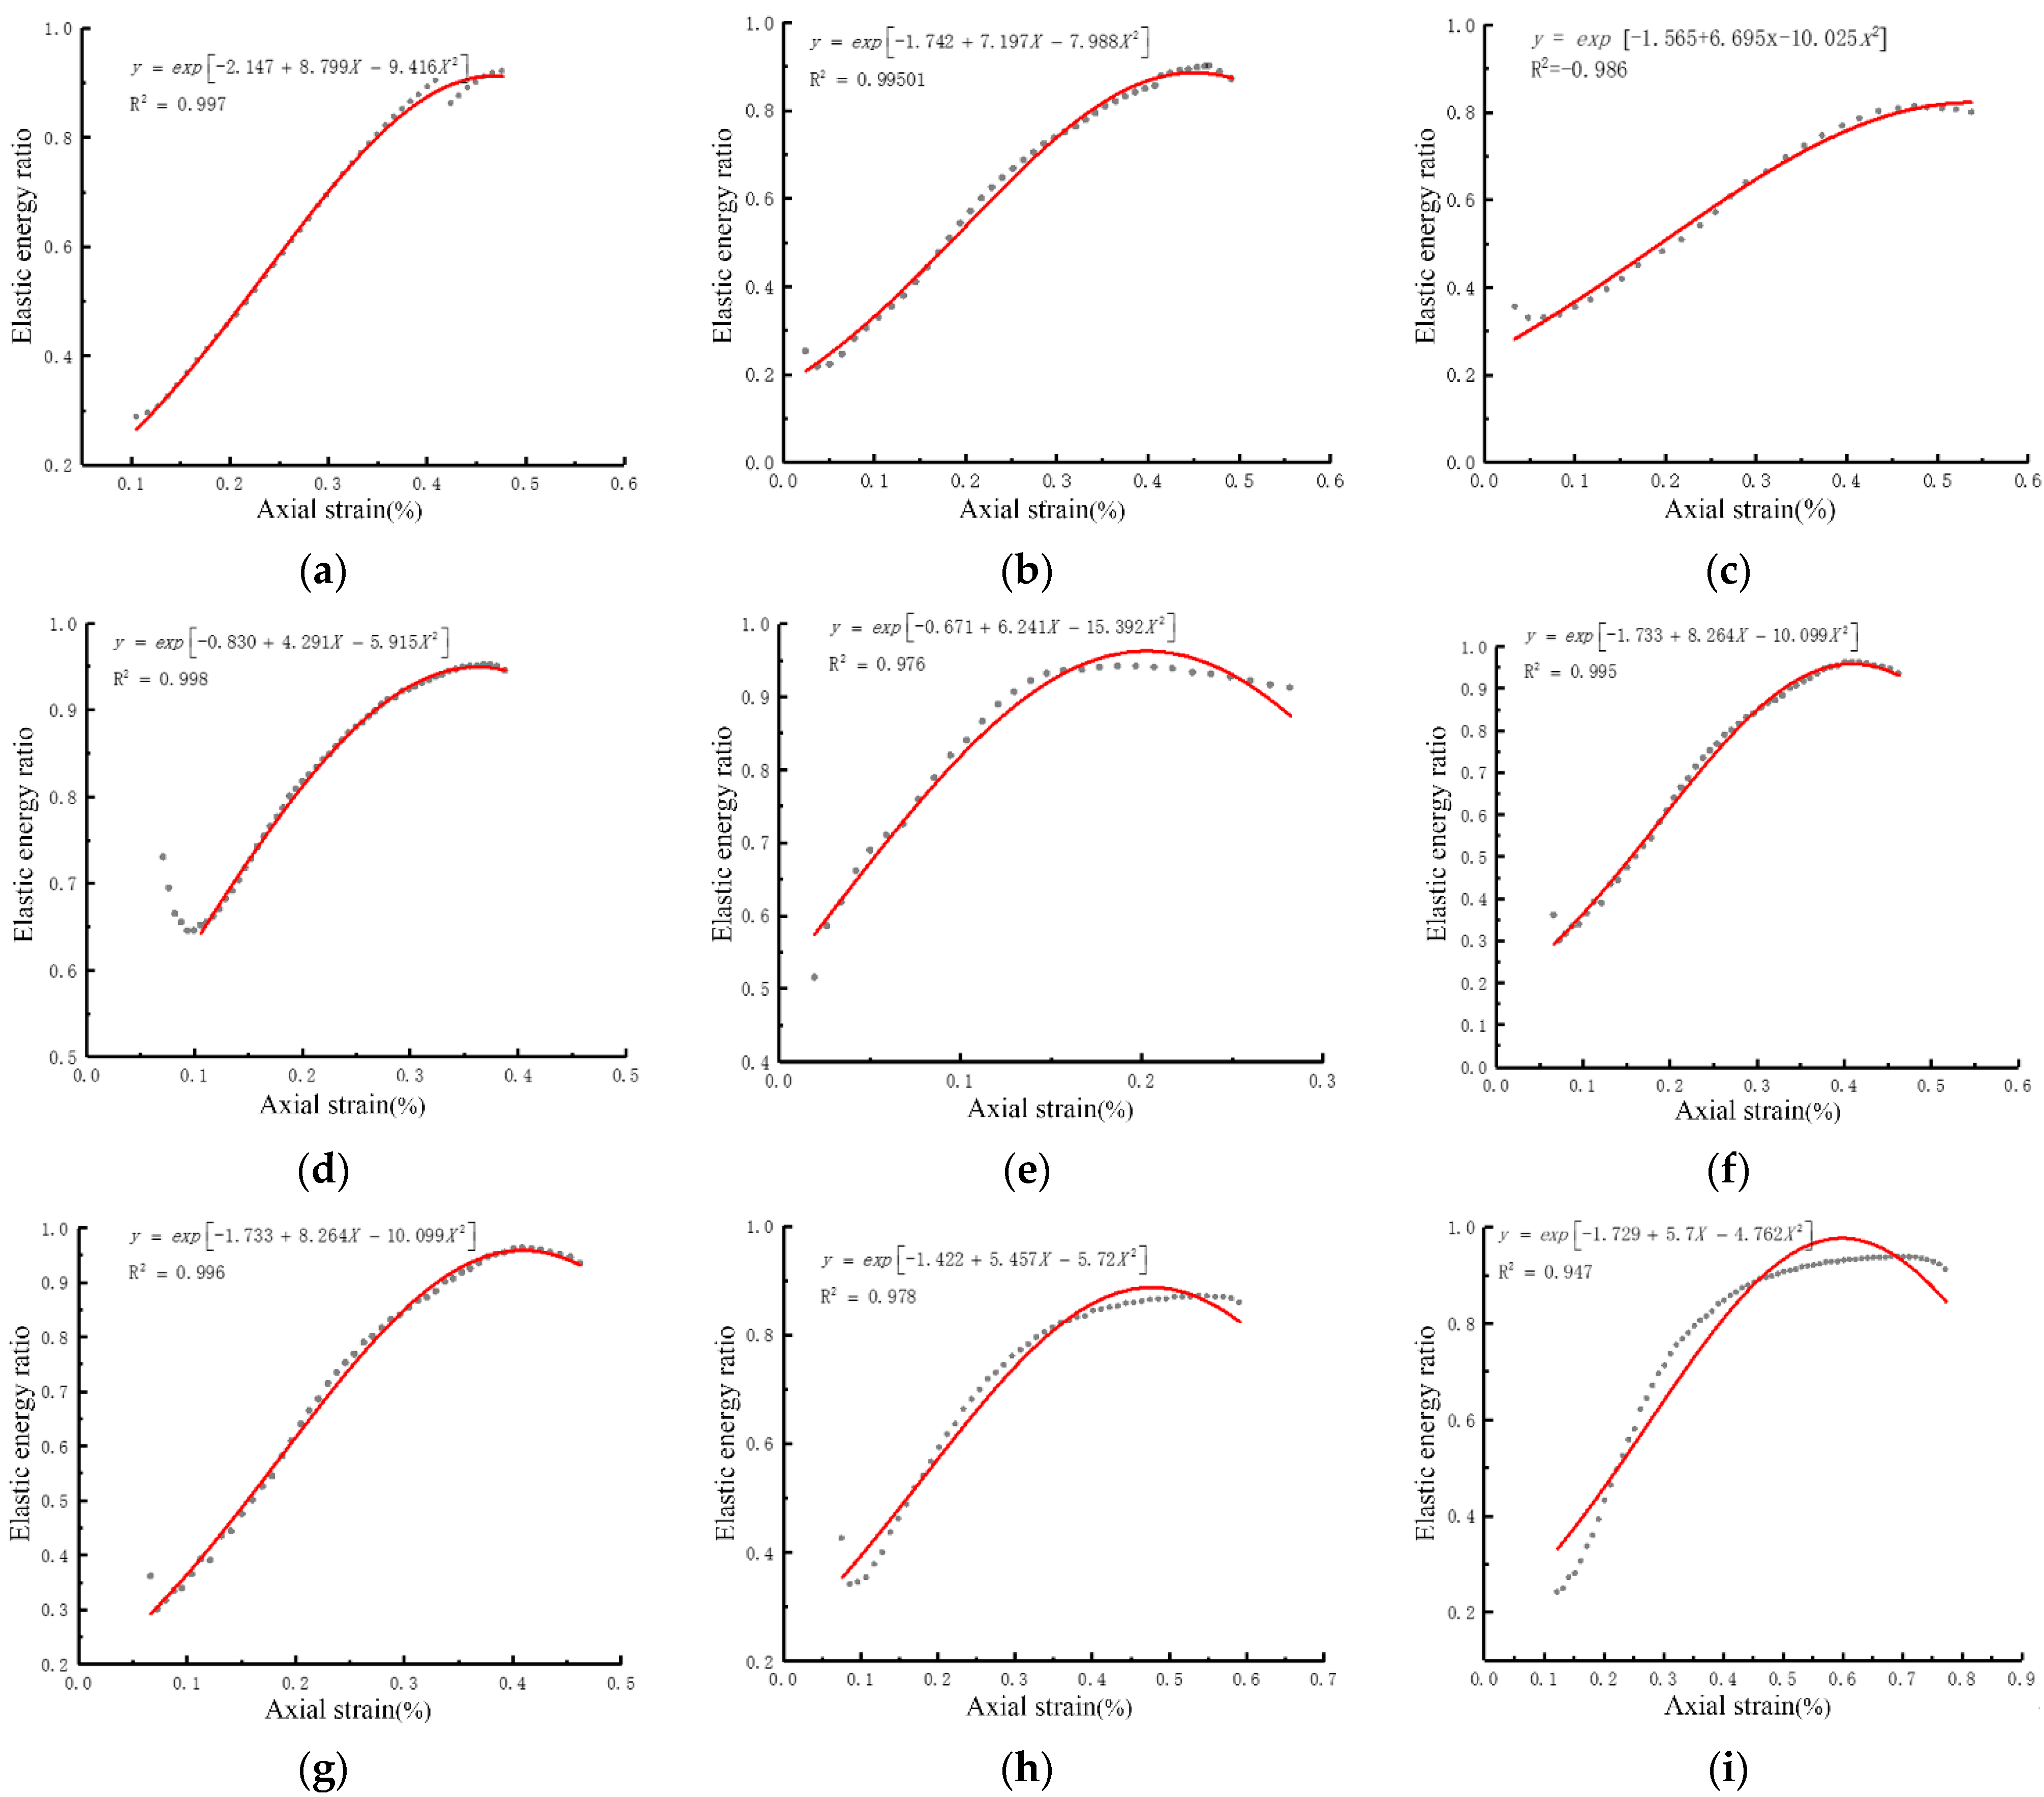
The elastic strain energy ratio represents the energy ratio absorbed by the elastic deformation of the specimen during triaxial compression, and this process can analyze the dynamic process of the energy accumulation state of the specimen. Figure 11 shows the relationship between the proportion of elastic strain energy and the strain before the loading peak of the rock specimen. It can be seen from Figure 11 that the curves of the proportion of elastic strain energy have similar characteristics. When the specimen is loaded to 30–40% of the peak strain, the proportion of elastic strain energy increases sharply, showing a linear upward trend. When the specimen is loaded to about 70% of the peak strain, the proportion of elastic strain energy of the specimen begins to be slow, and the growth process gradually tends to a stable maximum and remains for a period of time. When loading to the peak strain, the elastic strain energy ratio decreases gradually. In the initial stage of loading, the proportion of elastic strain energy in specimens 4, 6 and 8 decreased. In this stage, when the specimen was initially made of fractured specimens, some micro-cracks were generated inside the specimen. When the specimen was loaded, the micro-cracks inside the rock and other micro-structural surfaces were closed and friction slipped, thus consuming elastic strain energy. When the specimen reaches the peak stage, there are new cracks in the specimen. The strain energy consumed by unit strain is greater than the accumulated elastic strain energy, and the elastic energy decreases. It can be seen from the overall fitting curve that the elastic strain energy accumulation of the specimen presents a composite function of the exponential function of the natural constant e, and its change is obviously nonlinear.
6. Conclusions
- (1)
- The damage constitutive model of the mudstone specimen is established and verified by pre-cracking. The results show that the average damage degree D of the specimen is 0.12, and the model is reasonable.
- (2)
- Through triaxial mechanical experiments under different confining pressures W and loading rates S, the results show that under the same confining pressure W, the closed stress of mudstone increases gradually with the increase in loading rate S, and the closed stress has a good linear relationship with the loading rate S. Through the fitting relationship, it is found that the fitting correlation coefficient R, between the closed stress of mudstone and the loading rate S, is as high as 0.998.
- (3)
- Under the same confining pressure W, the energy absorbed by the rock sample is the largest when the loading rate S is 0.6 mm/min, and the energy absorbed by the rock sample decreases with the increase in the loading rate. The loading rate S at the turning point is 0.6 mm/min, indicating that the energy increases first and then decreases with the increase in the loading rate. The loading rate at the turning point is called the critical loading rate.
- (4)
- The proportion of elastic strain energy is used to analyze the dynamic process of the energy accumulation state of the specimen. It can be seen from the overall fitting curve that the elastic strain energy accumulation of the specimen presents a composite function of the exponential function of the natural constant e, and its change is obviously a nonlinear process.
Author Contributions
Conceptualization, Z.M.; methodology, H.Z. and X.L.; validation, L.Z. and D.Z.; data curation, X.L. and L.Z.; writing—original draft preparation, H.Z.; writing—review and editing, Z.M. All authors have read and agreed to the published version of the manuscript.
Funding
This paper is financially supported by the National Natural Science Foundation of China (No. 51904080 and No. 52164003) and the Science and Technology Project of Guizhou Province (No. 2021 general 352 and No. [2021]5610) during the research.
Institutional Review Board Statement
The study did not require ethical approval.
Informed Consent Statement
Informed consent was obtained from all subjects involved in the study.
Data Availability Statement
This study did not report any data.
Acknowledgments
The authors of this paper would like to express their gratitude for the National Natural Science Foundation of China (No. 51904080 and No. 52164003) and the Science and Technology Project of Guizhou Province (No. 2021 general 352 and No. [2021]5610) during the research.
Conflicts of Interest
The authors declare that there is no conflict of interest regarding the publication of this paper.
References
- Xu, J.H.; Kang, Y.; Wang, X.C.; Feng, G.; Wang, Z.F. Dynamic characteristics and safety criterion of deep rock mine opening under blast loading. J. Int. J. Rock Mech. Min. 2019, 119, 156–167. [Google Scholar] [CrossRef]
- Li, X.B.; Weng, L. Numerical investigation on fracturing behaviors of deep-buried opening under dynamic disturbance. J. Tunn. Undergr. Sp. Technol. 2016, 54, 61–72. [Google Scholar] [CrossRef]
- Zhang, Q.; Wang, J.Q.; Guo, Y.M.; Chen, Y.; Sun, Q. Study on deformation and stress evolution law of surrounding rock under repeated mining in close coal seam. J. Energ. Source Part A 2020. [Google Scholar] [CrossRef]
- Jing, H.D.; Li, Y.H.; Li, K.M. Study on the Deformation Mechanism of Soft Rock Roadway under Blasting Disturbance in Baoguo Iron Mine. J. Shock Vib. 2018, 2018, 4349810. [Google Scholar] [CrossRef]
- Zhao, Q.C.; Fu, B.J.; Yin, J.D.; Wen, Z.J. Deformation Mechanism and Control Technology of the Surrounding Rock of the Floor Roadway under the Influence of Mining. J. Adv. Civ. Eng. 2020, 2020, 6613039. [Google Scholar] [CrossRef]
- Kan, J.G.; Wang, P.; Wang, P. Influencing Factors of Disturbance Effects of Blasting and Driving of Deep Mine Roadway Groups. J. Shock Vib. 2021, 2021, 8873826. [Google Scholar] [CrossRef]
- Tian, M.L.; Han, L.J.; Meng, Q.B.; Ma, C.; Zong, Y.J.; Mao, P.Q. Physical Model Experiment of Surrounding Rock Failure Mechanism for the Roadway under Deviatoric Pressure form Mining Disturbance. J. KSCE J. Civ. Eng. 2020, 24, 1103–1115. [Google Scholar] [CrossRef]
- Lai, X.P.; Xu, H.C.; Shan, P.F.; Kang, Y.L.; Wang, Z.Y.; Wu, X. Research on Mechanism and Control of Floor Heave of Mining-Influenced Roadway in Top Coal Caving Working Face. J. Energ. 2020, 13, 381. [Google Scholar] [CrossRef] [Green Version]
- Liu, X.S.; Song, S.L.; Tan, Y.L.; Fan, D.Y.; Ning, J.G.; Li, X.B.; Yin, Y.C. Similar simulation study on the deformation and failure of surrounding rock of a large section chamber group under dynamic loading. J. Int J. Min. Sci. Technol. 2021, 31, 495–505. [Google Scholar] [CrossRef]
- Bai, J.B.; Shen, W.L.; Guo, G.L.; Wang, X.Y.; Yu, Y. Roof Deformation, Failure Characteristics, and Preventive Techniques of Gob-Side Entry Driving Heading Adjacent to the Advancing Working Face. J. Rock Mech. Rock Eng. 2015, 48, 2447–2458. [Google Scholar] [CrossRef]
- Zang, C.W.; Chen, Y.; Chen, M.; Zhu, H.M.; Qu, C.M.; Zhou, J. Research on Deformation Characteristics and Control Technology of Soft Rock Roadway under Dynamic Disturbance. J. Shock Vib. 2021, 2021, 6625233. [Google Scholar] [CrossRef]
- Du, K.; Tao, M.; Li, X.B.; Zhou, J. Experimental Study of Slabbing and Rockburst Induced by True-Triaxial Unloading and Local Dynamic Disturbance. J. Rock Mech. Rock Eng. 2016, 49, 3437–3453. [Google Scholar] [CrossRef]
- Su, M.; Gao, X.H. Research of the Surrounding Rock Deformation Control Technology in Roadway under Multiple Excavations and Mining. J. Shock Vib. 2021, 2021, 6681184. [Google Scholar] [CrossRef]
- Zhang, L.M.; Gao, S.; Wang, Z.Q.; Ren, M.Y. Analysis on Deformation Characteristics and Energy Dissipation of Marble under Different Unloading Rates. Tehnički Vjesnik 2014, 21, 987–993. [Google Scholar]
- Wen, T.; Tang, H.M.; Ma, J.W.; Liu, Y.R. Energy Analysis of the Deformation and Failure Process of Sandstone and Damage Constitutive Model. J. KSCE J. Civ. Eng. 2019, 23, 513–524. [Google Scholar] [CrossRef]
- Wang, C.L.; He, B.B.; Hou, X.L.; Li, J.Y.; Liu, L. Stress-Energy Mechanism for Rock Failure Evolution Based on Damage Mechanics in Hard Rock. J. Rock Mech. Rock Eng. 2020, 53, 1021–1037. [Google Scholar] [CrossRef]
- Zhao, Z.H.; Ma, W.P.; Fu, X.Y.; Yuan, J.H. Energy theory and application of rocks. J. Arab. J. Geosci. 2019, 12, 474. [Google Scholar] [CrossRef]
- Hou, Z.K.; Gutierrez, M.; Ma, S.Q.; Almrabat, A. Mechanical Behavior of Shale at Different Strain Rates. J. Rock Mech. Rock Eng. 2019, 52, 3531–3544. [Google Scholar] [CrossRef]
- Huang, D.; Li, Y.R. Conversion of strain energy in Triaxial Unloading Tests on Marble. J. Int. J. Rock Mech. Min. 2014, 66, 160–3544. [Google Scholar] [CrossRef]
- Zhang, Y.B.; Zhao, T.B.; Taheri, A.; Tan, Y.L.; Fang, K. Damage characteristics of sandstone subjected to pre-peak and post-peak cyclic loading. J. Acta Geodyn. Geomater. 2019, 16, 143–150. [Google Scholar] [CrossRef]
- Martin, C.D. The Strength of Massive Lac du Bonnet Granite around Underground Openings. Ph.D. Thesis, University of Manitoba, Winnipeg, MB, Canada, 1993. [Google Scholar]
- Eberhardt, E. Brittle Rock Fracture and Progressive Damage in Uniaxial Compression. Ph.D. Thesis, University of Saskatchewan, Saskatoon, SK, Canada, 1998. [Google Scholar]
- Cai, M.F.; He, M.C.; Liu, D.Y. Rock Mechanics and Engineering Science Press, 2nd ed.; Sciences Publishing House: Beijing, China, 2013; pp. 63–64. [Google Scholar]
Figure 1.
Core standard specimens.
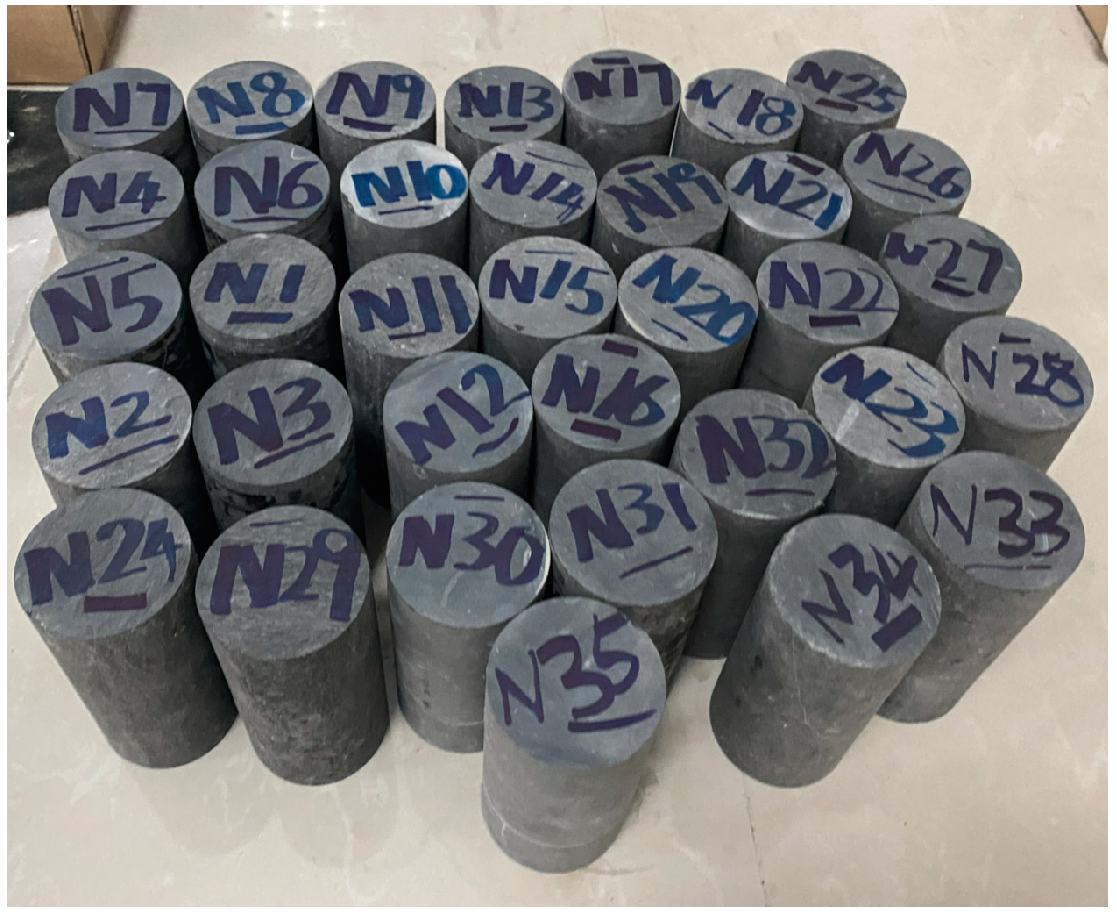
Figure 2.
DSZ-1000 mechanical experimental system.
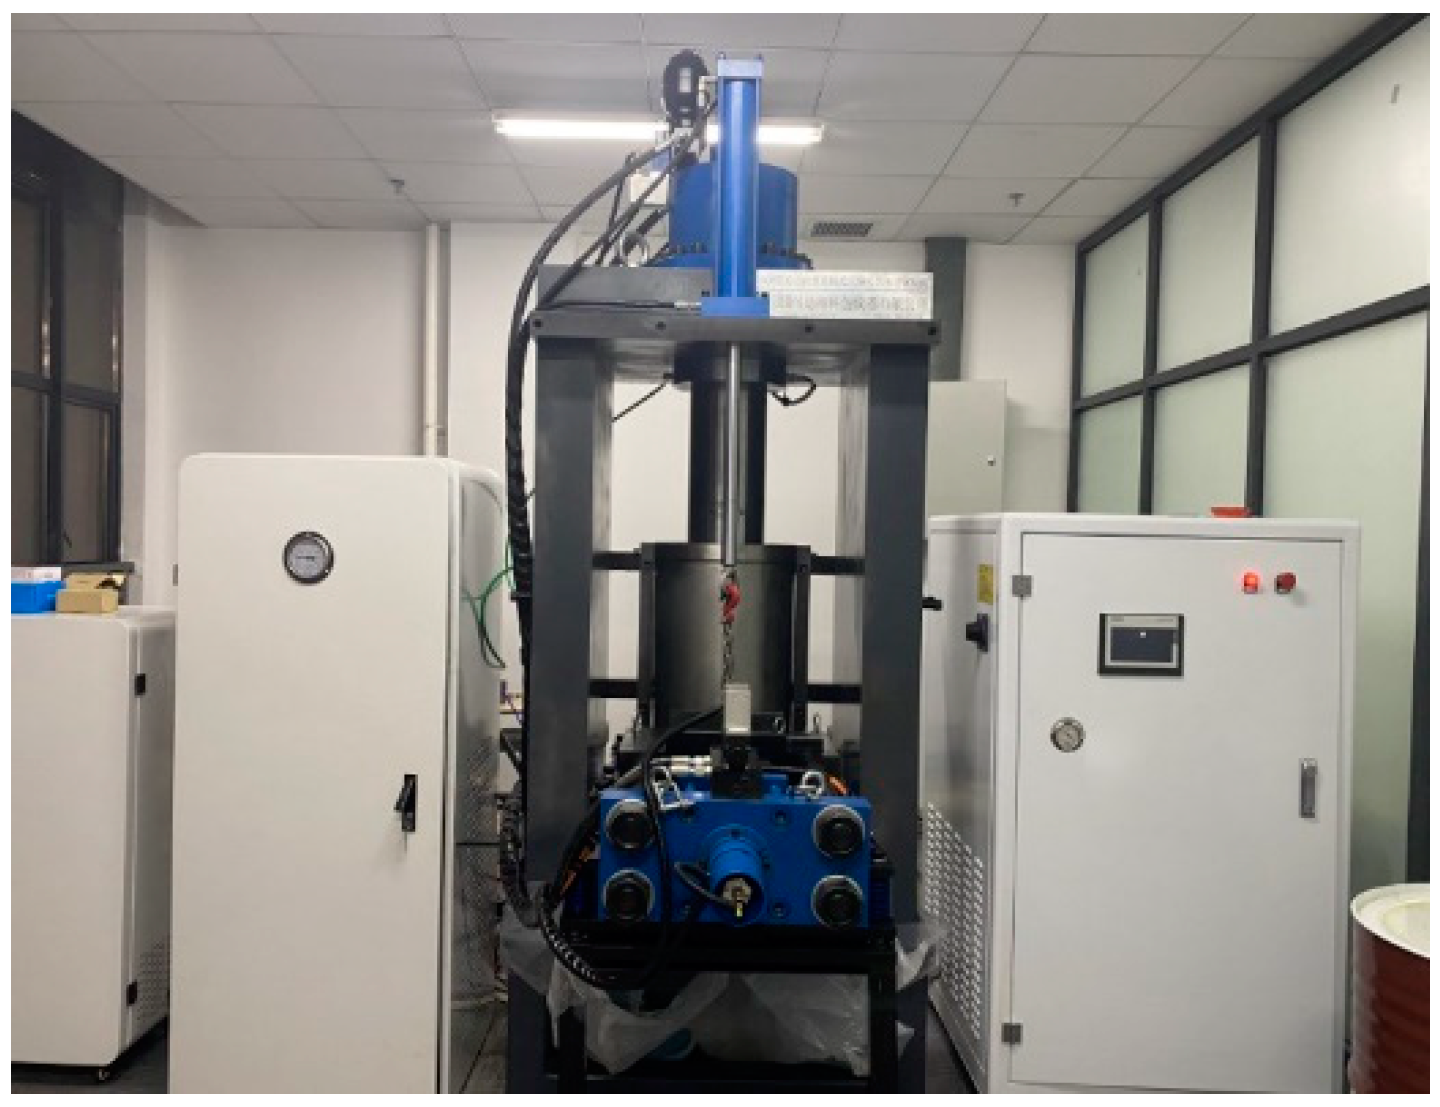
Figure 3.
Specimen loading path.
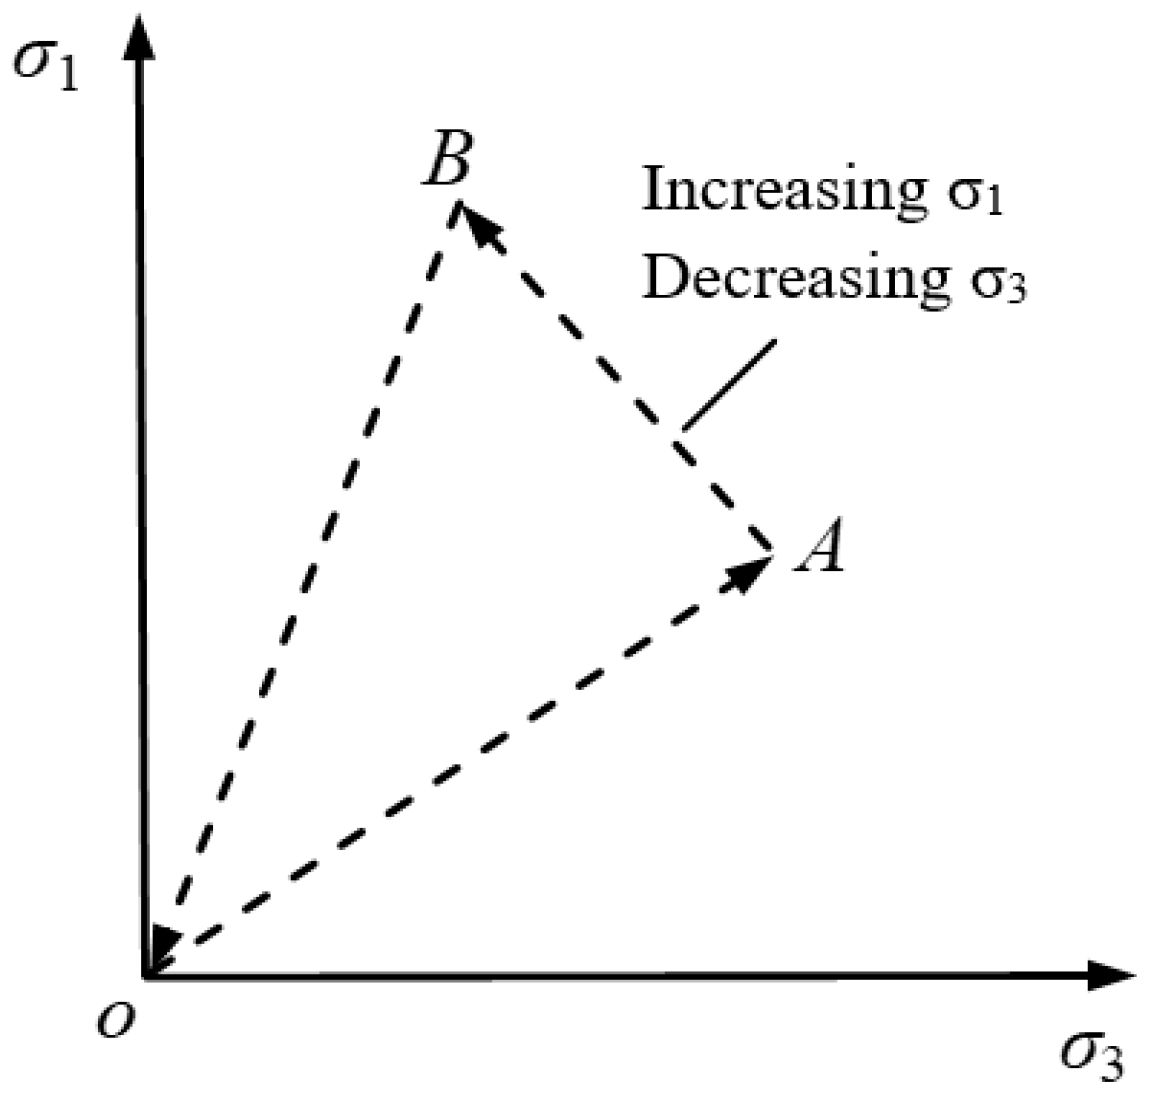
Figure 4.
Stress–strain curve under pre-cracking damage.
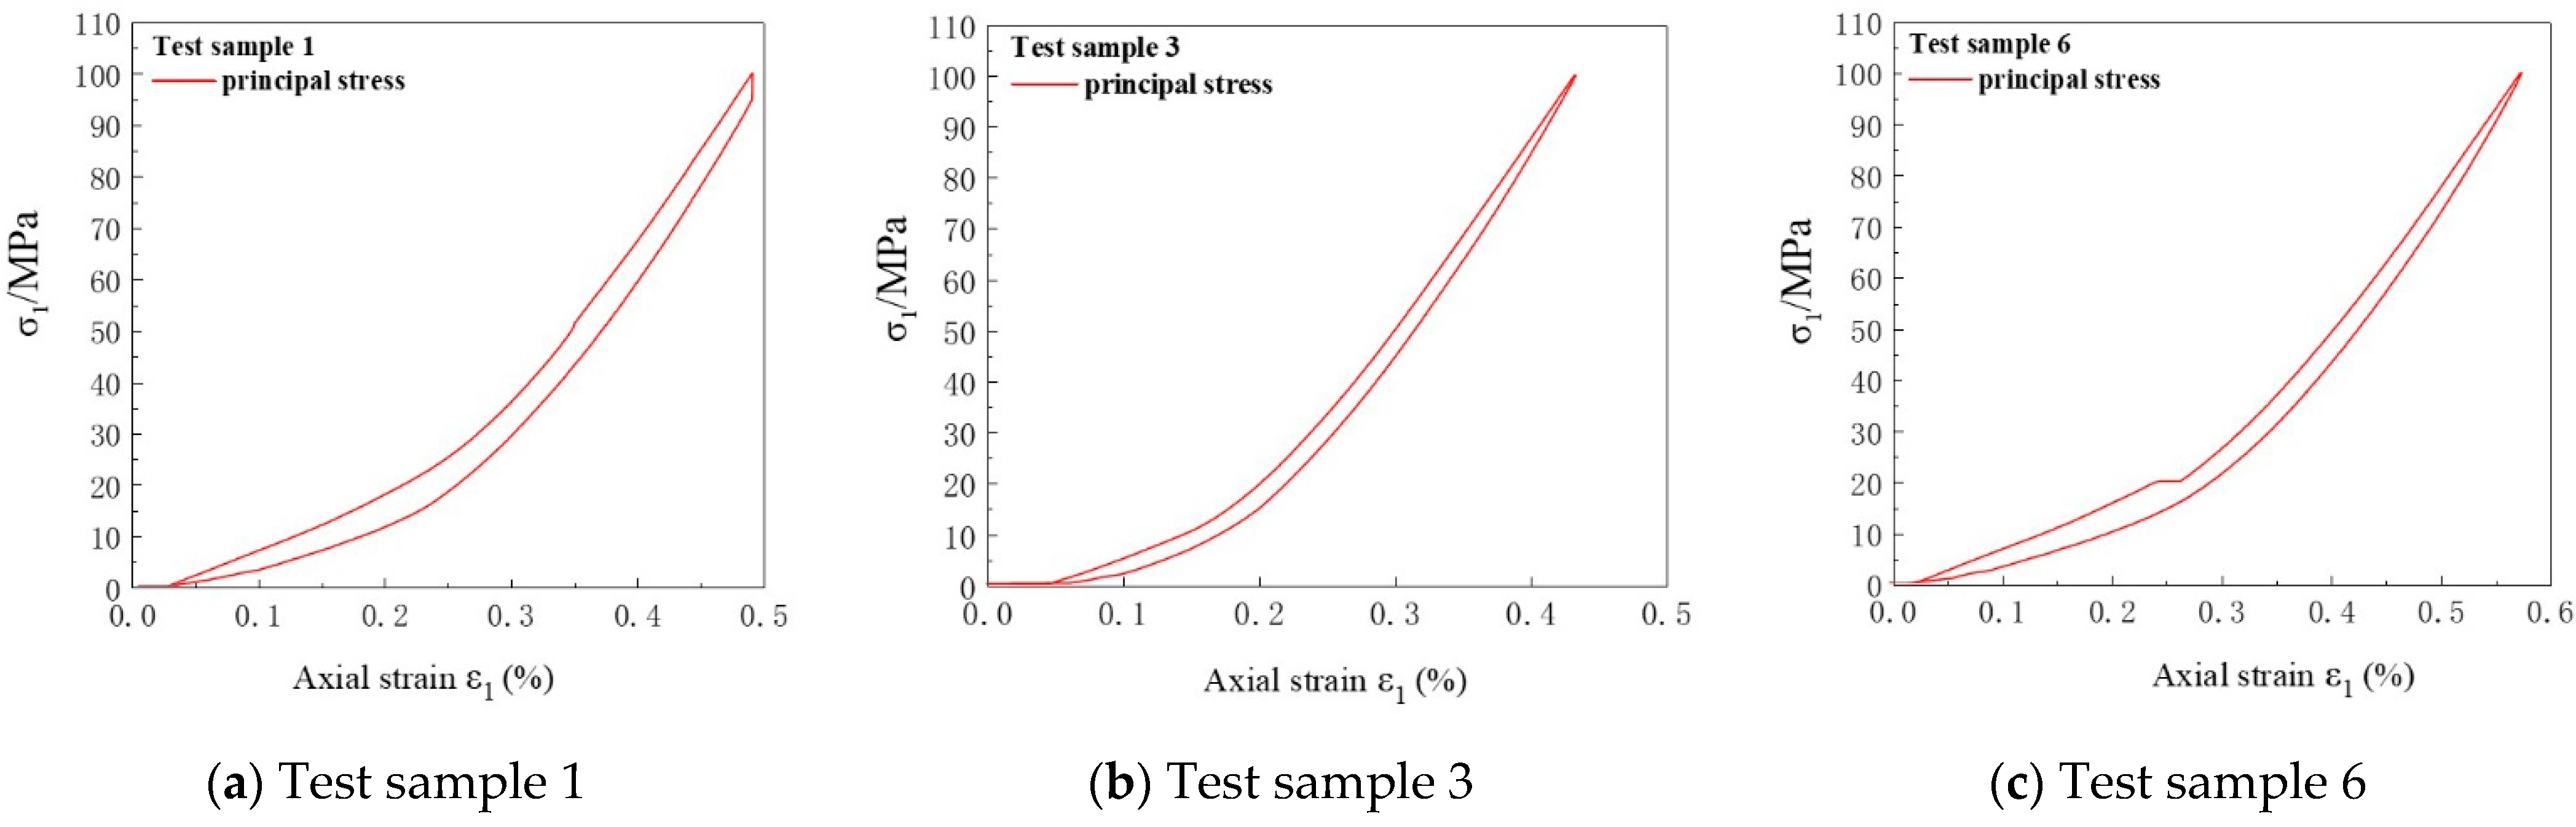
Figure 5.
Stress–strain curves of specimens under different confining pressures.
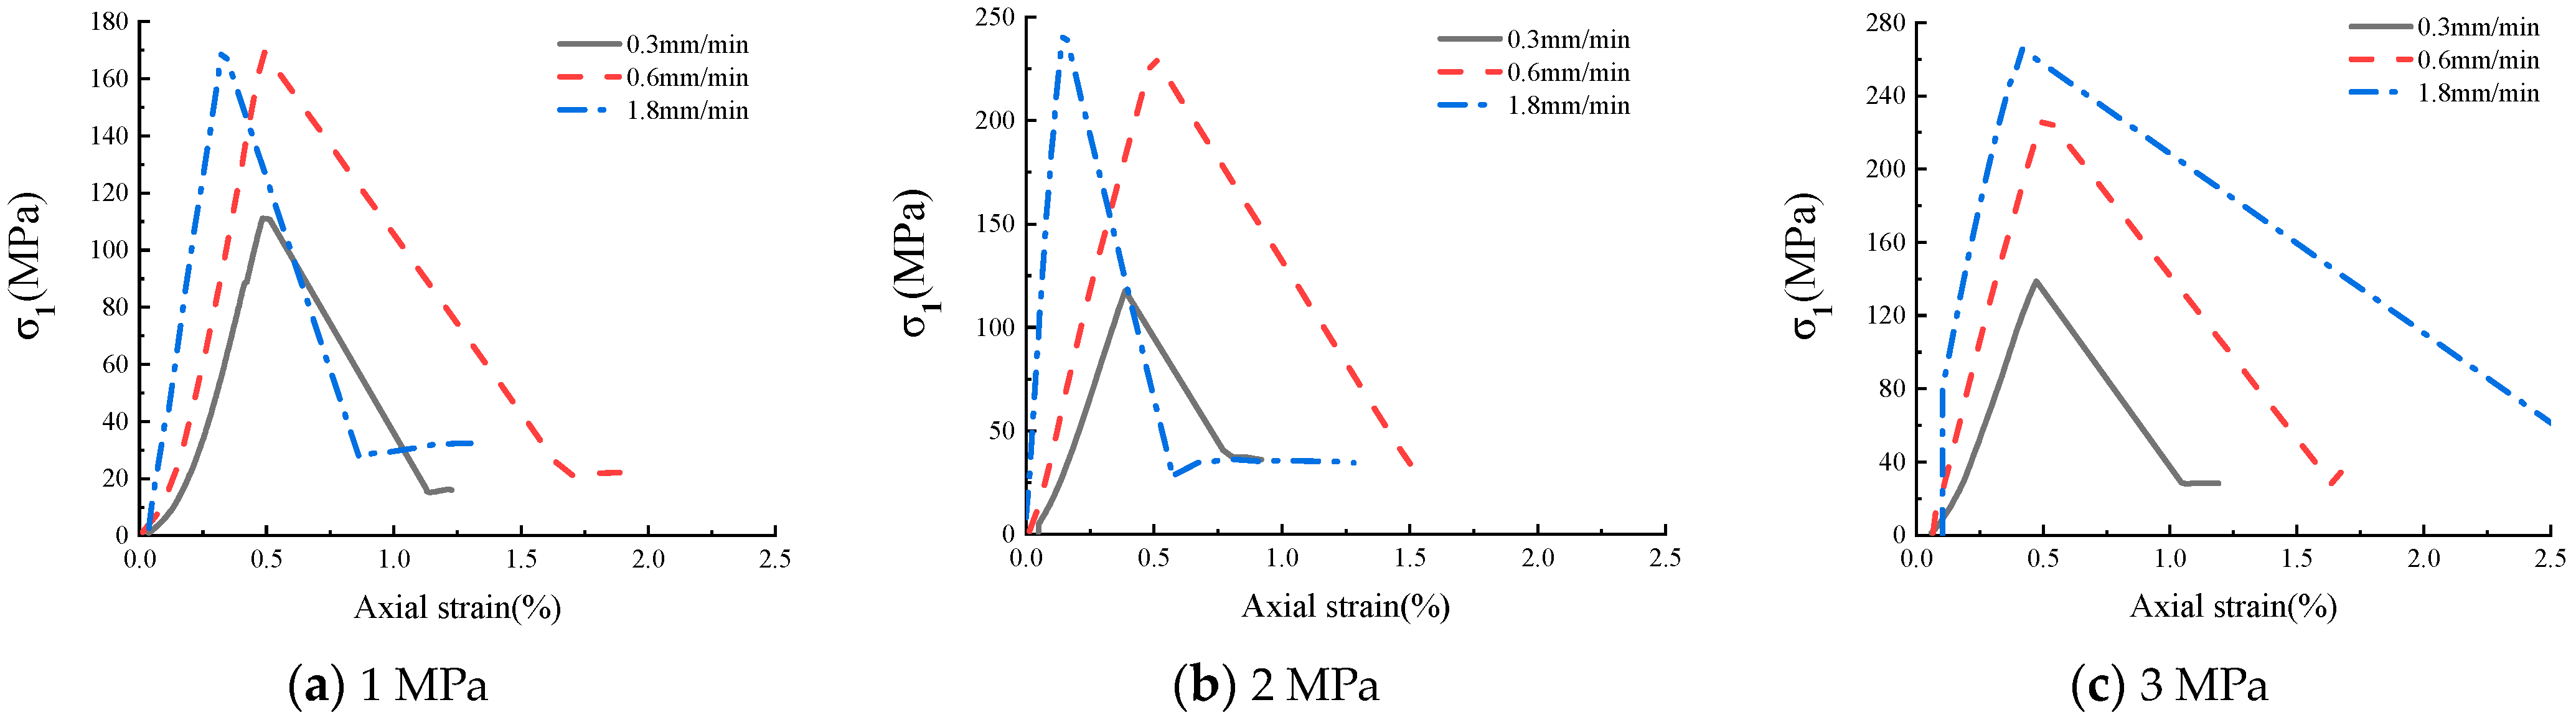
Figure 6.
Failure characteristics and binary treatment of specimens.
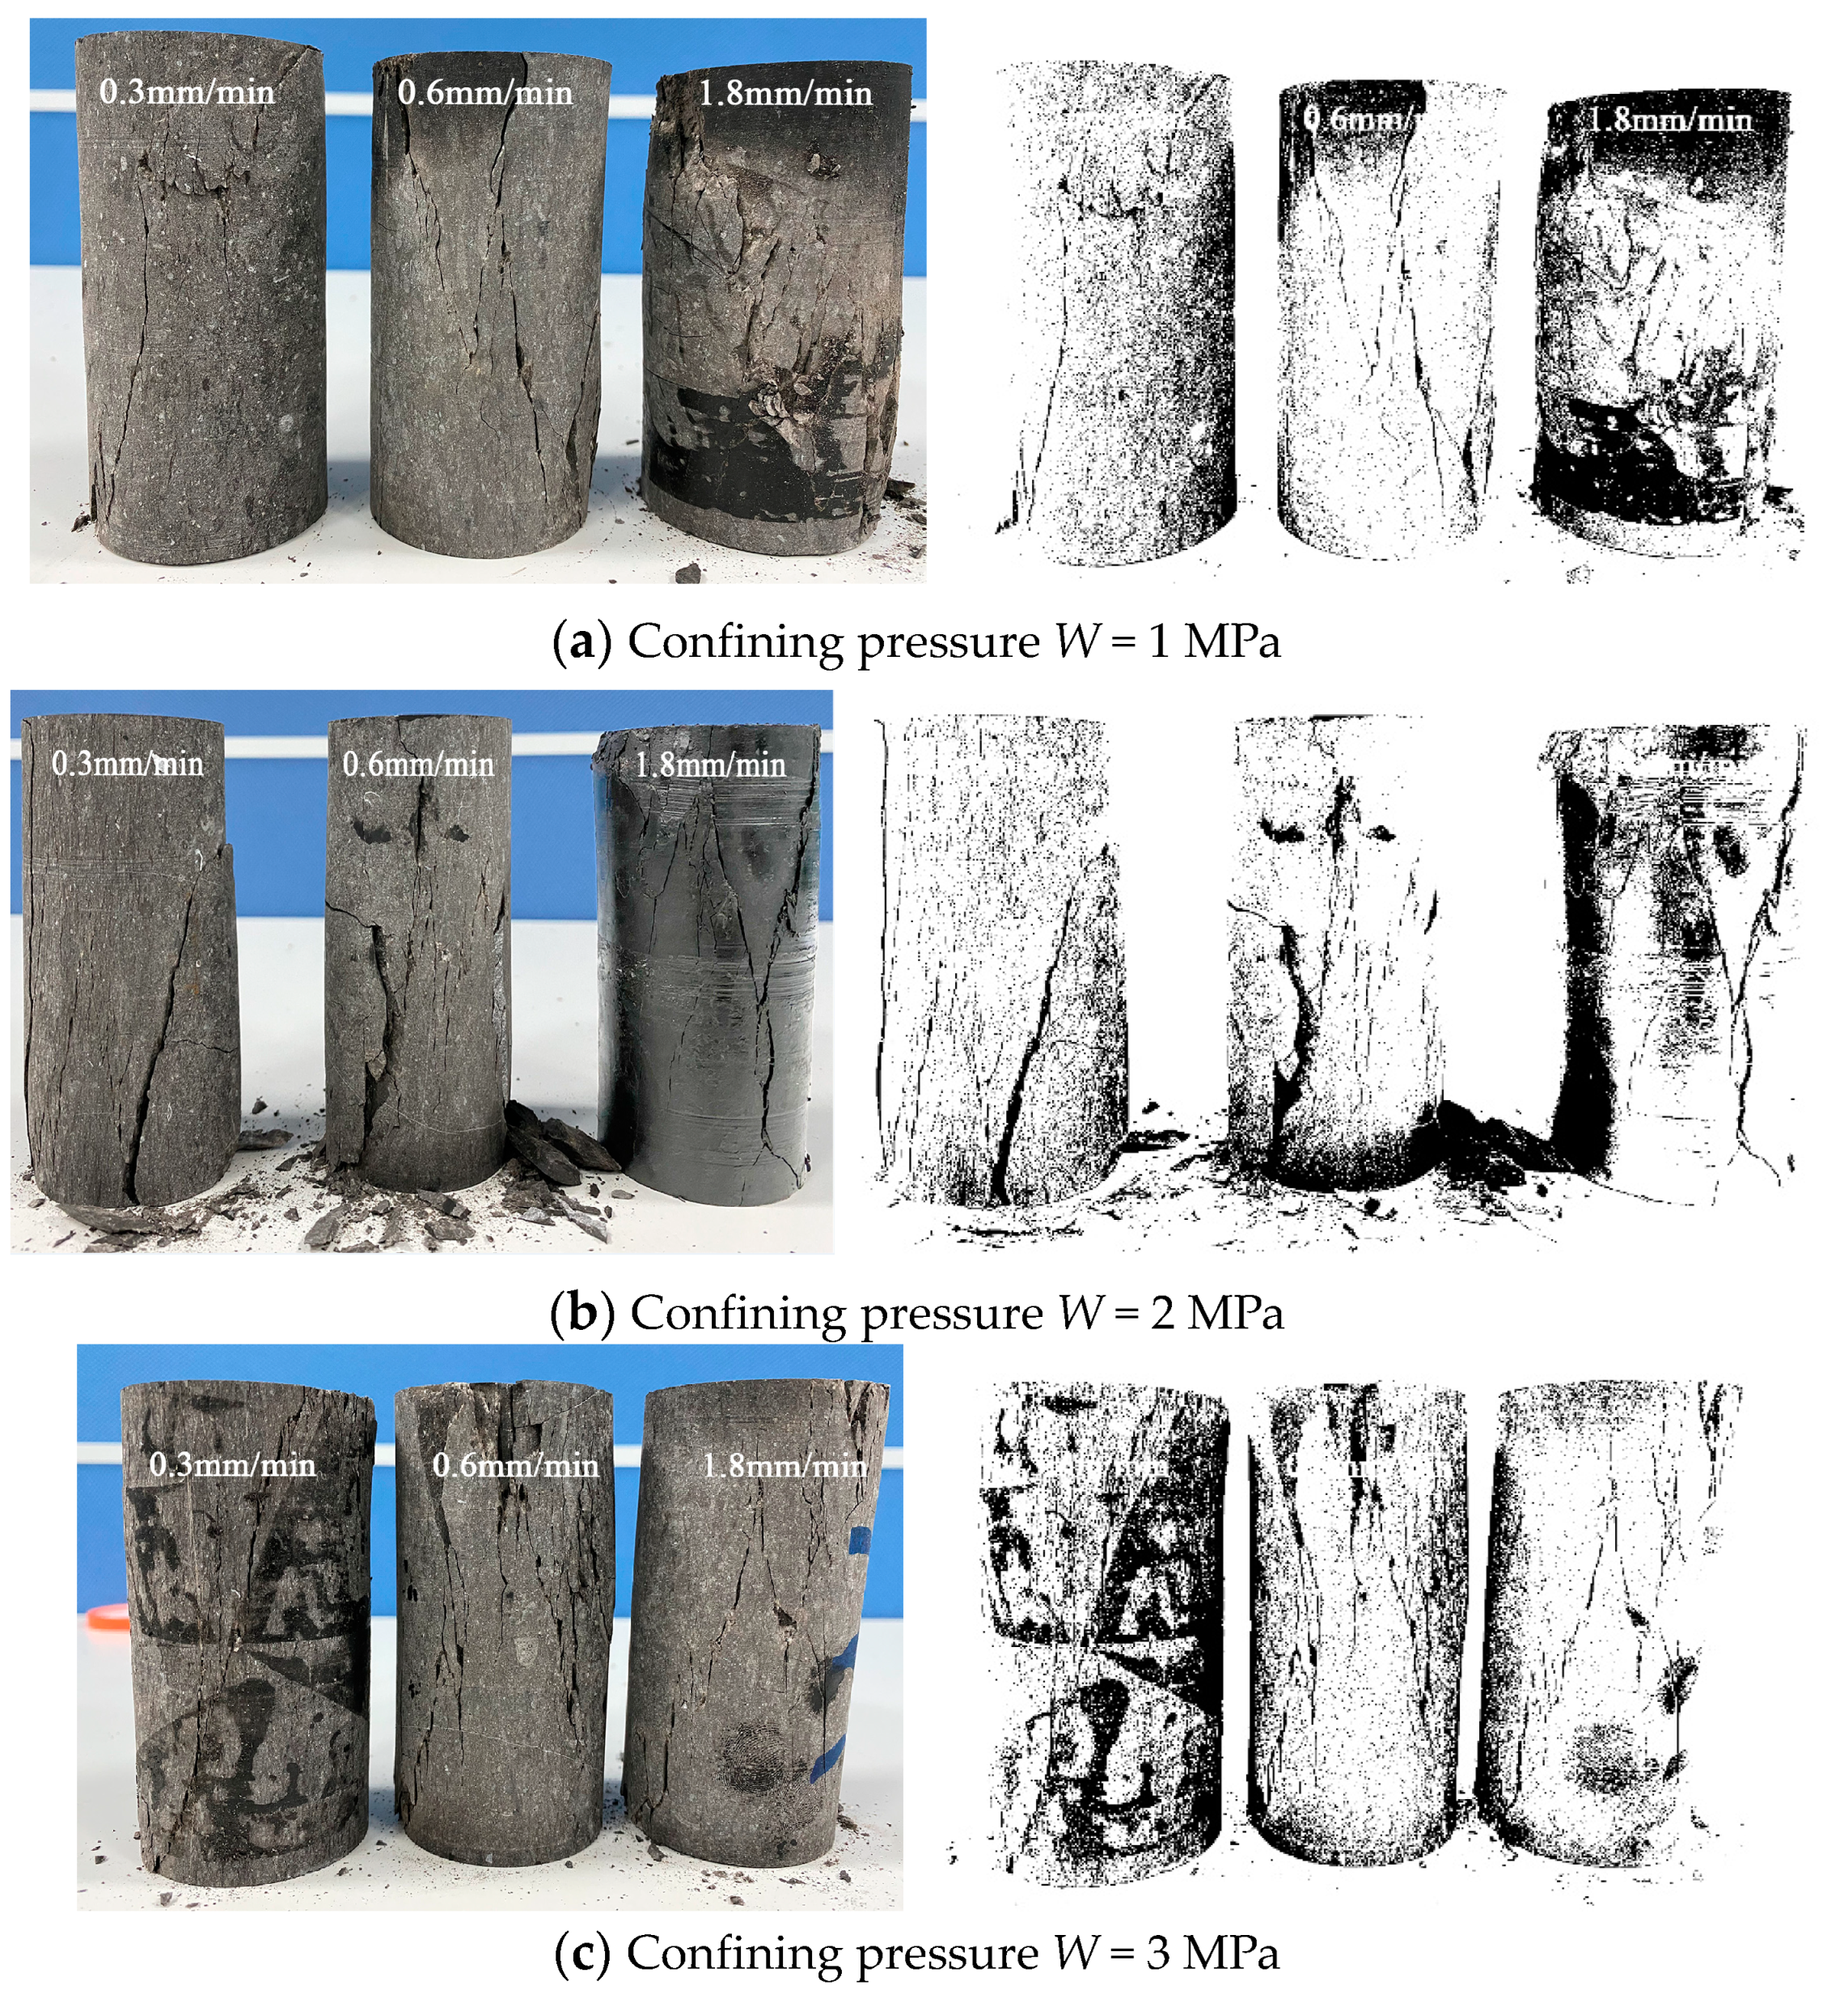
Figure 7.
Diagram of characteristic stress corresponding value (Cai et al. [23]).
Figure 7.
Diagram of characteristic stress corresponding value (Cai et al. [23]).
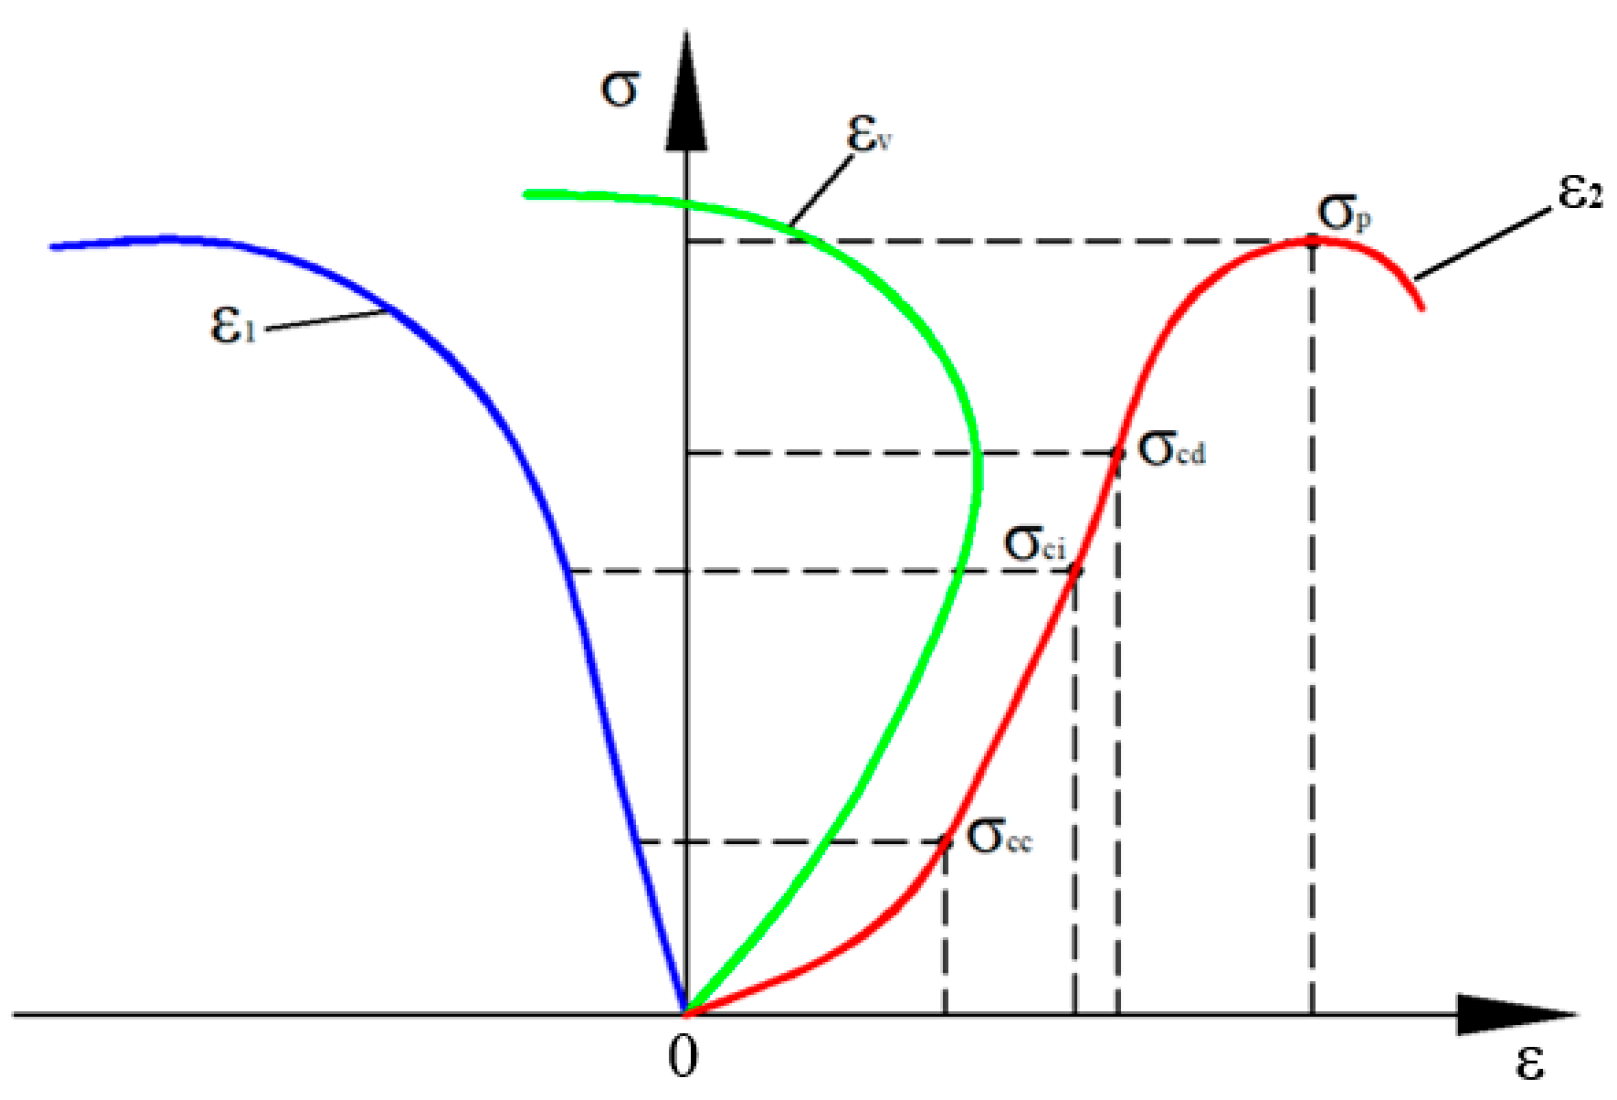
Figure 8.
Characteristic stress curves of specimens.

Figure 9.
Energy evolution curve of rock specimens. (a) Test sample 1 (W = 1 MPa, S = 0.3 mm/min), (b) Test sample 2 (W = 1 MPa, S = 0.6 mm/min), (c) Test sample 3 (W = 1 MPa, S = 1.8 mm/min), (d) Test sample 4 (W = 2 MPa, S = 0.3 mm/min), (e) Test sample 5, (W = 2 MPa, S = 0.6 mm/min), (f) Test sample 6 (W = 2 MPa, S = 1.8 mm/min), (g) Test sample 7 (W = 3 MPa, S = 0.3 mm/min) (h) Test sample 8 (W = 3 MPa, S = 0.6 mm/min), (i) Test sample 9 (W = 3 MPa, S = 1.8 mm/min).
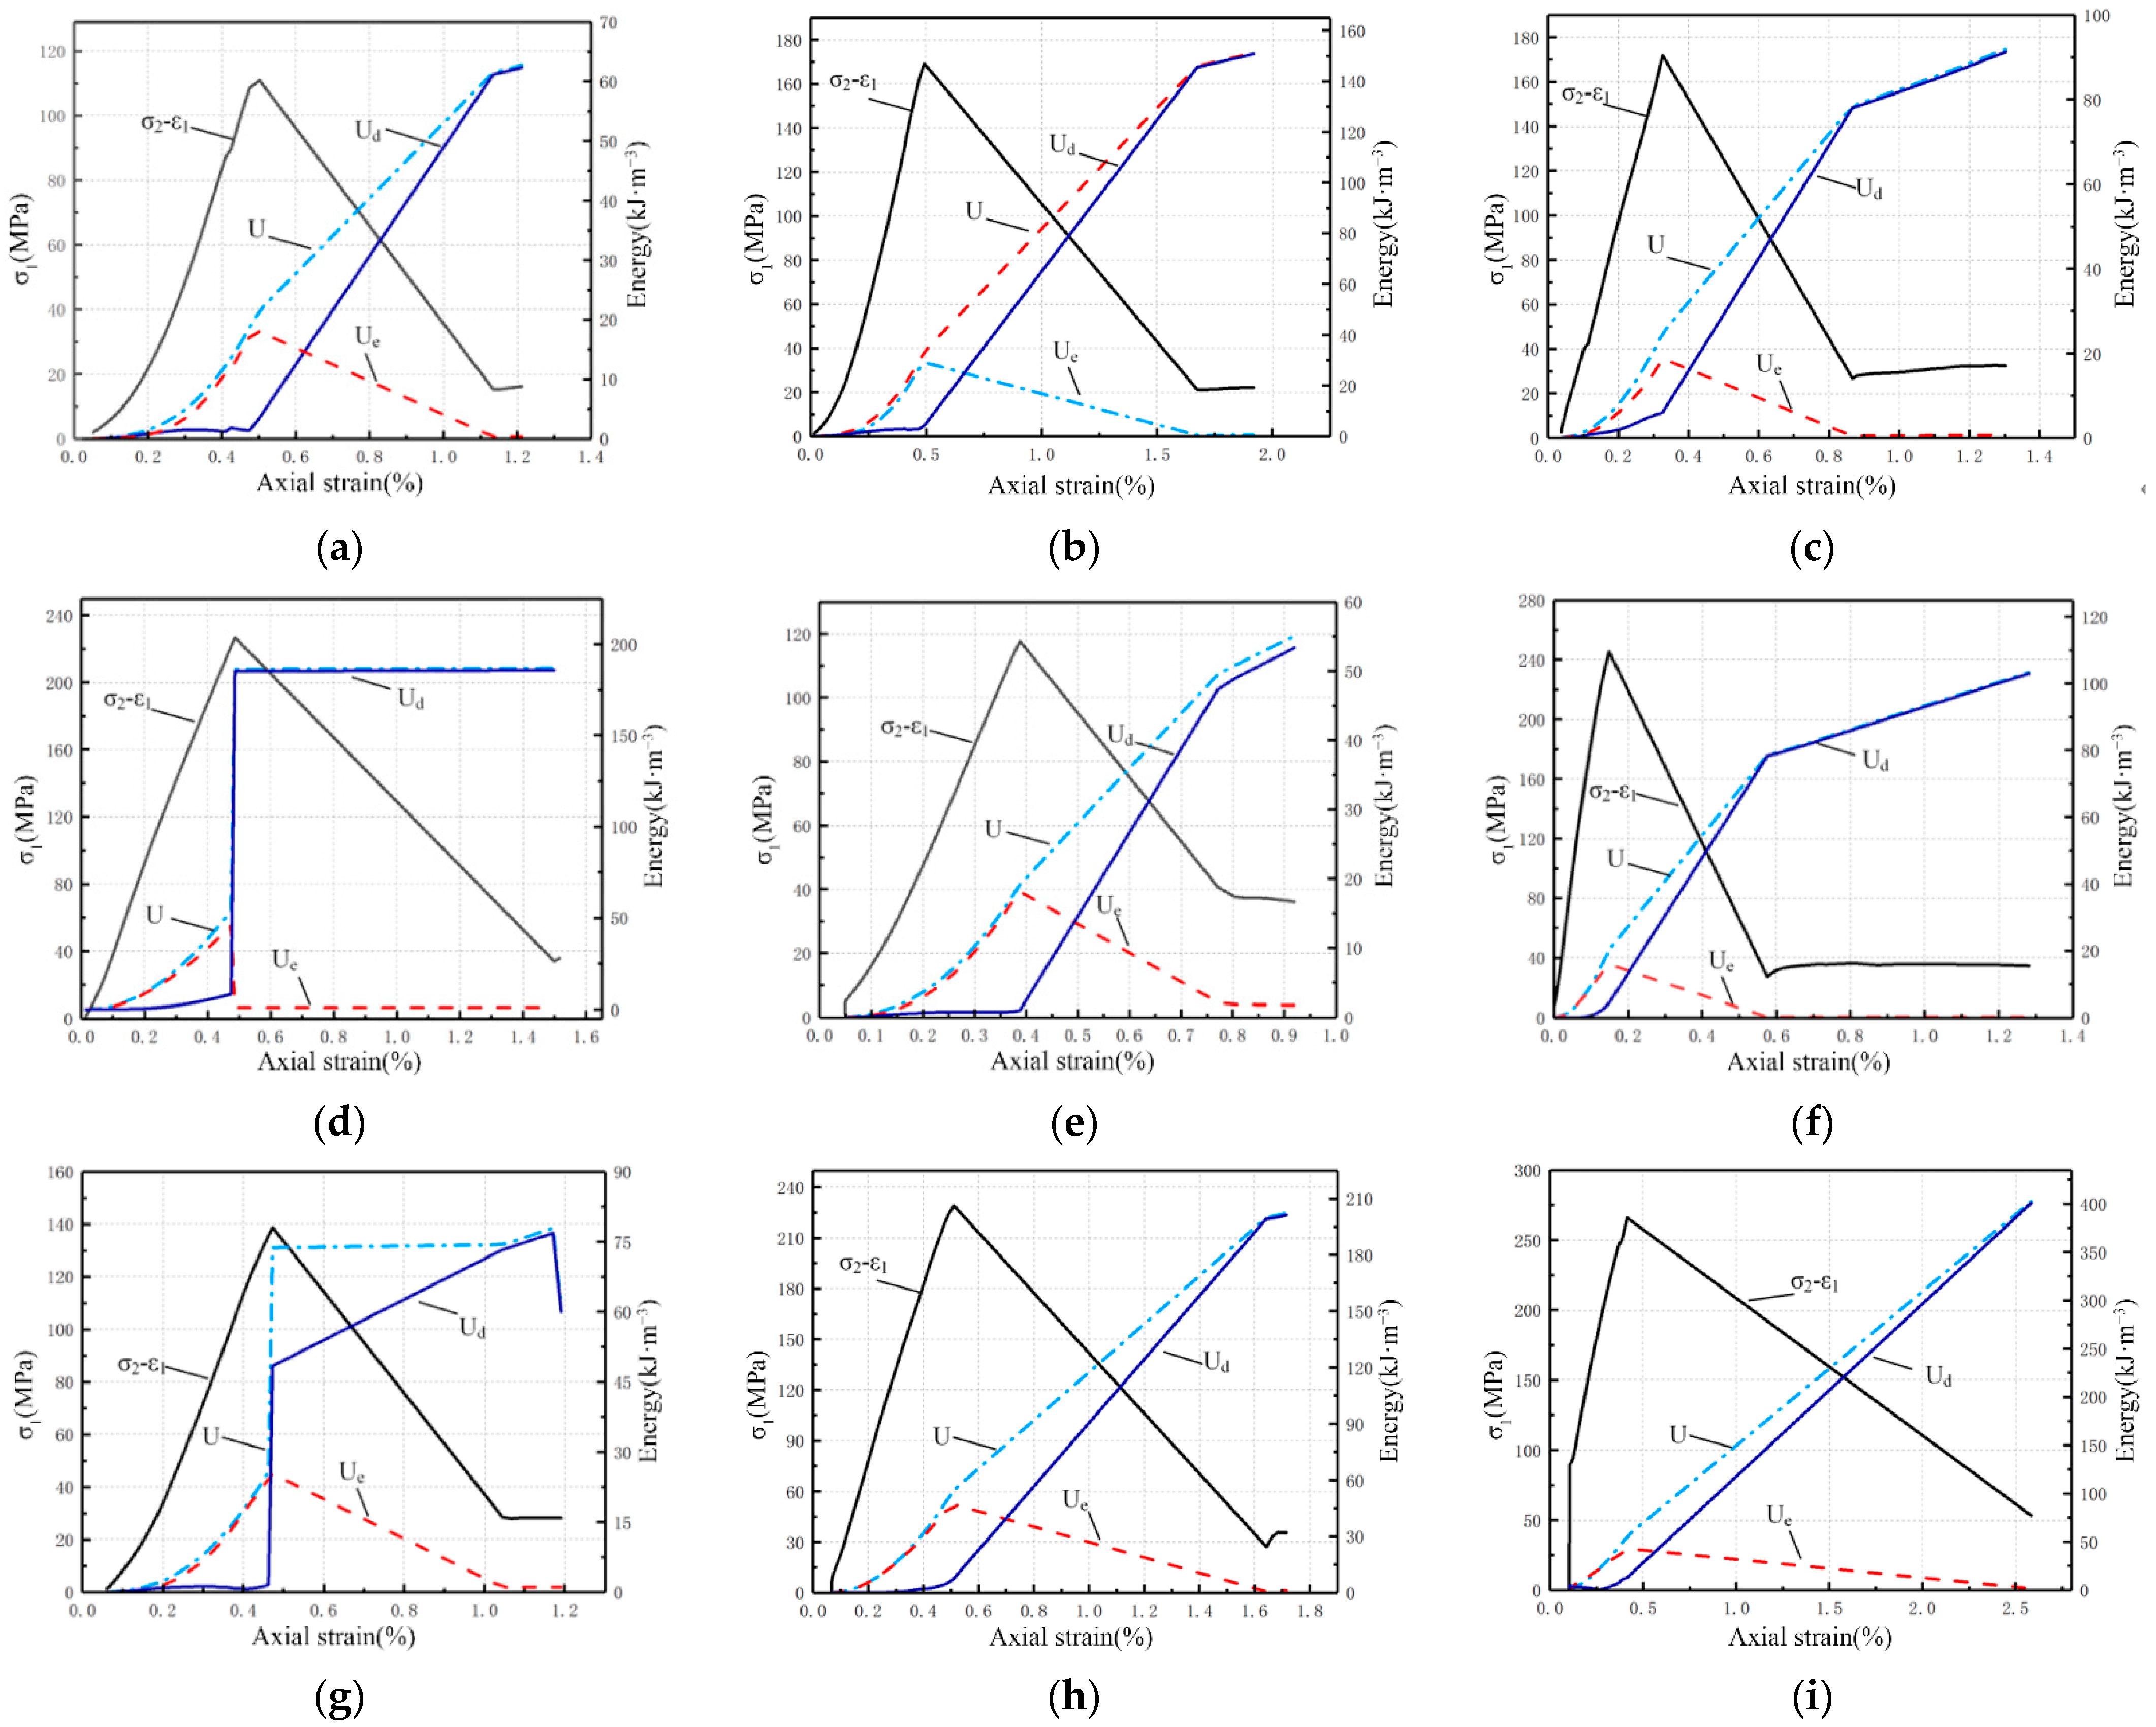
Figure 10.
Energy distribution chart of rock sample.
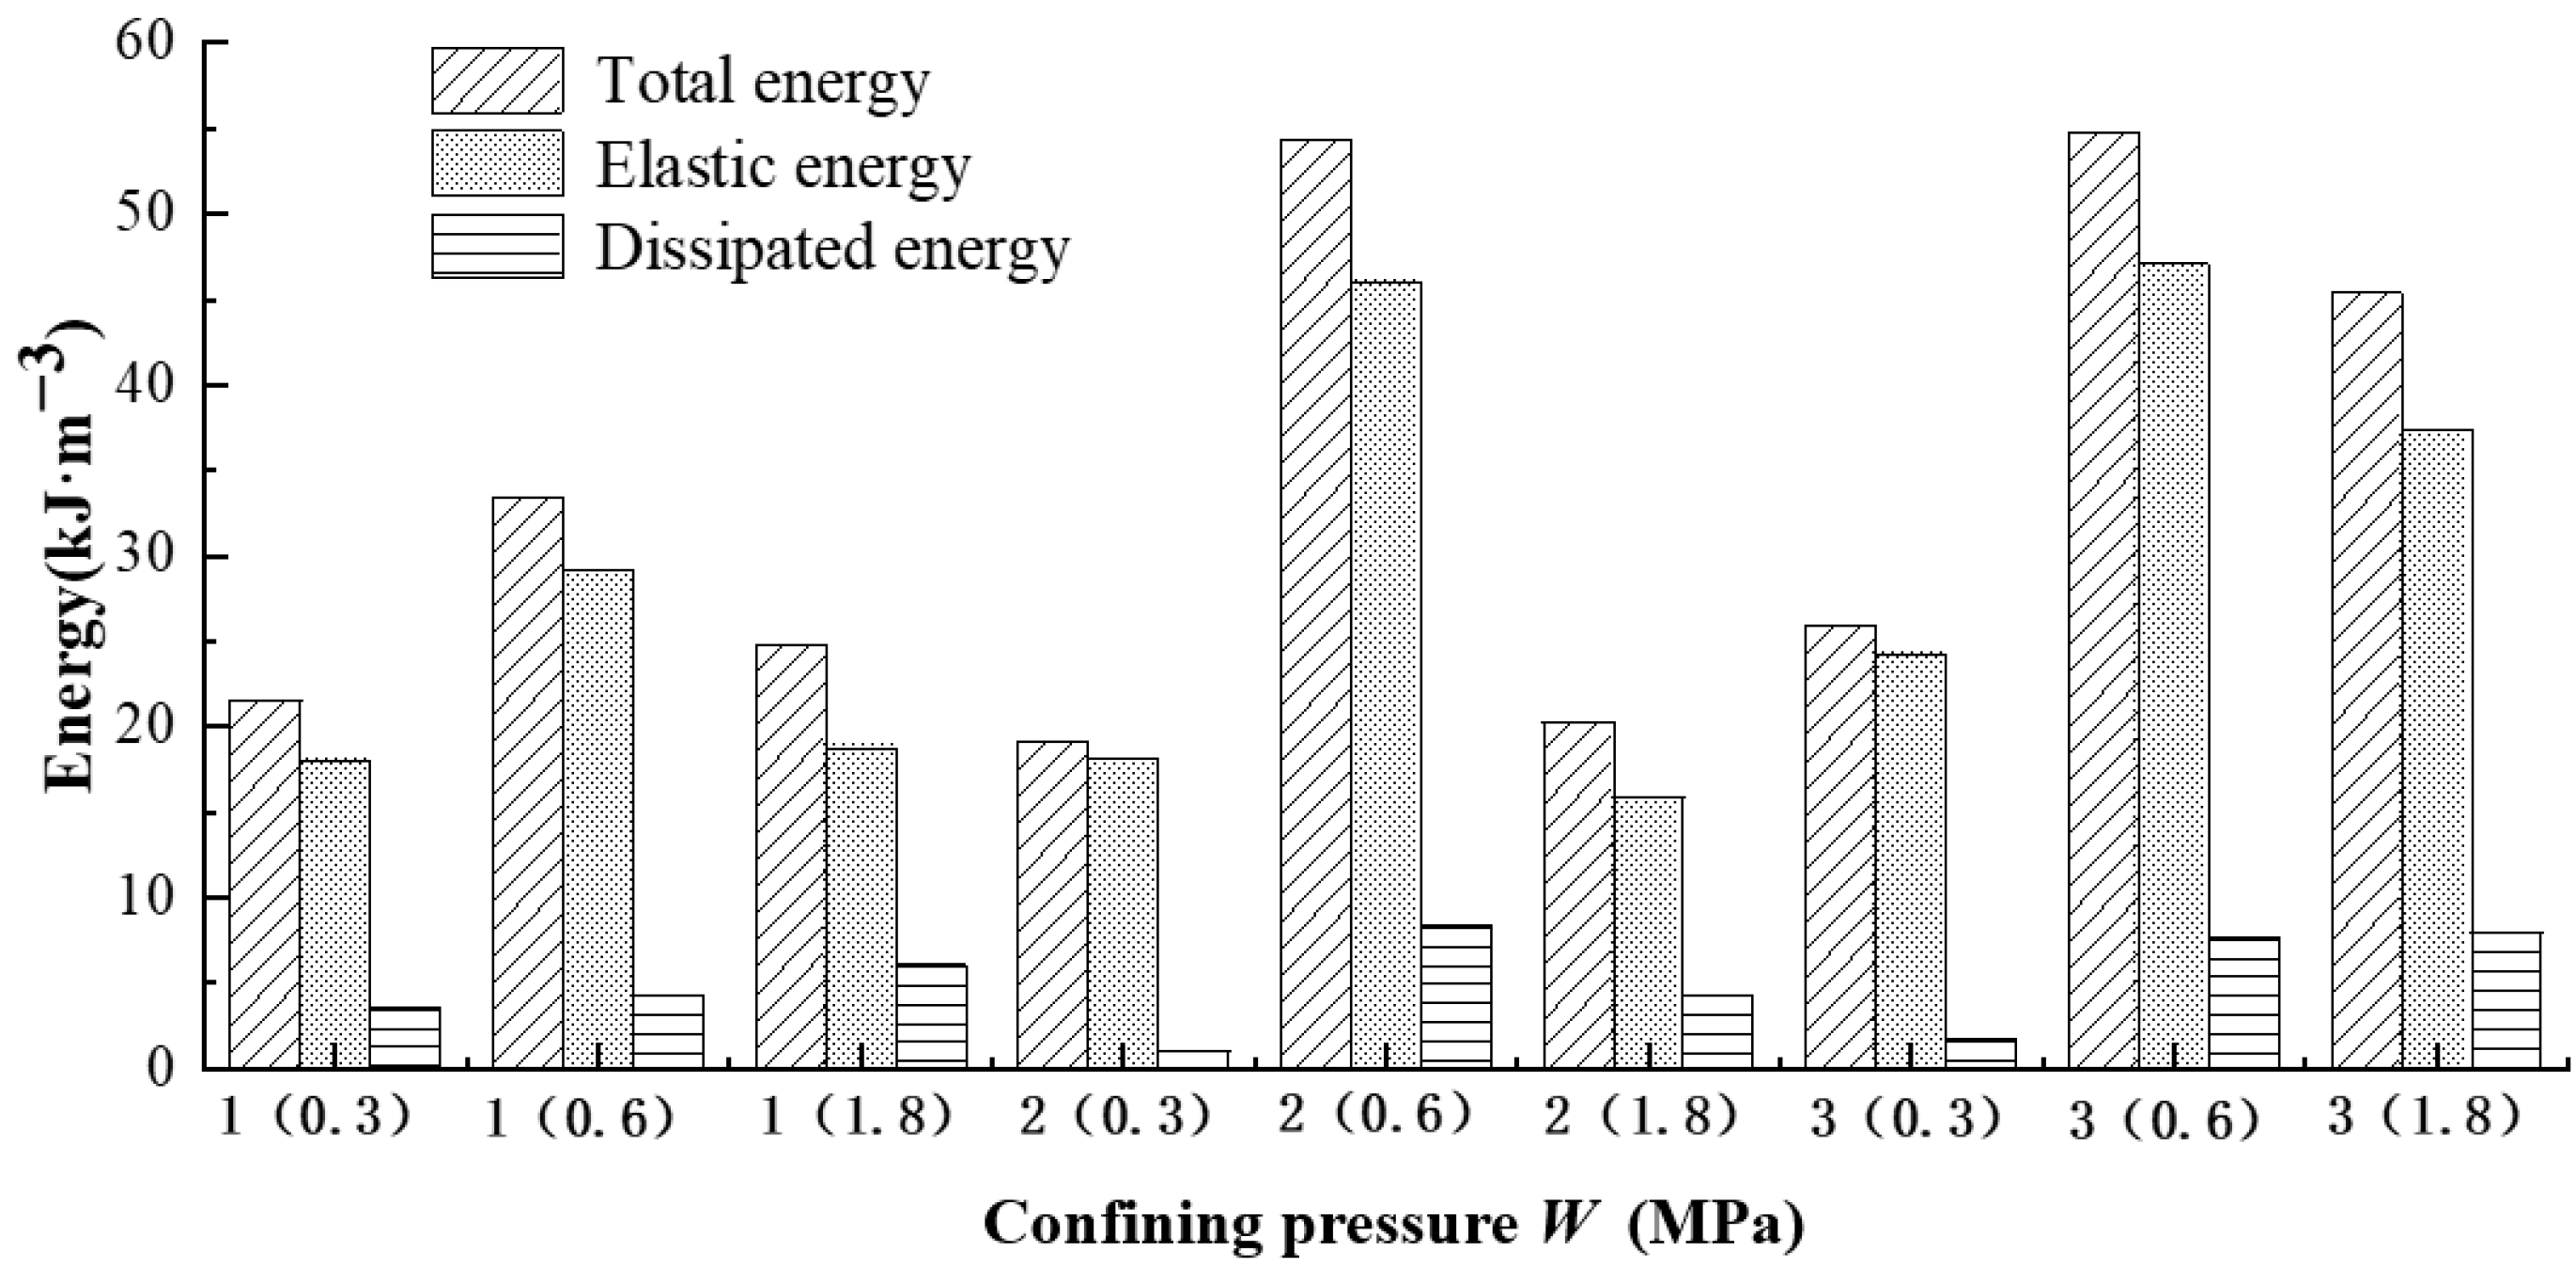
Figure 11.
Elastic strain energy ratio, strain curve diagram. (a) Test sample 1 (W = 1 MPa, S = 0.3 mm/min), (b) Test sample 2(W = 1 MPa, S = 0.6 mm/min), (c) Test sample 3 (W = 1 MPa, S = 1.8 mm/min), (d) Test sample 4 (W = 2 MPa–0.3 mm/min), (e) Test sample 5 (W = 2 MPa, S = 0.6 mm/min), (f) Test sample 6 (W = 2 MPa, S = 1.8 mm/min), (g) Test sample 7 (W = 3 MPa, S = 0.3 mm/min) (h) Test sample 8 (W = 3 MPa, S = 0.6 mm/min), (i) Test sample 9 (W = 3 MPa, S = 1.8 mm/min).

Table 1.
Triaxial compression test results.
| Sample No | Confining Pressure /MPa | Loading Rate /mm min−1 | Peak Strength /MPa | Elastic Modulus /GPa |
|---|---|---|---|---|
| 1 | 1.0 | 0.3 | 110.96 | 34.2 |
| 2 | 1.0 | 0.6 | 169.18 | 49.17 |
| 3 | 1.0 | 1.8 | 171.83 | 58.74 |
| 4 | 2.0 | 0.3 | 117.67 | 38.2 |
| 5 | 2.0 | 0.6 | 226.88 | 46.65 |
| 6 | 2.0 | 1.8 | 245.45 | 53.95 |
| 7 | 3.0 | 0.3 | 138.7 | 37.96 |
| 8 | 3.0 | 0.6 | 229.15 | 55.84 |
| 9 | 3.0 | 1.8 | 265.86 | 62.08 |
Publisher’s Note: MDPI stays neutral with regard to jurisdictional claims in published maps and institutional affiliations. |
© 2022 by the authors. Licensee MDPI, Basel, Switzerland. This article is an open access article distributed under the terms and conditions of the Creative Commons Attribution (CC BY) license (https://creativecommons.org/licenses/by/4.0/).
Share and Cite
MDPI and ACS Style
Zheng, H.; Ma, Z.; Zhou, L.; Zhang, D.; Liang, X. Effect of Loading Rate and Confining Pressure on Strength and Energy Characteristics of Mudstone under Pre-Cracking Damage. Energies 2022, 15, 3545. https://doi.org/10.3390/en15103545
AMA Style
Zheng H, Ma Z, Zhou L, Zhang D, Liang X. Effect of Loading Rate and Confining Pressure on Strength and Energy Characteristics of Mudstone under Pre-Cracking Damage. Energies. 2022; 15(10):3545. https://doi.org/10.3390/en15103545
Chicago/Turabian StyleZheng, Hanghang, Zhenqian Ma, Lang Zhou, Dongyue Zhang, and Xuchao Liang. 2022. "Effect of Loading Rate and Confining Pressure on Strength and Energy Characteristics of Mudstone under Pre-Cracking Damage" Energies 15, no. 10: 3545. https://doi.org/10.3390/en15103545
Note that from the first issue of 2016, this journal uses article numbers instead of page numbers. See further details here.