
Mechanism of Electron Acceptor Promoting Propionic Acid Transformation in Anaerobic Fermentation


1
College of Engineering, Northeast Agricultural University, Harbin 150030, China
2
Key Laboratory of Agricultural Renewable Resources Utilization Technology and Equipment in Cold Areas of Heilongjiang Province, Harbin 150030, China
*
Authors to whom correspondence should be addressed.
Energies 2022, 15(11), 3947; https://doi.org/10.3390/en15113947
Submission received: 30 April 2022
/
Revised: 19 May 2022
/
Accepted: 24 May 2022
/
Published: 27 May 2022
(This article belongs to the Special Issue Advances in Biomass for Energy Technologies)
Abstract
:To improve the conversion efficiency of propionic acid in the post-anaerobic fermentation of biogas slurry, the anaerobic fermentation process using biogas slurry with a high acid content was simulated in an anaerobic reactor at 35 ± 0.5 °C using sodium propionate as the sole substrate. The effects of different electron acceptors (NO3−, SO42− and Fe3+) on propionic acid conversion and the succession of microbial community structures were investigated. The results showed that the experimental group with the electron acceptor NO3− exhibited the best anaerobic fermentation effect, with a maximum propionate removal rate of 94%, which was 36% higher than the control group without an electron acceptor. The maximum methane production rate was 307.6 mL/g COD, an increase of 30% compared with the control group. Thauera, Aquabacterium, Desulfomicrobium, Clostridium_sensu_stricto_1, and other functional microorganisms were all enriched. The dominant functional genes related to redox reactions, such as K03711, K00384, and K03406, were highly enriched in the reactor when Fe3+ and NO3− were added. The study shows that adding an electron acceptor can enhance interactions between microorganisms, achieve efficient propionate conversion, and improve methane production in the system.

1. Introduction
Biogas slurry contains a significant amount of volatile fatty acids, making it generally unsuitable for biogas slurry reflux or fertilizer utilization [1,2]. Generally, a post-fermentation tank (pool) should be set up to reduce the amount of VFAs in the biogas slurry [3]. However, most of the residual volatile acid in the biogas slurry is propionic acid, which is difficult to convert [4,5], since the conversion process has the characteristics of high Gibbs free energy and slow progress [6,7,8]. This will increase the biogas slurry post-fermentation period and will require a large amount of equipment and considerable investment. In addition, the electron acceptor in the anaerobic post-fermentation system is dominated by a single HCO3− ion [9,10], while fatty-acid-oxidizing bacteria and carbonate-reducing bacteria (methanogens) are usually accomplished by indirect, inefficient electron transport [11]. Therefore, the lack of electron acceptor species in biogas slurry may be one of the reasons why propionic acid is difficult to convert. It is necessary to explore an economical and efficient way to achieve efficient transformation and removal of propionic acid accumulated in biogas slurry post-fermentation.
Using electron acceptors to degrade organic compounds has become a hot topic of research in recent years, and electron acceptors that metabolize organic acids have also been reported in several studies. Nitrates have been reduced in oilfield wastewater containing many volatile acids, with acetic acid and propionic acid preferentially utilized as electron donors. Microbial community analysis showed that the denitrifying bacteria Thauera was the dominant bacterial genus [12], except for nitrates. The addition of sulfate can also promote the conversion rate of propionic acid [13]. In the process of anaerobic digestion of excess sludge [14], iron-reducing microorganisms use organic acids to reduce Fe3+ to Fe2+. Different electron acceptors have different effects on the degradation and transformation of organic acids. These common electron acceptor substances are often discharged in the form of wastewater and waste residue, such as industrial wastewater (NO3−) [15], furfural wastewater (SO42−) [16], and waste iron filings (Fe3+), in some fields of production [17]. Therefore, if these cheap electron acceptors can be used to increase the removal of propionic acid accumulated in fermentation systems, processing costs can be reduced and the stability of anaerobic fermentation systems can be improved, which will have significant research and practical applications.
To our knowledge, there are few studies regarding the use of electron acceptors to remove propionic acid from a biogas slurry post-fermentation system. This study attempted to add common electron acceptor substances (NO3−, SO42−, Fe3+) to an anaerobic fermentation reactor, simulating biogas slurry post-fermentation systems with a high acid content, in order to explore the changing laws of fermentation characteristics, such as propionate removal rate, methane production characteristics, and ion concentration in effluent, under different electron acceptor systems. As such, 16S rDNA sequencing was used to analyze the succession of microbial community structure, and PICRUSt2 software was used to analyze functional genes. The study’s objective was to strengthen the conversion and reduction of propionate by adjusting the electron acceptor environment of the system. Increasing the operational efficiency of the post-liquid fermentation system, shortening the fermentation period, and improving the quality of biogas slurry can provide new reference ideas and a theoretical basis.
2. Materials and Methods
2.1. Materials
The inoculated sludge was taken from anaerobic sludge cultivated using cow dung as the substrate in the laboratory of Northeast Agricultural University. Details about the anaerobic sludge cultivated are as follows: Take fresh cow dung and put it in a jar, add water to the jar, the mass ratio of cow dung and water is 1:3, and acclimatize at 35 ± 0.5 °C until no gas is produced. The acclimation time is 25 days. We need to shake when using to ensure mixing. The TS and VS were 2.89% and 1.65%, respectively. The pH was 7.23. A detailed breakdown of the trace elements is shown in Table 1.
2.2. Experimental Setup
Culture experiments were conducted in four 500 mL glass bottles simulating anaerobic reactors, in which the working volume was 400 mL. The test device is shown in Figure 1. Each reactor was connected to the corresponding inlet and outlet pipelines and exhaust pipes. They are opened when feeding and discharging materials; otherwise, they are clamped with a stop valve. One end of the exhaust pipe was connected to the reaction bottle, and the other end of the gas outlet was connected to a clean gas-collecting bottle. Before the test, the airtightness of the whole system was confirmed and trial operations of the feeding and discharging processes were carried out to optimally adjust the operational performance of the system to ensure that the entire anaerobic fermentation system can be successfully applied to the follow-up research [19]. Before the experiment, N2 was added to the reactors to ensure good anaerobic conditions [20].
2.3. Experimental Design
The experiment was carried out in a medium temperature (35 ± 0.5 °C) reactor, which included four groups of reactors, labeled as R1−N, R2−S, R3−F, and R4−CK. R1−N used NO3− as the sole electron acceptor, R2−S used SO42−, R3−F used Fe3+, and R4−CK acted as the control group and contained no electron acceptor. Before commencing the experiment, different concentrations of propionate solutions were prepared as the anaerobic fermentation substrate. The influent concentration of sodium propionate in the first stage (S1) of 0–8 d was 8 g COD/L.
The specific preparation method is as follows: Four 100 mL beakers were labeled as R1−N, R2−S, R3−F, and R4−CK. Next, 7.38 g sodium propionate, 0.11 g KH₂PO4, 0.17 g K2HPO4, 0.05 g Na₂SO₄, 0.1 g MgCl2·6H2O, and 0.05 g CaCl2·2H2O were weighed and simultaneously added to the four groups of beakers together with 10 mL trace element solution. Then, 0.03 mmol NaNO3, 0.03 mmol Na2SO4, and 0.03 mmol FeCl3 were added to R1−N, R2−S, and R3−F, respectively, dissolved in distilled water, transferred to a 1 L constant-volume volumetric flask, and placed in a 4 °C refrigerator after storing them in a reagent bottle. In the second stage (S2), the influent concentration of sodium propionate was 16 g COD/L for 8–24 d, and the weight of sodium propionate was 14.76 g. The rest of the substances were added according to the formula in the first stage. The water concentration was 24 g COD/L(S3), the weight of sodium propionate was 22.14 g, and the rest of the substances were added according to the first stage formula. The specific experimental design is shown in Table 2. Before feeding, an anaerobic environment was maintained using N2 aeration. After aeration, 400 mL of inoculum was added to each reactor, 50 mL of material was discharged, 50 mL of feed was added, and the mixture was stirred for 5 min every 24 h at a stirring rate of 40 r/min, with a total reaction period of 48 d. Each of the indicators measured above was measured three times, and the average value was taken.
2.4. Physicochemical Analysis
TS and VS were determined by the APHA method [21]. VFAs were determined by an Agilent-6890N gas chromatograph, and the chromatographic conditions referred to [22]. The concentrations of nitrate and sulfate ions were determined by ion chromatography (Metrohm 930, Herisau, Switzerland), the carbonate eluent was the mobile phase, and the flow rate was 0.7 mL/min. The column temperature was 25 °C, the injection volume was 10 μL, the gradient was washed, and the culture solution was aseptically sampled with a N2 flushing syringe. The iron ion concentration was determined by o-phenanthroline spectrophotometry [23]. The Agilent-6890N gas chromatograph was used to determine the methane content in the biogas, and the gas chromatographic conditions were referred to [22]. Biogas production was measured using the water displacement method [24]. Finally, the spatial structure of the granular sludge was observed and photographed using field emission scanning electron microscopy (FESEM) (Hitachi SU8010, Tokyo, Japan) [25].
2.5. Microbial Community Analysis
Microbial diversity: The sample DNA was extracted, tested for purity and concentration, and then diluted with sterile water to 1 ng/μL. The general primers for the sludge bacteria archaea were 515F (GTGCCAGCMGCCGCGGTAA) and 806R (GGACTACHVGGGTTWTCTAAT), and the V3+V4 region was selected. PCR was performed according to the amplified area. Once the library was qualified, it was sequenced using a NovaSeq6000 sequencing system. The sample reads were spliced using FLASH software to obtain the original data. The resulting raw data were quality controlled using fast software [26], resulting in a high-quality dataset. Usearch software was used to perform quality control detection to remove chimeras and to obtain the final valid data. For the useful data obtained above, the DADA2 module or deblur in the QIIME2 software was used to denoise (DADA2 is used by default) and filter out an abundance of less than 5. The sequence of the final (Amplicon Sequence Variants (ASVs), i.e., amplicon sequence variation) and feature table were obtained compared with the database using the classify-Sklearn module in the QIIME2 software to obtain the specific information of each ASV. The information was then analyzed and summarized.
The functional gene analysis was performed using the PICRUSt2 analysis software. A complete gene function spectrum was constructed according to the microbial flora structure information obtained by high-throughput sequencing. The functional gene information of different sample flora was obtained, and the data were compared with the KEGG database [27].
3. Results and Discussion
3.1. Propionate Removal Rate
Figure 2 depicts the propionate removal rate change curve and shows that the removal rate of propionate in the treatment group with an electron acceptor was consistently higher than in the control group without an electron acceptor. The maximum propionate removal rates of R1−N, R2−S, and R3−F containing electron acceptors NO3−, SO42−, and Fe3+ were 94%, 90%, and 91%, respectively, and were 36%, 30%, and 32% higher, respectively, than the control group. When the influent concentration was relatively low, the propionate removal rate of R1−N, R2−S, and R3−F increased rapidly. Despite fluctuations, the propionate removal rate was always higher than 80%, with the propionate removal rate of R1−N higher than that of R2−S and R3−F. When the influent concentration rose to 24 g COD/L, under the continuous impact of high-influent concentration, the propionate removal rate of the four groups began to decrease, with the control group decreasing most rapidly; R1−N, R2−S, R3−F decreased more slowly, but R2−S decreased faster than both R1−N and R3−F. Studies have shown that the addition of electron acceptors can promote the metabolization of propionic acid and improve its degradation rate [28,29,30]. According to the thermodynamic principle [31], the priority of anaerobic respiratory electron acceptors is NO3− > Fe3+ > SO42−, which is consistent with the research results. The overall propionate degradation rate of R1−N containing electron acceptor NO3− is higher than R2−S and slightly higher than R3−F during anaerobic fermentation. The difference in electron sequence utilization is the fundamental reason for the different degradation rates of propionate under different electron acceptors.
3.2. Changes in Ion Concentration
The change curve of ion concentration is shown in Figure 3a–c. When the concentration of influent water is relatively low, NO2− increases rapidly, the concentration of NO3− is always less than 2 mg/L, and the utilization rate reaches more than 99%. As influent water concentration increased, the concentration of NO2− initially increased and then decreased gradually [32]. The decrease was mainly because NO2− was also a suitable electron acceptor [33]. Proliferation was active, and NO2− was gradually utilized. When the influent concentration was low, the concentration of SO32− in R2−S gradually increased. Some studies have shown that the conversion of SO32− into H2S, the final product of sulfate reduction, is the rate-limiting step [34]. At this time, the degradation rate of SO42− was so rapid that the cumulative concentration gradually decreased, indicating that the sulfate-reducing bacteria were more active this time, and their ability to use sulfur to metabolize propionic acid was strong [35]. Once it has adapted, its growth rate will gradually increase its ability to utilize SO42− As the influent concentration increased, the concentration of SO32− decreased rapidly. There may be two reasons for this, the first of which is that SO32− is utilized by sulfate-reducing bacteria [36], while the second possibility is the disproportionation reaction with H2S, the final product of the reduction reaction of SO42− [37]. In the initial stage of the reaction, Fe3+ concentration increased gradually. When the influent concentration was high, the Fe2+ concentration increased, but the rate was still low relative to the dosage. The reason for this may be that most of the Fe2+ ions were utilized by microorganisms and underwent precipitation reactions with anions, such as CO32−, in the system [38].
3.3. Methane Production Rate
The methane production rate change curve is shown in Figure 4. The methane production rate of the control group without electron acceptors was constantly lower than the experimental groups, which contained the electron acceptors NO3−, SO42−, and Fe3+. The experimental groups R1−N, R2−S, and R3−F had a maximum methane production rate of 307.6 NmL/g COD, 306.1 NmL/g COD, and 297.14 NmL/g COD, which were 31%, 30%, and 26% higher than the control group’s maximum methane production rate, respectively. The formula for the complete conversion of propionic acid to methane is 4CH3CH2COO− + 4H+ + 2H2O → 7CH4 + 5CO2. Theoretically, 1 mol of propionic acid is completely converted to produce 7/4 mol of methane. The maximum methane production rates of the experimental groups R1−N, R2−S, and R3−F with electron acceptors and the control group without electron acceptors accounted for 87.89%, 87.46%, 84.90%, and 67.14% of the theoretical methane production rates, respectively. The reason for the higher methane production rate in the experimental groups with electron acceptors may be because the addition of electron acceptors changes the redox potential in the anaerobic fermentation system [39,40]. When the influent concentration was relatively low, the methane production rates of the four treatments fluctuated, but the fluctuation range was small. When the influent concentration increased to 24 g COD/L, the methane production rates of the four treatments all decreased, although the control group with no electron acceptor decreased much more rapidly than the R1−N, R2−S, and R3−F groups with the electron acceptors. Additionally, despite the decrease in methane production rates in the experimental groups, they were still higher than in the control group. This indicates that the treatment group, which contained electron acceptors, was resistant to the shock of a high propionic acid concentration. The methanogenesis rate of R1−N with the electron acceptor NO3− and R3−F with the electron acceptor Fe3+ also fluctuated less due to acid shock. Moreover, in R1−N, with electron acceptor NO3−, the methane production rate decreased slowly, and the acid shock resistance was the best.
3.4. Sludge Morphology Analysis
The observation figure of the granular sludge structure visualized under FESEM is shown in Figure 5. The sludge high-magnification scanning electron microscope depiction of R1−N after anaerobic fermentation is shown in Figure 5a,b, where the multilayer granule sludge structure focusing on thalli with relatively regular shapes are formed, with relatively large sludge particulates. There are distinct boundaries among different microbial flora. The sludge high-magnification scanning electron microscope figure of R1−N after anaerobic fermentation is shown in Figure 5c,d. R2−S is similar to R1−N and contains cocci and bacilli. Some bacilli are chain typed, with apparent marginalization, a relatively regular shape, and a three-dimensional structure. The sludge high-magnification scanning electron microscope figure of R3−F after anaerobic fermentation is shown in Figure 5e,f. Unlike in R1−N and R2−S, the sludge in R3−F shows a three-dimensional network spatial structure composed of end-to-end thalli. There are multiple pore spaces of all sizes, both inside and on the surface of granule sludge, through which propionic acid spreads to the inside of the sludge from its periphery to generate biogas used for reproductive growth and metabolism in the thalli. This reticular structure increases the sludge’s stability, can show strong fighting capacity in continuous flushing of high-concentration inlet water, and can generate methane with high activity. The sludge high-magnification scanning electron microscope figure of R4−CK after anaerobic fermentation is shown in Figure 5g,h. The reactor contains Staphylococcus, Bacillus, and filamentous bacteria. Compared with the R1−N, R2−S, and R3−F sludge structure, to which electron acceptors NO3−, SO42−, and Fe3+ are added, the sludge structure of R4−CK is relatively scattered and is not stereometric [41]. The generated granule sludge rapidly forms a layered structure in the propionic acid conversion comparison group [42]. The granule sludge may form at the advantageous position where the organic substances and products are removed due to germ pursuit for their own growth, which also provides the basis for the structural differences in granule sludge in different electron acceptor systems.
3.5. Microbial Community Niche under Different Electron Acceptor Systems
The biodiversity indices of the microbial communities in the four sludge groups are shown in Table 3. The optimized sequences of the R1−N, R2−S, R3−F, and control group reactors formed 701, 649, 609, and 558 OTUs, respectively. The microbial library coverage of the four samples all reached 100%, which indicated that the sequencing results could reflect the actual value of microorganisms in the samples [43]. Table 3 also shows that R1−N, R2−S, and R3−F added electron acceptors NO3−, SO42−, and Fe3+, whose Chao1, Shanon, and Simpson indices were higher than R4−CK, with the largest Chao1, Shanon and Simpson indices found in R1−N. Species diversity and evenness were also highest in R1−N.
The Beta Diversity Index distance matrix heatmap is shown in Figure 6. The figure shows that the circle at the intersection of R1−N and R4−CK has the most prominent and darkest color, and the unweighted Unifrac value is 0.5~0.6. The circle at the intersection of R1−N and R3−F is relatively large, the color is relatively dark, and the unweighted Unifrac value is 0.4~0.5. It showed that the floral diversity of R1−N containing electron acceptor NO3− was significantly different from that of the control group without the electron acceptor and was also significantly different from R3−F with added electron acceptor Fe3+ [44].
3.6. Structure Analysis of Dominant Flora
Figure 7 shows the phylum-level classification of the microbial communities of the four reactors; those with sequencing abundances of less than 0.5% were classified as others. There was no significant difference in the abundance of bacterial Firmicutes in the four reactor groups. The abundance of Bacteroidota bacteria was largest in R3−F, which had the added electron acceptor Fe3+. Bacteroidota plays a vital role in the degradation of fatty acids and other organic substances [45], which also explains the slow decline in the propionate removal rate of R3−F containing Fe3+ as the influent concentration increased. As new archaea, Halobacterota was most abundant in R2−S with the electron acceptor SO42−, which indicates that adding electron acceptor SO42− can promote propionic acid oxidation, producing methane. The greatest abundance of Proteobacteria was found in R1−N with electron acceptor NO3−. Studies have shown that Proteobacteria are the main functional microorganisms in the removal of high-COD wastewater [46], which also explains the reason for the rapid removal rate of R1−N propionate containing electron acceptor NO3−. Studies have shown that Bacteroidota, Proteobacteria, and Firmicutes are commonly found in anaerobic fermentation microorganisms, which play an essential role in organic matter degradation and transformation [47]. The sum of the abundance of the three is the largest, R3−F, followed by R1−N, indicating that the overall conversion effect of propionic acid of R3−F and R1−N is better, which is consistent with the methane production rate and propionate removal results.
A heatmap can directly express the size of the data with a defined color depth by classifying and clustering high-abundance species and sample information for species difference analysis [48]. In this study, the top 35 genera by abundance were selected and incorporated into a heatmap. The closer the block’s color is to warm red, the greater the abundance. The heatmap of the propionic acid community treated with different electron acceptors is shown in Figure 8. Compared with the control group without an electron acceptor, the dominant bacteria in the experimental group with an electron acceptor shifted. Thauera and Aquabacterium in R1−N are denitrifying bacteria that can utilize NO3− and NO2− [49]. Their greater abundance also indicates that denitrifying bacteria can utilize NO3− during propionic acid conversion. Desulfomicrobium, which was found in R2−S, is a sulfate-reducing bacteria genus. The presence of Desulfomicrobium also shows that electron acceptor SO42− can use propionic acid as an electron donor for redox reactions in the fermentation system. However, some scholars have noted that sulfate-reducing bacteria will compete with methanogens for substrates [50], which is why the overall methane production rate for R2−S is lower than that for R1−N and R3−F. Clostridium_sensu_stricto_1 in R3−F has a reddish color and high abundance. Studies have shown that Clostridium_sensu_stricto_1 is a genus of iron-reducing bacteria [51], and its high abundance also indicates that iron-reducing bacteria are active in propionic acid conversion. Bacterial communities that had electron acceptors NO3− and Fe3+ added had more warm-red color blocks at the genus level. Species abundance is more significant, in keeping with previous research results, indicating that different electron acceptors will form different types of propionic acid. The microbial community structure can be adjusted according to actual production needs.
3.7. Functional Genes Analysis
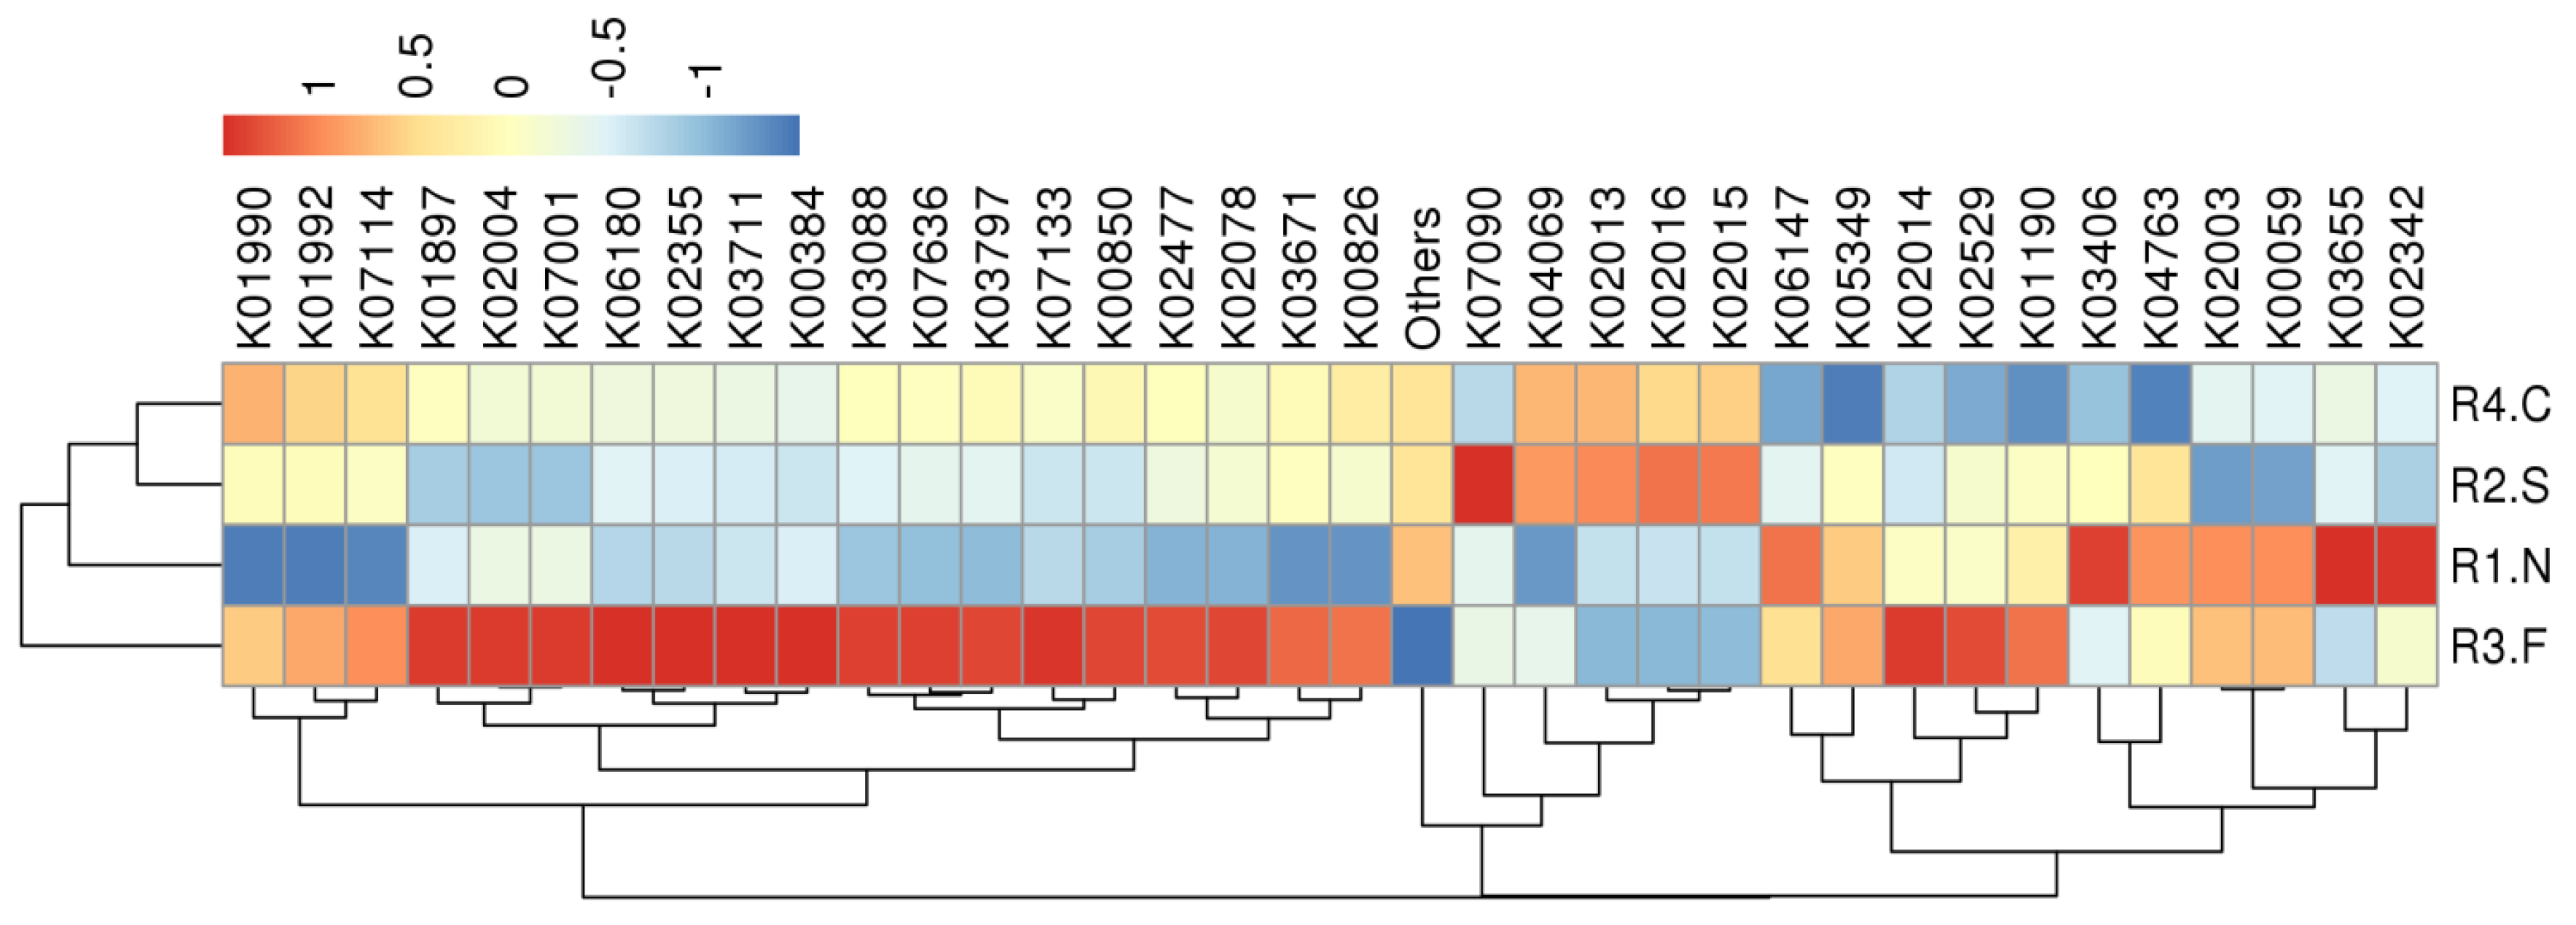
The top 35 functional genes with bacterial abundance in different samples were selected using PICRUSt2 software. According to their abundance information in each sample, they were clustered from the two levels of species and samples and drawn into a heat map. For higher genus abundance near the warm-red fungus, the sequencing data were compared with the KEGG database. A heat map of the relative abundance of KO genes is shown in Figure 9.
R3−F, containing electron acceptor Fe3+, had the warmest red-color blocks and the most abundant functional genes, followed by R1−N containing electron acceptor NO3−. The appearance of multiple enzyme protein genes also essentially explains that Fe3+ and NO3− had better conversion effects on propionic acid. The K03711 (fur, zur, furB; Fur family transcriptional regulator, ferric uptake regulator) in R3−F can bind to ferrous ions and negatively regulate the iron transport system. When the iron content is high, the iron absorption regulatory protein binds Fe2+ to form a structure suitable for binding to the target DNA sequence, thereby inhibiting transcription [52], a good metal regulator. Its emergence as a dominant gene also explains why Fe2+ concentration did not increase continuously in the later stage of organic loading treatment. K00384 (trxB, TRR; thioredoxin reductase (NADPH)) forms a thioredoxin system together with thioredoxin and NADPH [53]. Its appearance as a dominant gene in R3−F also shows that Fe3+ plays an essential role in electron transfer in the propionic acid anaerobic fermentation system. K03406 (mcp; methyl-accepting chemotaxis protein) in R1-N is a cell membrane receptor protein that plays an important role in signal transduction when bacterial cells undergo reversible methylation to adapt to attractors or repellants in the environment [54]. Compared with R1−N and R3−F, the relative abundance of functional genes in R2-S containing electron acceptor SO42− is smaller. In contrast, the block color in the control group without an electron acceptor is not warm red, and the predominant function genes are less enriched.
4. Conclusions
The highest propionate removal rate was found in the reactor with the addition of electron acceptor NO3−, which was 36% higher than the control group. The methane production effect was the best. The gas production fluctuation of the system containing NO3− and Fe3+ electron acceptors is slight and exhibited strong acid shock resistance. The microbial diversity in the activated sludge of the reactors with electron acceptors NO3−, SO42−, and Fe3+ was higher than that of the control group without electron acceptors. The species diversity in the sludge containing electron acceptor NO3− and uniformity is the best. Different electron acceptors have different effects on microbial functional genes. The dominant function genes related to redox reactions were most enriched in the reactors R3−F with electron acceptor Fe3+. Nevertheless, the AD process was susceptible to substrate concentration, and it can be optimized utilizing orthogonal experiments in future studies. This study provides theoretical support for strengthening the conversion of propionic acid in biogas slurry.
This study was carried out on a laboratory scale, and the influent water was a prepared propionate solution. In order to clarify the conversion of high-concentration organic acids in biogas slurry in future research, we will determine the experimental plan as soon as possible to carry out the effect of electron acceptors on residual volatile acids in biogas slurry at the pilot scale.
Author Contributions
H.J. (Hongjing Jing): Conceptualization, Supervision, Writing—original draft, Project administration, Funding acquisition. W.L.: Conceptualization, Supervision, Funding acquisition, Project administration. M.W.: Validation, Visualization, Writing—original draft, Supervision, Conceptualization, Project administration. H.J. (Hao Jiao): Conceptualization, Data curation, Formal analysis. Y.S.: Conceptualization, Supervision, Funding acquisition, Project administration. All authors have read and agreed to the published version of the manuscript.
Funding
This work was supported by the National Natural Science Foundation of China (52076034), National Key R&D Program of China (2019YFD1100603), and Special project of Heilongjiang Provincial Academy of science and technology cooperation (YS20B01).
Institutional Review Board Statement
Not applicable.
Informed Consent Statement
Not applicable.
Data Availability Statement
Not applicable.
Conflicts of Interest
The authors declare no conflict of interest.
References
- Bppt, Y.; Singgih, B. Utilization of Residu/Ampas Biogas Production from Bio-Slurry as Organic Fertilizer Resources. Inov. Pembang. J. Kelitbangan 2018, 6, 139–148. [Google Scholar] [CrossRef]
- Wang, L.; Guo, S.; Wang, Y.; Yi, D.; Wang, J. Poultry biogas slurry can partially substitute for mineral fertilizers in hydroponic lettuce production. Environ. Sci. Pollut. Res. Int. 2019, 26, 659–671. [Google Scholar] [CrossRef]
- Halat-Las, M.; Jedynak, P.; Malec, P.; Burczyk, J.; Vilches, A.; Iglesias, K. Application of microbial consortia for biological treatment of post-fermentation effluents from biomethanization of sewage sludge and pig manure. Przem. Chem. 2018, 97, 1189–1194. [Google Scholar]
- Borek, K.; Roman, K. The Analysis of a Prototype Installation for Biogas Production from Chosen Agricultural Substrates. Energies 2021, 14, 2132. [Google Scholar] [CrossRef]
- Sun, Y.; Zhang, Z.; Sun, Y.; Yang, G. One-pot pyrolysis route to FeN-Doped carbon nanosheets with outstanding electrochemical performance as cathode materials for microbial fuel cell. Int. J. Agric. Biol. Eng. 2020, 13, 8. [Google Scholar]
- Stams, A.; Plugge, C.M. Electron transfer in syntrophic communities of anaerobic bacteria and archaea. Nat. Rev. Microbiol. 2009, 7, 568–577. [Google Scholar] [CrossRef]
- Yuan, X.; Li, P.; Wang, H.; Wang, X.; Cheng, X.; Cui, Z. Enhancing the anaerobic digestion of corn stalks using composite microbial pretreatment. J. Microbiol. Biotechnol. 2011, 21, 746–752. [Google Scholar] [CrossRef] [Green Version]
- Luo, Y.; Luo, X.Z.; Zheng, Z.; Chen, G.Y.; Liang, Y.G. Effect of TS loading rates of biogas residue of Spartina alterniflora for secondary anaerobic digestion. Huan Jing Ke Xue 2011, 32, 3425–3428. (In Chinese) [Google Scholar]
- Mao, Z.; Gräßle, F.; Frey, J.; Franchini, P.; Schleheck, D.; Müller, N.; Schink, B. Phosphitispora fastidiosa gen. nov. sp. nov., a new dissimilatory phosphite-oxidizing anaerobic bacterium isolated from anaerobic sewage sludge. Int. J. Syst. Evol. Microbiol. 2021, 71, 005142. [Google Scholar] [CrossRef]
- Cervantes, F.J.; van der Velde, S.; Lettinga, G.; Field, J.A. Quinones as terminal electron acceptors for anaerobic microbial oxidation of phenolic compounds. Biodegradation 2000, 11, 313–321. [Google Scholar] [CrossRef]
- Welte, C.; Deppenmeier, U. Bioenergetics and anaerobic respiratory chains of aceticlastic methanogens. Biochim. Biophys. Acta 2014, 1837, 1130–1147. [Google Scholar] [CrossRef] [Green Version]
- Chen, C.; Shen, Y.; An, D.; Voordouw, G. Use of Acetate, Propionate, and Butyrate for Reduction of Nitrate and Sulfate and Methanogenesis in Microcosms and Bioreactors Simulating an Oil Reservoir. Appl. Environ. Microbiol. 2017, 83, e02983-16. [Google Scholar] [CrossRef] [Green Version]
- Glombitza, C.; Jaussi, M.; Røy, H.; Seidenkrantz, M.S.; Lomstein, B.A.; Jørgensen, B.B. Formate, acetate, and propionate as substrates for sulfate reduction in sub-arctic sediments of Southwest Greenland. Front. Microbiol. 2015, 6, 846. [Google Scholar] [CrossRef] [Green Version]
- Emerson, D. Potential for Iron-reduction and Iron-cycling in Iron Oxyhydroxide-rich Microbial Mats at Loihi Seamount. Geomicrobiol. J. 2009, 26, 639–647. [Google Scholar] [CrossRef]
- Zhang, Q.; Sun, J.; Liu, J.; Huang, G.; Lu, C.; Zhang, Y. Driving mechanism and sources of groundwater nitrate contamination in the rapidly urbanized region of south China. J. Contam. Hydrol. 2015, 182, 221–230. [Google Scholar] [CrossRef]
- Shokoohi, R.; Bajalan, S.; Salari, M.; Shabanloo, A. Thermochemical degradation of furfural by sulfate radicals in aqueous solution: Optimization and synergistic effect studies. Environ. Sci. Pollut. Res. Int. 2019, 26, 8914–8927. [Google Scholar] [CrossRef]
- Lefan, M.; Zhiquan, T.; Junfeng, Z. Removal of NOx from flue gas with iron filings reduction following complex absorption in ferrous chelates aqueous solutions. J. Air Waste Manag. Assoc. 2004, 54, 1543–1549. [Google Scholar] [CrossRef] [Green Version]
- Zhao, Z.; Zhang, Y.; Woodard, T.L.; Nevin, K.P.; Lovley, D.R. Enhancing syntrophic metabolism in up-flow anaerobic sludge blanket reactors with conductive carbon materials. Bioresour. Technol. 2015, 191, 140–145. [Google Scholar] [CrossRef]
- Cieciura-Woch, W.; Binczarski, M.; Tomaszewska, J.; Borowski, S.; Domański, J.; Dziugan, P.; Witońska, I. The Use of Acidic Hydrolysates after Furfural Production from Sugar Waste Biomass as a Fermentation Medium in the Biotechnological Production of Hydrogen. Energies 2019, 12, 3222. [Google Scholar] [CrossRef] [Green Version]
- Achiraya, J.; Kornpong, V.; Malinee, L.; Sumaeth, C. Three-Stage Anaerobic Sequencing Batch Reactor (ASBR) for Maximum Methane Production: Effects of COD Loading Rate and Reactor Volumetric Ratio. Energies 2018, 11, 1543. [Google Scholar]
- Morita, M.; Malvankar, N.S.; Franks, A.E.; Summers, Z.M.; Giloteaux, L.; Rotaru, A.E.; Rotaru, C.; Lovley, D.R. Potential for direct interspecies electron transfer in methanogenic wastewater digester aggregates. mBio 2011, 2, e00159-11. [Google Scholar] [CrossRef] [Green Version]
- Zhang, B.; Li, W.; Xu, X.; Li, P.; Li, N.; Zhang, H.; Sun, Y. Effect of Aerobic Hydrolysis on Anaerobic Fermentation Characteristics of Various Parts of Corn Stover and the Scum Layer. Energies 2019, 12, 381. [Google Scholar] [CrossRef] [Green Version]
- Sarzanini, C.; Bruzzoniti, M.C. Ion Chromatography: Modes for Metal Ions Analysis; CRC Press, Taylor & Francis Group: Boca Raton, FL, USA, 2010; pp. 405–436. [Google Scholar]
- Khan, M.U.; Ahring, B.K. Anaerobic Biodegradation of Wheat Straw Lignin: The Influence of Wet Explosion Pretreatment. Energies 2021, 14, 5940. [Google Scholar] [CrossRef]
- Veluchamy, C.; Raju, V.W.; Kalamdhad, A.S. Prerequisite—An electrohydrolysis pretreatment for anaerobic digestion of lignocellulose waste material. Bioresour. Technol. 2017, 235, 274–280. [Google Scholar] [CrossRef]
- Magoč, T.; Salzberg, S.L. FLASH: Fast length adjustment of short reads to improve genome assemblies. Bioinformatics 2011, 27, 2957–2963. [Google Scholar] [CrossRef]
- Sun, S.; Jones, R.B.; Fodor, A.A. Inference-based accuracy of metagenome prediction tools varies across sample types and functional categories. Microbiome 2020, 8, 46. [Google Scholar] [CrossRef] [Green Version]
- Grigoryan, A.A.; Cornish, S.L.; Buziak, B.; Lin, S.; Cavallaro, A.; Arensdorf, J.J.; Voordouw, G. Competitive oxidation of volatile fatty acids by sulfate- and nitrate-reducing bacteria from an oil field in Argentina. Appl. Environ. Microbiol. 2008, 74, 4324–4335. [Google Scholar] [CrossRef] [Green Version]
- Qiao, W.; Takayanagi, K.; Li, Q.; Shofie, M.; Gao, F.; Dong, R.; Li, Y.Y. Thermodynamically enhancing propionic acid degradation by using sulfate as an external electron acceptor in a thermophilic anaerobic membrane reactor. Water Res. 2016, 106, 320–329. [Google Scholar] [CrossRef]
- Deng, Y.; Xia, J.; Zhao, R.; Xu, J.; Liu, X. Iron-coated biochar alleviates acid accumulation and improves methane production under ammonium enrichment conditions. Sci. Total Environ. 2022, 809, 151154. [Google Scholar] [CrossRef]
- Tanner, R.S. Anoxic life: Biology of anaerobic microorganisms. Science 1989, 245, 201–202. [Google Scholar] [CrossRef]
- Sun, F.; Deng, Q.; Li, X.; Tang, M.; Ma, X.; Cao, X.; Zhou, Y.; Song, C. Organic carbon quantity and quality jointly triggered the switch between dissimilatory nitrate reduction to ammonium (DNRA) and denitrification in biofilters. Chemosphere 2021, 280, 130917. [Google Scholar] [CrossRef]
- Lü, L.; You, W.; Zhang, M.; Wu, P.; Shen, Y.L. Effect of NOx—N Recycling Ratio on Denitrifying Phosphorus Removal Efficiency in the ABR-MBR Combined Process. Huan Jing Ke Xue 2018, 39, 1309–1315. (In Chinese) [Google Scholar]
- Yao, Q.; Huang, J.; Yang, L.; Wu, X.; Hu, X. Characteristic of metabolism for sulfur-containing components during sulfate bioreduction process. J. Environ. Eng. 2018, 12, 2783–2790. (In Chinese) [Google Scholar]
- Goevert, D.; Conrad, R. Stable carbon isotope fractionation by acetotrophic sulfur-reducing bacteria. FEMS Microbiol. Ecol. 2010, 71, 218–225. [Google Scholar] [CrossRef]
- Frederiksen, T.M.; Finster, K. Sulfite-oxido-reductase is involved in the oxidation of sulfite in Desulfocapsa sulfoexigens during disproportionation of thiosulfate and elemental sulfur. Biodegradation 2003, 14, 189–198. [Google Scholar] [CrossRef]
- Haghighatian, S.; Mazarei, E.; Doroodmand, M.M.; Klein, A.; Memarpoor-Yazdi, M. A new whole-cell biocatalyst for sulfur dioxide filtering and degradation. Bioresour. Technol. 2020, 314, 123755. [Google Scholar] [CrossRef]
- Shi, C.; Wang, J.; Peng, S.; Hou, C.; Chen, T.; Yue, Z. Fe3+ enhanced anaerobic digestion process of corn straw. Nongye Gongcheng Xuebao/Trans. Chin. Soc. Agric. Eng. 2013, 29, 218–225. (In Chinese) [Google Scholar]
- Lu, J.; Jin, Q.; He, Y.; Wu, J. Enhanced anaerobic biodegradation of nonylphenol ethoxylates by introducing additional sulfate or nitrate as terminal electron acceptors. Int. Biodeterior. Biodegrad. 2008, 62, 214–218. [Google Scholar] [CrossRef]
- Levar, C.E.; Hoffman, C.L.; Dunshee, A.J.; Toner, B.M.; Bond, D.R. Redox potential as a master variable controlling pathways of metal reduction by Geobacter sulfurreducens. ISME J. 2017, 11, 741–752. [Google Scholar] [CrossRef] [Green Version]
- Dong, H.Y.; Ji, M. Comparative study on biological methane potential and methanogen biodiversity in the anaerobic digestion of excess sludge. Huan Jing Ke Xue 2014, 35, 1421–1427. (In Chinese) [Google Scholar]
- Fang, H.H.P.; Chui, H.; Li, Y. Effect of degradation kinetics on the microstructure of anaerobic biogranules. Water Sci. Technol. 1995, 32, 165–172. [Google Scholar] [CrossRef]
- Weithmann, N.; Mlinar, S.; Sonnleitner, E.; Weig, A.R.; Freitag, R. Flexible feeding in anaerobic digestion—Impact on process stability, performance and microbial community structures. Anaerobe 2021, 68, 102297. [Google Scholar] [CrossRef]
- Lozupone, C.; Knight, R. UniFrac: A new phylogenetic method for comparing microbial communities. Appl. Environ. Microbiol. 2005, 71, 8228–8235. [Google Scholar] [CrossRef] [Green Version]
- Begmatov, S.; Dorofeev, A.G.; Kadnikov, V.V.; Beletsky, A.V.; Pimenov, N.V.; Ravin, N.V.; Mardanov, A.V. The structure of microbial communities of activated sludge of large-scale wastewater treatment plants in the city of Moscow. Sci. Rep. 2022, 12, 3458. [Google Scholar] [CrossRef]
- Wang, S.; Pu, Y.; Wei, C. COD and nitrogen removal and microbial communities in a novel waterfall biofilm reactor operated at different COD/TN ratios. J. Environ. Sci. Health A Tox. Hazard. Subst. Environ. Eng. 2017, 52, 99–105. [Google Scholar] [CrossRef]
- Li, Y.; Dong, R.; Guo, J.; Wang, L.; Zhao, J. Effects of Mn2+ and humic acid on microbial community structures, functional genes for nitrogen and phosphorus removal, and heavy metal resistance genes in wastewater treatment. J. Environ. Manag. 2022, 313, 115028. [Google Scholar] [CrossRef]
- Wang, J.; Liu, T.; Sun, W.; Chen, Q. Bioavailable metal(loid)s and physicochemical features co-mediating microbial communities at combined metal(loid) pollution sites. Chemosphere 2020, 60, 127619. [Google Scholar] [CrossRef]
- Rabus, R.; Wilkes, H.; Schramm, A.; Harms, G.; Behrends, A.; Amann, R.; Widdel, F. Anaerobic utilization of alkylbenzenes and n-alkanes from crude oil in an enrichment culture of denitrifying bacteria affiliating with the beta-subclass of Proteobacteria. Environ. Microbiol. 1999, 2, 145–157. [Google Scholar] [CrossRef]
- Yuan, Y.; Bian, A.; Chen, F.; Xu, X.; Huang, C.; Chen, C.; Liu, W.; Cheng, H.; Chen, T.; Ding, C.; et al. Continuous sulfur biotransformation in an anaerobic-anoxic sequential batch reactor involving sulfate reduction and denitrifying sulfide oxidization. Chemosphere 2019, 234, 568–578. [Google Scholar] [CrossRef]
- Deng, Y.; Xia, J.; Zhao, R.; Liu, X.; Xu, J. Modified biochar promotes the direct interspecies electron transfer between iron-reducing bacteria and methanogens in high organic loading co-digestion. Bioresour. Technol. 2021, 342, 126030. [Google Scholar] [CrossRef]
- Bagg, A.; Neilands, J.B. Ferric uptake regulation protein acts as a repressor, employing iron (II) as a cofactor to bind the operator of an iron transport operon in Escherichia coli. Biochemistry 1987, 26, 5471–5477. [Google Scholar] [CrossRef]
- Cejudo, F.J.; Ferrández, J.; Cano, B.; Puerto-Galán, L.; Guinea, M. The function of the NADPH thioredoxin reductase C-2-Cys peroxiredoxin system in plastid redox regulation and signalling. FEBS Lett. 2012, 586, 2974–2980. [Google Scholar] [CrossRef] [Green Version]
- Kwon, O.; Georgellis, D.; Lin, E.C. Rotational on-off switching of a hybrid membrane sensor kinase Tar-ArcB in Escherichia coli. J. Biol. Chem. 2003, 278, 13192–13195. [Google Scholar] [CrossRef] [Green Version]
Figure 1.
Schematic diagram of the experimental setup.

Figure 2.
Propionate removal rate change curve.
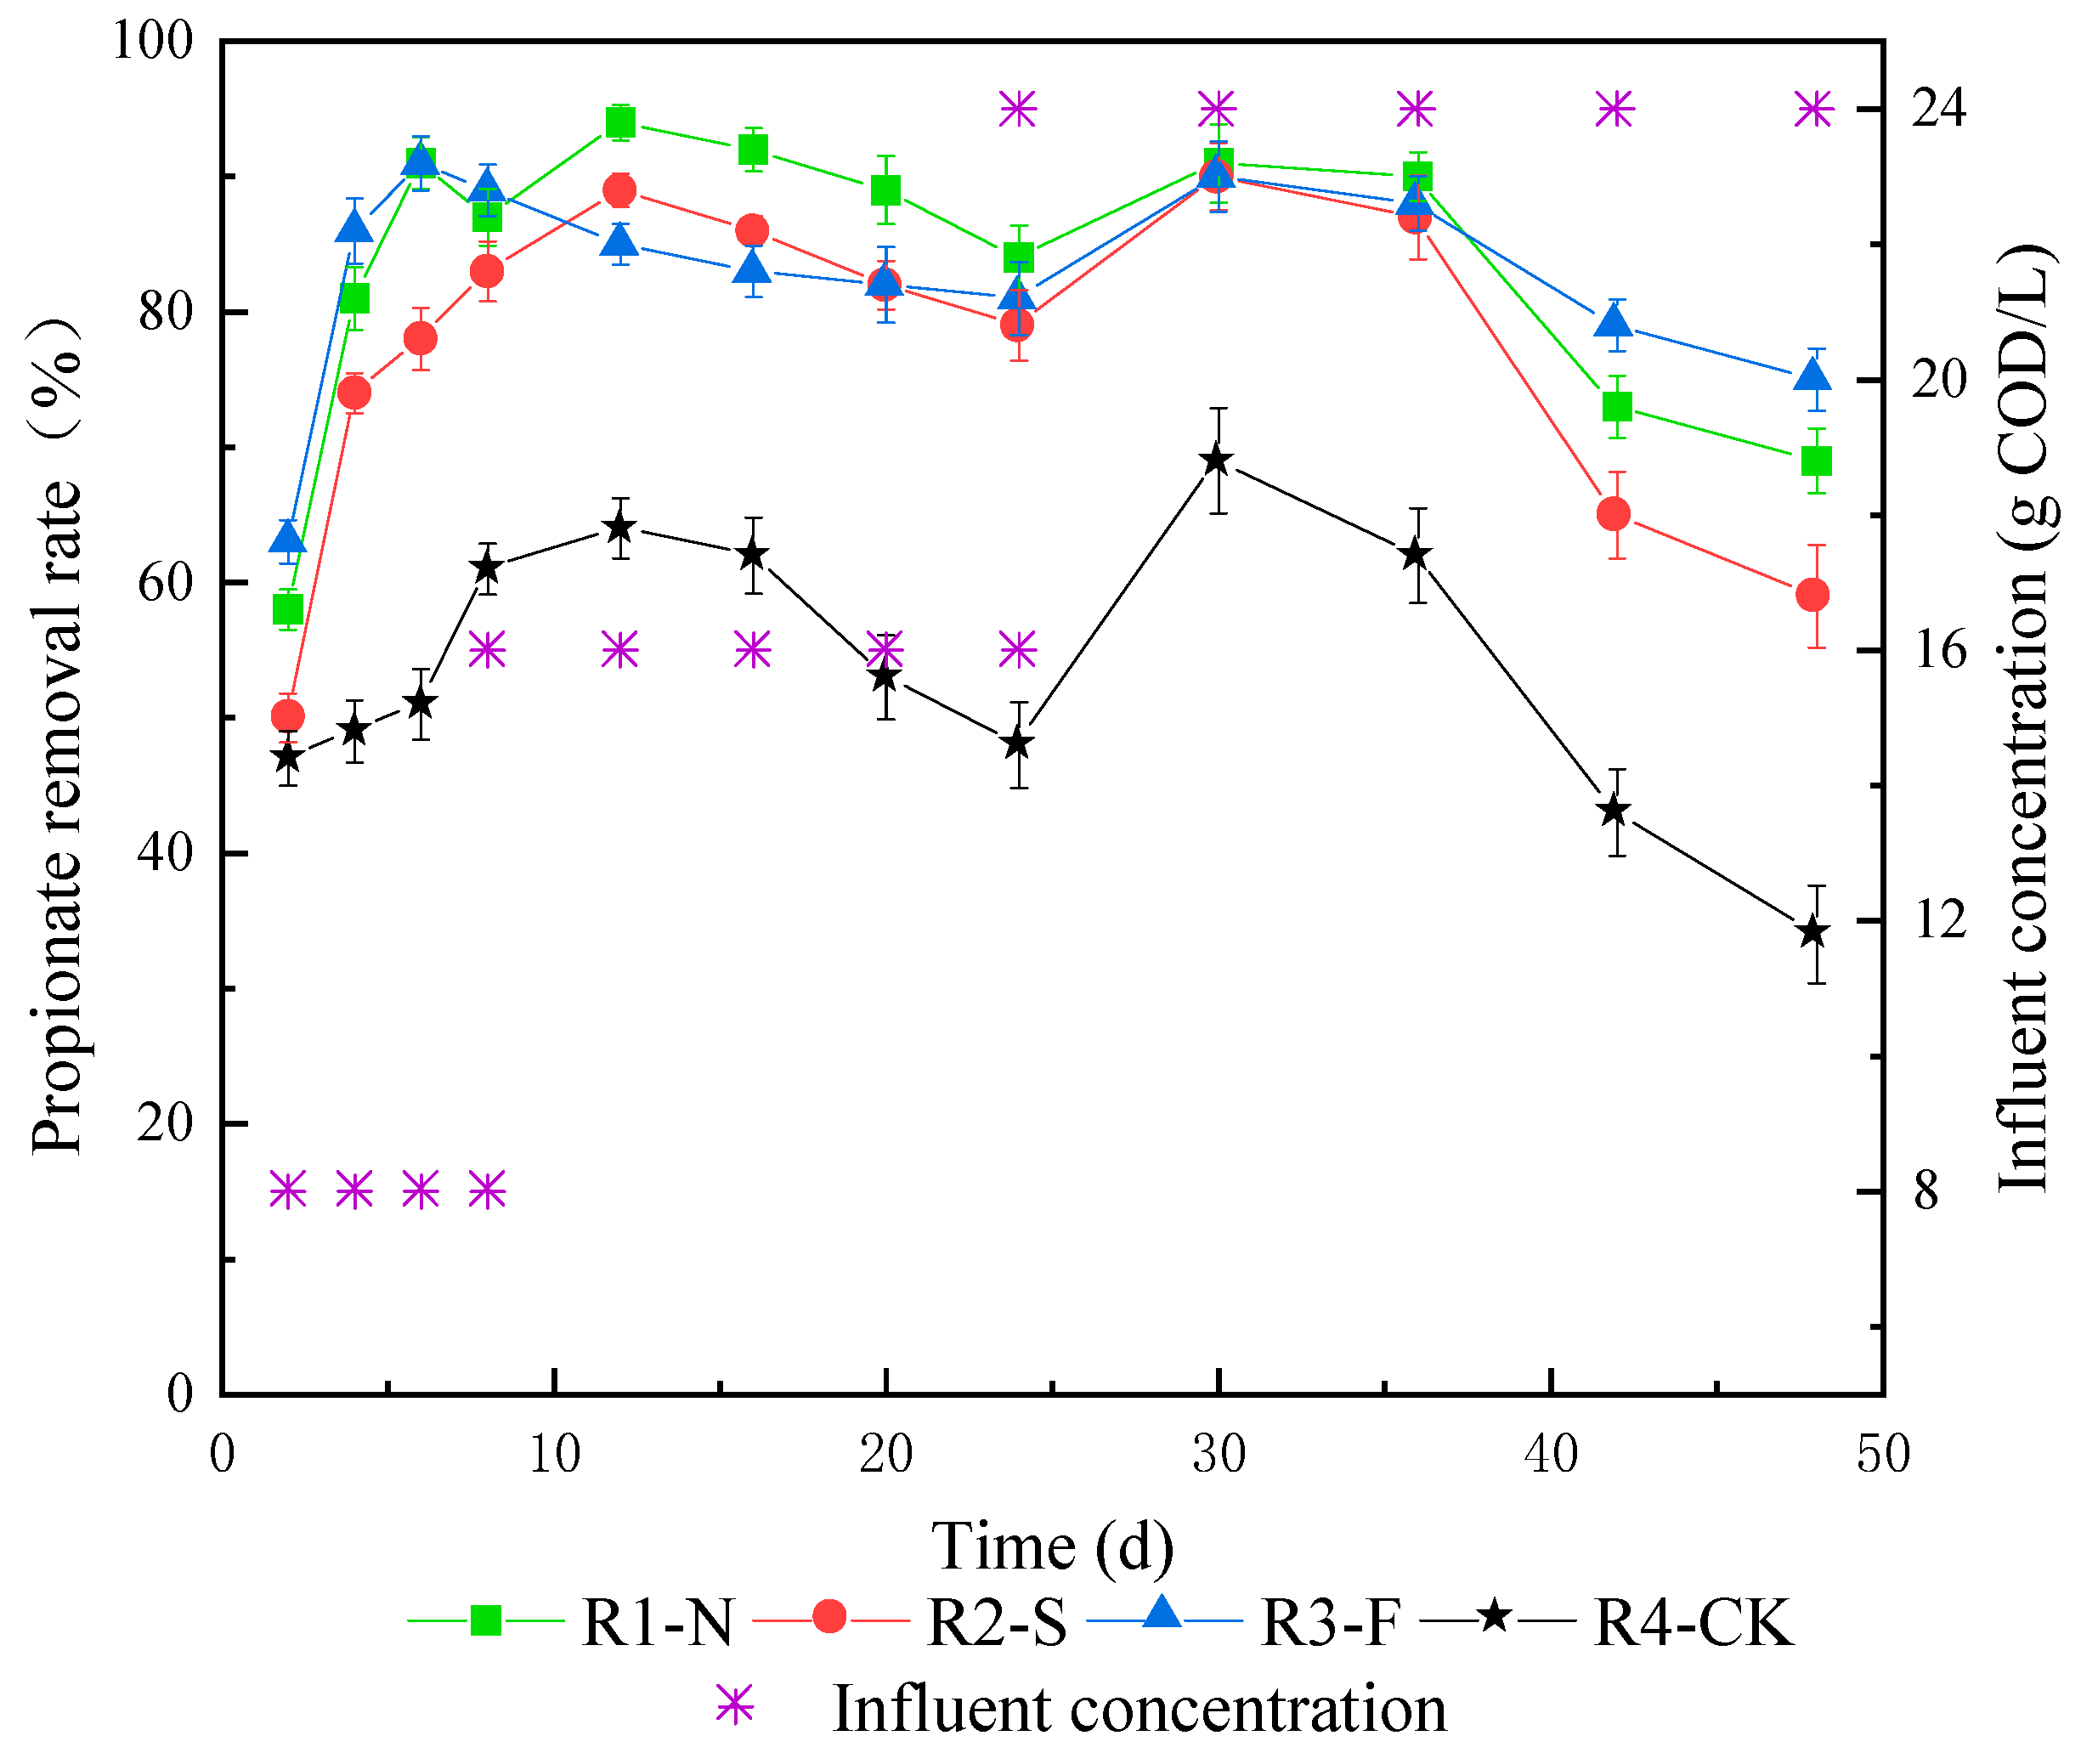
Figure 3.
Ion concentration curve. (a) Changes in nitrate ion concentration in R1−N; (b) changes in sulfate ion concentration in R2−S; (c) changes in iron ion concentration in R3−F.
Figure 3.
Ion concentration curve. (a) Changes in nitrate ion concentration in R1−N; (b) changes in sulfate ion concentration in R2−S; (c) changes in iron ion concentration in R3−F.

Figure 4.
Methane production rate change curve.

Figure 5.
Sludge SEM images. (a,c,e,g) are R1−N, R2−S, R3−F, R4−CK sludge observed by scanning electron microscope to 5 μm; (b,d,f,h) are R1−N, R2−S, R3−F, R4−CK sludge observed by scanning electron microscope to 2 μm, respectively.
Figure 5.
Sludge SEM images. (a,c,e,g) are R1−N, R2−S, R3−F, R4−CK sludge observed by scanning electron microscope to 5 μm; (b,d,f,h) are R1−N, R2−S, R3−F, R4−CK sludge observed by scanning electron microscope to 2 μm, respectively.
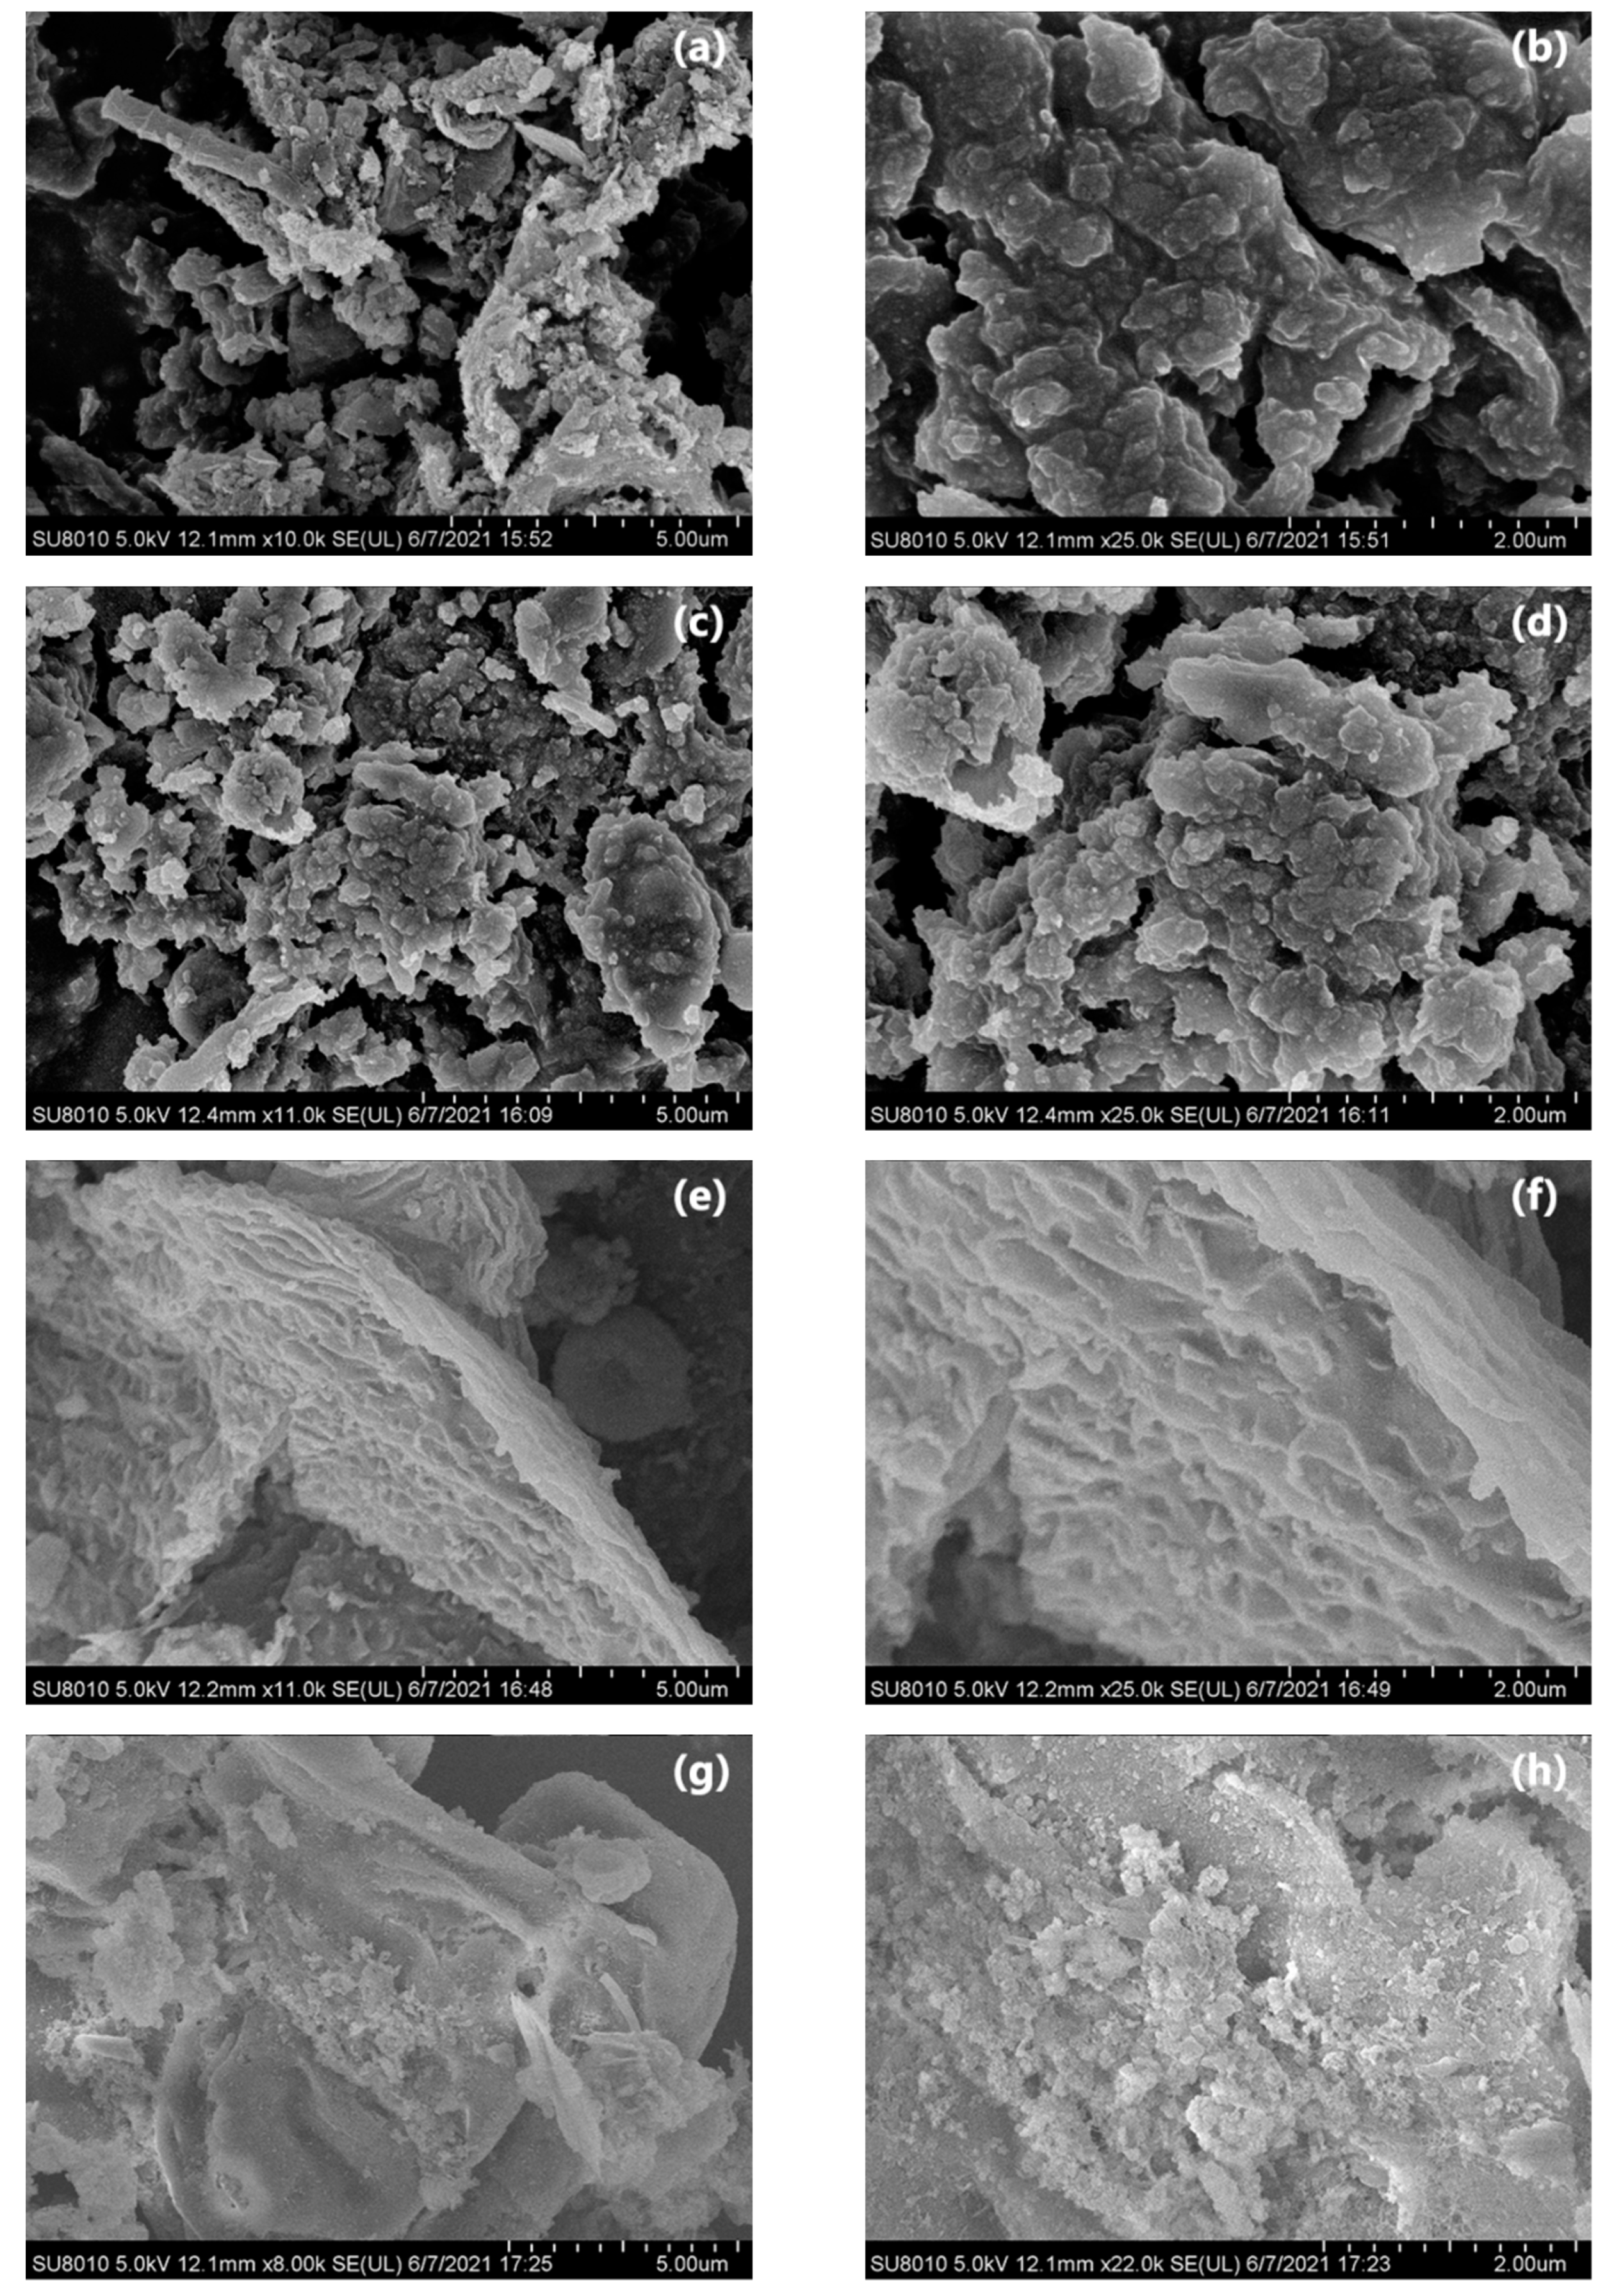
Figure 6.
Heat diagram of unweighted Unifrac distance matrix with Beta diversity index. The size and color of the circle in the square represents the level of the dissimilarity coefficient between the two samples. The larger the circle and the darker the color, the more significant the species difference; the smaller the circle, the lighter the color, the smaller the species difference.
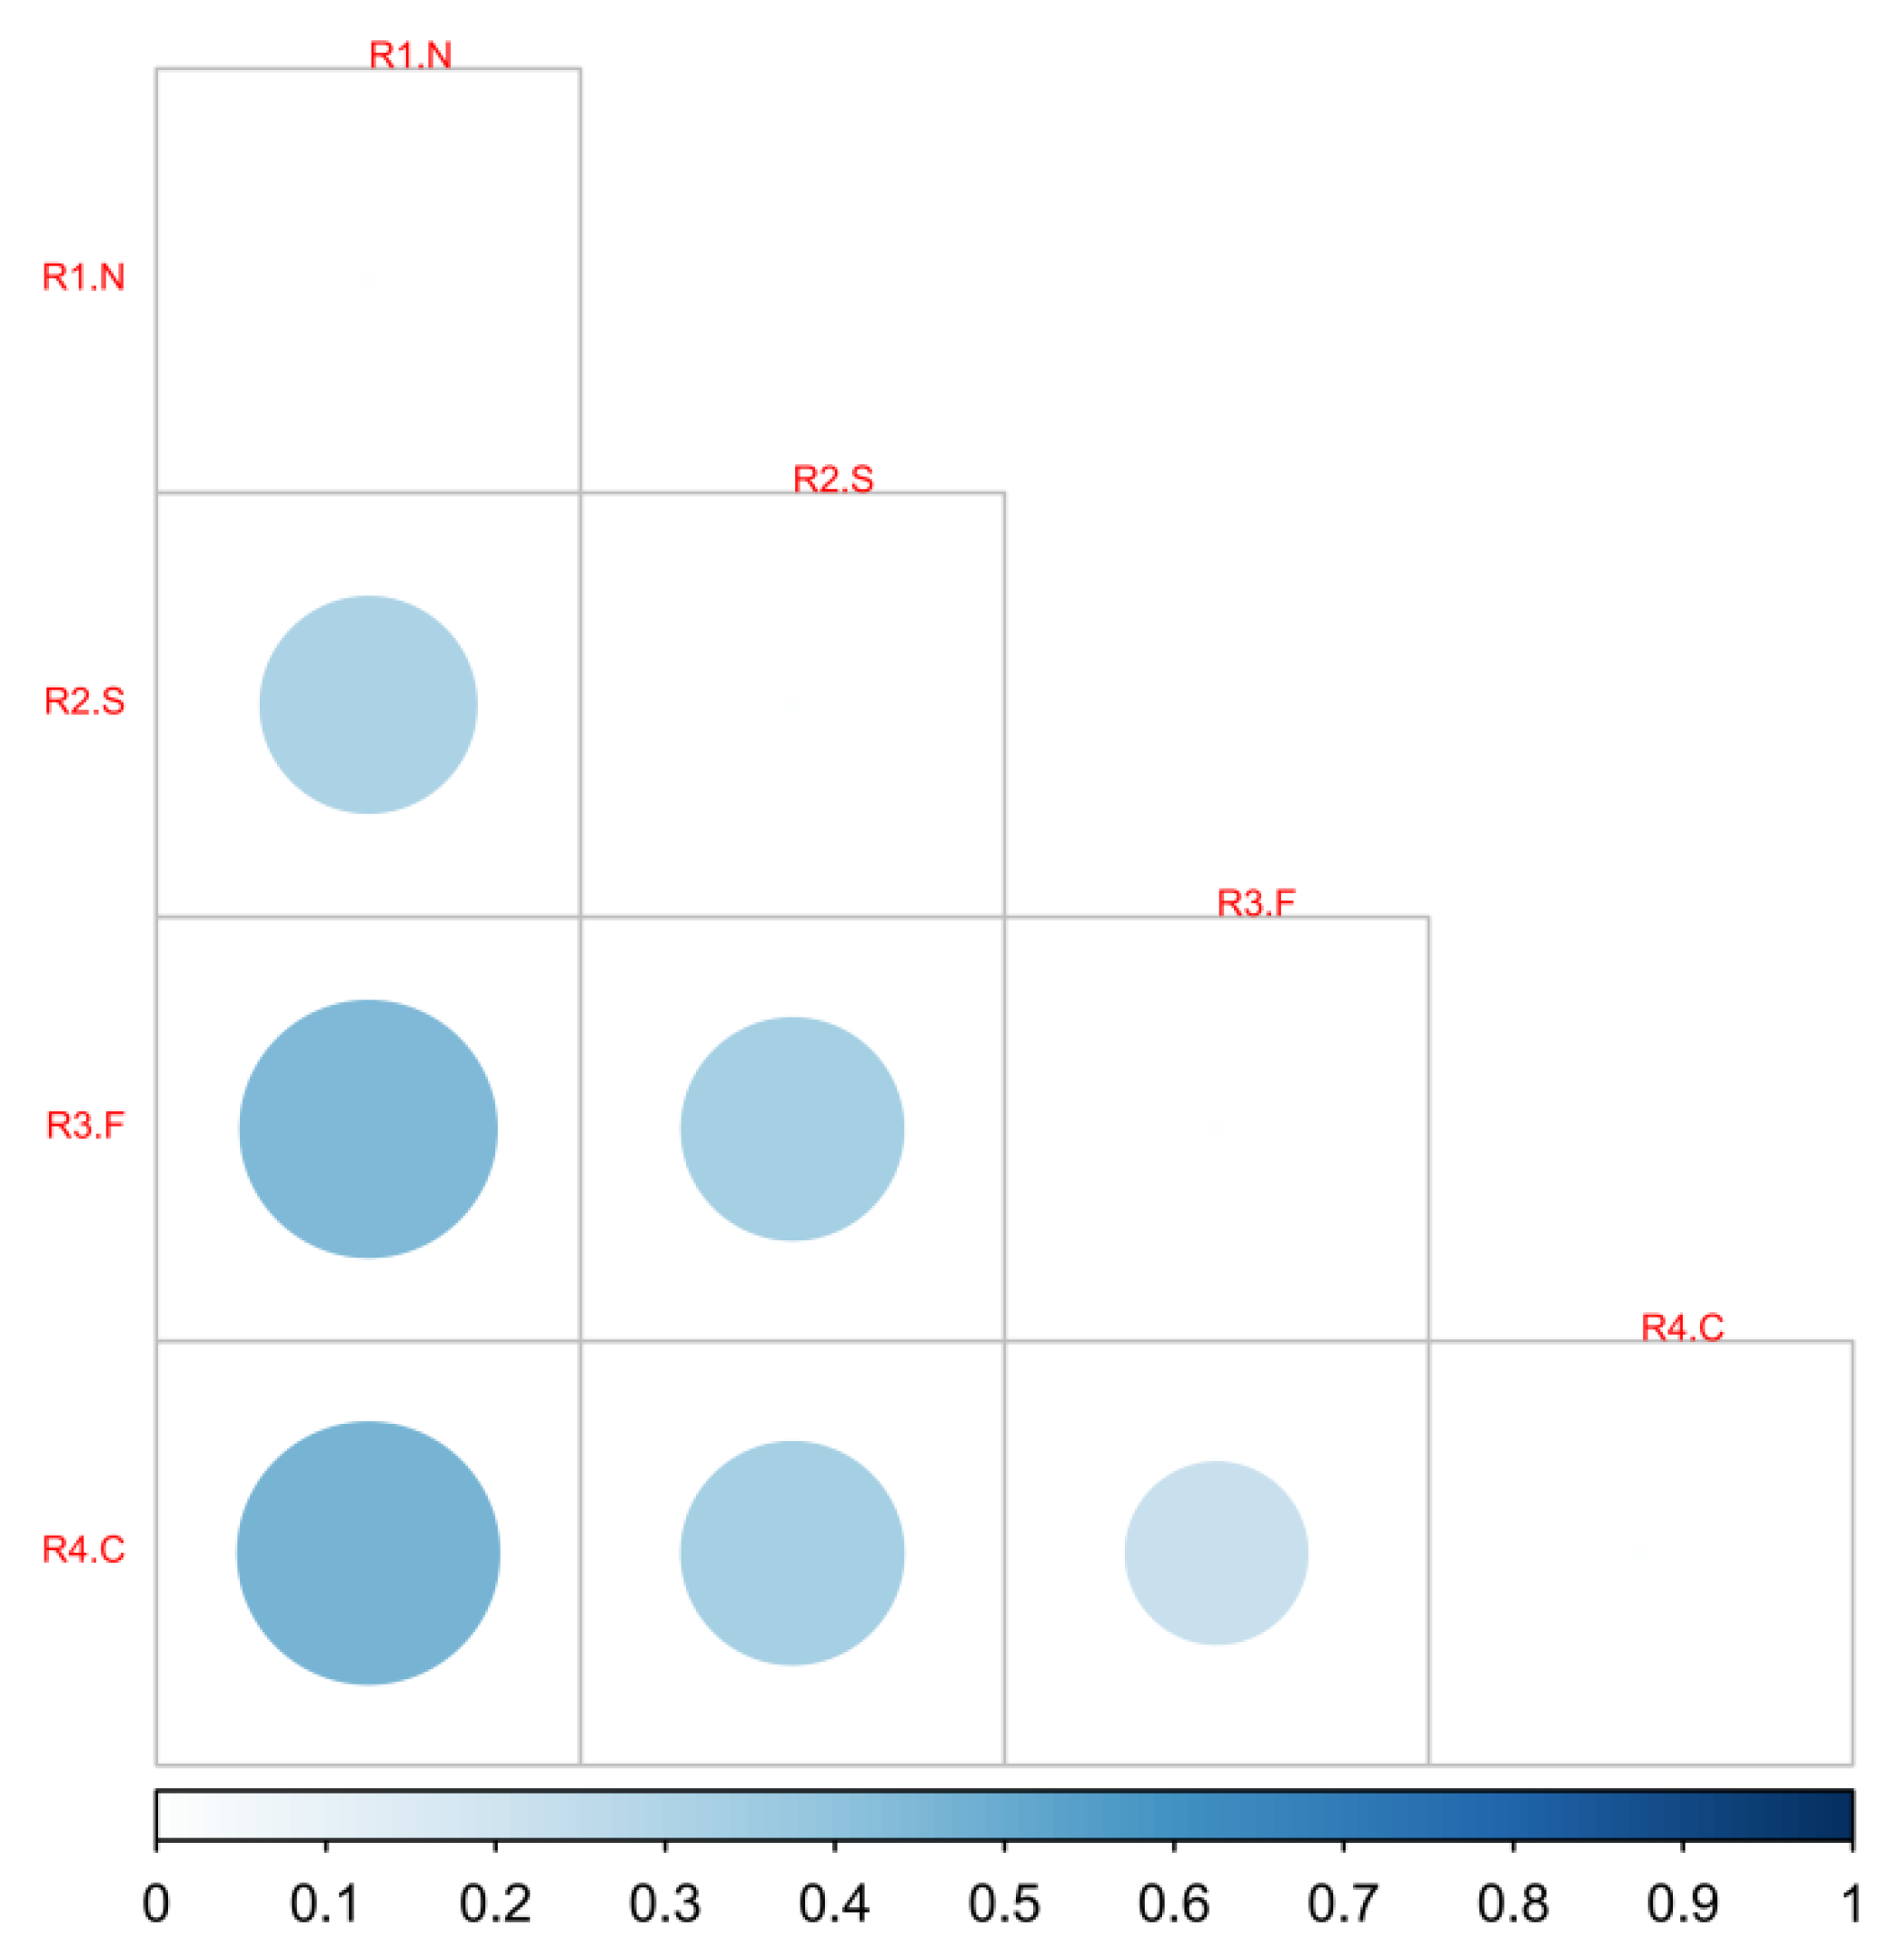
Figure 7.
Differences in community structure at phylum level.

Figure 8.
Heatmap of genus species abundance.

Figure 9.
Functional annotation cluster analysis heatmap at genus classification level.

Table 1.
Detailed composition of trace elements adapted with permission from Ref. [18], 2015, Zhao et al.
Table 1.
Detailed composition of trace elements adapted with permission from Ref. [18], 2015, Zhao et al.
| Drug Name | Concentration (g/L) |
|---|---|
| MnSO4 | 0.05 |
| FeSO4·7H2O | 0.1 |
| NiCl2·6H2O | 0.04 |
| CoCl2·6H2O | 0.05 |
| ZnCl2 | 0.13 |
| CuSO4·5H2O | 0.01 |
| KAl(SO4)2·12H2O | 0.01 |
| MnSO4 | 0.05 |
Table 2.
Experimental design.
| Reactor Name | Reaction Conditions | Substrate | Influent Concentration (g·COD/L) | Feed In and Out Time Interval |
|---|---|---|---|---|
| R1−N | IS + NO3− 0.03 mmol/L | Sodium propionate + basal medium + 10 mL/L trace elements | S1 8 g·COD/L S2 16 g·COD/L S3 24 g·COD/L | S1 2 d S2 4 d S3 6 d |
| R2−S | IS + SO42− 0.03 mmol/L | |||
| R3−F | IS + Fe3+ 0.03 mmol/L | |||
| R4−CK | IS |
Table 3.
Biodiversity index of microbial community.
| Sample ID | Chao1 | Goods Coverage | Observed OTUs | Shanon | Simpson |
|---|---|---|---|---|---|
| R1−N | 702.000 | 1.000 | 701 | 6.408 | 0.959 |
| R2−S | 650.050 | 1.000 | 649 | 5.998 | 0.930 |
| R3−F | 609.000 | 1.000 | 609 | 5.936 | 0.918 |
| CK | 558.000 | 1.000 | 558 | 5.785 | 0.922 |
Publisher’s Note: MDPI stays neutral with regard to jurisdictional claims in published maps and institutional affiliations. |
© 2022 by the authors. Licensee MDPI, Basel, Switzerland. This article is an open access article distributed under the terms and conditions of the Creative Commons Attribution (CC BY) license (https://creativecommons.org/licenses/by/4.0/).
Share and Cite
MDPI and ACS Style
Jing, H.; Li, W.; Wang, M.; Jiao, H.; Sun, Y. Mechanism of Electron Acceptor Promoting Propionic Acid Transformation in Anaerobic Fermentation. Energies 2022, 15, 3947. https://doi.org/10.3390/en15113947
AMA Style
Jing H, Li W, Wang M, Jiao H, Sun Y. Mechanism of Electron Acceptor Promoting Propionic Acid Transformation in Anaerobic Fermentation. Energies. 2022; 15(11):3947. https://doi.org/10.3390/en15113947
Chicago/Turabian StyleJing, Hongjing, Wenzhe Li, Ming Wang, Hao Jiao, and Yong Sun. 2022. "Mechanism of Electron Acceptor Promoting Propionic Acid Transformation in Anaerobic Fermentation" Energies 15, no. 11: 3947. https://doi.org/10.3390/en15113947
Note that from the first issue of 2016, this journal uses article numbers instead of page numbers. See further details here.