
Simulation on the Electric and Thermal Fields of a Microwave Reactor for Ex Situ Biomass Tar Elimination

Department of Engineering, Huzhou University, Huzhou 313000, China
*
Author to whom correspondence should be addressed.
Energies 2022, 15(11), 4143; https://doi.org/10.3390/en15114143
Submission received: 6 May 2022
/
Revised: 25 May 2022
/
Accepted: 2 June 2022
/
Published: 4 June 2022
(This article belongs to the Topic Sustainable Environmental Technologies)
Abstract
:Microwave treatment is an emerging technique for biomass tar elimination. The electric and thermal fields of the microwave reactor are the key to high elimination efficiency and energy utilization. In this work, we simulated the electric and thermal fields of a microwave reactor with various parameters including irradiation feed position, microwave power, silicon carbide length and flow velocity. Results show that the irradiation feed position that locates 5 mm vertically to the central plane can obtain the highest electric intensity and silicon carbide temperature (ca. 1100 K) after wave absorbing. Both the electric and thermal fields are strengthened when microwave power is increased. Extending the silicon carbide bed length will decrease the bed temperature and heating rate. A high flow velocity leads to non-uniform temperature distribution of the silicon carbide. For the purpose of achieving a high microwave energy utilization and uniform bed temperature, suitable irradiation feed position (zi = 5 mm), high microwave power (P = 1000 W), short silicon carbide bed length (lSiC = 100 mm) and low flow velocity (v = 0.02 m/s) are preferred, but the chemical kinetics of biomass tar elimination should also be considered in the practical application.
1. Introduction
The biomass gasification that can effectively convert biological waste into synthetic gas is a promising technology for energy recovery from biomass wastes, but the process inevitably produces biomass tar as the by-product [1]. The formation of biomass tar, which usually consists of multi-ring aromatics [2], will clog the downstream pipe and cause fouling and corrosion issues [3,4], thus it becomes the most critical problem in biomass gasification. Therefore, effective tar elimination methods are necessarily required in the biomass gasification system.
The biomass tar can be removed inside the gasifier (in situ elimination) or outside the gasifier (ex situ elimination) as shown in Figure 1. In situ elimination includes the use of gasification catalysts [5,6], structurally modified gasifiers [7] and novel heating strategies [8], but it can hardly achieve a complete tar removal without secondary elimination [9]. Therefore, the ex situ elimination methods are commonly employed. The ex situ elimination methods can be further divided into physical and chemical tar removal. The physical tar removal can be realized by dry/wet gas cleaning or solid-phase adsorption/desorption, but brings drawbacks including secondary pollution, waste management cost and energy loss [10]. Compared with physical tar removal, the chemical removal methods, especially thermal or catalytic cracking [11,12], show more advantages such as high elimination efficiency and energy utilization by cracking the tar into hydrocarbon gases that can be reused and were therefore extensively studied. The widely used catalysts include nickel or noble metal-based catalysts [13,14]. These catalysts are effective in tar elimination but less attractive in industrial application because of their high cost, as well as the deactivation problem [15]. Other catalysts such as iron- or biochar-based catalysts are more economically attractive and were therefore investigated extensively, as well, in the tar elimination process [16,17].
The ex situ tar elimination methods such as thermal or catalytic cracking are essentially endothermic, which makes the selection of the appropriate heating method of great importance. Microwave heating is an emerging technology in biomass treatment [18,19]. Compared to the conventional heating methods, microwave heating can penetrate the wave-absorbing materials and achieve direct energy input to the materials. It has several advantages such as rapid temperature rise with instantaneous start and stops, uniform temperature distribution throughout the volume of the materials and non-contact and selective heating [20,21]. Moreover, the hot spots and plasma generated during microwave heating can provide higher conversion efficiency and better product distribution [22]. With these advantages, the microwave-assisted elimination exhibits good performance on biomass tar removal. For example, Li et al. used the char-supported metal (Fe, Ni and Ce) catalysts as microwave absorbers and obtained the complete cracking of toluene—the model compound of biomass tar [23,24]—under microwave irradiation [25]. Similarly, Chen et al. observed a high toluene elimination efficiency (95.1%) in a microwave tube furnace with a biochar-supported Ni catalyst [26]. Zhang et al. used silicon carbide as the wave absorber in the microwave-assisted elimination of tar. They observed a maximum toluene elimination efficiency of 94.4% and found the main product to be H2 [27], indicating an effective tar cracking by the microwave heating technique.
In practical industrial processes, the temperature of the biomass gasification gas is typically 450–600 °C for downdraft fixed-bed gasifiers and ca. 150 °C for updraft fixed-bed gasifiers [22]. This means the biomass tar, which is mainly composed of mono- or poly-aromatics [23,24,28], will be in the gaseous phase. Since the biomass tar is ineffective in absorbing the microwave, the microwave absorbers are required in the microwave reactor. For this reason, the microwave reactor for biomass tar elimination mainly contains a microwave oven to generate microwave irradiation, a fixed bed with a wave absorber to allow biomass tar cracking, and a quartz tube to hold the wave absorber and allow the microwave to penetrate in the absorber [21,25,26,29]. In such a microwave reactor, the biomass tar can be ex situ cracked to the hydrocarbon gases. It is obvious that the electric and thermal fields that determine the reaction conditions in the microwave reactor will significantly affect the tar cracking. Therefore, the reactor and operation parameters that would influence the reaction fields should be detailly designed to achieve a high biomass tar elimination efficiency and energy utilization.
The COMSOL Multiphysics software has been successfully used to estimate the electric field intensity, temperature distribution, heat transfer (hot and cold spots), and absorbed power during microwave heating [30,31]. In this work, we used the COMSOL Multiphysics software to simulate the electric and thermal fields of the microwave reactor under various reactor and operation parameters including irradiation feed position, microwave power, microwave absorbers bed length and flow velocity. The silicon carbide was selected as the microwave absorber in the simulation to explore its temperature distribution and heating rate under microwave irradiation. The interest of this work is to find the optimal parameters about the microwave reactor designation and the main conditions in its application for the efficient elimination of biomass tar with the microwave technique.
2. Simulation Methods
2.1. Modeling of the Microwave Reactor
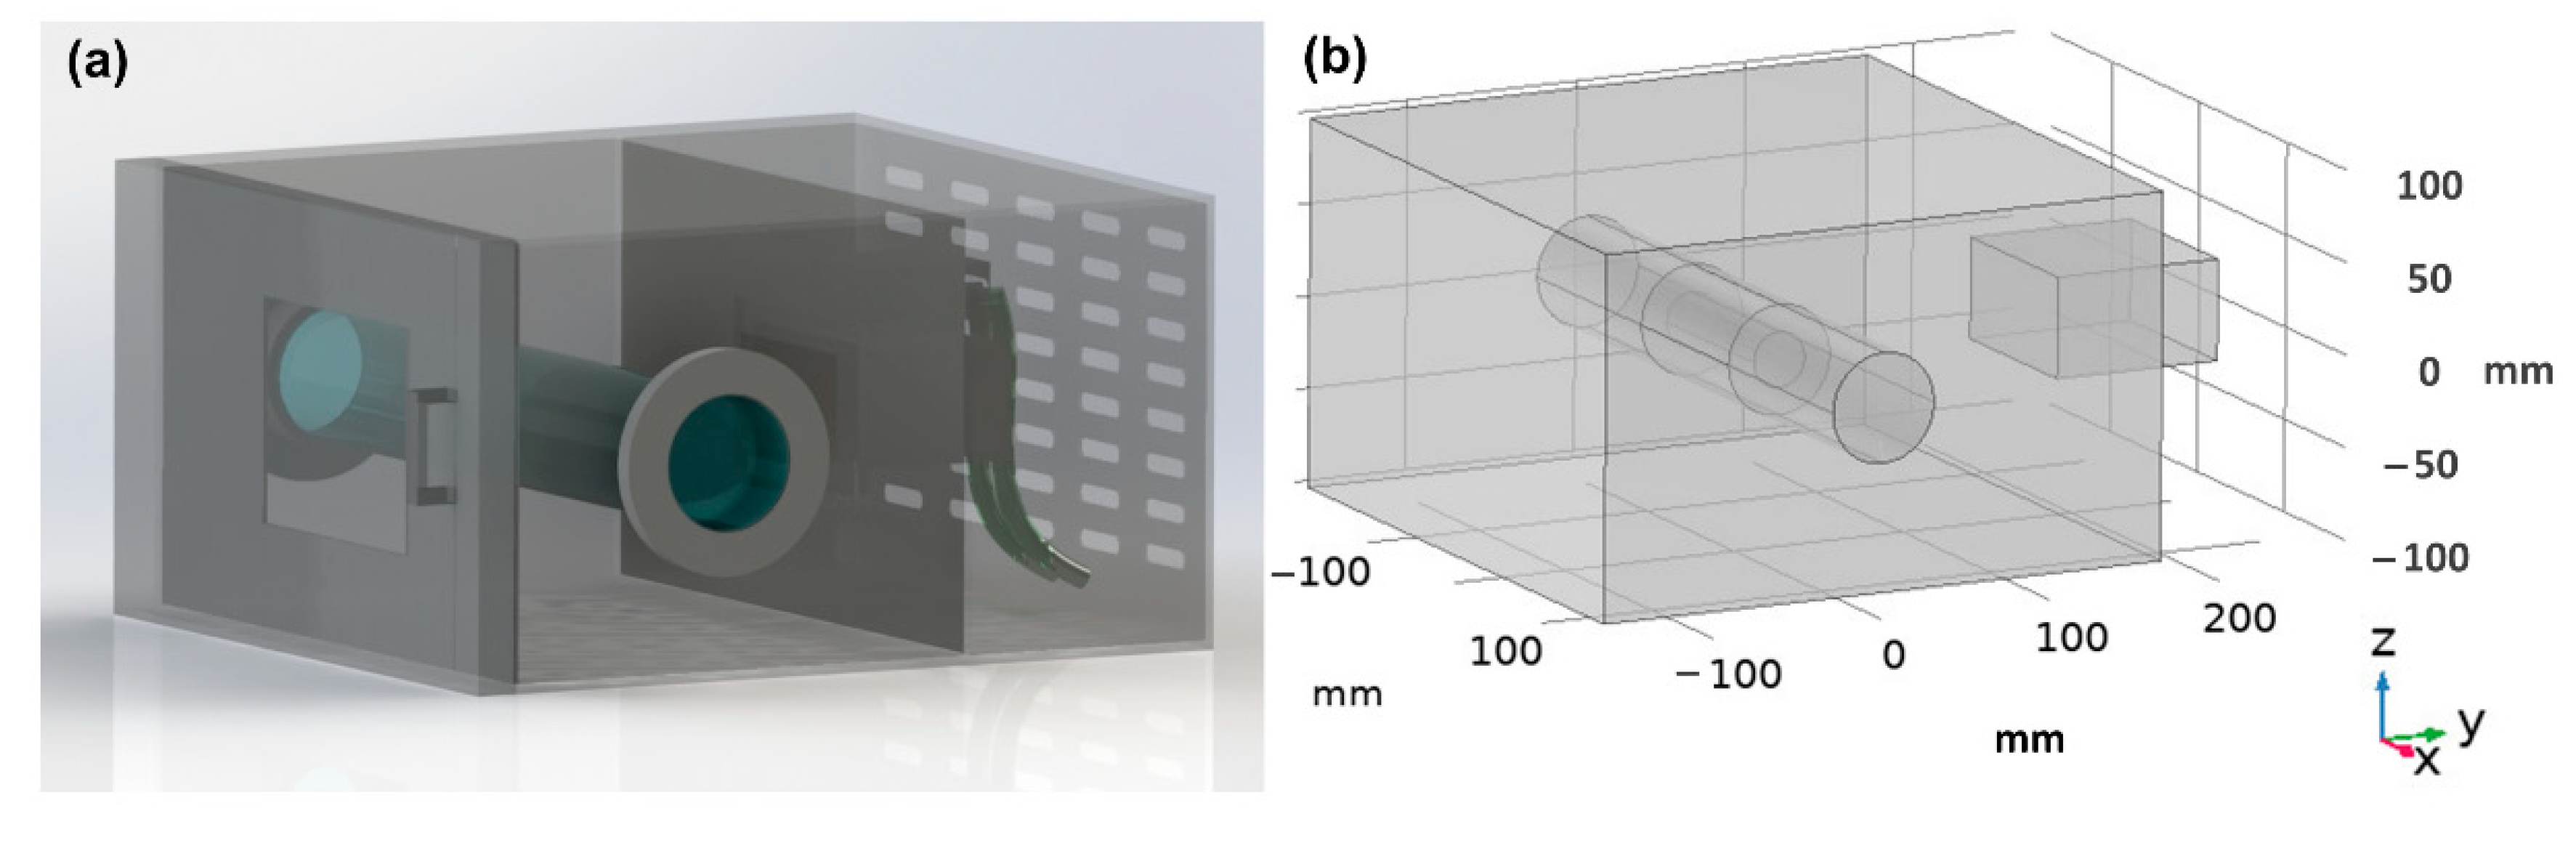
The modeling of the microwave reactor was based on a real microwave reactor that was used for biomass tar elimination. Its general structure is shown in Figure 2a. The microwave was generated by a single magnetron that was located in the back of the microwave reactor and then guided to the resonant cavity through a rectangular waveguide. A quartz tube filled with wave absorber was placed in the center of the reactor. The wave absorber can absorb the microwave and be heated up to the desired temperatures. The tar was blown from the inlet and eliminated after flowing through the hot absorber bed. The simulation model was established by the COMSOL Multiphysics 5.6 software (COMSOL, Burlington, MA, USA) (Figure 2b). The resonant cavity of the microwave reactor was a multimode cavity with an inner size of 340 mm (x) × 330 mm (y) × 200 mm (z). In the simulation, the quartz tube (d = 60 mm, l = 340 mm) was filled with silicon carbide particles as the wave absorber. A TE10 rectangular waveguide was used as the microwave irradiation feed. Its size was 100 mm (x) × 95 mm (y) × 55 mm (z).
2.2. Parameter Setting
The numerical work of electromagnetic and heat transfer equations for microwave heating was computed using the COMSOL Multiphysics software, which solves the numerical models using the finite element method (FEM) [32]. Before the simulation, the model materials were first defined. Their property parameters were obtained from the COMSOL Multiphysics 5.6 built-in material library and listed in Table 1. The irradiation feed position, microwave power, silicon carbide bed length and flow velocity were the main parameters for exploration. The vertical position of the irradiation feed (zi) was the main reactor parameter. Its initial location was in the center of the cavity back (zi = 0) and opposite straight to the silicon carbide bed as Figure 2b shows. The position was vertically adjusted with the zi values of 0, ±5, ±10 and ±20 mm. The operation parameters including microwave power (P), silicon carbide bed length (lSiC) and flow velocity (v) were adjusted in the range shown in Table 2. The electromagnetic propagation in the simulation was solved by Maxwell’s equations that were subjected to certain governing equation and boundary conditions (Table 3). Other fixed simulation parameters were also listed in Table 3. Some assumptions were made in the simulation to simplify the error problem and reduce the computational time. These assumptions mainly include: (1) the dielectric and thermal conductivity properties were assumed to be independent of the temperature; (2) the SiC sample is homogeneous and isotropic; (3) the mass transfer and chemical reactions are not considered; (4) the quartz tube and the air are zero dielectric losses medium; and (5) no heat transfer was considered in the quartz tube, surrounding cavity and environment [30].
2.3. Evaluation of the Electric and Thermal Fields
Distributions of the central electric intensity and temperature (x–y plane, z = 0) were obtained by the COMSOL software to evaluate the electric and thermal fields, respectively. The distribution bar with a gradient color was used to show the changes in electric intensity or temperature. The return loss is obtained to indicate the microwave reflection by the wave absorber and cavity. It is a measure of the effectiveness of power delivery from a transmission line to a load and is defined as [33]:
where Pref and Pin are the reflection and incident power, respectively. A higher return loss indicates less wave reflection (or a better match between the load and line), which means higher irradiation efficiency and energy utilization. The heating rate was also exported to give the temperature variation of the silicon carbide after microwave absorbing for 1200 s.
3. Results and Discussions
3.1. Effect of Irradiation Feed Position on the Simulated Electric and Thermal Fields
Figure 3a shows the variation of the electric fields with different irradiation feed positions. Due to the application of only one magnetron, the electric fields show non-uniform intensity [34,35], which is generally strong in the silicon carbide region, though it is covered by the non-conducting silicon carbide (dark blue center). As the irradiation feed position vertically moves, the electric field intensity changes accordingly. The electric intensity of the silicon carbide region becomes strong when the irradiation feed position moves from the side (zi = ±20 mm) toward the center and becomes strongest when zi = ±5. It is interesting to observe that when the irradiation feed position moves to the center (zi = 0), the electric intensity becomes the weakest. The reason is that the microwave was reflected heavily and caused severe echo cancellation when the center of the waveguide and quartz tube was on the same plane. This can be evidenced by the microwave return loss showing that the wave reflection is the most severe (lowest return loss) when zi = 0 (Figure 3b), indicating that placing the waveguide and quartz tube on the same plane results in low energy utilization. Salema and Afzal obtained a similar phenomenon that the maximum electric field intensity was not located at the center that opposites to the magnetron [30]. The reason they suggest is the larger heat losses or damped electric field at those regions, which supports the explanation about the energy loss caused by wave reflection in this simulation.
It is also reported that the sample position in the cavity greatly influences the heating characteristic [32,36] because of the high efficiency of converting electromagnetic energy into dielectric heating (typically more than 80% [37]) in conventional microwave heating systems. Therefore, the thermal fields of the reactor cavity were further investigated (Figure 4a). Since the silicon carbide is a good microwave absorber, the main high-temperature regions are centered in the silicon carbide (i.e., the middle of the quartz tube). The temperatures change with the irradiation feed position zi and reach the maximum when zi = ±5, indicating that this irradiation feed position leads to the highest temperature of silicon carbide after wave absorbing. This is reasonable because in such a situation the silicon carbide region will have the strongest microwave intensity as indicated in Figure 3a. The temperature of the hottest region is about 1100 K, which is high enough for biomass tar cracking [38,39]. The heating rate of silicon carbide is also the highest when zi = ±5 (Figure 4b), indicating the highest heating efficiency and energy utilization at this irradiation feed position.
3.2. Effect of Microwave Power on the Simulated Electric and Thermal Fields
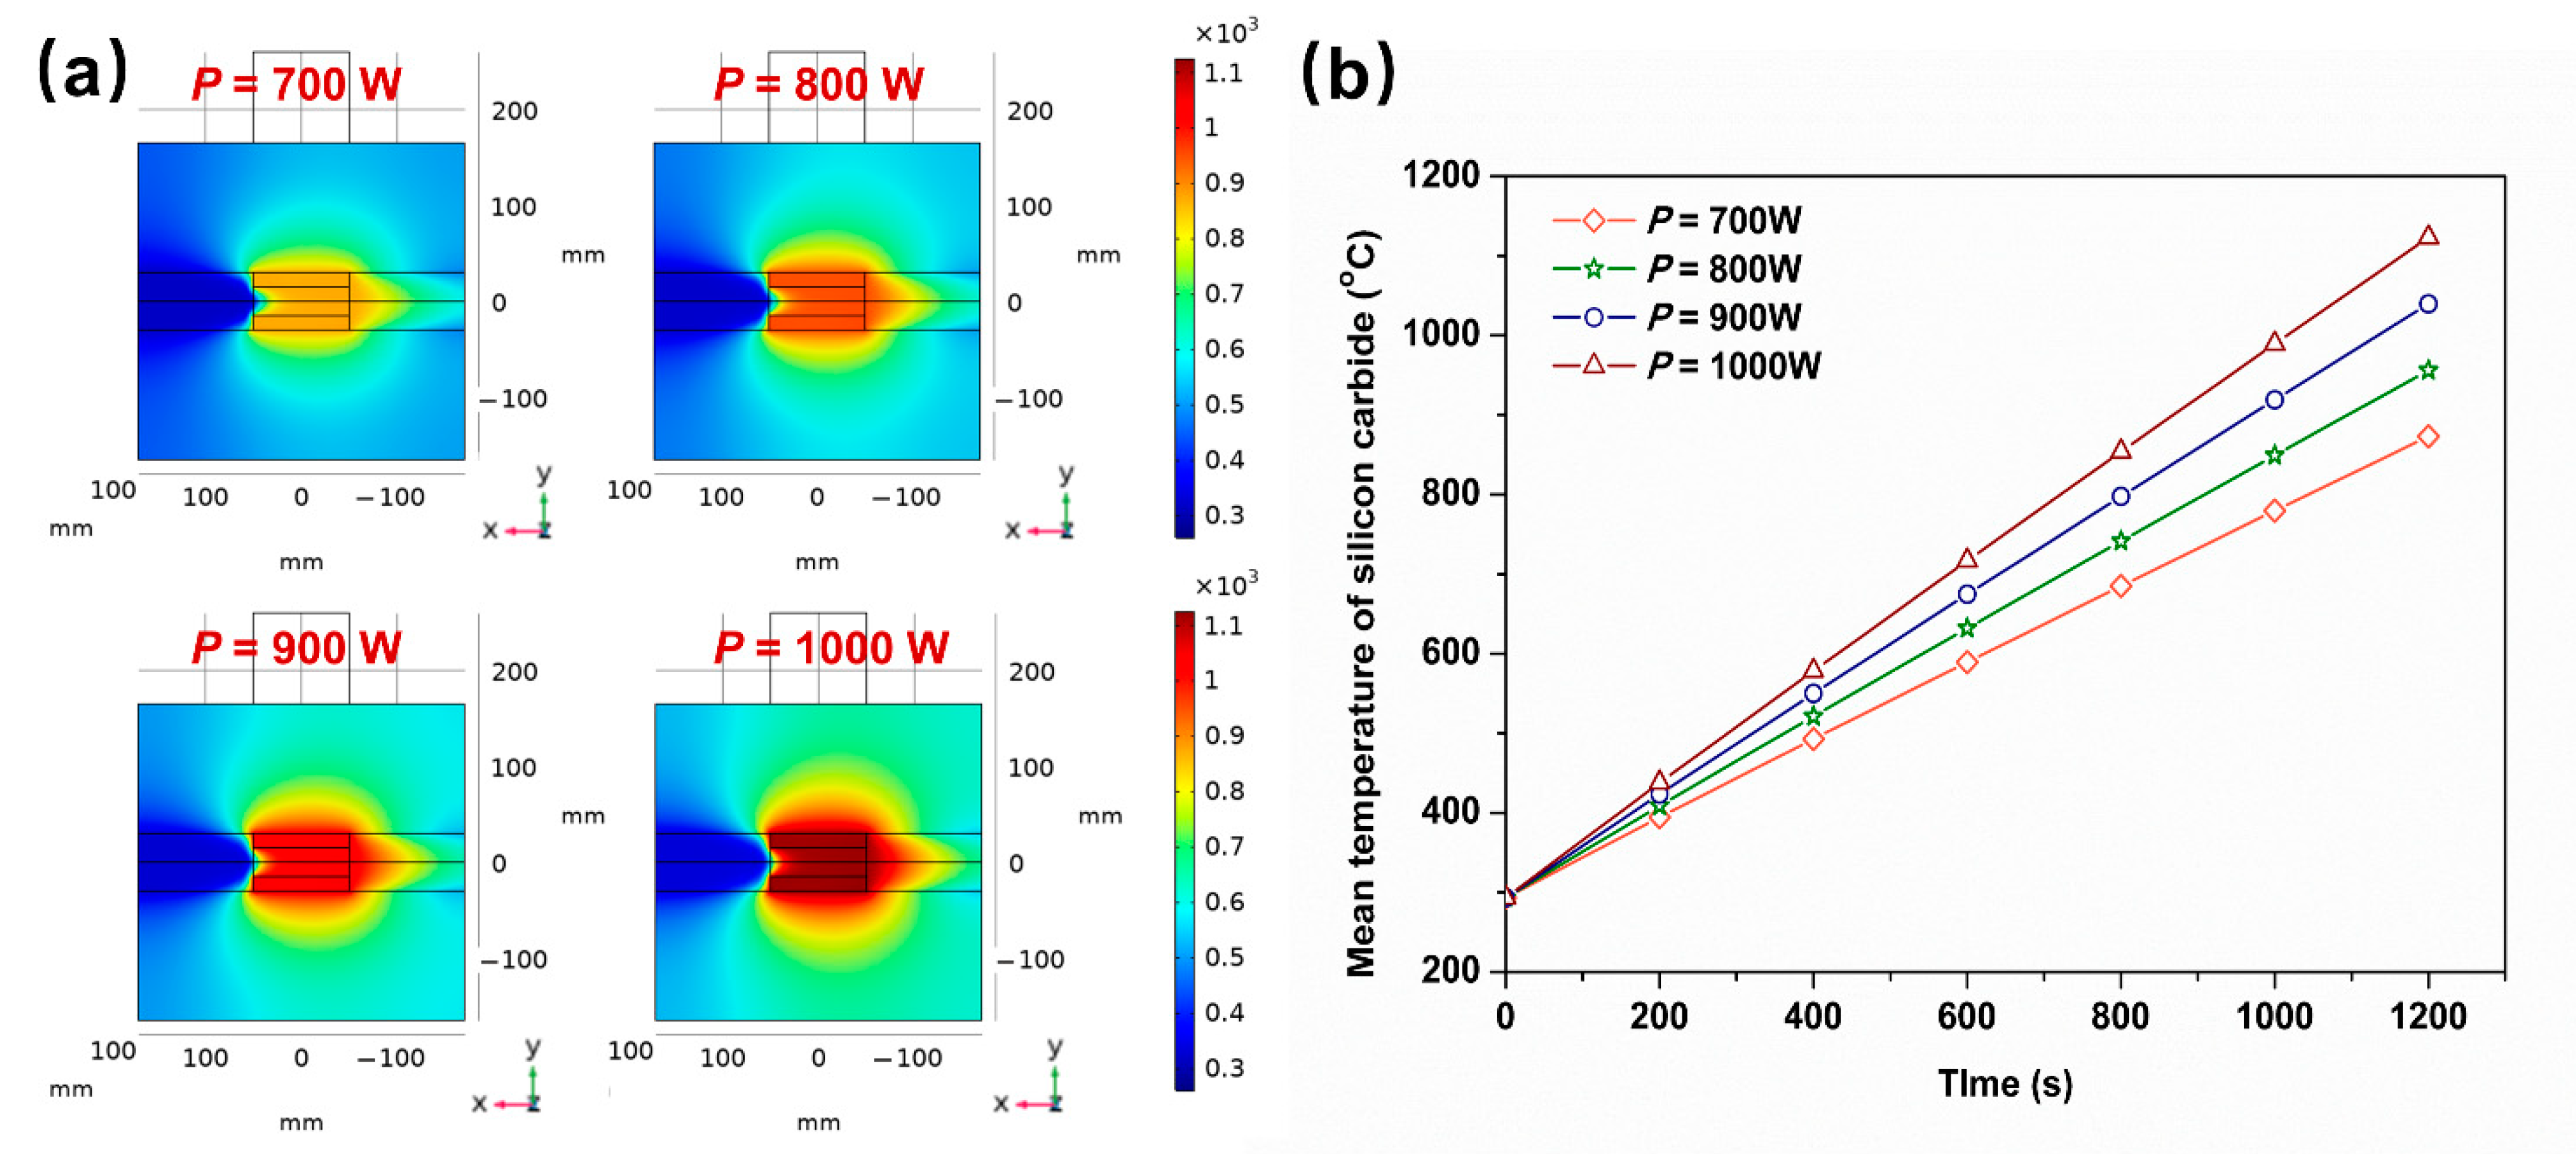
As the input energy mainly comes from the microwave, the microwave power would have a direct impact on the electric intensity and temperature distributions. When the microwave power increases from 700 W to 1000 W, the electric field distribution changes little while the intensity strengthens a bit (Figure 5a). The microwave return loss shows almost no change with the microwave power variation (Figure 5b) because the reflection medium and environment are unchanged. The strong electric intensity caused by the high microwave power results in the high temperature of the silicon carbide bed. The central temperature of the silicon carbide bed is around 850 K at P = 700 W and gradually increases to 1100 K when the microwave power rises to 1000 W (Figure 6a). Similarly, the heating rate of the silicon carbide bed also increases with the microwave power (Figure 6b). Therefore, high microwave power is positive for the bed temperature and heating rate. It is worth noting that although a high microwave power means a high energy input, it also decreases the heating time to the desired temperature. Considering the total energy that equals the power plus time, some researchers have found that the greater the microwave power is, the smaller the energy input is [32,40], which means a high microwave power can generally reduce the energy consumption.
3.3. Effect of Silicon Carbide Bed Length on the Simulated Electric and Thermal Fields
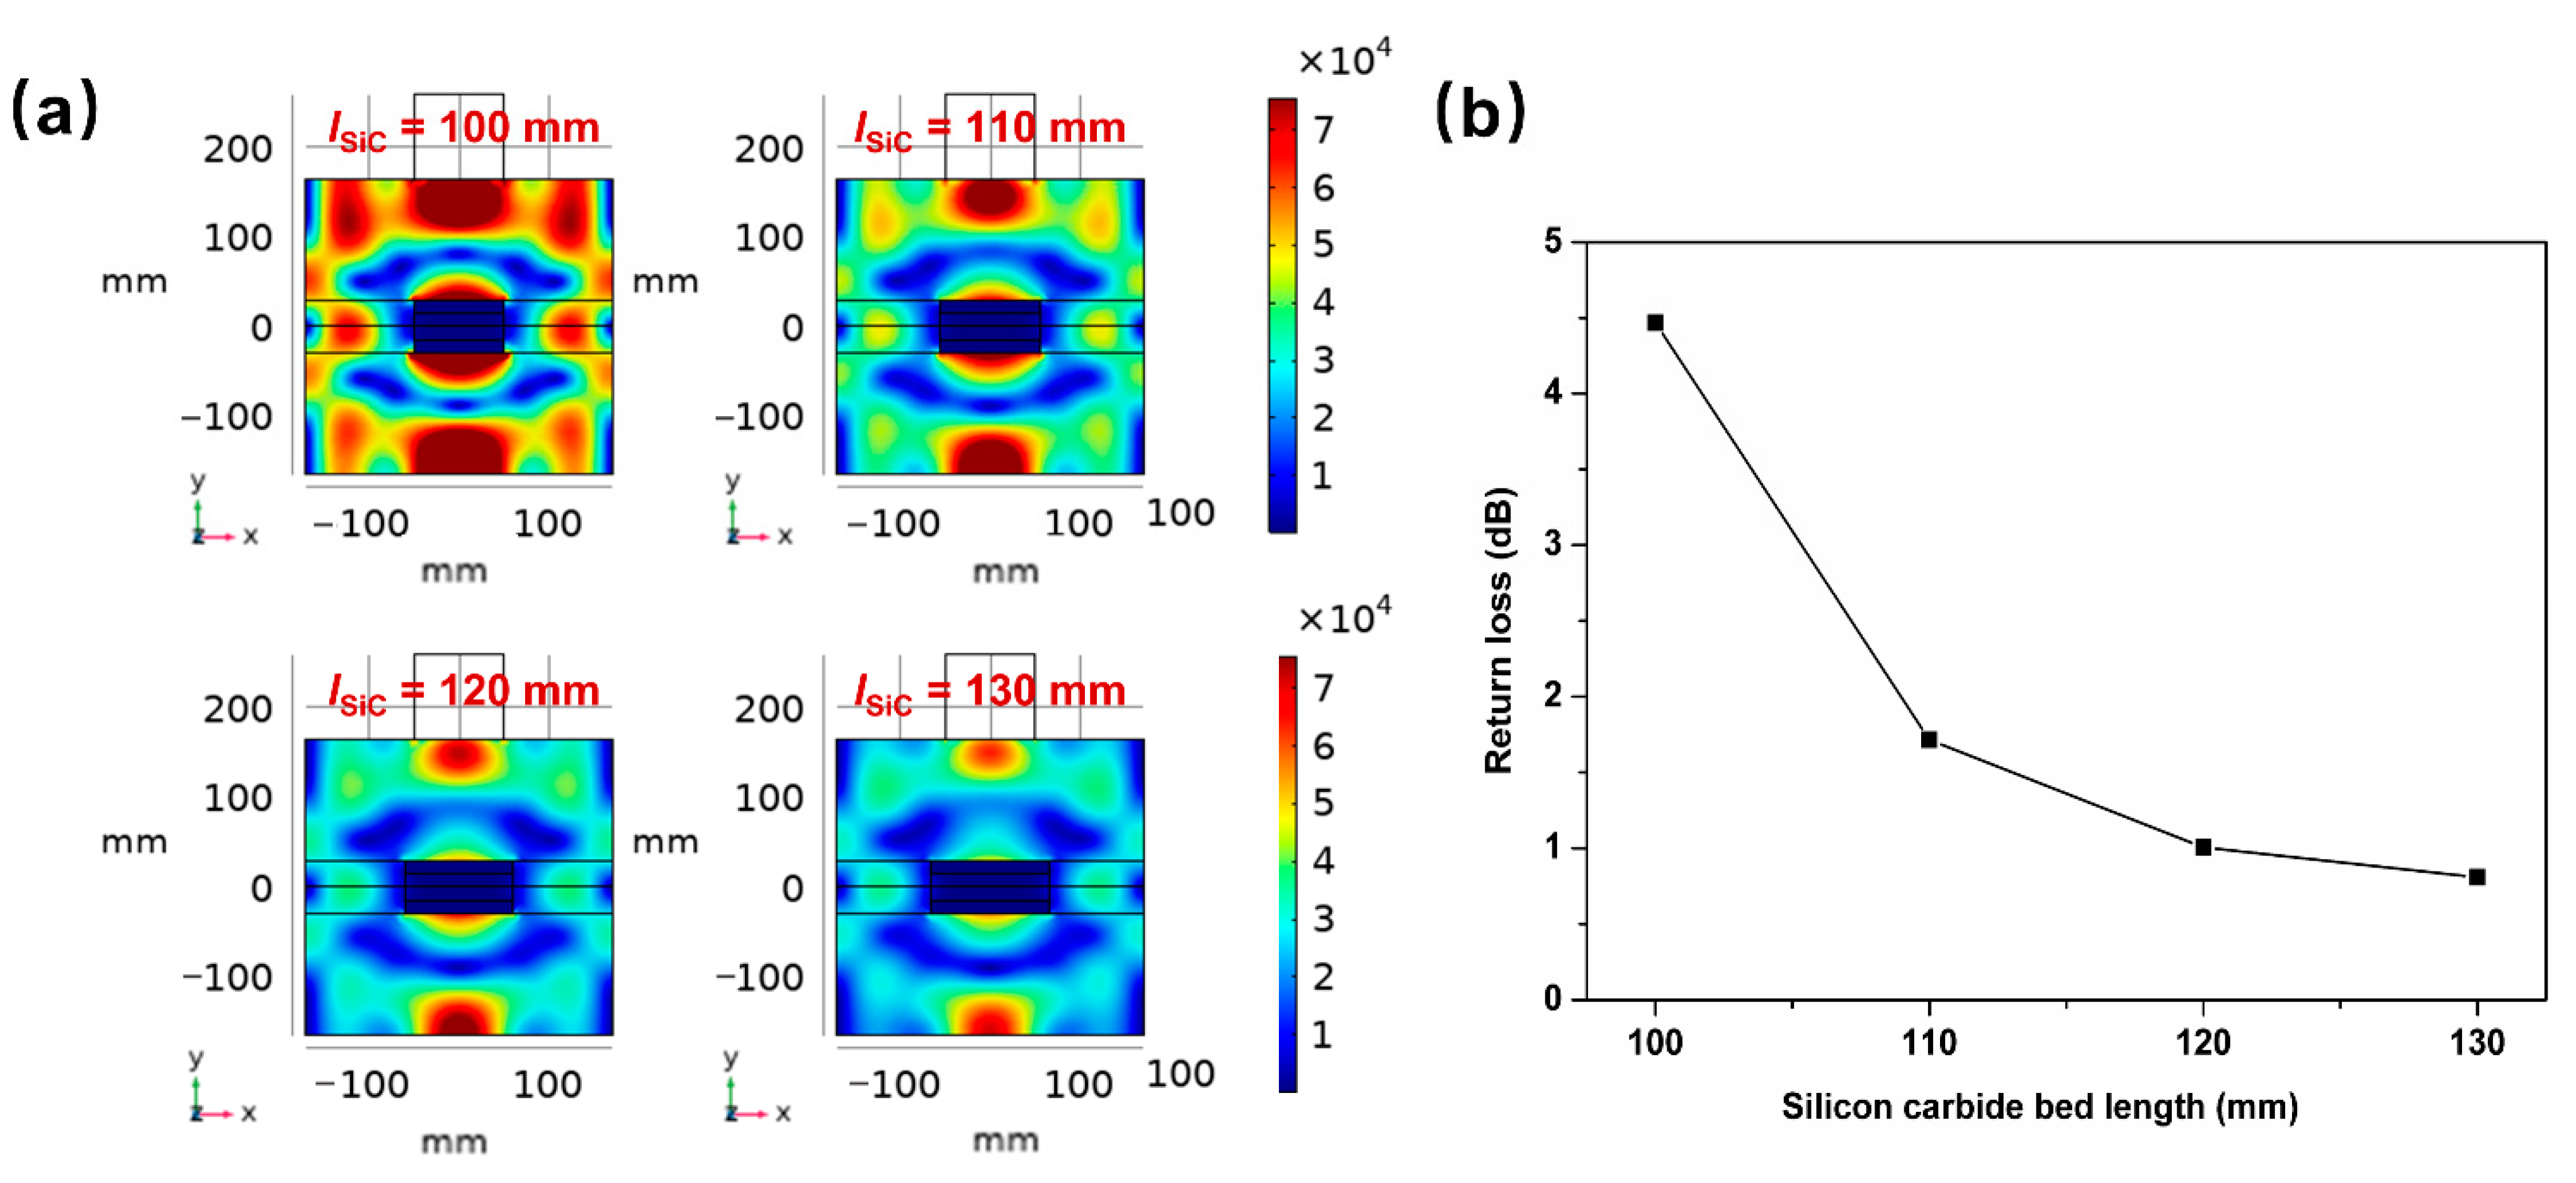
As the microwave absorber, the silicon carbide provides the reaction site for tar elimination. It did not affect the microwave irradiation but influenced the wave diffraction, reflection, interference and, consequently, the electric fields as shown in Figure 7a. When the silicon carbide bed length increases from 100 mm to 130 mm, the overall electric fields, especially the strong intensity regions (red spots), become weak because the microwave reflection increases when the silicon carbide bed length gets longer (Figure 7b). Since the silicon carbide is the microwave absorber, its bed length also influences the bed temperature distribution (Figure 8a). It is observed that the temperature of the silicon carbide bed is highest when the silicon carbide bed length is 100 mm. The highest temperature can reach approximately 1100 K. Extending the bed length results in the obvious decrease of the silicon carbide bed temperature, as well as the heating rate (Figure 8b), because when the silicon carbide bed gets longer, not only does the microwave reflection become severe but, also, the side of the silicon carbide bed locates in the less-intensive electric region where the temperature is lower and less uniform than in the center [41]. These results indicate that with regard to the bed temperature for tar elimination, it is better to shorten the silicon carbide bed length. However, the silicon carbide bed length also influences the heating area, residence time (or space velocity) and, consequently, the efficiency of the biomass tar elimination. For example, extending the silicon carbide bed length increases the residence time of biomass tar on the silicon carbide bed; thus, it will promote the tar cracking if the tar cracking reactions are not fast. When the treatment capacity (or flow rate) is constant in a fixed-bed reactor, a long silicon carbide bed length may lead to a more sufficient biomass tar elimination. Therefore, the chemical kinetics of the biomass tar elimination reactions should also be considered when determining the silicon carbide bed length in the practical application.
Many researchers found that the sample size significantly affects the power and temperature distribution in microwave heating, as well as the heating rate within the samples [42,43,44]. For example, Brodie [45] reported that the thick samples generate heat just below the surface while thin samples generate heat from the center. Although the silicon carbide in this simulation is not the reactant, it does act as the sample to be heated. Its length, in general, affects the overall size and will certainly be an important factor to influence the thermal field and, consequently, the biomass tar elimination.
3.4. Effect of Flow Velocity on the Simulated Thermal Fields
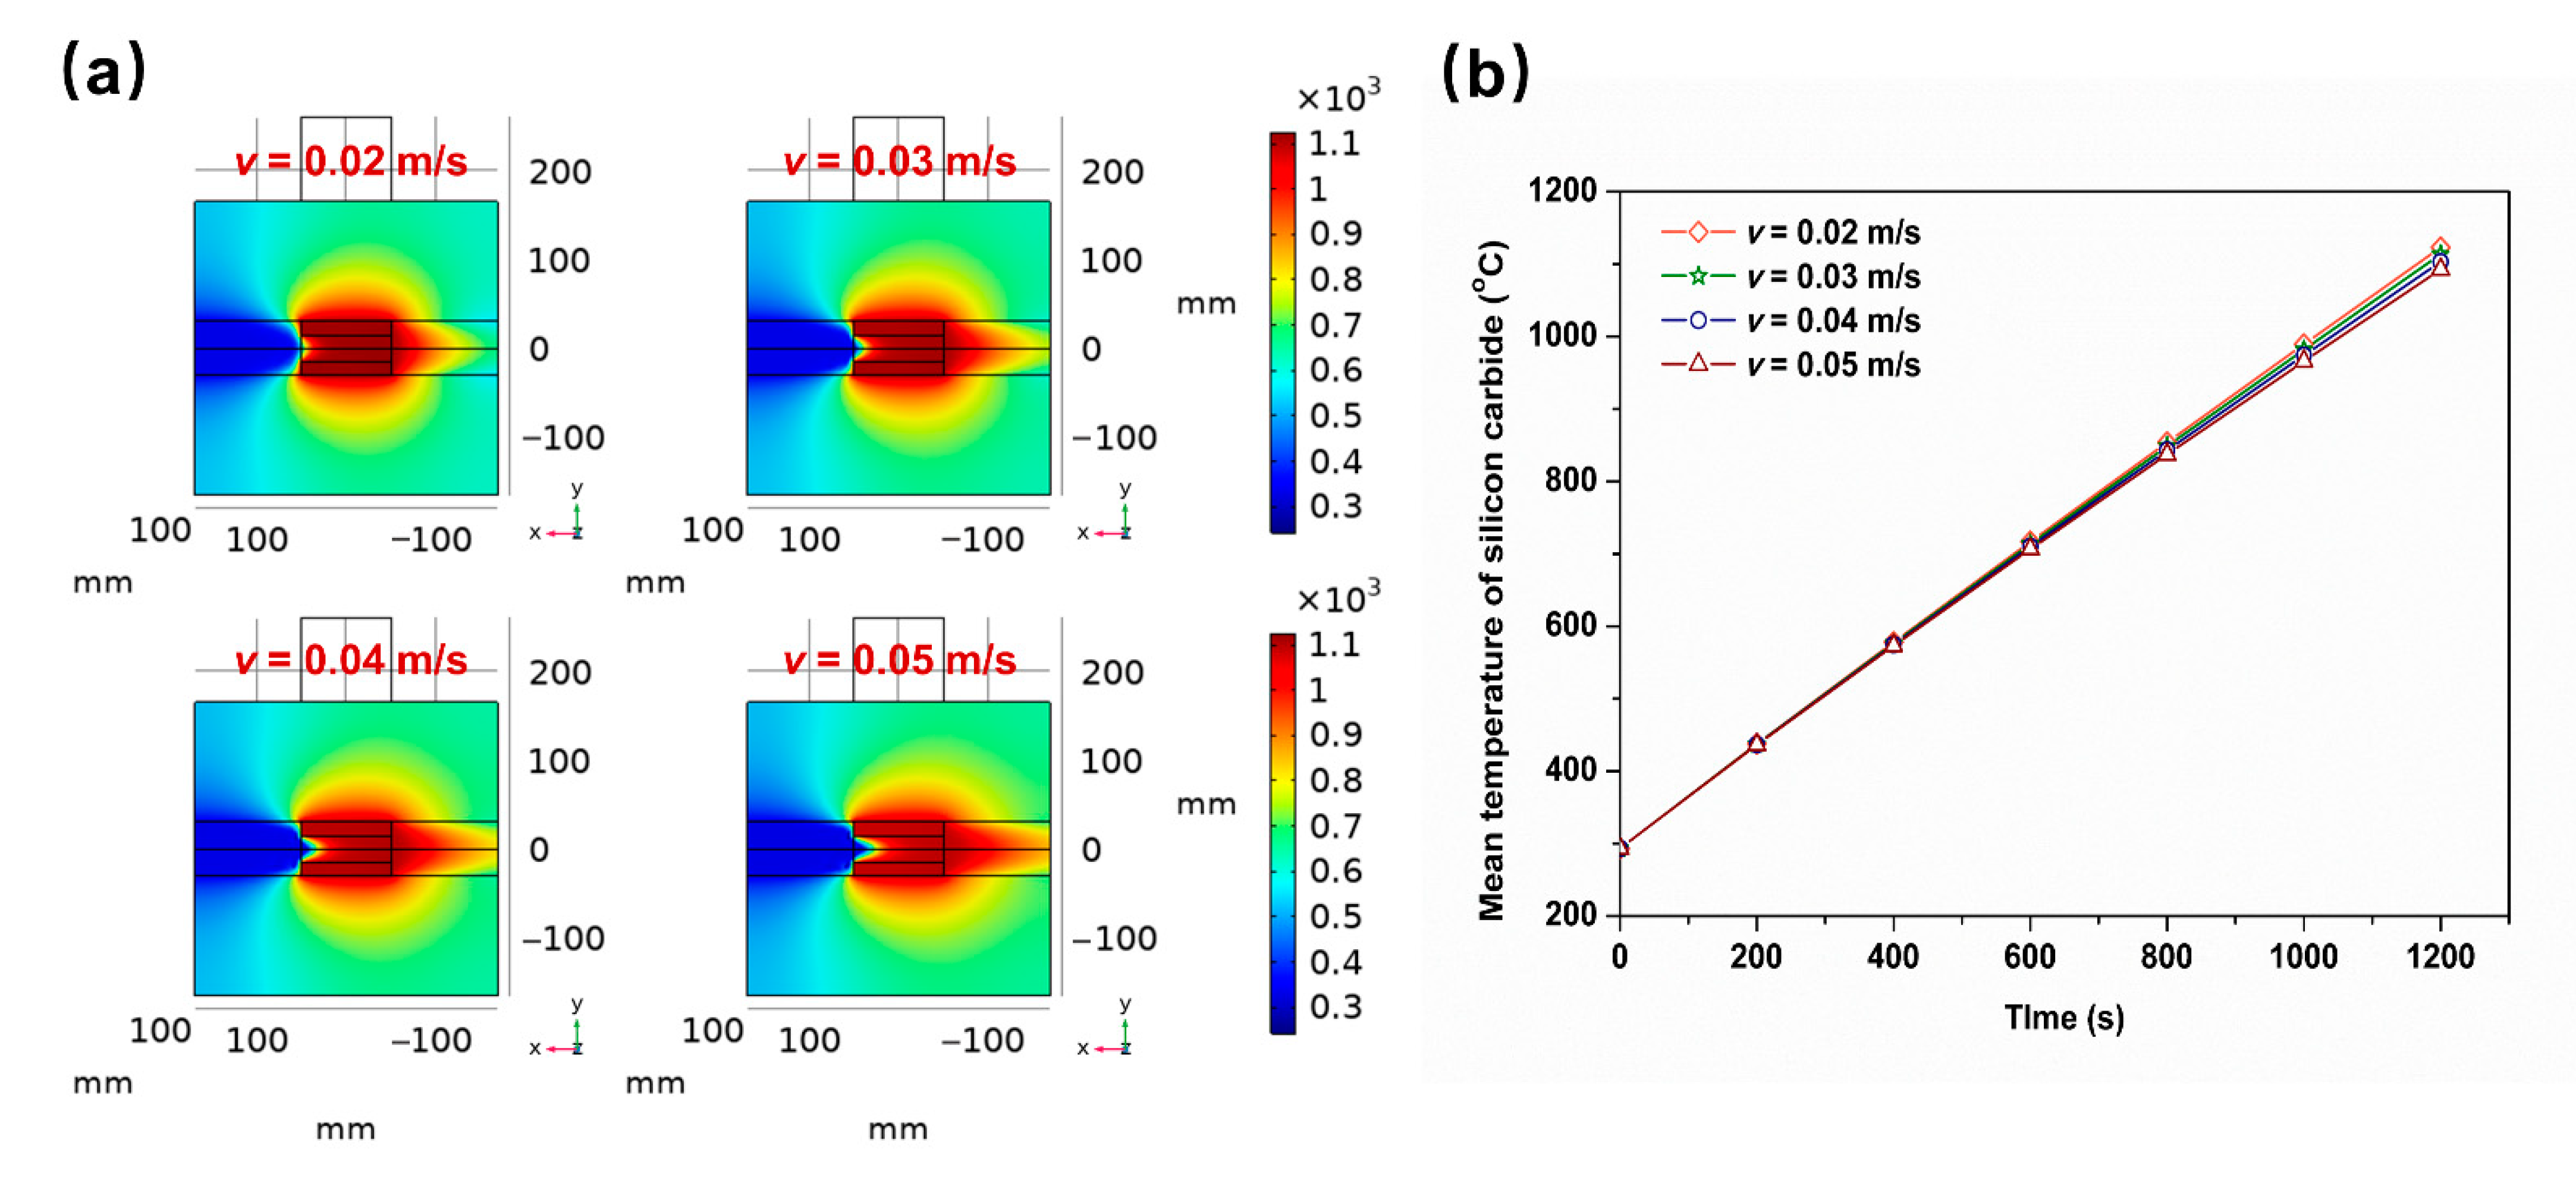
The nitrogen is used as the carrier gas to blow the tar through the silicon carbide bed. It has no wave-absorbing ability and, therefore, its flow rate will not affect the electric fields under microwave irradiation. For this reason, only the thermal fields of the cavity with different flow velocities were investigated. The cold carrier gas blew from the left inlet of the quartz tube, making the hot region (especially the central hot region) of the silicon carbide shift a little to the right (Figure 9a). When the flow velocity is higher, more cold carrier gas will be blown in and take the heat of the silicon carbide away, resulting in the obvious non-uniform temperature distribution on the silicon carbide, as well as the energy loss. The heating rate of silicon carbide under microwave irradiation will also decrease a little when the flow velocity gets higher (Figure 9b). It should be noted that although a low flow velocity may be beneficial to relatively uniform temperature distribution, less energy loss and long residence time, it decreases the treatment capacity of the biomass tar. Determination of the flow velocity in a practical application for efficient tar removal should consider both the temperature requirement and the chemical reaction rate of the biomass tar elimination.
4. Conclusions
The electric and thermal fields of the microwave reactor used for ex situ biomass tar elimination were simulated under various reactor and operation parameters including irradiation feed position, microwave power, silicon carbide bed length and flow velocity. The main conclusions include:
- (1)
- The irradiation feed position that locates 5 mm vertically to the silicon carbide plane (zi = 5 mm) obtains the highest electric intensity on the silicon carbide bed. At this feed position, the silicon carbide can reach the highest temperature and fastest heating rate after wave absorbing, achieving the highest heating efficiency and energy utilization. Placing the waveguide and quartz tube on the same plane will result in the lowest energy utilization because of severe wave reflection.
- (2)
- As the microwave power increases from 700 W to 1000 W, the temperature and heating rate of silicon carbide obviously increase, but the electric field distribution and microwave return loss changes little. The effect of silicon carbide bed length on electric fields is remarkable because of the microwave return loss. Extending the bed length from 100 mm to 130 mm will obviously decrease the bed temperature, as well as the heating rate. A high flow velocity leads to obvious non-uniform temperature distribution on silicon carbide because of the blowing of the cold carrier gas.
- (3)
- To achieve a high microwave energy utilization and uniform bed temperature distribution, a suitable irradiation feed position (zi = 5 mm), high microwave power (P = 1000 W), short silicon carbide bed length (lSiC = 100 mm) and low flow velocity (v = 0.02 m/s) are preferred. However, determination of these parameters in a practical application of biomass tar elimination should also consider the other conditions such as chemical kinetics, treatment capacity and the temperature requirement.
Author Contributions
Conceptualization, C.Y. and Z.C.; methodology, C.Y. and Z.C.; data curation, K.Y. and F.Y.; formal analysis, C.Y.; validation, H.P.; funding acquisition, Z.C. and F.Y.; supervision, Z.C.; writing—original draft, C.Y.; writing—review and editing, Z.C. All authors have read and agreed to the published version of the manuscript.
Funding
This research was mainly funded by the Huzhou Science and Technology Project (No. 2020GZ28) and partly funded by the Zhejiang Basic Public Welfare Research Project (No. LGF22E080025) and Postdoctoral Research Project of Zhejiang Province (ZJ2020100).
Institutional Review Board Statement
Not applicable.
Informed Consent Statement
Not applicable.
Conflicts of Interest
The authors declared no potential conflicts of interest concerning the research, authorship and/or publication of this article.
References
- Han, J.; Kim, H. The reduction and control technology of tar during biomass gasification/pyrolysis: An overview. Renew. Sustain. Energy Rev. 2008, 12, 397–416. [Google Scholar] [CrossRef]
- Li, C.; Suzuki, K. Tar property, analysis, reforming mechanism and model for biomass gasification—An overview. Renew. Sustain. Energy Rev. 2009, 13, 594–604. [Google Scholar] [CrossRef]
- Liu, W.J.; Li, W.W.; Jiang, H.; Yu, H.Q. Fates of chemical elements in biomass during its pyrolysis. Chem. Rev. 2017, 117, 6367–6398. [Google Scholar] [CrossRef] [PubMed]
- Guo, F.; Dong, Y.; Zhang, T.; Dong, L.; Guo, C.; Rao, Z. Experimental study on herb residue gasification in an air-blown circulating fluidized bed gasifier. Ind. Eng. Chem. Res. 2014, 53, 13264–13273. [Google Scholar] [CrossRef]
- Zhang, X.; Chen, Z.; Cheng, L.; Xu, L.; Bi, X.; Liu, Q. Valorization of fluid petroleum coke for efficient catalytic destruction of biomass gasification tar. J. Hazard. Mater. 2022, 424, 127297. [Google Scholar] [CrossRef]
- Li, X.; Liu, P.; Chen, W.; Wu, Y.; Lei, T.; Huang, S.; Li, Y.; Wu, S.; Wang, Z. Catalytic pyrolysis of toluene as biomass tar model component using Ni/HZSM-5 modified by CeO2 and MgO promoters. J. Anal. Appl. Pyrolysis 2022, 162, 105436. [Google Scholar] [CrossRef]
- Heidenreich, S.; Foscolo, P.U. New concepts in biomass gasification. Prog. Energy Combust. Sci. 2015, 46, 72–95. [Google Scholar] [CrossRef]
- Janajreh, I.; Raza, S.S.; Valmundsson, A.S. Plasma gasification process: Modeling, simulation and comparison with conventional air gasification. Energy Convers. Manag. 2013, 65, 801–809. [Google Scholar] [CrossRef]
- Devi, L.P.K.; Janssen, F.J.J.G. A review of the primary measures for tar elimination in biomass gasification processes. Biomass Bioenergy 2003, 24, 125–140. [Google Scholar] [CrossRef]
- Zeng, X.; Ueki, Y.; Yoshiie, R.; Naruse, I.; Wang, F.; Han, Z.; Xu, G. Recent progress in tar removal by char and the applications: A comprehensive analysis. Carbon Resour. Convers. 2020, 3, 1–18. [Google Scholar] [CrossRef]
- Anis, S.; Zainal, Z.A. Tar reduction in biomass producer gas via mechanical, catalytic and thermal methods: A review. Renew. Sustain. Energy Rev. 2011, 15, 2355–2377. [Google Scholar] [CrossRef]
- Shen, Y.; Yoshikawa, K. Recent progresses in catalytic tar elimination during biomass gasification or pyrolysis—A review. Renew. Sustain. Energy Rev. 2013, 21, 371–392. [Google Scholar] [CrossRef]
- Guan, G.; Kaewpanha, M.; Hao, X.; Abudula, A. Catalytic steam reforming of biomass tar: Prospects and challenges. Renew. Sustain. Energy Rev. 2016, 58, 450–461. [Google Scholar] [CrossRef] [Green Version]
- Chan, F.L.; Tanksale, A. Review of recent developments in Ni-based catalysts for biomass gasification. Renew. Sustain. Energy Rev. 2014, 38, 428–438. [Google Scholar] [CrossRef]
- Abdoulmoumine, N.; Adhikari, S.; Kulkarni, A.; Chattanathan, S. A review on biomass gasification syngas cleanup. Appl. Energy 2015, 155, 294–307. [Google Scholar] [CrossRef]
- Cheng, L.; Wu, Z.; Zhang, Z.; Guo, C.; Ellis, N.; Bi, X.; Paul Watkinson, A.; Grace, J.R. Tar elimination from biomass gasification syngas with bauxite residue derived catalysts and gasification char. Appl. Energy 2020, 258, 114088. [Google Scholar] [CrossRef]
- Hervy, M.; Weiss-Hortala, E.; Pham Minh, D.; Dib, H.; Villot, A.; Gérente, C.; Berhanu, S.; Chesnaud, A.; Thorel, A.; Le Coq, L.; et al. Reactivity and deactivation mechanisms of pyrolysis chars from bio-waste during catalytic cracking of tar. Appl. Energy 2019, 237, 487–499. [Google Scholar] [CrossRef] [Green Version]
- Motasemi, F.; Afzal, M.T. A review on the microwave-assisted pyrolysis technique. Renew. Sustain. Energy Rev. 2013, 28, 317–330. [Google Scholar] [CrossRef]
- Beneroso, D.; Bermúdez, J.M.; Montes-Morán, M.A.; Arenillas, A.; Menéndez, J.A. Microwave-induced cracking of pyrolytic tars coupled to microwave pyrolysis for syngas production. Bioresour. Technol. 2016, 218, 687–691. [Google Scholar] [CrossRef] [Green Version]
- Muley, P.D.; Henkel, C.E.; Aguilar, G.; Klasson, K.T.; Boldor, D. Ex situ thermo-catalytic upgrading of biomass pyrolysis vapors using a traveling wave microwave reactor. Appl. Energy 2016, 183, 995–1004. [Google Scholar] [CrossRef] [Green Version]
- Guo, F.; Dong, Y.; Tian, B.; Du, S.; Liang, S.; Zhou, N.; Wang, Y.; Chen, P.; Ruan, R. Applications of microwave energy in gas production and tar removal during biomass gasification. Sustain. Energy Fuels 2020, 4, 5927–5946. [Google Scholar] [CrossRef]
- Li, J.; Tao, J.; Yan, B.; Jiao, L.; Chen, G.; Hu, J. Review of microwave-based treatments of biomass gasification tar. Renew. Sustain. Energy Rev. 2021, 150, 111510. [Google Scholar] [CrossRef]
- Valderrama Rios, M.L.; González, A.M.; Lora, E.E.S.; Almazán del Olmo, O.A. Reduction of tar generated during biomass gasification: A review. Biomass Bioenergy 2018, 108, 345–370. [Google Scholar] [CrossRef]
- Kostyniuk, A.; Grilc, M.; Likozar, B. Catalytic cracking of biomass-derived hydrocarbon tars or model compounds to form biobased benzene, toluene, and xylene isomer mixtures. Ind. Eng. Chem. Res. 2019, 58, 7690–7705. [Google Scholar] [CrossRef] [Green Version]
- Li, J.; Tao, J.; Yan, B.; Cheng, K.; Chen, G.; Hu, J. Microwave reforming with char-supported nickel-cerium catalysts: A potential approach for thorough conversion of biomass tar model compound. Appl. Energy 2020, 261, 114375. [Google Scholar] [CrossRef]
- Chen, G.; Li, J.; Cheng, Z.; Yan, B.; Ma, W.; Yao, J. Investigation on model compound of biomass gasification tar cracking in microwave furnace: Comparative research. Appl. Energy 2018, 217, 249–257. [Google Scholar] [CrossRef]
- Zhang, Y.; Song, Z.; Yan, Y.; Zhao, X.; Sun, J.; Mao, Y.; Wang, W. Performance of Fe/SiC catalysts for cracking of toluene under microwave irradiation. Int. J. Hydrogen Energy 2018, 43, 7227–7236. [Google Scholar] [CrossRef]
- Claude, V.; Courson, C.; Köhler, M.; Lambert, S.D. Overview and essentials of biomass gasification technologies and their catalytic cleaning methods. Energy Fuels 2016, 30, 8791–8814. [Google Scholar] [CrossRef]
- Li, J.; Jiao, L.; Tao, J.; Chen, G.; Hu, J.; Yan, B.; Mansour, M.; Guo, Y.; Ye, P.; Ding, Z.; et al. Can microwave treat biomass tar? A comprehensive study based on experimental and net energy analysis. Appl. Energy 2020, 272, 115194. [Google Scholar] [CrossRef]
- Salema, A.A.; Afzal, M.T. Numerical simulation of heating behaviour in biomass bed and pellets under multimode microwave system. Int. J. Therm. Sci. 2015, 91, 12–24. [Google Scholar] [CrossRef]
- Zhou, R.; Yang, X.; Sun, D.; Jia, G. Multiple tube structure for heating uniformity and efficiency optimization of microwave ovens. Eur. Phys. J. Appl. Phys. 2015, 69, 20201. [Google Scholar] [CrossRef]
- Hong, Y.; Lin, B.; Li, H.; Dai, H.; Zhu, C.; Yao, H. Three-dimensional simulation of microwave heating coal sample with varying parameters. Appl. Therm. Eng. 2016, 93, 1145–1154. [Google Scholar] [CrossRef]
- Bird, T.S. Definition and Misuse of Return Loss [Report of the Transactions Editor-in-Chief]. IEEE Antennas Propag. 2009, 51, 166–167. [Google Scholar] [CrossRef]
- Wang, S.; Hu, Z.; Han, Y.; Gu, Z. Effects of magnetron arrangement and power combination of microwave on drying uniformity of carrot. Dry. Technol. 2013, 31, 1206–1211. [Google Scholar] [CrossRef]
- Wang, S.; Yang, R.; Han, Y.; Gu, Z. Effects of magnetron arrangement and power combination on temperature field uniformity of microwave drying of carrot. Dry. Technol. 2016, 34, 912–922. [Google Scholar] [CrossRef]
- Pedreño-Molina, J.L.; Monzó-Cabrera, J.; Catalá-Civera, J.M. Sample movement optimization for uniform heating in microwave heating ovens. Int. J. RF Microw. Comput.-Aided Eng. 2007, 17, 142–152. [Google Scholar] [CrossRef]
- Meredith, R. Engineer’s Handbook of Industrial Microwave Heating; The Institution of Electric Engineers: London, UK, 1998. [Google Scholar]
- Ren, J.; Cao, J.; Zhao, X.; Liu, Y. Recent progress and perspectives of catalyst design and downstream integration in biomass tar reforming. Chem. Eng. J. 2022, 429, 132316. [Google Scholar] [CrossRef]
- Ren, J.; Liu, Y.; Zhao, X.; Cao, J. Biomass thermochemical conversion: A review on tar elimination from biomass catalytic gasification. J. Energy Inst. 2020, 93, 1083–1098. [Google Scholar] [CrossRef]
- Samanli, S. A comparison of the results obtained from grinding in a stirred media mill lignite coal samples treated with microwave and untreated samples. Fuel 2011, 90, 659–664. [Google Scholar] [CrossRef]
- Klinbun, W.; Rattanadecho, P.; Pakdee, W. Microwave heating of saturated packed bed using a rectangular waveguide (TE10 mode): Influence of particle size, sample dimension, frequency, and placement inside the guide. Int. J. Heat Mass Transfer 2011, 54, 1763–1774. [Google Scholar] [CrossRef]
- Rattanadecho, P. The simulation of microwave heating of wood using a rectangular wave guide: Influence of frequency and sample size. Chem. Eng. Sci. 2006, 61, 4798–4811. [Google Scholar] [CrossRef]
- Curet, S.; Rouaud, O.; Boillereaux, L. Effect of sample size on microwave power absorption within dielectric materials: 2D numerical results vs. closed-form expressions. AIChE J. 2009, 55, 1569–1583. [Google Scholar] [CrossRef]
- Ayappa, K.G.; Davis, H.T.; Crapiste, G.; Davis, E.A.; Gordon, J. Microwave heating: An evaluation of power formulations. Chem. Eng. Sci. 1991, 46, 1005–1016. [Google Scholar] [CrossRef]
- Brodie, G. The Influence of Load Geometry on Temperature Distribution During Microwave Heating. Trans. ASABE 2008, 51, 1401–1413. [Google Scholar] [CrossRef]
Figure 1.
Biomass tar elimination method and their properties.

Figure 2.
Structure of the microwave reactor for ex situ biomass tar elimination: (a) structural model; and (b) simulation model of the resonant cavity.
Figure 2.
Structure of the microwave reactor for ex situ biomass tar elimination: (a) structural model; and (b) simulation model of the resonant cavity.

Figure 3.
Effect of irradiation feed position on the simulated electric fields (the electric field unit: V/m; x–y plane, z = 0; P = 1000 W; lSiC = 100 mm; v = 0.02 m/s): (a) variation of the electric fields with different irradiation feed positions; and (b) the microwave return loss with different irradiation feed positions.

Figure 4.
Effect of irradiation feed position on the simulated thermal fields (the temperature unit: K; x–y plane, z = 0; P = 1000 W; lSiC = 100 mm; v = 0.02 m/s): (a) variation of the thermal fields with different irradiation feed positions; and (b) the heating rate of silicon carbide under microwave irradiation with different irradiation feed positions.

Figure 5.
Effect of microwave power on the simulated electric fields (the electric field unit: V/m; x–y plane, z = 0; zi = 5 mm; lSiC = 100 mm; v = 0.02 m/s): (a) variation of the electric fields with different microwave power; and (b) the microwave return loss with different microwave power.
Figure 5.
Effect of microwave power on the simulated electric fields (the electric field unit: V/m; x–y plane, z = 0; zi = 5 mm; lSiC = 100 mm; v = 0.02 m/s): (a) variation of the electric fields with different microwave power; and (b) the microwave return loss with different microwave power.
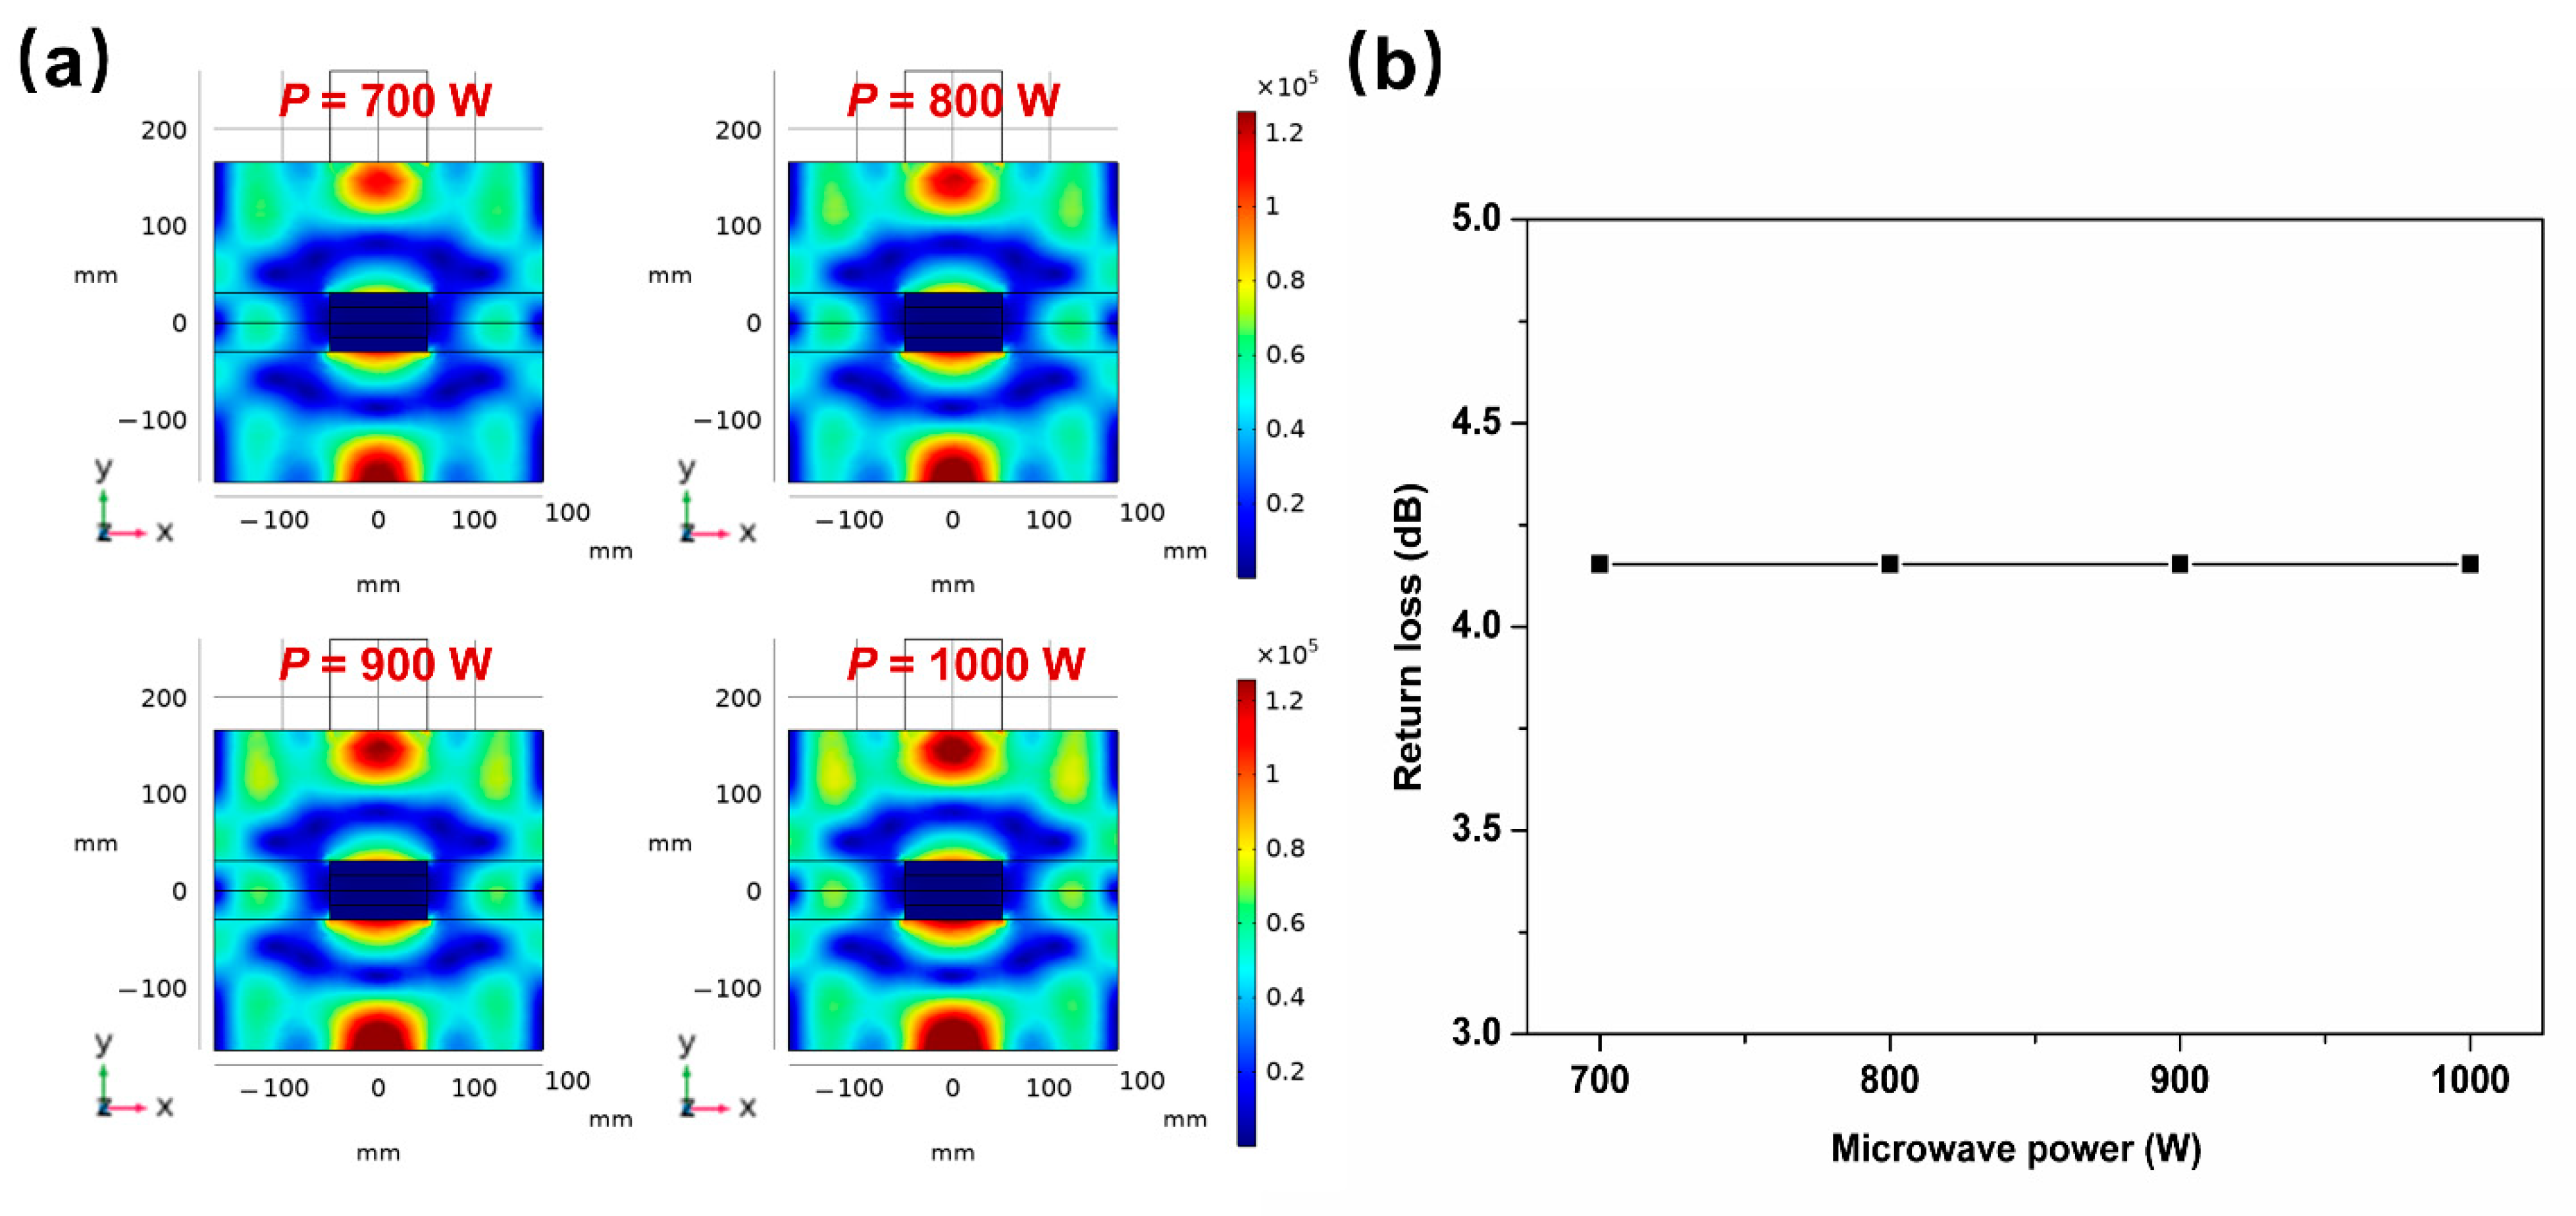
Figure 6.
Effect of microwave power on the simulated thermal fields (the temperature unit: K; x–y plane, z = 0; zi = 5 mm; lSiC = 100 mm; v = 0.02 m/s): (a) variation of the thermal fields with different microwave power; and (b) the heating rate of silicon carbide under microwave irradiation with different microwave power.

Figure 7.
Effect of silicon carbide bed length on the simulated electric fields (the electric field unit: V/m; x–y plane, z = 0; zi = 5 mm; P = 1000 W; v = 0.02 m/s): (a) variation of the electric fields with different silicon carbide bed lengths; and (b) the microwave return loss with different silicon carbide bed lengths.

Figure 8.
Effect of silicon carbide bed length on the simulated thermal fields (the temperature unit: K; x–y plane, z = 0; zi = 5 mm; P = 1000 W; v = 0.02 m/s): (a) variation of the thermal fields with different silicon carbide bed lengths; and (b) the heating rate of silicon carbide under microwave irradiation with different silicon carbide bed lengths.

Figure 9.
Effect of flow velocity on the simulated thermal fields (the temperature unit: K; x–y plane, z = 0; zi = 5 mm; P = 1000 W; lSiC = 100 mm): (a) variation of the thermal fields with different flow velocities; and (b) the heating rate of silicon carbide under microwave irradiation with different flow velocities.

Table 1.
Properties of the model materials.
| Item | Material | Property |
|---|---|---|
| Resonant cavity | Air |
|
| Tube | Quartz |
|
| Carrier gas | Nitrogen (gas) |
|
| Wave absorber | Silicon carbide |
|
Table 2.
The variable reactor and operation parameters.
| Parameters | Variable Range |
|---|---|
| zi (mm) | 0, ±5, ±10, ±15, ±20 |
| P (W) | 700, 800, 900, 1000 |
| lSiC (mm) | 100, 110, 120, 130 |
| v (m/s) | 0.02, 0.03, 0.04, 0.05 |
Table 3.
The governing equation and boundary conditions of Maxwell’s equations and other fixed simulation parameters.
Table 3.
The governing equation and boundary conditions of Maxwell’s equations and other fixed simulation parameters.
| Items | Value or Expression |
|---|---|
| Governing equation * | |
| Boundary conditions * | (electric field boundary) (magnetic field boundary) (thermal insulation) |
| Microwave frequency (GHz) | 2.45 |
| Wave mode | TE10 |
| Initial value (K) | 293.15 |
| Absolute pressure (Pa) | 101,325 |
| Grid cell size (m) | 24.47 (maximum) 7.3420 × 10⁻⁴ (minimum) |
| Curvature factor | 0.6 |
| Narrow slit interval resolution | 0.5 |
* The terms in the equations include: μr is the relative permeability; E is the electric field intensity; H is the magnetic field intensity; ω is the angular frequency; k0 is the wave number in free space and equals to ω/C0, in which C0 is the speed of light in vacuum; εr is the relative permittivity; σ is the electrical conductivity; and ε0 is the permittivity of vacuum (8.85 × 10⁻¹² F/m).
Publisher’s Note: MDPI stays neutral with regard to jurisdictional claims in published maps and institutional affiliations. |
© 2022 by the authors. Licensee MDPI, Basel, Switzerland. This article is an open access article distributed under the terms and conditions of the Creative Commons Attribution (CC BY) license (https://creativecommons.org/licenses/by/4.0/).
Share and Cite
MDPI and ACS Style
Yang, C.; Ying, K.; Yang, F.; Peng, H.; Chen, Z. Simulation on the Electric and Thermal Fields of a Microwave Reactor for Ex Situ Biomass Tar Elimination. Energies 2022, 15, 4143. https://doi.org/10.3390/en15114143
AMA Style
Yang C, Ying K, Yang F, Peng H, Chen Z. Simulation on the Electric and Thermal Fields of a Microwave Reactor for Ex Situ Biomass Tar Elimination. Energies. 2022; 15(11):4143. https://doi.org/10.3390/en15114143
Chicago/Turabian StyleYang, Cheng, Kanfeng Ying, Fan Yang, Huanghu Peng, and Zezhou Chen. 2022. "Simulation on the Electric and Thermal Fields of a Microwave Reactor for Ex Situ Biomass Tar Elimination" Energies 15, no. 11: 4143. https://doi.org/10.3390/en15114143
Note that from the first issue of 2016, this journal uses article numbers instead of page numbers. See further details here.