
First Prototype of a Cesium Oven Design for Negative-Ion-Source-Based Neutral Beam Injector at ASIPP


1
Institute of Plasma Physics Chinese Academy of Sciences, Hefei 230031, China
2
Science Island Branch, University of Science and Technology of China, Hefei 230026, China
*
Author to whom correspondence should be addressed.
Energies 2022, 15(12), 4409; https://doi.org/10.3390/en15124409
Submission received: 12 April 2022
/
Revised: 30 May 2022
/
Accepted: 13 June 2022
/
Published: 16 June 2022
(This article belongs to the Topic Nuclear Energy Systems)
Abstract
:The RF-driven negative ion source has a steady state characteristic and will be a promising ion source for neutral beam injection (NBI) in the future. Cesium (Cs) injection is an efficient method to enhance the yield of negative ions during plasma discharge. In order to support the engineering and physical research in this field, the Cs oven prototype has been developed for negative ion source based neutral beam injector at ASIPP. This article presents the design details of a Cs oven system, including the constant temperature control system, the mechanical structure of Cs oven, and the surface ionization detector (SID). SID is a measurement method for the cesium flux in the nozzle. The experiment results of constant temperature control system show that the control accuracy and function meet the requirements of device operation. Meanwhile, the simulation analysis of Cs vapor concentration has been carried out in this paper. According to the simulation results, the graph of total Cs flux is given in the article, which presents the reference for the subsequent device testing.
1. Introduction
Neutral beam injection is one of the most effective methods for plasma heating and current driving. The Experimental Advanced Superconducting Tokamak (EAST) is the first non-circular, cross-section Tokamak in China, the purpose of which is being at the forefront of fusion research. In order to support the physics experiments of EAST, two sets of NBI have been developed at the Institute of Plasma Physics, Chinese Academy of Sciences (ASIPP) [1,2,3]. The hot cathode bucket ion source is acquired in the present NBI system. Consisting of a long pulse, high power, and the steady-state [4,5,6,7], the RF-driven negative ion source is a promising ion source in the Chinese Fusion Engineering Test Reactor (CFETR) NBI [8]. In order to minimize the risks of unsuccessful operation of the CFETR NBI, the Comprehensive Research Facility for Fusion Technology (CRAFT) is under manufacture, comparable with ITER neutral beam test facility. With the aim of pre-understanding the engineering issues of RF-driven negative ion source, a test facility of the negative ion source with a single RF driver has been manufactured, which is shown in Figure 1. The test facility is equipped with various plant units and diagnostic tools, e.g., a gas pumping system, a water cooling system, a power supply, a diagnostic system, etc.
During the plasma discharge process, the yield of negative ions is effectively enhanced by the injection of Cs [9], i.e., the extraction of the negative ion beam is directly determined by the negative ion density. Since the usage of Cs as a negative ion source in 1970, the current density of negative hydrogen ions has increased from 5 to 125 A/m2 [10]. Cs plays important roles in negative ion density, mainly including reducing the work function and the co-extracted electrons. In the operation of the negative ion source, the Cs atoms should be continuously injected into the ion source to achieve the goal of enhancing the negative ion density. As the injection flux of Cs is mainly dependent on temperature, the temperature control for the Cs oven is necessary.
In order to meet the requirements of a steady Cs vapor flux, the cesium oven prototype for a negative ion source has been manufactured in the CRAFT NBI test facility. In the structure of the Cs oven, the constant temperature control is a powerful guarantee for the stable injection of Cs. Considering the characteristics of Cs and the high-voltage environment, it is necessary to develop a constant temperature control system with remote isolation communication function. Meanwhile, the isolated transformer should be adopted for a heating system. The segmented architecture is adopted in the Cs oven prototype, which provides convenience for maintenance.
2. Design Description of the Cs Oven
The mounted position of the Cs oven in negative ion source test facility is shown in Figure 1. As the cooling of the heating components in vacuum occurs only by thermal radiation and conduction, it is slower than in air conditions. Thus, the control precision of the temperature must be smooth, which could reduce the recovery time caused by temperature overshoots. Under this requirement, the control system for heating the Cs oven should be capable of adjusting different temperatures independently. The critical bodies of the Cs oven mainly comprise the Cs reservoir, the injection tube, the Swagelok® sealed valve, the resistive heater, and the heating control system. Considering the high-temperature environment, the selected version of the sealed valve should not contain non-metallic components in order to avoid material deformation caused by thermal expansion.
Figure 2 gives the structural view of the Cs oven. It can be seen that the delivery tubes are wounded by resistance wires, and the ON–OFF states of the Cs vapor are controlled by the sealed valve, which also protects it from being a poor vacuum environment. In order to avoid radio frequency interference, sealed valves are manually controlled. Two sealed valves are connected in series to facilitate the disassembly and maintenance of the cesium furnace. During the Cs heating operation, the Cs oven can reach temperatures more than 260 °C or even higher; thus, the components of the Cs oven must be compatible with the temperature environment. The delivery tube is made of 316 L stainless steel with a nickel coating, which can prevent Cs from forming chemical compounds with the reservoir and the tube. The Cs reservoir has a 70 mm height × 34 mm external diameter, an internal volume of 13 cm3, and is also made of 316 L stainless steel with nickel coating, the cubage of which is about 17 g. Due to the vertical installation of the ion source, the right-angle structure of the Cs oven is not suitable for Cs storage, which causes the liquid Cs to flow out of the reservoir. Meanwhile, the angle of installation prevents the liquid Cs from flowing into the delivery tube.
The evaporation rate is determined by the temperature of the reservoir, and the vapor pressure in the delivery tube is also controlled. However, this conclusion is under the condition that the temperature of the delivery tube is hotter than that of the reservoir. If the delivery tube temperature is lower than the reservoir, the Cs vapor would condense onto the inner wall of the tube. Hence, the temperature control of the delivery tube should be hotter than the reservoir in the Cs evaporation operation. Meanwhile, the multi-hole architecture is adopted in the nozzle, which enhances the diffusivity of Cs atoms and avoids directly hitting the PG (Plasma Grid) interface [11]. The heating wires are used for the temperature control of the Cs oven, which are wound around the delivery tubes and the Cs reservoir. Because of the small dimensions of the heating elements, the thermal exchange should be guaranteed between the heating wires and the Cs oven system. Brazing the heater around on the Cs oven for permanent connection, and clamping the heater on the dismountable components are effective methods to ensure the thermal exchange in the process of temperature control.
3. Temperature Control System
Considering the high-voltage work environment, the temperature control system must possess remote isolation communication functionality. Proportion Integration Differentiation (PID) parameters and target temperatures can also be remotely set via fiber optics. Temperature data can be locally displayed or remotely transmitted to the host computer. Meanwhile, the control system has an over-temperature alarm function. In conclusion, the temperature control system presents the characteristics of isolation communication, engineering cost, and design difficulty.
The temperature control system consists of a K-type thermocouple, a transformer, an MT2DC, a main control circuit board, and a communication circuit board, which are shown in Figure 3. The MT2DC is a commercial Silicon-Controlled Rectifier (SCR) product, the conduction angle of which can be set by an external control signal. The heater contains three heating positions. So, three main control circuit boards, an SCR controller MT2DC, and transformers are used in the system. The ratio of the primary coil to the secondary coil is 55/9; when the input of the primary coil is 220 V AC, the output of the transformer is 36 V AC. The output voltage of the MT2DC can be directly controlled by the external direct current (DC) signal. In order to shorten the heating time to the setting time, the maximum heating power is higher than the required one. Hence, 50 W for the Cs reservoir and 150 W for the injection tube have been adopted in the temperature control system.
The main control circuit board performs the functions of constant temperature control, data transmission, over-temperature protection, parameter setting, and temperature data drawing. The PID parameters and the target temperature can be set by the user in both the local and remote modes.
The communication circuit board sends the data signals to the main control circuit board, and it also receives temperature data from the main control circuit board. Then, it transmits the temperature data to the host PC via the RS232 interface.
3.1. Hardware Design of the Main Control Circuit Board
As shown in Figure 4, the main control circuit board consists of a thermocouple acquisition circuit, a voltage regulation circuit, an isolation transmission circuit, an over-temperature protection circuit, a storage circuit, a display circuit, and a control chip STM32F103ZET6. The chip-based 32-bit Microprogrammed Control Unit (MCU) has 512 KB Flash, 11 timers, 3 Analog-to-Digital Converters (ADCs), 13 communication interfaces. The STM32F103ZET6 high-density performance line family operates in the −40 to +105 °C temperature range from a 2.0 to 3.6 V power supply [12].
In remote mode, the RS232 communication protocol is adopted between the main control circuit board and the communication circuit board. The optic fiber is used as the communication media for isolated transmission. The schematic of the RS232–Fiber communication circuit connection is shown in Figure 5. The electric–optic conversion part consists of SN75452 and HFBR1414, which is shown in the left of Figure 6. SN75452 is comprised of dual peripheral NAND drivers, achieving the function of electric–optic conversion through cooperation with the miniature fiber optic sensor HFBR1414. The input logic “1” corresponds to the light on of HFBR1414. As shown in the right of Figure 5, the optic–electric conversion part mainly consists of fiber optic sensor HFBR2412. It converts the optical signal to a 5 V voltage signal, and the output signal is directly loaded to receive the pin of STM32F103ZET6. The RS232–Fiber communication circuit achieves the function of isolation transmission for RS232 communication.
3.2. SCR Controller MT2DC
The output of the transformer is loaded into the SCR controller MT2DC. As shown in Figure 6, the input of the MT2DC is the alternating current (AC). One of the AC inputs is used as a synchronization signal of control circuit of MT2DC. The other input of the MT2DC is loaded into the internal rectifier circuit. The SCR completes full-wave rectification, the conduction angle of which is controlled by the external control signal.
The output voltage of the MT2DC is controlled by a 0.8~4.6 V DC signal, which is generated by the main control circuit board. According to Figure 7, the relationship between the conduction angle and the control signal can be expressed by Equation (1):
Conduction angle(°) = 47.37 × Control Signal(V) − 37.89
The conduction angle of the MT2DC’s output is 0~180°, which is controlled by the output signal of the main control circuit board. As shown in Figure 8, the red sinusoid signal is the input of the MT2DC. Firstly, the MT2DC achieves the function of full wave rectification. Secondly, the MT2DC’s DC output is adjusted by the 0.8~4.6 V control signal. The temperature of the heater is directly controlled by the output voltage of the MT2DC. Figure 8 shows that the conduction angle of the MT2DC is 70°. According to Equation (1), the control signal is 2.27 V.
3.3. Hardware Design of the Communication Circuit Board
As shown in Figure 9, the communication circuit board consists of the isolation transmission circuit, the RS232 interface circuit, and the control chip STM32F103ZET6. The communication circuit board sends data-communication-enabled signals to the main control circuit boards every second. The data-communication-enabled signals only control the data transmission. They have no effect on the temperature acquisition of the main control circuit board. The temperature data are independently transmitted to the communication circuit board. Meanwhile, the communication circuit board judges the validity of the temperature data and transmits it to the host PC.
3.4. Surface Ionization Detector
In order to measure and control the Cs’s evaporation rate, an SID is necessary [13]. The detector is directly mounted at the oven’s opening. The alkali metal is ionized at the hot tungsten wire that is used as the ionization filament. The ions are accelerated by the bias voltage between the filament and the ion collector. The circuit connection of the SID is shown in Figure 10. Considering the detector relies on collecting the ions, the usage environment of the SID is only in vacuum. The maximum heating current of the filament is up to 8 A. The range of bias voltage is typically 40~60 V [14]. The current variation range of Cs ions is from nA to mA. The low signal current is acquired by the HAMAMATSU® C9329 amplifier, which is a current-to-voltage conversion amplifier used to amplify very slight currents with very low noise. Three photocurrent detection sensitivity levels (H, M, L) are selectable to match the input signal.
4. Finite Element Analysis
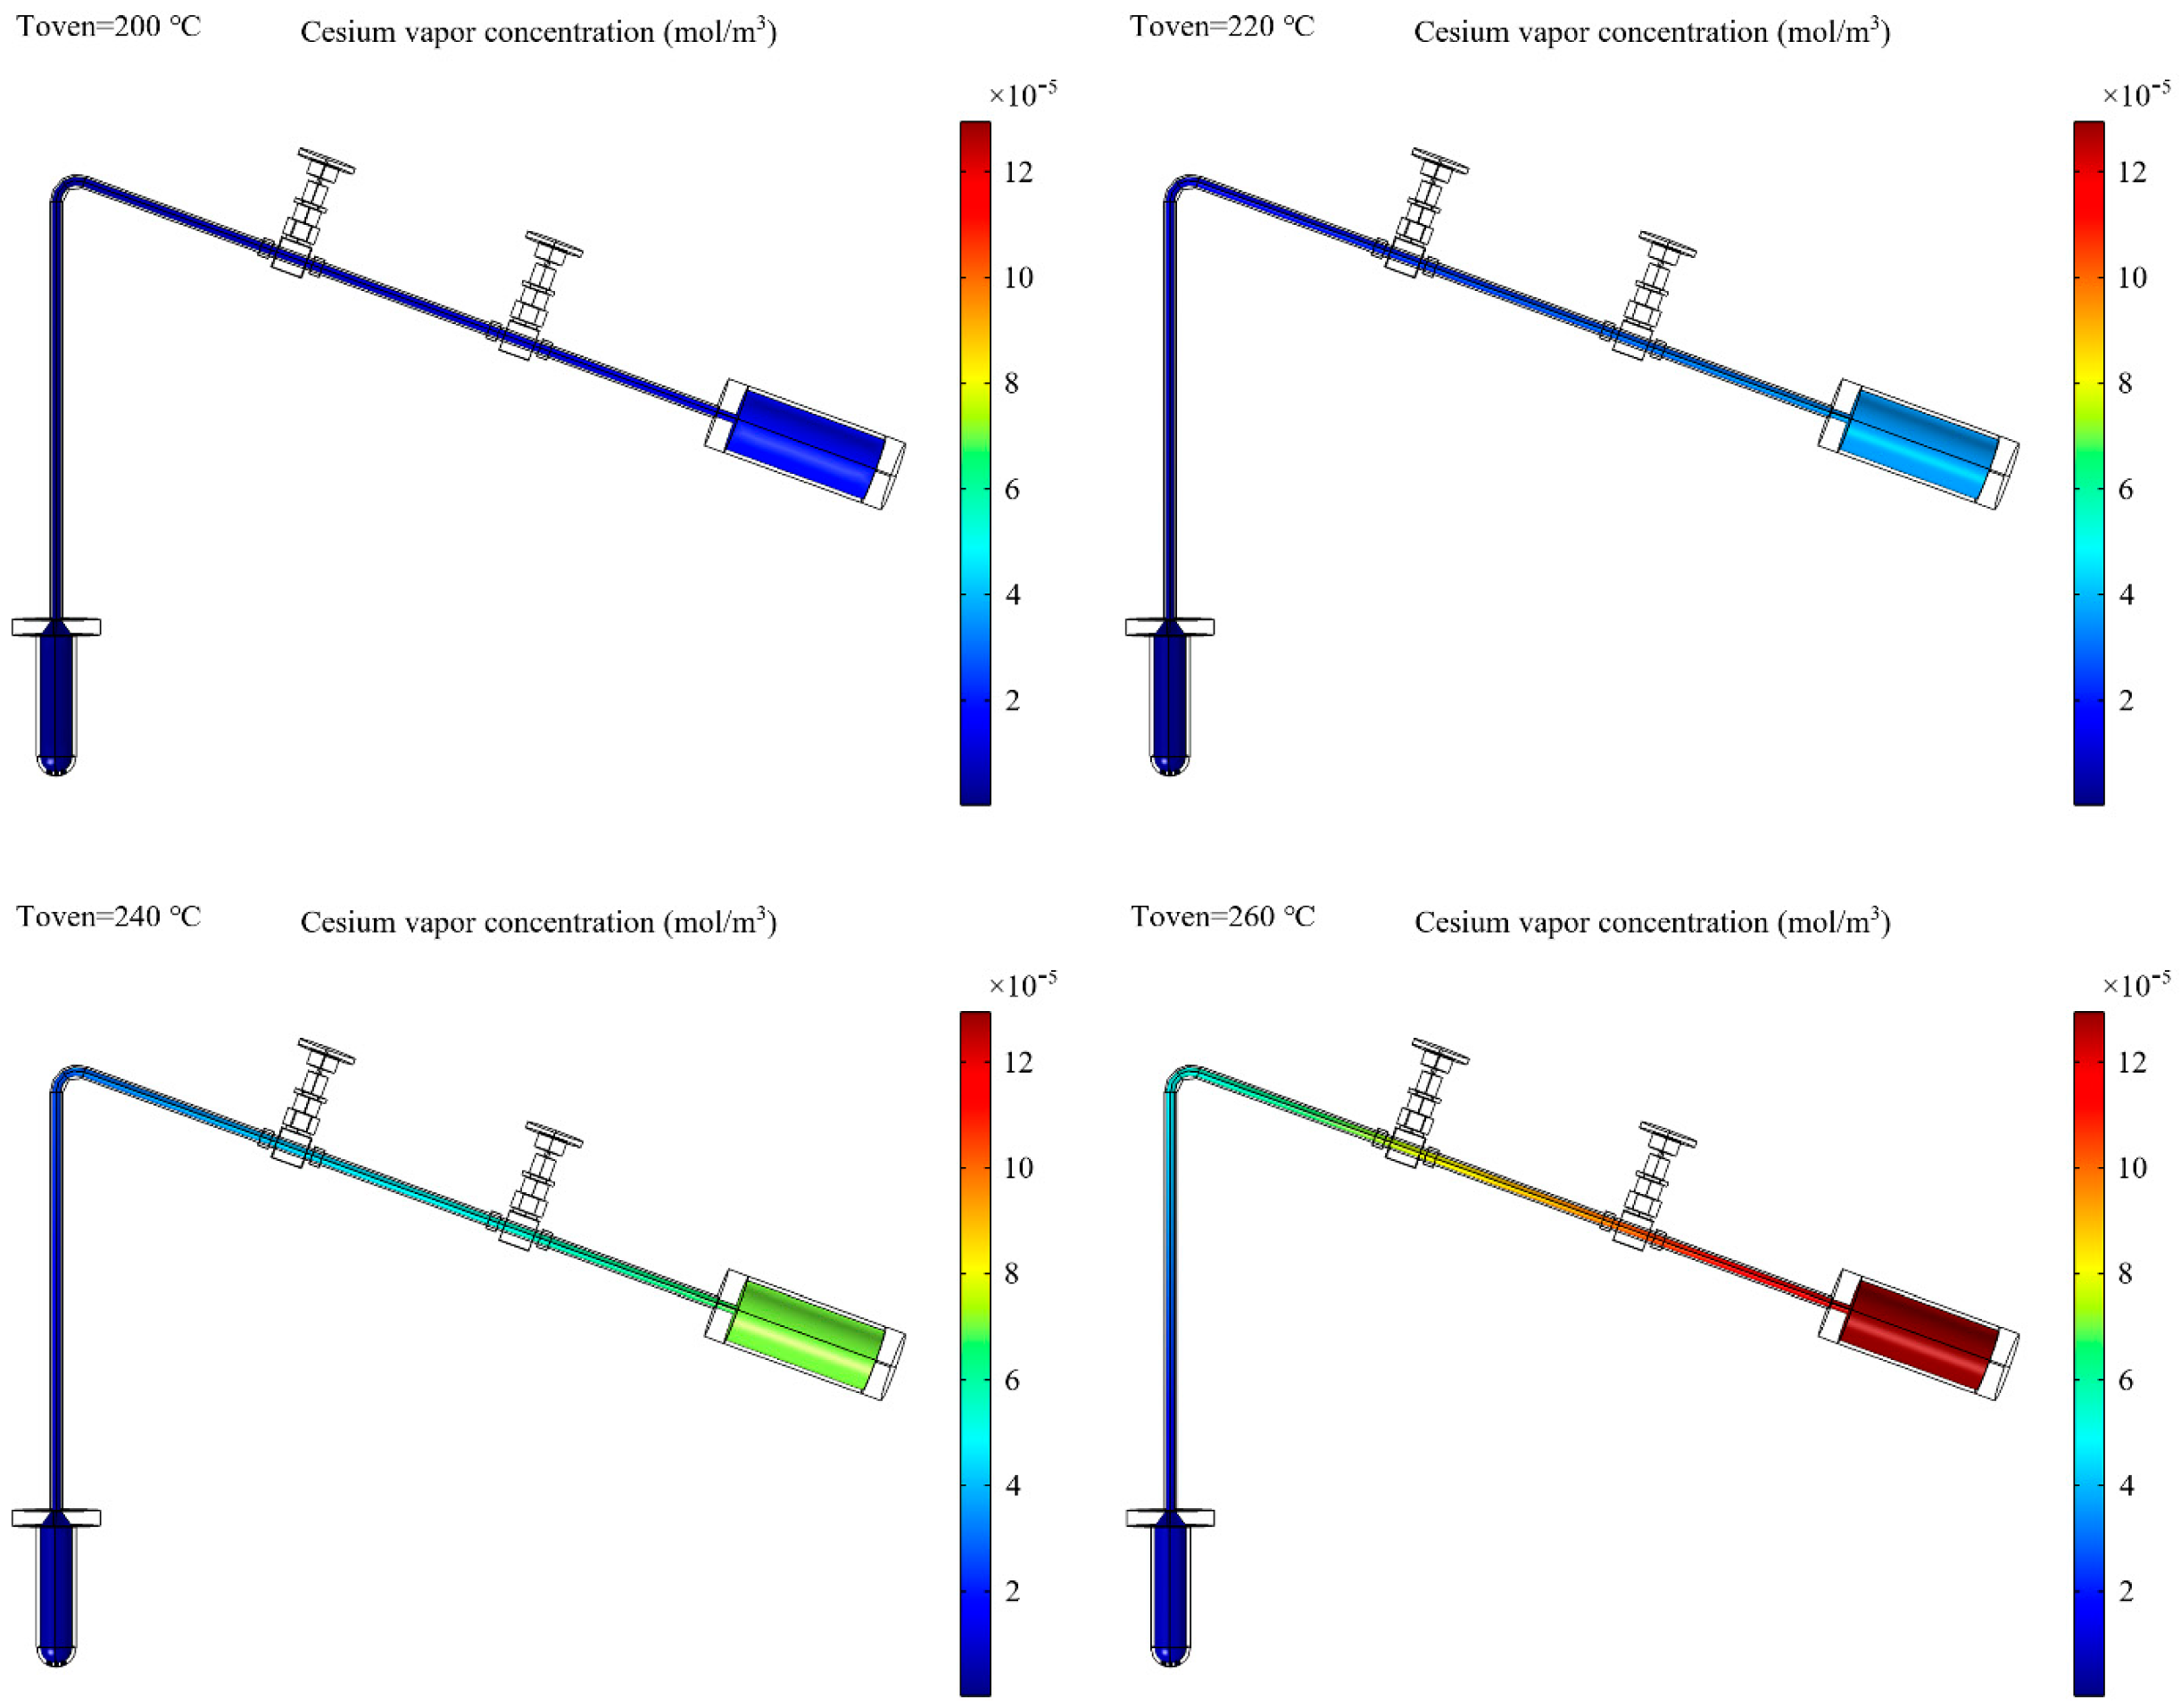
In order to verify the requirements of the Cs flux, the finite element analysis has been carried out, the aim of which is simulating the stable Cs vapor concentration in the constant temperature. Considering the pressure gradient distribution, the temperature of the reservoir is 10 °C less than the injection tube. Within the operating temperatures, the simulation is carried out every 10 °C. The simulation results of the Cs vapor concentrations at several temperatures are given in Figure 11. According to the results, the Cs flux is calculated as follows.
The total Cs flux is calculated by Equation (2). Here, n is concentration of Cs vapor (mol/m3), which is simulated in Figure 11. The Cs vapor concentration of nozzle is used as the input of Equation (3). NA is Avogadro’s constant. m is the mass of a Cs atom. A is the nozzle area (m2). v is the average particle velocity, which is calculated by Equation (3) [11]:
In Equation (3), KB is the Boltzmann constant, and T is temperature (K). The total Cs flux has a strong increase between 200 °C and 260 °C, which can be seen in Figure 12. The calculation results meet the design requirements.
5. System Test
To test the precision of the thermocouple-acquiring circuit, the constant temperature control system is used to acquire the temperature of the black body furnace. The black body furnace is a standard thermal radiation source. After experimental testing, the precision of thermocouple-acquiring circuit is ≤±2 °C. The testing result is shown in Figure 13.
After precision testing, the constant temperature control system was put into practice without Cs injection. The temperature curve of the injection pipeline is shown in Figure 14. It takes 30 s to increase from 10 °C to 100 °C, and the target temperature is set as 100 °C. The temperature fluctuation range around the set value is <±3 °C, which completely meets the experimental demands. The temperature data can be displayed in LCD in local mode and can also be independently transmitted to a host PC.
6. Conclusions
The conductance, vacuum degree, temperature and purity play important roles in Cs injection, but temperature is the main influencing factor of Cs injection for negative ion source. Keeping the temperature variations small is particularly important for avoiding uncontrolled changes such as evaporation. Hence, the first prototype of a Cs oven for a negative ion source has been developed for testing. The design details of the Cs oven structure and control system have been presented in this article. Meanwhile, the finite element analysis of the Cs vapor concentration has been carried out, which provides the calculation basis for the total Cs flux. Aiming to measure the total Cs flux, the development of the SID has been described. In order to monitor the Cs level measurement system, continuous level measurement is the preferred choice. The Cs level measurement system is ongoing, and the reference structure is based on [15]. In the following experiments, the operation details of the Cs oven and the total Cs flux will be given.
Author Contributions
W.L.: Software, formal analysis, writing—original draft preparation; B.L.: resources; Y.Z. and Q.C.: data curation; C.H.: funding acquisition; L.L.: conceptualization and methodology. All authors have read and agreed to the published version of the manuscript.
Funding
This work was supported by the HFIPS Director’s Fund (grants 2021YZGH02 and YZJJQY202204), the National Key R&D Program of China (grant 2017YFE300101), the University Synergy Innovation Program of Anhui Province (grant GXXT-2021-015), the Comprehensive Research Facility for Fusion Technology Program of China (grant 2018-000052-73-01-001228), and the National Natural Science Foundation of China (grant 11575240).
Institutional Review Board Statement
Not applicable.
Informed Consent Statement
Not applicable.
Data Availability Statement
Not applicable.
Conflicts of Interest
The authors declare no conflict of interest.
References
- Hu, C.D. First achievement of plasma heating for EAST neutral beam injector. Plasma Sci. Technol. 2015, 17, 1–3. [Google Scholar] [CrossRef]
- Hu, C.D.; Xie, Y.H.; Xie, Y.L.; Liu, S.; Xu, Y.J.; Liang, L.Z.; Jiang, C.C.; Sheng, P.; Gu, Y.M.; Li, J.; et al. Overview of Development Status for EAST-NBI System. Plasma Sci. Technol. 2015, 17, 817–825. [Google Scholar] [CrossRef]
- Tao, L.; Xie, Y.L.; Hu, C.D.; Wei, Y.; Liang, L.Z. Improved Design and Thermo-Mechanical Verification of Deflection Magnet Beam Collimator of EAST-NBI System. Energies 2022, 15, 1911. [Google Scholar] [CrossRef]
- Lang, J.Q.; Hu, C.D.; Xie, Y.L.; Tong, Y.H. Optimization Analysis of the Structural Design of NNBI Cryosorption Pumps. Energies 2022, 14, 3628. [Google Scholar] [CrossRef]
- Pandya, K.; Bansal, G.; Gahlaut, A.; Soni, J.; Yadav, R.K.; Mahesh, V.; Tyagi, H.; Parmar, K.; Mistri, H.; Bhagora, J.; et al. System upgradation for surface mode negative ion beam extraction experiments in ROBIN. Fusion Eng. Des. 2017, 114, 187–191. [Google Scholar] [CrossRef]
- Mochalskyy, S.; Fantz, U.; Wunderlich, D.; Minea, T. Comparison of ONIX simulation results with experimental data from the BATMAN testbed for the study of negative ion extraction. Nucl. Fusion 2016, 56, 10625. [Google Scholar] [CrossRef] [Green Version]
- Bacal, M. Physics aspects of negative ion sources. Nucl. Fusion 2006, 46, S250–S259. [Google Scholar] [CrossRef]
- Gu, Y.M.; Li, J.; Wei, J.L.; Xie, Y.H.; Liang, L.Z.; Hu, C.D. Manufacturing and testing of multiaperture and multichannel grids for the prototype negative ion source for CFETR-NBI system. Fusion Sci. Technol. 2017, 72, 148–156. [Google Scholar] [CrossRef]
- Yoshida, M.; Hanada, M.; Kojima, A.; Kashiwagi, M.; Umeda, N.; Hiratsuka, J.; Ichikawa, M.; Watanabe, K.; Grisham, L.R.; Tsumori, K.; et al. Time evolution of negative ion profile in a large cesiated negative ion source applicable to fusion reactors. Rev. Sci. Instrum. 2016, 87, 02B114. [Google Scholar] [CrossRef] [PubMed]
- Ehlers, K.W.; Leung, K.N. Multicusp negative ion source. Rev. Sci. Instrum. 1980, 51, 721–727. [Google Scholar] [CrossRef] [Green Version]
- Liu, Y.Y.; Zhang, X.; Xu, Y.H.; Cui, Z.L.; Li, H.; Liu, H.F.; Wang, X.Q.; Huang, J.; Liu, H.; Cheng, J.; et al. Design of an advanced cesium oven for the prototype negative ion source in the CFETR-NNBI system. Fusion Eng. Des. 2020, 161, 112073. [Google Scholar]
- STM32F103ZET6 Datasheet. Available online: https://www.st.com/resource/en/datasheet/cd00191185.pdf (accessed on 9 June 2022).
- Fantz, U.; Friedl, R.; Fröschle, M. Controllable evaporation of cesium from a dispenser oven. Rev. Sci. Instrum. 2012, 83, 123305. [Google Scholar] [CrossRef] [PubMed] [Green Version]
- Fröschle, M.; Riedl, R.; Falter, H.; Gutser, R.; Fantz, U. The IPP NNBI team Recent developments at IPP on evaporation and control of caesium in negative ion sources. Fusion Eng. Des. 2009, 84, 788–792. [Google Scholar] [CrossRef] [Green Version]
- Rizzolo, A.; Pavei, M.; Pomaro, N. Caesium oven design and R&D for the SPIDER beam source. Fusion Eng. Des. 2013, 88, 1007–1010. [Google Scholar]
Figure 1.
The picture of the RF beam source test facility.

Figure 2.
The schematic diagram of the heater.

Figure 3.
The block diagram of constant temperature control system.

Figure 4.
The structure diagram of main control circuit board.

Figure 5.
The schematic of the RS232–Fiber communication circuit.

Figure 6.
The schematic of the MT2DC.

Figure 7.
The control diagram of the MT2DC.

Figure 8.
The trends of the conduction angle of the MT2DC with the control signal of the main control circuit board.
Figure 8.
The trends of the conduction angle of the MT2DC with the control signal of the main control circuit board.

Figure 9.
The block diagram of the communication circuit board.

Figure 10.
SID circuit connection.

Figure 11.
The simulation results of the vapor concentration at different temperature.

Figure 12.
The calculated Cs flux of the oven at different temperatures.

Figure 13.
The testing result of the thermocouple-acquiring circuit.

Figure 14.
The temperature curve of the injection pipeline. The target temperature is 100 °C.

Publisher’s Note: MDPI stays neutral with regard to jurisdictional claims in published maps and institutional affiliations. |
© 2022 by the authors. Licensee MDPI, Basel, Switzerland. This article is an open access article distributed under the terms and conditions of the Creative Commons Attribution (CC BY) license (https://creativecommons.org/licenses/by/4.0/).
Share and Cite
MDPI and ACS Style
Liu, W.; Liu, B.; Zhao, Y.; Cui, Q.; Hu, C.; Liang, L. First Prototype of a Cesium Oven Design for Negative-Ion-Source-Based Neutral Beam Injector at ASIPP. Energies 2022, 15, 4409. https://doi.org/10.3390/en15124409
AMA Style
Liu W, Liu B, Zhao Y, Cui Q, Hu C, Liang L. First Prototype of a Cesium Oven Design for Negative-Ion-Source-Based Neutral Beam Injector at ASIPP. Energies. 2022; 15(12):4409. https://doi.org/10.3390/en15124409
Chicago/Turabian StyleLiu, Wei, Bo Liu, Yuanzhe Zhao, Qinglong Cui, Chundong Hu, and Lizhen Liang. 2022. "First Prototype of a Cesium Oven Design for Negative-Ion-Source-Based Neutral Beam Injector at ASIPP" Energies 15, no. 12: 4409. https://doi.org/10.3390/en15124409
Note that from the first issue of 2016, this journal uses article numbers instead of page numbers. See further details here.