Article

Corrosion of Metal Alloys in Potassium Acetate Solutions for Liquid Desiccant Dehumidification and Air Conditioning

1
National Renewable Energy Laboratory, Golden, CO 80401, USA
2
Advanced Energy Systems Graduate Program, Colorado School of Mines and the National Renewable Energy Laboratory, Golden, CO 80401, USA
*
Author to whom correspondence should be addressed.
These authors contributed equally to this work.
Energies 2022, 15(12), 4421; https://doi.org/10.3390/en15124421
Submission received: 4 May 2022 / Revised: 7 June 2022 / Accepted: 14 June 2022 / Published: 17 June 2022
(This article belongs to the Special Issue Building Energy Management: Materials, Modeling, and Components)

Abstract

:
For commercial buildings, liquid desiccant air conditioners (LDACs) could provide up to 80% energy savings compared to high-efficiency vapor compression AC, but commonly utilized liquid desiccants are highly corrosive. This precludes the use of metallic components, necessitating specialized plastics and thereby driving up cost, weight, and limiting operational temperature and pressure ranges. Less corrosive alternatives are sought. Here, potassium acetate solutions are investigated as less-corrosive alternatives to the chloride salt solutions that are typically used in LDAC systems. Corrosion evaluations for a Cu alloy (C12200) and two Al alloys (Al3003 and Al1100) in both potassium acetate and chloride salt solutions are presented. We show that yearly corrosion rates are lower in potassium acetate solutions by up to three orders of magnitude. Active corrosion behavior is largely absent in potassium acetate solutions but is present in chloride salt solutions. Furthermore, solid corrosion products are observed in chloride salt solutions. Thus, we conclude that potassium acetate is a promising candidate as a less corrosive alternative liquid desiccant for LDAC systems with metallic components.

Graphical Abstract

1. Introduction

Up to 50% of energy use in buildings goes toward cooling and other thermal loads, globally accounting for more than 10% of electricity use across all sectors [1,2]. Liquid desiccant air conditioners (LDACs) could reduce this energy use. Building energy simulations indicate that LDAC uses significantly less energy than high-efficiency vapor compression AC. For example, one model shows that LDAC could yield 80% energy savings in Phoenix, while other studies predict that LDAC could enable energy savings of 40–85%, varying by region and climate [3,4,5]. LDAC systems also have the potential to improve indoor air quality compared to vapor compression AC since these systems can cause bacterial and mold growth, and vapor compression AC systems often use toxic refrigerants [3,6,7,8,9].
Despite the numerous advantages offered by LDAC systems, material limitations remain a major hurdle. Most liquid desiccants are corrosive. Therefore, LDAC systems are usually designed with plastic rather than metallic components. However, plastic’s elastic modulus, yield strength, and thermal conductivity are very low (twenty times lower, six times lower, and one thousand times lower than aluminum metal, respectively). The maximum allowable operating temperature for plastic is usually less than 60 °C, while the ideal operating temperature for LDAC systems is over 80 °C. Furthermore, the maximum allowable pressure is much lower for plastic than for metal, thereby limiting the pressures that can be used in LDAC systems [10]. Plastic is not compatible with heat exchanger enhancements like tabbed or louvered fin features, so plastic heat exchangers are drastically larger and heavier than metallic heat exchangers. Finally, plastic heat exchangers are often less mechanically robust than their metallic counterparts, and have connection points that are not as strong, leading to less predictable performance.
Thus, a less corrosive liquid desiccant, compatible with metallic components, is desirable. For use in LDAC, liquid desiccants must be highly hygroscopic, nontoxic, and relatively low in cost. To reduce the energy required for pumping, they should exhibit favorable transport characteristics such as low surface tension and low viscosity [11,12,13,14,15]. Salts of weak organic acids meet these requirements. Among these, potassium acetate (CH3COOK) is a promising candidate [11,12,16,17,18]. CH3COOK has a similar dehumidification potential to chloride salts, at a fraction of the cost [14].
However, to our knowledge, no previous studies have directly evaluated the corrosion behavior of metals and metal alloys in CH3COOK solutions under conditions relevant to desiccant-based dehumidification and air-conditioning systems. Thus, we undertook an evaluation of the corrosion behavior of a Cu alloy (C12200) and two Al alloys (Al3003 and Al1100) in CH3COOK solutions and directly compared these results to corrosion experiments in chloride salt solutions (LiCl and CaCl2) to assess the promise of CH3COOK as a non-corrosive liquid desiccant. The results of this study are presented here.

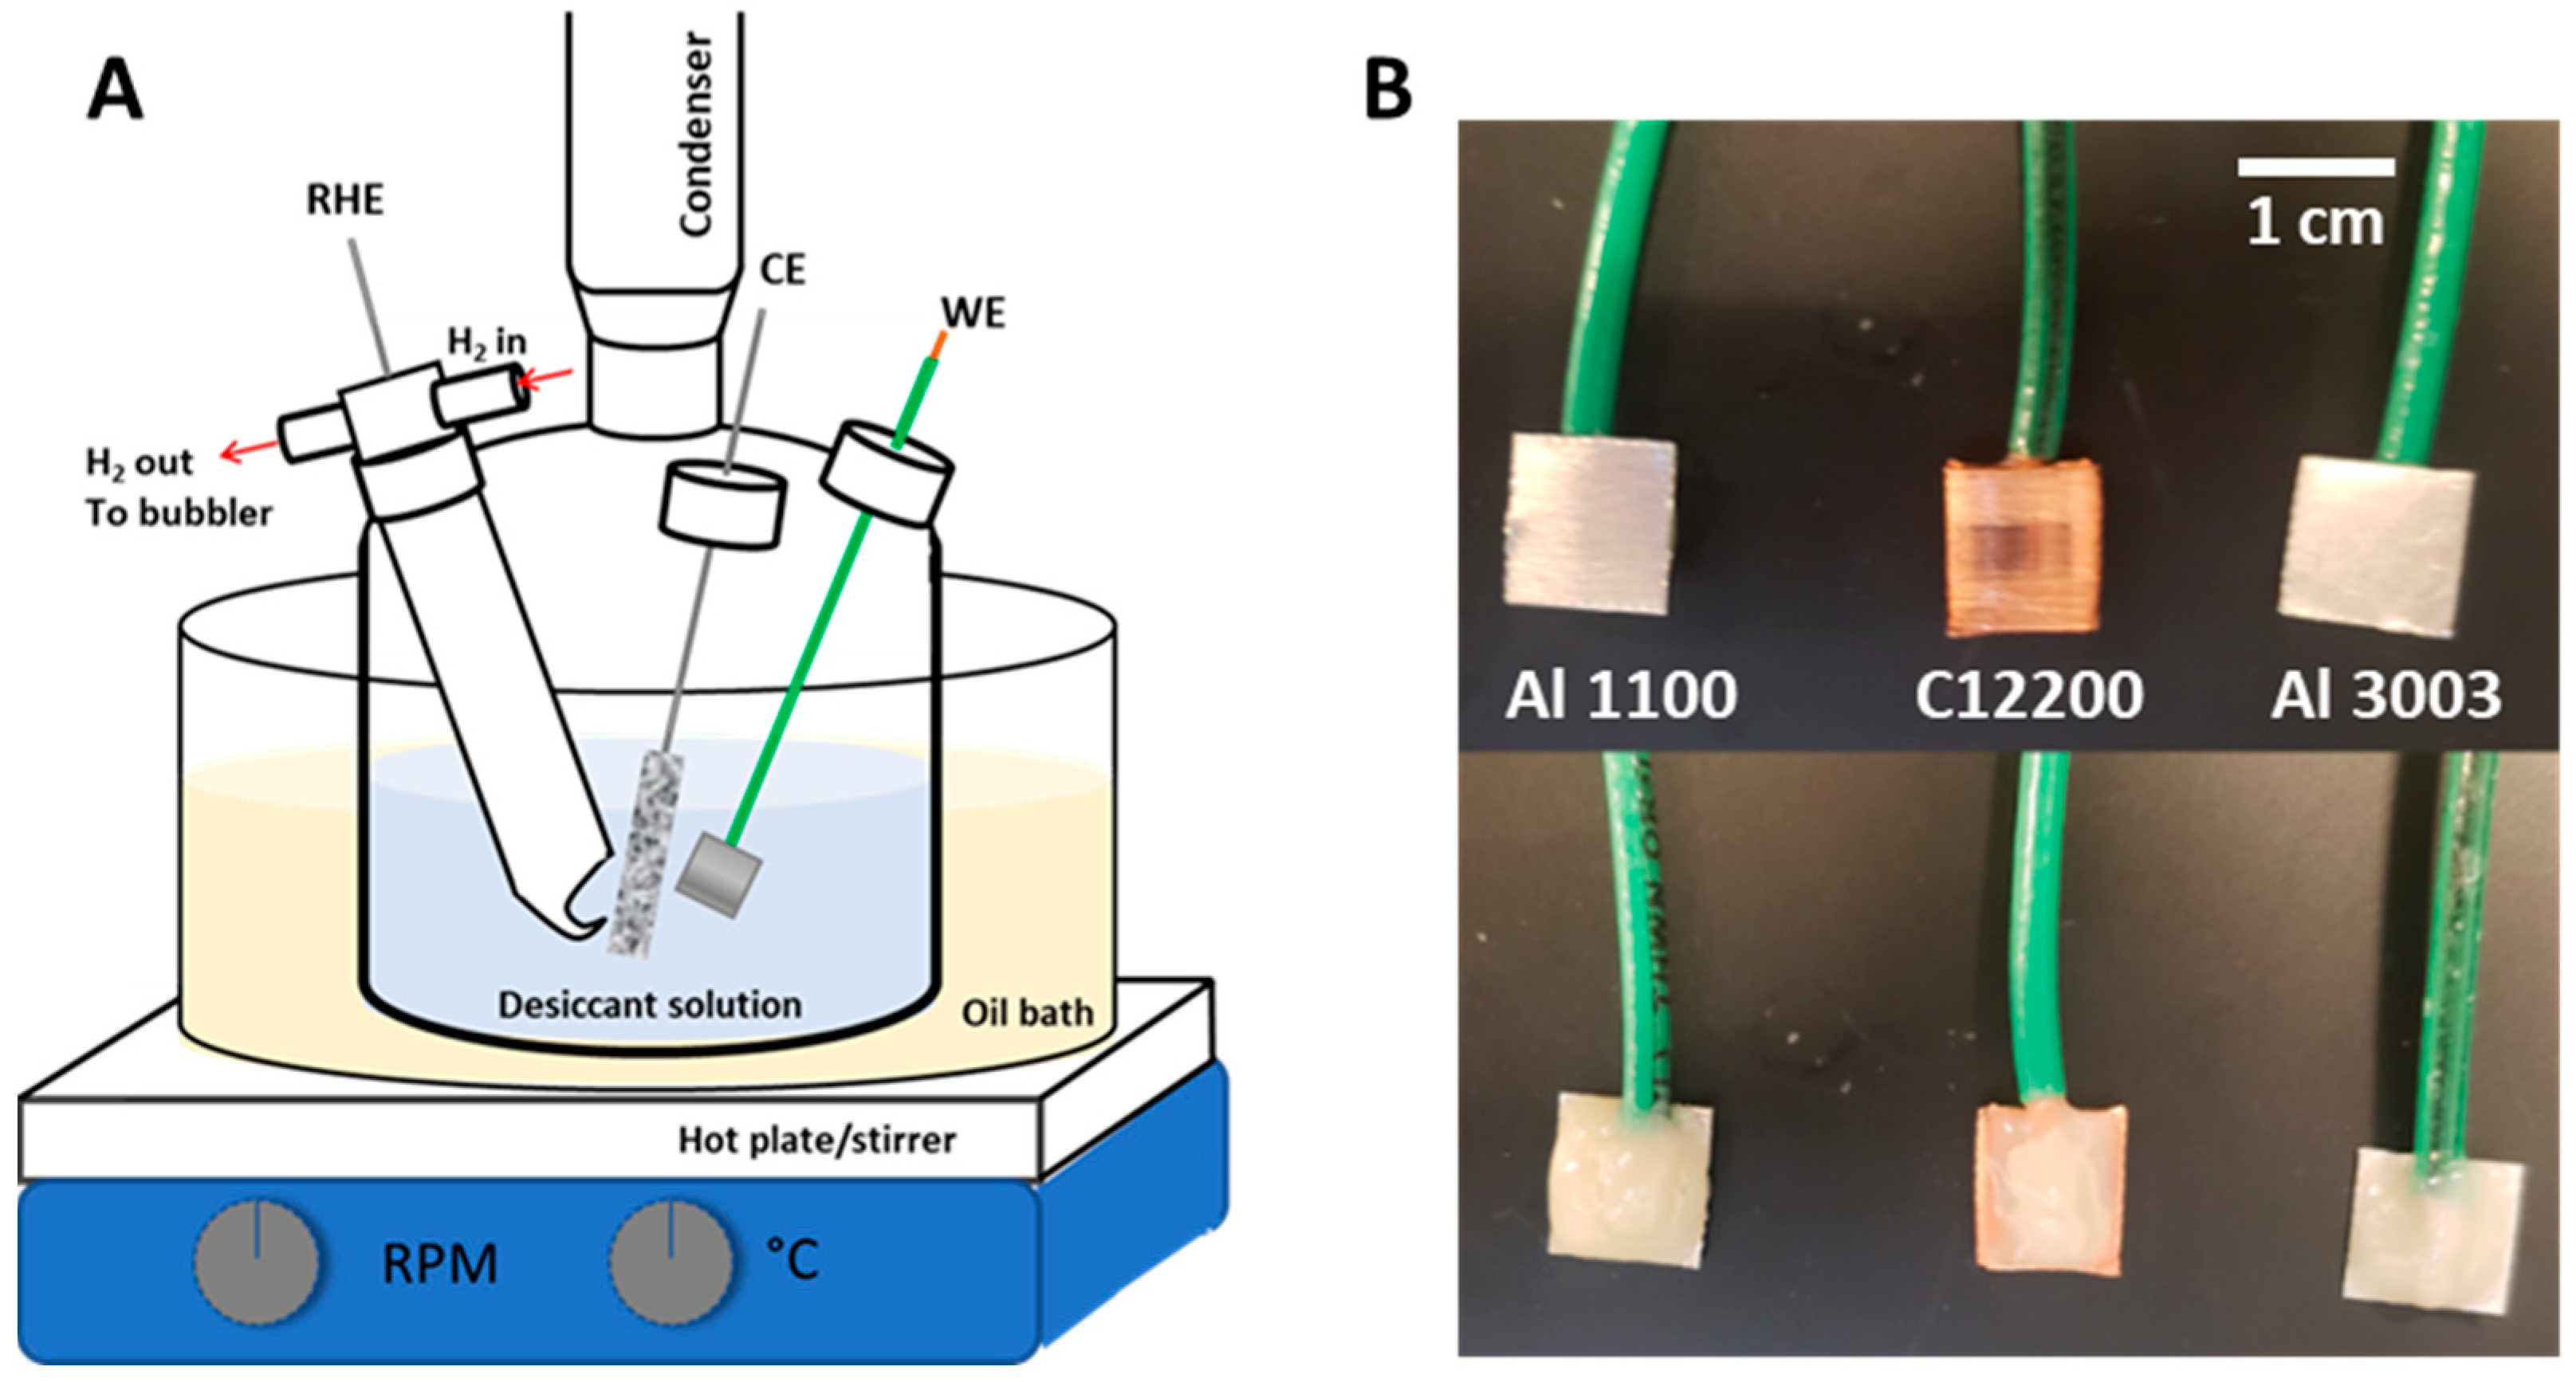
2. Materials and Methods

2.1. Material Selection

C12200, Al3003, and Al1100 were selected because they have optimal properties for LDAC system components. C12200 is commonly utilized for heat exchanger coils in HVAC systems due to its high thermal conductivity. Al3003 is among the most widely used Al alloys. It contains a higher wt. % of Mn for improved strength, improved corrosion resistance over other Al alloys, and high workability. Al1100 is a typical Al alloy used in industry, with a 99% Al content. Details of the composition of these materials are given in Table 1.
For direct comparison to CH3COOK, we also performed a corrosion evaluation of the alloys in lithium chloride (LiCl) and calcium chloride (CaCl2) solutions, which are among the most common chloride salt-based liquid desiccants in use today [16,17,18]. Since each salt solution has different dehumidification properties, they are each suitable for LDAC systems over different concentration ranges. Therefore, rather than evaluating chloride and acetate salts at the same concentrations, we evaluated them at concentrations relevant to LDAC performance. Thus, LiCl solutions were 30 wt. % salt [8,18]; CaCl2 solutions were 40 wt. % salt [18]; and CH3COOK solutions were 50 wt. % salt [3,19].

2.2. General Overview of Methods for Electrochemical Corrosion Evaluation

Here, we present a discussion of the theory governing the techniques utilized in this paper to evaluate corrosion. For specific details of how these techniques were utilized in the work presented here, please refer to Section 2.3, Section 2.4, Section 2.5, Section 2.6 and Section 2.7.
To determine corrosion rates (CRs), we utilized potentiodynamic polarization. This powerful electrochemical technique is often utilized to evaluate degradation because it generates reliable data quickly and is extremely sensitive to low CRs, which are obtained in minutes rather than months [20,21,22,23,24]. A diagram of the three-electrode system used for these experiments is illustrated in Figure 1A. In this system, the alloy being investigated served as the working electrode (WE), shown in Figure 1B, while the liquid desiccant solution served as the electrolyte. Details of the preparation of desiccant solution (electrolytes) and alloy samples (WEs) are given in Section 2.3 and Section 2.4, respectively.
In potentiodynamic polarization experiments, the open-circuit potential (OCP), or the stable electric potential between the working electrode’s surface and the salt solution, was first established. Determination of the OCP is critical to ensure the system is equilibrated. Details of OCP determination for this work are given in Section 2.5.
After the OCP was established, Tafel experiments were used to determine a corrosion rate. These experiments are detailed in Section 2.6. In these experiments, a potential is applied to the working electrode. The applied potential was swept from cathodic (negative overpotential relative to OCP) to anodic (positive overpotential relative to OCP) while the current response was recorded, yielding potentiodynamic polarization curves. An example of such a curve is given in Figure 2. At potentials close to the OCP (usually < 20 mV), anodic and cathodic contributions were both observed. At potentials far from the OCP, mass transport limitations began to dominate. However, between ca. 20 and 120 mV, Tafel lines can be extrapolated [21,25].
Tafel lines represent pure anodic and cathodic kinetic responses. Thus, the intersection of anodic and cathodic Tafel lines provides the corrosion potential (Ecorr) and corrosion current density (jcorr) (which is the corrosion current (icorr) divided by the exposed area (A). Ecorr is often close to or the same as the OCP).
Using the Stern–Geary equation and Faraday’s law, the corrosion rate (CR) in millimeters per year can be calculated from these values [26,27]:
C R = ( j c o r r ) ( K ) ( E W ) ρ
where K is a constant equal to 3272 [mm·A−1·cm−1·year−1], EW is the equivalent weight of the alloy [g·(mole-e)−1], and ρ is the alloy density [g·cm−3]. The densities and equivalent weights used in this report are given in Table 1. The equivalent weight of the alloy is calculated using its composition and the following equations:
E W = N E Q 1
N E Q = Σ   ( f i n i M W i )
where NEQ is the number of equivalents, fi is the weight fraction, ni is the number of electrons being transferred, and MWi is the atomic weight.
In addition to allowing for calculations of the yearly CR, potentiodynamic polarization data gives information about the corrosion behavior of samples [21]. Steep slopes, where the current rapidly increases with increasing applied potential, can be indicative of active corrosion. Decreasing slopes, where the current drops with increased applied potential and/or falls beneath the value of icorr, can be indicative of passivation, or the formation of protective surface layers. If the polarization curves show a current initially falling beneath the value of icorr with a further increase at higher overpotentials, this can indicate transpassivation behavior or pitting corrosion, in which protective surface layers are initially formed, then degrade, allowing localized corrosion to occur. Localized corrosion can lead to critical losses in material integrity and ultimately, device failure.
Potentiodynamic polarization was used alongside optical microscopy, field emission scanning electron microscopy (FESEM) coupled with energy-dispersive X-ray spectrometry (EDX), and inductively coupled plasma mass spectroscopy (ICP-MS) to study the corrosion behavior of samples relevant to LDAC systems. Specifically, C12200, Al1100, and Al3003 samples were evaluated in aqueous solutions of CH3COOK, LiCl, and CaCl2 at a series of conditions and temperatures applicable to LDAC operation. Further evaluations were also conducted on the corrosion behavior of C12200, Al1100, and Al3003 samples in CH3COOK solutions at various concentrations and pH values, as these can affect the corrosion of alloys in potassium acetate solutions [28,29].

2.3. Electrolyte Preparation

The 30 wt. % LiCl and 40 wt. % CaCl2 solutions were prepared utilizing pure LiCl and CaCl2 hexahydrate, respectively (Sigma Aldrich, St. Louis, MO, USA, >95% purity, used as received) and deionized water. Solutions of 50 wt. %, 25 wt. %, and saturated CH3COOK (Sigma Aldrich, >95% purity, used as received) were prepared for temperature- and concentration-dependence experiments. Solutions of 50 wt. % were prepared with equal parts CH3COOK and deionized water by weight. For 25 wt. % solutions, equal parts of the 50 wt. % stock solution and deionized water were used. For saturated solutions, the solubility of CH3COOK at 25 °C was used (268.6 g/100 mL), and the resulting solution was 73 wt. % CH3COOK.
For pH-dependence experiments, a 50 wt. % CH3COOK solution was prepared, then potassium hydroxide (KOH, Sigma Aldrich, >95% purity, used as received) was added to increase the pH. Glacial acetic acid (Sigma Aldrich, 99% purity, used as received) was used to decrease the pH. For high pH, 83 mg of KOH was added to 150 mL of 50 wt. % CH3COOK solution. Subsequently, 20 mL of this solution was added to 180 mL of 50 wt. % CH3COOK and the resultant pH as measured with a pH probe was 11.3. For low pH, 50 wt. % solution was iteratively titrated with glacial acetic acid and measured with a pH probe until a final pH of 6.6 was reached. Additional CH3COOK was added as needed to maintain 50 wt. %.

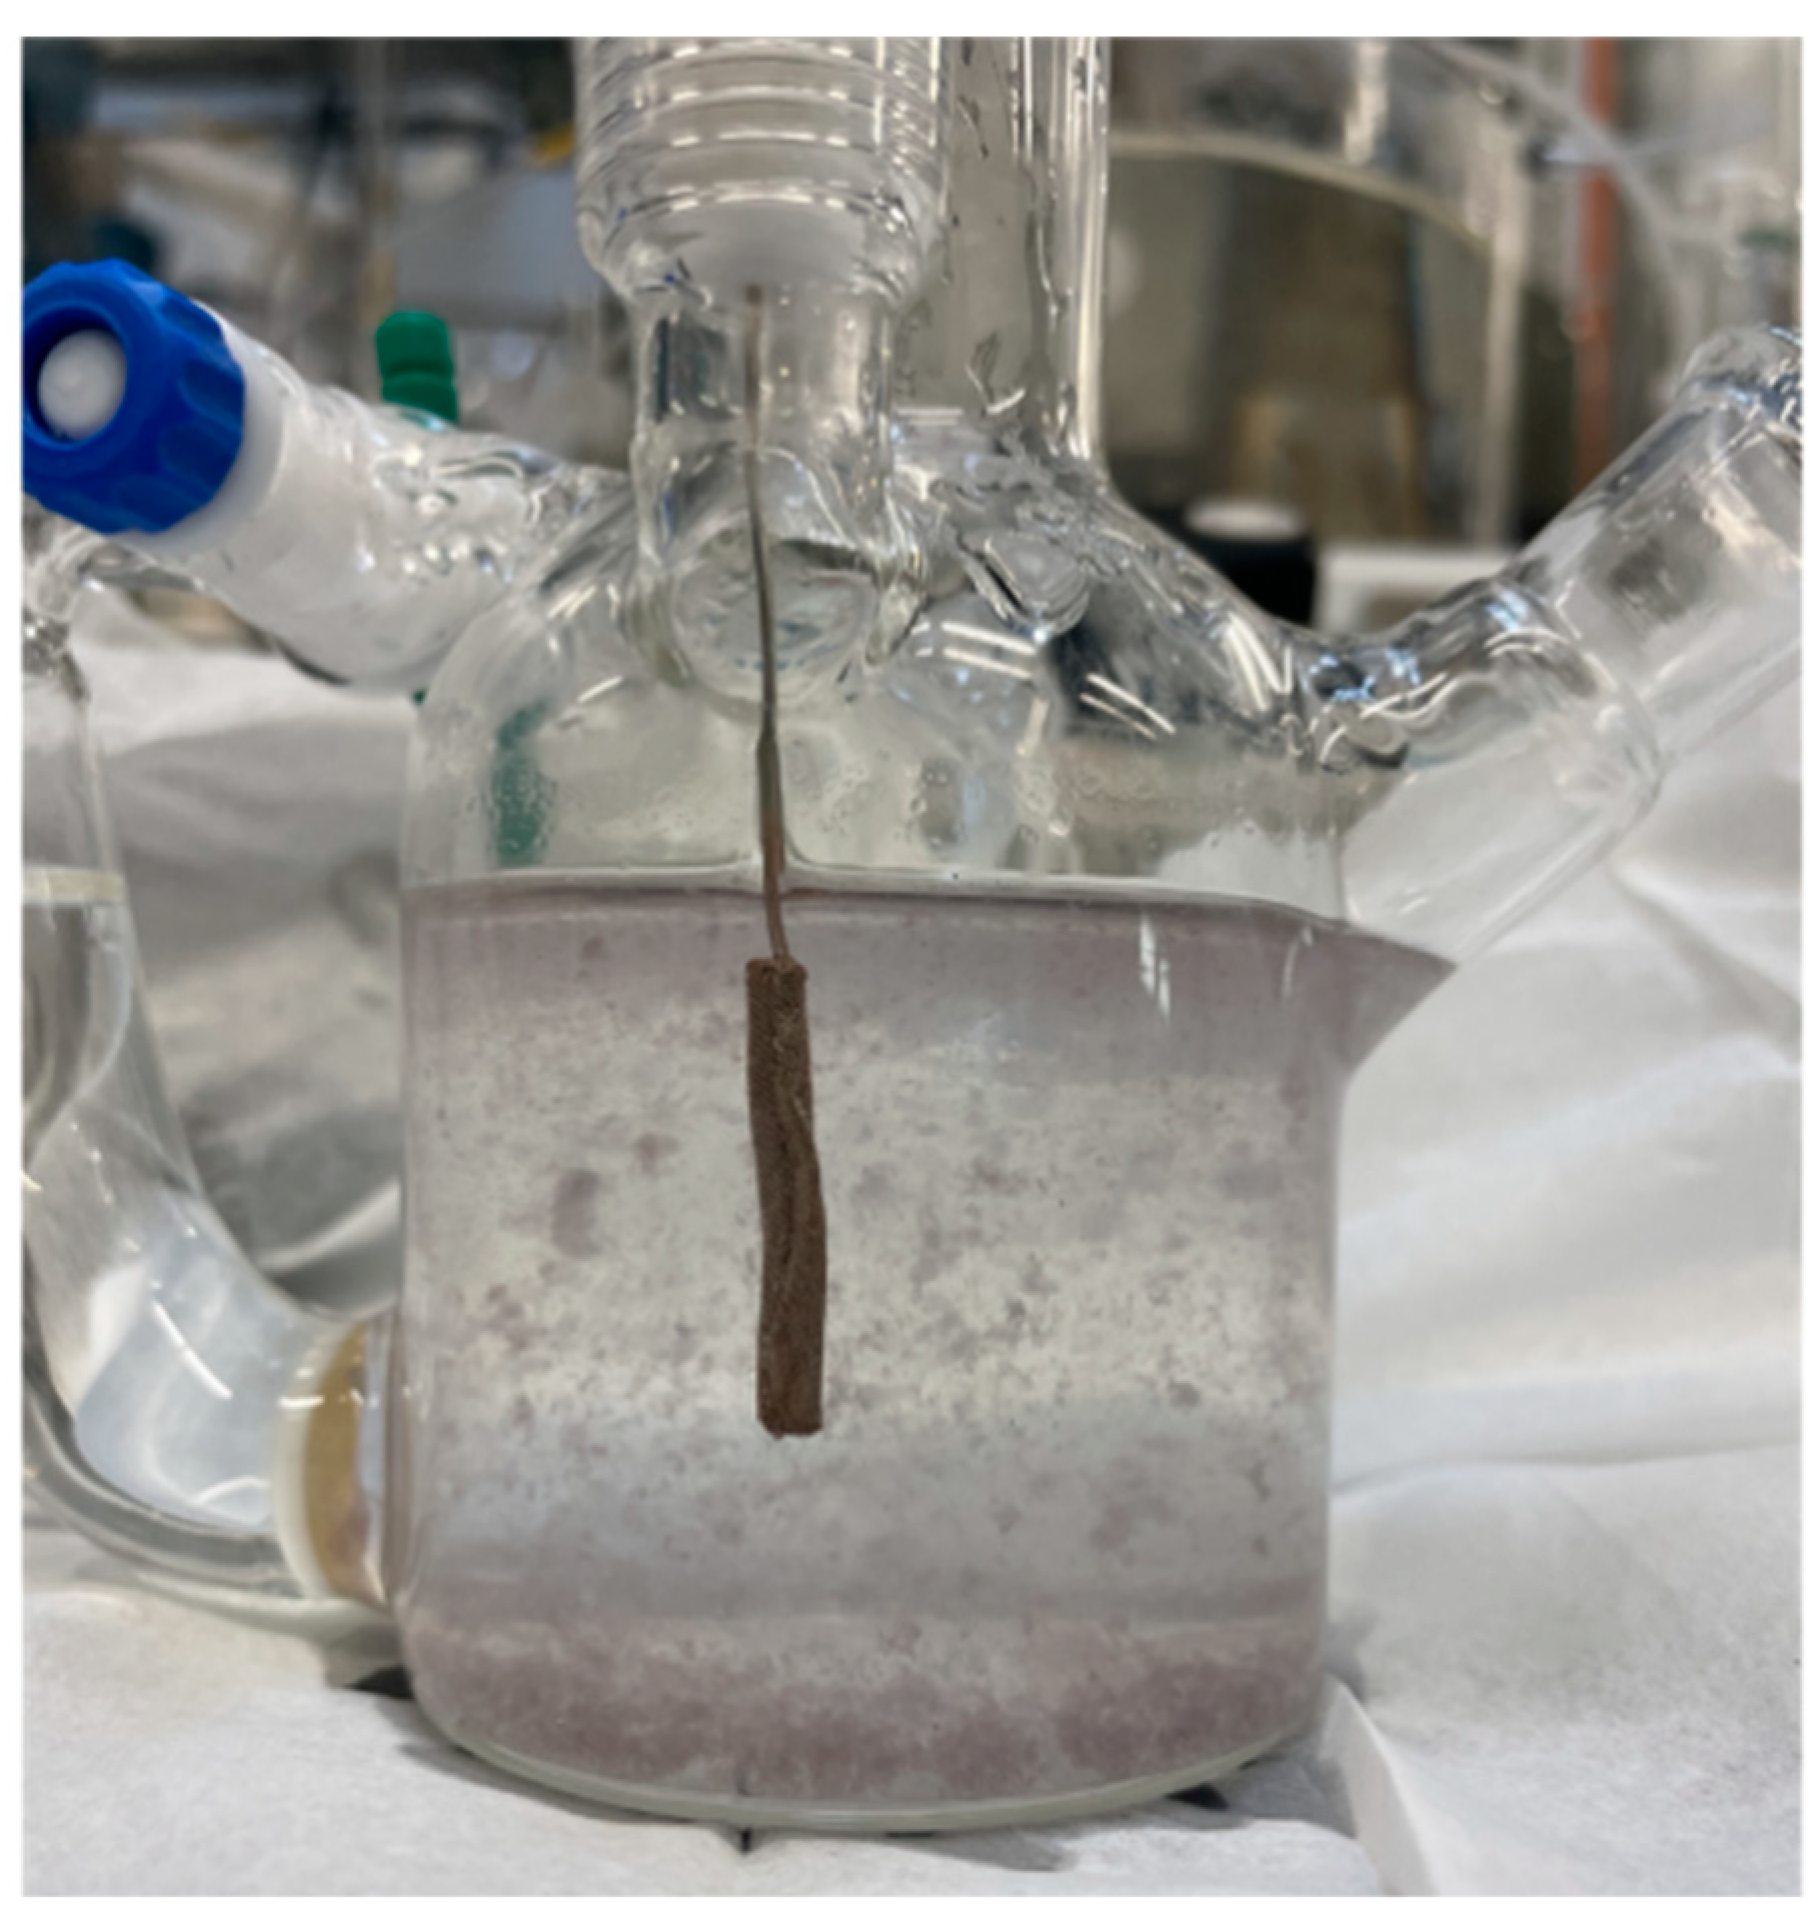
2.4. Electrode Fabrication

For the working electrodes (WEs), samples of Al alloys (sheet metal, 0.005″, All Foils) and C12200 (refrigeration grade > 99.9% Cu tubing, 0.03″, McMaster Carr) were lightly sanded with 150-grit sandpaper to roughen the surface (which is desirable for liquid desiccant systems) and cut into 1 cm2 squares. Sections of insulated Cu wire, four inches long, were cut, and the ends were stripped to expose approximately 0.5 cm of Cu wire. On one end, the exposed wire was attached to the Al alloy or C12200 sample using epoxy. After the epoxy dried, silver paint was used to ensure good electrical contact between metal wire and sample. The silver paint was dried in an oven at 60 °C for 15–20 min. A second layer of epoxy was then applied, covering the exposed Cu wire, silver paint, and back of the sample completely. Examples of working electrodes are included in Figure 1B.
The counter electrode (CE) was fabricated from Pt gauze (100 mesh), folded to ca. 0.5 cm by 2 cm and spot welded to a 0.5 mm-diameter Pt wire. Thus, its high surface area (ca. 10 × WE surface area) ensured that reactions at the CE were not rate-limiting.
A reversible hydrogen electrode (RHE) was utilized as a reference electrode.

2.5. OCP Determination

To obtain OCP, the RHE and CE were immersed into the electrolyte, then the WE was immersed, and the voltage was recorded as a function of time. This allowed determination of the equilibration point at which the OCP was stabilized. Typically, for C12200 electrodes, the OCP stabilized within 30 min. For the Al alloy electrodes, the OCP generally stabilized after 2 h. While the OCP was dependent on experimental conditions, for C12200, it generally stabilized around 0.5–0.7 V versus RHE. For both Al alloys, it generally stabilized at a negative potential between −0.3 and −0.5 V versus RHE.
To ensure reproducibility of OCP determination, three replicates were performed for each material in 50 wt. % CH3COOK at 80 °C. Values of OCP and Ecorr were most consistent for C12200 replicates, reproducible within ±0.035 V. However, for all materials, OCP and Ecorr values were, on average, reproducible within ±0.052 V.

2.6. Electrochemical Corrosion Tests

The three-electrode system depicted in Figure 1A was utilized to perform potentiodynamic polarization experiments. The sample of interest was the WE, prepared as discussed above. During experiments, a potential was applied to the WE and swept from approximately 300 mV below to approximately 300 mV above the OCP at a scan rate of 0.001 V s−1, and the current response was recorded. The high surface area of the CE (ca. 10 × WE surface area) ensured that reactions at the CE were not rate-limiting. During potentiodynamic polarization experiments, the potential and current of the WE with respect to the RHE were measured with a potentiostat (AUTOLAB–PGSTAT302N, EcoChemie, Metrohm). Experiments were conducted at 23 °C, 80 °C, and 120 °C. For experiments at elevated temperatures, a hot plate and mineral oil bath were used to maintain a constant temperature. Due to the low vapor pressure of the salt solutions, very little vapor was observed, even at elevated temperatures. However, to ensure consistent results, a reflux condenser was used, maintaining constant electrolyte volume and concentration throughout experiments.
To calculate CR from potentiodynamic polarization, Tafel analysis was utilized. At potentials close to the OCP (usually <20 mV), anodic and cathodic contributions were both observed. At potentials far from the OCP, mass transport limitations could begin to dominate. However, between ca. 20 and 120 mV, Tafel lines can be extrapolated [21,25]. The Tafel lines represent pure anodic and cathodic kinetic responses, and the intersection provides the corrosion potential (Ecorr) and corrosion current density (jcorr), which is the corrosion current (icorr) divided by the exposed area (A). Ecorr is often close to or the same as the OCP.
Using the Stern–Geary equation and Faraday’s law, the corrosion rate (CR) in millimeters per year was calculated from these values [26,27].
To validate the method and ensure it gave reproducible results, three experiments were performed for each material in 50 wt. % CH3COOK at 80 °C. A fresh working electrode was used for each replicate. The results of these replicate experiments show that the technique gave, on average, icorr values reproducible within ±25% and yearly CRs reproducible within ±27%, as illustrated in Figure 3. Thus, we have drawn conclusions from our data based on differences of an order of magnitude or more for CR but were unable to draw conclusions based on CR differences of less than an order of magnitude using this technique.

2.7. Characterization of Corroded Samples and Salt Solutions
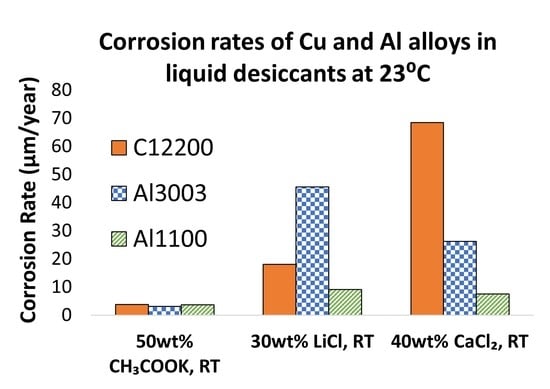
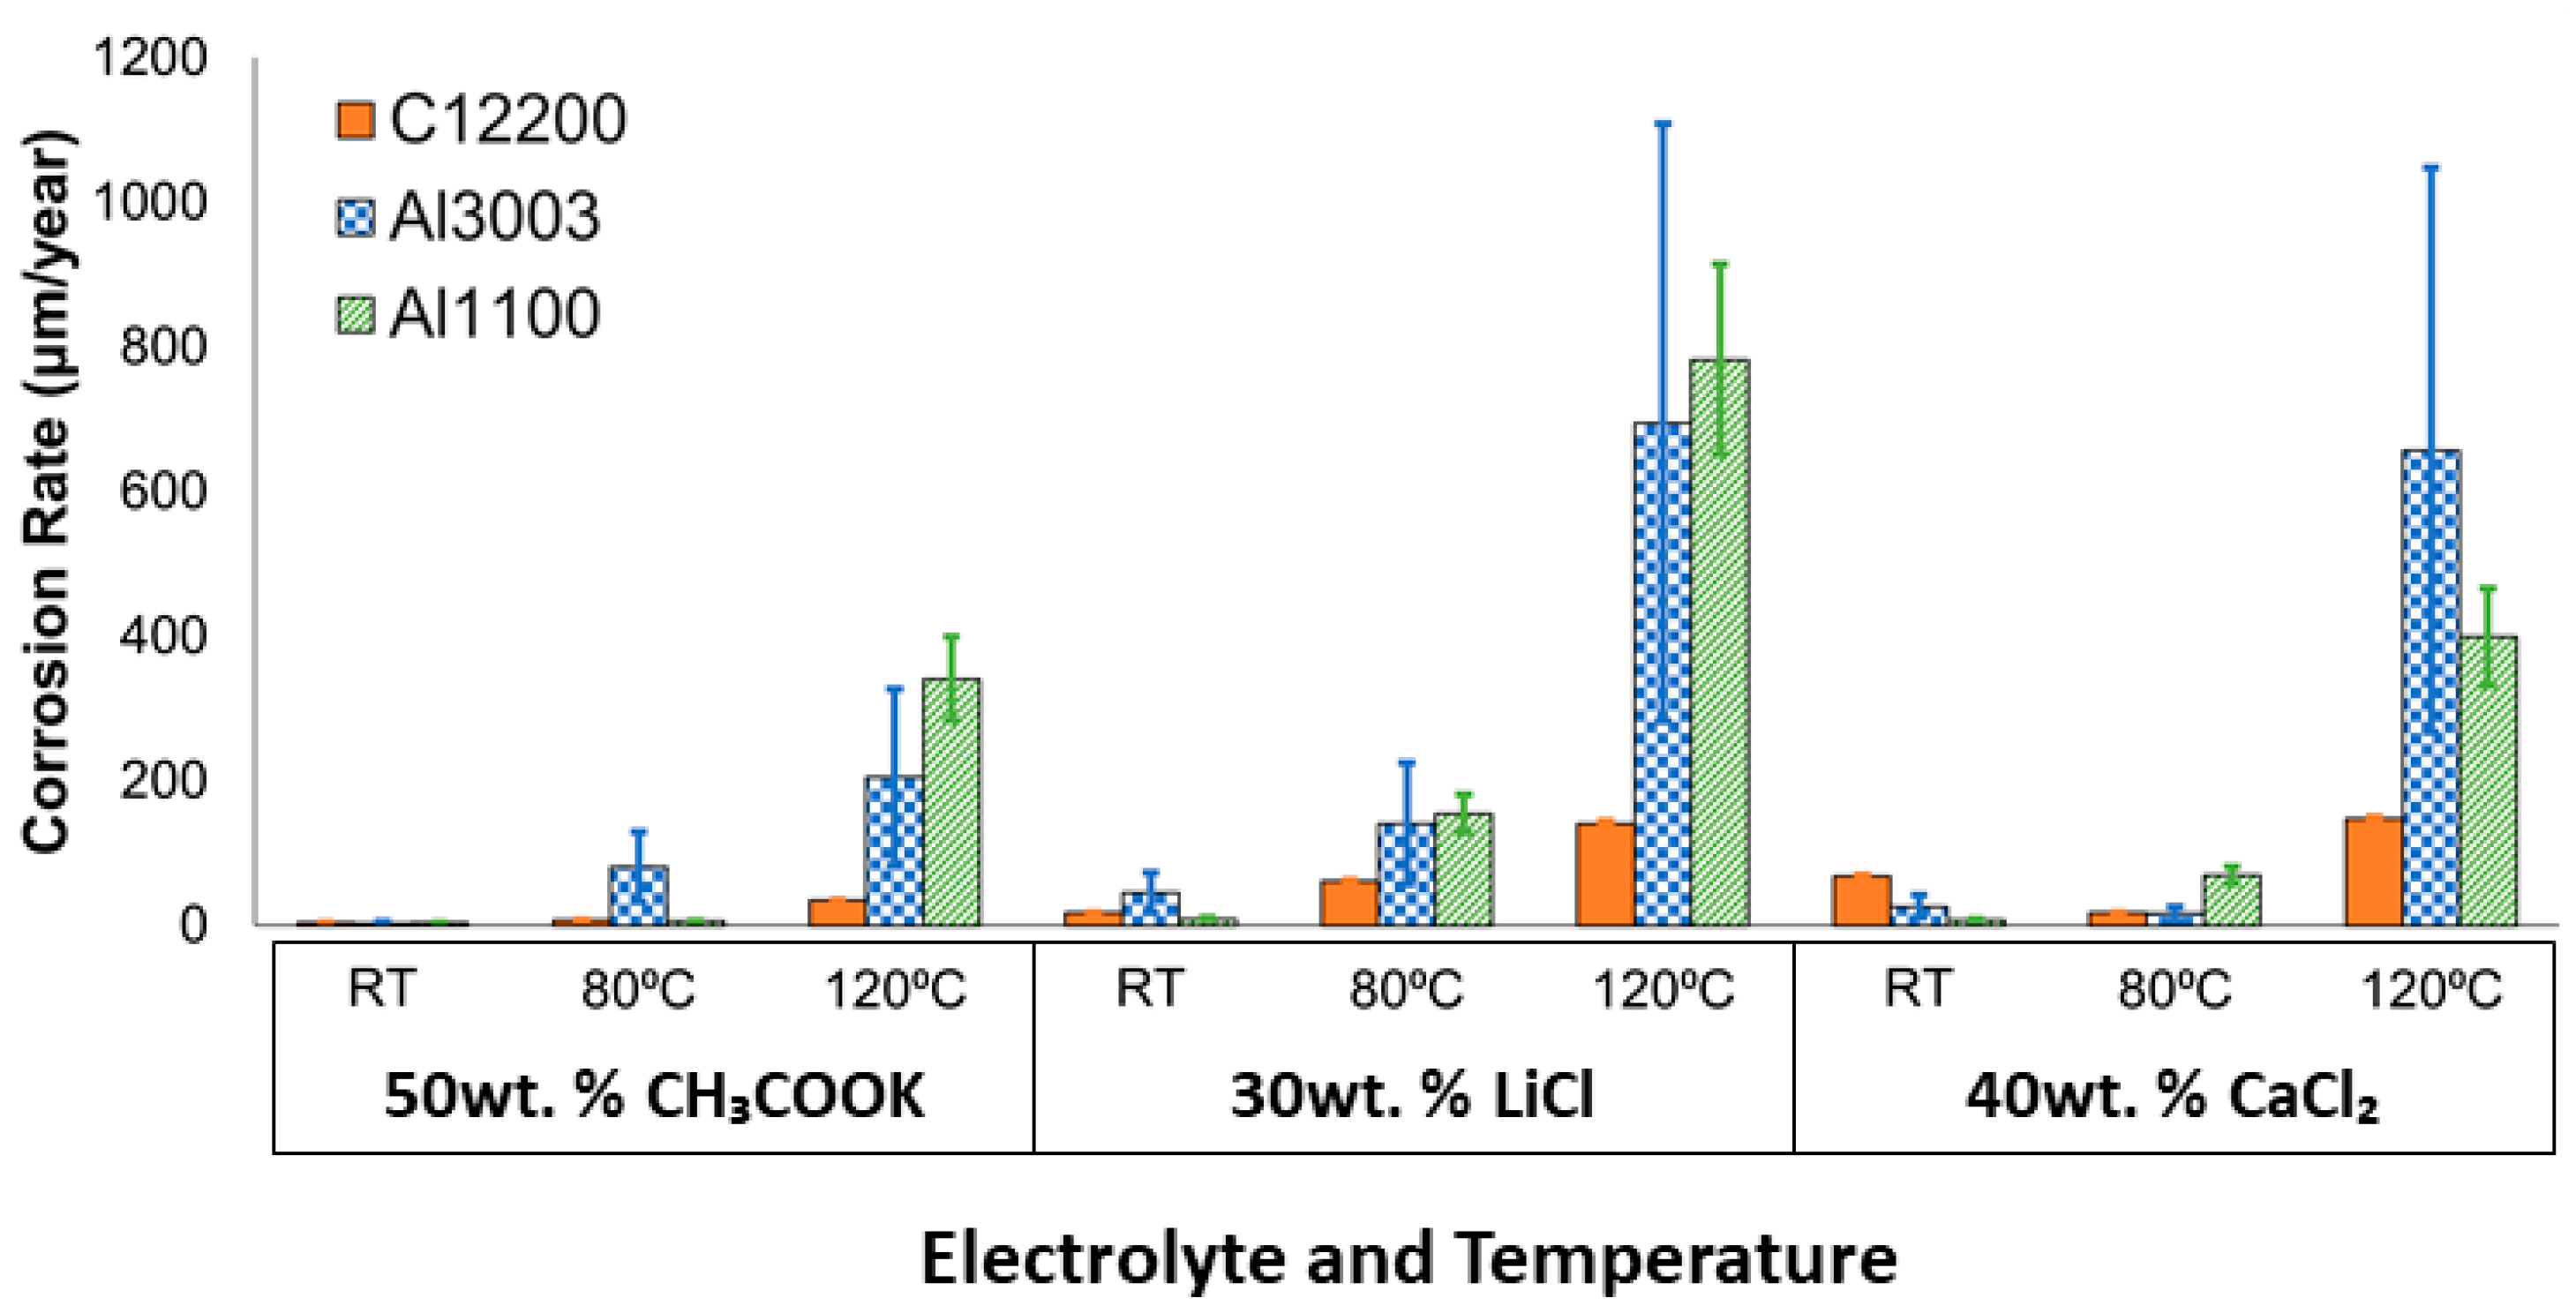
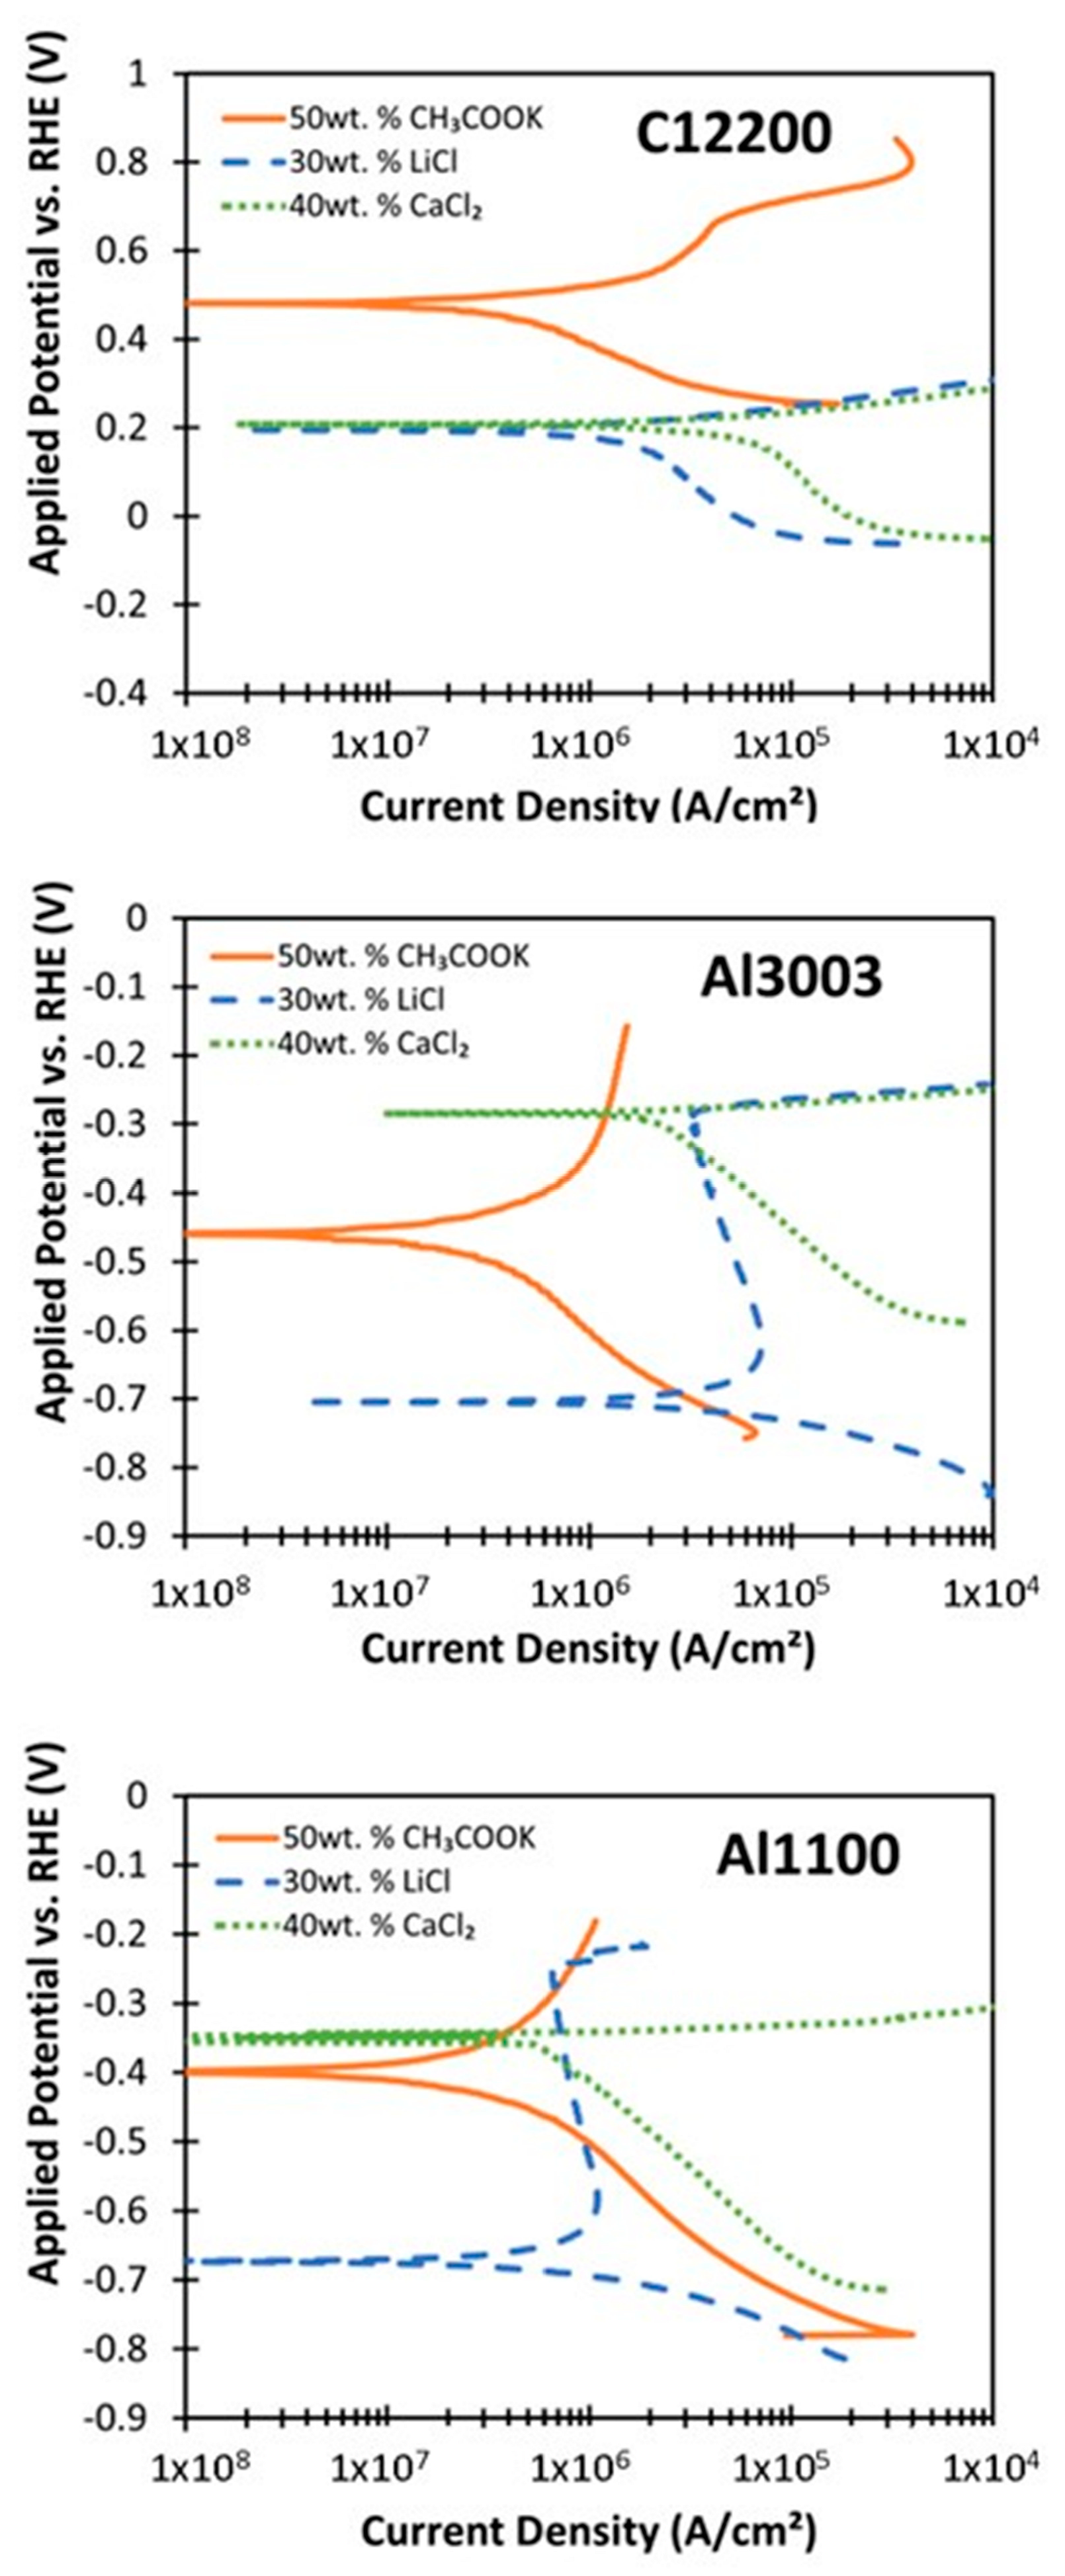
After electrochemical corrosion experiments, an analysis of the WE surface and the electrolyte solution was conducted. For analysis of the WE surface, samples were rinsed to remove excess electrolyte and soluble and/or loose corrosion products. The samples were then metallographically characterized using an optical microscope and FESEM. Chemical analysis of the corroded samples was performed with FESEM-EDX. For analysis of the electrolyte solution, including analysis of any corrosion products that did not adhere to the electrode, ICP-MS was performed. This highly sensitive technique allowed analysis of chemical composition of the electrolyte solutions, identifying even trace elements.

3. Results

For each material of interest (C12200, Al3003, and Al1100), corrosion was evaluated in each liquid desiccant (LiCl, CaCl2, and CH3COOK) at three operationally relevant temperatures (23 °C, 80 °C, and 120 °C). Furthermore, corrosion in CH3COOK was evaluated under a range of conditions. Results of these electrochemical corrosion experiments are given in Table 2 and Table 3 and are illustrated graphically in Figure 4.
In CH3COOK solutions, C12200 demonstrated CRs of less than tens of μm’s per year at all temperatures evaluated. Al1100 had a reasonably low CR (<10 μm/year) at both 23 °C and at 80 °C, but at 120 °C, it was more than an order of magnitude higher. Al3003 showed similar results.
The CRs in LiCl and CaCl2 solutions were consistently higher than CRs in CH3COOK solutions. For C12200 metal, CRs were lower in both LiCl and CaCl2 solutions at lower temperatures, but at 120 °C, were higher by an order of magnitude. Al1100 showed slightly better performance than Al3003, with lower CRs for both LiCl and CaCl2 solutions at 23 °C, but with much higher CRs at 80 °C and 120 °C. Al3003 had relatively high CRs in chloride salt solutions at all temperatures.
The corroded samples were metallographically characterized using an optical microscope and FESEM-EDX for surface morphology and composition evaluation. Imaging revealed evidence of pitting corrosion for samples in chloride salt solutions. It is important to note that CR measurements inherently cannot quantify localized corrosion behavior such as pitting; CR may therefore underestimate the corrosivity of chloride salt solutions. The salt solutions were also analyzed after electrochemical experiments with ICP-MS.

4. Discussion

4.1. Corrosion Behavior

Since the CRs for samples evaluated in CH3COOK are much lower than the CRs for samples evaluated in chloride salts, CH3COOK is a more promising candidate for use with metal alloys. While CRs in CH3COOK were relatively high at 120 °C, it is unlikely during normal operation of LDAC systems that this temperature would be sustained for long periods of time. Furthermore, corrosion mitigation measures such as the use of surface coatings and/or corrosion inhibitors have previously been shown to reduce Al alloy corrosion and could reduce CRs further [24,30,31,32].
Results from potentiodynamic polarization experiments also give insights into details of corrosion behavior. The shape of the Tafel lines can be indicative of possible corrosion mechanisms. For example, when the current changes very rapidly with applied potential, this can indicate active corrosion. This behavior can be seen clearly for both Al3003 and Al1100 samples in CaCl2 solution (see Figure 5). Here, the current changes dramatically with applied potential, and the anodic Tafel line has an extremely flat slope.
Furthermore, Figure 5 shows a possible transpassivation behavior—pitting corrosion—for both Al3003 and Al1100 samples in LiCl solution above −0.3 V. For both Al alloys, the anodic Tafel lines exhibit an inverse relationship between current and applied potential between 0.1 V and 0.5 V above OCP, indicating possible passivation, strengthening with increased potential. At greater than 0.5 V above OCP, the current begins to sharply increase with applied potential, indicating that transpassivation and pitting corrosion may be occurring.
Such behavior has been well documented in chloride salts. Oxide layers are not stable in the presence of chloride ions which can attack and degrade them [21,33,34]. This results in an uneven breakdown of the protective oxide layer, giving a sudden and sharp increase of current. This type of localized corrosion can cause a catastrophic failure of components.

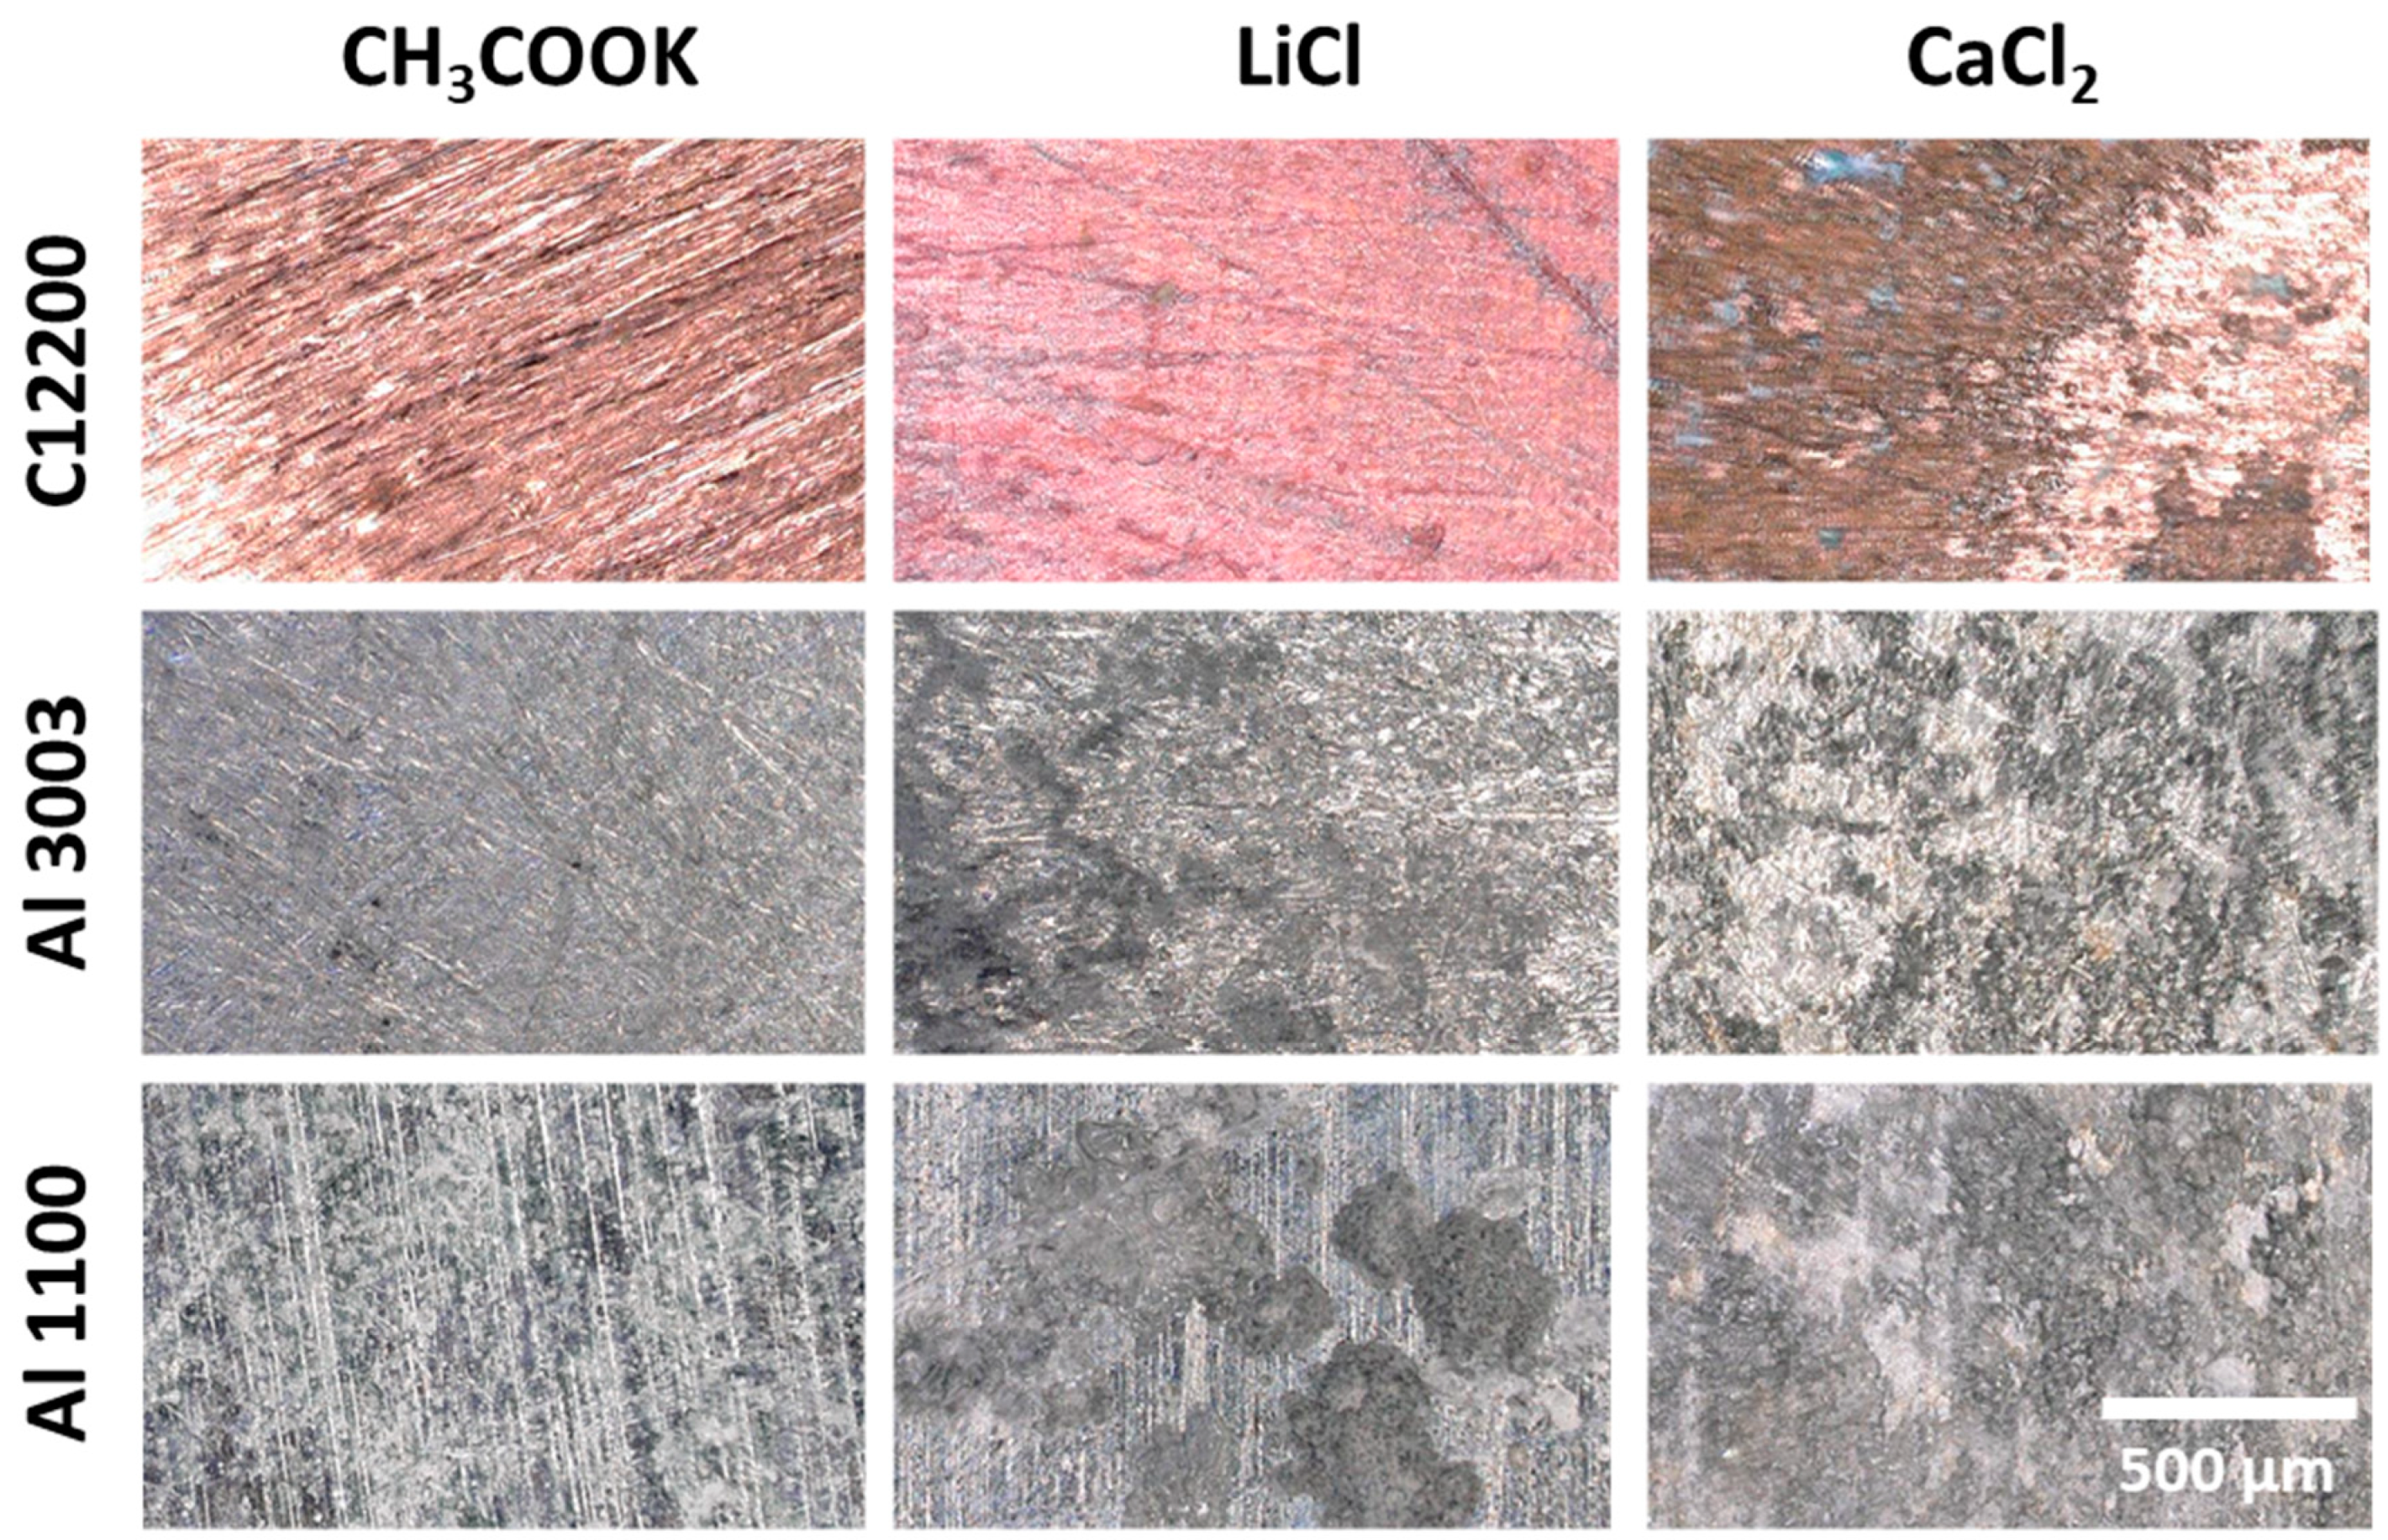
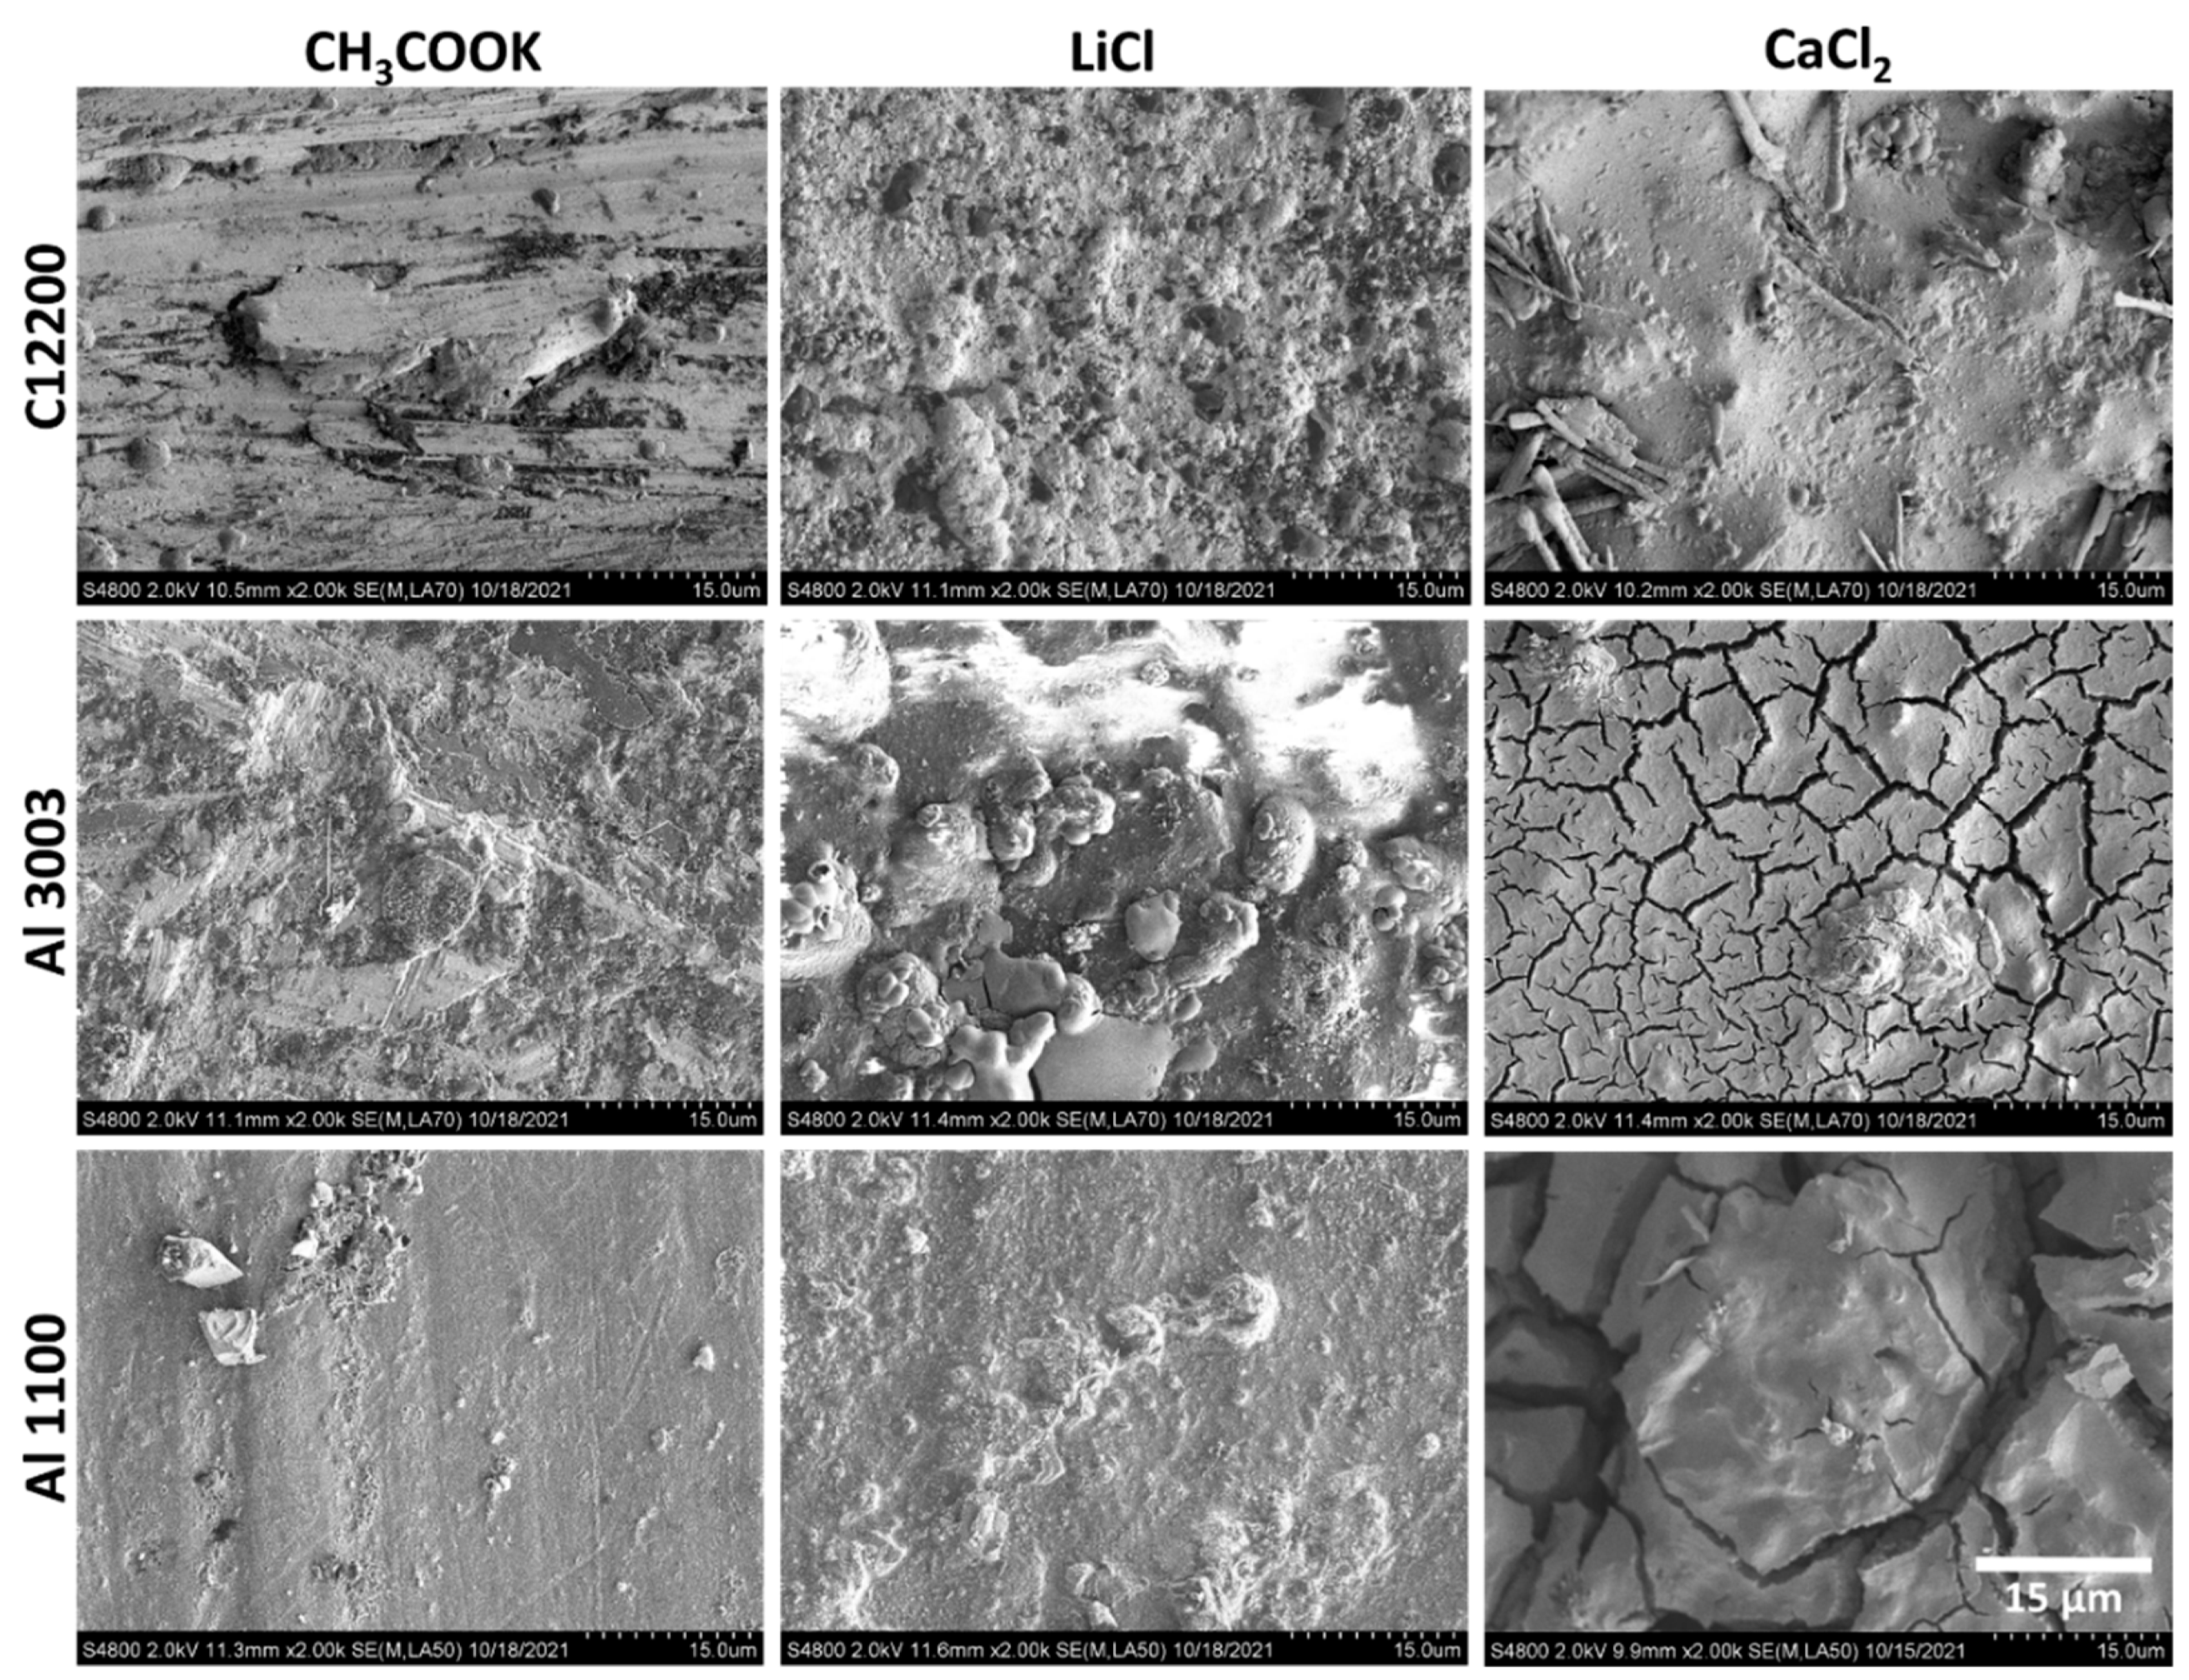
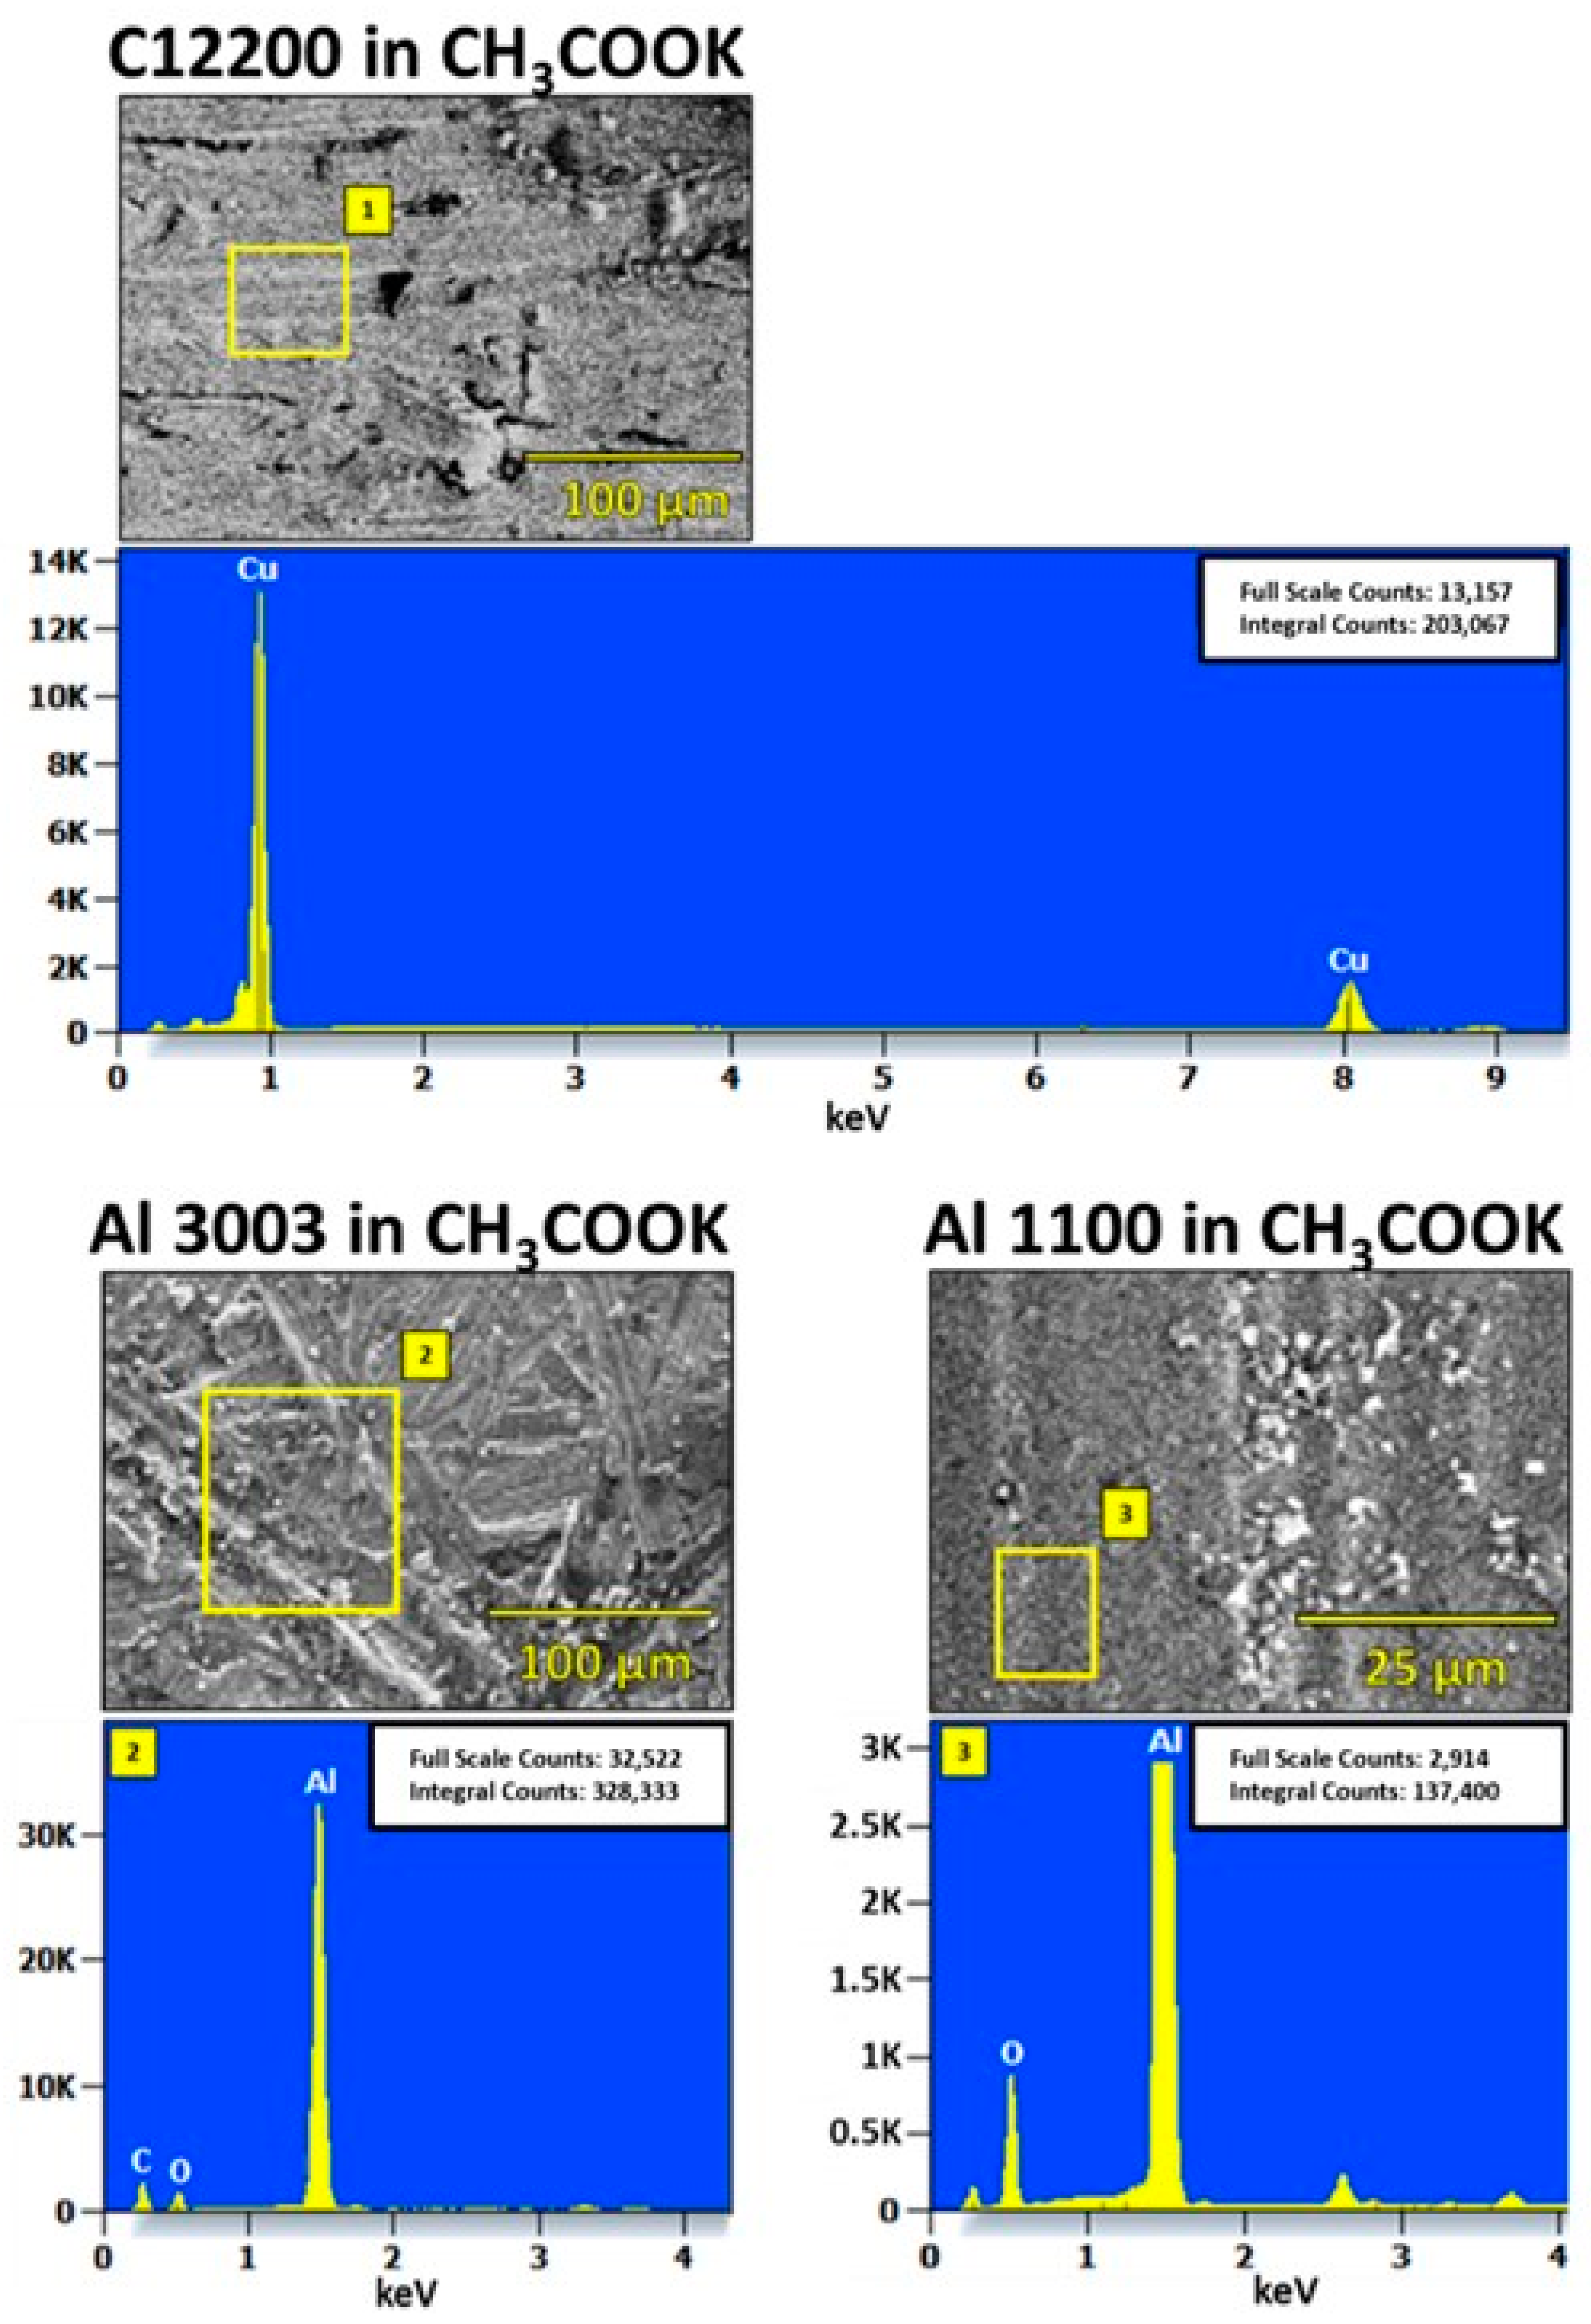
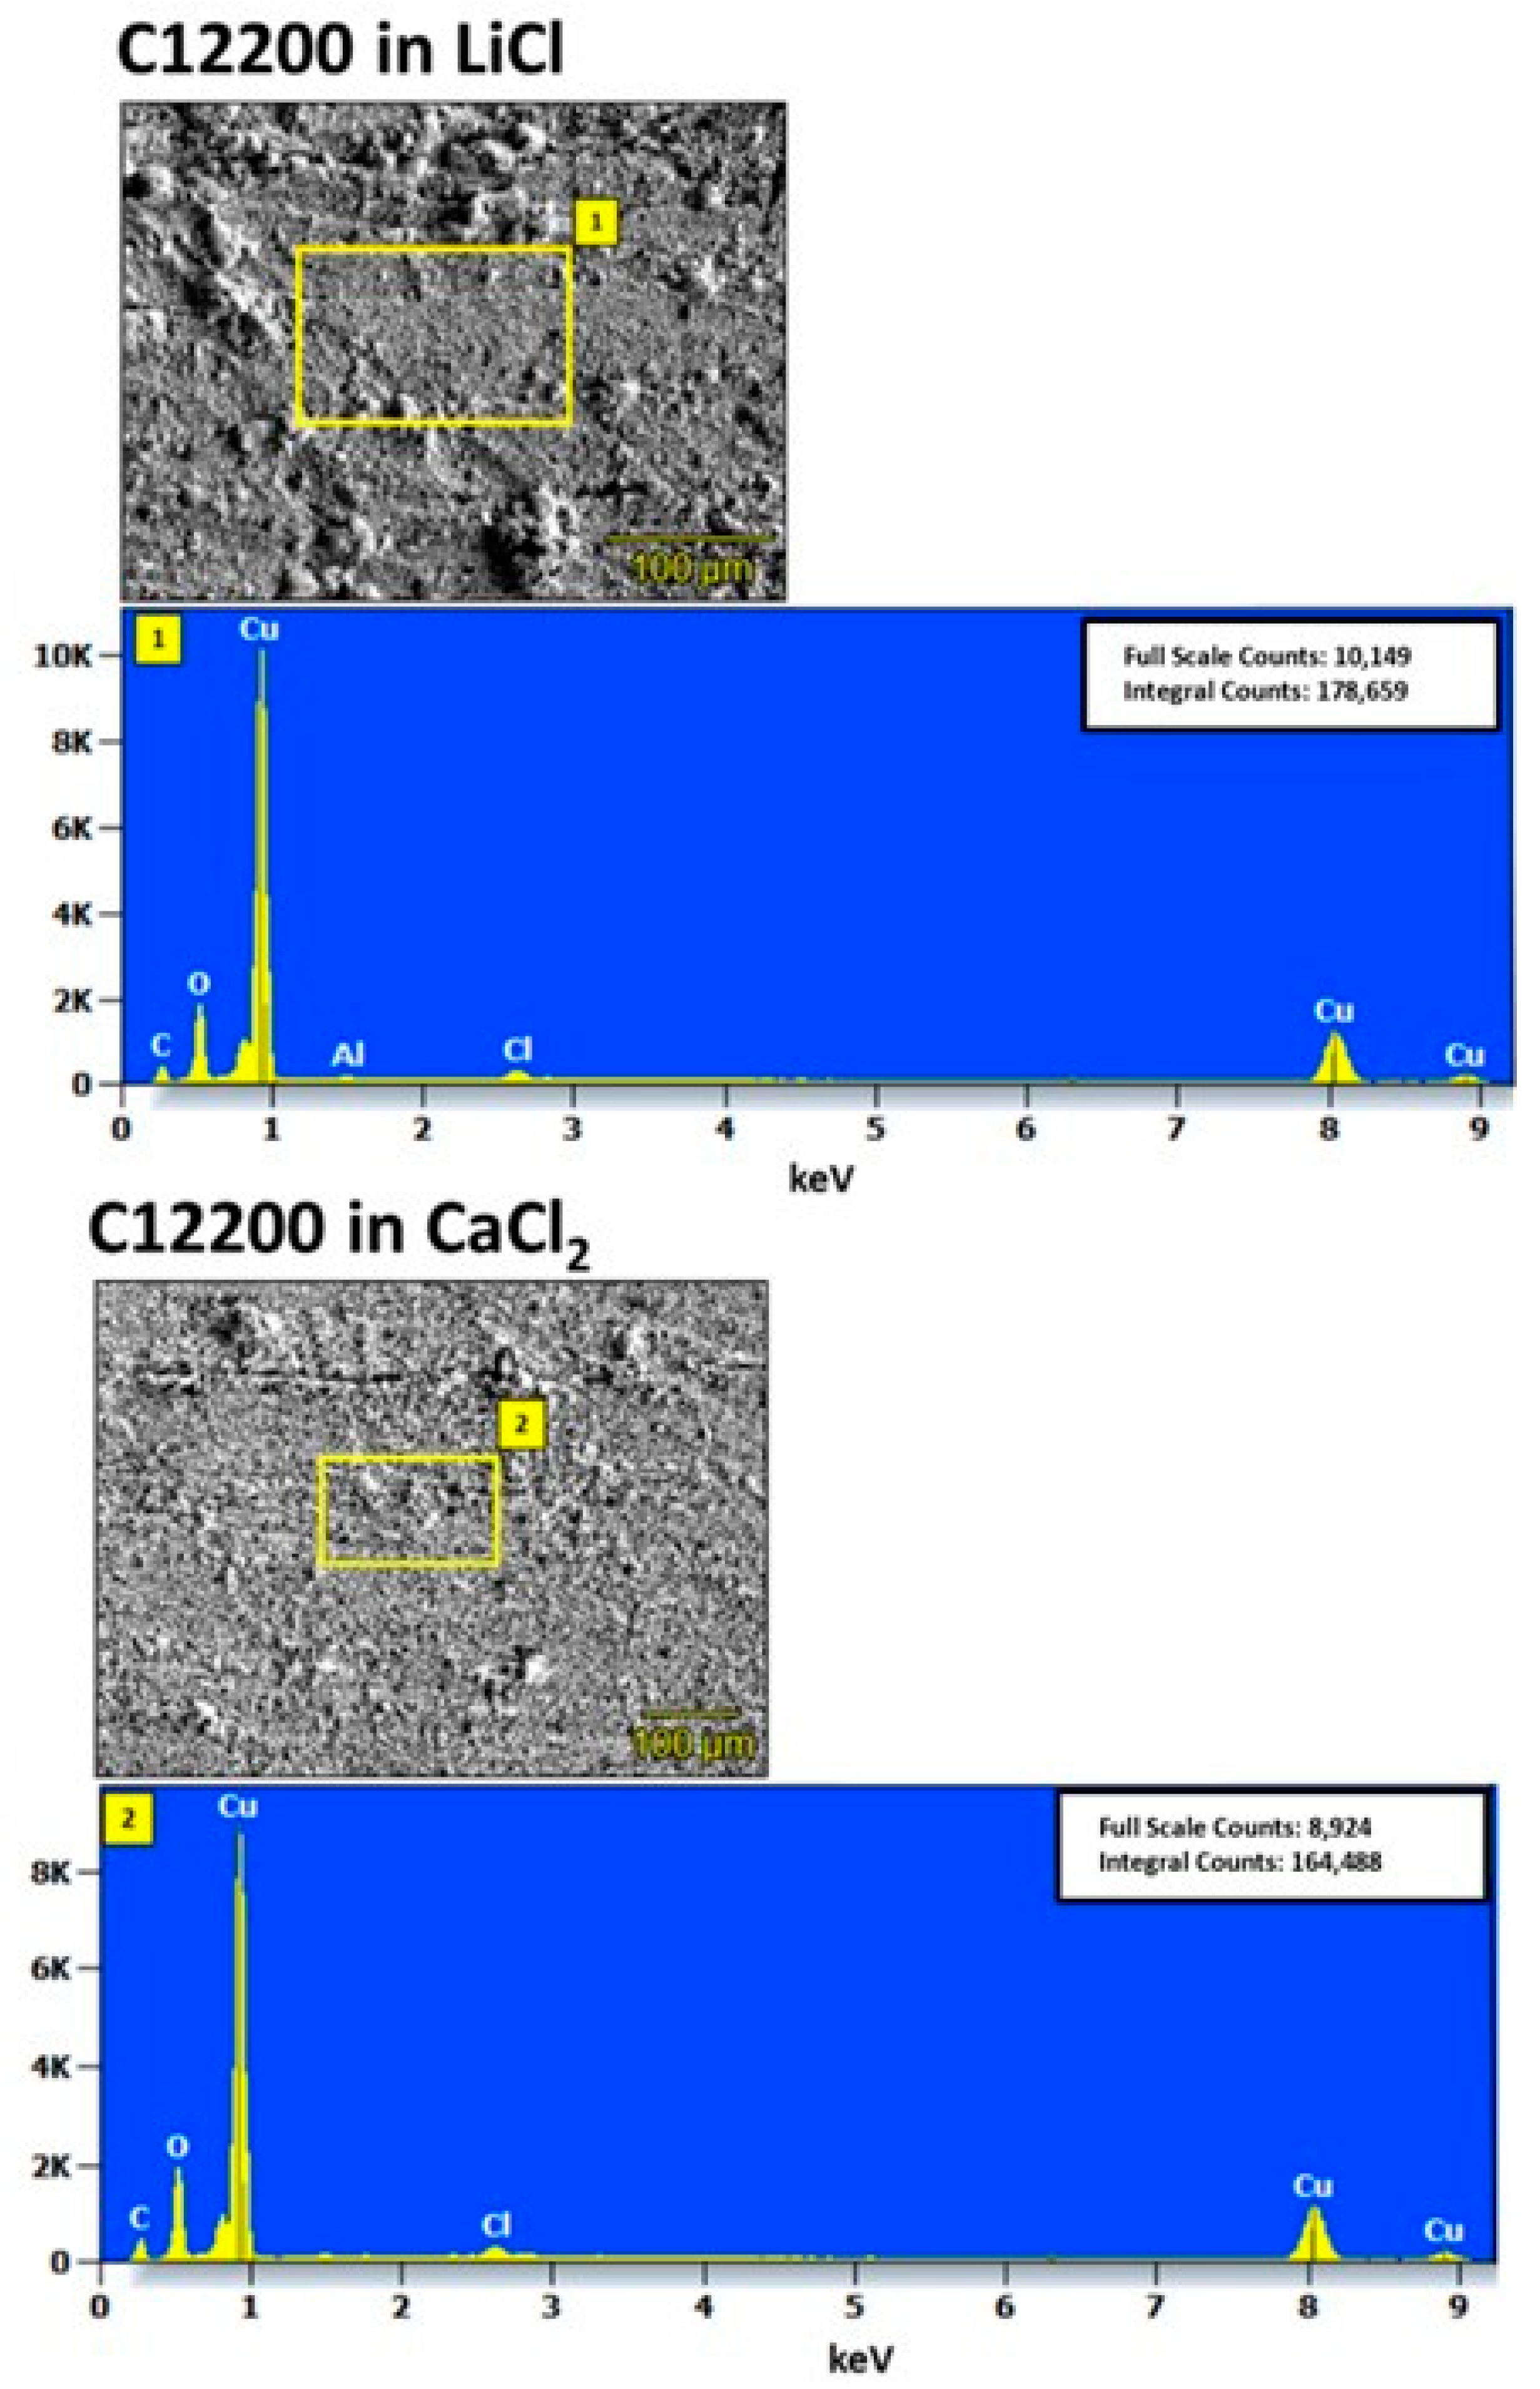
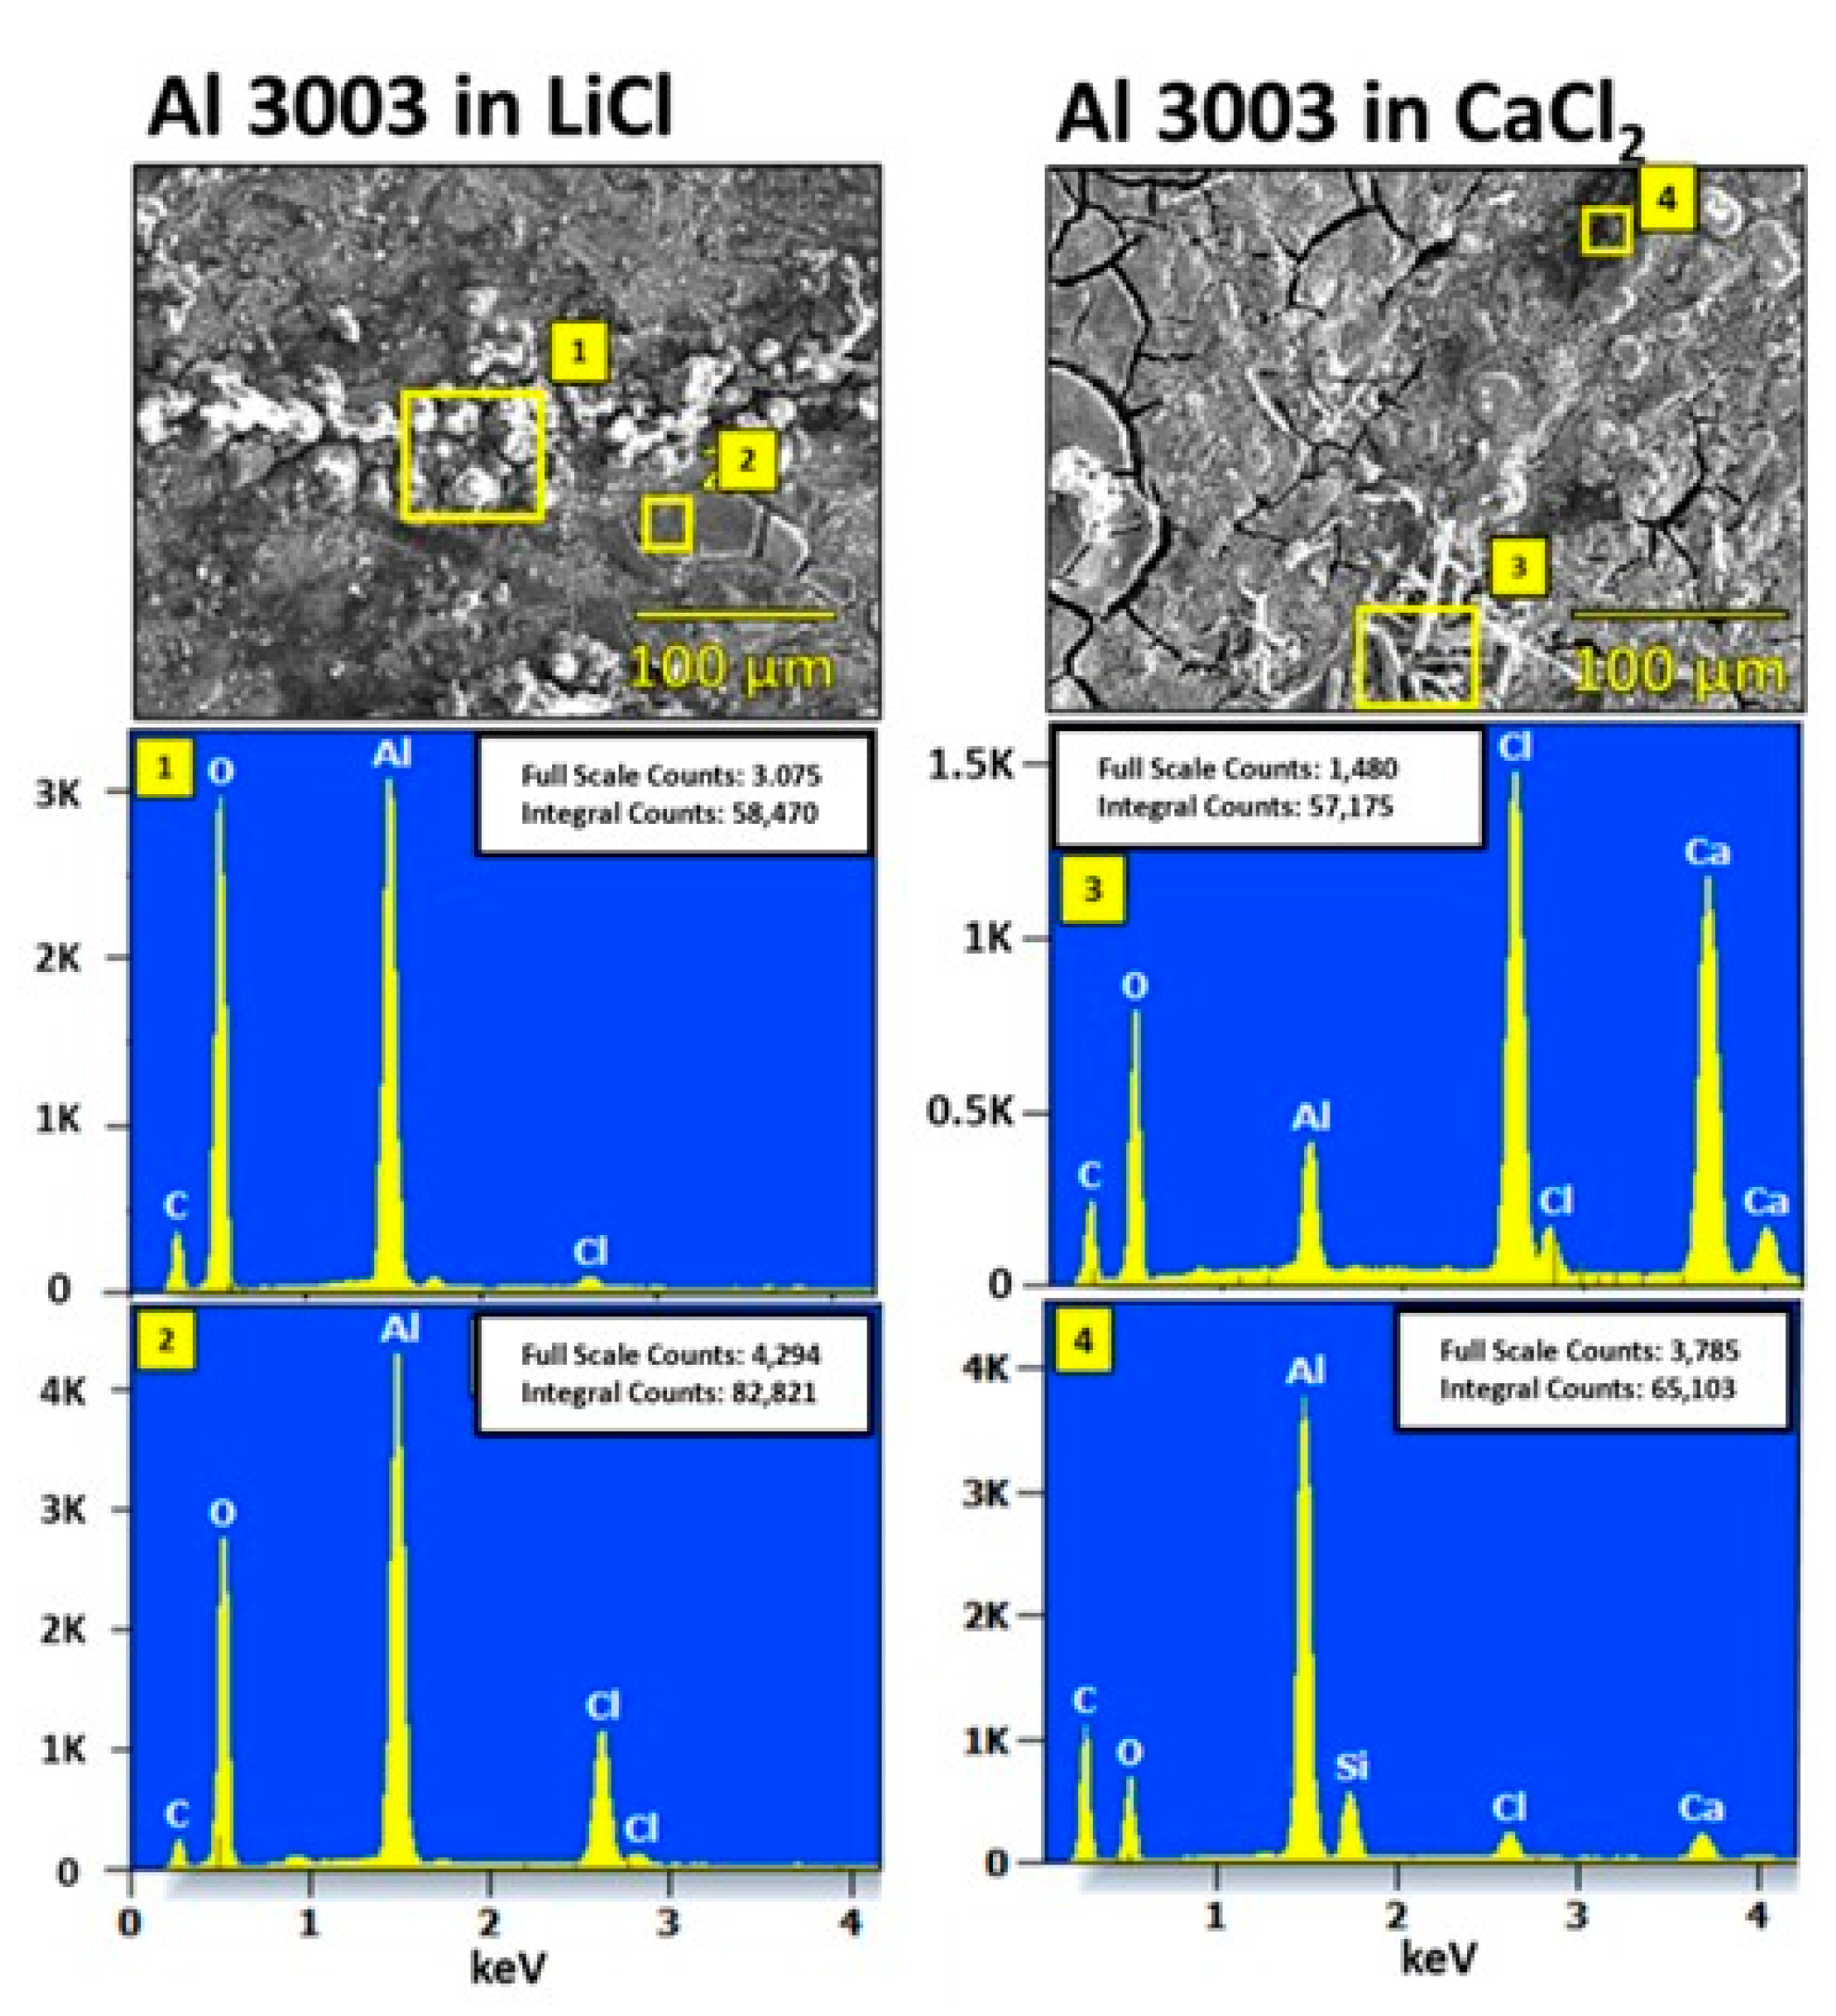
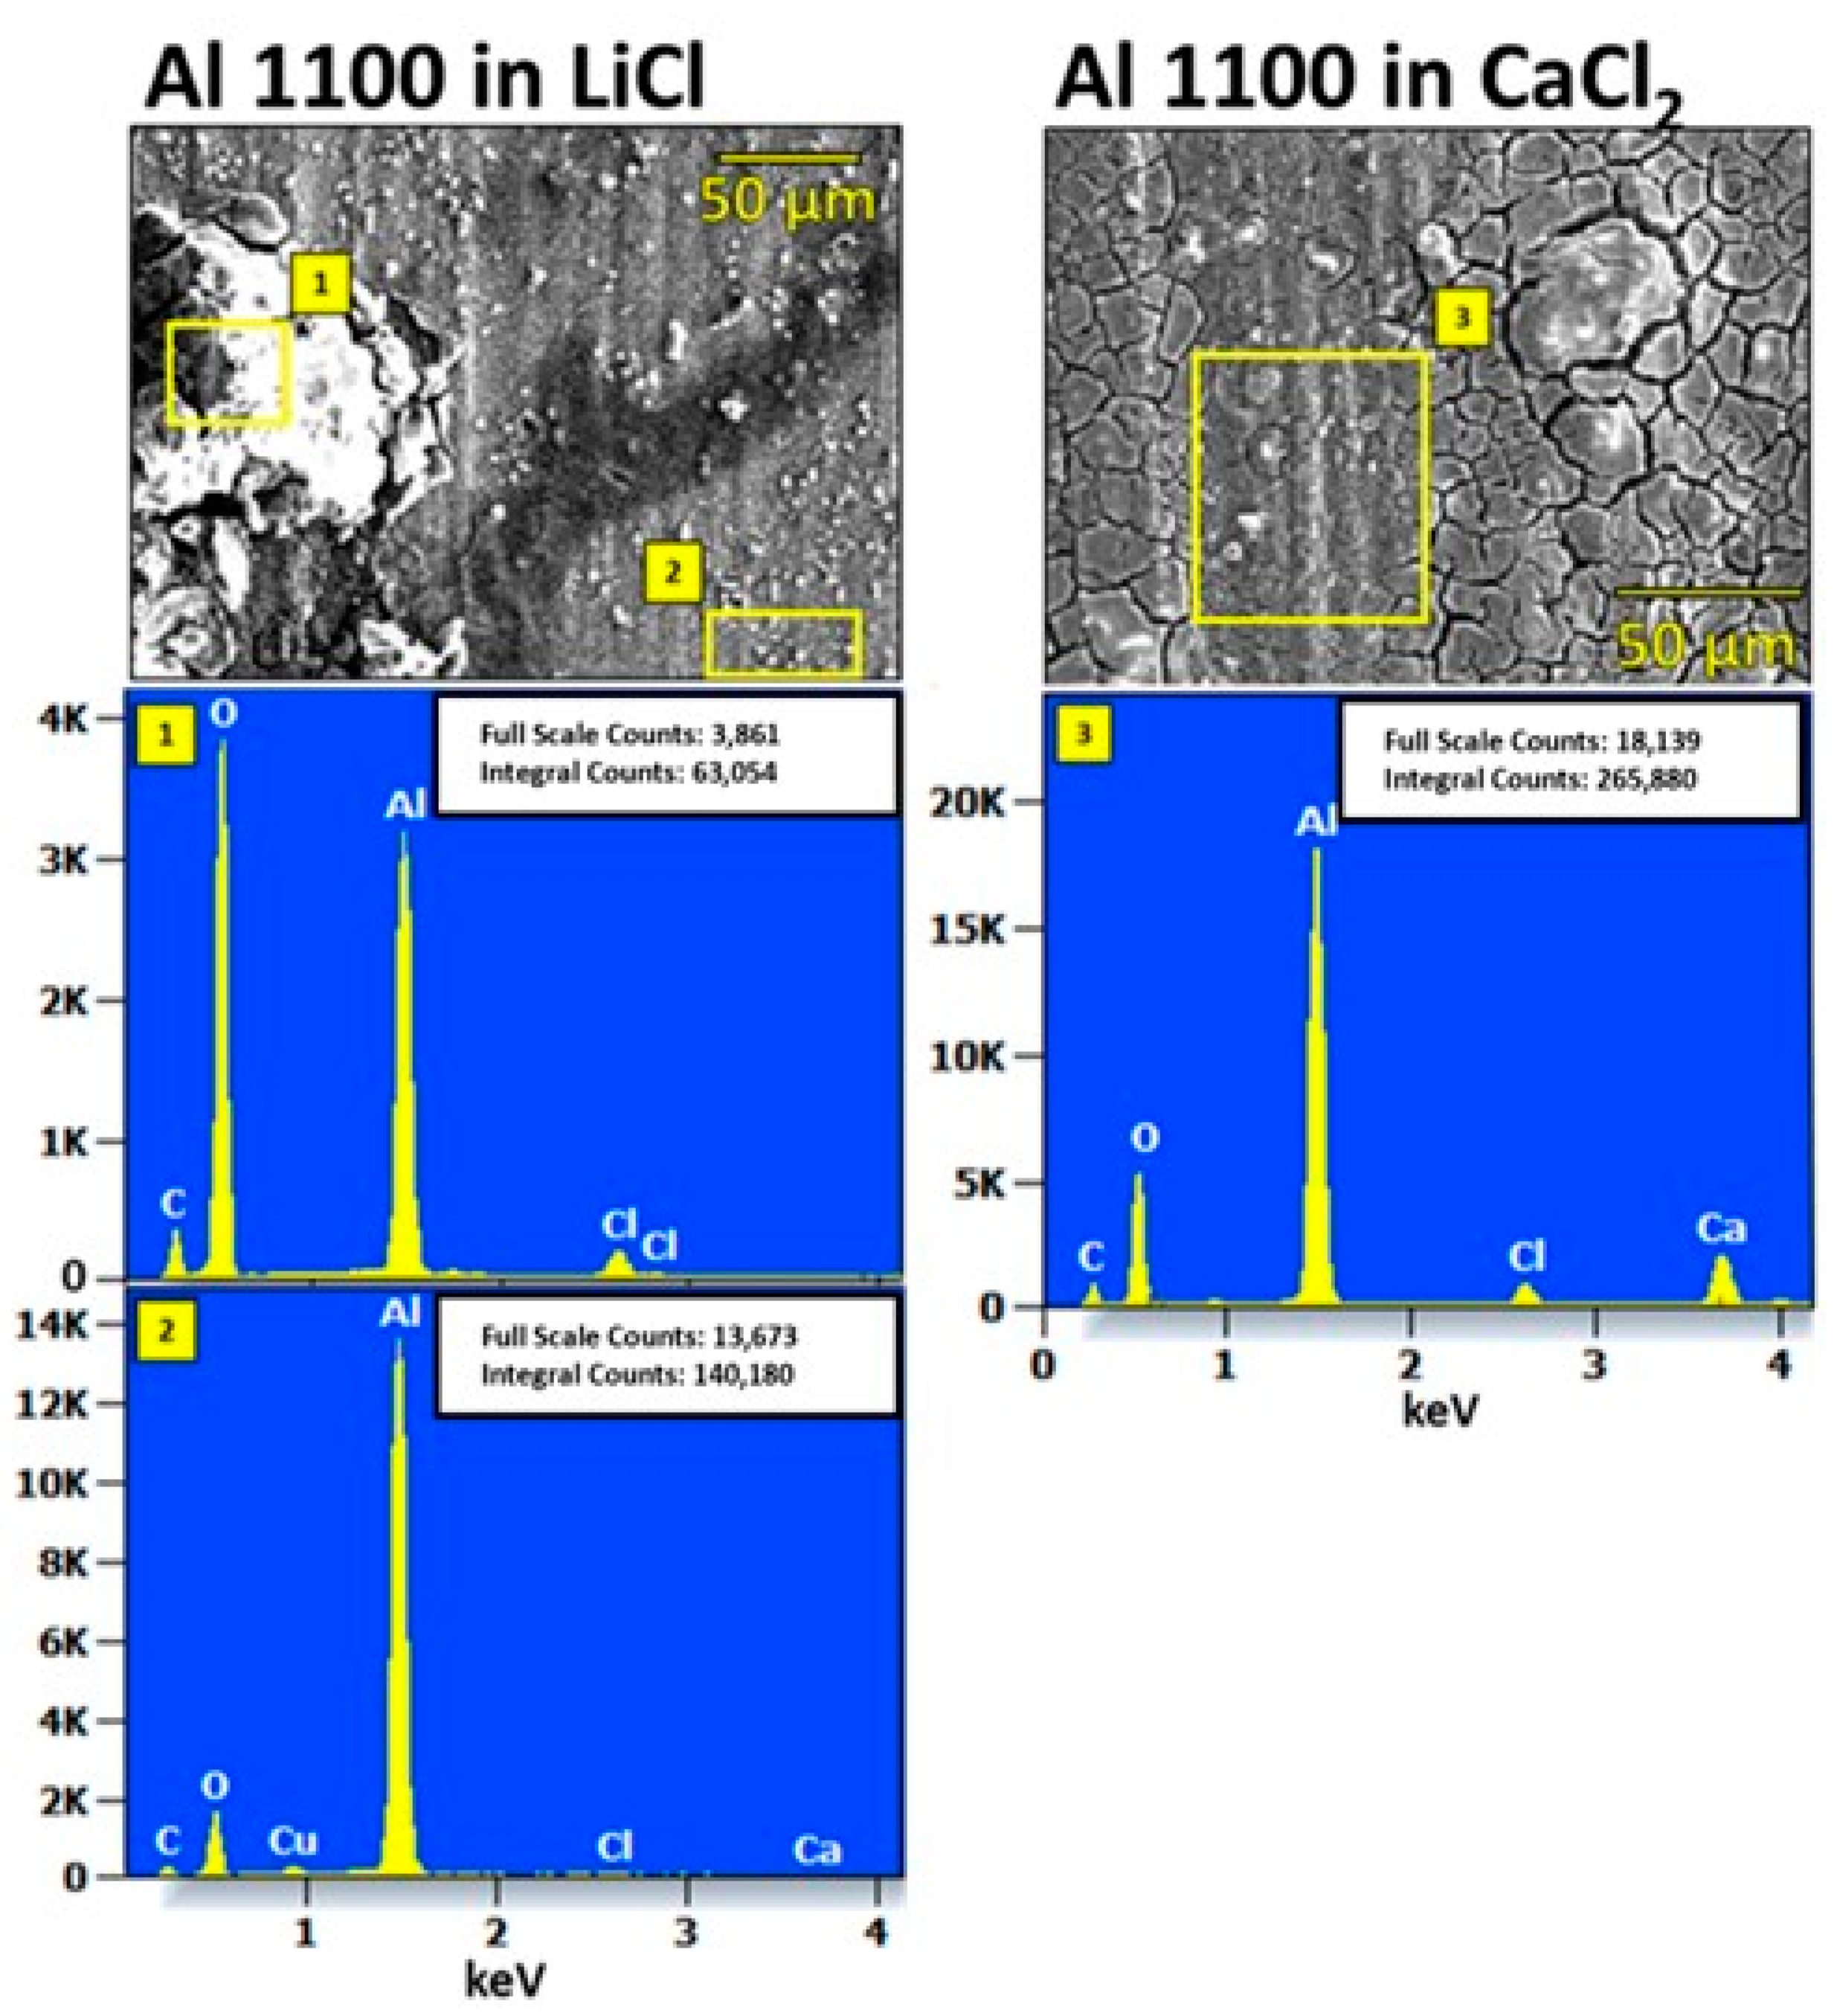
4.2. Characterization of Corroded Alloy Samples and Liquid Desiccant Solutions

Figure 6 shows a selection of the images obtained using an optical microscope for samples evaluated in desiccant solutions at 80 °C. For all samples in CH3COOK solutions, optical microscopy results showed that metallic luster was retained, and marks from sanding with 150-grit sandpaper to roughen the surface were still visible. These results support the low CRs calculated from our electrochemical experiments. In contrast, the surfaces of all samples evaluated in LiCl and CaCl2 solutions show significant evidence of corrosion. The C12200 sample evaluated in a LiCl solution no longer shows a metallic luster and has changed color. The C12200 sample evaluated in CaCl2 shows similar corrosion behavior. For C12200 in both chloride salt solutions, there was evidence of discoloration and corrosion processes. Optical microscopy for all Al alloy samples in chloride salts showed clear evidence of pitting corrosion.
At higher magnification using FESEM, depicted in Figure 7, surface morphology changes could be observed in more detail. For experiments in CH3COOK, there was evidence of a small amount of surface deposits in all cases. However, features of the original metallic surfaces are still visible, showing much of the surface is unchanged after experiments. The surfaces of all three sample types were largely intact—no significant pits or spots, and surface uniformity was generally maintained.
In contrast, all samples from chloride salt experiments showed an uneven buildup of material on the surface. Rough, bumpy features between 1 and 5 μm could be seen on the surfaces of samples from LiCl experiments. Cracking and degradation of the surface buildup were clearly visible on the surfaces of Al alloy samples from CaCl2 experiments.
FESEM-EDX was utilized to analyze the elemental composition of sample surfaces. Experiments in CH3COOK showed relatively homogenous corroded surfaces, as shown in Figure 8. For Cu and Al alloys in CH3COOK, FESEM-EDX data primarily showed the composition of the metallic substrate, as illustrated in Figure 8. The presence of small O peaks in the spectra of the Al alloys may be due to alumina formation during the corrosion test, although we cannot definitively rule out that these peaks arise from other species such as Al(OH)3. In contrast, the spectra for C12200 in CH3COOK did not show any O peaks, while those in chloride salts did, as illustrated in Figure 9.
For Al3003 in chloride salts, the surface presented different compositions at different locations, as illustrated in Figure 10. Notably, in some places, Al metal dominated the composition. In others, Cl and O were present. Similarly, for Al1100 in LiCl solutions, compositions vary, as can be seen in Figure 11. This is consistent with pitting corrosion, in which accelerated corrosion at specific locations results in an inhomogeneous sample surface. For Al1100 in CaCl2, the surface composition appeared to be more homogenous, though significantly cracked and without metallic luster.
For all experiments with C12200, ICP-MS showed that salt solutions contained similar amounts of Cu after experiments, with concentrations ranging from 302 to 490 mg·L−1. There was no observable trend differentiating the amount of Cu present in CH3COOK vs. chloride salt solutions.
For CH3COOK solutions in which Al alloys had been evaluated, concentrations of up to nearly 1 g·L−1 Al metal were observed. No Al was detectable in chloride salt solutions in which Al alloys had been evaluated. However, a grey solid which could not be redissolved into solution was observed in both chloride salt solutions during evaluation of Al alloys at temperatures of 80 °C and above. A photograph of an experiment during which this solid corrosion product appeared in the CaCl2 solution is shown in Figure 12.
ICP-MS analysis of this sample showed that it was primarily composed of Al and Ca, with a ratio of approximately 2:1 by weight. Interestingly, Si and B, minor alloying metals, were also detected in the solid corrosion product. This suggests that Al alloys in salt solutions may corrode through the formation of solid corrosion products. This makes them less favorable for use in LDAC systems; large concentrations of particulates cannot be tolerated, as they may lead to clogging and hazardous operating conditions.
For solutions in which Al alloys were evaluated, minor amounts of alloying elements, including Ti, Fe, Mo, and Zn, were also present in amounts ranging from 41.3 to 118 mg·L−1. No trends in the amounts of these materials present in different types of solution were apparent. For LiCl and CH3COOK solutions in which Al alloys were evaluated, between 376 and 1920 mg·L−1 of the alloying element B was observed. There was significantly more Al dissolution in LiCl solutions than in CH3COOK. Interestingly, there was no detectable B in solutions of CaCl2 in which Al alloys had been evaluated. However, this is consistent with the identification of B in the precipitate that was observed in CaCl2 solutions.

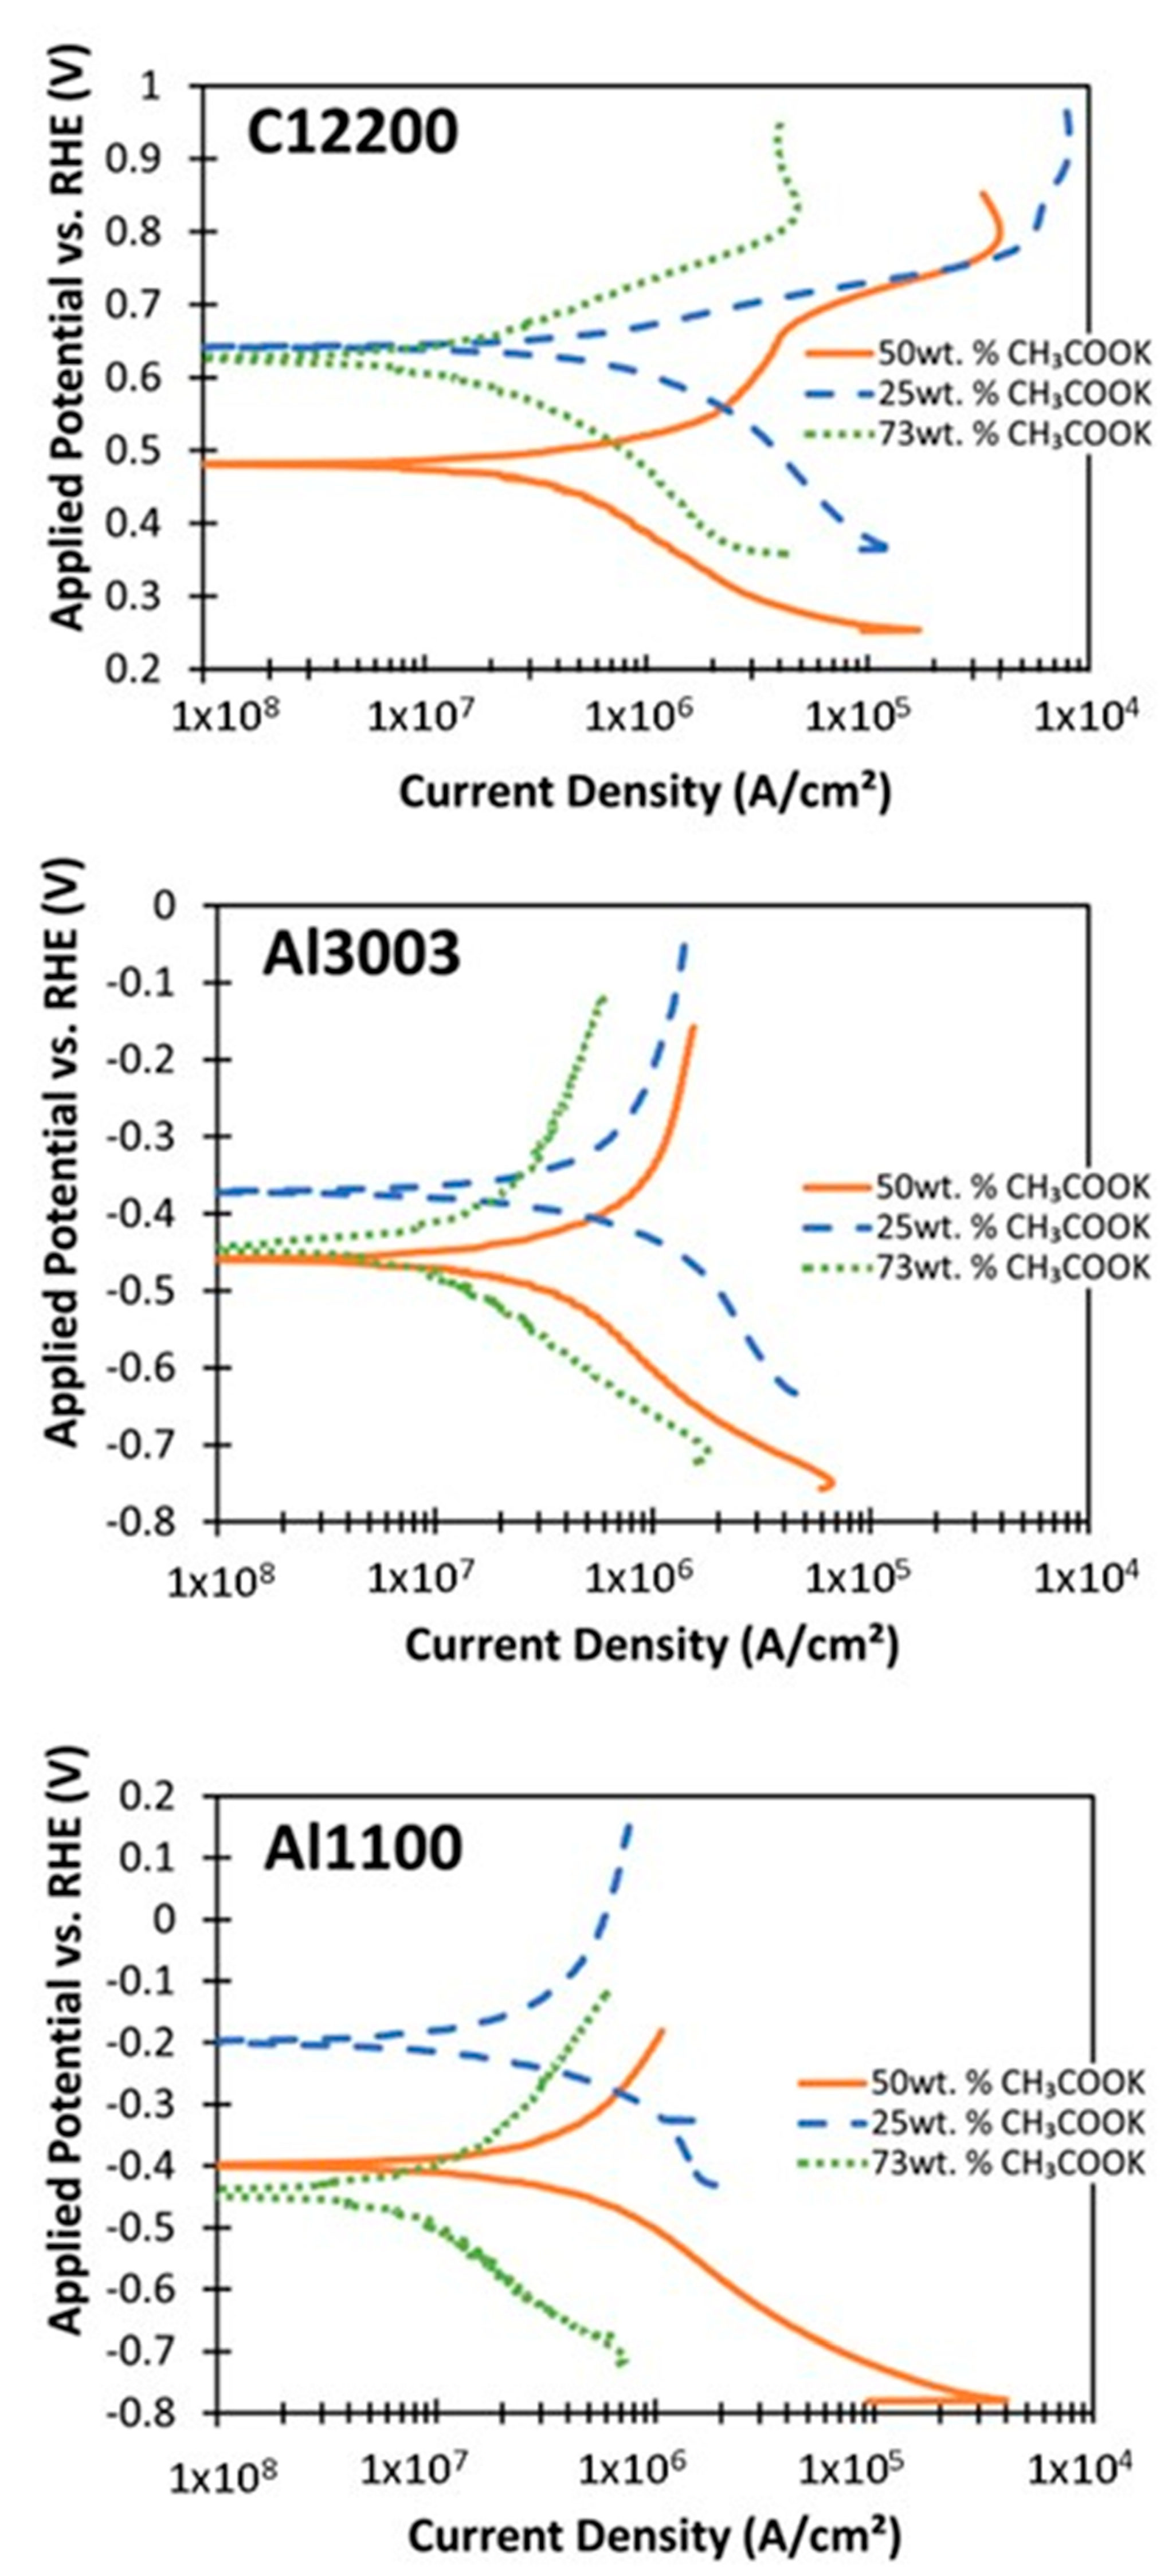
4.3. Corrosion in CH3COOK under Varied Conditions

The corrosion behavior of alloys in CH3COOK solutions was evaluated under a broader range of conditions that may be relevant to LDAC system operation. For one set of experiments, we varied concentration. In a second set of experiments, we investigated a range of pH values. The results of these evaluations are given in Table 3.
The results at varied concentrations are illustrated in Figure 13. These results are important because the concentration of the desiccant changes during the operation of liquid desiccant dehumidification and air-conditioning systems as moisture is absorbed and rejected [21]. A distinct difference in icorr at 25 wt. % versus 50 wt. % was not apparent. Interestingly, the saturated solutions (73 wt. % CH3COOK) demonstrated the lowest icorr in all cases. Study into this phenomenon is ongoing. We note that similar effects have been observed for corrosion inhibitors—including acetate salts—which aggregate on surfaces and protect them from corrosion [31,35,36]. Cano et al. have suggested that Cu(OH)(CH3COO)2·2H2O may form a protective layer on Cu surfaces in the presence of acetate and protect surfaces from corrosion [37]. Further work may allow us to determine whether potassium acetate functions similarly in this case.
Unlike concentration, there was no general trend for the effect of pH on icorr for Al alloy samples over the pH range that was investigated in this study, from pH 6.6 to pH 11.3. While the literature suggests that at low pH, potassium acetate solutions form acetic acid, which can accelerate corrosion, this does not appear to have a significant effect at pH 6.6 [29].
The literature also indicates that under alkaline conditions, pitting can occur, accelerating corrosion. However, this effect was not observed at pH 11.3. Higher pH was avoided because substances at high pH (> 11.5) are considered hazardous and therefore avoided for building applications [38].
Similarly, no pH-dependent trend was observed for C12200 samples. However, we note that for C12200 samples, it appeared that un-modified 50 wt. % CH3COOK at a mid-range pH of around 9.8 had the lowest icorr, and samples with a pH of 6.6 had the highest.
Cu is known to corrode in acetic acid via the formation of corrosion products such as Cu2O, Cu(OH)2, and Cu(CH3COO)2 [37,39]. This corrosion may be uniform or, in more acidic environments, may follow an ant nest corrosion (ANC) mechanism [37] depending on how concentrated the acidic environment is. At pH 6.6, C12200 in potassium acetate solution appears to exhibit uniform corrosion (see optical microscope and SEM data, Figure 6 and Figure 7), consistent with expected behavior in weakly acidic conditions. A mechanism based on the formation of these oxygenated Cu species may play a role in the increased corrosion behavior at pH 6.6 versus higher pH.
In contrast, for Al samples, higher CRs were observed at pH 11.3, and relatively low CRs were observed at pH 6.6. The higher CR at higher pH is likely attributable to the fact that above pH 9, the protective native alumina layers naturally present on Al and Al alloys are not thermodynamically stable, and an additional corrosion mechanism governed by the anodic dissolution of Al(OH)4 is present [40].
CRs in LiCl and CaCl2 solutions were consistently higher than CRs in CH3COOK management costs or additional thickness of material added to compensate solutions. For C12200 metal, CRs were lower in both LiCl and CaCl2 solutions at lower temperatures, but at 120 °C were higher by an order of magnitude. Al1100 showed slightly better performance than Al3003, with lower CRs, both LiCl and CaCl2 solutions at 23 °C, but with much higher CRs at 80 °C and 120 °C. Al3003 had relatively high CR in chloride salt solutions at all temperatures.
The corroded samples were metallographically characterized using an optical microscope and FESEM-EDX for surface morphology and composition evaluation. Imaging revealed evidence of pitting corrosion for samples in chloride salt solutions. Intergranular and pitting corrosion, as observed in both chloride salt solutions, can be catastrophic to the structural integrity of metallic components and could potentially lead to device failure. It is important to note that CR measurements inherently cannot quantify localized corrosion behavior such as pitting; CR may therefore underestimate the corrosivity of chloride salt solutions. The salt solutions were also analyzed after electrochemical experiments with ICP-MS.

5. Conclusions

Key findings of this research include (1) that metallic samples in CH3COOK solutions exhibit CRs of tens of micrometers per year or less, (2) that the CRs of metallic samples in CH3COOK solutions are lower than the CRs in chloride salt solutions by up to several orders of magnitude, and (3) CH3COOK solutions exhibit uniform corrosion behavior, whereas both chloride salt solutions show evidence of localized corrosion (intergranular or pitting).
These results suggest that CH3COOK solutions are much less corrosive than chloride salt solutions and are a strong candidate for use in LDAC systems with metallic components. To contextualize the CR values obtained in this study, consider that the sheet metal components of air conditioning systems are often between 127 and 250 μm (0.005″ and 0.01″) thick, with desired operational lifetimes of 20–30 years. The CR data here indicate that Al components could corrode completely in less than a year in chloride salt solutions. Pitting and intragranular corrosion observed in chloride salt solutions could lead to localized failure in even less time. Finally, the formation of solid corrosion products could clog components and pumps. Thus, the data confirm and quantify that chloride-salt-based desiccants are not compatible with metal or metal alloy components and therefore necessitate the use of undesirable plastic components.
In contrast, metallic samples tested in CH3COOK solutions exhibit lower CRs, little or no localized corrosion, and do not form solid corrosion products. Specifically, CRs are up to two orders of magnitude lower than CRs in chloride salt solutions, which could lead to component lifetimes that are longer by years or even decades. Analysis of potentiodynamic polarization curves indicates that, in contrast to chloride salt solutions, pitting corrosion does not occur for Cu or Al alloys in CH3COOK solutions. Instead, corrosion of Cu and Al alloys in CH3COOK solutions occurs primarily through the slow, uniform dissolution of metals into solution, as evidenced by electrochemical evaluation and by optical microscopic and FESEM evaluation of metal and alloy samples and ICP-MS evaluation of salt solutions after corrosion experiments. Based on these findings, it is possible that in CH3COOK, metal components could approach their desired operational lifetimes under idealized conditions. To further reduce corrosion of metallic components in CH3COOK solutions, especially at high temperatures, relatively facile corrosion mitigation strategies could be applied to lower CRs even further. Ongoing related work is focused on the use of corrosion inhibitors.
Ultimately, we conclude that CH3COOK solutions are candidates for use with metal and metal alloy components in LDAC systems. We assert that the further study of CH3COOK as a liquid desiccant for LDAC systems is warranted and are undertaking studies, including investigation of the rheological characteristics of CH3COOK (such as surface tension and viscosity), studying the thermophysical properties of CH3COOK (such as regeneration behavior, vapor pressure, and hygroscopicity), and investigating the use of CH3COOK in LDAC systems at a laboratory scale.

Author Contributions

K.C.R. and E.V. contributed to all work reported here. They contributed equally to this work. R.B. assisted in development of electrochemical methods. K.G. conducted FESEM and FESEM-EDX. J.V. assisted in method development. E.K. determined experimental parameters relevant to LDAC systems and assisted in experimental matrix development. All authors have read and agreed to the published version of the manuscript.

Funding

The work of Emily Volk was supported by the Mines/NREL Advanced Energy Systems Graduate Program. This work was also supported in part by the U.S. Department of Energy, Office of Science, Office of Workforce Development for Teachers and Scientists (WDTS) under the Science Undergraduate Laboratory Internships (SULI) and Community College Internships (CCI) programs. Finally, this work was supported in part by the Wells Fargo Innovation Incubator (IN2) and by Blue Frontier.

Institutional Review Board Statement

Not applicable.

Informed Consent Statement

Not applicable.

Data Availability Statement

Not applicable.

Acknowledgments

We thank Bobby To for his assistance with FESEM and FESEM-EDX.

Conflicts of Interest

The authors declare no conflict of interest. The funders had no role in the design of the study; in the collection, analyses, or interpretation of data; in the writing of the manuscript, or in the decision to publish the results.

References

  1. Odukomaiya, A.; Woods, J.; James, N.; Kaur, S.; Gluesenkamp, K.R.; Kumar, N.; Mumme, S.; Jackson, R.; Prasher, R. Addressing energy storage needs at lower cost via on-site thermal energy storage in buildings. Energy Environ. Sci. 2021, 14, 5315–5329. [Google Scholar] [CrossRef]
  2. International Energy Agency. The Future of Cooling; International Energy Agency: Paris, France, 2018.
  3. Lowenstein, A.; Slayzak, S.; Ryan, J.; Pesaran, A. Advanced Commercial Liquid-Desiccant Technology Development Study; National Renewable Energy Lab. (NREL): Golden, CO, USA, 1998.
  4. Woods, J.; Kozubal, E. Combining liquid desiccant dehumidification with a dew-point evaporative cooler: A design analysis. HVAC&R Res. 2013, 19, 663–675. [Google Scholar]
  5. Eric Kozubal, J.W.; Judkoff, R. Development and Analysis of Desiccant Enhanced Evaporative Air Conditioner Prototype; National Renewable Energy Lab. (NREL): Golden, CO, USA, 2012.
  6. Kian Jon, C.; Islam, M.R.; Kim Choon, N.; Shahzad, M.W. Future of Air Conditioning. In Advances in Air Conditioning Technologies: Improving Energy Efficiency; Kian Jon, C., Islam, M.R., Kim Choon, N., Shahzad, M.W., Eds.; Springer: Singapore, 2021; pp. 17–52. [Google Scholar]
  7. Cheng, Q.; Zhang, X. Review of solar regeneration methods for liquid desiccant air-conditioning system. Energy Build. 2013, 67, 426–433. [Google Scholar] [CrossRef]
  8. Koronaki, I.P.; Christodoulaki, R.I.; Papaefthimiou, V.D.; Rogdakis, E.D. Thermodynamic analysis of a counter flow adiabatic dehumidifier with different liquid desiccant materials. Appl. Therm. Eng. 2013, 50, 361–373. [Google Scholar] [CrossRef]
  9. Mujahid Rafique, M.; Gandhidasan, P.; Ibrahim, N.I.; Bahaidarah, H.M. Recent Developments in Liquid Desiccant-Based Cooling Systems. In Encyclopedia of Sustainable Technologies; Abraham, M.A., Ed.; Elsevier: Oxford, UK, 2017; pp. 441–453. [Google Scholar]
  10. Liu, X.; Qu, M.; Liu, X.; Wang, L. Membrane-based liquid desiccant air dehumidification: A comprehensive review on materials, components, systems and performances. Renew. Sustain. Energy Rev. 2019, 110, 444–466. [Google Scholar] [CrossRef]
  11. Chen, Y.; Yin, Y.; Zhang, X. Performance analysis of a hybrid air-conditioning system dehumidified by liquid desiccant with low temperature and low concentration. Energy Build. 2014, 77, 91–102. [Google Scholar] [CrossRef]
  12. de Lucas, A.; Donate, M.; Rodríguez, J.F. Vapour pressures, densities, and viscosities of the (water+lithium bromide+potassium acetate) system and (water+lithium bromide + sodium lactate) system. J. Chem. Thermodyn. 2006, 38, 123–129. [Google Scholar] [CrossRef]
  13. Donate, M.; Rodriguez, L.; Lucas, A.D.; Rodríguez, J.F. Thermodynamic evaluation of new absorbent mixtures of lithium bromide and organic salts for absorption refrigeration machines. Int. J. Refrig. 2006, 29, 30–35. [Google Scholar] [CrossRef]
  14. Salikandi, M.; Ranjbar, B.; Shirkhan, E.; Shanmuga Priya, S.; Thirunavukkarasu, I.; Sudhakar, K. Recent trends in liquid desiccant materials and cooling systems: Application, performance and regeneration characteristics. J. Build. Eng. 2021, 33, 101579. [Google Scholar] [CrossRef]
  15. Watanabe, H.; Komura, T.; Matsumoto, R.; Ito, K.; Nakayama, H.; Nokami, T.; Itoh, T. Design of ionic liquids as liquid desiccant for an air conditioning system. Green Energy Environ. 2019, 4, 139–145. [Google Scholar] [CrossRef]
  16. Wen, T.; Lu, L.; Li, M.; Zhong, H. Comparative study of the regeneration characteristics of LiCl and a new mixed liquid desiccant solution. Energy 2018, 163, 992–1005. [Google Scholar] [CrossRef]
  17. Wen, T.; Lu, L.; Nie, Y.; Zhong, H. Development and investigation on the dehumidification and corrosion resistance performance of a new mixed liquid desiccant. Int. J. Heat Mass Transf. 2019, 130, 72–82. [Google Scholar] [CrossRef]
  18. Bouzenada, S.; Kaabi, A.N.; Frainkin, L.; Salmon, T.; Léonard, A. Experimental Comparative Study on Lithium Chloride and Calcium Chloride Desiccants. Procedia Comput. Sci. 2016, 83, 718–725. [Google Scholar] [CrossRef] [Green Version]
  19. Lowenstein, A.; Miller, J.A.; Hermans, T. LDDX: A High Efficiency Air Conditioner for DOD Buildings; AIL Research, Inc.: Hopewell, NJ, USA, 2017. [Google Scholar]
  20. Gomez-Vidal, J.C.; Tirawat, R. Corrosion of alloys in a chloride molten salt (NaCl-LiCl) for solar thermal technologies. Sol. Energy Mater. Sol. Cells 2016, 157, 234–244. [Google Scholar] [CrossRef] [Green Version]
  21. Shinagawa, T.; Garcia-Esparza, A.T.; Takanabe, K. Insight on Tafel slopes from a microkinetic analysis of aqueous electrocatalysis for energy conversion. Sci. Rep. 2015, 5, 13801. [Google Scholar] [CrossRef] [PubMed] [Green Version]
  22. McCafferty, E. Validation of corrosion rates measured by the Tafel extrapolation method. Corros. Sci. 2005, 47, 3202–3215. [Google Scholar] [CrossRef]
  23. Perez, T.E. Corrosion in the Oil and Gas Industry: An Increasing Challenge for Materials. JOM 2013, 65, 1033–1042. [Google Scholar] [CrossRef] [Green Version]
  24. Finšgar, M.; Jackson, J. Application of corrosion inhibitors for steels in acidic media for the oil and gas industry: A review. Corros. Sci. 2014, 86, 17–41. [Google Scholar] [CrossRef] [Green Version]
  25. Espinosa-Medina, M.A.; Carbajal-De la Torre, G.; Liu, H.B.; Martínez-Villafañe, A.; González-Rodriguez, J.G. Hot corrosion behaviour of Fe–Al based intermetallic in molten NaVO3 salt. Corros. Sci. 2009, 51, 1420–1427. [Google Scholar] [CrossRef]
  26. Rapp, R.A.; Zhang, Y.-S. Hot corrosion of materials: Fundamental studies. JOM 1994, 46, 47–55. [Google Scholar] [CrossRef]
  27. Gamry. Getting Started with Electrochemical, Corrosion Measurements; Gamry: Warminster, PA, USA, 2011. [Google Scholar]
  28. Tabrizi, M.R.; Lyon, S.B.; Thompson, G.E.; Ferguson, J.M. The long-term corrosion of aluminium in alkaline media. Corros. Sci. 1991, 32, 733–742. [Google Scholar] [CrossRef]
  29. Adams, F.V.; Akinwamide, S.O.; Obadele, B.; Olubambi, P.A. Comparison study on the corrosion behavior of aluminum alloys in different acidic media. Mater. Today Proc. 2021, 38, 1040–1043. [Google Scholar] [CrossRef]
  30. Paz Martínez-Viademonte, M.; Abrahami, S.T.; Hack, T.; Burchardt, M.; Terryn, H. A Review on Anodizing of Aerospace Aluminum Alloys for Corrosion Protection. Coatings 2020, 10, 1106. [Google Scholar] [CrossRef]
  31. Xhanari, K.; Finšgar, M.; Knez Hrnčič, M.; Maver, U.; Knez, Ž.; Seiti, B. Green corrosion inhibitors for aluminium and its alloys: A review. RSC Adv. 2017, 7, 27299–27330. [Google Scholar] [CrossRef]
  32. Xhanari, K.; Finšgar, M. Organic corrosion inhibitors for aluminum and its alloys in chloride and alkaline solutions: A review. Arab. J. Chem. 2019, 12, 4646–4663. [Google Scholar] [CrossRef]
  33. Frankel, G.S. Pitting Corrosion of Metals A Review of the Critical Factors. J. Electrochem. Soc. 1998, 145, 2186–2198. [Google Scholar] [CrossRef]
  34. Akpanyung, K.; Loto, R. Pitting corrosion evaluation: A review. J. Phys. Conf. Ser. 2019, 1378, 022088. [Google Scholar] [CrossRef]
  35. Chernova, G.P.; Kornienko, L.P. Effect of inhibiting additives on the electrochemical behavior of AMg-6 alloy in aqueous potassium acetate solutions at elevated temperatures. Prot. Met. Phys. Chem. Surf. 2010, 46, 354–358. [Google Scholar] [CrossRef]
  36. Ahangar, M.; Izadi, M.; Shahrabi, T.; Mohammadi, I. The synergistic effect of zinc acetate on the protective behavior of sodium lignosulfonate for corrosion prevention of mild steel in 3.5 wt% NaCl electrolyte: Surface and electrochemical studies. J. Mol. Liq. 2020, 314, 113617. [Google Scholar] [CrossRef]
  37. Cano, E.; Bastidas, J.M.; Polo, J.L.; Mora, N. Study of the Effect of Acetic Acid Vapor on Copper Corrosion at 40 and 80% Relative Humidity. J. Electrochem. Soc. 2001, 148, B431. [Google Scholar] [CrossRef]
  38. Occupational Safety and Health Administration. Hazard Classification Guidance for Manufacturers, Importers, and Employers; U.S. Department of Labor: Washington, DC, USA, 2016.
  39. Liu, X.; Li, H.; Zhao, X.; Chen, Y.; Wang, S. Comparison of the corrosion behavior of copper tubes in formic acid and acetic acid environment. Mater. Corros. 2021, 72, 1919–1927. [Google Scholar] [CrossRef]
  40. Wysocka, J.; Cieslik, M.; Krakowiak, S.; Ryl, J. Carboxylic acids as efficient corrosion inhibitors of aluminium alloys in alkaline media. Electrochim. Acta 2018, 289, 175–192. [Google Scholar] [CrossRef]
Figure 1. (A) Schematic of the electrochemical cell utilized to perform electrochemical corrosion evaluation. This is a three-electrode setup utilizing a reference hydrogen electrode (RHE), a platinum mesh counter electrode (CE), and a working electrode (WE) made of the metal or metal alloy sample. (B) Examples of the front (top) and back (bottom) of the WEs that were fabricated for these experiments.
Energies 15 04421 g001
Figure 2. Example of a polarization curve. Green curve is the result of a potentiodynamic polarization experiment, orange and blue lines are the fit of the anodic and cathodic Tafel lines, respectively.
Energies 15 04421 g002
Figure 3. Three replicates of an electrochemical evaluation of C12200 in 50 wt. % CH3COOK at 80 °C, illustrating good reproducibility of icorr and corrosion behavior in the Tafel region.
Energies 15 04421 g003
Figure 4. Corrosion rates of metal alloy samples in liquid desiccant solutions at various temperatures. In all cases, corrosion rates in CH3COOK were lower than in chloride salts.
Energies 15 04421 g004
Figure 5. Examples of potentiodynamic polarization curves used to evaluate corrosion behavior of metal alloy samples in various liquid desiccants. Data shown is for experiments at 80 °C.
Energies 15 04421 g005
Figure 6. Images of WE surfaces after electrochemical corrosion experiments at 80 °C. Images were taken using an optical microscope.
Energies 15 04421 g006
Figure 7. FESEM top-view micrographs of the WE surfaces after electrochemical corrosion experiments.
Energies 15 04421 g007
Figure 8. FESEM-EDX surface analysis of samples after electrochemical corrosion experiment in 50% CH3COOK solution at 80 °C.
Energies 15 04421 g008
Figure 9. FESEM-EDX surface analysis of C12200 samples after electrochemical corrosion experiment in 30 wt. % LiCl solution and 40 wt. % CaCl2 solution at 80 °C. The surface composition was relatively homogenous, primarily composed of Cu, with some evidence of oxide formation.
Energies 15 04421 g009
Figure 10. FESEM-EDX surface analysis of Al 3003 samples after electrochemical corrosion experiment in 30 wt. % LiCl solution and 40 wt. % CaCl2 solution at 80 °C. The composition of the surface varied.
Energies 15 04421 g010
Figure 11. FESEM-EDX surface analysis of Al 1100 samples after electrochemical corrosion experiment in 30 wt. % LiCl solution and 40 wt. % CaCl2 solution at 80 °C. The composition of the surface varied.
Energies 15 04421 g011
Figure 12. Example of precipitation observed in CaCl2 after electrochemical corrosion experiments (pictured with CE still immersed in solution; RHE and WE removed).
Energies 15 04421 g012
Figure 13. Potentiodynamic polarization curves for CH3COOK solutions of different concentrations. Experiments were performed at 23 °C.
Energies 15 04421 g013
Table 1. Densities, equivalent weights, and composition of Cu and Al alloys. Compositions listed are maximum wt. % unless range is indicated.
Metal/AlloyC12200Al3003Al1100
Density (g/cm3)8.962.732.71
Equivalent Weight (g)31.789.459.14
Typical Composition (wt. %)99.9 Cu
0.015–0.040 P
98.6 Al
0.05–0.2 Cu
1.0–1.5 Mn
0.7 Fe
0.6 Si
0.10 Zn
0.15 other
99 Al
0.02–0.05 Cu
0.05 Mn
0.95 Si + Fe
0.10 Zn
0.15 other
Table 2. Comparison of corrosion in different liquid desiccant solutions.
SampleConditionsOCP vs. RHE (mV)Ecorr vs. RHE (mV)jcorr (µA/cm2)CR (µm/Year)
LiCl
C1220023 °C, 30 wt. %237 ± 14197 ± 81.56 ± 0.0318.1 ± 0.4
C1220080 °C, 30 wt. %−8.00 ± 0.48−28.6 ± 1.15.31 ± 0.1161.7 ± 1.3
C12200120 °C, 30 wt. %−18.0 ± 1.1−43.1 ± 1.712.2 ± 0.3141 ± 3
Al300323 °C, 30 wt. %−542 ± 87−704 ± 1133.93 ± 2.3345.6 ± 27.1
Al300380 °C, 30 wt. %−446 ± 72−440 ± 7112.1 ± 7.2141 ± 84
Al3003120 °C, 30 wt. %−516 ± 83−509 ± 8259.9 ± 35.6696 ± 413
Al110023 °C, 30 wt. %−515 ± 148−672 ± 2360.785 ± 0.1329.11 ± 1.53
Al110080 °C, 30 wt. %−434 ± 125−416 ± 14613.3 ± 2.2155 ± 26
Al1100120 °C, 30 wt. %−453 ± 130−407 ± 14367.5 ± 11.4783 ± 132
CaCl2
C1220023 °C, 40 wt. %248 ± 15209 ± 85.89 ± 0.1268.4 ± 1.4
C1220080 °C, 40 wt. %8.00 ± 0.48−33.9 ± 1.31.56 ± 0.0318.1 ± 0.4
C12200120 °C, 40 wt. %−25.0 ± 1.5−34.7 ± 1.412.7 ± 0.3147 ± 3
Al300323 °C, 40 wt. %−289 ± 46−287 ± 462.26 ± 1.3426.3 ± 15.6
Al300380 °C, 40 wt. %−406 ± 65−425 ± 681.41 ± 0.8416.4 ± 9.7
Al3003120 °C, 40 wt. %−484 ± 78-480 ± 7756.7 ± 33.7658 ± 391
Al110023 °C, 40 wt. %−415 ± 119−354 ± 1250.646 ± 0.1097.50 ± 1.26
Al110080 °C, 40 wt. %−405 ± 116−460 ± 1626.00 ± 1.0169.6 ± 11.7
Al1100120 °C, 40 wt. %−518 ± 149−515 ± 18134.4 ± 5.8399 ± 67
CH3COOK
C1220023 °C, 50 wt. %551 ± 33481 ± 190.329 ± 0.0073.82 ± 0.08
C1220080 °C, 50 wt. %671 ± 40645 ± 250.669 ± 0.0147.77 ± 0.16
C12200120 °C, 50 wt. %721 ± 43566 ± 223.01 ± 0.0634.9 ± 0.7
Al300323 °C, 50 wt. %−458 ± 74−457 ± 730.272 ± 0.1613.15 ± 1.87
Al300380 °C, 50 wt. %−373 ± 60−394 ± 636.97 ± 4.1480.9 ± 48.0
Al3003120 °C, 50 wt. %−332 ± 53−337 ± 5417.7 ± 10.5205 ± 122
Al110023 °C, 50 wt. %−482 ± 138−396 ± 1390.321 ± 0.0543.73 ± 0.63
Al110080 °C, 50 wt. %−176 ± 51−191 ± 670.516 ± 0.0875.99 ± 1.01
Al1100120 °C, 50 wt. %−281 ± 81−311 ± 11029.4 ± 5.0342 ± 58
Table 3. Variation of experimental conditions for corrosion experiments in CH3COOK.
SampleConditionsOCP vs. RHE (mV)Ecorr vs. RHE (mV)jcorr (µA/cm2)CR (mm/year)
CH3COOK, 23 °C
C1220073 wt. %657 ± 40624 ± 250.104 ± 0.0021.20 ± 0.03
Al300373 wt. %−423 ± 68−446 ± 720.0878 ± 0.05211.02 ± 0.61
Al110073 wt. %−420 ± 121−446 ± 1570.0642 ± 0.01080.745 ± 0.126
C1220025 wt. %663 ± 40643 ± 250.387 ± 0.0084.49 ± 0.09
Al300325 wt. %−334 ± 54−369 ± 590.619 ± 0.3687.19 ± 4.27
Al110025 wt. %−132 ± 38−201 ± 700.176 ± 0.0302.04 ± 0.34
CH3COOK, 50 wt. %, 23 °C
C12200pH 11.3705 ± 42679 ± 270.802 ± 0.0179.31 ± 0.20
Al3003pH 11.3−539 ± 87−559 ± 901.20 ± 0.7113.9 ± 8.3
Al1100pH 11.3−425 ± 122−483 ± 1700.731 ± 0.1238.48 ± 1.43
C12200pH 6.6442 ± 27417 ± 161.36 ± 0.0315.8 ± 0.3
Al3003pH 6.619.0 ± 3.119.9 ± 3.20.0802 ± 0.04760.931 ± 0.553
Al1100pH 6.6−21.0 ± 6.09.58 ± 3.370.436 ± 0.0745.06 ± 0.85
Publisher’s Note: MDPI stays neutral with regard to jurisdictional claims in published maps and institutional affiliations.

