Article

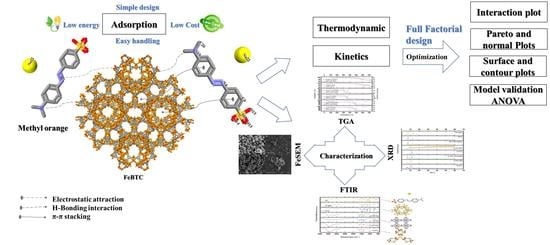
Parametric Study of Methyl Orange Removal Using Metal–Organic Frameworks Based on Factorial Experimental Design Analysis

1
Department of Chemical Engineering, American University of Sharjah, Sharjah P.O. Box 26666, United Arab Emirates
2
Department of Chemical Engineering, McMaster University, Hamilton, ON L8S 4L8, Canada
3
Department of Chemistry, Biology and Environmental Sciences, American University of Sharjah, Sharjah P.O. Box 26666, United Arab Emirates
*
Author to whom correspondence should be addressed.
Energies 2022, 15(13), 4642; https://doi.org/10.3390/en15134642
Submission received: 3 May 2022 / Revised: 26 May 2022 / Accepted: 1 June 2022 / Published: 24 June 2022
(This article belongs to the Topic Sustainable Environmental Technologies)

Abstract

:
Wastewater treatment plants (WWTPs) are one of the most energy-intensive industries. Every stage of wastewater treatment consumes energy, which is the primary contributor to WWTP costs. Adsorbents and process optimization are critical for energy savings. The removal of dyes from industrial wastewater by adsorption using commercially available adsorbents is inefficient. Metal–organic frameworks (MOFs) have outstanding properties that can improve separation performance over current commercial adsorbents, and thus, these materials represent a milestone in improving dye removal in water treatment methods. In this work, three types of metal–organic frameworks (Fe-BTC, Cu-BTC, and ZIF-8) have been investigated as prospective adsorbents for methyl orange removal from water in batch setups. The results showed that at 15 mg/L MO initial concentration and 100 mg dosage, Fe-BTC had the highest removal efficiency of 91%, followed by ZIF-8 (63%), and finally Cu-BTC (35%), which exhibited structural damage due to its instability in water. Fe-BTC maintained consistent adsorption capacity over a wide range of pH values. Furthermore, a 23 full factorial design analysis was implemented to evaluate the conditions for maximum MO-removal efficiency. The main effects, interaction effects, analysis of variance (ANOVA), and the Pareto chart were reported. The statistical analysis demonstrated that the MOF type was the most significant factor, followed by dosage and initial concentration. The analysis indicated that the type of MOF and dosage had a positive effect on the removal efficiency, while the initial concentration had a negative effect. The two-way and three-way interactions were also found to be significant.

Graphical Abstract

1. Introduction

Along with energy demand in highly urbanized and industrialized countries, population growth has led to higher demand for clean water supply and higher production of wastewater. In order to maintain the ecological status of water resources, produced wastewater requires adequate treatment before being safely discharged into the receiving water bodies [1,2,3]. Therefore, the number of wastewater collection and treatment plants has increased in communities [4], leading to countless plants operating throughout the world [5]. Wastewater treatment plants (WWTPs) are among the most energy-intensive industries. In 2014, the global energy demand for the water sector was estimated at 120 million tons of oil, which corresponds to 1395.6 TW-h, and projections estimate this value to double before 2040 [6,7,8,9]. This increase in energy consumption leads to significant growth in operational costs and to considerable boost in CO2 emissions of wastewater treatment plants [10,11]. Therefore, the need to protect the environment from fossil fuel emissions and to have effective treatment of these industrial wastewaters before they are discharged into the environment necessitates the development of robust, economically feasible, environment-friendly, and energy-efficient solutions to be implemented for wastewater treatment industries [12].
One major component of industrial wastewater effluents is the discharge of a substantial amount of synthetic dyes due to their wide-ranging applications, including in textiles, printing, plastic, and food processing [13,14]. To prevent any potential hazards caused by these dyes to the surrounding environment of aquatic life and humans [15], industrial wastewater effluents are usually treated by several physical and/or chemical treatment processes to remove these synthetic dyes [16]. These treatments include flocculation combined with flotation, electroflocculation, membrane filtration, electrokinetic coagulation, electrochemical destruction, and ion exchange [17,18]. However, these technologies have several limitations, including low removal efficiencies, high cost, complexity of operation, high energy demand, and sensitivity to variations in wastewater influent [19]. In comparison to these techniques, however, adsorption is more effective and energy-efficient. Its low cost, simple design, easy handling, and sludge-free cleaning operations have proven that the adsorption technique is a preferred technique, especially for the removal of synthetic dyes from wastewater [18,19,20]. Adsorption is based on the binding of the soluble pollutant in wastewater (e.g., dye) to an insoluble adsorbent, which is then removed from the wastewater by filtration or precipitation, taking with it the adsorbed pollutant. The adsorbent can be regenerated and used for another cycle of the adsorption process.
Currently, beyond silica gel, other widely used adsorbents which rely on physical adsorption for water removal are zeolites, activated alumina, and activated carbon. Although all of them can be easily regenerated at a relatively low temperature, their main drawback is their limited adsorption capacity [20,21]. Traditionally, activated carbon (AC) is used as an adsorbent for quickly capturing dyes from wastewater and lowering their concentration in effluents. However, AC as an adsorbent generally shows very little selectivity over molecules of different sizes and has a high regeneration cost when exhausted [16]. Therefore, the development of efficient and cost-effective adsorbents is urgently needed.
Recently, metal–organic frameworks (MOFs) came into view as promising adsorbents. MOFs are porous solid materials comprised of metal clusters (blocks) connected by organic ligands via coordination bonds and have exceptional adsorbent properties that make them superior to other conventional porous solids [22]. Haque et al. (2010) were the first group to report the adsorptive removal of dyes using MOFs, where they employed chromium–benzene dicarboxylates MOFs (Cr-BDCs) for methyl orange (MO) adsorption [22]. Since then, several investigators have reported their findings on the removal of different dyes using various lab-synthesized MOFs as adsorbents [14,15,16,17,18,19,20,21,22,23,24,25,26]—for example, iron 1,3,5-benzenetricarboxylate (Fe-BTC) MOF, has been used in the liquid-phase separation of various molecules/compounds (organic and inorganic) [27,28]. Similarly, copper benzene-1,3,5-tricarboxylate (Cu-BTC) is a widely investigated MOF in different environmental applications, such as gas storage and adsorptive separation [29,30], and was used for methylene blue adsorption from water [31]. Additionally, 2-methylimidazole zinc salt (ZIF-8) was reported to exhibit high thermal stability up to 400 °C and excellent chemical stability in liquid-phase adsorption [32]. Recently, a new study investigated the development of new surfactant-modified carbon-coated monolith for the adsorption of cationic dyes. The results showed that the new material is suitably adsorbent for rapid and effective decolorization of methylene blue, with a high adsorption capacity of 200 mg/g [33,34].
The fact that MOFs have higher adsorption capacity, less energy-intensive regeneration conditions, and higher recyclability in comparison to other adsorbents makes them ideal energy-efficient adsorbents. However, for MOFs to be implemented for large-scale wastewater treatment plants, better assessment tools to compare MOFs with other adsorbents—emphasizing the energy-saving factor—are needed. Thus, we report herein the use of “design of experiment” (DOE) analysis to determine the optimal conditions for the adsorption process of MOFs. To achieve this objective, a well-studied system of MOF/MO is used as a model system for this study. A 23 factorial design was implemented to investigate the effect of three major factors on the efficiency of the adsorption process, including (1) the type of MOF, (2) the dosage, and (3) the initial concentration on MOFs’ removal efficiency of MO. In this study, three commercially available MOFs, namely Basolite® F300 (Fe-BTC) [24], C300 (Cu-BTC or HKUST-1) [25], and Z1200 (ZIF-8) [26], were used for the adsorption of azo-anionic MO dye from aqueous solutions that are widely used in the textile, printing, pharmaceutical, and food industries.
Additionally, the effect of adsorption on the structure of the MOFs and the possible adsorption mechanism was also investigated using various characterization techniques including FTIR, XRD, SEM, and TGA. Finally, the kinetics and equilibrium isotherms of adsorption were studied, and the thermodynamic parameters of MO adsorption were calculated.
We believe that this study will contribute to the efforts to better improve the process of selecting the best MOFs as promising adsorbent candidates in terms of their optimal adsorption capacity. The adsorption of methyl orange (MO) on MOFs has been contemplated as a promising advancement in wastewater treatment. Understanding the adsorption mechanism and kinetics and their effect on removal efficiency is essential for reaching the full potential of this approach. In addition, such a comparative study of MO removal and MOFs was defined by using a full factorial design method and an analysis of variance (ANOVA) statistical approach.

2. Materials and Methods

2.1. Materials

Fe-BTC, Cu-BTC, and ZIF-8 were purchased from Sigma-Aldrich under trademark Basolite® F300, Basolite® C300, and Basolite® Z1200, respectively, and were used without further modifications. Methyl orange (MO) was purchased from LabChem (Zelienople, PA, USA) as 0.1% (1000 mg/L) stock solution, and different concentrations were obtained by subsequent dilution using deionized water. For pH adjustment, 1 M HCl and NaOH aqueous solutions were used (prepared from 37% hydrochloric acid and 98% sodium hydroxide pellets, respectively). For MOF regeneration, ethanol (99.8%, Sigma-Aldrich, St. Louis, MO, USA) was used as the eluent.

2.2. Characterization

Several characterization analyses of the MOF samples, before and after MO adsorption, were performed. First, the crystal structure was investigated via the X-ray diffraction (XRD) measurements using a Bruker D8 ADVANCE system with a Cu tube (λ = 1.5406 Å) and a linear detector (LYNXEYE XE). The measurements were obtained over a 2θ range of 50–60° (0.03° step size). The shapes and morphologies of the MOF samples before and after MO adsorption were examined via Scanning Electron Microscopy (SEM) and Transmission Electron Microscopy (TEM). In addition, the Fourier Transform Infrared (FTIR) spectra of the MOF samples were measured (KBr pellet technique) using PerkinElmer FTIR instrument (Waltham, MA, USA), and the measurement’s scanning range was 4000 to 450 cm−1 with a resolution of 1.0 cm−1. The thermogravimetric analysis (TGA) was performed using a Pyris 1 TGA instrument (PerkinElmer, Waltham, MA, USA). The temperature range was 30 °C to 700 °C and the heating rate was 10 °C·min−1. Moreover, the solid addition method was utilized to measure the surface point zero charge (pHPZC) of each MOF. The procedure is similar to what was reported in [35,36], except for the KNO3, HNO3, and KOH solutions were replaced with NaCl, HCl, and NaOH solutions, respectively.

2.3. Adsorption Experiments

For the adsorption experiments, aqueous MO solutions were first prepared by successive dilution of the 1000 mg/L stock solution with deionized water to obtain the desired initial MO concentration. In each adsorption experiment, 100–200 mg of MOF was added to 50 mL of 5–15 mg/L MO solution at a pH of 6 at room temperature (25 °C). The mixtures were mixed thoroughly with magnetic stirring in sealed beakers and samples were taken after a predetermined time (5 to 180 min). Each sample was collected using a syringe and filtered using a membrane syringe filter (0.45 µm pore size, nylon). The MO concentration in all the samples was determined by visible light spectroscopic analysis of the solutions at the characteristic MO absorbance peak (λ = 464 nm) with a UV–Vis spectrophotometer (Evolution 60s, Thermo Scientific, Waltham, MA, USA).
At any given time (t), the adsorbed MO amount per unit mass of MOF (qt) was calculated by Equation (1).
q t = ( C o C t ) × V m
where Co, Ct, V, and m are the initial MO concentration, the MO concentration in the liquid phase at time t, the MO solution’s volume, and the MOF’s dosage, respectively. Additionally, the removal efficiency (RE) was calculated using Equation (2).
R E = C o C t C o × 100
The adsorption kinetics; isotherms; and thermodynamic analysis methodology, results, and discussion are presented in the Supplementary Information.

2.4. Factorial Design Analysis

DOE is a method used to plan for experiments such that the gathered experimental data can be assessed for statistical significance to reach unbiased conclusions. The basic steps of statistically designed experiments are (1) selection of factors and their corresponding levels; (2) determination of response variables; (3) selection of the type of the experimental design; (4) statistical analysis of the experimental data. In this paper, the full factorial design, which is one of the most widely used experimental designs, was chosen to investigate the effects of the aforementioned factors and their interactions. One of the main advantages of this design is the reduced number of experiments, which reduces the cost associated with the experimental work [35]. The number of experimental runs is given by Lk, where k is the number of factors and L is the number of levels in the design space (range of values over which factors are to be varied) [37]. Herein, three factors (k) were examined, including the type of MOF, dosage, and initial concentration. The number of levels was 2. In addition, the experiments were carried out in duplicate. Therefore, the total number of experiments was determined to be 16.
The 2k factorial design is extensively utilized in adsorption experiments, where each experimental factor is investigated at two levels (high and low). In this work, the response variable was selected to be the removal efficiency of MO (RE), which is calculated according to Equation (2). To evaluate the statistical significance of the factors, RE was determined as the average of two parallel experiments. For analysis of the experimental data, Minitab Statistical Software (Version 17) was used.

3. Results and Discussion

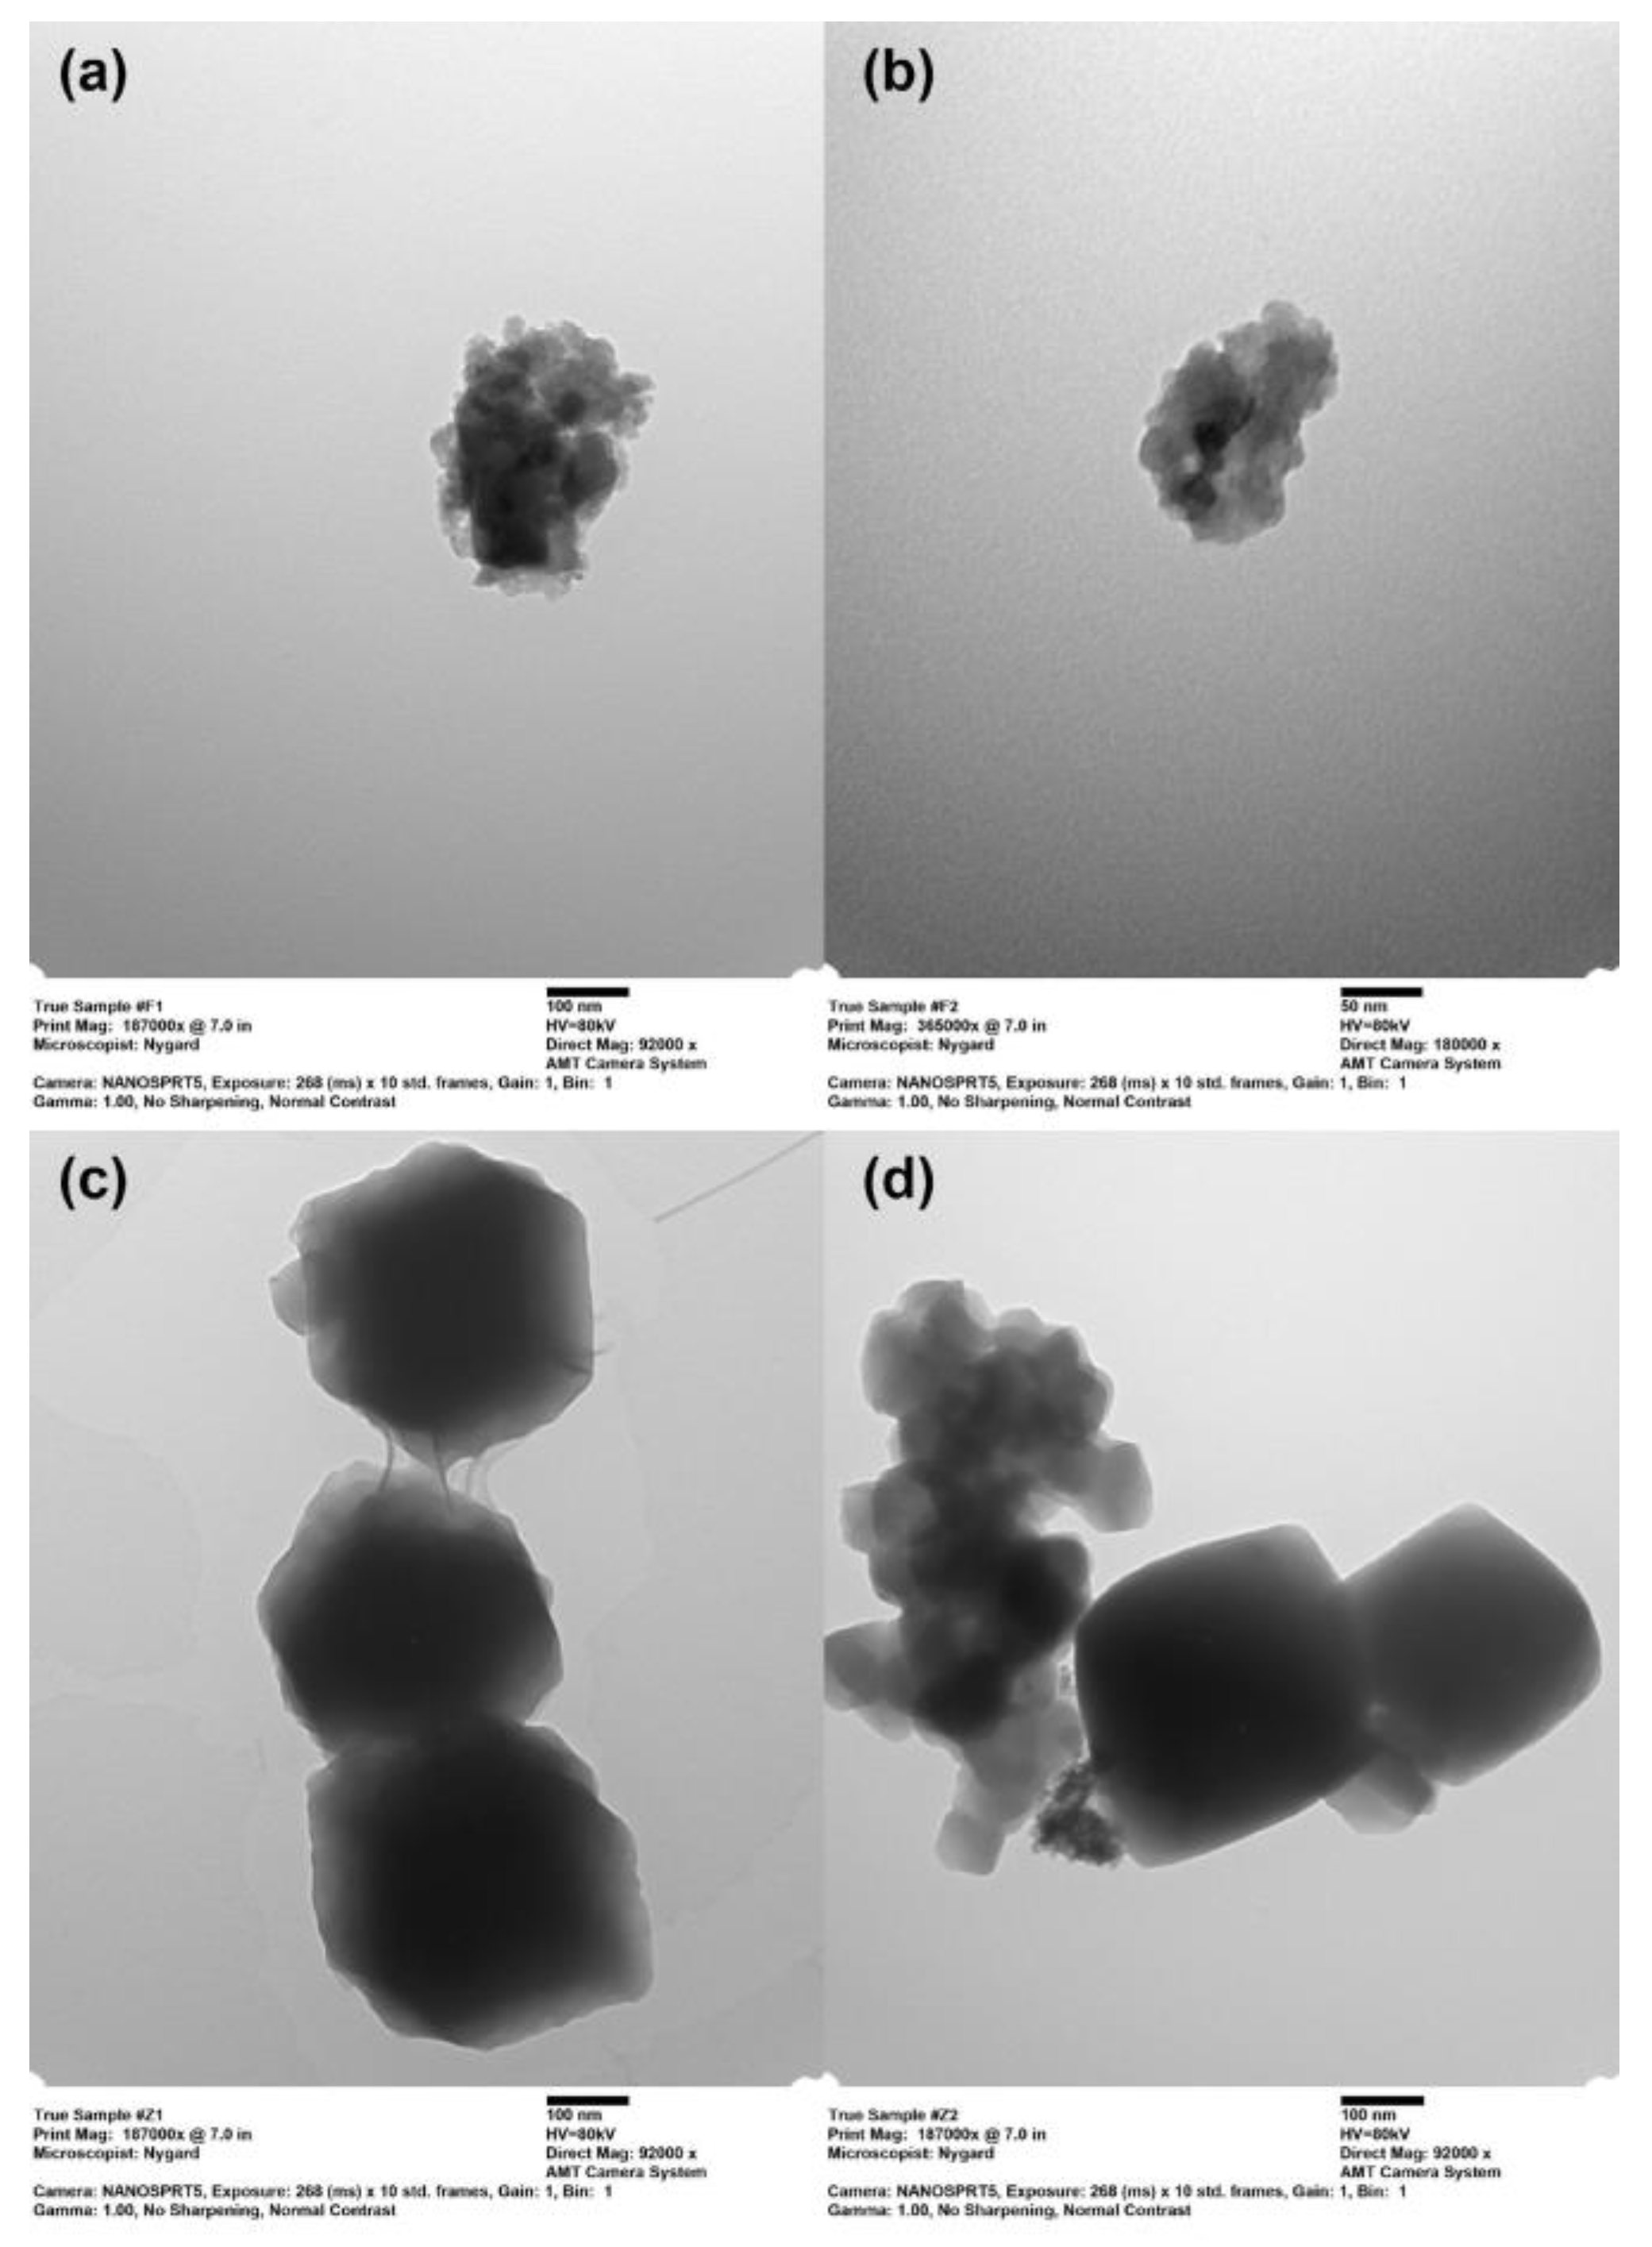
3.1. Characterization

Figure 1 shows the measured MOF’s XRD patterns before and after MO adsorption. The results demonstrate that both Cu-BTC and ZIF-8 have a crystalline structure and that the obtained patterns for the commercial MOFs are in good agreement with those reported in the literature for the equivalent lab-synthesized MOFs [32,38,39,40,41,42,43,44]. The main signature peaks present for Cu-BTC in the XRD patterns are at 2θ = 11.61°, 13.4°, 17.45°, 23.36°, and 29.33°. In addition, two extra peaks that are reported in the literature at 2θ = 6.7° and 9.5° were detected at low intensity. On the other hand, the signature peaks for ZIF-8 are at 2θ = 7.45°, 10.5°, 12.8°, 14.8, 16.5, and 18.1°. For the Fe-BTC sample, the broad peaks in the XRD pattern reveal that it is a material of low crystalline order, which is in agreement with what is reported in the literature for commercial Fe-BTC as well as lab-synthesized Fe-BTC [45,46,47,48]. The XRD patterns of Fe-BTC and ZIF-8 after MO adsorption show that their structure remains intact, while the XRD pattern of the Cu-BTC/MO sample revealed apparent loss of crystallinity, which is an indication that the crystalline structure of Cu-BTC was damaged after adsorption.
The SEM and TEM micrographs in Figure 2 and Figure 3, respectively, reveal the crystal morphologies of the MOF samples before and after MO adsorption. The SEM and TEM images for the fresh samples are similar to those reported in the literature for Fe-BTC [45,48,49], Cu-BTC [38,50,51], and ZIF-8 [52,53,54]. For Fe-BTC samples, it was difficult to obtain SEM images at higher magnification due to the magnetic character of the Fe-rich samples, whereas TEM images in Figure 3a,b clearly reveal the semi-amorphous nature of Fe-BTC. For Cu-BTC, the well-known octahedral shape can be seen in Figure 2a. However, the morphology of the after-adsorption sample shown in Figure 2b cannot be observed due to the loss of the spatial structure of the MOF. Finally, SEM images (Figure 2c,d) of the small particles of ZIF-8 and ZIF-8/MO and the TEM micrographs (Figure 3c,d) at the nm scale reveal the polyhedral shape of ZIF-8, which is retained after adsorption.
FTIR spectra of the MOF samples presented in Figure 4 are in good agreement with the literature [45,55,56,57,58,59]. For Fe-BTC and Cu-BTC MOFs, the measured IR spectra show absorption peaks that are quite similar. This can be explained by the similarity in nature of the two MOFs regardless of their crystalline order [45,49]. The broad peaks between 3800–3000 cm−1 for both samples correspond to the presence of the hydroxyl group of the adsorbed water molecules. Both Fe-BTC and Cu-BTC absorb some of the moisture in the atmosphere, and this explains the presence of free water molecules in the sample before adsorption. On the other hand, water in the samples after adsorption is mainly from the adsorbed water molecule from the aqueous solution. The IR spectrum for the Fe-BTC sample shows absorption peaks at 711.6, 760.5, 1380, 1448, 1577, and 1627 cm−1. The two peaks at 1577 cm−1 and 1627 cm−1 are attributed to the carboxylic (COO) asymmetric stretching, whereas the peak at 1448 cm−1 belongs to the corresponding symmetric stretching vibration [45]. The peak at 1380 cm−1 indicates the presence of (C-O) from the BTC ligand [60]. In addition, the bands at 760.5 cm−1 and 711.6 cm−1 might be related to the Fe-O bond vibration. The IR spectrum of the Fe-BTC/MO sample shows a slight shift in some of the peaks related to the carboxylic (COO) stretching and the ligand–Fe bond vibration. Additionally, the broad band in the range of 3800–3000 cm−1 had a narrower and less intense peak, which might be attributed to the hydroxyl group having H-bond interaction with the MO molecule. The measured IR spectra for the Cu-BTC sample, on the other hand, show absorption peaks at 729.6, 760.1, 1373, 1445, 1560, and 1620 cm−1. The absorption peaks at 1445, 1560, and 1620 cm−1 are related to the organic linker’s COO symmetric/asymmetric vibration [45]. The presence of the C–O bond from the BTC ligand can be related to the peak at 1373 cm−1 [60]. Additionally, the bands at 760.1 cm−1 and 729.6 cm−1 might be indicative of the Cu–O stretching vibration [31]. The vibrational band corresponding directly to the ligand coordinated with the centered Cu(II) ions is also visible on the IR absorption band at 487 cm−1 [61,62]. The IR spectrum for the Cu-BTC/MO sample shows clear changes in the peaks related to the COO stretching modes in the 1700–1300 cm−1 range, and the ligand–Cu bond vibration in the 760–730 cm−1 range. In the IR spectrum of both Fe-BTC/MO and Cu-BTC/MO, the peak around 1120 cm−1 can be assigned to the S-O bonds from MO, confirming the presence of MO molecules on Fe-BTC and Cu-BTC surfaces. For the ZIF-8 samples, the small peaks at 3140 cm−1 and 2930 cm−1 are attributed to the aliphatic/aromatic C-H stretching in the organic linker (from the methyl group and imidazole ring) [63]. Moreover, the peak at 1590 cm−1 can be assigned to the stretching mode of C=N, whereas that observed between 1460 and 1310 cm−1 is related to the vibration of the imidazole ring [64]. Furthermore, the peak at 1150 cm−1 corresponds to the C-H bending in the imidazolate [64]. Finally, the peaks between 1100 and 950 cm−1 and the two peaks at 760 and 694 cm−1 could be related to the in-plane and out-of-plane bending of the imidazole ring, respectively [63,64]. For the ZIF-8/MO sample, the broader and more intense peak in the 3300–3600 cm−1 range was related to the free hydroxyl group and the hydrogen-bonded hydroxyl groups confirming the presence of free water in the ZIF-8/MO sample [59]. Finally, the small peak at 1030 cm−1 could be ascribed to the presence of MO on the ZIF-8 surface.
TGA was used to test the stability of the MOFs before and after MO adsorption. The TGA results are presented in Figure 5, and they indicate that the overall thermal stabilities of the MOFs were comparable to those reported for the lab-synthesized MOFs [38,49,65]. For Fe-BTC MOF, the overall weight loss for the sample before adsorption was around 70%, whereas the sample after adsorption had a slightly higher weight loss of about 72%. The first drop in weight is around 100 °C, which corresponds to the evaporation of the water present in the samples. This is confirmed by the peak in derivative weight loss (DWT%) curves for both samples, where the Fe-BTC/MO sample had a slightly more intense peak, indicating higher water content in the sample, mainly from the MO aqueous solution. In addition, at 200 °C, the Fe-BTC sample lost approximately 10% of its weight, whereas the Fe-BTC/MO sample lost approximately 20%, mostly water content. Then, between 200 °C and 300 °C, both samples showed no significant weight loss. Following this, both samples continued to lose weight between 300 °C and 500 °C, where total weight loss reached around 55% at 500 °C. This loss can be attributed to the decomposition of BTC linkers [28]. Between 500 °C and 600 °C, there was no significant weight loss, followed by a sudden drop in weight above 600 °C (ca. 10% for Fe-BTC and ca. 12% for Fe-BTC/MO). This loss of weight is due to the total decomposition of the samples and the formation of iron-containing ashes [46]. For Cu-BTC MOF, the overall weight loss of the samples was around 60%. The first drop in weight is at 100 °C which corresponds to the evaporation of water present in the samples. This is confirmed by the peak in DWT% curves for both samples, where Cu-BTC/MO sample had a second peak between 150 °C and 200 °C, indicating higher water content in the sample, mainly from the MO aqueous solution. Then, above 200 °C, Cu-BTC sample showed no significant weight loss up to 360 °C after which a sudden weight loss is observed from the DWT% curve. On the other hand, the second stage of weight loss for the Cu-BTC/MO sample occurs at around 300 °C, where a broad shoulder peak in the DWT% curve is observed. In both cases, this drop in weight is attributed to the total decomposition of BTC linkers and production of CuO as the remaining product [40,41], plus the decomposition of MO in the Cu-BTC/MO sample. For ZIF-8 MOF, the overall weight loss for the sample before adsorption was around 38%, whereas the sample after adsorption had a slightly higher weight loss of about 40%. The TGA results for the ZIF-8 sample show that there was no weight loss in the temperature range of 100–450 °C, indicating that the ZIF-8 had no trapped solvent molecules inside the framework and that it was stable up to 450 °C. On the other hand, the ZIF-8/MO sample had a small weight loss (2%) at 150 °C, corresponding to the release of water adsorbed at the crystal surface. Then, both samples exhibited a gradual weight loss at around 500 °C followed by a sharp drop at 600 °C due to the structural collapse of ZIF-8 and decomposition of the organic ligand, leading to the formation of ZnO as the final product [63]. In comparison, ZIF-8 had the best overall thermal stability among the three MOFs under consideration.

3.2. Removal Efficiencies

Figure 6 demonstrates the removal efficiency (RE) as a function of time for the three adsorbents. Among the three MOFs considered, Fe-BTC had the highest maximum MO removal efficiency (91%), followed by ZIF-8 (63%) and finally Cu-BTC (35%). It can be seen that the MO adsorption was rapid in the case of Fe-BTC (80% RE in 10 min), and equilibrium was achieved in 60 min, while adsorption over ZIF-8 took 180 min to reach equilibrium. In contrast, the removal efficiency of Cu-BTC drops after 30 min, indicating that the structure of the adsorbent was damaged, as was confirmed by the XRD results for Cu-BTC/MO sample. Therefore, Cu-BTC cannot be counted as a good candidate for the adsorptive removal of MO from water under the investigated experimental conditions. Furthermore, although Fe-BTC had the lowest BET surface area (according to the data reported by Sigma-Aldrich), it had the highest removal efficiency, indicating that MO adsorption was not necessarily directly related to the surface area or pore volume of the MOF used; rather, it can be due to the presence of specific interactions between the MOF and MO. Additionally, Luan Tran et al. [66] studied the effect of the external surface area of ZIF-8 on dyes’ adsorption capacity. According to their findings, the external surface of ZIF-8 was the only contributor to adsorption, and there was no adsorption inside the pores of the MOF. Additionally, the lower removal efficiency of ZIF-8 compared to Fe-BTC can be linked to the hydrophobic character of ZIF-8 versus the hydrophilic nature of Fe-BTC [59,67]. Therefore, these factors may be the reason for the limited MO adsorption capacity over ZIF-8 despite the larger surface area of the MOF.

3.3. Initial pH (pHinitial) Effect and Adsorption Mechanism

The effect of the initial pH on MO adsorption was investigated in the 2–12 pH range. In this study, the pH effect experiments were carried out at 25 °C. The initial MO concentration was kept at 15 mg/L, and the dosage of the MOF was 150 mg. The effect of the initial pH (pHinitial) on MO adsorption is shown in Figure 7a. For Fe-BTC, the pHinitial of the solution (in the range of 2–10) had an insignificant effect on MO equilibrium adsorption capacity (qe), while in the same range, ZIF-8 had the highest adsorption capacity at pHinitial of 2 with relatively similar capacities between 4 and 10. On the other hand, the adsorption capacity of Cu-BTC decreased as pHinitial increased in the same range. At pHinitial 12, the adsorption capacity of all MOFs was the lowest, suggesting the collapse of the MOFs’ structures under strong alkaline conditions [68]. These findings can be linked with the results of pHPZC experiments shown in Figure 7b. For pHinitial less than pHPZC, the MOF’s surface is more positively charged, which strengthens the electrostatic attraction to MO molecules that are usually in the negatively charged sulfonate form. Additionally, for pHinitial greater than pHPZC, the surface of the MOF is more negatively charged, which leads to strong repulsion between the MOF’s surface and MO molecules (both are negatively charged) [22,68]. In the cases of Fe-BTC and ZIF-8, the pHPZC was around 9 and 9.5, respectively. Therefore, the drop in the adsorption capacity at pH 12 can be attributed to the electrostatic repulsion between the negative surface charge and the negatively charged MO molecule as well as to the decomposition of the MOF structure. However, for Cu-BTC, the pHPZC was around 4, which explains the higher adsorption capacity at pHinitial less than 4 since the surface of Cu-BTC is more positively charged. However, it should be noted that the improvement in the amount adsorbed at pHinitial less than 4 was not substantial, indicating that the effect of water instability on the structure of Cu-BTC was significant, as was shown previously. As a result, all other experiments were performed at the natural MO solution’s pH without adjustment (pH = 6).
It is worth noting that the relatively constant qe for Fe-BTC and ZIF-8 in the pH range 2–10 could indicate the involvement of other adsorption mechanisms in addition to the electrostatic interactions, such as π–π stacking and hydrogen bonding, between MO and the MOF. In the case of Fe-BTC, the interaction between the benzene rings in the MOF’s organic linker and MO molecules is referred to as the π–π stacking [69], while hydrogen bonds can form between MO’s nitrogen or oxygen atoms and the hydrogen atoms in the benzene ring of Fe-BTC and the imidazole ring of ZIF-8. Therefore, electrostatic, π–π stacking, and hydrogen-bond interactions are considered the primary forces involved in MO adsorption on both ZIF-8 and Fe-BTC. The details of the adsorption kinetics, isotherms, and thermodynamic analyses are discussed and presented in the supplementary information.

3.4. Factorial Design Analysis

The factors selected for the experimental design were the type of MOF, the dosage of MOF, and the initial concentration. For the type of MOF factor, only Fe-BTC and ZIF-8 were considered since the structure of Cu-BTC was proven to be unstable under the experimental conditions. Furthermore, the pH effect was not included since it was performed separately, and the results showed that pH effect on MO adsorption was negligible over a wide pH range (2–10).
Optimum conditions are decided by changing several factors and using different levels of these factors. Factorial designs are widely applied in experiments that are take into account several factors where it is necessary to study the interaction effect of factors on the response [20]. The factorial design describes which factor shows more impact and influences the variation of one factor on the other factors [21].
Table 1 presents the high and low levels for the 23 factorial design for a total of 16 experiments. The higher level was given the “+1” designation, and the lower level was given the “−1” designation. For the type of MOF, ZIF-8 was assigned as the lower level since it had lower removal efficiency than Fe-BTC. The factorial design matrix (codified variables) along with the response values for MO removal efficiency are summarized in Table 2. Figure 8 presents a graphical representation (cube plot) of the experimental results (average RE) for the respective low and high levels of each factor. The following codified equation was used to explain the 23 factorial design of MO removal:
Y = X0 + X1A + X2B + X3C + X4AB + X5AC + X6BC + X7ABC
where 𝑌 is the predicted response (removal efficiency percentage), 𝑋0 represents the global mean, 𝑋𝑖 is the regression coefficient corresponding to the main factor effects and interactions, 𝐴 is the MOF type, 𝐵 is the adsorbent dosage (mg), and 𝐶 is the initial dye concentration (mg/L).
Analysis of variance (ANOVA) was conducted to examine the reliability of the model describing the response as a function of the factors. The analysis was performed using Fisher’s test (F-value) and p-values to determine the significance of the regression coefficients of the main effects and the interaction effects. In general, p-values < 0.05 are considered statistically significant [70]. The ANOVA results and the contribution of the main factors and their interactions with the model are shown in Table 3 as well. From the p-values, it can be seen that the main factors (A, B, and C), their two-way interactions (AB, AC, and BC), and their three-way interaction (ABC) are statistically significant to the removal efficiency. The coefficients and the effects of the main factor and their interactions in the model are presented in Table 4. The significance (or relative importance) of the main factors and their interactions can be determined from the absolute values in the “Effect” column. It can be seen that the order of the effects of the factors and their interactions in the model is ABC < BC < AB < AC < C < B < A. The positive values of the effects indicate that as the level of the factor increases the removal efficiency increases, while the negative values imply the opposite (i.e., increasing the level of the factor decreases removal efficiency).
The normal probability plot can be divided into two regions: the region with percentages above 50 percent, where the factors are represented by positive coefficients (A, B, AC, and BC), and the region with percentages below 50 percent, where the factors are represented by negative coefficients (C, AB, and ABC). Furthermore, the main factors and their interactions denoted by circles are not significant, whereas the effects denoted by a square are significant. Analysis of variance is a statistical method that divides total variation into component parts, each of which corresponds to a different source of variation [20,21].
The main factors’ statistical significance and their interactions were also confirmed via the Pareto chart in Figure 9b. For the 95% confidence level (α value of 0.05), the t-value was 2.31 (the vertical reference line). The values that exceed the reference line are considered significant [71]. According to Figure 9, all main factors and their interactions were statistically significant at the level of 0.05, which corroborated the results from ANOVA. Though the Pareto chart allows one to compare the absolute values of the effects of each factor and their interactions, the normal plot of standardized effects is more accurate in determining the significance and insignificance of each effect, as shown in Figure 9a. A normal probability plot could be separated into two regions: the region with percentages above 50%, where the factors are indicated by positive coefficients (A, B, AC, and BC), whereas in the region with percentages below 50%, the factors are indicated by negative coefficients (C, AB, and ABC). Moreover, the main factors and their interactions denoted as circles are not significant, while the effects shown as a square are significant. Figure 9a indicates that the main factors and their interactions were all significant. Analysis of variance is a statistical method that partitions the total variation into its component parts, each of which is associated with a different source of variation [20,21].
The main effects of each factor on the response variable (RE) are presented in Figure 10. The results show that changing the MOF from ZIF-8 to Fe-BTC had a positive effect on MO’s removal efficiency. For the effect of MOF dosage, increasing the dosage from 100 mg to 200 mg increased the removal efficiency. As the MOF’s dosage increases, the available adsorption sites increase, leading to more MO molecules being adsorbed by the MOF and thus lowering its concentration in the solution. As a result, the difference between the initial and final MO concentration increases, which increases the removal efficiency (see Equation (2)) [72,73,74]. On the other hand, increasing the initial concentration decreased the removal efficiency. This can be attributed to the increased amount of MO molecules in the solution—which saturates the binding sites on the MOF’s surface—at a fixed MOF dosage, thus leading to a decrease in RE (see Equation (2)) [75,76,77,78].
Furthermore, an interaction effect of the different factors is considered prominent when the change in the level of one factor results in a change in the response variable (i.e., removal efficiency) that is also dependent on the level of another factor. This can be detected when the lines of the response variable are not parallel or intersect [71]. The plots, presented in Figure 11, indicate that interactions between the factors (AB, AC, and BC) were all significant, as was confirmed by the ANOVA analysis and the Pareto chart. The AB and AC plots reveal that changing the MOF type had more effect at a lower dosage and higher initial concentration. On the other hand, the BC plot showed that increasing dosage from 100 mg to 200 mg had a higher effect at higher initial concentrations. The multi-vari chart presented in Figure 12 reveals a comprehensive representation of the effects of interactions between the experimental factors. It can be seen that changing the type of MOF from ZIF-8 to Fe-BTC at 100 mg dosage and 15 mg/L MO initial concentration had the most prominent change in the removal efficiency, which is evident from the slope and length of the blue lines.

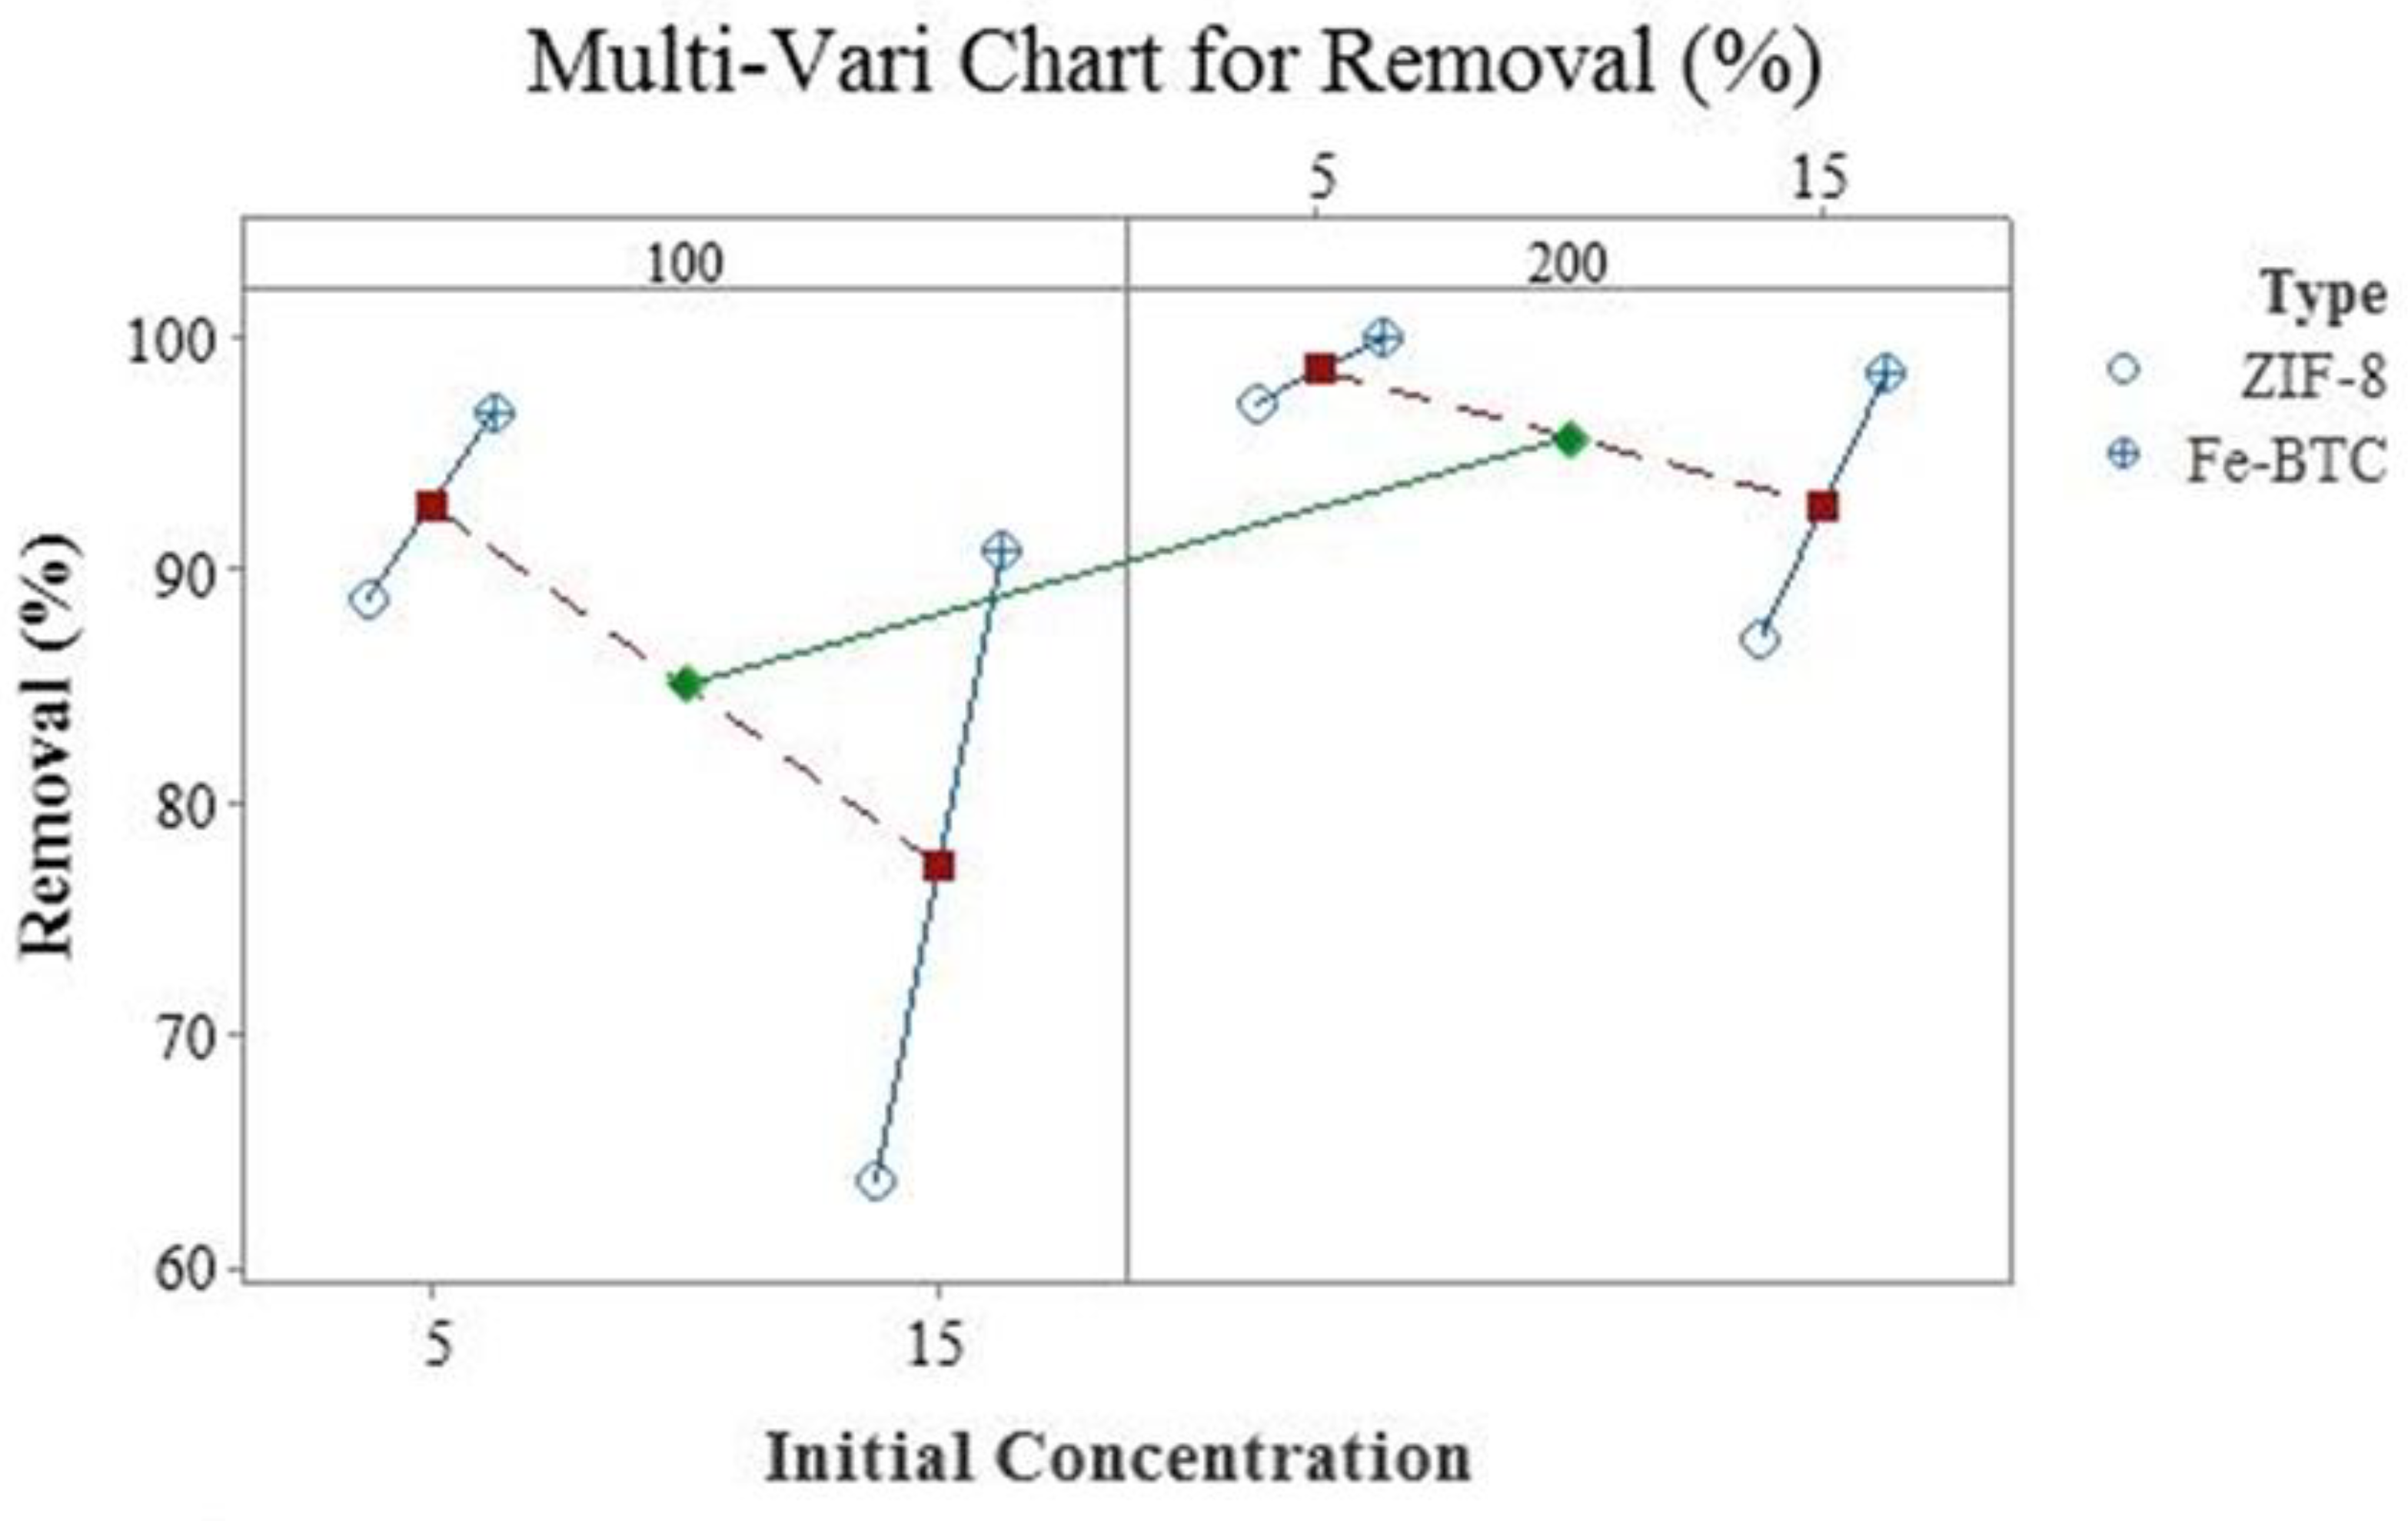
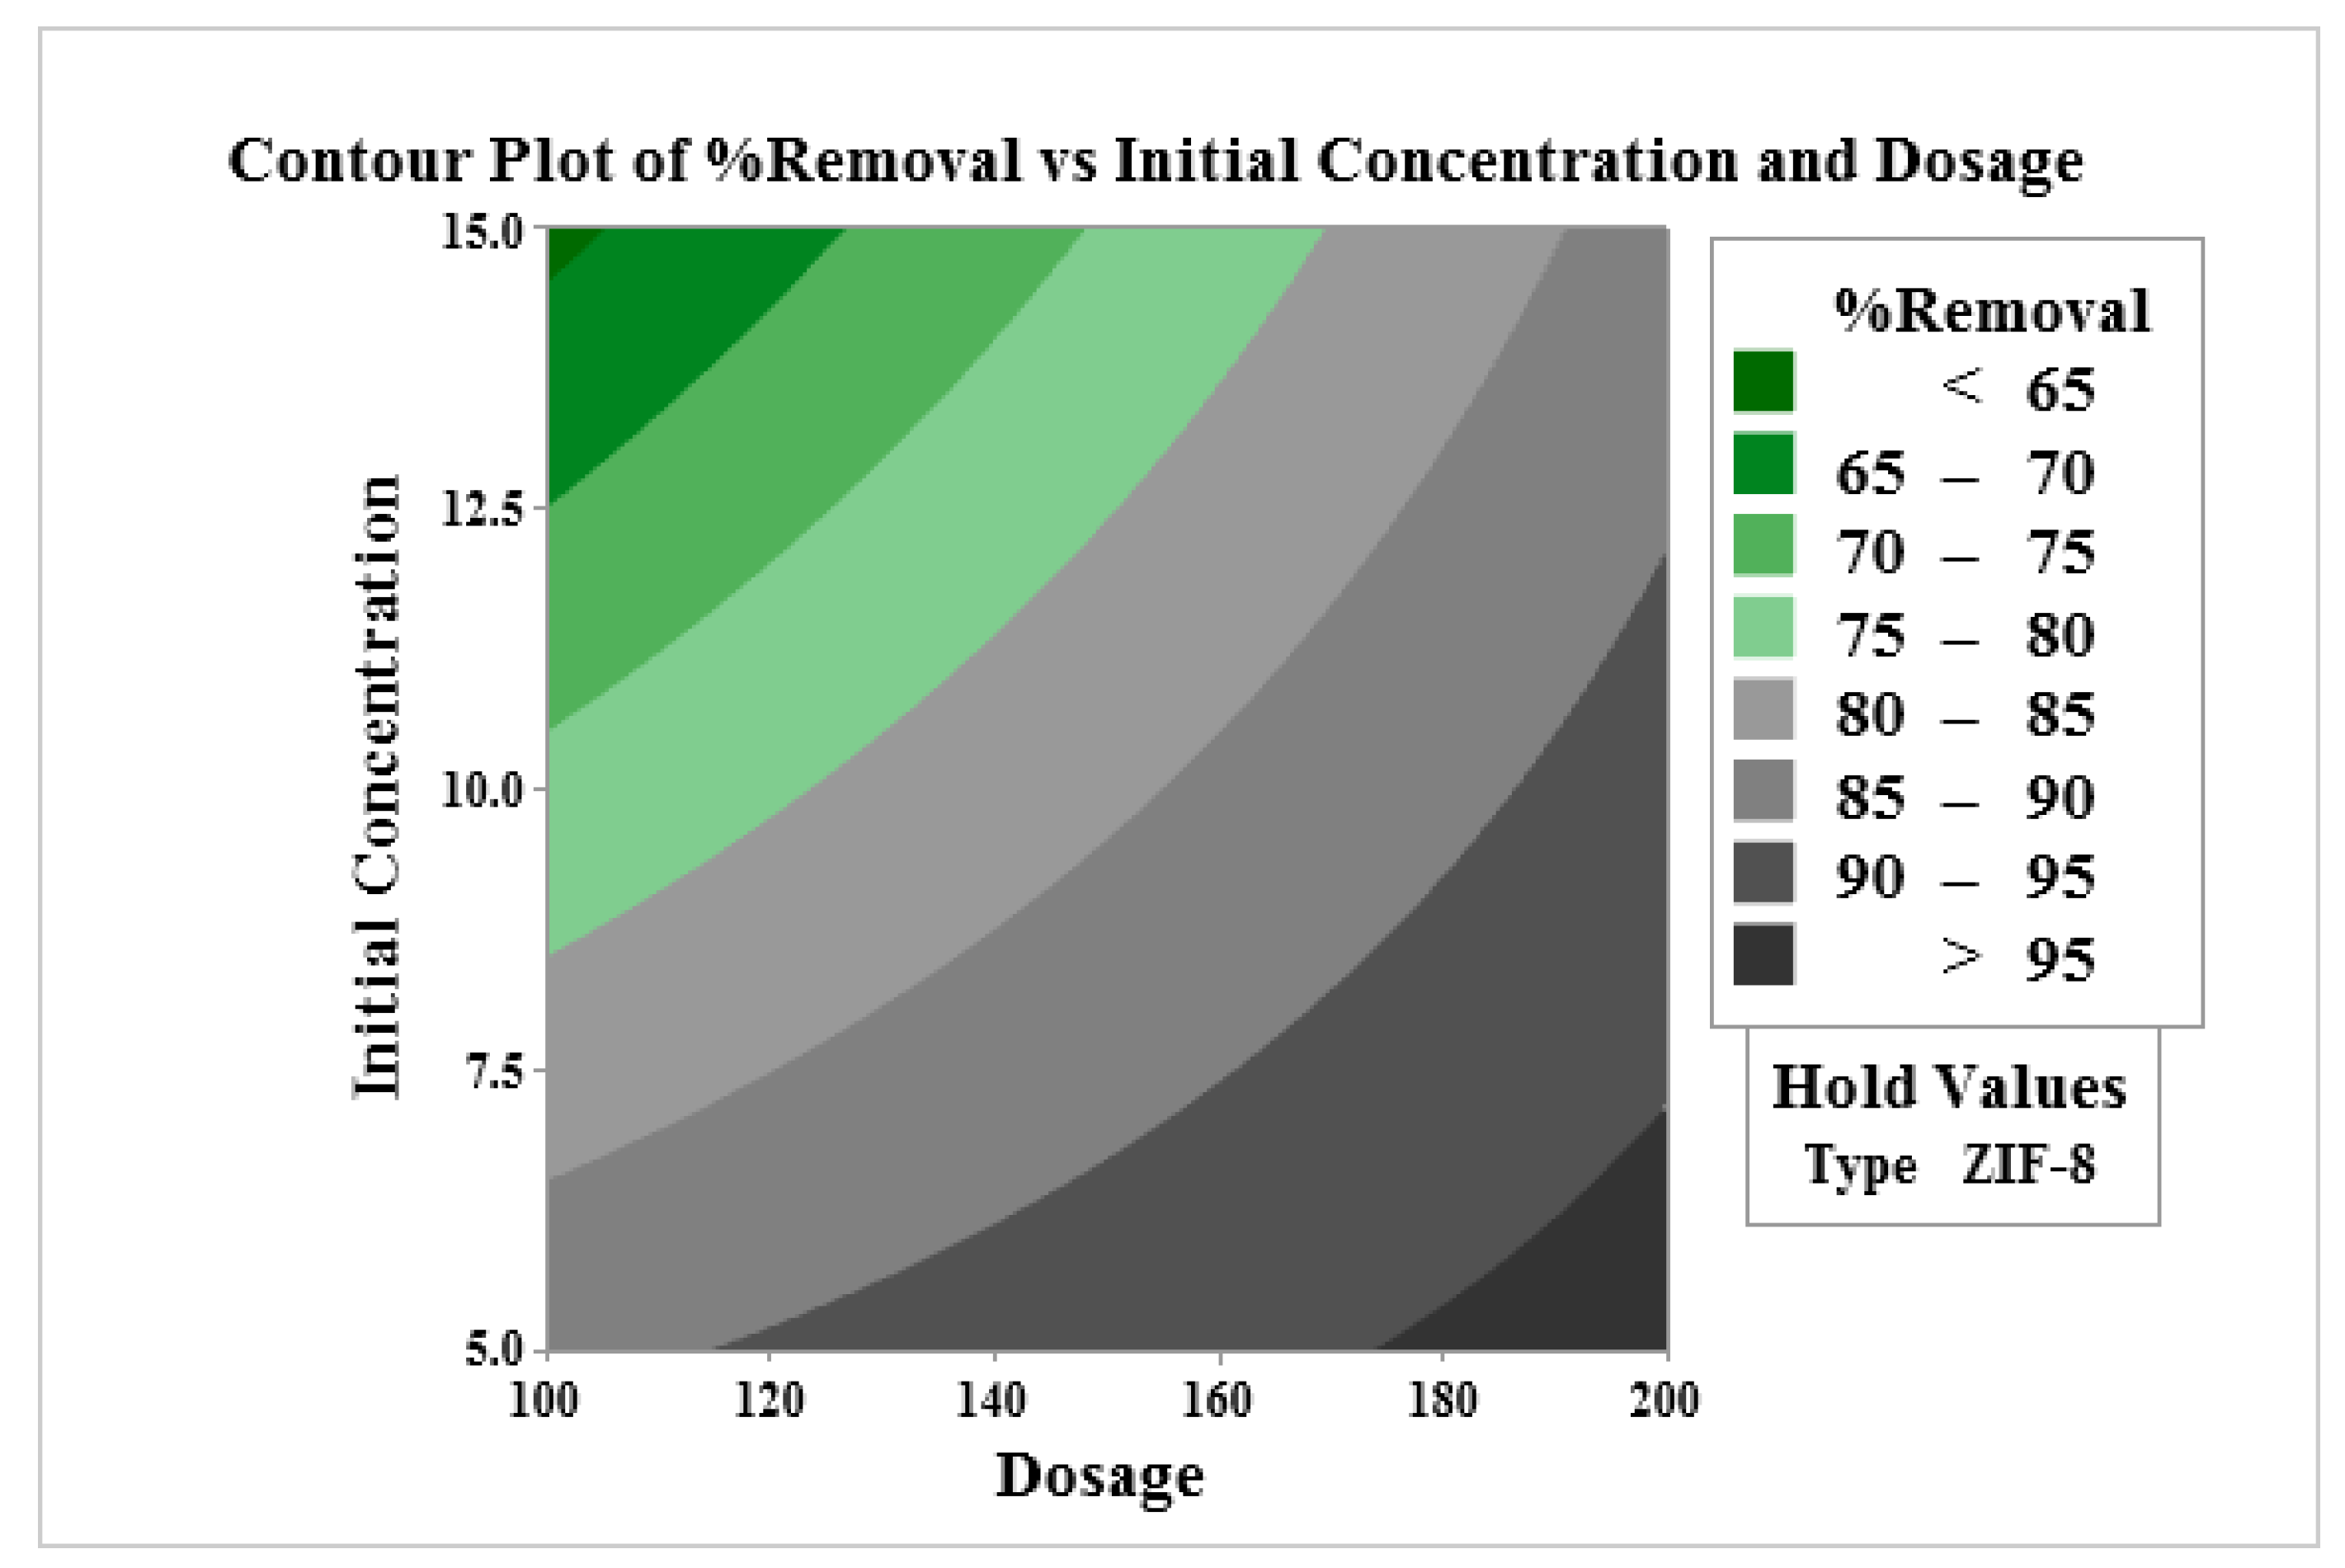
3.5. Response Surface of Independent Variables and Their Interaction

The last step of the statistical optimization was the analysis of the 3D response surface plots and contour plots as a function of three independent variables, which served the purpose of determining the interaction effects between three parameters while keeping the others at a fixed value. Statistical process optimization, in a given range of parameter values, allows not only for calculating the optimal condition, but also for determining the effect of the process conditions on the adsorption. A 3D graph (Figure 13) was plotted for each of initial concentration, dosage, and type of MOF. The MO removal rate reached its maximum for all MO initial concentrations and dosage loads, as shown in Figure 13A,B. However, when higher initial MO concentrations were used, the rate of MO removal decreased. Increased MOF dosage, on the other hand, increased removal efficiency. As a result, despite the dosage load, Figure 13C shows that Fe-BTC has the highest MO removals.
According to Figure 14, which depicts the contour plot of the coded MO concentration and MOF dosage, the range of optimum dye removal value is related to both MO initial concentration and dosage while keeping the ZIF-8 constant (on hold). Indeed, the same trend has been demonstrated previously in the literature; the optimal dosage and concentration have a significant impact on the removal rate [76].

3.6. Process Optimization Curve

The process optimization curve, which enables the determination of optimum conditions of independent variables for obtaining a desired value of the response, is presented in Figure 15. In the present study, the desired value of removal percentage, i.e., the goal, was to obtain a value at or near the target value of 95%, and the minimum and maximum qe were set at 10% and 100%, which means that removal percentage values lower than 61.5 and larger than 100 are not acceptable. As can be seen in Figure 15, for this target value, the predicted response of 95% was obtained at optimum conditions of the independent variables, including an initial concentration of 10.58 mg/L and an adsorbent dose of 126 g with a good desirability score. A perfect desirability score could have been obtained if uptake had achieved the ideal settings [35]. However, it is well within the acceptable range and in good accordance with the experimental response. The maximum uptake is shown to be achieved at 15 mg/L initial concentration and adsorbent dose of 200 g.

3.7. Comparison of Adsorption Capacity with Other Adsorbents

Several studies using different adsorbents were reported for the removal of methyl orange in the literature. The adsorption capacities of Fe-BTC and ZIF-8 are compared with other adsorbents in Table 5. It can be seen that the adsorption capacity of the proposed MOFs for MO is higher than most adsorbents. Thus, the value of adsorption capacity indicates that Fe-BTC is a good adsorbent for the adsorption of MO.

4. Conclusions

In conclusion, metal–organic frameworks with superior advantages over other conventional adsorbents in removing dyes from the aquatic environment have attracted much attention in recent years. Three MOFs (Cu-BTC, Fe-BTC, and ZIF-8) were investigated for the adsorptive removal of MO from aqueous solutions. The results showed that Fe-BTC exhibited the highest removal efficiency among the three adsorbents. Additionally, the characterization results showed that no significant changes in the internal structure of Fe-BTC and ZIF-8 after the adsorption process were detected, and they were easily regenerated by washing with ethanol, whereas the crystal structure of Cu-BTC was damaged and could not be regenerated. The maximum removal efficiencies for Fe-BTC and ZIF-8 were 91% and 63%, respectively, and both MOFs maintained their removal efficiency and adsorption capacity over a wide range of pH. Hence, the adsorption mechanism of MO on the MOFs could be due to a combination of electrostatic, π–π stacking, and hydrogen bonding interactions. Finally, the 23 factorial design utilized to study the effect of MOF type, dosage, and initial concentration on the MO removal efficiency revealed that the MOF type was the most statistically significant factor, followed by dosage and initial concentration. Both the type of MOF and dosage had a positive effect on removal efficiency, while the initial concentration had a negative effect. The two-way and three-way interactions were also found to be significant.

Supplementary Materials

The following supporting information can be downloaded at: https://www.mdpi.com/article/10.3390/en15134642/s1. References [86,87,88,89,90,91,92,93,94,95,96,97,98,99,100,101,102,103,104,105,106,107,108,109,110,111] are cited in the supplementary materials.

Author Contributions

Conceptualization, R.S. (Rana Sabouni); Data curation, R.S. (Reem Shomal); Formal analysis, A.K. and R.S. (Reem Shomal); Funding acquisition, R.S. (Rana Sabouni); Investigation, A.K. and R.S. (Reem Shomal); Methodology, A.K. and R.S. (Rana Sabouni); Project administration, R.S. (Rana Sabouni); Resources, M.H.A.-S. and A.A.; Supervision, R.S. (Rana Sabouni); Writing—original draft, A.K. and R.S. (Reem Shomal); Writing—review & editing, R.S. (Rana Sabouni) and M.H.A.-S. All authors have read and agreed to the published version of the manuscript.

Funding

This research was funded by [American University of Sharjah] grant number [FRG21-M-E63]. And the APC was funded by [American University of Sharjah] grant number [OAPCEN-1410-E00033].

Institutional Review Board Statement

Not applicable.

Informed Consent Statement

Not applicable.

Data Availability Statement

The data presented in this study are available on request from the corresponding author.

Acknowledgments

The authors gratefully acknowledge the financial support by the American University of Sharjah Faculty Research grant FRG21-M-E63. The work in this paper was supported in part by the Open Access Program from the American University of Sharjah (grant number: OAPCEN-1410-E00033). This paper represents the opinions of the author(s) and does not mean to represent the position or opinions of the American University of Sharjah.

Conflicts of Interest

The authors declare no conflict of interest.

References

  1. Katheresan, V.; Kansedo, J.; Lau, S.Y. Efficiency of various recent wastewater dye removal methods: A Review. J. Environ. Chem. Eng. 2018, 6, 4676–4697. [Google Scholar] [CrossRef]
  2. Adegoke, K.A.; Bello, O.S. Dye sequestration using agricultural wastes as adsorbents. Water Resour. Ind. 2015, 12, 8–24. [Google Scholar] [CrossRef] [Green Version]
  3. Molinos-Senante, M.; Maziotis, A. Evaluation of energy efficiency of wastewater treatment plants: The influence of the technology and aging factors. Appl. Energy 2022, 310, 118535. [Google Scholar] [CrossRef]
  4. Di Fraia, S.; Massarotti, N.; Vanoli, L. A novel energy assessment of urban wastewater treatment plants. Energy Convers. Manag. 2018, 163, 304–313. [Google Scholar] [CrossRef]
  5. Hernández-Chover, V.; Bellver-Domingo, Á.; Hernández-Sancho, F. Efficiency of wastewater treatment facilities: The influence of scale economies. J. Environ. Manag. 2018, 228, 77–84. [Google Scholar] [CrossRef]
  6. International Energy Agency. Water Energy Nexus—Excerpt from the World Energy Outlook 2016; International Energy Agency: Paris, France, 2016; ISBN 978-92-64-26494-6. [Google Scholar]
  7. Bodík, I.; Kubaská, M. Energy and sustainability of operation of a wastewater treatment plant. Environ. Prot. Eng. 2013, 39, 15–24. [Google Scholar] [CrossRef]
  8. Wakeel, M.; Chen, B.; Hayat, T.; Alsaedi, A.; Ahmad, B. Energy consumption for water use cycles in different countries: A Review. Appl. Energy 2016, 178, 868–885. [Google Scholar] [CrossRef]
  9. Ahmad, A.; Mohd-Setapar, S.H.; Chuong, C.S.; Khatoon, A.; Wani, W.A.; Kumar, R.; Rafatullah, M. Recent advances in new generation dye removal technologies: Novel search for approaches to reprocess wastewater. RSC Adv. 2015, 5, 30801–30818. [Google Scholar] [CrossRef]
  10. Hao, X.; Liu, R.; Huang, X. Evaluation of the potential for operating carbon neutral wwtps in China. Water Res. 2015, 87, 424–431. [Google Scholar] [CrossRef]
  11. Molinos-Senante, M.; Hernandez-Sancho, F.; Sala-Garrido, R. Benchmarking in wastewater treatment plants: A tool to save operational costs. Clean Technol. Environ. Policy 2013, 16, 149–161. [Google Scholar] [CrossRef]
  12. Ananda, J. Productivity implications of the water-energy-emissions nexus: An empirical analysis of the drinking water and wastewater sector. J. Clean. Prod. 2018, 196, 1097–1105. [Google Scholar] [CrossRef]
  13. Ali, H. Biodegradation of synthetic dyes—A review. Water Air Soil Pollut. 2010, 213, 251–273. [Google Scholar] [CrossRef]
  14. Fatima, M.; Farooq, R.; Lindström, R.W.; Saeed, M. A review on biocatalytic decomposition of azo dyes and electrons recovery. J. Mol. Liq. 2017, 246, 275–281. [Google Scholar] [CrossRef]
  15. Adeyemo, A.A.; Adeoye, I.O.; Bello, O.S. Metal organic frameworks as adsorbents for Dye adsorption: Overview, prospects and future challenges. Toxicol. Environ. Chem. 2012, 94, 1846–1863. [Google Scholar] [CrossRef]
  16. Karami, A.; Sabouni, R.; Al-Sayah, M.H.; Aidan, A. Adsorption potentials of iron-based metal–organic framework for methyl orange removal: Batch and fixed-bed column studies. Int. J. Environ. Sci. Technol. 2021, 18, 3597–3612. [Google Scholar] [CrossRef]
  17. Ahmad, M.A.; Alrozi, R. Optimization of rambutan peel based activated carbon preparation conditions for Remazol Brilliant Blue R Removal. Chem. Eng. J. 2011, 168, 280–285. [Google Scholar] [CrossRef]
  18. Srinivasan, A.; Viraraghavan, T. Decolorization of dye wastewaters by biosorbents: A Review. J. Environ. Manag. 2010, 91, 1915–1929. [Google Scholar] [CrossRef]
  19. Karami, A.; Sabouni, R.; Ghommem, M. Experimental investigation of competitive co-adsorption of naproxen and diclofenac from water by an aluminum-based metal-organic framework. J. Mol. Liq. 2020, 305, 112808. [Google Scholar] [CrossRef]
  20. Konaganti, V.K.; Kota, R.; Patil, S.; Madras, G. Adsorption of anionic dyes on chitosan grafted poly(alkyl methacrylate)s. Chem. Eng. J. 2010, 158, 393–401. [Google Scholar] [CrossRef]
  21. Özbay, N.; Yargıç, A.Ş.; Yarbay-Şahin, R.Z.; Önal, E. Full factorial experimental design analysis of reactive dye removal by carbon adsorption. J. Chem. 2013, 2013, 234904. [Google Scholar] [CrossRef] [Green Version]
  22. Mtaallah, S.; Marzouk, I.; Hamrouni, B. Factorial experimental design applied to adsorption of cadmium on activated alumina. J. Water Reuse Desalin. 2017, 8, 76–85. [Google Scholar] [CrossRef]
  23. Haque, E.; Lee, J.E.; Jang, I.T.; Hwang, Y.K.; Chang, J.-S.; Jegal, J.; Jhung, S.H. Adsorptive removal of methyl orange from aqueous solution with metal-organic frameworks, porous chromium-benzenedicarboxylates. J. Hazard. Mater. 2010, 181, 535–542. [Google Scholar] [CrossRef] [PubMed]
  24. Ayati, A.; Shahrak, M.N.; Tanhaei, B.; Sillanpää, M. Emerging adsorptive removal of azo dye by metal–organic frameworks. Chemosphere 2016, 160, 30–44. [Google Scholar] [CrossRef] [PubMed]
  25. Babu, K.F.; Kulandainathan, M.A.; Katsounaros, I.; Rassaei, L.; Burrows, A.D.; Raithby, P.R.; Marken, F. Electrocatalytic activity of BasoliteTM F300 metal-organic-framework structures. Electrochem. Commun. 2010, 12, 632–635. [Google Scholar] [CrossRef]
  26. Chui, S.S.-Y.; Lo, S.M.-F.; Charmant, J.P.; Orpen, A.G.; Williams, I.D. A chemically functionalizable nanoporous material [Cu3 (TMA)2 (H2O)3]n. Science 1999, 283, 1148–1150. [Google Scholar] [CrossRef]
  27. Banerjee, R.; Phan, A.; Wang, B.; Knobler, C.; Furukawa, H.; O’Keeffe, M.; Yaghi, O.M. High-throughput synthesis of zeolitic imidazolate frameworks and application to CO2 capture. Science 2008, 319, 939–943. [Google Scholar] [CrossRef]
  28. Centrone, A.; Santiso, E.E.; Hatton, T.A. Separation of chemical reaction intermediates by metal-organic frameworks. Small 2011, 7, 2356–2364. [Google Scholar] [CrossRef]
  29. Zhu, B.-J.; Yu, X.-Y.; Jia, Y.; Peng, F.-M.; Sun, B.; Zhang, M.-Y.; Luo, T.; Liu, J.-H.; Huang, X.-J. Iron and 1,3,5-benzenetricarboxylic metal–organic coordination polymers prepared by SOLVOTHERMAL method and their application in efficient as(v) removal from Aqueous Solutions. J. Phys. Chem. C 2012, 116, 8601–8607. [Google Scholar] [CrossRef]
  30. Wang, Q.M.; Shen, D.; Bülow, M.; Ling Lau, M.; Deng, S.; Fitch, F.R.; Lemcoff, N.O.; Semanscin, J. Metallo-organic molecular sieve for gas separation and purification. Microporous Mesoporous Mater. 2002, 55, 217–230. [Google Scholar] [CrossRef]
  31. Hamon, L.; Jolimaître, E.; Pirngruber, G.D. CO2 and CH4 separation by adsorption using Cu-BTC metal−organic framework. Ind. Eng. Chem. Res. 2010, 49, 7497–7503. [Google Scholar] [CrossRef]
  32. Lin, S.; Song, Z.; Che, G.; Ren, A.; Li, P.; Liu, C.; Zhang, J. Adsorption behavior of metal–organic frameworks for methylene blue from aqueous solution. Microporous Mesoporous Mater. 2014, 193, 27–34. [Google Scholar] [CrossRef]
  33. Park, K.S.; Ni, Z.; Cote, A.P.; Choi, J.Y.; Huang, R.; Uribe-Romo, F.J.; Chae, H.K.; O’Keeffe, M.; Yaghi, O.M. Exceptional Chemical and thermal stability of zeolitic imidazolate frameworks. Proc. Natl. Acad. Sci. USA 2006, 103, 10186–10191. [Google Scholar] [CrossRef] [PubMed] [Green Version]
  34. Malekbala, M.R.; Khan, M.A.; Hosseini, S.; Abdullah, L.C.; Choong, T.S.Y. Adsorption/desorption of cationic dye on surfactant modified mesoporous carbon coated monolith: Equilibrium, kinetic and thermodynamic studies. J. Ind. Eng. Chem. 2015, 21, 369–377. [Google Scholar] [CrossRef]
  35. Wabaidur, S.M.; Khan, M.A.; Siddiqui, M.R.; Otero, M.; Jeon, B.-H.; Alothman, Z.A.; Hakami, A.A. Oxygenated functionalities enriched mwcnts decorated with silica coated spinel ferrite—A nanocomposite for potentially rapid and efficient de-colorization of aquatic environment. J. Mol. Liq. 2020, 317, 113916. [Google Scholar] [CrossRef]
  36. Fiol, N.; Villaescusa, I. Determination of Sorbent Point zero charge: Usefulness in sorption studies. Environ. Chem. Lett. 2008, 7, 79–84. [Google Scholar] [CrossRef]
  37. Hosseini, S.; Khan, M.A.; Malekbala, M.R.; Cheah, W.; Choong, T.S.Y. Carbon coated monolith, a mesoporous material for the removal of methyl orange from aqueous phase: Adsorption and Desorption Studies. Chem. Eng. J. 2011, 171, 1124–1131. [Google Scholar] [CrossRef]
  38. Ranjan, D.; Khan, M.A.; Otero, M.; Siddiqui, M.R.; Alshaeef, S.A. Optimization of Bromate adsorption onto Fe-CNTS nanocomposite using response surface methodology. Water SA 2021, 47, 423–429. [Google Scholar]
  39. Najafi Nobar, S. Cu-BTC Synthesis, characterization and preparation for adsorption studies. Mater. Chem. Phys. 2018, 213, 343–351. [Google Scholar] [CrossRef]
  40. Schlichte, K.; Kratzke, T.; Kaskel, S. Improved synthesis, thermal stability and catalytic properties of the metal-organic framework compound CU3(BTC)2. Microporous Mesoporous Mater. 2004, 73, 81–88. [Google Scholar] [CrossRef]
  41. Yang, Y.; Shukla, P.; Wang, S.; Rudolph, V.; Chen, X.-M.; Zhu, Z. Significant improvement of surface area and CO2 adsorption of Cu–BTC via Solvent Exchange Activation. RSC Adv. 2013, 3, 17065. [Google Scholar] [CrossRef]
  42. Lin, K.-S.; Adhikari, A.K.; Ku, C.-N.; Chiang, C.-L.; Kuo, H. Synthesis and characterization of porous HKUST-1 metal organic frameworks for hydrogen storage. Int. J. Hydrogen Energy 2012, 37, 13865–13871. [Google Scholar] [CrossRef]
  43. Chen, L.; Yuan, S.; Qian, J.-F.; Fan, W.; He, M.-Y.; Chen, Q.; Zhang, Z.-H. Effective adsorption separation of n-hexane/2-methylpentane in facilely synthesized zeolitic imidazolate frameworks zif-8 and zif-69. Ind. Eng. Chem. Res. 2016, 55, 10751–10757. [Google Scholar] [CrossRef]
  44. Lee, Y.-R.; Jang, M.-S.; Cho, H.-Y.; Kwon, H.-J.; Kim, S.; Ahn, W.-S. Zif-8: A comparison of synthesis methods. Chem. Eng. J. 2015, 271, 276–280. [Google Scholar] [CrossRef]
  45. Cho, H.-Y.; Kim, J.; Kim, S.-N.; Ahn, W.-S. High yield 1-L scale synthesis of ZIF-8 via a sonochemical route. Microporous Mesoporous Mater. 2013, 169, 180–184. [Google Scholar] [CrossRef]
  46. Torres, N.; Galicia, J.; Plasencia, Y.; Cano, A.; Echevarría, F.; Desdin-Garcia, L.F.; Reguera, E. Implications of structural differences between Cu-BTC and Fe-BTC on their hydrogen storage capacity. Colloids Surf. A Physicochem. Eng. Asp. 2018, 549, 138–146. [Google Scholar] [CrossRef]
  47. Martínez, F.; Leo, P.; Orcajo, G.; Díaz-García, M.; Sanchez-Sanchez, M.; Calleja, G. Sustainable fe-BTC catalyst for efficient removal of mehylene blue by advanced Fenton Oxidation. Catal. Today 2018, 313, 6–11. [Google Scholar] [CrossRef]
  48. Dhakshinamoorthy, A.; Alvaro, M.; Horcajada, P.; Gibson, E.; Vishnuvarthan, M.; Vimont, A.; Grenèche, J.-M.; Serre, C.; Daturi, M.; Garcia, H. Comparison of porous iron trimesates basolite F300 and mil-100(fe) as heterogeneous catalysts for Lewis acid and oxidation reactions: Roles of structural defects and stability. ACS Catal. 2012, 2, 2060–2065. [Google Scholar] [CrossRef]
  49. Shahid, S.; Nijmeijer, K. High pressure gas separation performance of mixed-matrix polymer membranes containing mesoporous fe(btc). J. Membr. Sci. 2014, 459, 33–44. [Google Scholar] [CrossRef]
  50. Autie-Castro, G.; Autie, M.A.; Rodríguez-Castellón, E.; Aguirre, C.; Reguera, E. Cu-BTC and Fe-BTC Metal-organic frameworks: Role of the materials structural features on their performance for volatile hydrocarbons separation. Colloids Surf. A Physicochem. Eng. Asp. 2015, 481, 351–357. [Google Scholar] [CrossRef]
  51. Dathe, H.; Peringer, E.; Roberts, V.; Jentys, A.; Lercher, J.A. Metal organic frameworks based on Cu2+ and benzene-1,3,5-tricarboxylate as host for SO2 trapping agents. C. R. Chim. 2005, 8, 753–763. [Google Scholar] [CrossRef]
  52. Chowdhury, P.; Bikkina, C.; Meister, D.; Dreisbach, F.; Gumma, S. Comparison of adsorption isotherms on Cu-BTC Metal Organic Frameworks synthesized from different routes. Microporous Mesoporous Mater. 2009, 117, 406–413. [Google Scholar] [CrossRef]
  53. McEwen, J.; Hayman, J.-D.; Ozgur Yazaydin, A. A comparative study of CO2, CH4 and N2 adsorption in zif-8, zeolite-13x and BPL activated carbon. Chem. Phys. 2013, 412, 72–76. [Google Scholar] [CrossRef]
  54. Yin, H.; Kim, H.; Choi, J.; Yip, A.C.K. Thermal stability of zif-8 under oxidative and Inert Environments: A practical perspective on using ZIF-8 as a catalyst support. Chem. Eng. J. 2015, 278, 293–300. [Google Scholar] [CrossRef]
  55. Du, M.; Li, L.; Li, M.; Si, R. Adsorption mechanism on Metal Organic Frameworks of cu-BTC, Fe-BTC and zif-8 for CO2 capture investigated by X-ray absorption fine structure. RSC Adv. 2016, 6, 62705–62716. [Google Scholar] [CrossRef]
  56. Sanchez-Sanchez, M.; de Asua, I.; Ruano, D.; Diaz, K. Direct synthesis, structural features, and enhanced catalytic activity of the basolite F300-like Semiamorphous Fe-BTC Framework. Cryst. Growth Des. 2015, 15, 4498–4506. [Google Scholar] [CrossRef]
  57. Dhakshinamoorthy, A.; Alvaro, M.; Chevreau, H.; Horcajada, P.; Devic, T.; Serre, C.; Garcia, H. Iron(III) metal–organic frameworks as solid Lewis acids for the isomerization of α-pinene oxide. Catal. Sci. Technol. 2012, 2, 324–330. [Google Scholar] [CrossRef]
  58. Wang, Y.; Xu, Y.; Ma, H.; Xu, R.; Liu, H.; Li, D.; Tian, Z. Synthesis of zif-8 in a deep eutectic solvent using cooling-induced crystallisation. Microporous Mesoporous Mater. 2014, 195, 50–59. [Google Scholar] [CrossRef]
  59. He, M.; Yao, J.; Liu, Q.; Wang, K.; Chen, F.; Wang, H. Facile synthesis of zeolitic imidazolate framework-8 from a concentrated aqueous solution. Microporous Mesoporous Mater. 2014, 184, 55–60. [Google Scholar] [CrossRef]
  60. Jian, M.; Liu, B.; Zhang, G.; Liu, R.; Zhang, X. Adsorptive removal of arsenic from aqueous solution by zeolitic imidazolate framework-8 (zif-8) nanoparticles. Colloids Surf. A Physicochem. Eng. Asp. 2015, 465, 67–76. [Google Scholar] [CrossRef]
  61. McKinstry, C.; Cussen, E.J.; Fletcher, A.J.; Patwardhan, S.V.; Sefcik, J. Scalable continuous production of high quality HKUST-1 via conventional and microwave heating. Chem. Eng. J. 2017, 326, 570–577. [Google Scholar] [CrossRef] [Green Version]
  62. He, L.; Dumée, L.F.; Liu, D.; Velleman, L.; She, F.; Banos, C.; Davies, J.B.; Kong, L. Silver nanoparticles prepared by gamma irradiation across metal–organic framework templates. RSC Adv. 2015, 5, 10707–10715. [Google Scholar] [CrossRef]
  63. Conde-González, J.E.; Peña-Méndez, E.M.; Rybáková, S.; Pasán, J.; Ruiz-Pérez, C.; Havel, J. Adsorption of silver nanoparticles from aqueous solution on copper-based metal organic frameworks (HKUST-1). Chemosphere 2016, 150, 659–666. [Google Scholar] [CrossRef] [PubMed]
  64. Kaur, H.; Mohanta, G.C.; Gupta, V.; Kukkar, D.; Tyagi, S. Synthesis and characterization of zif-8 nanoparticles for controlled release of 6-Mercaptopurine Drug. J. Drug Deliv. Sci. Technol. 2017, 41, 106–112. [Google Scholar] [CrossRef]
  65. Bustamante, E.L.; Fernández, J.L.; Zamaro, J.M. Influence of the solvent in the synthesis of zeolitic imidazolate framework-8 (zif-8) nanocrystals at room temperature. J. Colloid Interface Sci. 2014, 424, 37–43. [Google Scholar] [CrossRef]
  66. Nguyen, L.T.L.; Le, K.K.A.; Phan, N.T.S. A zeolite imidazolate framework zif-8 catalyst for Friedel-Crafts acylation. Chin. J. Catal. 2012, 33, 688–696. [Google Scholar] [CrossRef]
  67. Luan Tran, B.; Chin, H.-Y.; Chang, B.K.; Chiang, A.S.T. Dye adsorption in zif-8: The importance of external surface area. Microporous Mesoporous Mater. 2019, 277, 149–153. [Google Scholar] [CrossRef]
  68. Seo, Y.-K.; Yoon, J.W.; Lee, J.S.; Lee, U.-H.; Hwang, Y.K.; Jun, C.-H.; Horcajada, P.; Serre, C.; Chang, J.-S. Large scale fluorine-free synthesis of hierarchically porous iron(iii) trimesate mil-100(fe) with a zeolite MTN topology. Microporous Mesoporous Mater. 2012, 157, 137–145. [Google Scholar] [CrossRef]
  69. Wu, S.-C.; You, X.; Yang, C.; Cheng, J.-H. Adsorption behavior of methyl orange onto an aluminum-based metal organic framework, MIL-68(AL). Water Sci. Technol. 2017, 75, 2800–2810. [Google Scholar] [CrossRef]
  70. Hasan, Z.; Jhung, S.H. Removal of hazardous organics from water using metal-organic frameworks (mofs): Plausible mechanisms for selective adsorptions. J. Hazard. Mater. 2015, 283, 329–339. [Google Scholar] [CrossRef]
  71. Regti, A.; Laamari, M.R.; Stiriba, S.-E.; El Haddad, M. Use of response factorial design for process optimization of basic dye adsorption onto activated carbon derived from Persea species. Microchem. J. 2017, 130, 129–136. [Google Scholar] [CrossRef]
  72. Mathialagan, T.; Viraraghavan, T. Biosorption of pentachlorophenol by fungal biomass from aqueous solutions: A factorial design analysis. Environ. Technol. 2005, 26, 571–580. [Google Scholar] [CrossRef] [PubMed]
  73. Abdi, J.; Vossoughi, M.; Mahmoodi, N.M.; Alemzadeh, I. Synthesis of metal-organic framework hybrid nanocomposites based on go and CNT with high adsorption capacity for dye removal. Chem. Eng. J. 2017, 326, 1145–1158. [Google Scholar] [CrossRef]
  74. Yao, Y.; Bing, H.; Feifei, X.; Xiaofeng, C. Equilibrium and kinetic studies of methyl orange adsorption on multiwalled carbon nanotubes. Chem. Eng. J. 2011, 170, 82–89. [Google Scholar] [CrossRef]
  75. Senthil Kumar, P.; Ramalingam, S.; Senthamarai, C.; Niranjanaa, M.; Vijayalakshmi, P.; Sivanesan, S. Adsorption of dye from aqueous solution by cashew nut shell: Studies on equilibrium isotherm, kinetics and thermodynamics of interactions. Desalination 2010, 261, 52–60. [Google Scholar] [CrossRef]
  76. Chen, C.; Zhang, M.; Guan, Q.; Li, W. Kinetic and thermodynamic studies on the adsorption of xylenol orange onto MIL-101(CR). Chem. Eng. J. 2012, 183, 60–67. [Google Scholar] [CrossRef]
  77. Haque, E.; Jun, J.W.; Jhung, S.H. Adsorptive removal of methyl orange and methylene blue from aqueous solution with a metal-organic framework material, iron terephthalate (MOF-235). J. Hazard. Mater. 2011, 185, 507–511. [Google Scholar] [CrossRef] [PubMed]
  78. Huo, S.-H.; Yan, X.-P. Metal–organic framework mil-100(fe) for the adsorption of Malachite Green from aqueous solution. J. Mater. Chem. 2012, 22, 7449. [Google Scholar] [CrossRef]
  79. Embaby, M.S.; Elwany, S.D.; Setyaningsih, W.; Saber, M.R. The adsorptive properties of uio-66 towards organic dyes: A record adsorption capacity for the anionic dye alizarin red s. Chin. J. Chem. Eng. 2018, 26, 731–739. [Google Scholar] [CrossRef]
  80. Zhao, P.; Zhang, R.; Wang, J. Adsorption of methyl orange from aqueous solution using Chitosan/diatomite composite. Water Sci. Technol. 2017, 75, 1633–1642. [Google Scholar] [CrossRef]
  81. Li, X.; Wang, Z.; Ning, J.; Gao, M.; Jiang, W.; Zhou, Z.; Li, G. Preparation and characterization of a novel polyethyleneimine cation-modified persimmon tannin bioadsorbent for anionic dye adsorption. J. Environ. Manag. 2018, 217, 305–314. [Google Scholar] [CrossRef] [Green Version]
  82. Peng, H.H.; Chen, J.; Jiang, D.Y.; Guo, X.L.; Chen, H.; Zhang, Y.X. Merging of Memory Effect and anion intercalation: Mnox-decorated mgal-LDO as a high-performance nano-adsorbent for the removal of methyl orange. Dalton Trans. 2016, 45, 10530–10538. [Google Scholar] [CrossRef] [PubMed]
  83. Patra, G.; Barnwal, R.; Behera, S.K.; Meikap, B.C. Removal of dyes from aqueous solution by sorption with fly ash using a hydrocyclone. J. Environ. Chem. Eng. 2018, 6, 5204–5211. [Google Scholar] [CrossRef]
  84. Ahmadijokani, F.; Mohammadkhani, R.; Ahmadipouya, S.; Shokrgozar, A.; Rezakazemi, M.; Molavi, H.; Aminabhavi, T.M.; Arjmand, M. Superior chemical stability of uio-66 metal-organic frameworks (mofs) for selective dye adsorption. Chem. Eng. J. 2020, 399, 125346. [Google Scholar] [CrossRef]
  85. Tang, J.; Wang, J. Fe-based metal organic framework/graphene oxide composite as an efficient catalyst for Fenton-like degradation of methyl orange. RSC Adv. 2017, 7, 50829–50837. [Google Scholar] [CrossRef] [Green Version]
  86. Tan, K.L.; Hameed, B.H. Insight into the adsorption kinetics models for the removal of contaminants from aqueous solutions. J. Taiwan Inst. Chem. Eng. 2017, 74, 25–48. [Google Scholar] [CrossRef]
  87. Ho, Y.S.; McKay, G. Pseudo-second order model for sorption processes. Process Biochem. 1999, 34, 451–465. [Google Scholar] [CrossRef]
  88. Ghaedi, M.; Ghaedi, A.M.; Negintaji, E.; Ansari, A.; Vafaei, A.; Rajabi, M. Random forest model for removal of bromophenol blue using activated carbon obtained from Astragalus bisulcatus tree. J. Ind. Eng. Chem. 2014, 20, 1793–1803. [Google Scholar] [CrossRef]
  89. Tong, M.; Liu, D.; Yang, Q.; Devautour-Vinot, S.; Maurin, G.; Zhong, C. Influence of framework metal ions on the dye capture behavior of MIL-100 (Fe, Cr) MOF type solids. J. Mater. Chem. A 2013, 1, 8534. [Google Scholar] [CrossRef]
  90. Ji, W.-J.; Hao, R.-Q.; Pei, W.-W.; Feng, L.; Zhai, Q.-G. Design of two isoreticular CD-biphenyltetracarboxylate frameworks for Dye adsorption, separation and photocatalytic degradation. Dalton Trans. 2018, 47, 700–707. [Google Scholar] [CrossRef]
  91. Hameed, B.H.; Rahman, A.A. Removal of phenol from aqueous solutions by adsorption onto activated carbon prepared from biomass material. J. Hazard. Mater. 2008, 160, 576–581. [Google Scholar] [CrossRef]
  92. Din, A.T.M.; Hameed, B.H.; Ahmad, A.L. Batch adsorption of phenol onto physiochemical-activated coconut shell. J. Hazard. Mater. 2009, 161, 1522–1529. [Google Scholar] [CrossRef]
  93. Srivastava, V.C.; Swamy, M.M.; Mall, I.D.; Prasad, B.; Mishra, I.M. Adsorptive removal of phenol by bagasse fly ash and activated carbon: Equilibrium, kinetics and thermodynamics. Colloids Surf. A Physicochem. Eng. Asp. 2006, 272, 89–104. [Google Scholar] [CrossRef]
  94. Teng, H.; Hsieh, C.-T. Activation Energy for Oxygen Chemisorption on Carbon at Low Temperatures. Ind. Eng. Chem. Res. 1999, 38, 292–297. [Google Scholar] [CrossRef]
  95. Piasecki, W.; Rudziński, W. Application of the statistical rate theory of interfacial transport to investigate the kinetics of divalent metal ion adsorption onto the energetically heterogeneous surfaces of oxides and activated carbons. Appl. Surf. Sci. 2007, 253, 5814–5817. [Google Scholar] [CrossRef]
  96. Weber, W.J.; Morris, J.C. Kinetics of Adsorption on Carbon from Solution. J. Sanit. Eng. Div. 1963, 89, 31–60. [Google Scholar] [CrossRef]
  97. Mittal, A.; Malviya, A.; Kaur, D.; Mittal, J.; Kurup, L. Studies on the adsorption kinetics and isotherms for the removal and recovery of Methyl Orange from wastewaters using waste materials. J. Hazard. Mater. 2007, 148, 229–240. [Google Scholar] [CrossRef]
  98. Wu, F.C.; Tseng, R.L.; Juang, R.S. Initial behavior of intraparticle diffusion model used in the description of adsorption kinetics. Chem. Eng. J. 2009. [CrossRef]
  99. Machado, F.M.; Bergmann, C.P.; Lima, E.C.; Royer, B.; de Souza, F.E.; Jauris, I.M.; Calvete, T.; Fagan, S.B. Adsorption of Reactive Blue 4 dye from water solutions by carbon nanotubes: Experiment and theory. Phys. Chem. Chem. Phys. 2012, 14, 11139. [Google Scholar] [CrossRef]
  100. Dhakshinamoorthy, A.; Alvaro, M.; Garcia, H. Aerobic oxidation of cycloalkenes catalyzed by iron metal organic framework containing N-hydroxyphthalimide. J. Catal. 2012, 289, 259–265. [Google Scholar] [CrossRef]
  101. Langmuir, I. The adsorption of gases on plane surfaces of glass, mica and platinum. J. Am. Chem. Soc. 1918, 40, 1361–1403. [Google Scholar] [CrossRef] [Green Version]
  102. Liu, Y.; Liu, Y.-J. Biosorption isotherms, kinetics and thermodynamics. Sep. Purif. Technol. 2008, 61, 229–242. [Google Scholar] [CrossRef]
  103. Kousha, M.; Daneshvar, E.; Sohrabi, M.S.; Jokar, M.; Bhatnagar, A. Adsorption of acid orange II dye by raw and chemically modified brown macroalga Stoechospermum marginatum. Chem. Eng. J. 2012, 192, 67–76. [Google Scholar] [CrossRef]
  104. Vijayaraghavan, K.; Padmesh, T.; Palanivelu, K.; Velan, M. Biosorption of nickel(II) ions onto Sargassum wightii: Application of two-parameter and three-parameter isotherm models. J. Hazard. Mater. 2006, 133, 304–308. [Google Scholar] [CrossRef] [PubMed]
  105. Basar, C. Applicability of the various adsorption models of three dyes adsorption onto activated carbon prepared waste apricot. J. Hazard. Mater. 2006, 135, 232–241. [Google Scholar] [CrossRef]
  106. Zhou, X.; Zhou, X. The unit problem in the thermodynamic calculation of adsorption using the Langmuir equation. Chem. Eng. Commun. 2014, 201, 1459–1467. [Google Scholar] [CrossRef]
  107. Mahmoodi, N.M.; Najafi, F. Synthesis, amine functionalization and dye removal ability of titania/silica nano-hybrid. Microporous Mesoporous Mater. 2012, 156, 153–160. [Google Scholar] [CrossRef]
  108. Shen, T.; Luo, J.; Zhang, S.; Luo, X. Hierarchically mesostructured MIL-101 metal–organic frameworks with different mineralizing agents for adsorptive removal of methyl orange and methylene blue from aqueous solution. J. Environ. Chem. Eng. 2015, 3, 1372–1383. [Google Scholar] [CrossRef]
  109. Haque, E.; Lo, V.; Minett, A.I.; Harris, A.T.; Church, T.L. Dichotomous adsorption behaviour of dyes on an amino-functionalised metal–organic framework, amino-MIL-101(Al). J. Mater. Chem. A 2014, 2, 193–203. [Google Scholar] [CrossRef]
  110. Angin, D. Utilization of activated carbon produced from fruit juice industry solid waste for the adsorption of Yellow 18 from aqueous solutions. Bioresour. Technol. 2014, 168, 259–266. [Google Scholar] [CrossRef]
  111. Kara, M.; Yuzer, H.; Sabah, E.; Celik, M. Adsorption of cobalt from aqueous solutions onto sepiolite. Water Res. 2003, 37, 224–232. [Google Scholar] [CrossRef]
Figure 1. XRD patterns of MOF samples before and after MO adsorption. The simulated XRD patterns of Cu-BTC and ZIF-8 were sourced from the Cambridge Crystallographic Data Centre database.
Energies 15 04642 g001
Figure 2. SEM micrographs of (a) Cu-BTC; (b) Cu-BTC/MO; (c) ZIF-8; (d) ZIF-8/MO.
Energies 15 04642 g002
Figure 3. TEM micrographs of (a) Fe-BTC; (b) Fe-BTC/MO; (c) ZIF-8; (d) ZIF-8/MO.
Energies 15 04642 g003
Figure 4. FTIR spectra of Fe-BTC, Cu-BTC and ZIF-8 before and after MO adsorption.
Energies 15 04642 g004
Figure 5. TGA profiles of the MOFs before and after MO adsorption.
Energies 15 04642 g005
Figure 6. Comparison of MO removal efficiency of Fe-BTC, Cu-BTC, and ZIF-8 (m = 100 mg, Co = 15 mg/L, pH = 6).
Energies 15 04642 g006
Figure 7. (a) Initial pH’s (pHinitial) effect on equilibrium adsorption capacity (qe); and (b) experimental results of (pHinitial − pHfinal) vs. pHinitial curves used to determine pHPZC of the MOFs.
Energies 15 04642 g007
Figure 8. Cube plot for MO removal efficiency.
Energies 15 04642 g008
Figure 9. (a) Normal plot of the standardized effects; (b) Pareto chart of the standardized effects.
Energies 15 04642 g009
Figure 10. The main effects plot for MO removal efficiency of (a) type of MOF’s, (b) dosage, and (c) initial concentration of MO.
Energies 15 04642 g010
Figure 11. Interaction effects plot for MO removal efficiency.
Energies 15 04642 g011
Figure 12. Multi-vari chart plot for MO removal efficiency. The green diamond symbols represent the mean for each level of dosage while the green line connects the dosage level means and the red square symbols correspond to the means for each level of initial concentration while the red-dashed line connects the initial concentration level means.
Energies 15 04642 g012
Figure 13. Surface graph of dye removal showing interaction of (A) dosage and initial concentration, (B) type and initial concentration, and (C) type and dosage.
Energies 15 04642 g013
Figure 14. Contour plot of dye removal showing the interaction of Fe-BTC dosage and MO initial concentration.
Energies 15 04642 g014
Figure 15. Process optimization curve for a target value of 95% removal of MO on Fe-BTC.
Energies 15 04642 g015
Table 1. The factors and their corresponding levels used in the factorial design.
FactorCodeLow Level (−1)High Level (+1)
Type of MOFAZIF-18Fe-BTC
Dosage (mg)B100200
Initial Concentration (mg/L)C515
Table 2. The factorial design matrix and the experimental response results for MO removal efficiency.
RunsABCMO Removal Efficiency (%)
1−1+1+187.3
2−1−1−188.9
3+1+1+199
4+1−1−196.9
5−1−1+161.5
6−1+1−197.2
7−1−1−188.6
8+1−1+190.9
9−1+1+186.9
10+1+1−1100
11+1−1−196.8
12+1+1−1100
13+1+1+198.1
14+1−1+190.9
15−1−1+166
16−1+1−197.2
Table 3. Analysis of variance (ANOVA) results for RE calculated using Minitab.
SourceDFAdjusted Sum of Squares
(Adj. SS)
Adjusted Mean Squares (Adj. MS)F-Valuep-ValueContribution
A1612.6612.6459.70.00031.39%
B1453.7453.7340.50.00023.25%
C1451.6451.6338.90.00023.14%
AB1110.3110.382.740.0005.650%
AC1191.8191.8144.00.0009.830%
BC194.0994.0970.610.0004.820%
ABC127.0427.0420.290.0021.390%
Error810.661.332
Total71951.68
Main effects71941.02277.288208.100.000
2-way interactions3396.16132.05499.100.000
3-way interaction127.0427.04020.290.002
Table 4. Estimated regression coefficients of the factors and their effects on MO removal.
TermEffectCoefficientStandard Error CoefficientT-Statisticp-Value
Constant 90.390.289313.210.000
A12.386.1880.28921.440.000
B10.655.3250.28918.450.000
C−10.63−5.3120.289−18.410.000
AB−5.250−2.6250.289−9.100.000
AC6.9253.4630.28912.000.000
BC4.8502.4250.2898.400.000
ABC−2.600−1.3000.289−4.500.002
S1.154
R-Sq99.45%
R-Sq (adj.)98.98%
Table 5. Adsorption performance of MO with other adsorbents.
Adsorbent TypepHTime
(Min)
Initial Concentration
(mg/L)
Adsorption Capacity (%)References
Zirconium MOF 31[79]
chitosan/diatomite composite5405088.3[80]
Polyethyleneimine-modified persimmon tannin41203097.6[81]
MnOx-decorated MgAl 204090.5[82]
Fly ash8.5 6066[83]
UiO-66 MOF5.51801087.4[84]
Fe-based MOF/graphene oxide32405098[85]
Fe-BTC6601599This work
Publisher’s Note: MDPI stays neutral with regard to jurisdictional claims in published maps and institutional affiliations.

