
Effects of Bioliquid Recirculation on Hydrothermal Carbonization of Lignocellulosic Biomass
by
 ,
,
Sun-Ju Lee
1,2 ,
,
Min-Ah Oh
2,
Seung-Jin Oh
2,
Na-Hyeon Cho
1,
Young-Yeul Kang
1 and
Jai-Young Lee
2,* 1
Department of Resource Recirculation Research, National Institute of Environmental Research, Seo-gu, Incheon 22689, Korea
2
School of Environmental Engineering, University of Seoul, Dongdaemun-gu, Seoul 02504, Korea
*
Author to whom correspondence should be addressed.
Energies 2022, 15(13), 4903; https://doi.org/10.3390/en15134903
Submission received: 22 April 2022
/
Revised: 17 June 2022
/
Accepted: 29 June 2022
/
Published: 4 July 2022
(This article belongs to the Topic Sustainable Environmental Technologies)
Abstract
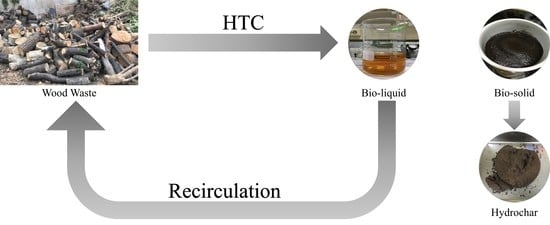
:The characteristics of bioliquid produced through the hydrothermal carbonization (HTC) of wood wastes and the effects of recirculation on hydrochar production were analyzed. The organic acids and total organic carbon of bioliquid increased with progressive recirculation, whereas intermediate byproducts decreased. Hydrochar production by bioliquid recirculation increased mass yield, carbon content, caloric value, and energy yield of the former, while improving its quality as a solid refuse fuel. We concluded that bioliquid recirculation promoted HTC, as demonstrated by Fourier-transform infrared spectroscopy. Furthermore, contrary to predictions, a relatively constant quantity of bioliquid was generated in each step, indicating that its continuous reuse is feasible. Therefore, bioliquid recirculation can improve hydrochar production while simultaneously mitigating the environmental impact of wastewater generation. This method should be considered an important strategy toward the implementation of carbon-neutrality goals.
1. Introduction
In 2015, the international community launched a new climate regime to cope with the climate crisis through the Paris Agreement. South Korea established long-term low greenhouse gas emission development strategies (LEDS) becoming the 14th country in the world to enact legislation requiring the achievement of carbon neutrality by 2050. However, greenhouse gas emissions from South Korea in 2018 reached 727.6 million tons of carbon dioxide equivalent (CO2eq), with the energy sector accounting for 86.9% of emissions [1]. Furthermore, CO2 accounts for 91.4% of total national emissions. Thus, energy production methods that can reduce greenhouse gas emissions are necessary as a contribution toward carbon neutrality goals.
Forests cover 63.7% of Korea’s land area; this proportion is the fourth highest amongst member countries of the Organization for Economic Co-operation and Development (OECD) [2]. However, as forest area decreases and growth stocks increase as a result of forest rehabilitation projects, wood wastes (e.g., roots, branches, stems) generated in processes such as construction and mountain clearing are predicted to consequently increase [3]. These wood wastes include plant biomass such as lignocellulosic biomass. Emissions from plant biomass are not included in greenhouse gas emission inventories as plants absorb CO2 during growth, and the CO2 generated during the burning of solid fuels produced by thermochemical conversion is also absorbed by nature [4]. As wood wastes are usually stockpiled or incinerated, measures to process them in an efficient and eco-friendly manner are required.
The hydrothermal carbonization (HTC) reaction is a thermochemical process that converts biomass into hydrochar and produces biosolid, bioliquid, and biogas. HTC is particularly useful as it can convert biomass with a high moisture content, such as lignocellulosic biomass (which consists of refractory lignin, cellulose, and hemicellulose) [5] and D-xylose, into carbon materials [6]. Previous research on hydrochar production through HTC has detailed the products and byproducts of the reaction. Acetic acid is generated first [7] and acts as a catalyst for dehydration [8,9], one of the main mechanisms of the reaction. When acetic acid is used as a catalyst in the HTC of lignocellulosic biomass, the high heating value of hydrochar increases. As a larger amount of acetic acid was added, the production of hydroxymethylfurfural (HMF), an intermediate bioliquid product, increases [10,11]. However, HTC is a process generated in the aqueous phase, and some organic materials and intermediate byproducts in the biomass are dissolved in bioliquid [12]. Therefore, bioliquid can cause environmental pollution when it is discharged as wastewater due to its high chemical oxygen demand (COD) and total organic carbon (TOC) [12,13]. For this reason, process water recirculation for the economic and ecological treatment of bioliquid has been studied—mostly for biomass from single materials such as poplar wood chips [14], orange and grape pomace [9], loblolly pine [15], sweet potato waste [12], green urban waste [16], paper [17], and laminaria [18]. Across these studies, the mass yield after recirculation always increased; however; the trends of parameters such as the carbon content and caloric value of hydrochar were not consistent. Therefore, despite inconsistencies between different types of starting biomass materials, bioliquid recirculation has been shown to form additional solid matter.
Although recirculation has previously been applied to single-source biomasses, this study aims to develop a method to produce solid fuels using a financially and ecologically sustainable process. We produce hydrochar through composite materials, wood wastes, and HTC; we suppress the generation of wastewater and recover residuals through recirculation and examine the effects of bioliquid recirculation by evaluating the characteristics of the resulting hydrochar. Overall, we sought to develop a technique that contributes to achieving carbon neutrality goals by producing solid fuels through an economic and eco-friendly process.
2. Materials and Methods
2.1. Materials
2.1.1. Wood Wastes
Wood wastes (WW) composed of twigs, bark, and leaves were collected in Dongdaemun-gu, Seoul, South Korea. In addition to being used in this experiment, the samples collected were dried in a drying oven at 105 °C until a constant weight was achieved; they were then pulverized into fragments smaller than 5 mm.
2.1.2. Hydrothermal Carbonization (HTC) Reactor
Hydrochar was produced using 600 mL Parr Series 5500 HP Compact Reactors (Parr Instrument Company, Moline, IL, USA). The stainless-steel reactor was composed of an internal stirrer, pressure and temperature sensors, gas inflow and outflow valves, and an internal cooling loop. The temperature, pressure and revolutions per minute were monitored and adjusted using the connected 4848 Temperature Controller.
2.2. Experiment
2.2.1. Production of Hydrochar and Bioliquid
The mass ratio and reaction temperature of biomass and water were set to 1:5 and 220 °C, respectively [19]. In accordance with the capacity and stability of the reactor, 60 g of biomass and 300 g of distilled water were used as starting materials and reacted at 220 °C for 2 h. After the reaction, the reactor was water-cooled for 5 min, and degassed for 1 min. The head and vessel of the reactor were then separated, and the residual gas was cooled for 30 min. After filtration under reduced pressure for solid–liquid separation, the separated biosolid was dried for 12 h in a drying oven at 105 °C and defined as hydrochar H1. After the pH of the bioliquid was measured, it was marked as L1, and used for the recirculation experiment.
2.2.2. Recirculation
The same amount of biomass was used in the recirculation experiment. The total biomass (excluding the amount needed for analysis) was used in the recirculation treatment of all bioliquid. Distilled water was added to match the mass ratio of biomass to water. The subsequent hydrochar production process was performed as described above. The liquid and hydrochar produced through nine recirculation experiments were marked as L2–L10 and H2–H10, respectively, as per the relevant recirculation step.
2.3. Analyses
2.3.1. Bioliquid Analysis
The bioliquid was stored in a refrigerator at 4 °C, and a 1:1000 dilution of the bioliquid was used for every analysis, excluding that of pH. The pH was measured using the K Series Multimeter K7000-PDC (iSTEK, Seoul, Republic of Korea) in accordance with Korean Standard (KS) ES 04306. The TOC was measured via combustion oxidation at 680 °C using a TOC-V Series instrument (Shimadzu, Kyoto, Japan) and an ASI-V Autosampler.
The organic acids and intermediate products were analyzed using high-performance liquid chromatography (HPLC), Ultimate 3000 (Thermo Fisher Scientific, Waltham, MA, USA), and the refractive index (RI) (ERC RefractoMax 520, DataApex, Prague, Czech Republic) was used as a detector. In the HPLC, 0.01N H2SO4 was used as the mobile phase; a 10 μL sample of this was injected into an Aminex 87H column (300 × 10 mm, Bio-Rad, Hercules, CA, USA) for analysis. The eluent flow rate was 0.5 mL/min and the oven temperature was maintained at 40 °C. A total of 7 standards were used as follows; lactic acid sodium salt (Fluka-Honeywell, Charlotte, USA), citric acid (Showa chem, Beijing, China), malic acid (Kanto chem, Tokyo, Japan), succinic acid (Sigma-Aldrich, Taufkirchen, Germany), oxalic acid (Showa chem, Beijing, China), fumaric acid (Showa chem, Beijing, China), and VOAs mixture (AccuStandard, New Haven, CT, USA).
2.3.2. Hydrochar Analysis
Fourier transform infrared spectroscopy (FT-IR) was performed using a Nicolet iS 10 FT-IR Spectrometer (Thermo Fisher Scientific, Waltham, MA, USA) to analyze changes in the chemical structure of hydrochar due to bio liquid recirculation. The mass yield of hydrochar was calculated as follows, using the mass of the input biomass (Mb), and the mass of the produced hydrochar (Mh):
Changes in the properties of hydrochar due to bioliquid recirculation were analyzed via industrial, elemental, and heating value analyses. For the industrial analysis, the moisture, ash, and volatile matter contents were quantified, and fixed carbon was calculated based on the values obtained, according to ASTM standards D3172, D3173, D3174 and D3175, as follows:
The elemental analysis of hydrochar was conducted using a carbon, hydrogen, nitrogen, and sulfur (CHNS) analyzer (Thermal Fisher Scientific, Waltham, MA, USA) according to ASTM D3176. The oxygen content of the hydrochar was calculated based on the CHNS values and ash content:
The high heating value (HHV) was analyzed using an ECO bomb calorimeter (DDS CALORIMETERS, South Africa) according to KS E 3707. The low heating value (LHV) was calculated based on the HHV, and results of the elemental and industrial analyses, as follows:
The energy density (ED) and energy yield (EY) were calculated based on these values, as shown below, to evaluate the effects of bioliquid recirculation on the characteristics of hydrochar energy:
3. Results and Discussion
3.1. Characteristics of Bioliquid
3.1.1. Production and pH of Bioliquid
The first HTC experiment produced 228 g of bioliquid. It was expected that the quantities produced would decrease with progressive recirculation, but similar amounts of bioliquid (in the range of 221–228 g) were produced at every step. Additionally, all of the bioliquid generated in the experiments had a yellowish-brown color that tended to darken with progressive recirculation. The pH of all bioliquid samples ranged from 3.4 to 3.6, as confirmed to be acidic as in the other studies [14,15,16,17].
3.1.2. Organic Acid and Total Organic Carbon Analyses
Acetic and formic acid were detected using organic acid analysis via HPLC. Xylose accounts for approximately 20–30% by weigh of lignocellulosic biomass, and d-xylose (wood sugar) is the main structure of hemicellulose [20]. The monosaccharides in cellulose and hemicellulose are released through hydrolysis [21]. Therefore, the detected acids could be generated via the hydrolysis of hemicellulose, and the dehydration reactions of d-xylose [22,23] or lignin side chains [6,24]. In particular, they could be produced by the degradation of C5 and C6 sugars [25].
The concentration of acetic acid increased from 11.6 g/L to 35.1 g/L, rising sharply until L6 (Figure 1). After this, the increase was insignificant; however, all subsequent concentrations were higher than that of L1. Formic acid levels rose sharply to 4.1 g/L in L5 before decreasing to 4.0 g/L in L6. However, it increased significantly to 4.5 g/L in L7, showing a similar trend to that of acetic acid. Therefore, the changes in concentration of acetic and formic acid were similar, and the pH of each sample of bioliquid was affected by organic acid levels. This acidic condition can produce water-soluble intermediates by promoting the degradation of biomass into monosaccharides [26,27].
The TOC, in particular, increased sharply to 30 g/L in L6, where five cycles of recirculation had occurred, indicating that this metric was affected by increasing levels of acetic acid (Figure 1). Furthermore, H2O was generated by the decomposition of formic acid under hydrothermal conditions [6,28] (see also [29]) suggesting that a relatively constant amount of bioliquid was generated at all steps of the process.
3.1.3. Intermediate Analysis of Bioliquid
In this example, 5-HMF and furfural were identified as intermediate products in the bioliquid. These are production of dehydration of hexoses [20] and xylose into pentose sugar by acid-catalyzed [30,31]. Organic acids from lignocellulosic biomass decomposition, which accumulated in the bioliquid, could act as homogeneous catalysts when hexoses and pentoses are hydrolyzed to 5-HMF and furfural [16,32,33]. Therefore, it can be considered that the generation of 5-HMF and furfural was influenced by the organic acids analyzed previously. In addition, 5-HMF and furfural can catalyze the condensation reaction of lignin [34,35].
The levels of the intermediate products decreased with the progression of bioliquid recirculation, showing a trend opposite to those of the organic acid levels (Figure 2). The 5-HMF decreased from 1.5 g/L to 0.9 g/L, while furfural decreased from 0.7 g/L to 0.2 g/L, likely as a result of their condensation reactions. Furthermore, the yellowish-brown color of every bioliquid was likely the result of furfural oxidization after contact with air as the furfural formed a yellowish-brown synthetic resin. It can also be the result of decomposition and dissolution of organic matter [24,36].
3.2. Characteristics of Hydrochar
3.2.1. Fourier Transform Infrared Analysis of Hydrochar
FT-IR analysis was performed to examine the effects of bioliquid recirculation on the characteristics of hydrochar (Figure 3). A peak at 1160 cm−1 signified the vibration characteristics of cellulose and hemicellulose in all hydrochar. This indicated the presence of undecomposed crystalline cellulose and hemicellulose. A peak at 3700 cm−1 that was only observed in WW indicated the presence of alcohol (O-H), implying that this was what was decomposed by HTC. A peak from 3600–3200 cm−1, which indicated an O-H bond, was discovered in every sample; however, it tended to decrease gradually with the recirculation of bioliquid. This indicated that bioliquid recirculation accelerated hydrolysis by HTC. We hypothesize that the amount of bioliquid produced remained constant because of this phenomenon. The peak decreased significantly after H6 because hydrolysis had been promoted by organic acids in the bioliquid, which were more scarce following this cycle. Due to the acidity of the initial environment, the degradation response strengthened, leading to the further decomposition of glucose. A peak at 3300 cm−1, indicating a carboxylic acid compound, was caused by the oxidation of alcohol and the hydrolysis of ester. This peak showed a trend similar to previous peaks, decreasing significantly at H6.
In the presence of a peak from 1750–1700 cm−1, an additional peak in the 1200–1100 cm−1 range indicates the presence of an ester compound, which is generated by condensation polymerization after water is decomposed in acid and alcohol. The peak observed in this range showed the greatest and most distinct vibration characteristics in H1. This suggested that the ester bond was broken due to active hydrolysis during bioliquid recirculation. We thus concluded that alcohol was decomposed by HTC and that the recirculation of bioliquid accelerated the HTC mechanism.
3.2.2. Mass Yield of Hydrochar
Figure 4 shows the mass yield of hydrochar. The mass yield increased the most in the first step of bioliquid recirculation, from 65% in H1 to 69% in H2, and reached its highest, 70% in H6. The increase in mass yield in H1 to H2 is more pronounced than that in the other stages. This is because H1 is a hydrochar produced using biomass and water, whereas H2 is hydrochar produced by recirculation bioliquid. In other words, there is no material catalyzing the HTC mechanism when H1 was produced. However, when H2 is generated, the HTC mechanism is promoted by organic acids and intermediates in the bioliquid; therefore, it shows a rapid increase rate compared with other steps. The mass yield of hydrochar was lower than that of biomass because cellulose and hemicellulose are decomposed to form by-products in gaseous and liquid states [37].
The hydrochar yield did not increase consistently with the progress of recirculation, but all the values from H2–H10 were higher than the value in H1. This increase was the result of organic molecules in the bioliquid forming additional solid materials [17]. In particular, the HMF decomposed from cellulose and lignin formed a precipitate called HTC-coal via continuous polymerization and condensation reactions [6]. Therefore, the recirculation of bioliquid increased the production of hydrochar.
3.2.3. Proximate Analysis of Hydrochar
Table 1 shows the results of the proximate analysis of biomass and hydrochar. The ash content of hydrochar generated through bioliquid recirculation increased, whereas the content of volatiles decreased. The increase in ash content can be attributed to the accumulation of inorganic components [9,38]. The fixed carbon content did not increase regularly with the progression of bioliquid recirculation, but it was higher than H1 in all other samples. In addition, H2, where bioliquid recirculation was first applied, showed the highest increase rate compared with the previous stage. This shows a similar trend to the result of the mass yield.
3.2.4. Changes in the Properties of Hydrochar Fuel
Table 2 shows the result of the ultimate analysis of biomass and hydrochar. The carbon content presented the largest rate of increase, rising from 55.7% in H1 to 58.4% in H2. This is similar to the result of mass yield and proximate analysis. This indicates that some of the additional solids produced by bioliquid recirculation are carbon. Additionally, all the carbon content in samples H2–H10 were higher than that in H1, reaching the highest value of 59.7% in H5. In H6, which showed the highest yield, the carbon content was 59.1%, having decreased minutely after H5.
Table 3 shows the combustion characteristics. The HHV measurements increased with bioliquid recirculation, reaching its highest value of 24.78 MJ/kg in H10. In contrast, the highest value obtained from calculating the LHV through elemental analysis was 23.04 MJ/kg in H7 and H8. This indicates that bioliquid recirculation can improve the value of hydrochar as fuel while increasing its pure carbon content. The energy densities of the biomass and hydrochar, and their energy yield, tended to increase with the progression of bioliquid recirculation. Moreover, this increase showed a similar trend to previous results. The energy yield, which was 80%, was increased to 90% after the recirculation of bioliquid, and increased continuously to 94% following the final reaction.
Overall, we found that some of the solid materials that were generated through progressive water recirculation were carbon materials, meaning that bioliquid recirculation can recover resources and increase energy recovery rates.
4. Conclusions
To conclude, we have investigated the impact of bioliquid recirculation on solid hydrochar production by hydrothermal carbonization as a carbon-neutral wood waste processing technique. Bioliquid was generated in a relatively constant quantity for every recirculation step, and acetic acid, formic acid, 5-HMF, and furfural were generated as intermediate products. Organic acids and intermediate products promoted the HTC mechanism, thus increasing the mass yield, carbon content, heating value, and energy density of hydrochar. Our findings have a wide range of applications in the field of wood waste processing and any processing that involves hydrothermal carbonization. Therefore, bioliquid recirculation can be proposed as a method for developing an eco-friendly HTC process by recovering resources from wastewater and as a means of sustainable energy production for carbon neutrality.
Author Contributions
Conceptualization, S.-J.L.; Formal analysis, S.-J.O.; Investigation, S.-J.O., N.-H.C. and Y.-Y.K.; Methodology, S.-J.L.; Supervision, J.-Y.L.; Visualization, S.-J.L.; Writing—original draft, S.-J.L.; Writing—review & editing, M.-A.O. All authors have read and agreed to the published version of the manuscript.
Funding
This research was funded by the National Institute of Environmental Research, Republic of Korea (No. NIER-2021-03-01-006).
Institutional Review Board Statement
Not applicable.
Informed Consent Statement
Not applicable.
Data Availability Statement
Not applicable.
Acknowledgments
The author acknowledge the research support provided by the Ministry of Environment (MOE) of the Republic of Korea.
Conflicts of Interest
The authors declare no conflict of interest.
References
- Greenhouse Gas Inventory and Research Center of Korea. National Inventory Report 2021; Ministry of Environment: Seoul, Korea, 2021.
- Korea Forest Service. Forestry Statistics 2020; Korea Forest Service: Daejeon, Korea, 2021.
- Ministry of Environment Republic of Korea. Enforcement Rule of The Wastes Control Act. Available online: https://law.go.kr/lsSc.do?section=&menuId=1&subMenuId=15&tabMenuId=81&eventGubun=060101&query=%ED%8F%90%EA%B8%B0%EB%AC%BC%EA%B4%80%EB%A6%AC%EB%B2%95#J14551159 (accessed on 21 July 2017).
- Intergovernmental Panel on Climate Change. Good Practice Guidance and Uncertainty Management in National Greenhouse Gas Inventories; Intergovernmental Panel on Climate Change: Geneva, Switzerland, 2000. [Google Scholar]
- Anwar, Z.; Gulfraz, M.; Irshad, M. Agro-industrial lignocellulosic biomass a key to unlock the future bio-energy: A brief review. J. Radiat. Res. Appl. Sci. 2014, 7, 163–173. [Google Scholar] [CrossRef]
- Funke, A.; Ziegler, F. Hydrothermal carbonization of biomass: A summary and discussion of chemical mechanisms for process engineering. Biofuels Bioprod. Biorefin. 2010, 4, 160–177. [Google Scholar] [CrossRef]
- Yan, W.; Hastings, J.T.; Acharjee, T.C.; Coronella, C.J.; Vásquez, V.R. Mass and Energy Balances of Wet Torrefaction of Lignocellulosic Biomass. Energy Fuels 2010, 24, 4738–4742. [Google Scholar] [CrossRef]
- Boutaieb, M.; Román, S.; Ledesma, B.; Sabio, E.; Guiza, M.; Ouederni, A. Towards a more efficient Hydrothermal Carbonization: Processing water recirculation under different conditions. Waste Manag. 2021, 132, 115–123. [Google Scholar] [CrossRef] [PubMed]
- Kabadayi Catalkopru, A.; Kantarli, I.C.; Yanik, J. Effects of spent liquor recirculation in hydrothermal carbonization. Bioresour. Technol. 2017, 226, 89–93. [Google Scholar] [CrossRef] [PubMed]
- Lynam, J.G.; Coronella, C.J.; Yan, W.; Reza, M.T.; Vasquez, V.R. Acetic acid and lithium chloride effects on hydrothermal carbonization of lignocellulosic biomass. Bioresour. Technol. 2011, 102, 6192–6199. [Google Scholar] [CrossRef]
- Xu, C.; Leppänen, A.-S.; Eklund, P.; Holmlund, P.; Sjöholm, R.; Sundberg, K.; Willför, S. Acetylation and characterization of spruce (Picea abies) galactoglucomannans. Carbohydr. Res. 2010, 345, 810–816. [Google Scholar] [CrossRef]
- Chen, X.; Ma, X.; Peng, X.; Lin, Y.; Wang, J.; Zheng, C. Effects of aqueous phase recirculation in hydrothermal carbonization of sweet potato waste. Bioresour. Technol. 2018, 267, 167–174. [Google Scholar] [CrossRef]
- Becker, R.; Dorgerloh, U.; Paulke, E.; Mumme, J.; Nehls, I. Hydrothermal Carbonization of Biomass: Major Organic Components of the Aqueous Phase. Chem. Eng. Technol. 2014, 37, 511–518. [Google Scholar] [CrossRef]
- Stemann, J.; Putschew, A.; Ziegler, F. Hydrothermal carbonization: Process water characterization and effects of water recirculation. Bioresour. Technol. 2013, 143, 139–146. [Google Scholar] [CrossRef]
- Uddin, M.H.; Reza, M.T.; Lynam, J.G.; Coronella, C.J. Effects of water recycling in hydrothermal carbonization of loblolly pine. Environ. Prog. Sustain. Energy 2013, 33, 1309–1315. [Google Scholar] [CrossRef]
- Köchermann, J.; Görsch, K.; Wirth, B.; Mühlenberg, J.; Klemm, M. Hydrothermal carbonization: Temperature influence on hydrochar and aqueous phase composition during process water recirculation. J. Environ. Chem. Eng. 2018, 6, 5481–5487. [Google Scholar] [CrossRef]
- Weiner, B.; Poerschmann, J.; Wedwitschka, H.; Koehler, R.; Kopinke, F.-D. Influence of Process Water Reuse on the Hydrothermal Carbonization of Paper. ACS Sustain. Chem. Eng. 2014, 2, 2165–2171. [Google Scholar] [CrossRef]
- Wang, F.; Wang, J.; Gu, C.; Han, Y.; Zan, S.; Wu, S. Effects of process water recirculation on solid and liquid products from hydrothermal carbonization of Laminaria. Bioresour. Technol. 2019, 292, 121996. [Google Scholar] [CrossRef] [PubMed]
- Watanabe, A.; Morita, S.; Ozaki, Y. Study on Temperature-Dependent Changes in Hydrogen Bonds in Cellulose Iβ by Infrared Spectroscopy with Perturbation-Correlation Moving-Window Two-Dimensional Correlation Spectroscopy. Biomacromolecules 2006, 7, 3164–3170. [Google Scholar] [CrossRef] [PubMed]
- Cheng, K.; Zheng, W.; Chen, H.; Zhang, Y.-H.P.J. Upgrade of wood sugar d-xylose to a value-added nutraceutical by in vitro metabolic engineering. Metab. Eng. 2019, 52, 1–8. [Google Scholar] [CrossRef]
- Oliveira, P.C.; Canhaci, S.J.; Gabriel, C.B.; Moreira, C.R.; de Farias, A.M.D.; Fraga, M.A. Conversion of xylose to bioproducts on bifunctional supported platinum-group metals catalysts. Curr. Res. Green Sustain. Chem. 2022, 5, 100305. [Google Scholar] [CrossRef]
- Świątek, K.; Gaag, S.; Klier, A.; Kruse, A.; Sauer, J.; Steinbach, D. Acid Hydrolysis of Lignocellulosic Biomass: Sugars and Furfurals Formation. Catalysts 2020, 10, 437. [Google Scholar] [CrossRef] [Green Version]
- Oefner, P.J.; Lanziner, A.H.; Bonn, G.; Bobleter, O. Quantitative studies on furfural and organic acid formation during hydrothermal, acidic and alkaline degradation of D-xylose. Monatsh. Chem. 1992, 123, 547–556. [Google Scholar] [CrossRef]
- Peterson, A.A.; Vogel, F.; Lachance, R.P.; Fröling, M.; Antal, M.J., Jr.; Tester, J.W. Thermochemical biofuel production in hydrothermal media: A review of sub- and supercritical water technologies. Energy Environ. Sci. 2008, 1, 32–65. [Google Scholar] [CrossRef]
- Antczak, A.; Szadkowski, J.; Szadkowska, D.; Zawadzki, J. Assessment of the effectiveness of liquid hot water and steam explosion pretreatments of fast-growing poplar (Populus trichocarpa) wood. Wood Sci. Technol. 2021, 56, 87–109. [Google Scholar] [CrossRef]
- Sharma, H.B.; Panigrahi, S.; Vanapalli, K.R.; Cheela, V.S.; Venna, S.; Dubey, B. Study on the process wastewater reuse and valorisation during hydrothermal co-carbonization of food and yard waste. Sci. Total Environ. 2022, 806, 150748. [Google Scholar] [CrossRef] [PubMed]
- Picone, A.; Volpe, M.; Messineo, A. Process Water Recirculation during Hydrothermal Carbonization of Waste Biomass: Current Knowledge and Challenges. Energies 2021, 14, 2962. [Google Scholar] [CrossRef]
- Mccollom, T.M.; Ritter, G.; Simoneit, B.R.T. Lipid synthesis under hydrothermal conditions by Fischer–Tropsch-Type reactions. Orig. Life Evol. Biosph. 1999, 29, 153–166. [Google Scholar] [CrossRef]
- Yu, J.; Savage, P.E. Decomposition of Formic Acid under Hydrothermal Conditions. Ind. Eng. Chem. Res. 1998, 37, 2–10. [Google Scholar] [CrossRef]
- Lange, J.-P. Lignocellulose conversion: An introduction to chemistry, process and economics. Biofuels Bioprod. Biorefining 2007, 1, 39–48. [Google Scholar] [CrossRef]
- Schwiderski, M.; Kruse, A.; Grandl, R.; Dockendorf, D. Comparison of the influence of a Lewis acid AlCl3 and a Brønsted acid HCl on the organosolv pulping of beech wood. Green Chem. 2014, 16, 1569–1578. [Google Scholar] [CrossRef]
- Kang, S.; Li, X.; Fan, J.; Chang, J. Characterization of Hydrochars Produced by Hydrothermal Carbonization of Lignin, Cellulose, d-Xylose, and Wood Meal. Ind. Eng. Chem. Res. 2012, 51, 9023–9031. [Google Scholar] [CrossRef]
- Yemis, O.; Mazza, G. Acid-catalyzed conversion of xylose, xylan and straw into furfural by microwave-assisted reaction. Bioresour. Technol. 2011, 102, 7371–7378. [Google Scholar] [CrossRef]
- Parajo, J.C.; Arbeit, D. Hydrothermal processing of lignocellulosic materials. Eur. J. Wood Prod. 1999, 57, 191–202. [Google Scholar]
- Leng, S.; Li, W.; Han, C.; Chen, L.; Chen, J.; Fan, L.; Lu, Q.; Li, J.; Leng, L.; Zhou, W. Aqueous phase recirculation during hydrothermal carbonization of microalgae and soybean straw: A comparison study. Bioresour. Technol. 2020, 298, 122502. [Google Scholar] [CrossRef] [PubMed]
- Xu, X.; Jiang, E. Treatment of urban sludge by hydrothermal carbonization. Bioresour. Technol. 2017, 238, 182–187. [Google Scholar] [CrossRef] [PubMed]
- Kambo, H.S.; Minaret, J.; Dutta, A. Process Water from the Hydrothermal Carbonization of Biomass: A Waste or a Valuable Product? Waste Biomass Valorization 2018, 9, 1181–1189. [Google Scholar] [CrossRef]
- Leng, S.; Leng, L.; Chen, L.; Chen, J.; Chen, J.; Zhou, W. The effect of aqueous phase recirculation on hydrothermal liquefaction/carbonization of biomass: A review. Bioresour. Technol. 2020, 318, 124081. [Google Scholar] [CrossRef] [PubMed]
Figure 1.
Concentration of organic acids and TOC in bioliquid.
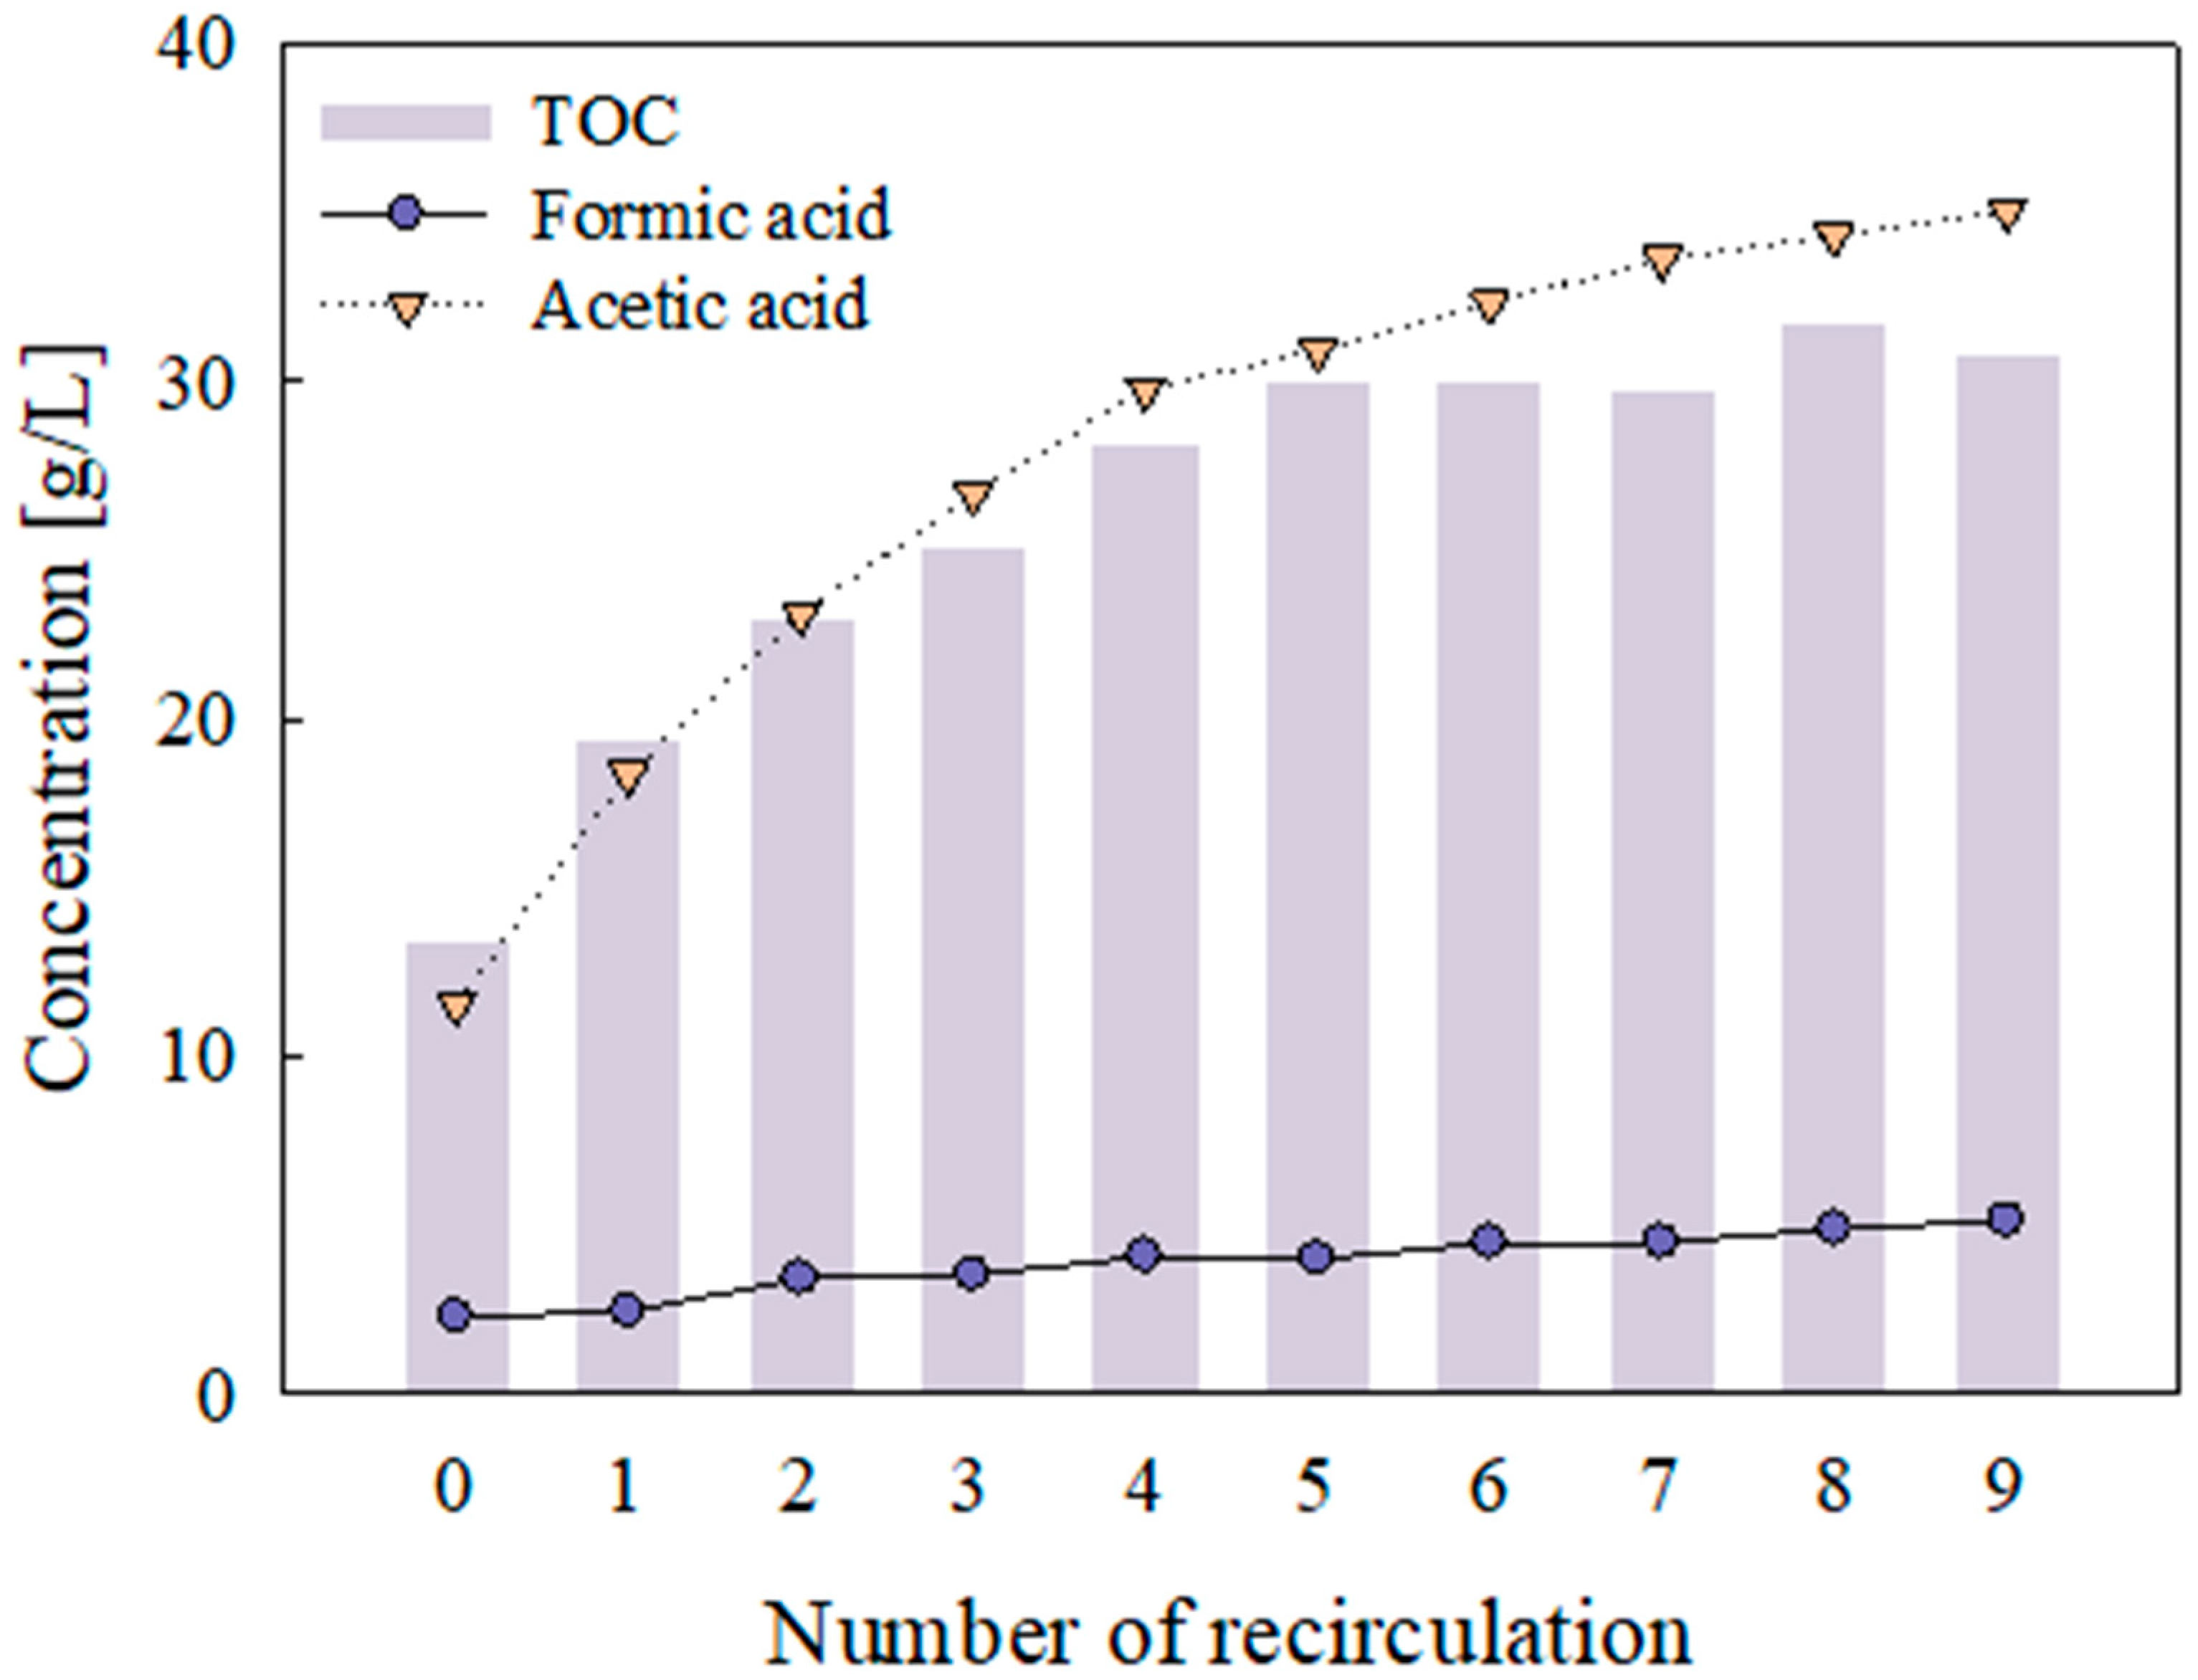
Figure 2.
Concentration of intermediate products in bioliquid.

Figure 3.
FT-IR result of biomass and hydrochar.
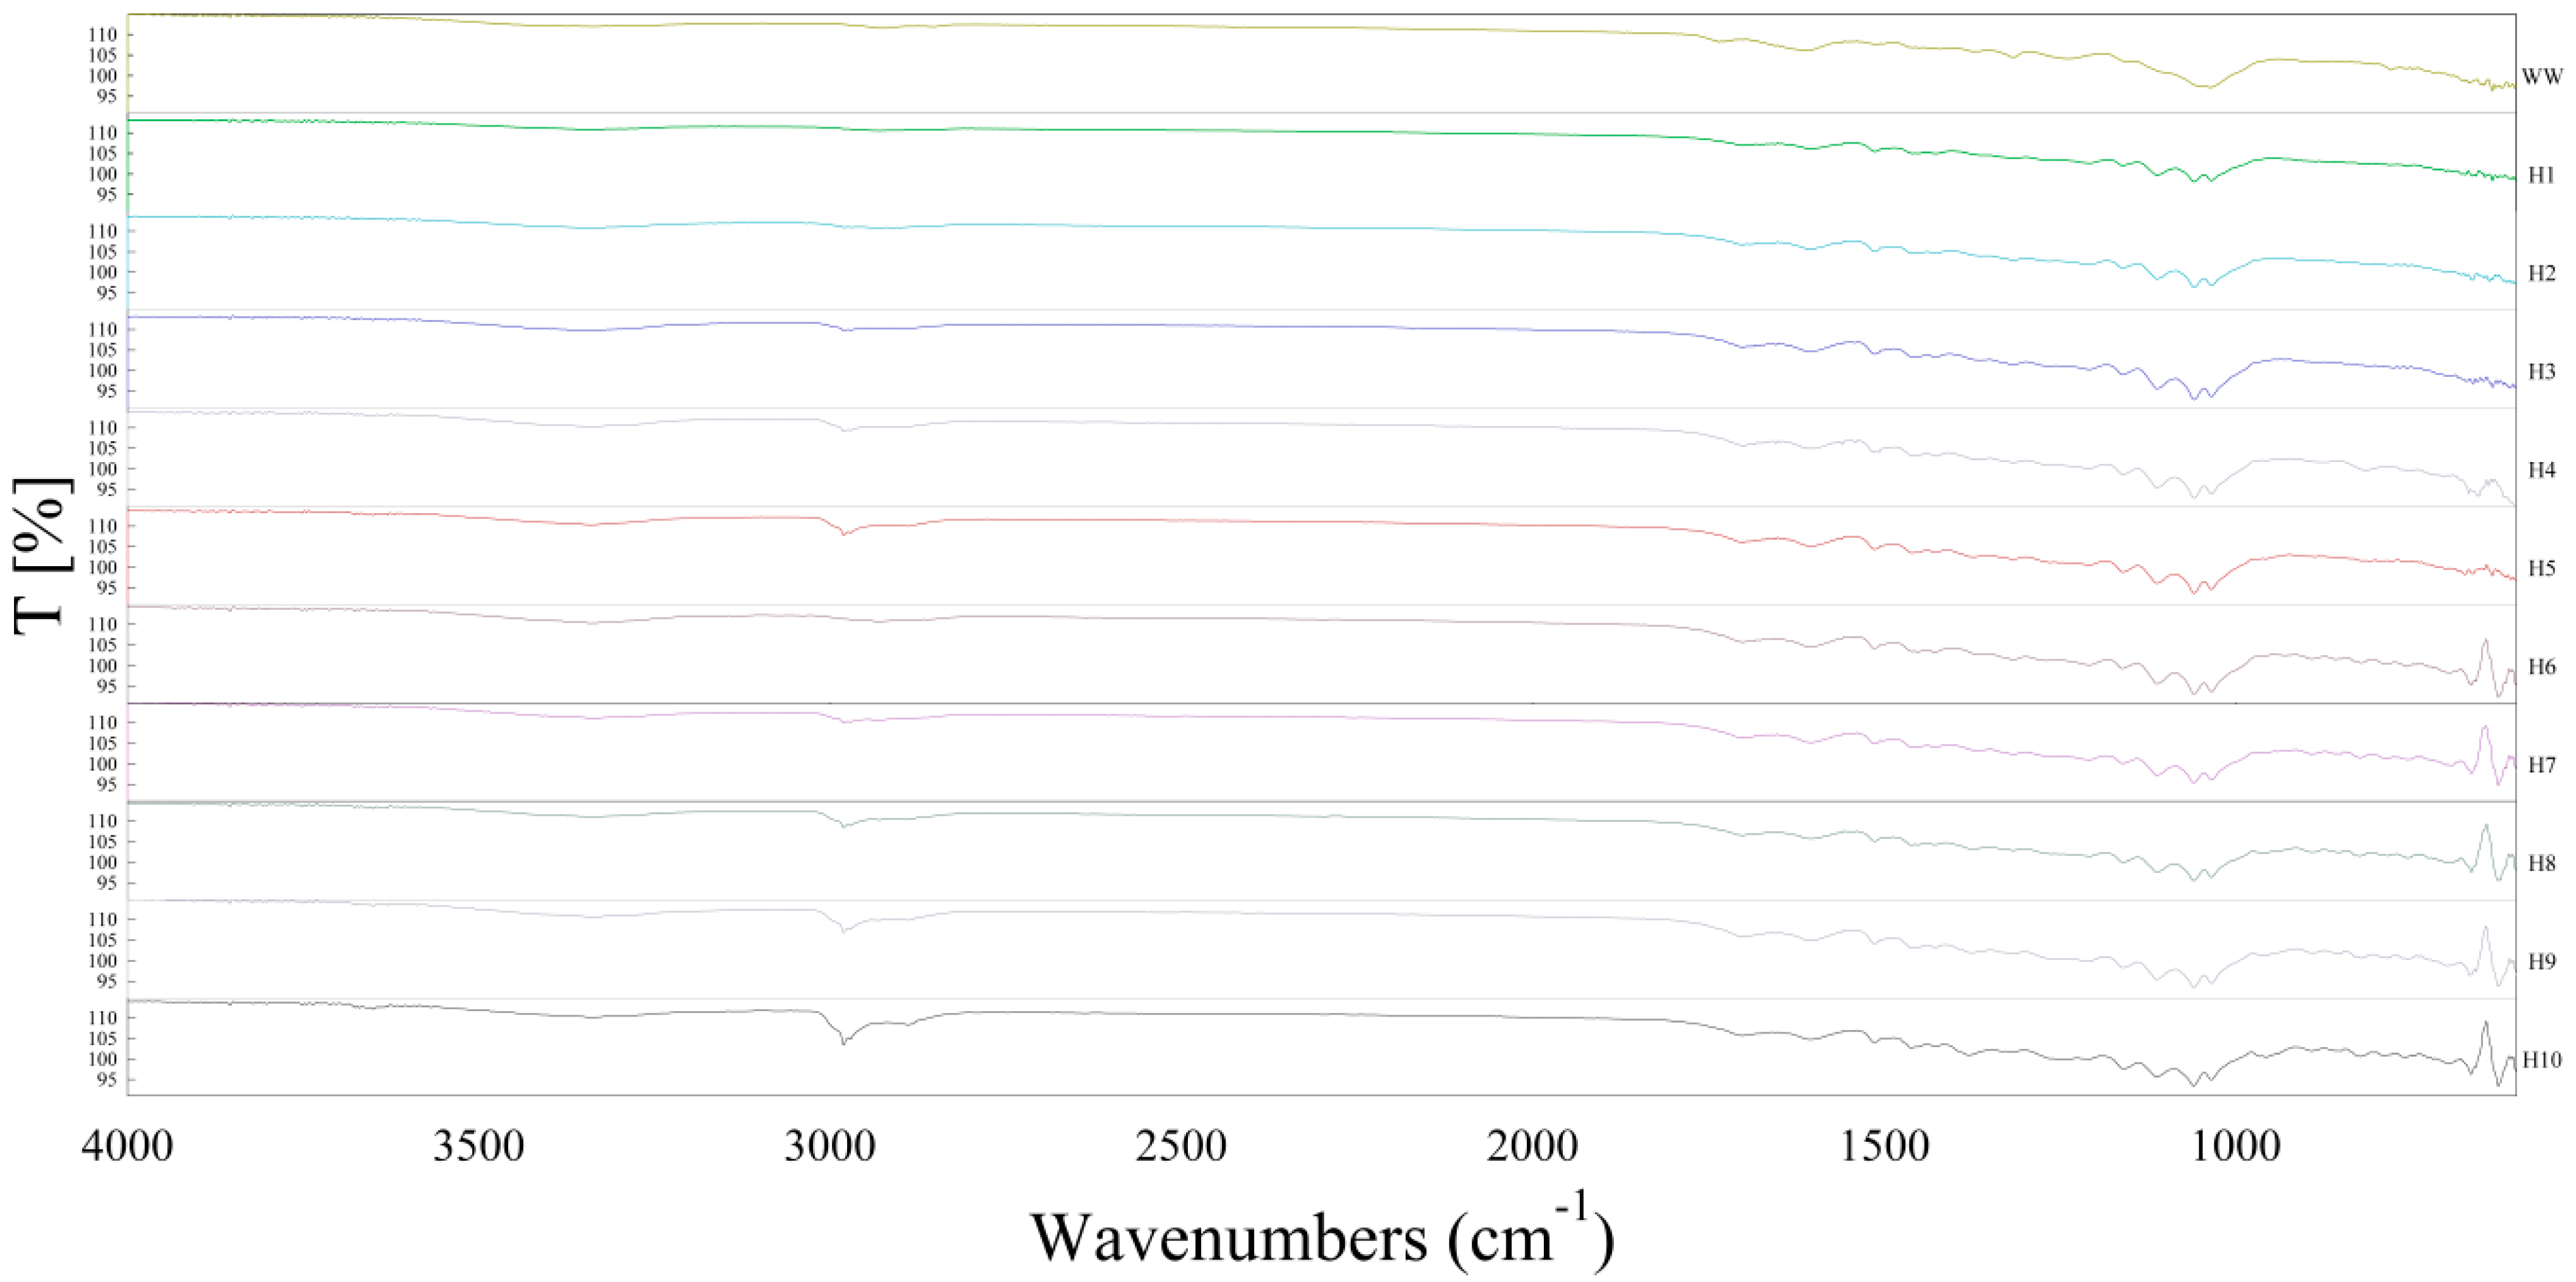
Figure 4.
Mass yield of hydrochar.


Table 1.
Proximate analysis of biomass and hydrochar.
| Proximate Analysis, wt% | Fixed Carbon, % | |||
|---|---|---|---|---|
| Moisture Content | Ash Content | Volatile Matter | ||
| WW | 6.03 ± 0.16 | 1.84 ± 0.24 | 76.94 ± 0.31 | 15.19 ± 0.42 |
| H1 | 2.68 ± 0.04 | 2.35 ± 0.27 | 68.47 ± 0.04 | 26.51 ± 0.34 |
| H2 | 2.54 ± 0.14 | 2.31 ± 0.24 | 66.91 ± 0.11 | 28.24 ± 0.21 |
| H3 | 2.00 ± 0.07 | 2.37 ± 0.35 | 67.90 ± 0.19 | 27.72 ± 0.13 |
| H4 | 1.57 ± 0.04 | 2.89 ± 0.03 | 67.46 ± 1.17 | 28.08 ± 1.10 |
| H5 | 1.28 ± 0.05 | 3.09 ± 0.06 | 66.76 ± 0.09 | 28.86 ± 0.11 |
| H6 | 2.30 ± 0.02 | 2.71 ± 0.10 | 66.06 ± 0.38 | 28.93 ± 0.29 |
| H7 | 1.98 ± 0.07 | 2.85 ± 0.12 | 65.62 ± 0.27 | 29.55 ± 0.33 |
| H8 | 2.21 ± 0.07 | 2.86 ± 0.18 | 65.18 ± 0.25 | 29.74 ± 0.19 |
| H9 | 2.75 ± 0.02 | 2.88 ± 0.01 | 66.32 ± 0.45 | 28.05 ± 0.46 |
| H10 | 2.44 ± 0.01 | 3.07 ± 0.08 | 65.86 ± 0.42 | 28.63 ± 0.36 |
Table 2.
Ultimate analysis of biomass and hydrochar.
| Ultimate Analysis, wt% | |||||
|---|---|---|---|---|---|
| C | H | N | S | O | |
| WW | 41.8 ± 2.13 | 6.2 ± 0.23 | 0.8 ± 0.02 | 0.05 ± 0.00 | 49.3 ± 0.06 |
| H1 | 55.7 ± 3.02 | 5.9 ± 1.41 | 0.5 ± 0.03 | 0.05 ± 0.00 | 35.5 ± 0.07 |
| H2 | 58.4 ± 0.86 | 5.9 ± 1.23 | 0.6 ± 0.03 | 0.05 ± 0.00 | 32.7 ± 0.03 |
| H3 | 59.3 ± 1.08 | 7.0 ± 1.80 | 0.6 ± 0.01 | 0.05 ± 0.00 | 30.6 ± 0.04 |
| H4 | 59.2 ± 0.24 | 7.2 ± 0.87 | 0.6 ± 0.02 | 0.05 ± 0.00 | 30.1 ± 0.01 |
| H5 | 59.7 ± 0.18 | 6.9 ± 0.95 | 0.6 ± 0.01 | 0.05 ± 0.00 | 29.7 ± 0.01 |
| H6 | 59.1 ± 0.39 | 6.7 ± 0.86 | 0.6 ± 0.02 | 0.05 ± 0.00 | 30.9 ± 0.02 |
| H7 | 58.7 ± 0.68 | 6.5 ± 1.11 | 0.6 ± 0.02 | 0.05 ± 0.00 | 31.3 ± 0.02 |
| H8 | 59.1 ± 0.74 | 6.8 ± 0.91 | 0.6 ± 0.01 | 0.05 ± 0.00 | 30.6 ± 0.03 |
| H9 | 59.0 ± 0.20 | 6.9 ± 1.11 | 0.6 ± 0.03 | 0.05 ± 0.00 | 30.6 ± 0.02 |
| H10 | 59.2 ± 0.66 | 7.5 ± 1.17 | 0.6 ± 0.01 | 0.05 ± 0.00 | 29.7 ± 0.03 |
Table 3.
The combustion characteristic of biomass and hydrochar.
| HHV, MJ/kg | LHV, MJ/kg | ED | EY, % | |
|---|---|---|---|---|
| WW | 18.02 ± 0.35 | 16.47 ± 0.47 | - | - |
| H1 | 22.67 ± 0.36 | 21.27 ± 0.16 | 1.26 ± 0.04 | 80.03 ± 2.27 |
| H2 | 23.24 ± 0.54 | 21.84 ± 0.32 | 1.29 ± 0.05 | 89.59 ± 3.10 |
| H3 | 23.49 ± 0.29 | 21.85 ± 0.60 | 1.30 ± 0.02 | 88.78 ± 1.34 |
| H4 | 23.63 ± 0.17 | 21.96 ± 0.06 | 1.31 ± 0.03 | 88.56 ± 2.28 |
| H5 | 23.73 ± 0.07 | 22.14 ± 0.23 | 1.32 ± 0.02 | 89.63 ± 1.48 |
| H6 | 24.52 ± 0.30 | 22.94 ± 0.11 | 1.36 ± 0.03 | 92.81 ± 2.02 |
| H7 | 24.55 ± 0.18 | 23.04 ± 0.34 | 1.36 ± 0.02 | 92.26 ± 1.10 |
| H8 | 24.63 ± 0.08 | 23.04 ± 0.28 | 1.37 ± 0.03 | 92.50 ± 1.72 |
| H9 | 24.53 ± 0.01 | 22.90 ± 0.26 | 1.36 ± 0.03 | 92.92 ± 1.74 |
| H10 | 24.78 ± 0.06 | 23.03 ± 0.25 | 1.38 ± 0.02 | 94.38 ± 1.68 |
Publisher’s Note: MDPI stays neutral with regard to jurisdictional claims in published maps and institutional affiliations. |
© 2022 by the authors. Licensee MDPI, Basel, Switzerland. This article is an open access article distributed under the terms and conditions of the Creative Commons Attribution (CC BY) license (https://creativecommons.org/licenses/by/4.0/).
Share and Cite
MDPI and ACS Style
Lee, S.-J.; Oh, M.-A.; Oh, S.-J.; Cho, N.-H.; Kang, Y.-Y.; Lee, J.-Y. Effects of Bioliquid Recirculation on Hydrothermal Carbonization of Lignocellulosic Biomass. Energies 2022, 15, 4903. https://doi.org/10.3390/en15134903
AMA Style
Lee S-J, Oh M-A, Oh S-J, Cho N-H, Kang Y-Y, Lee J-Y. Effects of Bioliquid Recirculation on Hydrothermal Carbonization of Lignocellulosic Biomass. Energies. 2022; 15(13):4903. https://doi.org/10.3390/en15134903
Chicago/Turabian StyleLee, Sun-Ju, Min-Ah Oh, Seung-Jin Oh, Na-Hyeon Cho, Young-Yeul Kang, and Jai-Young Lee. 2022. "Effects of Bioliquid Recirculation on Hydrothermal Carbonization of Lignocellulosic Biomass" Energies 15, no. 13: 4903. https://doi.org/10.3390/en15134903
Note that from the first issue of 2016, this journal uses article numbers instead of page numbers. See further details here.