Article

Integration of Pore-Scale Visualization and an Ultrasonic Test System of Methane Hydrate-Bearing Sediments

1
Key Laboratory of Gas Hydrate, Ministry of Natural Resources, Qingdao Institute of Marine Geology, Qingdao 266237, China
2
Laboratory for Marine Mineral Resources, Qingdao National Laboratory for Marine Science and Technology, Qingdao 266237, China
3
Qingdao Geo-Engineering Surveying Institute (Qingdao Geological Exploration and Development Bureau), Qingdao 266100, China
4
Key Laboratory of Geological Safety of Coastal Urban Underground Space, Ministry of Natural Resources, Qingdao 266100, China
*
Authors to whom correspondence should be addressed.
Energies 2022, 15(14), 4938; https://doi.org/10.3390/en15144938
Submission received: 24 May 2022 / Revised: 21 June 2022 / Accepted: 4 July 2022 / Published: 6 July 2022
(This article belongs to the Special Issue Burial Characteristics and Exploitation of Natural Gas Hydrate)

Abstract

:
The acoustic characteristics of hydrates are important parameters in geophysical hydrate exploration and hydrate resource estimation. The microscale distribution of hydrate has an important influence on the acoustic response of a hydrate-bearing reservoir. Although microscale hydrate distributions can be determined using means such as X-ray computed tomography (X-CT), it is difficult to obtain acoustic parameters for the same sample. In this study, we developed an experimental system that integrated pore-scale visualization and an ultrasonic testing system for methane-hydrate-bearing sediments. Simultaneous X-CT observation and acoustic detection could be achieved in the same hydrate sample, which provided a new method for synchronously monitoring microscale distributions during acoustic testing of natural gas hydrate samples. Hydrate formation experiments were carried out in sandy sediments, during which the acoustic characteristics of hydrate-bearing sediments were detected, while X-ray computed tomography was performed simultaneously. This study found that hydrates formed mainly at the gas–water interface in the early stage, mainly in the pore fluid in the middle stage, and came into contact with sediments in the later stage. The development of this experimental device solved the difficult problem of determining the quantitative relationship between the microscale hydrate distribution and the acoustic properties of the reservoir.

1. Introduction

Natural gas hydrates are naturally occurring clathrates that are crystalline, non-stoichiometric masses in which a host lattice of water surrounds guest molecules of natural gas [1]. Natural gas hydrate deposits are widespread and contain a large quantity of resources [2]. Even the most conservative estimates suggest that hydrate deposits contain at least twice as much natural gas as conventional global estimates of natural gas [3]. It is an internationally recognized clean energy source with high potential [4,5,6]. Marine gas hydrates are found on almost all continental margins, such as the Black Ridge [7], the southern Hydrate Ridge [8], the northern Cascadia margin [9], the eastern Nankai Trough [10], offshore India [11], the Gulf of Mexico [12], the Ulleung Basin in the Southeast Seas of South Korea [13], and the K-G Basin on the Indian continental margin [14]. In addition, methane-producing gas was also found in deep-sea environments, including the Caspian Sea and the Black Sea [15,16,17,18,19]. Currently, the increasing demand for natural gas hydrates has led to a gradual development of exploration methods for natural gas hydrate resources [20]. Geophysical exploration techniques are an important means of marine natural gas hydrate exploration and monitoring [21,22,23,24]; however, research into the basic physical properties of hydrates requires laboratory investigation. To conduct hydrate simulation experiments, researchers developed a series of experimental simulation devices [25,26,27,28,29], carried out relevant laboratory simulation studies, and obtained a rich collection of basic research results. In recent years, we also conducted a series of acoustic detection simulation experiments for hydrate-bearing sediment reservoirs in a laboratory setting [30,31,32,33,34]. In a hydrate-bearing deposition system, the relationship between the components affects the acoustic properties. The microscale distribution of hydrates can be studied by observing the acoustic properties [35,36]. The microscale hydrate distribution in sedimentary reservoirs has a strong influence on the acoustic characteristics of hydrate-bearing units, and different hydrate occurrence states produce different acoustic response characteristics [32,33].
X-ray computed tomography (X-CT) technology allows for the direct observation of the spatial distribution of hydrates, directly revealing the microscale characteristics of hydrates. The successful application of X-CT technology makes it possible to observe the microscale distribution of hydrates in sediment pore spaces. Researchers directly observed the microscale distribution of hydrates through X-CT technology in previous studies [37,38,39,40,41,42,43,44]. Ma et al. reviewed the important role of X-ray CT in hydrate research from the aspects of analyzing the basic physical properties of hydrate-bearing sediments and identifying the occurrence mode of hydrates in sediments [45]. Li et al. synthesized hydrates in sediments of the Shenhu Area of the South China Sea and achieved online observation of the hydrate formation and decomposition processes using X-CT techniques [46,47]. Lei et al. conducted a series of studies on the formation and decomposition of hydrate with X-CT and determined the 3D pore habit of methane hydrates and their evolution in the sediment matrix [48,49,50]. In addition to microscale observations of hydrates using X-CT techniques, researchers also developed a series of experimental devices combined with X-CT techniques to study the physical properties of hydrates. Konno et al. proposed a new method to measure the effective gas–water permeability of methane-hydrate-bearing sediments, which performs a gas–water displacement process during X-CT scanning [51]. Li et al. developed a triaxial testing device that is suitable for X-ray computed tomography, which can capture the hydrate saturation, effective stress, strain rate, hydrate decomposition characteristics in hydrate-containing sediment, and cementation failure behavior [52]. Seol et al. also developed an assembly for the pore-scale visualization and triaxial testing of methane-hydrate-bearing sediments, which can be used to assess the geomechanical properties of methane-hydrate-bearing sediments [53]. Zhang et al. developed a new testing assembly that combines micro-X-ray computed tomography scans and low-field nuclear magnetic resonance tests to determine pore-scale characteristics, where the obtained test results can be used to evaluate the pore structure of hydrate-containing sediments [54]. Zhao et al. combined X-ray computed tomography and resistivity measurement techniques to simultaneously derive the three-dimensional spatial structure and resistivity of hydrate-bearing sediments [55]. Similarly, some scientists combined X-CT detection techniques with ultrasonic testing technology, such as the high-pressure multi-property characterization chamber (MPCC) developed by Seol et al. Such systems provide insight into the total characteristics of hydrate-bearing sediments in the laboratory, as well as in the field of pressure core technology [56]. Their apparatus has an inner diameter of 50.8 mm, and the X-CT scan results yield information about the general morphology of the sample but cannot clearly show the microscale distribution of hydrate. Jin et al. developed a novel X-ray computed tomography system and an attenuated total reflection infrared (ATR-IR) probe for use in an Instrumented Pressure Testing Chamber (IPTC), which is a system that can measure the sediment structure, primary wave velocity, density, and shear strength under pressurized conditions [57]. The core diameter is 5.36 cm and the scan results have poor resolution. Sahoo et al. conducted X-ray synchrotron time-lapse 4-D imaging of methane hydrate evolution in sand, and measured ultrasonic P and S wave velocities and electrical resistivity, but X-CT scanning and physical property testing were not performed by the same system [58]. Yang et al. developed a novel Pressure Core Ultrasonic Test System (PCUTS) for the onboard analysis of sediment cores containing gas hydrates at in situ pressures. However, this system cannot perform simultaneous X-CT scans [59]. In summary, there are various problems with comprehensive experimental devices for acoustic detection and X-CT detection of hydrate-containing sediments in the laboratory. In addition, they currently use X-CT scanning and acoustic characteristic detection to carry out experiments in different experimental devices, which either cannot be performed simultaneously in real time, have a large sample size, or the scanning results obtained have an insufficient resolution. It is difficult to establish a corresponding relationship between the microscale distribution of hydrate and the acoustic properties with the existing instrumentation. Therefore, it is necessary to develop a set of experimental devices that can not only observe the spatial distribution of hydrate, water, gas, and sediment in sedimentary reservoirs in real time but can also accurately detect acoustic characteristics during the formation and decomposition of hydrate.
In this study, we developed an experimental setup that could perform X-CT scanning and acoustic detection at the same time. The research reported in this paper introduced a setting for methane hydrate formation and tested the changes in acoustic wave velocity during the formation of hydrate. At the same time, X-CT scanning was performed at different stages of hydrate formation to observe the microscale distribution of the hydrate.

2. Experimental Apparatus

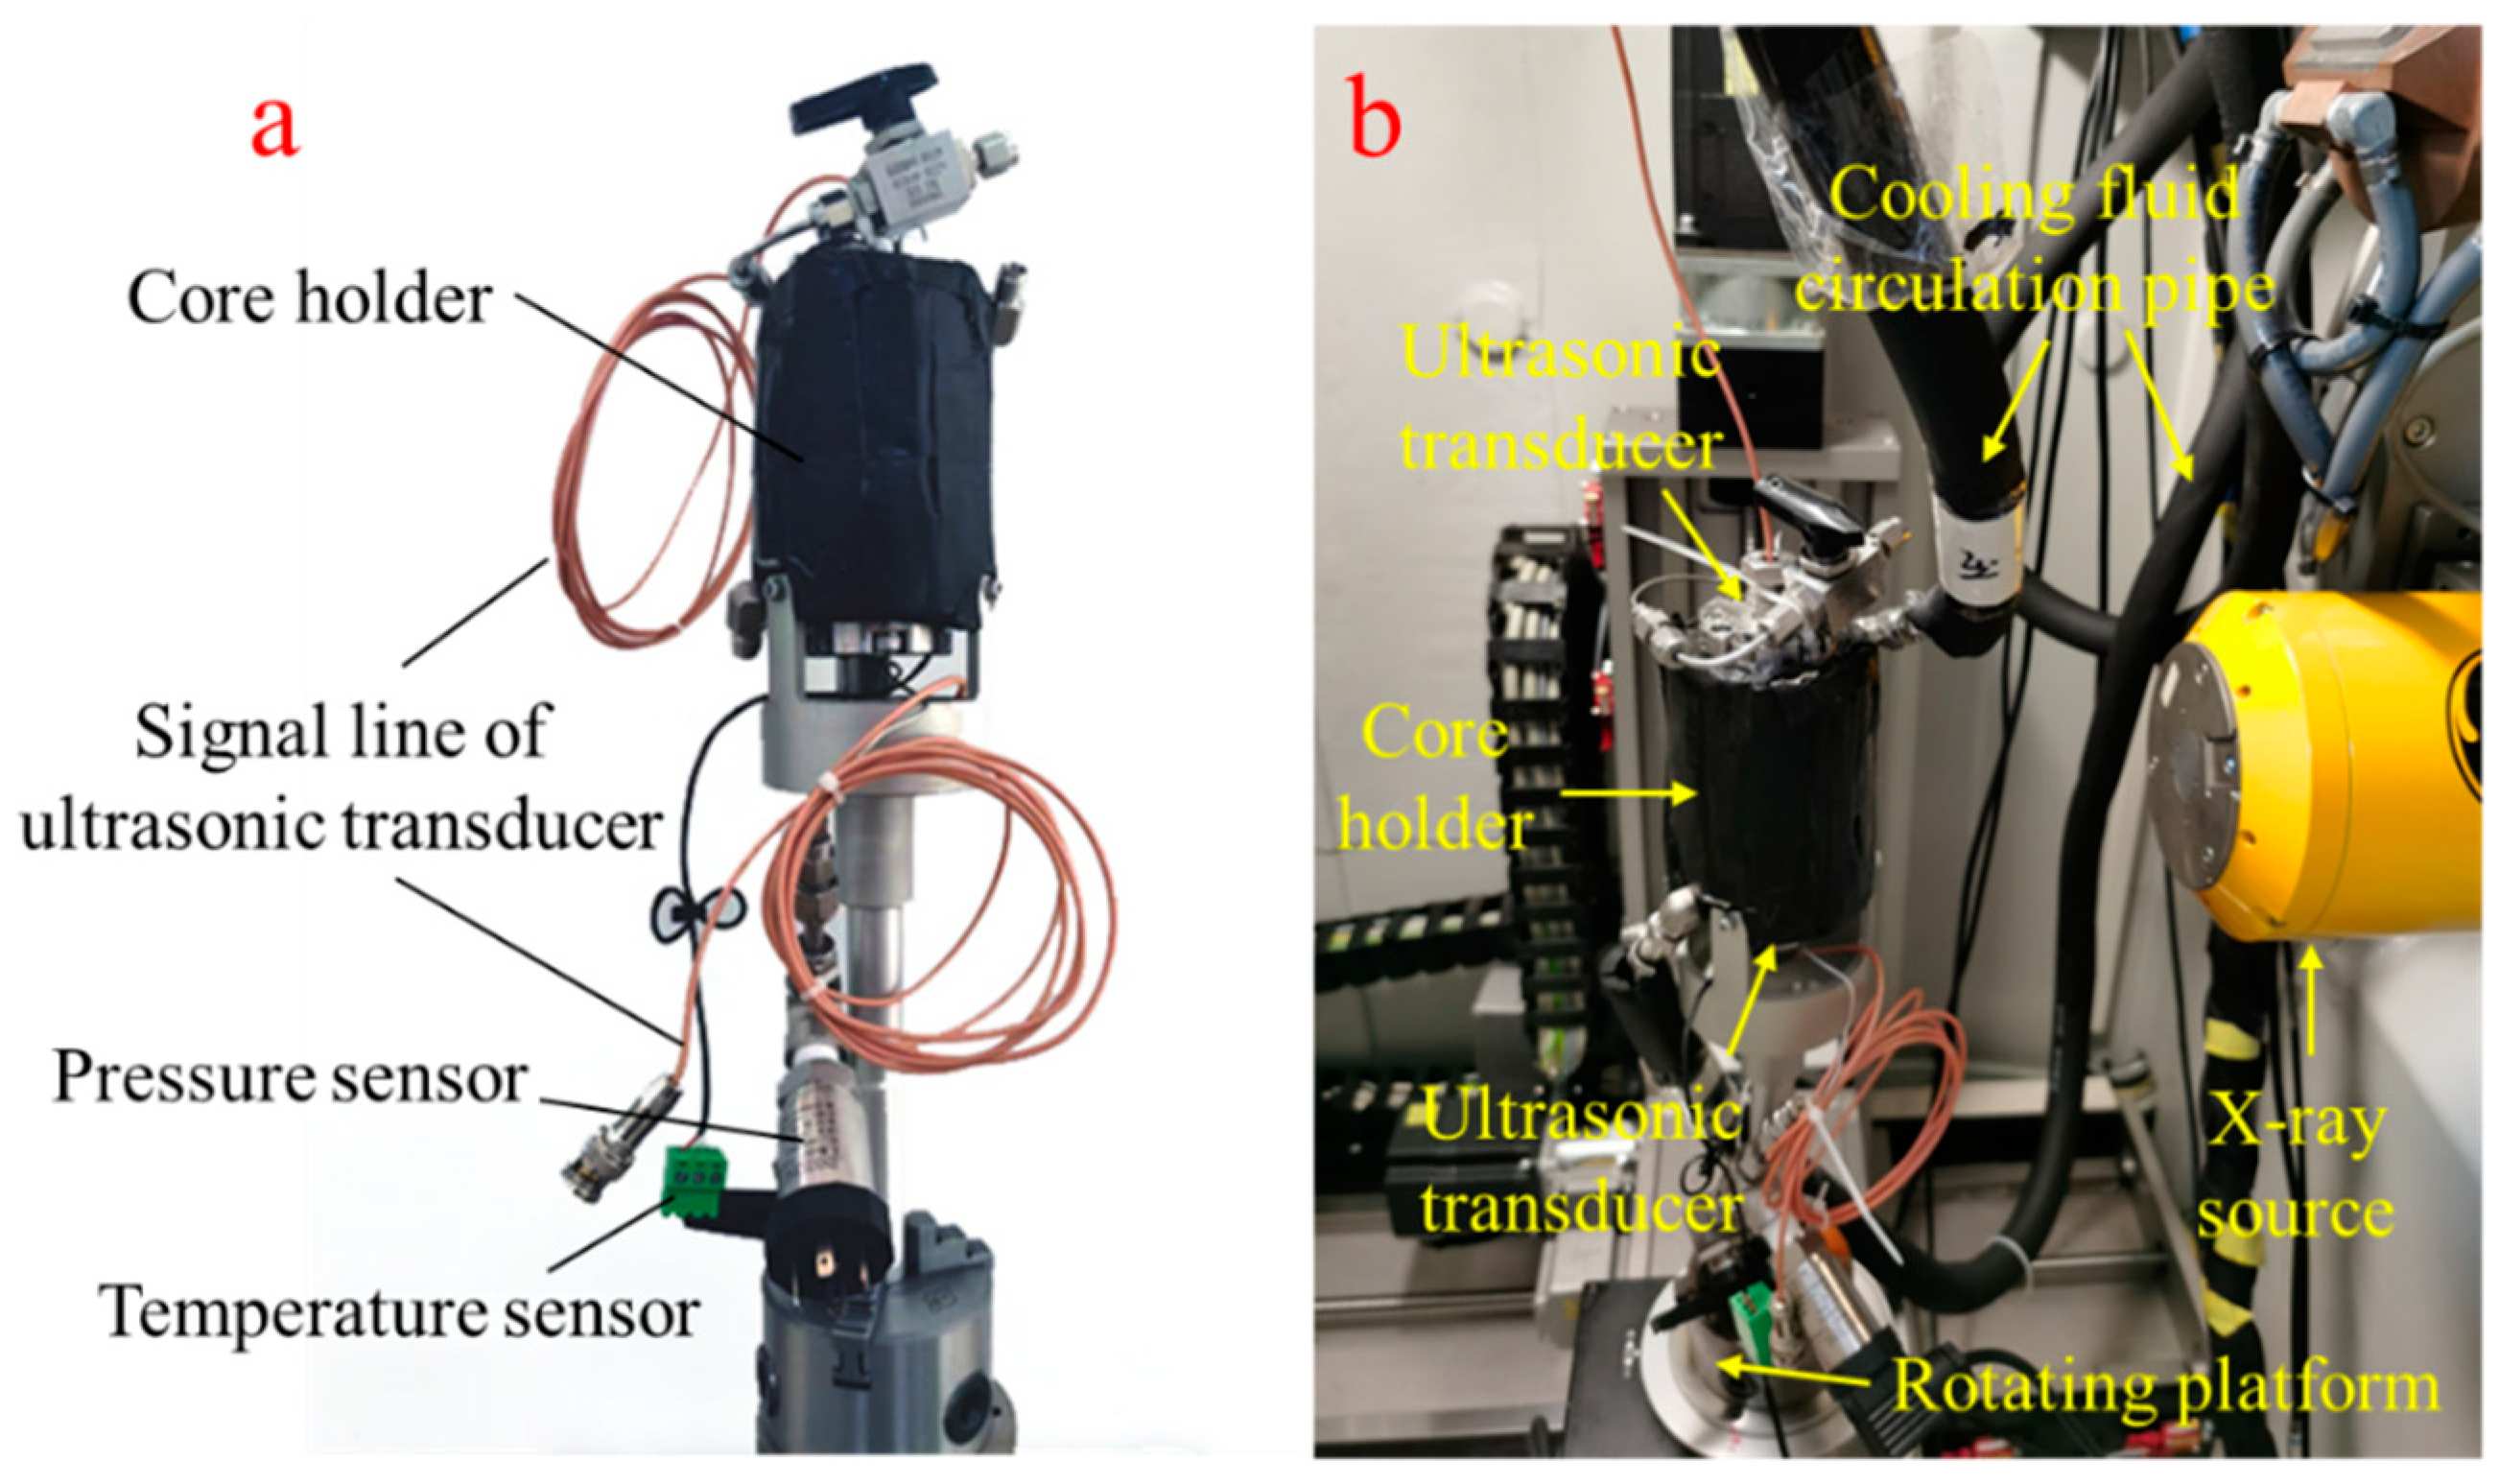
2.1. Experimental System

A hydrate-specific X-CT and joint ultrasonic detection experimental device were used (Figure 1), which included an X-ray-penetrable high-pressure cavity, an acoustic measurement device, a temperature control device, a pressure control device, a data acquisition device, and an X-CT imaging system. The pressure control device communicated with the high-pressure reaction device, which was located inside the CT imaging device, and included a pressure-bearing cylinder in which sediments were placed with a sleeve surrounding the pressure-bearing cylinder. In the reaction cylinder outside the pressure-bearing cylinder was the acoustic measurement device, which included an ultrasonic transducer located at the upper and lower ends of the pressure-bearing cylinder. The temperature control device included a circulating water bath in the cavity between the pressure-bearing cylinder and the reaction cylinder. The acoustic measurement device, the temperature control device, the pressure control device, and the CT imaging device were all connected with the data acquisition device. The acoustic measurement device further included a wave parameter tester connected with the ultrasonic transducer through a signal line. The CT imaging device contained a rotating platform, and the high-pressure cavity was mounted on the rotating platform through a rotating clamping block provided at the bottom. The temperature-control device further comprised a constant-temperature water bath control box that was connected with the water bath circulation cavity through an included circulation conduit. The temperature range was −10–50 °C (accuracy was ±0.5 °C). The pressure control device included a booster pump that was connected at one end with the pressure-bearing cylinder and at the other end with a high-pressure gas cylinder, as well as a back pressure valve that was installed between the booster pump and the high-pressure reaction device. The design pressure of the high-pressure chamber was 15 MPa (with an accuracy of ±0.1 MPa).

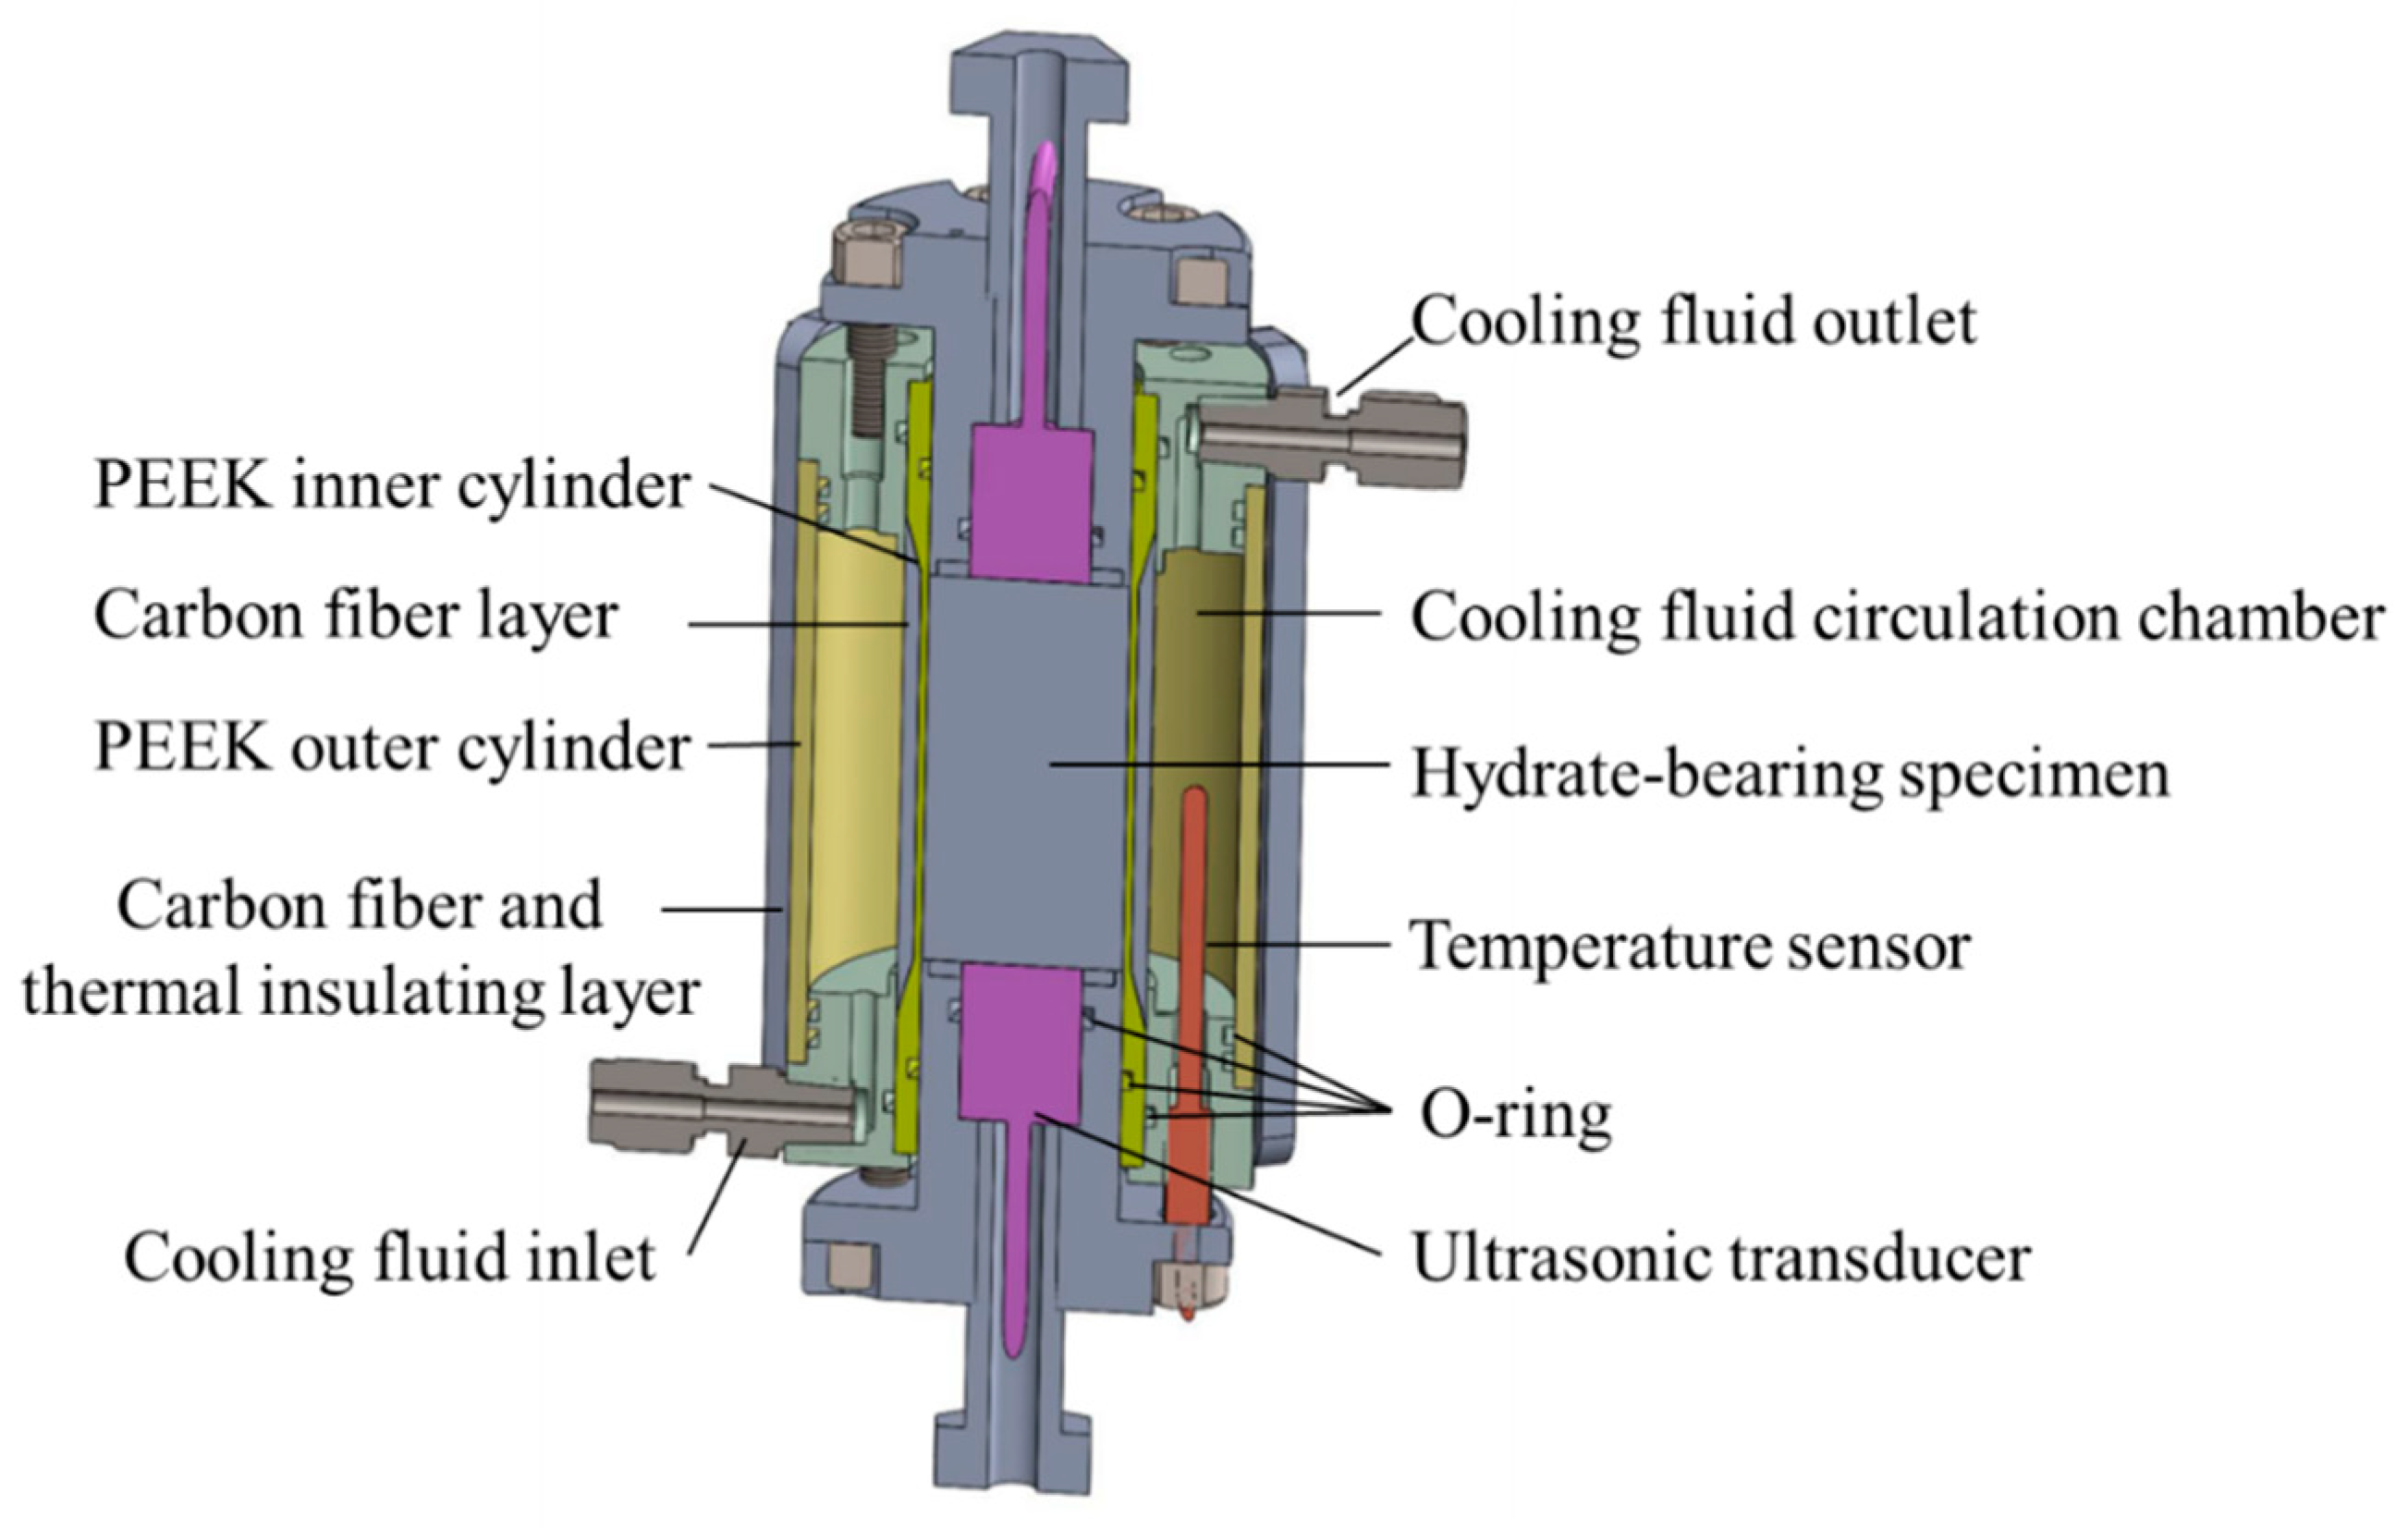
2.2. Pressure Chamber Design

The most important part of the experimental device is the high-pressure cavity (Figure 2), which needs to meet the criteria of X-ray penetration. Therefore, the gripper cylinder was constructed out of PEEK plastic. PEEK plastic has high strength, is lightweight, and allows for good penetration of X-rays. At the same time, in order to avoid possible accidental damage to the PEEK material due to temperature changes, micro-cracks formed during processing, and internal defects in the materials, a circumferential winding of carbon fiber was used for reinforcement, which completely prevented accidental damage of the plastic materials and greatly improved the safety of the experimental equipment. The vessel was designed for a pore pressure of 15 MPa, and considering the force of the internal pressure on the end cover, the total axial-load-bearing design value was 12 kN. The effective interior size of the sample cavity was φ 25 × 50 mm and the size of the ultrasonic transducer was φ 15 × 20 mm.
By designing an X-ray-penetrable high-pressure cavity (Figure 3a) and placing it inside the CT imaging device (Figure 3b), X-CT scanning imaging could be performed in real time during the hydrate formation and decomposition process in the high-pressure reaction cavity, allowing us to realize the internal visualization of hydrate-bearing sediments. At the same time, the ultrasonic transducer installed on the pressure-bearing cylinder detected the acoustic wave characteristics of the hydrate-bearing sediments, which achieved the combined detection of X-CT data and acoustic wave data in hydrate-bearing sediments. Thus, we could determine the wave velocity of a hydrate-bearing sedimentary reservoir and its relationship to the hydrate micro-distribution. In addition, a circulating water bath chamber was present between the pressure-bearing cylinder in which the hydrate deposits were placed and the outer reaction cylinder. By circulating refrigerant in the water bath chamber, the temperature of the hydrate generation environment could be controlled. This method controlled the temperature of the entire pressure-bearing cylinder. During the experiment, the temperatures of the samples throughout the reaction device were kept uniform, with little variation in temperature.
It should be noted that the pressure-bearing cylinder included an inner pressure-bearing cylinder and an outer pressure-bearing cylinder. The ultrasonic transducers were arranged at the upper and lower ends of the inner pressure-bearing cylinder. The inner cylinder was fixed and pressed against the sealing end cover, and the space between the sealing end cover and the ultrasonic transducer was sealed by the pressure block of the ultrasonic transducer probe. An installed sealing ring created a seamless connection between the ultrasonic transducer and the inner pressure-bearing cylinder and ensured the sealing performance of the inner pressure-bearing cylinder in a high-pressure environment. There was a gas inlet and outlet on one side of the ultrasonic transducer probe pressure block, which was used to add high-pressure gas to and release it from inside the inner pressure-bearing cylinder.

3. Measurement

In order to verify the efficacy of the experimental system, this study carried out hydrate formation experiments in sandy sediments and performed ultrasonic tests and X-CT scans during the experiments. The particle size of the sediment used in the experiment was 500–600 μm, the solution used was a NaCl solution (3.5 wt.%), and the gas used was pure methane gas (99.99% purity).

3.1. Experimental Procedure

The experimental procedure used in this study was as follows:
  • The ultrasonic transducer was installed at the bottom of the high-pressure cavity.
  • Twenty-five milliliters of the sediment intended for the experiment was measured, placed into the high-pressure reaction chamber, and an appropriate amount of NaCl solution was added (to an 80% water-saturated level so that the gas could enter the sediment to generate hydrate).
  • The ultrasonic transducer was installed at the top of the high-pressure cavity.
  • The reaction vessel was affixed to the rotatable three-dimensional motion detection platform, the reaction vessel was placed under vacuum, and the internal air was discharged.
  • Methane gas was introduced into the reactor using the pressure control system until the pressure reached 8 MPa.
  • The reaction temperature was set by gradually cooling the reaction vessel until the temperature dropped by about 2 °C.
  • The temperature and pressure changes in the reactor were recorded through the data collector, multiple X-CT scans were performed during the hydrate formation process, and ultrasonic testing was performed synchronously during scanning.
  • Measurements were continuously collected to obtain the relationship between the microscale distribution of hydrate and acoustic parameters.

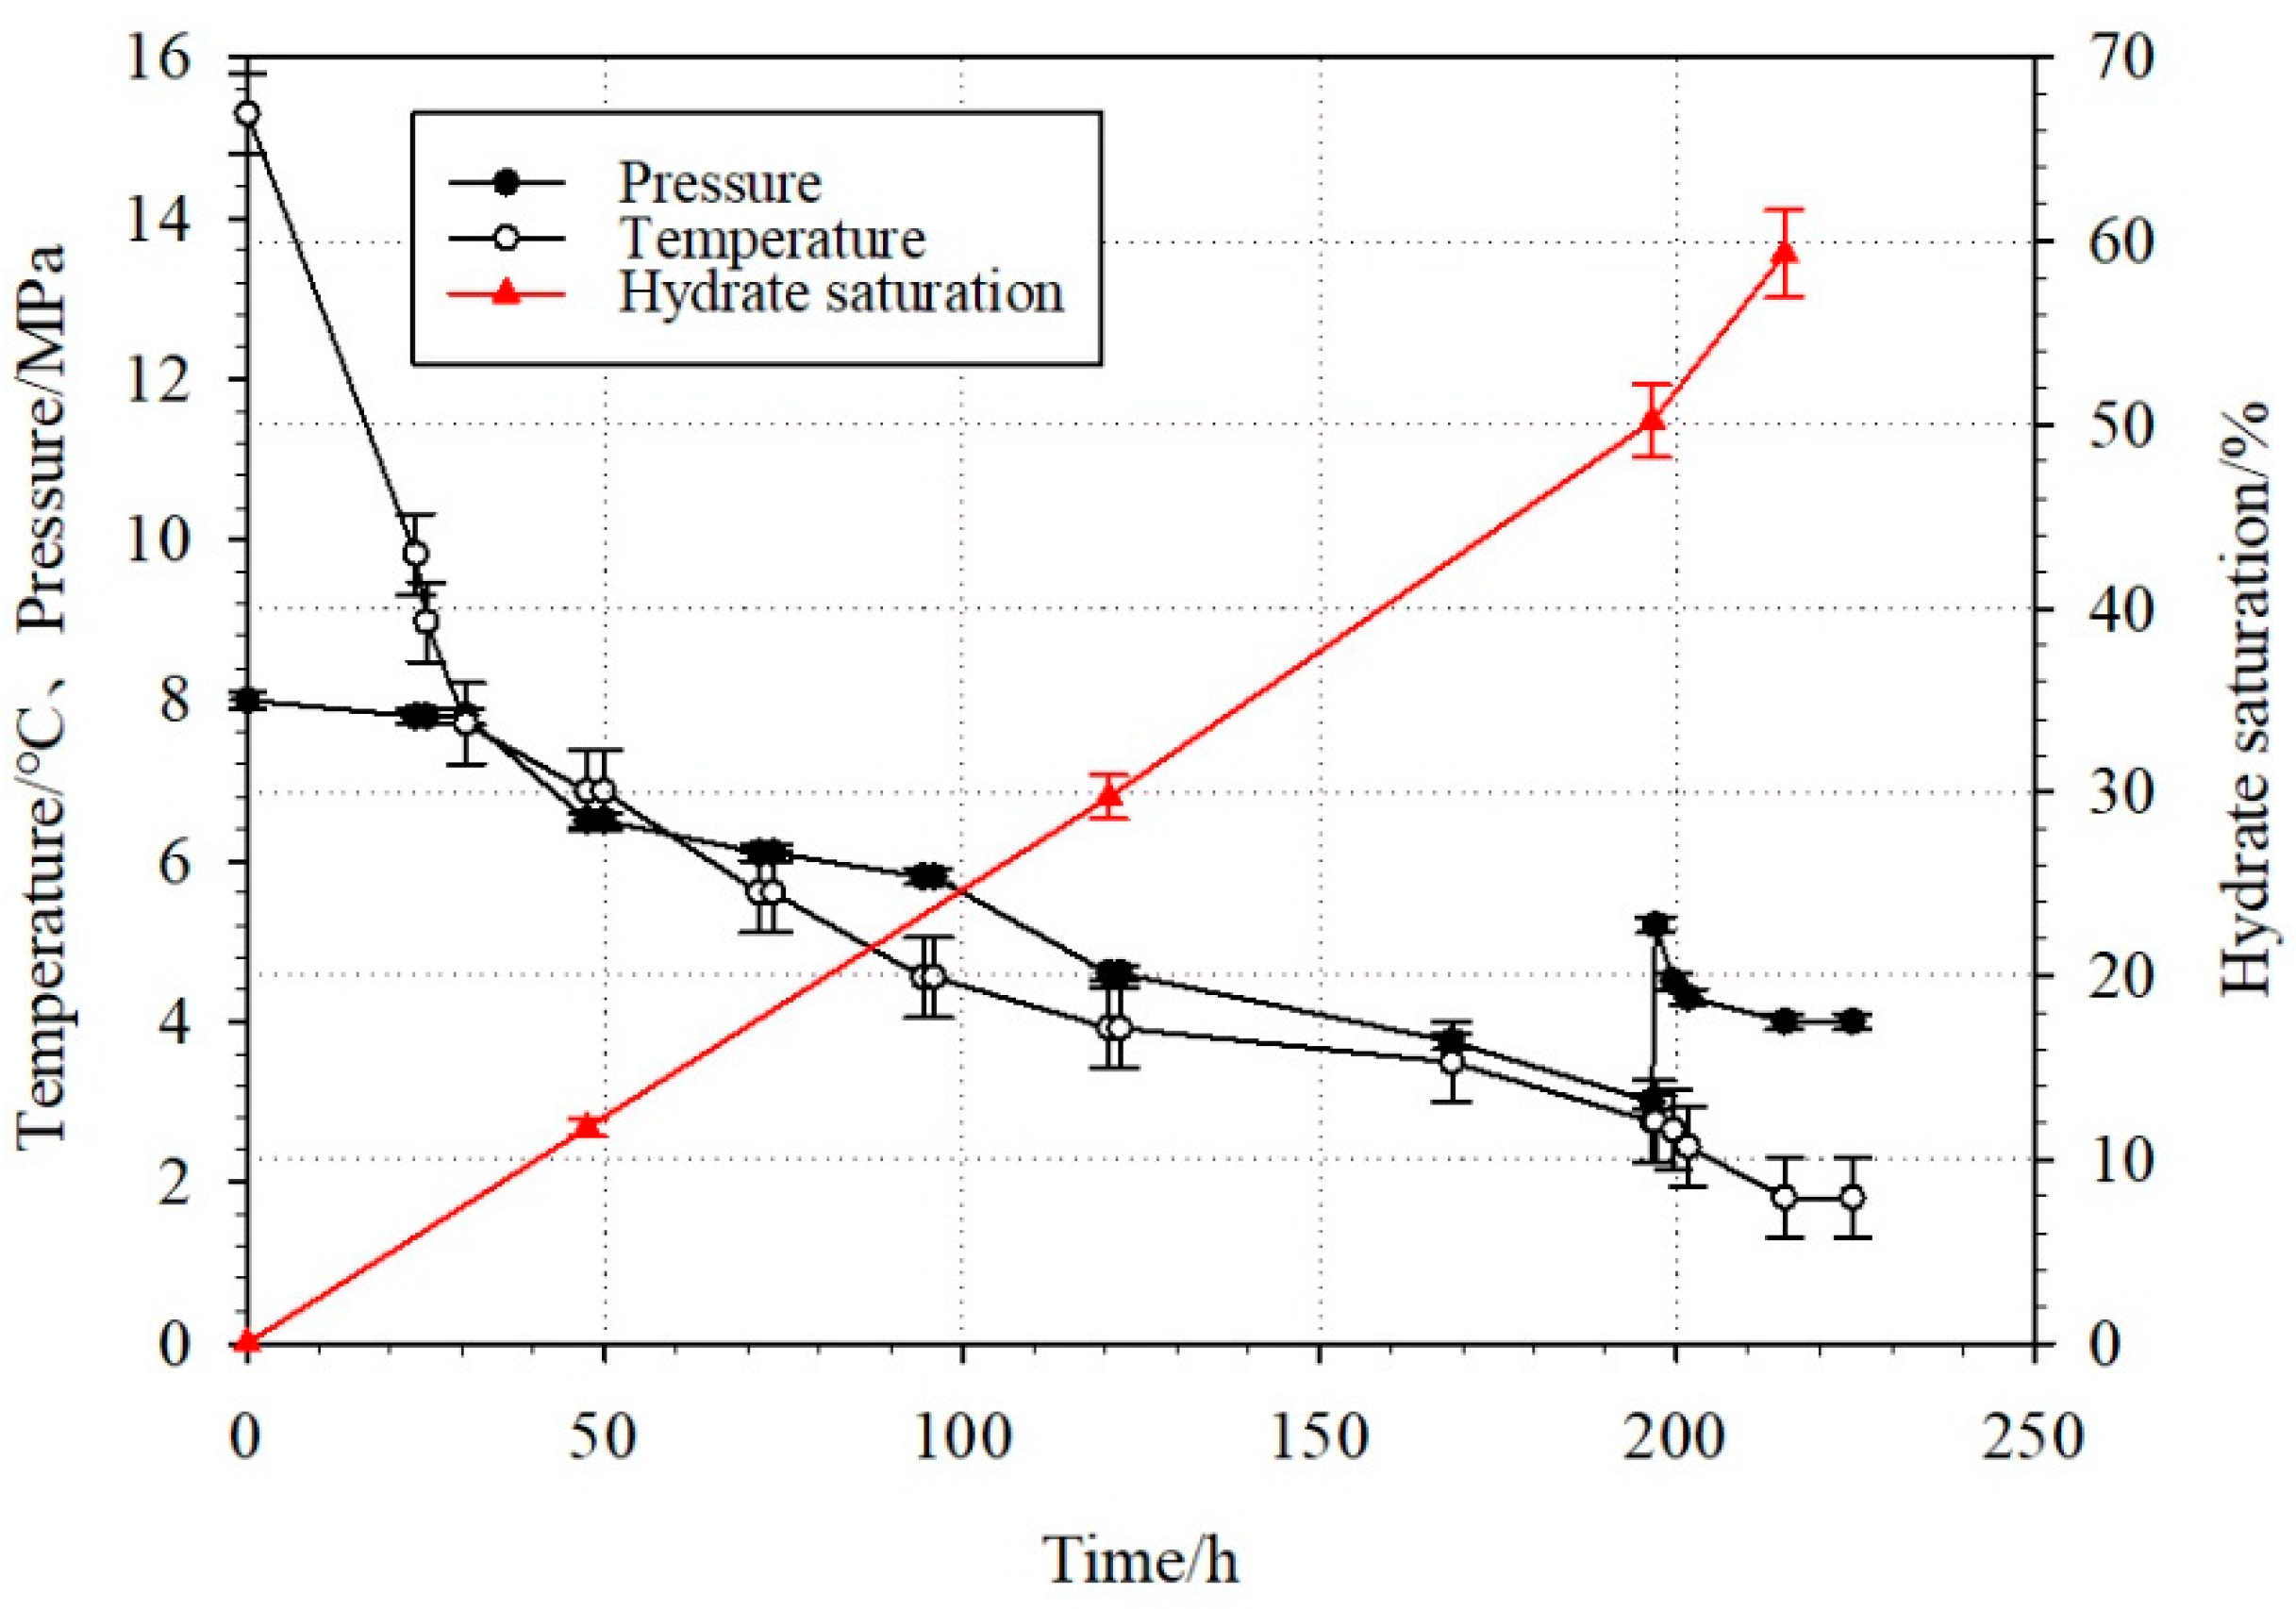
3.2. Methane Hydrate Formation Process

The hydrate formation process is triggered by lowering the temperature of the refrigeration system. The temperature of the refrigerant was lowered using a step-wise cooling method, and the refrigerant was cooled by 2 °C at regular intervals. The temperature of the refrigerating circulating liquid was lowered by an additional 2 °C approximately every 24 h until the hydrate formation process was completed. As shown in Figure 4, as the temperature gradually decreased, the pressure gradually decreased in stages during the hydrate formation. When the reaction process time reached close to 200 h and the pressure dropped to 3 MPa, the reaction vessel was supplemented with gas, pressurized to 5.2 MPa, and hydrate generation was continued.
As the temperature decreased, hydrate was gradually formed, the pressure in the high-pressure reaction chamber gradually decreased, and the hydrate saturation gradually increased (Figure 4). In this study, the hydrate saturation was calculated according to the CT image method, where the hydrate saturation (precision, ±4.0%) was the volume proportion of hydrate in the pore spaces over the entire experimental sample. The increase in saturation during the hydrate formation process changed linearly, which was consistent with the trend of the whole cooling and depressurization process.

3.3. Ultrasonic Velocity Detection
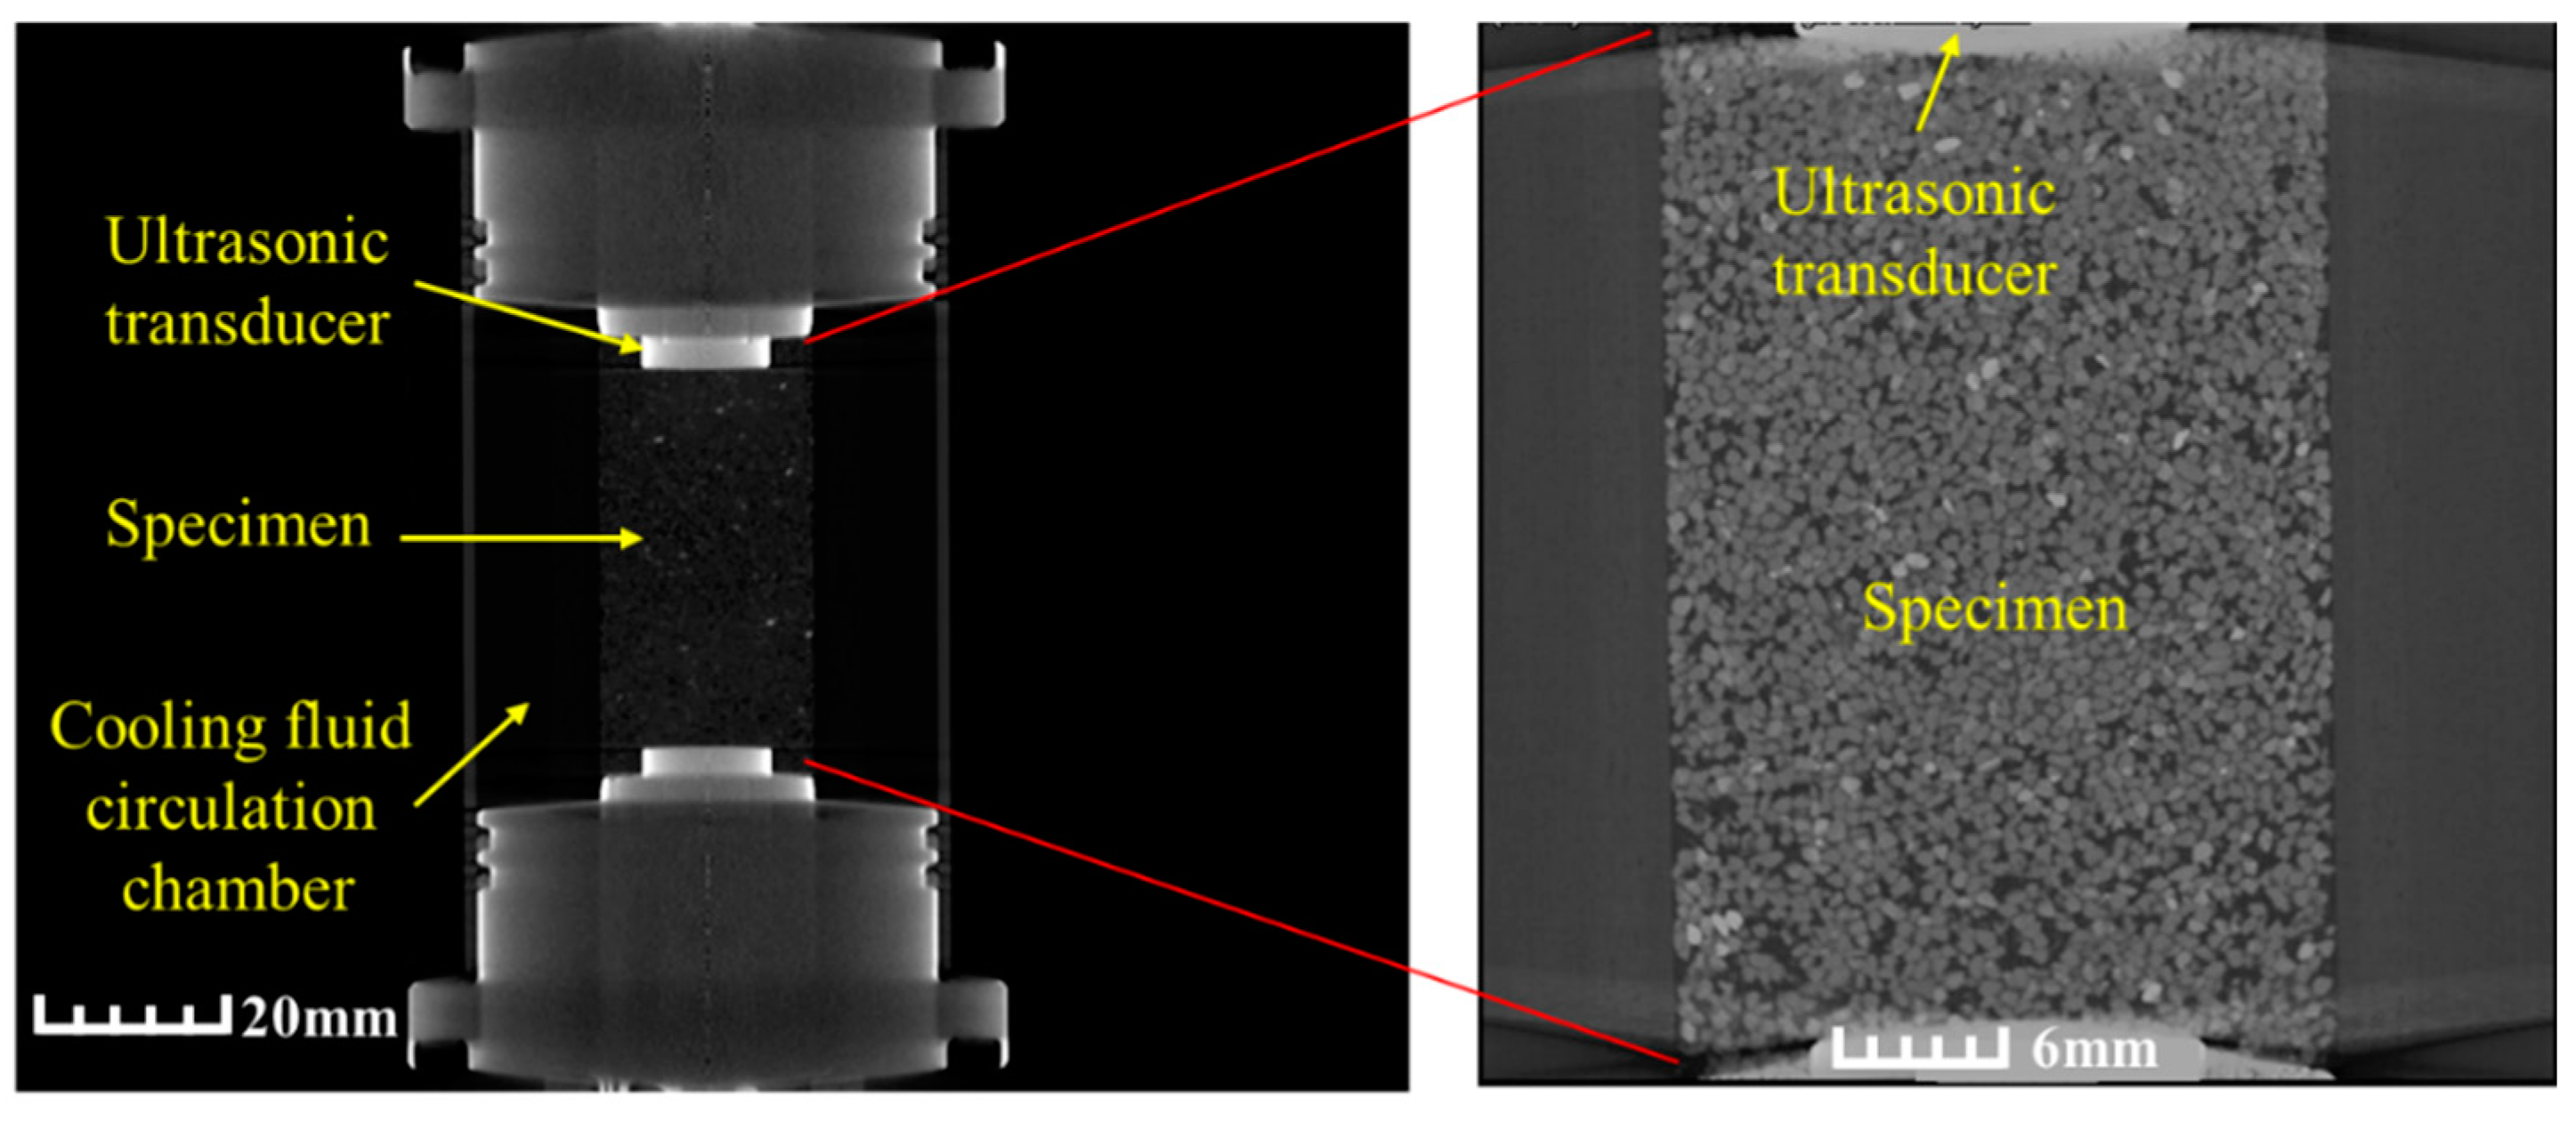
The ultrasonic transducer was installed at both ends of the sample, where the transducer probe size was φ15 × 20 mm. The main frequency of the ultrasonic transducer was 200 kHz and the actual style of the transducer is shown in Figure 5a. The other end of the transducer was connected to a bayonet nut connector (BNC) through a signal line, and the BNC connector could be directly connected to the ultrasonic tester. As shown in Figure 5b, the working surface of the ultrasonic transducer was a circular plane: the front end near the working surface was a thin cylindrical crystal material, which was wrapped by the main damping material located in the middle of the transducer. The signal line was drawn from the crystal material and connected to the exterior through the damping material. The outermost layer was the housing that encapsulated the probe. The ultrasonic transducers could withstand the pressure and water and had a compact size, which made them highly suitable for high-pressure hydrate chambers for X-CT scanning. The acoustic data acquisition system used the HS-CS4EL ultrasonic tester developed by the Xiangtan Tianhong Electronics Research Institute. The pulse voltage of the ultrasonic tester was 250 V, with 8 independent amplifier attenuations, where the sampling byte and sampling rate could be adjusted.
The working principle of ultrasonic detection is an instrument system that transmits an electric pulse to the transmitting transducer made of piezoelectric material, which excites a chip to vibrate, emitting waves that propagate through the test material. The waves are then received by the receiving transducer, which converts the energy into a weak electrical signal sent to the receiving system; then, the signal is amplified and the waveform is displayed on the screen after analog-to-digital conversion. The wave amplitude and first arrival time (t) are read from the waveform and used to calculate the longitudinal wave velocity (Vp) of the ultrasonic wave propagating in the test sample from the known test sample distance (L), which is expressed as
Vp = L/t
Before the experiment, it is necessary to perform a zero-time calibration test on the ultrasonic transducer using the direct docking method. The transmitting transducer and the receiving transducer are directly docked and stabilized, and the first arrival time of wave propagation is recorded; that is, a wave with zero delay t0 in the measurement system. The result of the zero-wave calibration test for this experimental system is shown in Figure 6, which displays a very short time. More detailed results are shown in the partial enlargement of the first arrival time in the upper-right corner. Then, in this experimental system, the expression of longitudinal wave velocity was
Vp = L/(tt0)
The calibration of the ultrasonic transducers is important. The error in the velocity estimation is mainly from identifying t, which is the travel time of the compressional wave. The velocity is calculated using Equation (2), where L is the sample length and t0 is the inherent travel time of the transducers. Four different lengths of standardized polyoxymethylene (POM) rods were used to calibrate the t0 of the transducers (Table 1). According to the equation, we obtained the P-wave velocity in the POM rods and the inherent travel time of the transducers: Vp = 2241.7 m/s and to = 6.31 μs, respectively. The accuracy of the P-wave velocity measurement was ± 1.7%.

3.4. CT Imaging

In this study, a Phoenix v|tome|x industrial X-CT (Figure 3b) produced by Phoenix, Germany, which is a subsidiary of GE, was used. Up to 240 kV, the voxel resolution was up to 2 μm. The sample was placed on a 360°-rotatable stage, with a maximum sample diameter of 135 mm, a maximum sample height of 420 mm, and a maximum load of 10 kg. The detector was a 16-bit digital flat panel detector with 1024 pixels × 1024 pixels and an effective area of 204.8 mm × 204.8 mm. In this study, the scanning parameters needed to be set prior to starting the experiment. After the reaction vessel was fixed on the rotating stage of the CT system, various CT scanning parameters were adjusted, including the ray tube voltage, current, detector exposure time, imaging times, geometric magnification, and spatial resolution. Depending on the experimental sample size, the X-CT scan was operated at a voltage of 120 kV, a current of 100 µA, and a detector exposure time of 333 ms. After the scanning was complete, the scanned data were reconstructed to obtain two-dimensional and three-dimensional images of the sample and were finally analyzed using the VG Studio software to obtain the required experimental results. For a more detailed description of the X-CT experimental system, X-CT image acquisition, X-CT image analysis, and identification of the system components and boundaries, readers can refer to references [46,47].
Figure 7 shows an overall X-CT scanning result. In the figure, the sediment sample, the cooling liquid circulation cavity, and the ultrasonic transducers located at both ends of the sediment sample can be clearly seen. Since ultrasonic detection was required in the combined CT and ultrasonic detection experimental device, the size of the experimental sample was limited and could not be too small. The effective interior size of the sample cavity was φ 25 × 50 mm. The resolution during sediment scanning in this study was 40 μm, which allowed for the sediment particles and the pore fluid around the particles to be clearly distinguished. The scanning results in Figure 7 show the sample condition before hydrate formation, where the pore fluid contained only methane gas and the NaCl solution, but no hydrate.

4. Results and Discussions

The main purpose of this study was to simultaneously obtain acoustic wave testing data and X-CT scanning images in real time during hydrate formation to reveal the acoustic response and microscale distribution characteristics during the process of hydrate formation.

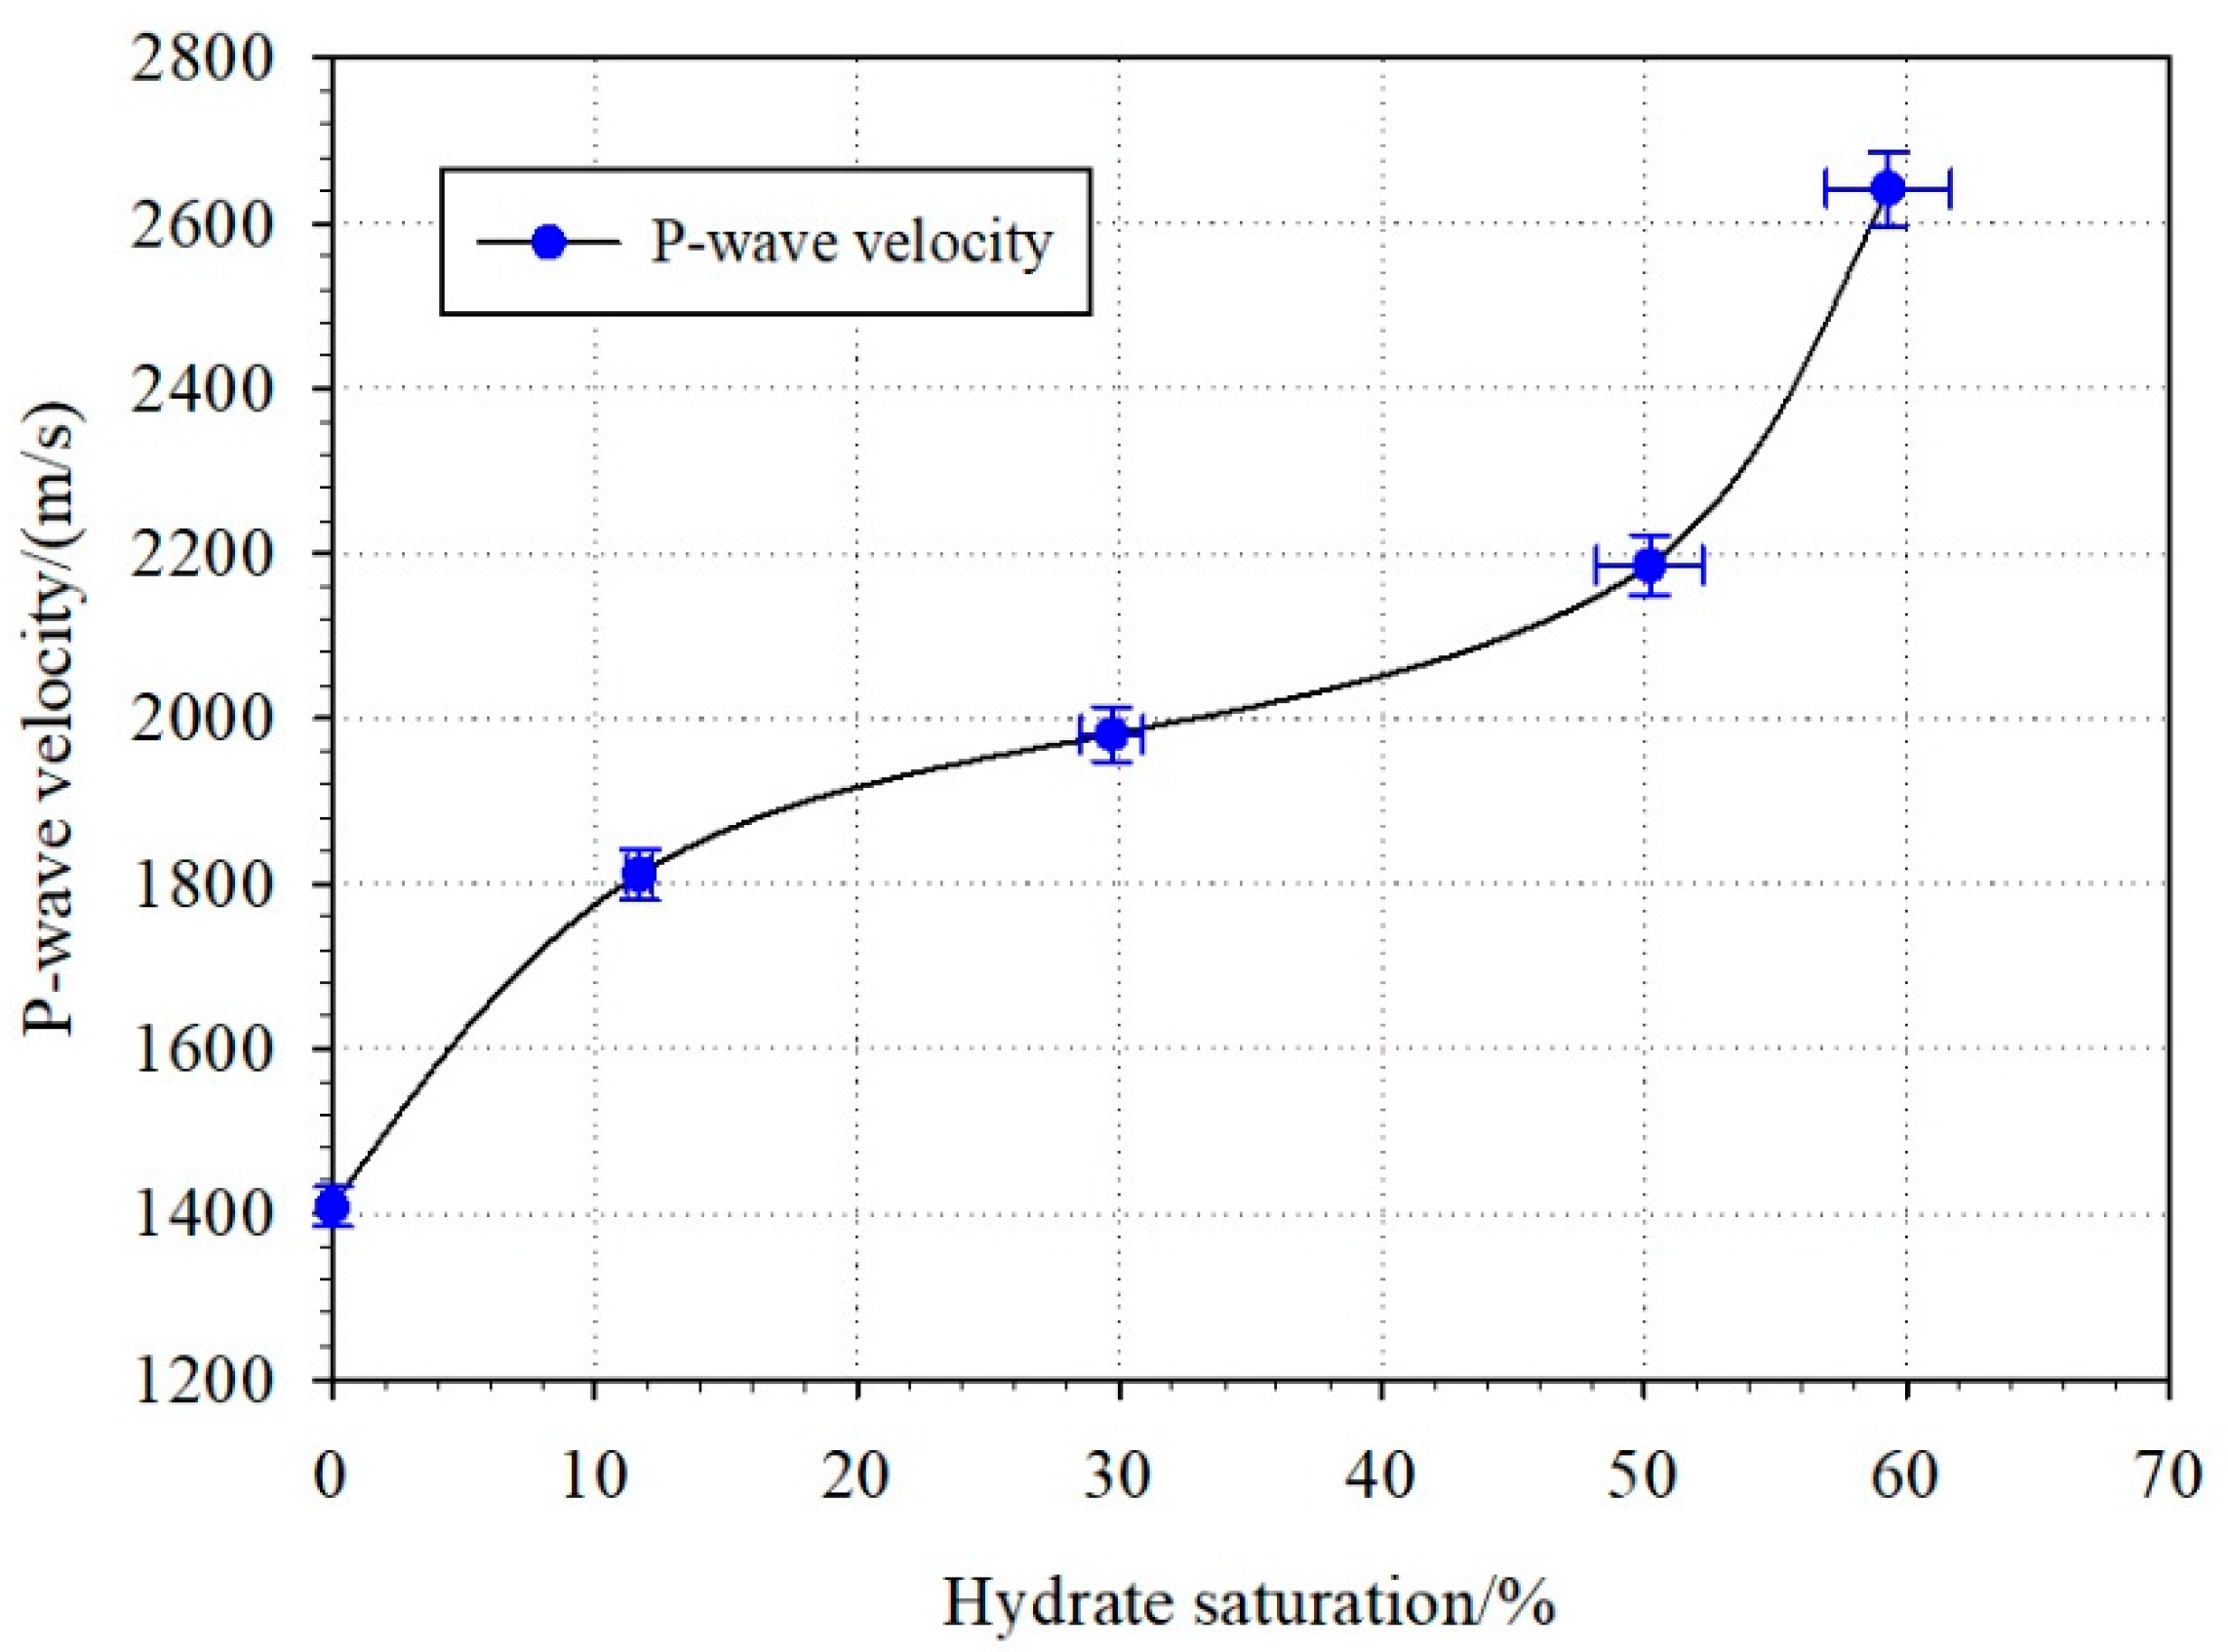
4.1. Acoustic Responses

Based on the temperature and pressure changes during the experiment (Figure 4), various pressure change nodes were selected to analyze the acoustic wave velocities. The acoustic velocities at 47.5 h, 120.5 h, 196.5 h, and 215 h were selected for the analysis. The hydrate content was calculated from the X-CT scanning images and is reported as the proportion of hydrate in the pore spaces. Prior to the hydrate formation in the experiment, the initial P-wave velocity was 1408 m/s; with a hydrate content up to 59.3%, the P-wave velocity was as high as 2642 m/s. With the progressive formation of hydrates, as shown in Figure 8, the P-wave velocity of the hydrate-bearing sediments displays a periodic trend. At hydrate contents of less than 10%, the acoustic wave velocity increased rapidly with hydrate formation. When the hydrate content was between 10% and 50%, the hydrate content continued to increase, but the change in the acoustic wave velocity was small, with a slowly increasing trend for the P-wave velocity. As the hydrate content exceeded 50%, the acoustic wave velocity again exhibited a trend of rapid increase.

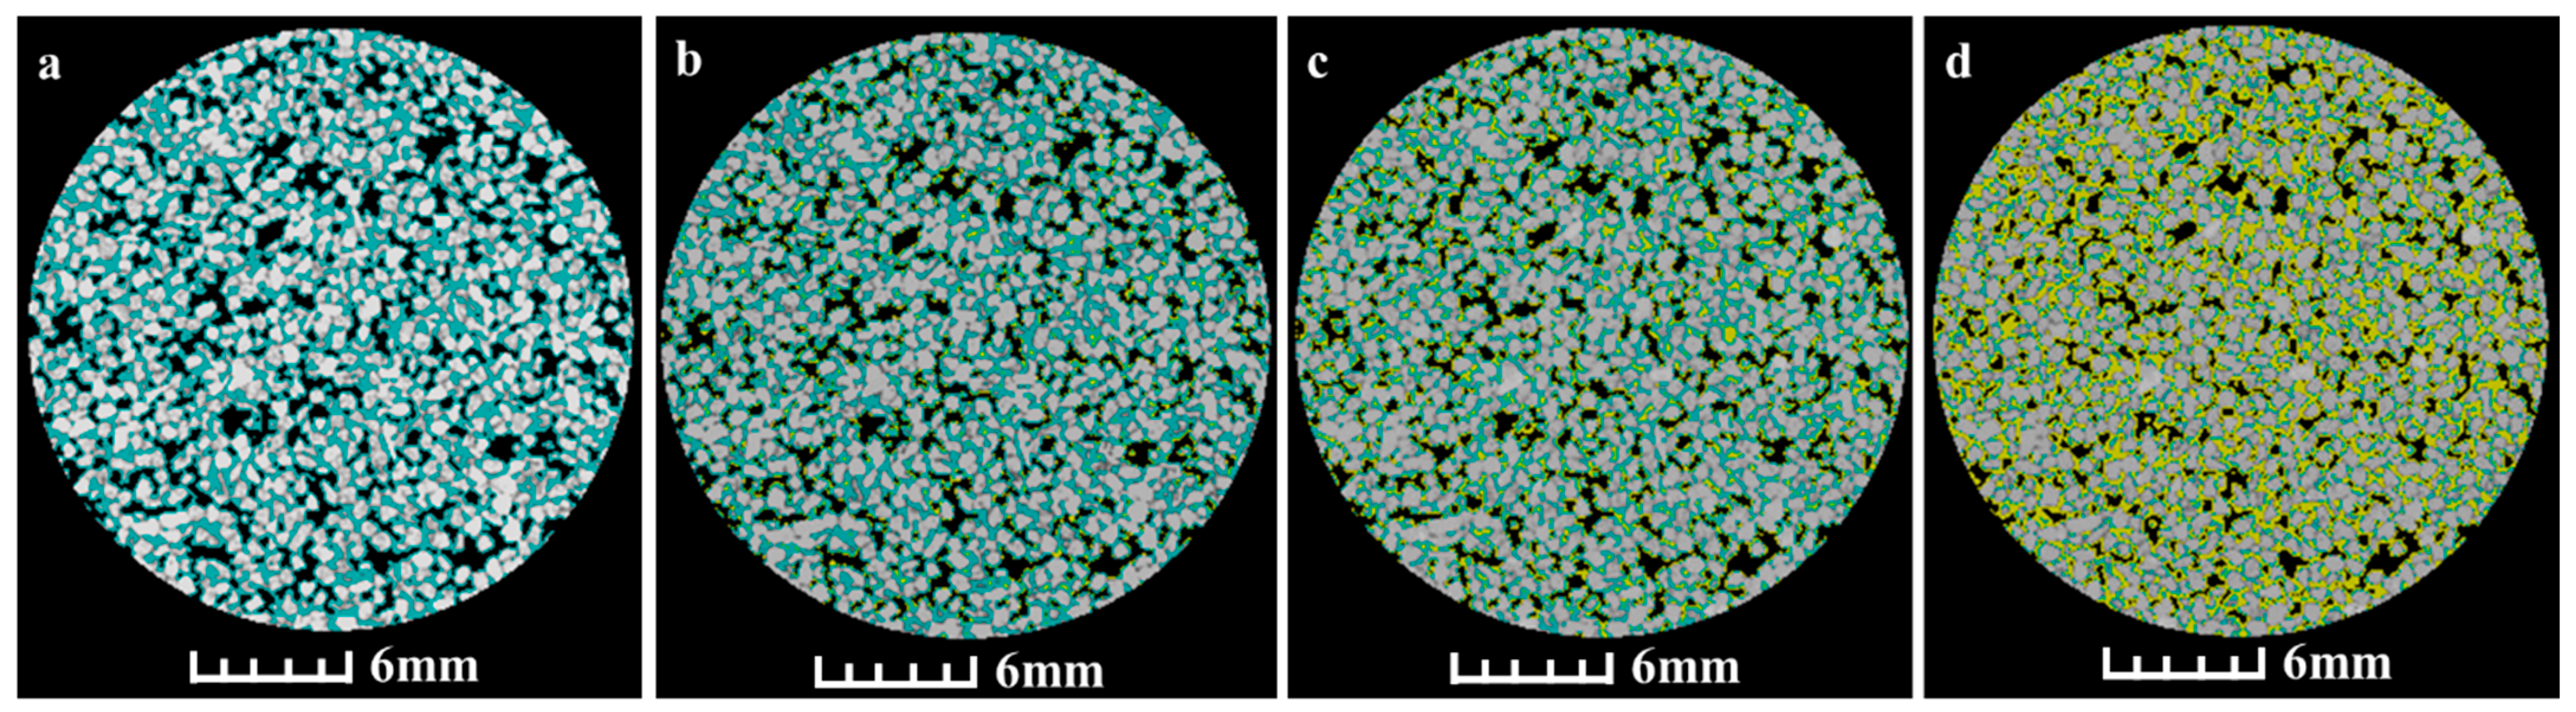
4.2. Microstructure Analysis

The X-CT scan results at 47.5 h, 120.5 h, and 215 h were chosen for the analysis (Figure 9) to represent the microscopic distribution of hydrate in the early, middle, and late stages of the formation process, respectively. Prior to the hydrate formation (Figure 9a), methane gas and NaCl solution were mainly located in the sediment pore spaces. In the early stage of hydrate formation (Figure 9b), the hydrate content was 11.7%. It can be seen that hydrates began to form at the gas–water surface, with a relatively uniform distribution throughout the sediment. With continued hydrate generation in the middle stage (Figure 9c), the hydrate content was 29.7%, and the hydrate continued to grow along the gas–water interface, mainly in the pore fluid. In the later stage of hydrate formation (Figure 9d), the hydrate content was 59.3%. As the hydrate generation increased, the gas and water in the pores gradually decreased, and the hydrate began to come in contact with the sediment particles to form a sedimentary framework.

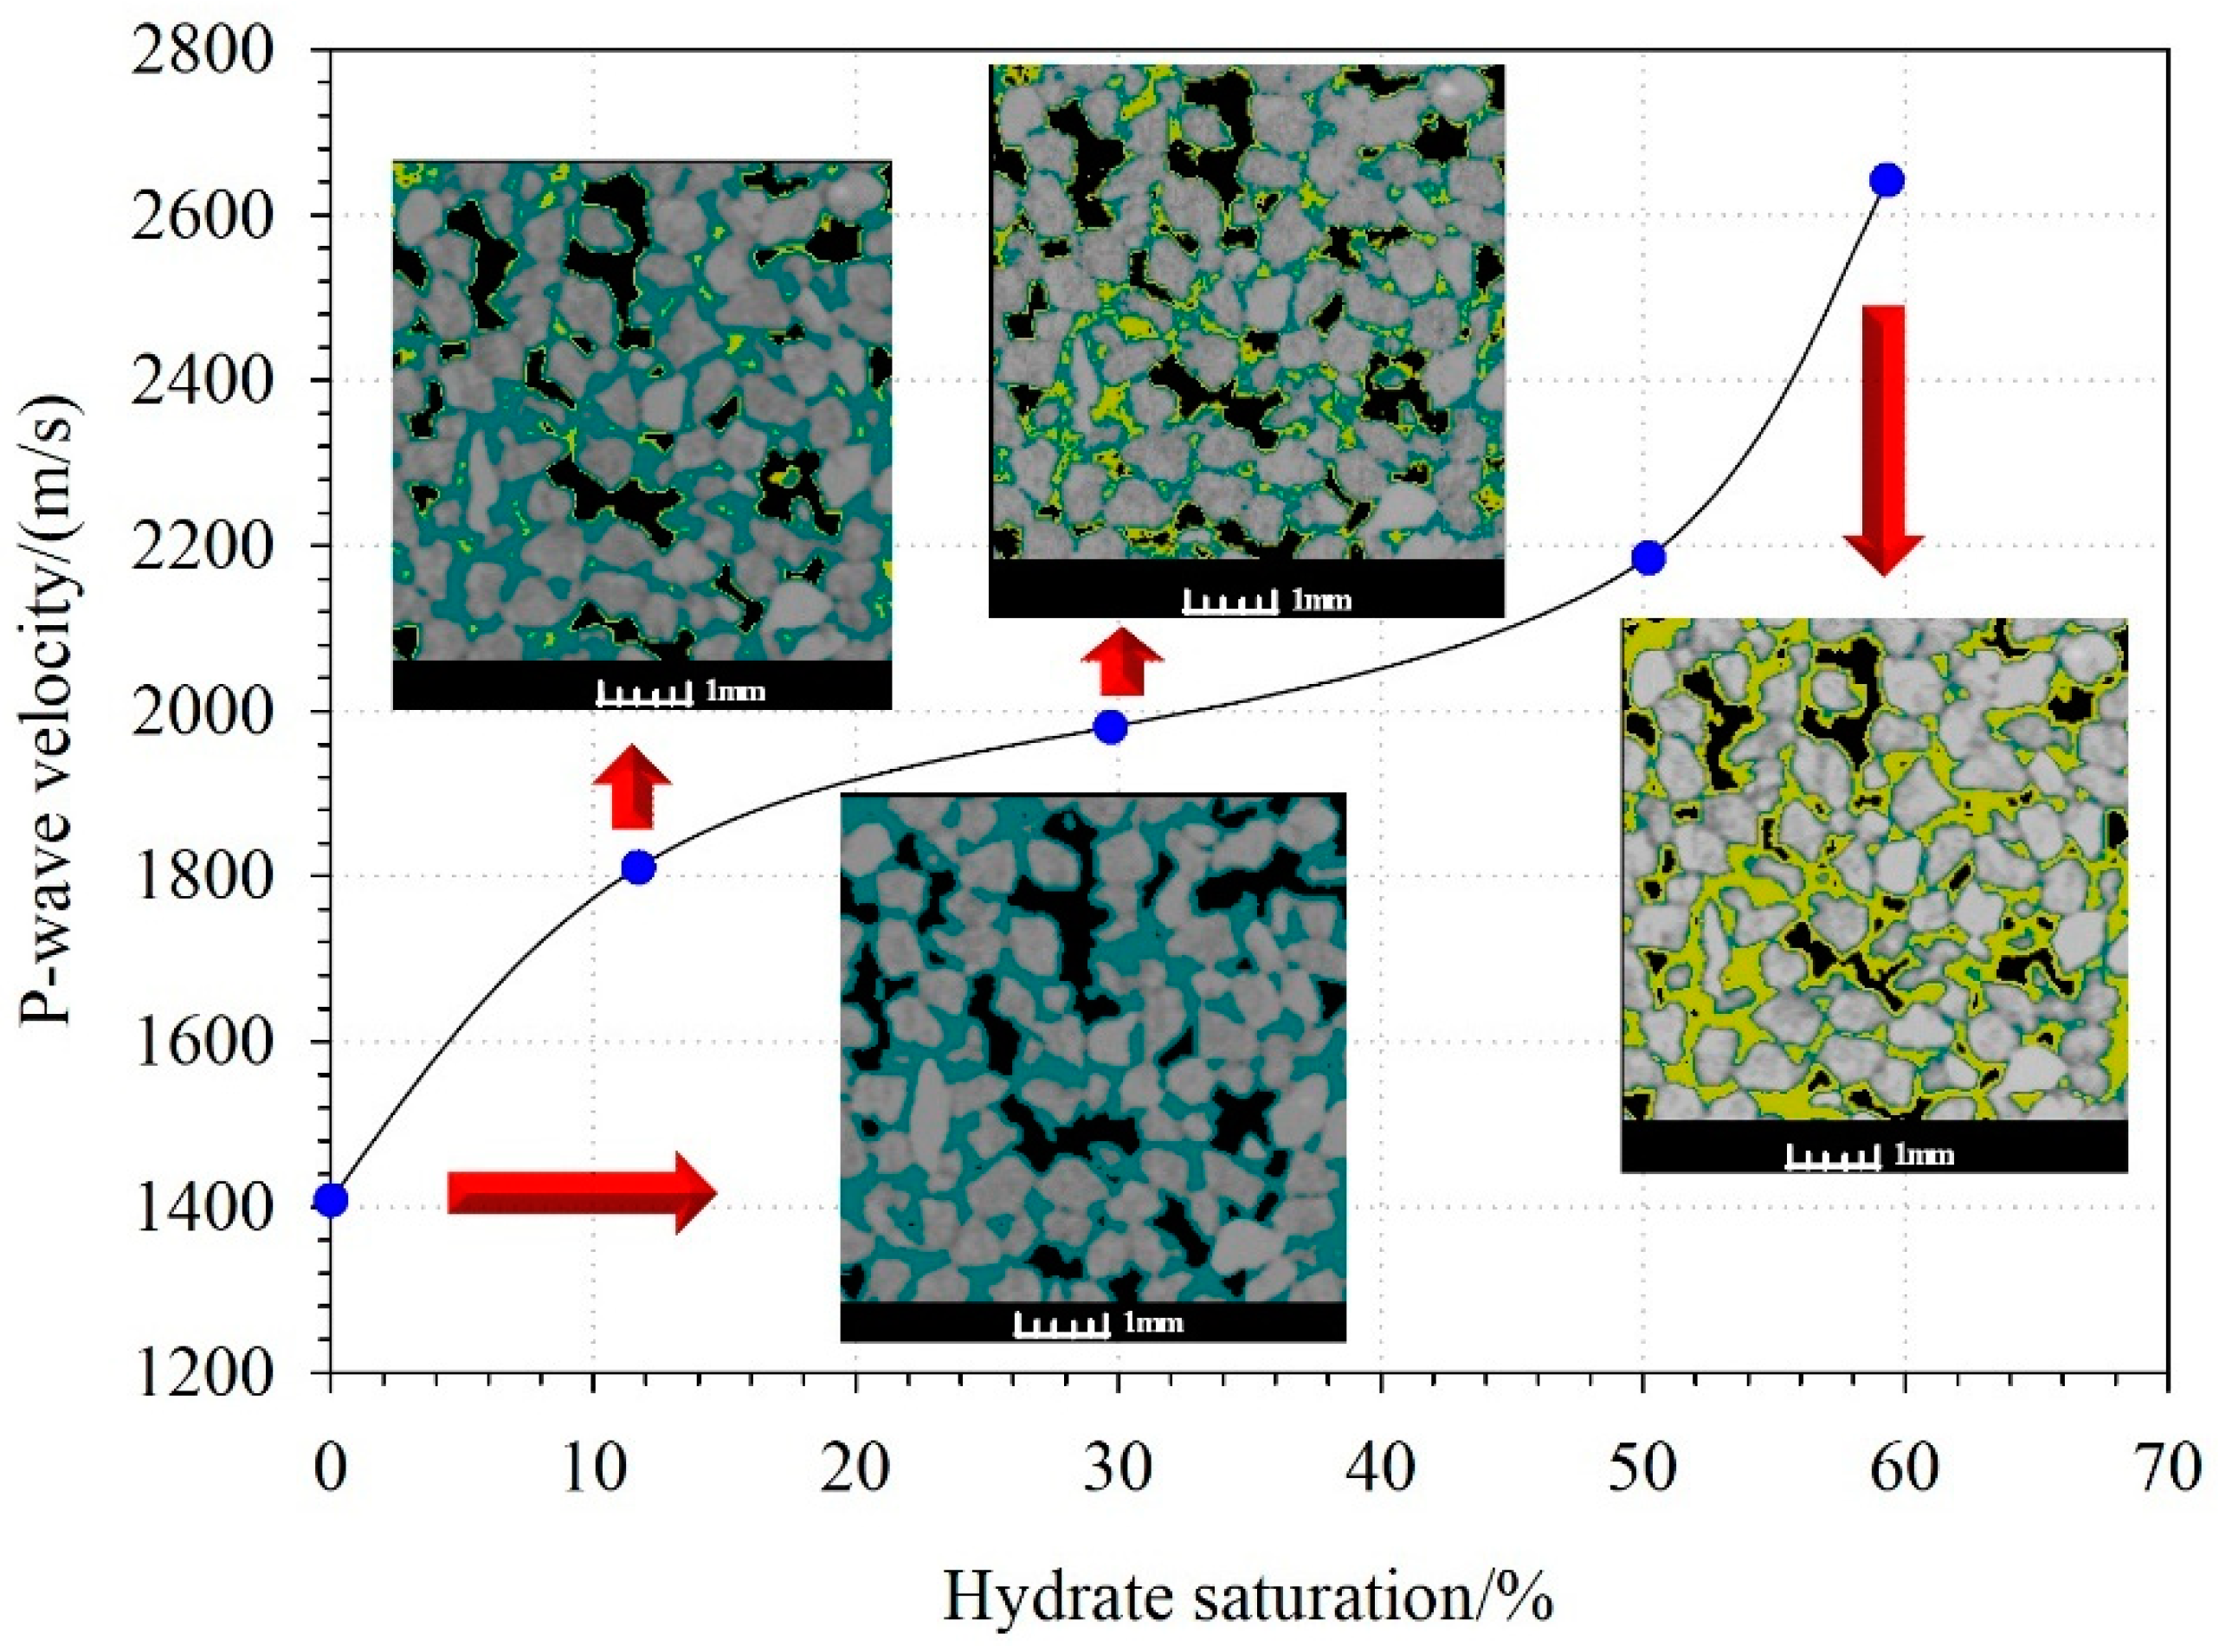
4.3. Influence of the Microscopic Hydrate Distribution on Acoustic Velocity

In order to better analyze the microscopic distribution state during the process of hydrate decomposition, we selected parts of various blocks from the results with a scanning resolution of 30 μm for closer analysis. Changes in the P-wave velocity with hydrate saturation during hydrate formation are shown in Figure 10. It can be seen that the change in wave velocity with hydrate saturation was not linear. During the process of increasing hydrate saturation, the overall acoustic wave velocity displayed three stages of change. In the initial stage, the acoustic wave velocity of the hydrate-bearing sediments increased more rapidly, showing a larger rate of change. In the middle stage, the change in wave velocity was small, and the overall trend of change was slow. In the later stage, the acoustic wave velocity increased fast again.
The variation of acoustic waves at different stages in the hydrate formation process and the corresponding hydrate micro-distribution are clearly shown in Figure 10. Based on the combined acoustic characteristics and X-CT images of the hydrate formation process, we believe that hydrate formation in the early stage altered the scaffold-like structure of the sediments and that the gas–water fluid mixture was replaced by consolidated hydrates, resulting in a significant change in the acoustic velocity. During the initial process of hydrate generation, the amount of hydrate was small, and thus, was not sufficient to change the properties of the sedimentary framework; therefore, the increase in hydrates had little effect on the overall structure. When a certain amount of hydrate had accumulated, most of the pore space became occupied by hydrates, which strengthened the connection between the sedimentary particles and induced a notable change in the acoustic wave velocity; therefore, the amount of hydrate had a major influence on the acoustic wave velocity. In sandy sediments, hydrates mainly occurred as a pore-filling phase. In the early stage of hydrate formation, they mainly formed at the gas–water interface, while in the middle stage, they mainly grew in the pore fluid. In the later stage, when the amount of hydrate gradually increased, the hydrate existed in contact with the sediment.
In this study, it can be clearly seen that hydrate nucleation mainly occurred at the gas–water interface (Figure 10). Yang et al. found that hydrate clusters were initiated and accumulated in the gas–water interface in the process of hydrate formation [60]. The same hydrate formation mode was also found by Lei et al. [49], where they also found that dew droplets could be potential nucleation sites in experiments with low initial water saturations. During the formation process of hydrates, Yang et al. also observed that gas hydrates mainly exist in the pore space [60]. Therefore, the occurrence mode of gas hydrates in sediments is likely to be a pore-filling mode. This was consistent with what we observed in this study.

5. Conclusions

In this study, an experimental system for ultrasonic–CT joint detection was constructed to enhance our understanding of how the acoustic response characteristics of pore-filled hydrates reflect different microscale distributions. Simultaneous X-CT scanning and acoustic detection experiments were performed on the same sample under the same experimental conditions, which enabled a better understanding of the physical parameters of the state in which natural gas hydrate occurs, and helped to establish an accurate view of the microscale hydrate distribution. Determining a quantitative relationship between the basic physical parameters of its reservoir is highly important.
The microscopic distribution pattern of the hydrate formation process in sandy sediments was preliminarily obtained. Preliminary studies found that pore-filling hydrates mainly formed at the gas–water interface in the initial stage and gradually grew along the gas–water interface in the middle stage, mainly in the pore fluid. Afterward, they came in contact with the sediments to form a sedimentary framework.
The newly developed experimental device could accurately detect the acoustic properties during hydrate generation and decomposition and simultaneously observe the spatial distribution of hydrate, water, gas, and sediment in a sedimentary reservoir in real time, which provided a new method for the simultaneous observation of microscale distributions and acoustic testing in natural gas hydrate samples. The experimental design of this study can provide a basis for relevant scientific research to be carried out in future studies for specific scientific problems.

Author Contributions

Research design, Q.B., Q.M. and G.H.; methodology, Q.B. and C.L. (Chengfeng Li); experiments, J.Z., Z.W. and W.Z.; data analysis, J.D., J.K. and C.L. (Chengfeng Li); writing—original draft preparation, Q.B.; writing—review and editing, Q.M. and G.H.; supervision, C.L. (Changling Liu); project administration, C.L. (Changling Liu). All authors have read and agreed to the published version of the manuscript.

Funding

This research was supported financially by the National Natural Science Foundation of China (no. 41906067), Shandong Provincial Natural Science Foundation (no. ZR2019BD051), Marine S&T Fund of Shandong Province for Pilot National Laboratory for Marine Science and Technology (Qingdao) (no. 2021QNLM020002), China Postdoctoral Science Foundation (grant no. 2018M632634), Shandong Province Postdoctoral Innovation Project (201902050), and Marine Geological Survey Program (DD20221704).

Institutional Review Board Statement

Not applicable.

Informed Consent Statement

Not applicable.

Data Availability Statement

The data that support the findings of this paper are available upon request.

Conflicts of Interest

The authors declare no conflict of interest.

References

  1. Sloan, E.; Koh, C. Clathrate Hydrates of Natural Gases; CRC Press: Boca Raton, FL, USA, 2008; pp. 156–168. [Google Scholar]
  2. Lv, T.; Li, X.S.; Chen, Z.Y.; Sun, D.; Zhang, Y.; Yan, K.F.; Cai, J. Experimental investigation on the production behaviors of methane hydrate in sandy sediments by different depressurization strategies. Energy Technol. 2018, 6, 2501–2511. [Google Scholar] [CrossRef]
  3. Merey, S. Well completion operations in gas hydrate reservoirs. Int. J. Oil Gas Coal. Technol. 2019, 20, 373–396. [Google Scholar] [CrossRef]
  4. Makogon, Y.F.; Holditch, S.A.; Makogon, T.Y. Natural gas-hydrates—A potential energy source for the 21st Century. J. Petrol. Sci. Eng. 2007, 56, 14–31. [Google Scholar] [CrossRef]
  5. He, T.B.; Chong, Z.R.; Babu, P.; Linga, P. Techno-economic Evaluation of Cyclopentane Hydrate-Based Desalination with LNG Cold Energy Utilization. Energy Technol. 2019, 8, 1900212. [Google Scholar] [CrossRef]
  6. Yin, Z.Y.; Linga, P. Methane hydrates: A future clean energy resource. Chinese J. Chem. Eng. 2019, 27, 36–46. [Google Scholar] [CrossRef]
  7. Paull, C.K.; Matsumoto, R. Leg 164 overview. Proc. Ocean. Drill. Program Sci. Results 2000, 164, 3–10. [Google Scholar]
  8. Claypool, G.E.; Milkov, A.V.; Lee, Y.J.; Torres, M.E.; Borowski, W.S.; Tomaru, H. Microbial methane generation and gas transport in shallow sediments of an accretionary complex, southern hydrate ridge (ODP leg 204), offshore oregon, USA. Proc. Ocean. Drill. Program Sci. Results 2006, 204, 1–52. [Google Scholar]
  9. Pohlman, J.W.; Kaneko, M.; Heuer, V.B.; Coffin, R.B.; Whiticar, M. Methane sources and production in the northern Cascadia margin gas hydrate system. Earth Planet Sc. Lett. 2009, 287, 504–512. [Google Scholar] [CrossRef]
  10. Kida, M.; Jin, Y.; Watanabe, M.; Konno, Y.; Yoneda, J.; Egawa, K.; Ito, T.; Nakatsuka, Y.; Suzuki, K.; Fujii, T.; et al. Chemical and crystallographic characterizations of natural gas hydrates recovered from a production test site in the eastern Nankai Trough. Mar. Petrol. Geol. 2015, 66, 396–403. [Google Scholar] [CrossRef]
  11. Lorenson, T.D.; Collett, T.S. Nation Gas Hydrate Program Expedition 01 offshore India gas hydrate petroleum systems as revealed by hydrocarbon gas geochemistry. Mar. Petrol. Geol. 2018, 92, 477–492. [Google Scholar] [CrossRef]
  12. Collett, T.S.; Boswell, R.M. Resource and hazard implications of gas hydrates in the Northern Gulf of Mexico: Results of the 2009 Joint Industry Project Leg II Drilling Expedition. Mar. Petrol. Geol. 2012, 34, 223. [Google Scholar] [CrossRef]
  13. Park, K.P.; Bahk, J.J.; Kwon, Y.; Kim, G.Y.; Riedel, M.; Holland, M.; Schultheiss, P.; Rose, K. The UBGH-1 Scientific Party. Korean National Program Expedition Confirms Rich Gas Hydrate Deposits in the Ulleung Basin, East Sea. Fire Ice Methane Hydrate Newsl. 2008, 8, 6–9. [Google Scholar]
  14. Collett, T.S.; Riedel, M.; Cochran, J.R.; Boswell, R.; Kumar, P.; Sathe, A.V.; The NGHP Expedition01 Scientific Party. Indian continental margin gas hydrate prospects: Results of the Indian National Gas Hydrate Program (NGHP) Expedition 01. In Proceedings of the 6th International Conference on Gas Hydrates (ICGH 2008), Vancouver, BC, Canada, 6–10 July 2008. 10p. [Google Scholar]
  15. Collett, T.S. Energy resource potential of natural gas hydrates. Am. Assoc. Pet. Geol. 2002, 86, 1971–1992. [Google Scholar]
  16. Kvenvolden, K.A. A review of the geochemistry of methane in natural gas hydrate. Org. Geochem. 1995, 23, 997–1008. [Google Scholar] [CrossRef]
  17. Milkov, A.V.; Sassen, R. Economic geology of offshore gas hydrate accumulations and provinces. Mar. Petrol. Geol. 2002, 19, 1–11. [Google Scholar] [CrossRef]
  18. Bondarenko, V.; Sai, K.; Prokopenko, K.; Zhuravlov, D. Thermodynamic and geomechanical processes research in the development of gas hydrate deposits in the conditions of the Black Sea. Min. Miner. Depos. 2018, 12, 104–115. [Google Scholar] [CrossRef]
  19. Bazaluk, O.; Sai, K.; Lozynskyi, V.; Petlovanyi, M.; Saik, P. Research into dissociation zones of gas hydrate deposits with a heterogeneous structure in the Black Sea. Energies 2021, 14, 1345. [Google Scholar] [CrossRef]
  20. Moridis, G.J.; Collett, T.S.; Pooladi-Darvish, M.; Hancock, S.H.; Santamarina, J.C.; Boswell, R.; Koh, C. Challenges, uncertainties and issues facing gas production from hydrate deposits in geologic systems. In Proceedings of the SPE Unconventional Gas Conference, Pittsburgh, PA, USA, 23–25 February 2010. [Google Scholar]
  21. Li, Y.L.; Liu, L.L.; Jin, Y.R.; Wu, N.Y. Characterization and development of natural gas hydrate in marine clayey-silt reservoirs: A review and discussion. Adv. Geo-Energy Res. 2021, 5, 75–86. [Google Scholar] [CrossRef]
  22. Li, Y.L.; Sun, H.L.; Meng, Q.G.; Liu, C.L.; Chen, Q.; Xing, L.C. 2-D electrical resistivity tomography assessment of hydrate formation in sandy sediments. Nat. Gas Ind. B 2020, 7, 278–284. [Google Scholar] [CrossRef]
  23. Cai, J.C.; Xia, Y.X.; Xu, S.; Tian, H.T. Advances in multiphase seepage characteristics of natural gas hydrate sediments. Chin. J. Theor. Appl. Mech. 2019, 52, 208–223. [Google Scholar]
  24. Cai, J.C.; Wei, W.; Hu, X.Y.; Wood, D.A. Electrical conductivity models in saturated porous media: A review. Earth-Sci. Rev. 2017, 171, 419–433. [Google Scholar] [CrossRef]
  25. Webb, E.B.; Rensing, P.J.; Koh, C.A.; Sloan, E.D.; Sum, A.K.; Liberatore, M.W. High pressure rheometer for in situ formation and characterization of methane hydrates. Rev. Sci. Instrum. 2012, 83, 015106. [Google Scholar] [CrossRef] [PubMed]
  26. Maeda, N. Measurements of gas hydrate formation probability distributions on a quasi-free water droplet. Rev. Sci. Instrum. 2013, 84, 015110. [Google Scholar] [CrossRef] [PubMed]
  27. Priegnitz, M.; Thaler, J.; Spangenberg, E.; Rucker, C.; Schicks, J.M. A cylindrical electrical resistivity tomography array for three-dimensional monitoring of hydrate formation and dissociation. Rev. Sci. Instrum. 2013, 84, 104502. [Google Scholar] [CrossRef] [PubMed]
  28. Zhao, J.; Wang, B.; Yang, L.; Cheng, C.; Song, Y. A novel apparatus for in situ measurement of thermal conductivity of hydrate-bearing sediments. Rev. Sci. Instrum. 2015, 86, 085110. [Google Scholar] [CrossRef]
  29. Muraoka, M.; Yamamoto, Y. In situ chamber built for clarifying the relationship between methane hydrate crystal morphology and gas permeability in a thin glass micromodel cell. Rev. Sci. Instrum. 2017, 88, 064503. [Google Scholar] [CrossRef]
  30. Bu, Q.T.; Hu, G.W.; Ye, Y.G.; Liu, C.L.; Li, C.F.; Best, A.I.; Wang, J.S. The elastic wave velocity response of methane gas hydrate formation in vertical gas migration systems. J. Geophys. Eng. 2017, 14, 555–569. [Google Scholar] [CrossRef] [Green Version]
  31. Bu, Q.T.; Hu, G.W.; Ye, Y.G.; Liu, C.L.; Li, C.F.; Wang, J.S. Experimental study on 2-d acoustic characteristics and hydrate distribution in sand. Geophys. J. Int. 2017, 211, 990–1004. [Google Scholar] [CrossRef]
  32. Bu, Q.T.; Hu, G.W.; Liu, C.L.; Xing, T.J.; Li, C.F.; Meng, Q.G. Acoustic characteristics and microscopic distribution prediction during hydrate dissociation in sediments from the South China Sea. J. Nat. Gas Sci. Eng. 2019, 65, 135–144. [Google Scholar] [CrossRef]
  33. Bu, Q.T.; Hu, G.W.; Liu, C.L.; Dong, J.; Xing, T.J.; Sun, J.Y.; Li, C.F.; Meng, Q.G. Effect of methane gas on acoustic characteristics of hydrate-bearing sediment–model analysis and experimental verification. J. Ocean. U China 2021, 20, 75–86. [Google Scholar] [CrossRef]
  34. Bu, Q.T.; Liu, S.B.; Hu, G.W.; Liu, C.L.; Wan, Y.Z. Acoustic characteristics of hydrate-bearing sediments: A comparative analysis of experimental and numerical simulations results. Mar. Geol. Front. 2020, 36, 56–67. [Google Scholar]
  35. Dvorkin, J.; Prasad, M.; Sakai, A.; Lavoie, D. Elasticity of marine sediments: Rock physics modeling. Geophys. Res. Lett. 1999, 26, 1781–1784. [Google Scholar] [CrossRef]
  36. Helgerud, M.B.; Dvorkin, J.; Nur, A.; Sakai, A.; Collett, T. Elastic-wave velocity in marine sediments with gas hydrate: Effective medium modeling. Geophys. Res. Lett. 1999, 26, 2021–2024. [Google Scholar] [CrossRef]
  37. Yang, L.; Falenty, A.; Chaouachi, M.; Haberthür, D.; Kuhs, W.F. Synchrotron X-ray computed microtomography study on gas hydrate decomposition in a sedimentary matrix. Geochem. Geophy. Geosyst. 2016, 17, 3717–3732. [Google Scholar] [CrossRef] [Green Version]
  38. Chaouachi, M.; Falenty, A.; Sell, K.; Enzmann, F.; Kersten, M.; Haberth€ur, D.; Kuhs, W.F. Microstructural evolution of gas hydrates in sedimentary matrices observed with synchrotron X-ray computed tomographic microscopy. Geochem. Geophy. Geosyst. 2015, 16, 1711–1722. [Google Scholar] [CrossRef] [Green Version]
  39. Le, T.X.; Bornert, M.; Aimedieu, P.; Chabot, B.; King, A.; Tang, A.M. An experimental investigation on methane hydrate morphologies and pore habits in sandy sediment using synchrotron x-ray computed tomography. Mar. Petrol. Geol. 2020, 122, 104646. [Google Scholar] [CrossRef]
  40. Han, G.; Kwon, T.H.; Lee, J.Y.; Kneafsey, T.J. Depressurization-induced fines migration in sediments containing methane hydrate: X-ray computed tomography imaging experiments. J. Geophys. Res. Solid Earth 2018, 123, 2539–2558. [Google Scholar] [CrossRef]
  41. Li, Y.H.; Song, X.G.; Wu, P.; Sun, X.; Song, Y.C. Consolidation deformation of hydrate-bearing sediments: A pore-scale computed tomography investigation. J. Nat. Gas Sci. Eng. 2021, 95, 104184. [Google Scholar] [CrossRef]
  42. Zhao, Y.S.; Zhao, J.Z.; Shi, D.X.; Feng, Z.C.; Liang, W.G.; Yang, D. Micro-ct analysis of structural characteristics of natural gas hydrate in porous media during decomposition. J. Nat. Gas Sci. Eng. 2016, 31, 139–148. [Google Scholar] [CrossRef]
  43. Li, C.F.; Liu, L.L.; Sun, J.Y.; Zhang, Y.C.; Hu, G.W.; Liu, C.L. Finite element analysis of micro-seepage in hydrate-bearing quartz sands based on digital cores. Mar. Geol. Front. 2020, 36, 68–72. [Google Scholar]
  44. Zhang, Y.C.; Liu, C.L.; Wu, N.Y.; Liu, L.L.; Hao, X.L.; Meng, Q.G.; Li, C.F.; Sun, J.Y.; Wang, D.G. Advances in the pore-structure characteristics and microscopic seepage numerical simulation of the hydrate-bearing sediments. Mar. Geol. Front. 2020, 36, 23–33. [Google Scholar]
  45. Ma, S.H.; Zheng, J.N.; Tang, D.W.; Li, Y.P.; Lv, X. Application of X-Ray Computed Tomography Technology in Gas Hydrate. Energy Technol. 2018, 7, 1800699. [Google Scholar] [CrossRef]
  46. Li, C.F.; Hu, G.W.; Zhang, W.; Ye, Y.G.; Liu, C.L.; Li, Q.; Sun, J.Y. Influence of foraminifera on formation and occurrence characteristics of natural gas hydrates in fine-grained sediments from shen hu area, South China Sea. Sci. China Earth Sci. 2016, 59, 2223–2230. [Google Scholar] [CrossRef]
  47. Li, C.F.; Liu, C.L.; Hu, G.W.; Sun, J.Y.; Hao, X.L.; Liu, L.L.; Meng, Q.G. Investigation on the multiparameter of hydrate - bearing sands using nano-focus X-ray computed tomography. J. Geophys. Res. Solid Earth 2019, 124, 2286–2296. [Google Scholar] [CrossRef]
  48. Lei, L.; Seol, Y.; Myshakin, E.M. Methane hydrate film thickening in porous media. Geophys. Res. Lett. 2019, 46, 11091–11099. [Google Scholar] [CrossRef]
  49. Lei, L.; Seol, Y.; Choi, J.H.; Kneafsey, T.J. Pore habit of methane hydrate and its evolution in sediment matrix—Laboratory visualization with phase-contrast micro-ct. Mar. Petrol. Geol. 2019, 104, 451–467. [Google Scholar] [CrossRef] [Green Version]
  50. Lei, L.; Seol, Y. High—Saturation gas hydrate reservoirs—A pore scale investigation of their formation from free gas and dissociation in sediments. J. Geophys. Res. Solid Earth 2019, 124, 12430–12444. [Google Scholar] [CrossRef]
  51. Konno, Y.; Jin, Y.; Uchiumi, T.; Nagao, J. Multiple-pressure-tapped core holder combined with x-ray computed tomography scanning for gas-water permeability measurements of methane-hydrate-bearing sediments. Rev. Sci. Instrum. 2013, 84, 064501. [Google Scholar] [CrossRef]
  52. Li, Y.H.; Wu, P.; Liu, W.G.; Sun, X.; Cui, Z.; Song, Y.C. A microfocus x-ray computed tomography based gas hydrate triaxial testing apparatus. Rev. Sci. Instrum. 2019, 90, 055106. [Google Scholar] [CrossRef]
  53. Seol, Y.; Lei, L.; Choi, K.J.; Jarvis, D. Hill, Integration of triaxial testing and pore-scale visualization of methane hydrate bearing sediments review of scientific instruments. Rev. Sci. Instrum. 2019, 90, 124504. [Google Scholar] [CrossRef]
  54. Zhang, Z.; Liu, L.L.; Li, C.F.; Liu, C.L.; Ning, F.L.; Liu, Z.C.; Meng, Q.G. A testing assembly for combination measurements on gas hydrate-bearing sediments using x-ray computed tomography and low-field nuclear magnetic resonance. Rev. Sci. Instrum. 2021, 92, 085108. [Google Scholar] [CrossRef] [PubMed]
  55. Zhao, J.; Liu, C.; Li, C.; Zhang, Y.; Bu, Q.; Wu, N.; Liu, Y.; Chen, Q. Pore-Scale Investigation of the Electrical Property and Saturation Exponent of Archie’s Law in Hydrate-Bearing Sediments. J. Mar. Sci. Eng. 2022, 10, 111. [Google Scholar] [CrossRef]
  56. Seol, Y.; Choi, J.; Dai, S. Multi-property characterization chamber for geophysical-hydrological investigations of hydrate bearing sediments. Rev. Sci. Instrum. 2014, 85, 084501. [Google Scholar] [CrossRef] [PubMed]
  57. Jin, Y.; Konno, Y.; Yoneda, J.; Kida, M.; Nagao, J. In situ methane hydrate morphology investigation: Natural gas hydrate-bearing sediment recovered from the eastern nankai trough area. Energy Fuel. 2016, 30, 5547–5554. [Google Scholar] [CrossRef]
  58. Sahoo, S.K.; Madhusudhan, B.N.; Marín-Moreno, H.; North, L.J.; Ahmed, S.; Falcon-Suarez, I.H.; Minshull, T.A.; Best, A.I. Laboratory insights into the effect of sediment-hosted methane hydrate morphology on elastic wave velocity from time-lapse 4-D synchrotron X-ray computed tomography. Geochem. Geophy. Geosyst. 2018, 19, 4502–4521. [Google Scholar] [CrossRef] [Green Version]
  59. Yang, L.; Zhou, W.; Xue, K.; Wei, R.; Ling, Z. A pressure core ultrasonic test system for on-board analysis of gas hydrate-bearing sediments under in situ pressures. Rev. Sci. Instrum. 2018, 89, 054904. [Google Scholar] [CrossRef]
  60. Yang, L.; Zhao, J.F.; Liu, W.G.; Li, Y.H.; Yang, M.J.; Song, Y.C. Microstructure observations of natural gas hydrate occurrence in porous media using microfocus x-ray computed tomography. Energy Fuel. 2015, 29, 4835–4841. [Google Scholar] [CrossRef]
Figure 1. Schematic configuration of the ultrasonic–CT combined detection system for hydrate.
Energies 15 04938 g001
Figure 2. Structure of the core holder with ultrasonic probes for X-CT scanning.
Energies 15 04938 g002
Figure 3. Actual display of (a) the core holder and (b) the X-CT scanning system.
Energies 15 04938 g003
Figure 4. Variation in temperature, pressure, and hydrate saturation (Sh) during hydrate formation.
Energies 15 04938 g004
Figure 5. (a) The ultrasonic transducer and (b) the schematic diagram of the ultrasonic transducer.
Energies 15 04938 g005
Figure 6. Signal waveform of the direct measurement of t0.
Energies 15 04938 g006
Figure 7. The overall schematic of a specimen scan.
Energies 15 04938 g007
Figure 8. Variation of acoustic wave velocity with hydrate saturation during hydrate formation.
Energies 15 04938 g008
Figure 9. X-CT images of a sample cross-section during hydrate formation, where (ad) represent different formation stages: (a) before hydrate formation, (b) the initial stage of hydrate formation, (c) the middle stage of hydrate formation, and (d) the late stage of hydrate formation. The yellow represents methane hydrate, the blue represents NaCl solution, the light gray represents sand, and the black represents methane gas.
Energies 15 04938 g009
Figure 10. Variation of the microscopic spatial distribution and acoustic characteristics during hydrate formation. The yellow represents methane hydrate, the blue represents NaCl solution, the light gray represents sand, and the black represents methane gas.
Energies 15 04938 g010
Table 1. Testing time for P-wave of POM rods.
No.POM-1POM-2POM-3POM-4
Length (m)0.120.150.2040.25
Average time of t (µs)57.7574.6597.45117.35
Publisher’s Note: MDPI stays neutral with regard to jurisdictional claims in published maps and institutional affiliations.

