
Evolution of the Pseudo-Components of Heavy Oil during Low Temperature Oxidation Processes
by
 ,
,
Renbao Zhao
1,2,*, 
Tiantian Wang
1,*,
Lijuan Chen
3,
Jingjun Pan
3,
Shutong Li
1,
Dong Zhao
1,
Long Chen
3 and
Jiaying Wang
1 1
State Key Laboratory of Petroleum Resources and Prospecting, China University of Petroleum, Beijing 102249, China
2
Technology and Information Department, China University of Petroleum-Beijing at Karamay, Karamay 834000, China
3
Xinjiang Oil Field Branch Company, PetroChina, Karamay 834000, China
*
Authors to whom correspondence should be addressed.
Energies 2022, 15(14), 5201; https://doi.org/10.3390/en15145201
Submission received: 14 June 2022
/
Revised: 9 July 2022
/
Accepted: 13 July 2022
/
Published: 18 July 2022
(This article belongs to the Special Issue Development of Unconventional Oil and Gas Fields)
Abstract
:Heavy oil was divided into different pseudo-components according to their boiling ranges through a real-boiling point distillation process, and the oxidation products for pseudo-components with a boiling range higher than 350 °C were systematically investigated during low temperature oxidation (LTO). Kinetic cell (KC) experiments were conducted under different ambient pressure conditions and temperature ranges, and the oxidation products were characterized using Fourier transform ion cyclotron resonance mass spectrometry (FT-ICR-MS). The results indicate that the oxygen addition and cracking reactions typically occur in the temperature intervals of 140–170 °C and 180–220 °C, respectively, at the given heating rate of 3.83 °C/min. Components with the mass-to-charge ratio in the region of 250–450 Da mainly evaporate in the temperature regions of 25–150 °C, which results in losses from the fraction. Considering the gas-liquid multi-phase reaction, the pseudo-components with low boiling range distributed on the surface of the liquid film are prone to generate high molecular weight compounds through oxygen addition. In contrast, the high boiling point range fractions increase in molecular weight through oxygen addition and are then subject to further cracking processes that generate lower molecular weights in the region of 200–400 Da. N1O3- and N1O4- containing compounds were determined by high resolution mass spectra, and these compounds were generated through oxygen addition of basic N1-containing compounds. On the basis of these reactions and the experimental results obtained, some insights related to the LTO of heavy oil, which are highly valuable for ISC field applications, are summarized.
1. Introduction
Considering the issues of increasing energy demand of mankind and the challenge of renewable energy development, the profitable exploitation of unconventional oil and gas resources with less energy consumption is more imperative at present than before. As a typical unconventional fossil fuel, heavy oil is widely distributed with large amounts of underground resources, especially in Canada, Venezuela and China, etc. (Lovett et al. 2015; Ashraf et al. 2021; Safaei et al. 2022) [1,2,3]. Therefore, the development of heavy oil is of great strategic significance to adjust the energy structure and alleviate the energy crisis. However, the steam method used in the development of heavy oil is traditionally considered as a high energy consumption process. In situ combustion (ISC) is acknowledged as one of the most attractive alternatives for heavy oil recovery due to its higher displacement efficiency and better cost-effectiveness [4]. The ISC process is essentially a complex thermochemical reaction, which occurs simultaneously in multiphase flow in heavy oil reservoirs. It is generally divided into three stages according to the local temperature environment: low temperature oxidation (LTO), oxidative cracking and high temperature oxidation (HTO) [5,6].
The LTO process is defined as the beginning of the ISC, which generates a certain amount of oxygenated compounds with multi-oxygen groups (Ox, x ≥ 2). Then the second stage, known as oxidative cracking, begins under atmospheric conditions when temperature rises to around 260 °C. Oxygenated compounds are continually cracked into lower molecular weight hydrocarbons mainly through decarbonation processes [7]. The residue called “coke” serves as fuel and is burned through the HTO process in the even higher temperature region of around 380 °C. Hence, the LTO process can be regarded as the first stage in “coke” preparation, and many researchers name these mixtures as ‘coke1’ [8]. The oxidative cracking process is regarded as the second or final phase of the “coke” preparation, which generates thermal cracking products defined as ‘coke2’ [9]. Although numerous studies have reported on the LTO mechanism of heavy oil, the correlation between the production evolution and molecule distribution at different temperature regions is unclear.
Traditionally, most researchers characterized the reaction kinetics of heavy oil during the ISC process solely according to the content variation of saturates, aromatics, resin and asphaltene (abbreviated as SARA) analysis [10,11]. The degree of LTO was intensified with the oxidation temperature, during which gas compositions and the content of elements, saturates-aromatics-resins-asphaltenes (SARA) fractions, free radicals, and hydrogen groups of oils that were produced changed obviously [12,13]. However, the relationship between variation in the SARA fractions and the reaction kinetics as well as fuel consumption have been studied using qualitative or semiquantitative analysis methods, and the conclusions drawn by different researchers are contradictory. Saturated hydrocarbons have a higher reactivity during the LTO process and tend to be more readily oxidized than other components [14]. However, aromatic hydrocarbons have greater reactivity during oxidation [15]. Therefore, the traditional method of separating the heavy oil with a wide carbon number distribution and varying functional groups into SARA fractions according to its polarity variation is not suitable for explaining the effect of the ISC processes which involve intense distillation effects and large temperature differences.
The true boiling point distillation (TBPD) experiment is normally used to divide the heavy oil into different fractions according to the different true boiling points of the components rather than polarity [16]. In contrast to using the SARA fraction, the method of dividing heavy oil into different pseudo-components according to distillation range may help to reveal the relationship between the component consumption and distillation range distribution. Hence, it can be inferred that serious separation of components would occur in the reservoir during the ISC process due to the distillation effect [17]. The components with lower boiling points evaporate more readily and are flushed away by flue gases rather than oxidized, whereas the higher boiling range fractions would burn as fuel in three reaction periods. A study of the reaction kinetics of different pseudo-components suggests that the fractions with higher boiling point range are consumed more as fuel, and therefore, contribute more to heat generation [18]. Hence, the method of dividing the heavy oil into different pseudo-components according to their different boiling ranges is more reasonable than SARA. The variation of the components with boiling ranges higher than 350 °C should be considered most as the main contribution of LTO.
In order to characterize the variation of components in the LTO process, gas chromatography (GC) [19], thermo-gravimetry (TG) [20], Fourier transform infrared spectroscopy (FT-IR) [21] and other advanced apparatus have been widely used recently. The oxidation products through the GC analysis during the ISC process, and a significant pyrolysis reaction was verified according to the variation in the carbon number distribution [22]. In addition, an important marker called anthracene was also detected, from which can be inferred that the thermal cracking of heavy oil is an essential reaction path in the successful ISC process [23]. Since the analysis of effluent oil in peaks spectrum varying with the wavelength or retention time, which were automatically plotted by the FT-IR and GC apparatus, separately demonstrated the light absorption versus wavelength and total ionize intensity versus retention time. Neither of the two methods can precisely determine the concentration or the total amount of compounds. A greater deviation may occur when serious baseline drift is encountered in heavy oil gas chromatography [24]. Therefore, according to the changes of molecular functional groups and carbon number distribution, the comprehensive characterization method of analyzing the complex components of crude oil at the molecular level is very important to revealing the reaction scheme in the ISC process [25]. FT-ICR MS has proved to be an efficient method for providing quantitative information on crude oil, especially concerning the molecular composition with different carbon number distributions and functional groups variation [26,27]. The fraction variation in oil samples can be assessed using FT-ICR MS assisted with multiple ionization sources, and the results indicate that the basic nitrides and PAHs in heavy oil are relatively stable, whereas the acidic compounds undergo significant changes [28].
In this work, the oxidation behavior of heavy crude oil and its distillate fractions were investigated using KC experiments and FT-ICR-MS, which were expected to offer some new insights into the oxidation mechanisms of crude oils during the LTO process.
2. Apparatus and Methodology
2.1. Materials
The oil sample was collected from Xinjiang Oil field and was dehydrated prior to use. A HAAKE RS6000 Rotor Rheometer (Thermo Scientific, Karlsruhe, Germany) was used to determine the viscosity of the oil sample at a constant temperature of 40 °C. The oil sample was characterized with a density of 0.959 × 10³ kg/m3 and the viscosity of 14,582 mPa·s.
The true boiling point distillation experiments were conducted under atmospheric and vacuum conditions to fractionate the oil sample into many pseudo-components with different boiling ranges. The mass distribution of the pseudo-components of the oil sample is presented in Table 1. It can be seen that the content of collected components with a boiling point greater than 350 °C exceeds 68% of the oil sample. These fractions were regarded as major sources of fuel formation during the ISC process due to their poor mobility (or higher viscosity) and smaller distillation effect.
2.2. Apparatus
A true boiling point distillation apparatus (Petroleum Analytical Instrument Company, Dalian, China) was used for preparation of the pseudo-components, and the kinetic cell (KC) experiment was conducted to investigate the LTO process of heavy oil in porous media. A detailed description of the apparatus and experimental operations has been presented in previous research [29]. A Bruker’s Apex-Ultra model Fourier transform ion cyclotron mass spectrometer (FT-ICR MS) was then utilized to characterize the functional groups and carbon number distribution of the heavy oil.
2.3. Kinetic Cell Experiment
The kinetic cell (KC) experiment device consists of four units: the temperature monitoring unit, the air flow rate control unit, the gas concentration measurement unit, and the data transportation and logging unit. In order to investigate the LTO reaction at different environmental temperatures, the furnace heating was pre-programmed to increase a linear manner from room temperature to the different target set-points. The other experimental conditions and procedures remained unchanged. Quartz sand particles with the mesh size of 40–60 were mixed adequately with the pseudo-components at a mass ratio of 10 to 0.5 and placed into the cell. Details of the KC experiment procedure were also reported in the previous research [30]. The test process was as follows: the whole system was flushed with nitrogen at the rate of 2 L/min to calibrate the gas analyzer after the completion of the leak check process, and then altered to air injection at the same rate. The furnace was triggered with a heating rate of 3.83 °C/min while the oxygen concentration was maintained at a constant value of 20.80%. At the same time, the gas concentration produced was monitored on-line by the gas analyzer. The parameters of the KC experiments are shown in Table 2.
2.4. FT-ICR MS Characterization
The FT-ICR MS instrument has a magnetic field strength of 9.4 T and is equipped with a negative ion electrospray ionization (-ESI) source to ionize compounds containing polar heteroatoms. After the LTO process, the oil sand was removed from the kinetic cell and the oxidation products were extracted with toluene according to the national standard SYT 5118–2005. The mixture was then dissolved continuously with more toluene diluted to 10 mg/mL. Methanol and toluene were mixed at a volume ratio of 3:1 and used to dilute the above solution to 0.2 mg/mL. In addition, a 20 µL NH4OH solution was spiked into the 1 mL analyte to promote the ionization.
The mass spectrum peak data with a signal-to-noise ratio greater than 5.5 was then imported into Excel, and the relative molecular mass (IUPAC Mass) of the compound was converted into Kendrick mass by Equation (1):
In this calculation, the relative molecular mass of the compounds with the same parent structure differs by an integer multiple of 14, while the decimal portion remains the same the same. Therefore, the same type of compounds can be quickly identified according to the Kendrick mass.
Negative-ion electrospray ionizes petroleum acids and weakly acidic, neutral nitrogen compounds, by which the atomic groups of C, H, O, N and S in molecules can be determined accurately. Therefore, the chemical formula (CcHhNnSs) can be accurately determined according to the exact molecular weight corresponding to the mass spectrum peaks [31]. The equivalent double bond (DBE) is defined as the sum of the number of double bonds and the number of cycloalkyl moieties in the molecular structure. The formula is provided as follows:
2.5. Total Oxygen Consumption and Carbon Oxides Production
The molar amounts of O2 consumption and COx (equal to the sum of CO and CO2) production for different pseudo-components were calculated according to the on-line measurement of the gas analyzer. In past studies, two peaks have been found in both the O2 and COx concentration curves, which also correspond to the two temperature humps designated as low temperature oxidation (LTO) and high temperature oxidation (HTO), respectively [32]. The accumulation amount of carbon oxides production during the HTO period was defined as the amount of fuel consumption.
The gas analyzer produced data in the form of percent concentration of the vent gas per second. The total production of COx and consumption of O2 in the kinetic cell experiment were calculated using Equations (3) and (4):
where q represents the gas flow; t1 and t2 represent the moments that different reaction processes start and end, respectively. The concentrations of O2, CO and CO2 were detected by the gas analyzer.
3. Results and Discussion
3.1. Oxidation Degree at Different Temperature Regions
The molar amounts of oxygen consumption and carbon oxides production for the four distillate fractions (350–420 °C, 420–450 °C, 450–500 °C and 500+ °C) of oil sample 1 increased with the ambient temperature; the calculated results are listed in Table 3 and Table 4. The results indicate that the higher the environment temperature, the greater the oxygen addition and cracking degree of LTO, which is consistent with the previous research [33].
RCOx/O2 designates the ratio of carbon oxides production to oxygen consumption. Table 5 lists the calculated values of each pseudo-component. Significantly, the value of RCOx/O2 increases directly with the carbon oxides production, which indicates that the degree of decarboxylation of pseudo-components increases in the LTO process. The RCOx/O2 of four pseudo-components is low and varies in the range of 0–0.33 when the temperature falls in the region of 25–200 °C. The pseudo-components of the 350–420 °C and 420–450 °C ranges are susceptible to being oxidized into oxygen-containing compounds to a higher degree due to their higher concentration in the gas phase. However, the pseudo-components of 450–500 °C and 500+ °C have a lower oxidation degree with a lower conversion. Although these four components present different reaction behaviors, the RCOx/O2 of each pseudo-component continues to increase to about 50% when the temperature increases to 300 °C. This indicates that the oxygen addition and decarboxylation or cracking reaction become faster with even greater conversion of heteroatom compounds. During this process, the oxygenated products containing Ox (x ≥ 2) groups continue to react with oxygen through two different processes, namely decarboxylation and dehydrogenation reactions. The rates of both the reactions vary directly with the temperature, resulting in a greater amount of carbon oxides production.
Figure 1 shows that the temperature that triggers the LTO process for the four pseudo-components varies directly with their boiling range. The temperature that triggers the oxidation and cracking reactions is higher for pseudo-components with higher boiling range when all other factors are the same. The oxidation reaction monitored by the oxygen consumption for the four pseudo-components occurs when the ambient temperature reaches 145.43 °C, 155.95 °C, 162.20 °C and 167.63 °C, respectively. However, the carbon oxides production, which is normally considered as the indicator of cracking reactions, was not initiated until the temperature reached even higher values of 184.32 °C, 193.21 °C, 197.83 °C and 210.23 °C, respectively. According to the variation of COX and O2 concentrations in different temperature ranges, it can be inferred that the pseudo-components mainly undergo oxygen addition in the range of 140–170 °C, whereas the cracking and dehydrogenation occur simultaneously at 180–220 °C. Furthermore, it can be predicted that for the whole crude oil, oxidation and cracking reactions occur when the ambient temperature varies in the regions of 150–200 °C and 200–300 °C, respectively.
3.2. Evolution of Relative Molecular Weight Distribution
In order to characterize the molecular weight distribution of the pseudo-components at different temperature regions, the mass spectra variation before and after oxidation were superimposed to identify any differences, as is shown in Figure 2 and Figure 3. The blue and red curves represent the mass spectrum peak distributions for different components before and after oxidation, respectively. The x-axis represents the variation in relative molecular weight, and the y-axis is the total ion current intensity, which is regarded as relatively abundance.
Figure 2 shows the high-resolution mass spectrogram of four pseudo-components before and after the reaction in the 25–150 °C temperature range. Notably, the amount of low molecular weight compounds is reduced, which might be attributed to the oxidation and evaporation processes. Considering the initial reaction temperature varying from 145.43 to 167.63 °C for different fractions, the amount of oxygen consumption should be the lowest or even zero (for the component 500+ °C) if the ambient temperature is set in the range of 25–150 °C (shown in Table 4). The carbonaceous gas production for pseudo-components in the 450–500 °C and 500+ °C ranges were also measured as zero (shown in Table 5), which confirms the absence of decarboxylation or cracking reaction. In addition, a high precision resolution gas analyzer was used to monitor the compositions of the effluent gas and a small amount of C1-C4 production was found, which was attributed to either the cracking reaction or distillation effect during the LTO process [34]. Consequently, the reduction in the content of low-molecular-weight compounds distributed in the left side of the spectrum for each pseudo-component is mainly caused by the serious distillation effect. In the temperature interval 25–150 °C, compounds withmolecular weight distributions in the range of 250–300 Da, 250–320 Da, 350–430 Da and 300–450 Da, which were initially characterized as the four pseudo-components, were found only at low levels. According to the evolution of the relative molecular weight distribution in the 25–150 °C temperature region, it can be inferred that the pseudo-components with molecular weights of 250–450 Da were mainly evaporative fractions, which were volatilized and flushed by the flue gases.
Figure 3 shows the variation in the high-resolution mass spectra for the four pseudo-components before and after the reaction in the temperature region of 25–200 °C. These results indicate that the molecular weight distribution centers for the pseudo-components 350–420 °C and 420–450 °C shifted to the right during the oxidation reaction, and the number of mass spectra peaks found increased significantly in the 400–500 Da and 450–550 Da intervals. Conversely, the mass spectra of the pseudo-components 450–500 °C and 500+ °C showed no obvious changes before and after oxidation. The pseudo-components 350–420 °C and 420–450 °C consumed 6.36 × 10⁻³ mol and 6.56 × 10⁻³ mol of oxygen, respectively. They also produced lower amounts of carbonaceous gases: 3.73 × 10⁻⁴ mol and 1.19 × 10⁻⁴ mol, respectively. Similarly, the pseudo-components 450–500 °C and 500+ °C possess more viscous liquid films which substantially decrease the oxygen transportation speed; as a result, the oxygen consumption of these pseudo-components is greatly decreased (1.64 × 10⁻⁴ mol and 3.60 × 10⁻⁵ mol, respectively). Consequently, the pseudo-components with low boiling point range mainly generated high molecular weight compounds through the oxygen addition process. In the temperature interval 25–200 °C, the number of compounds with small molecular weights are slightly decreased, and are primarily distributed in the intervals of 350–430 Da and 300–460 Da. Additionally, the viscosity of crude oil after the LTO process may increase dramatically due to the reduction of some volatile fractions by distillation.
Figure 4 provides a high-resolution mass spectra of the four pseudo-components before and after the reaction in the 25–300 °C temperature range. The centers of the molecular weight distributions were significantly shifted to the left after oxidation due to the characterization of additional small molecular substances, which suggests a cracking process. Similarly, together with the carbonaceous gas production results shown in Table 5, it can be speculated that the oxidized products of oxygen addition continue to react with O2, leading to an even wider molecular weight distribution and lower molecular weight compounds. It has been reported that the cracking of weak C-C bonds within the branch chain is prone to occur under the attack of oxygen atoms during the LTO process, resulting in the formation of small molecule acid substances, CO2 and CO [35]. Figure 4 shows that the newly generated substances obtained from the oxidation reaction of four pseudo-components exhibit a molecular weight distribution in the intervals of 200–320 Da, 150–330 Da, 200–400 Da and 200–430 Da, respectively. The compounds within the pseudo-components 350–420 °C have broad molecular weight distributions, containing high-mass and low-mass compounds, which suggests that the main reaction transferred from oxygen addition to thermal cracking accompanied by oxygen addition. Therefore, a more intense degree of cracking for the 500+ °C component was detected, which is attributed to the weak C-C bonds that are mainly connected to the main carbon chain as a branch and weak C-heteroatoms bonds.
3.3. Evolution of Functional Groups of Oxygen and Nitrogen-Containing Compounds
The degree of oxygen addition and cracking reactions is normally characterized by the conversion of functional groups. Therefore, the changes in functional groups of the pseudo-components were analyzed. Figure 5 presents the data for temperature and two kinds of functional groups. It proves to be free of the LTO process at the origination point. The relative contents of N1 and O2 substances decreased significantly with the increase of temperature, whereas those of other compounds with the polar groups N1O3, N1O4, O3 and O4 increased directly. The initial proportions of O2-containing compounds in the four pseudo-components were measured as 98.38%, 94.38%, 95.37% and 48.43%, respectively. As the temperature increased to 300 °C, the proportion of the 500+ °C pseudo-components showed little change with the value of 45.79%, whereas the proportions of the other three pseudo-components decreased sharply with values of 20.44%, 15.72% and 21.79%, respectively. The results also show a slight increase in compounds containing N1O3 from 0.65% to 2.82%, and of N1O4 from 0.14% to 1.11%. Therefore, the reduction in O2-containing compounds and the increase in the N1O3- and N1O4-containing compounds were much less than that of other pseudo-components. The results indicate that pseudo-components of the highest boiling point range (500+ °C) exhibit low oxidation activity during the LTO process.
Since the generated N1O3 and N1O4 compounds have been detected in the reaction products for the four pseudo-components, a possible reaction scheme describing the evolution of N1-containing compounds is proposed. N1-containing compounds might be oxidized into N1O3-containing and N1O4-containing substances. Due to the complex molecular branches and high degree of aromatization, the nitrogenous heterocyclic compounds possess strong polarity and are more susceptible to be oxidized. On the one hand, the C-C bonds between the alkyl side chain and the aromatic ring on the nitrogenous ring could easily be activated, making the side chains susceptible to breaking. On the other hand, the weak C-N bonds are easily cleaved at a higher temperature, through which the heavy components are cracked into different branch parts and then generate free radicals with much greater reactivity, with the formation of more stable hydroxyl or carboxyl groups quickly following [36].
The KC experiments were conducted to confirm the existence of N1O3- and N1O4-containing compounds based on the -ESI ionization source, which is reactive to basic nitrogen-containing compounds. In the experiments, two compounds named 9-azafluorene (C12H9N) and 10-azaanthracene (C13H9N) were used as standard materials with a purity of 99% and 98%, respectively [37]. The temperature of the KC experiments was set from 25 °C to 200 °C according to the flash point of C12H9N of 220 °C. The high-resolution mass spectra of C12H9N and 4-hydroxyacridine (C13H9NO) are shown in Figure 6. It shows that the basic nitride C13H9N is more easily oxidized to C13H9NO than C12H9N during the LTO process. A large number of N1O3- and N1O4-containing compounds were detected in the experiments, which indicates a decrease in N1 substances and is evidence that N1O3− and N1O4−containing compounds are generated from basic rather than neutral N1−containing compounds.
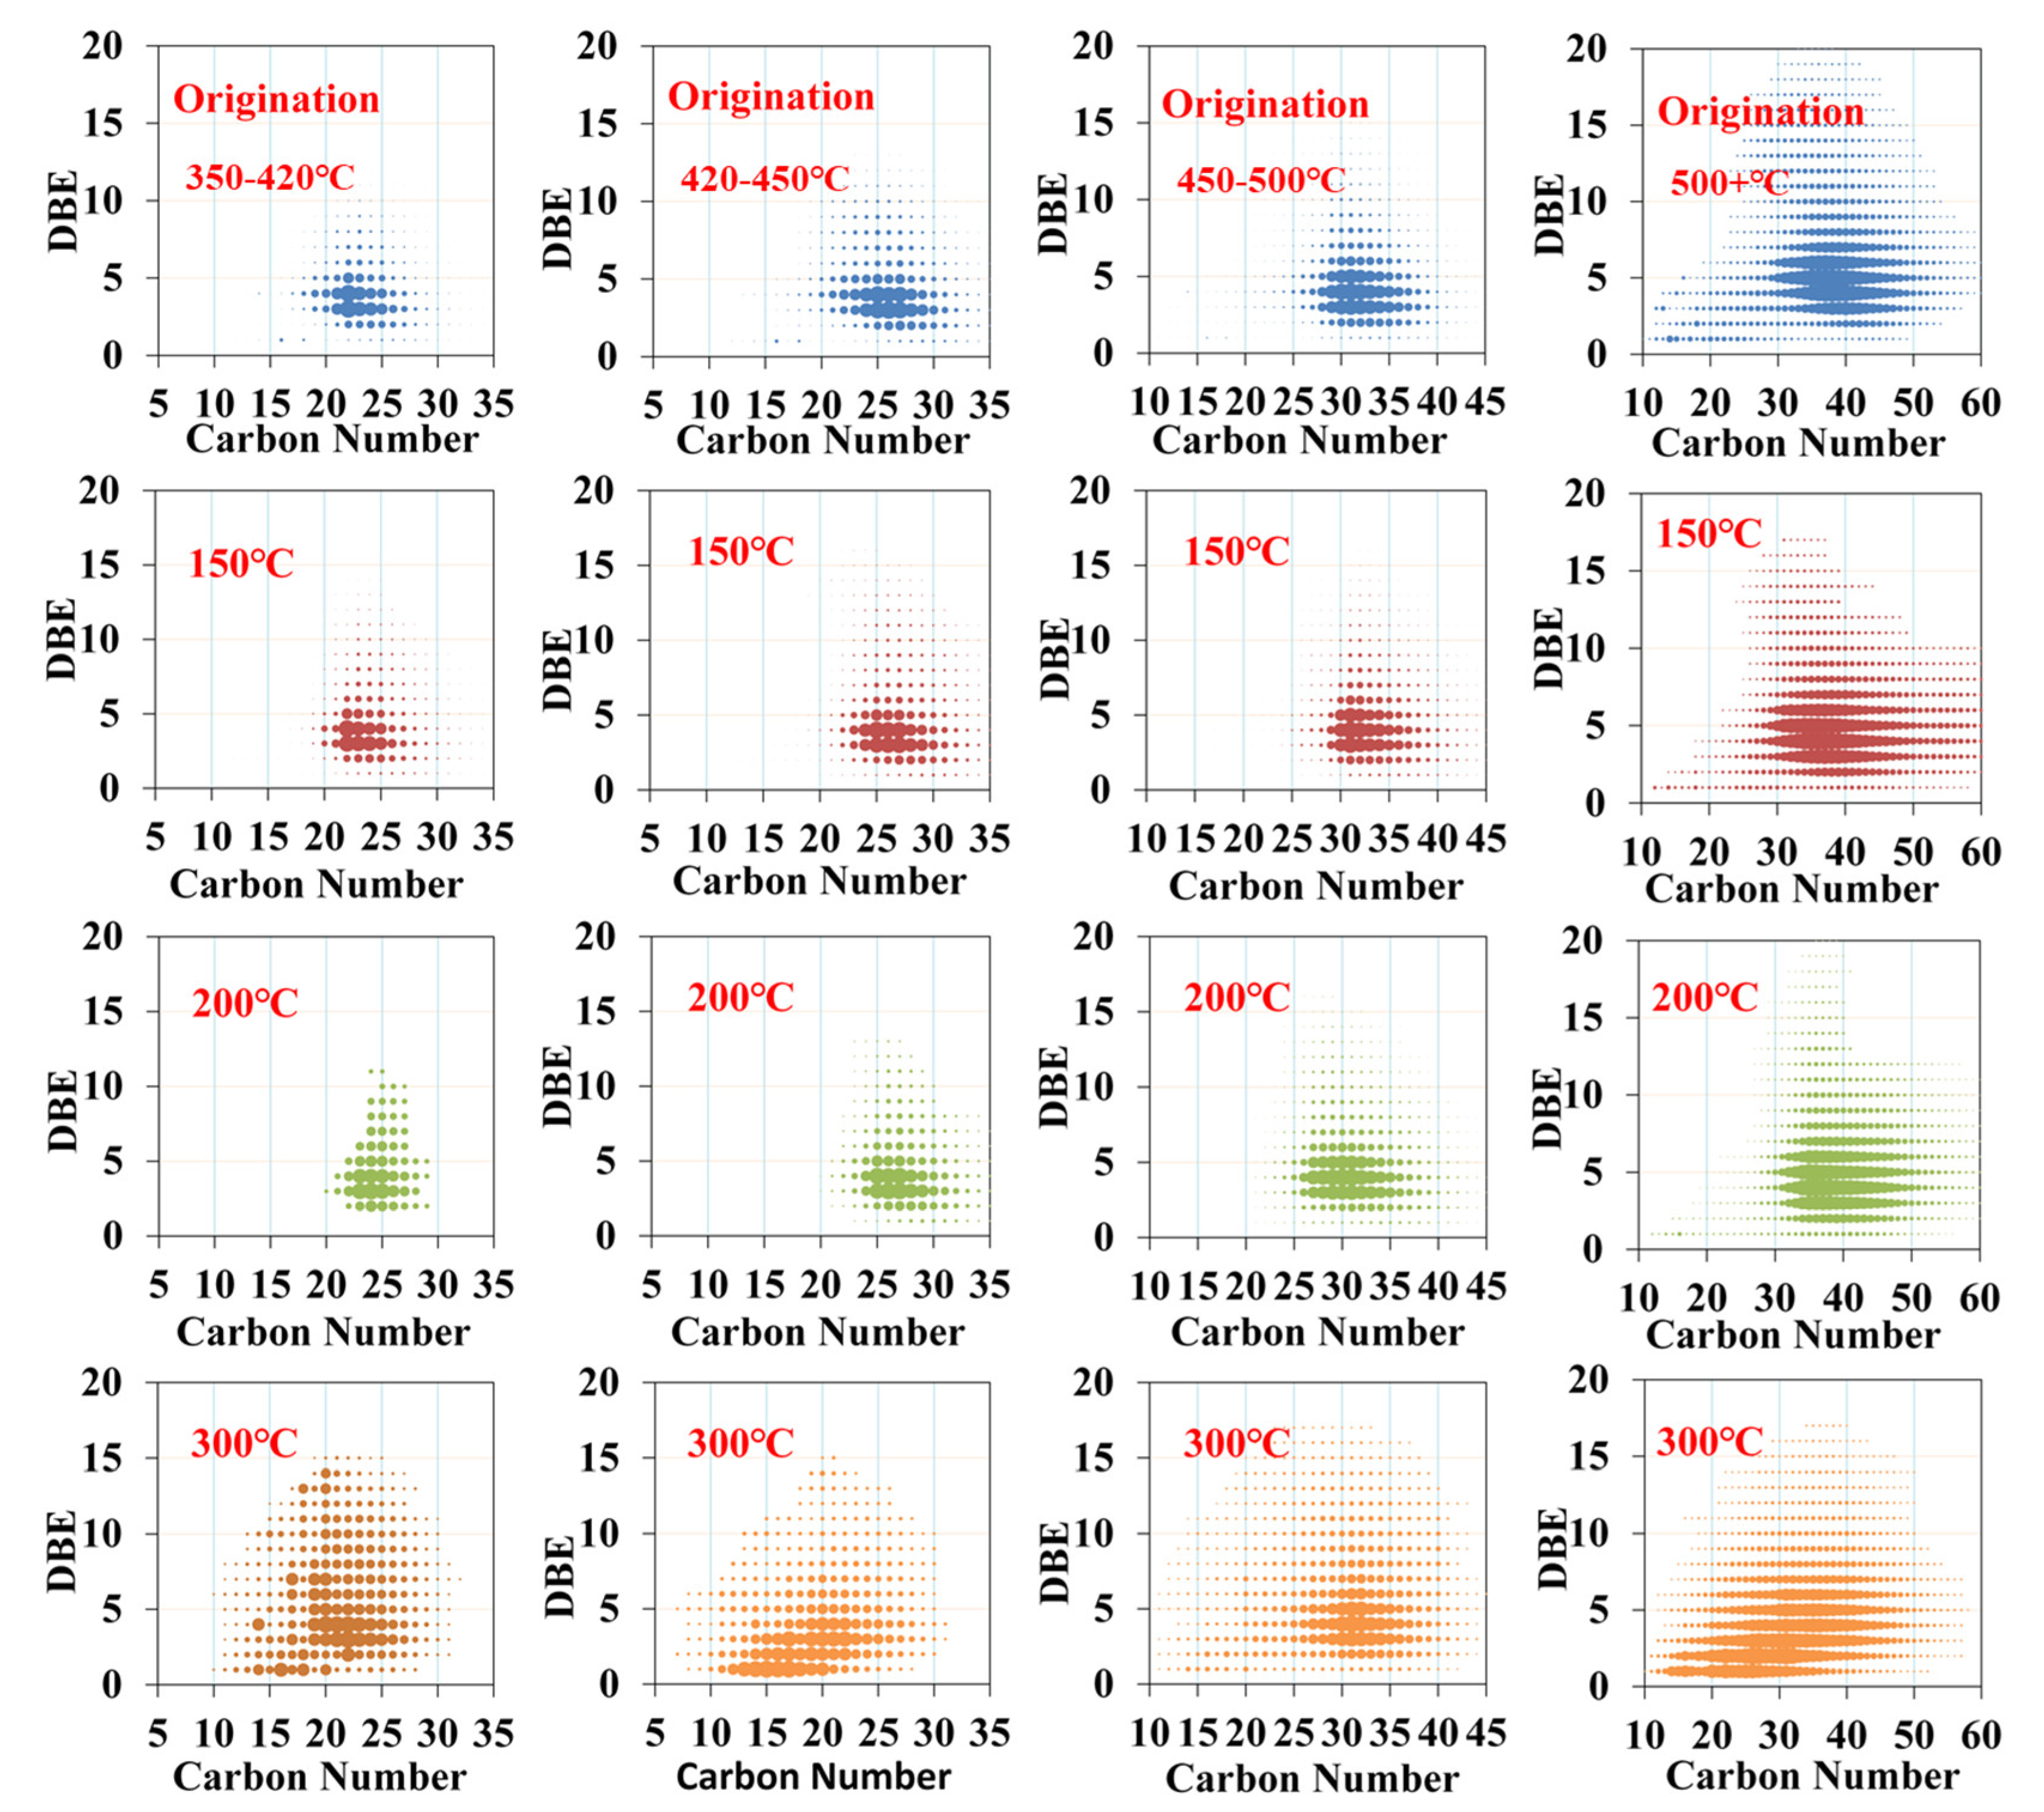
To analyze the conversion mechanism of N-containing compounds, the evolution of O-containing compounds was studied. The acidic compounds detected were generated through the oxidation reaction of non-acidic substances. The relative content of O3-, O4-, and O5-containing compounds increases directly with the temperature, and these compounds are likely to be generated by the oxidation of non-acidic substances such as naphthenic hydrocarbon and aromatic hydrocarbon. This is also verified by the decrease in O2-containing compounds. The variation in O2-content, which mainly exists in petroleum acid compounds, is attributed more to the oxygen addition mechanism of heavy oil. Hence the reaction scheme for the conversion of O2-containing compounds into O3-, O4-, and O5-containing compounds has been verified and could directly suggest the oxygen addition mechanism. Figure 7 shows the relationship between the carbon number and DBE distribution of compounds containing O2 during the oxidation of the four pseudo-components in different temperature regions. As is shown in Figure 7, the carbon number and DBE of the O2-containing compounds remained almost unchanged, even when the ambient temperature rose to 200 °C during the oxidation of the four pseudo-components. When temperature continued to rise to 300 °C, however, the relative content of O2-containing compounds sharply decreased (shown in Figure 5), thus causing the dramatic variation in the carbon number and DBE.
The compounds within the pseudo-components 350–420 °C were detected and characterized with carbon numbers and a DBE distribution of 13–25 and 1–14, respectively, at 300 °C, which indicates that the main reaction transferred from oxygen addition to thermal cracking accompanied by oxygen addition. As for the pseudo-components 420–450 °C, the detected carbon number distribution is mainly in the region of 10–25, and the DBE varies mainly from 1 to 7, which indicates a cracking reaction at the given temperature range of 25–300 °C. For the 450–500 °C pseudo-components, a large number of compounds with the DBE of 2–8 and carbon numbers of 25–40 were detected, which confirms the dominant reaction of oxidation at 300 °C. A wider carbon number distribution of the 500+ °C pseudo-component compounds, mainly from 10 to 50, was measured, indicating a cracking reaction that includes the ring-opening between heteroatoms and carbon as well as the C–C bond scissoring of the carbon main chain.
4. Conclusions
In this work, pseudo-components of heavy oil in its initial state and its oxidation products were characterized with FT-ICR-MS combined with KC experiments. The detailed data, including the variation in functional groups, molecular weights, and DBE versus carbon number distribution, were analyzed, and the following conclusions can be drawn:
- (1)
- The pseudo-components were subjected to two different reactions during the LTO process: oxygen addition and thermal cracking. The two reactions were detected and both occurred sequentially and simultaneously in different pseudo-components.
- (2)
- The pseudo-components with a low boiling point range generated high molecular weight compounds through the oxygen addition process. Then the fractions of high boiling point range could be oxidized into other compounds with greater molecular weight through oxygen addition reactions. As the temperature increased, the products continued to endure cracking reactions, through which new kinds of compounds with lower molecular weight were generated.
- (3)
- The variation in functional groups serves as an proximate indicator of the reaction scheme. N1O3- and N1O4-containing compounds are generated through oxygen addition of basic N1-containing compounds rather than of neutral N1-containing compounds.
Author Contributions
Conceptualization, R.Z.; methodology, S.L.; formal analysis, T.W. and D.Z.; investigation, L.C. (Lijuan Chen), J.P. and L.C. (Long Chen); data curation, S.L. and D.Z.; writing—original draft preparation, T.W.; writing—review and editing, R.Z., T.W. and J.W.; supervision, R.Z.; funding acquisition, L.C. (Lijuan Chen), J.P. and L.C. (Long Chen). All authors have read and agreed to the published version of the manuscript.
Funding
This research was funded by the High-Level Talents Introduction Project in the Xinjiang Uygur Autonomous Region grant number [JXDF0221] and the Initial Scientific Research Fund of the China University of Petroleum grant number [KL01JB20180005].
Informed Consent Statement
Informed consent was obtained from all subjects involved in the study.
Conflicts of Interest
The authors declare no conflict of interest.
References
- Lovett, S.; Monmont, F.; Nikiforakis, N. An experimentally-based in-situ combustion model with adaptive meshing. Combust. Flame 2015, 162, 960–977. [Google Scholar] [CrossRef]
- Ashraf, U.; Zhang, H.; Anees, A.; Mangi, H.N.; Ali, M.; Zhang, X.; Imraz, M.; Abbasi, S.S.; Abbas, A.; Ullah, Z.; et al. A core logging, machine learning and geostatistical modeling interactive approach for subsurface imaging of lenticular geobodies in a clastic depositional system, SE pakistan. Nat. Resour. Res. 2021, 30, 2807–2830. [Google Scholar] [CrossRef]
- Safaei-Farouji, M.; Thanh, H.V.; Dashtgoli, D.S.; Yasin, Q.; Radwan, A.E.; Ashraf, U.; Lee, K. Application of robust intelligent schemes for accurate modelling interfacial tension of CO2 brine systems: Implications for structural CO2 trapping. Fuel 2022, 319, 123821. [Google Scholar] [CrossRef]
- Zhao, R.B.; Xia, X.T.; Luo, W.W.; Shi, Y.L.; Diao, C.J. Alteration of heavy oil properties under in-situ combustion: A field study. Energy Fuels 2015, 29, 6839–6848. [Google Scholar] [CrossRef]
- Wang, Y.; Zhou, Y.; Fan, S.; Lang, X.; Li, G. Influence of low temperature oxidation on heavy oil coking by thermal pyrolysis during in situ combustion process. Fuel 2022, 316, 123314. [Google Scholar] [CrossRef]
- Khansari, Z.; Gates, I.D.; Mahinpey, N. Detailed study of low-temperature oxidation of an alaska heavy oil. Energy Fuels 2012, 26, 1592–1597. [Google Scholar] [CrossRef]
- Chen, Y.-F.; Yin, H.; He, D.-L.; Gong, H.-F.; Liu, Z.-Z.; Liu, Y.-Q.; Zhang, X.-M.; Pu, W.-F. Low temperature oxidized coke of the ultra-heavy oil during in-situ combustion process: Structural characterization and evolution elucidation. Fuel 2022, 313, 122676. [Google Scholar] [CrossRef]
- Akkutlu, I.Y.; Yortsos, Y.C. The dynamics of in-situ combustion fronts in porous media. Combust. Flame 2003, 134, 229–247. [Google Scholar] [CrossRef]
- Khansari, Z.; Gates, I.D.; Mahinpey, N. Low-temperature oxidation of lloydminster heavy oil: Kinetic study and product sequence estimation. Fuel 2014, 115, 534–538. [Google Scholar] [CrossRef]
- Bissada, K.K.; Tan, J.; Szymczyk, E.; Darnell, M.; Mei, M. Group-type characterization of crude oil and bitumen. Part I: Enhanced separation and quantification of saturates, aromatics, resins and asphaltenes (SARA). Org. Geochem. 2016, 95, 21–28. [Google Scholar] [CrossRef]
- Zhao, S.; Pu, W.F.; Varfolomeev, M.A.; Yuan, C.; Rodionov, A.A. Integrative investigation of low-temperature oxidation characteristics and mechanisms of heavy crude oil. Ind. Eng. Chem. Res. 2019, 58, 14595–14602. [Google Scholar] [CrossRef]
- Wang, T.; Wang, J.; Yang, W.; Yang, D. Quantification of low-temperature oxidation of light oil and its SAR fractions with TG-DSC and TG-FTIR analysis. Energy. Sci. Eng. 2020, 8, 376–391. [Google Scholar] [CrossRef] [Green Version]
- Zhao, S.; Pu, W.; Varfolomeev, M.A.; Liu, Y.; Liu, Z. Oxidation characteristics of heavy oil and its SARA fractions during combustion using TG-FTIR. J. Petrol. Sci. Eng. 2020, 192, 107331. [Google Scholar] [CrossRef]
- Akin, S.; Kok, M.V.; Bagci, S.; Karacan, O. Oxidation of heavy oil and their SARA fractions: Itsrole in modeling in-situ combustion. In Proceedings of the SPE Annual Technical Conference and Exhibition, Dallas, TX, USA, 1 October 2000. [Google Scholar]
- Aleksandrov, D.; Kudryavtsev, P.; Hascakir, B. Variations in in-situ combustion performance due to fracture orientation. J. Petrol. Sci. Eng. 2017, 154, 488–494. [Google Scholar] [CrossRef]
- Lopes, M.S.; Gonçalves, F.d.; Lopes, M.S.; Perna, R.F.; Filho, R.M. Extending the true boiling point curve of a heavy crude oil by means of molecular distillation and characterization of the products obtained. Petrol. Sci. Technol. 2017, 35, 1523–1529. [Google Scholar] [CrossRef]
- Zhao, R.B.; Wei, Y.G.; Wang, Z.M.; Yan, W.; Yang, H.J.; Liu, S.J. Kinetics of low-temperature oxidation of light crude oil. Energy Fuels 2016, 30, 2647–2654. [Google Scholar] [CrossRef]
- Zhao, R.; Chen, Y.; Huan, R.; Castanier, L.M.; Kovscek, A.R. An experimental investigation of the in-situ combustion behavior of Karamay crude oil. J. Petrol. Sci. Eng. 2015, 127, 82–92. [Google Scholar] [CrossRef]
- Chen, Y.; He, J.; Wang, Y.; Li, P. GC-MS used in study on the mechanism of the viscosity reduction of heavy oil through aquathermolysis catalyzed by aromatic sulfonic H3PMo12O40. Energy 2010, 35, 3454–3460. [Google Scholar] [CrossRef]
- Elbaz, A.M.; Gani, A.; Hourani, N.; Emwas, A.-H.; Sarathy, S.M.; Roberts, W.L. TG/DTG, FT-ICR mass spectrometry, and NMR spectroscopy study of heavy fuel oil. Energy Fuels 2015, 29, 7825–7835. [Google Scholar] [CrossRef] [Green Version]
- Freitag, N.P. Chemical reaction mechanisms that govern oxidation rates during in-situ combustion and high-pressure air injection. SPE Res. Eval. Eng. 2016, 19, 645–654. [Google Scholar] [CrossRef]
- Zhang, X.; Liu, Q.; Che, H. Parameters determination during in-situ combustion of Liao he heavy oil. Energy Fuels 2013, 27, 3416–3426. [Google Scholar] [CrossRef]
- Trejo, F.; Rana, M.S.; Ancheyta, J. Thermogravimetric determination of coke from asphaltenes, resins and sediments and coking kinetics of heavy crude asphaltenes. Catal. Today 2010, 150, 272–278. [Google Scholar] [CrossRef]
- Meléndez, L.V.; Lache, A.; Orrego-Ruiz, J.A.; Pachón, Z.; Mejía-Ospino, E. Prediction of the SARA analysis of colombian crude oils using ATR-FTIR spectroscopy and chemometric methods. J. Petrol. Sci. Eng. 2012, 90, 56–60. [Google Scholar] [CrossRef]
- Zhang, Y.; Zhang, L.; Xu, Z.; Zhang, N.; Chung, K.H.; Zhao, S.; Xu, C.; Shi, Q. Molecular characterization of heavy petroleum and its supercritical fluid extraction fractions by FT-ICR MS with various ionization methods. Energy Fuels 2014, 28, 7448–7456. [Google Scholar] [CrossRef]
- Cho, Y.; Witt, M.; Kim, Y.H.; Kim, S. Characterization of crude oils at the molecular level by use of laser desorption ionization fourier-transform ion cyclotron resonance mass spectrometry. Anal. Chem. 2012, 84, 8587–8594. [Google Scholar] [CrossRef] [PubMed]
- Smith, D.F.; Rodgers, R.P.; Rahimi, P.; Teclemariam, A.; Marshall, A.G. Effect of thermal treatment on acidic organic species from athabasca bitumen heavy vacuum gas oil, analyzed by negative-ion electrospray Fourier Transform Ion Cyclotron Resonance (FT-ICR) mass spectrometry. Energy Fuels 2009, 23, 314–319. [Google Scholar] [CrossRef]
- Zhao, R.; Sun, J.; Fang, Q.; Wei, Y.; Song, G.; Xu, C.; Hsu, C.S.; Shi, Q. Evolution of acidic compounds in crude oil during in-situ combustion. Energy Fuels 2017, 31, 5926–5932. [Google Scholar] [CrossRef]
- Cinar, M.; Castanier, L.M.; Kovscek, A.R. Combustion kinetics of heavy oils in porous media. Energy Fuels 2011, 25, 4438–4451. [Google Scholar] [CrossRef]
- Cinar, M.; Hascakir, B.; Castanier, L.M.; Kovscek, A.R. Predictability of crude oil in-situ combustion by the iso conversional kinetic approach. Soc. Petrol. Eng. J. 2011, 16, 537–547. [Google Scholar] [CrossRef]
- Burger, J.G.; Sahuquet, B.C. Laboratory research on wet combustion. J. Petrol. Technol. 2013, 25, 1137–1146. [Google Scholar] [CrossRef]
- Kapadia, P.; Gates, I.D.; Mahinpey, N.; Gates, I.D. Kinetic models for low temperature oxidation subranges based on reaction products. In Proceedings of the SPE Heavy Oil Conference-Canada, Calgary, AB, Canada, 11 June 2013; pp. 11–13. [Google Scholar] [CrossRef]
- Zhao, R.B.; Li, B.C.; Yang, J.; Gao, B.; Zhang, C.; Fu, J.Y.; Wang, R. Temperature prediction via reaction heat calculation of burned pseudo-componentss during in-situ combustion. Energy Fuels 2009, 23, 314–319. [Google Scholar] [CrossRef]
- Zhang, L.; Deng, J.; Wang, L.; Chen, Z.; Ren, S.; Hu, C.; Zhang, S. Low-temperature oxidation characteristics and its effect on the critical coking temperature of heavy oils. Energy Fuels 2015, 29, 538–545. [Google Scholar] [CrossRef]
- Zhao, J.Z.; Jia, H.; Pu, W.-F.; Wang, L.-L.; Peng, H. Sensitivity studies on the oxidation behavior of crude oil in porous media. Energy Fuels 2012, 26, 6815–6823. [Google Scholar] [CrossRef]
- Castro, L.V.; Vazquez, F. Fractionation and characterization of Mexican crude oils. Energy Fuels 2009, 23, 1603–1609. [Google Scholar] [CrossRef]
- Chen, Y.L.; Li, P.; Wang, Y.Q.; He, J. Change of carbazole compounds in heavy oil by catalytic aquathermolysis and the catalytic mechanism of viscosity reduction. J. Fuel. Chem. Technol. 2011, 39, 271–277. [Google Scholar]
Figure 1.
Kinetic cell experiments of different pseudo-components: (a) 350–420 °C; (b) 420–450 °C; (c) 450–500 °C; (d) 500+ °C.
Figure 1.
Kinetic cell experiments of different pseudo-components: (a) 350–420 °C; (b) 420–450 °C; (c) 450–500 °C; (d) 500+ °C.

Figure 2.
High-resolution spectra of pseudo-components in the range of 25–150 °C: (a) 350–420 °C; (b) 420–450 °C; (c) 450–500 °C; (d) 500+ °C.
Figure 2.
High-resolution spectra of pseudo-components in the range of 25–150 °C: (a) 350–420 °C; (b) 420–450 °C; (c) 450–500 °C; (d) 500+ °C.

Figure 3.
High-resolution spectra of pseudo-components in the range of 25–200 °C: (a) 350–420 °C; (b) 420–450 °C; (c) 450–500 °C; (d) 500+ °C.
Figure 3.
High-resolution spectra of pseudo-components in the range of 25–200 °C: (a) 350–420 °C; (b) 420–450 °C; (c) 450–500 °C; (d) 500+ °C.

Figure 4.
High-resolution spectra of pseudo-components in the range of 25–300 °C: (a) 350–420 °C; (b) 420–450 °C; (c) 450–500 °C; (d) 500+ °C.
Figure 4.
High-resolution spectra of pseudo-components in the range of 25–300 °C: (a) 350–420 °C; (b) 420–450 °C; (c) 450–500 °C; (d) 500+ °C.
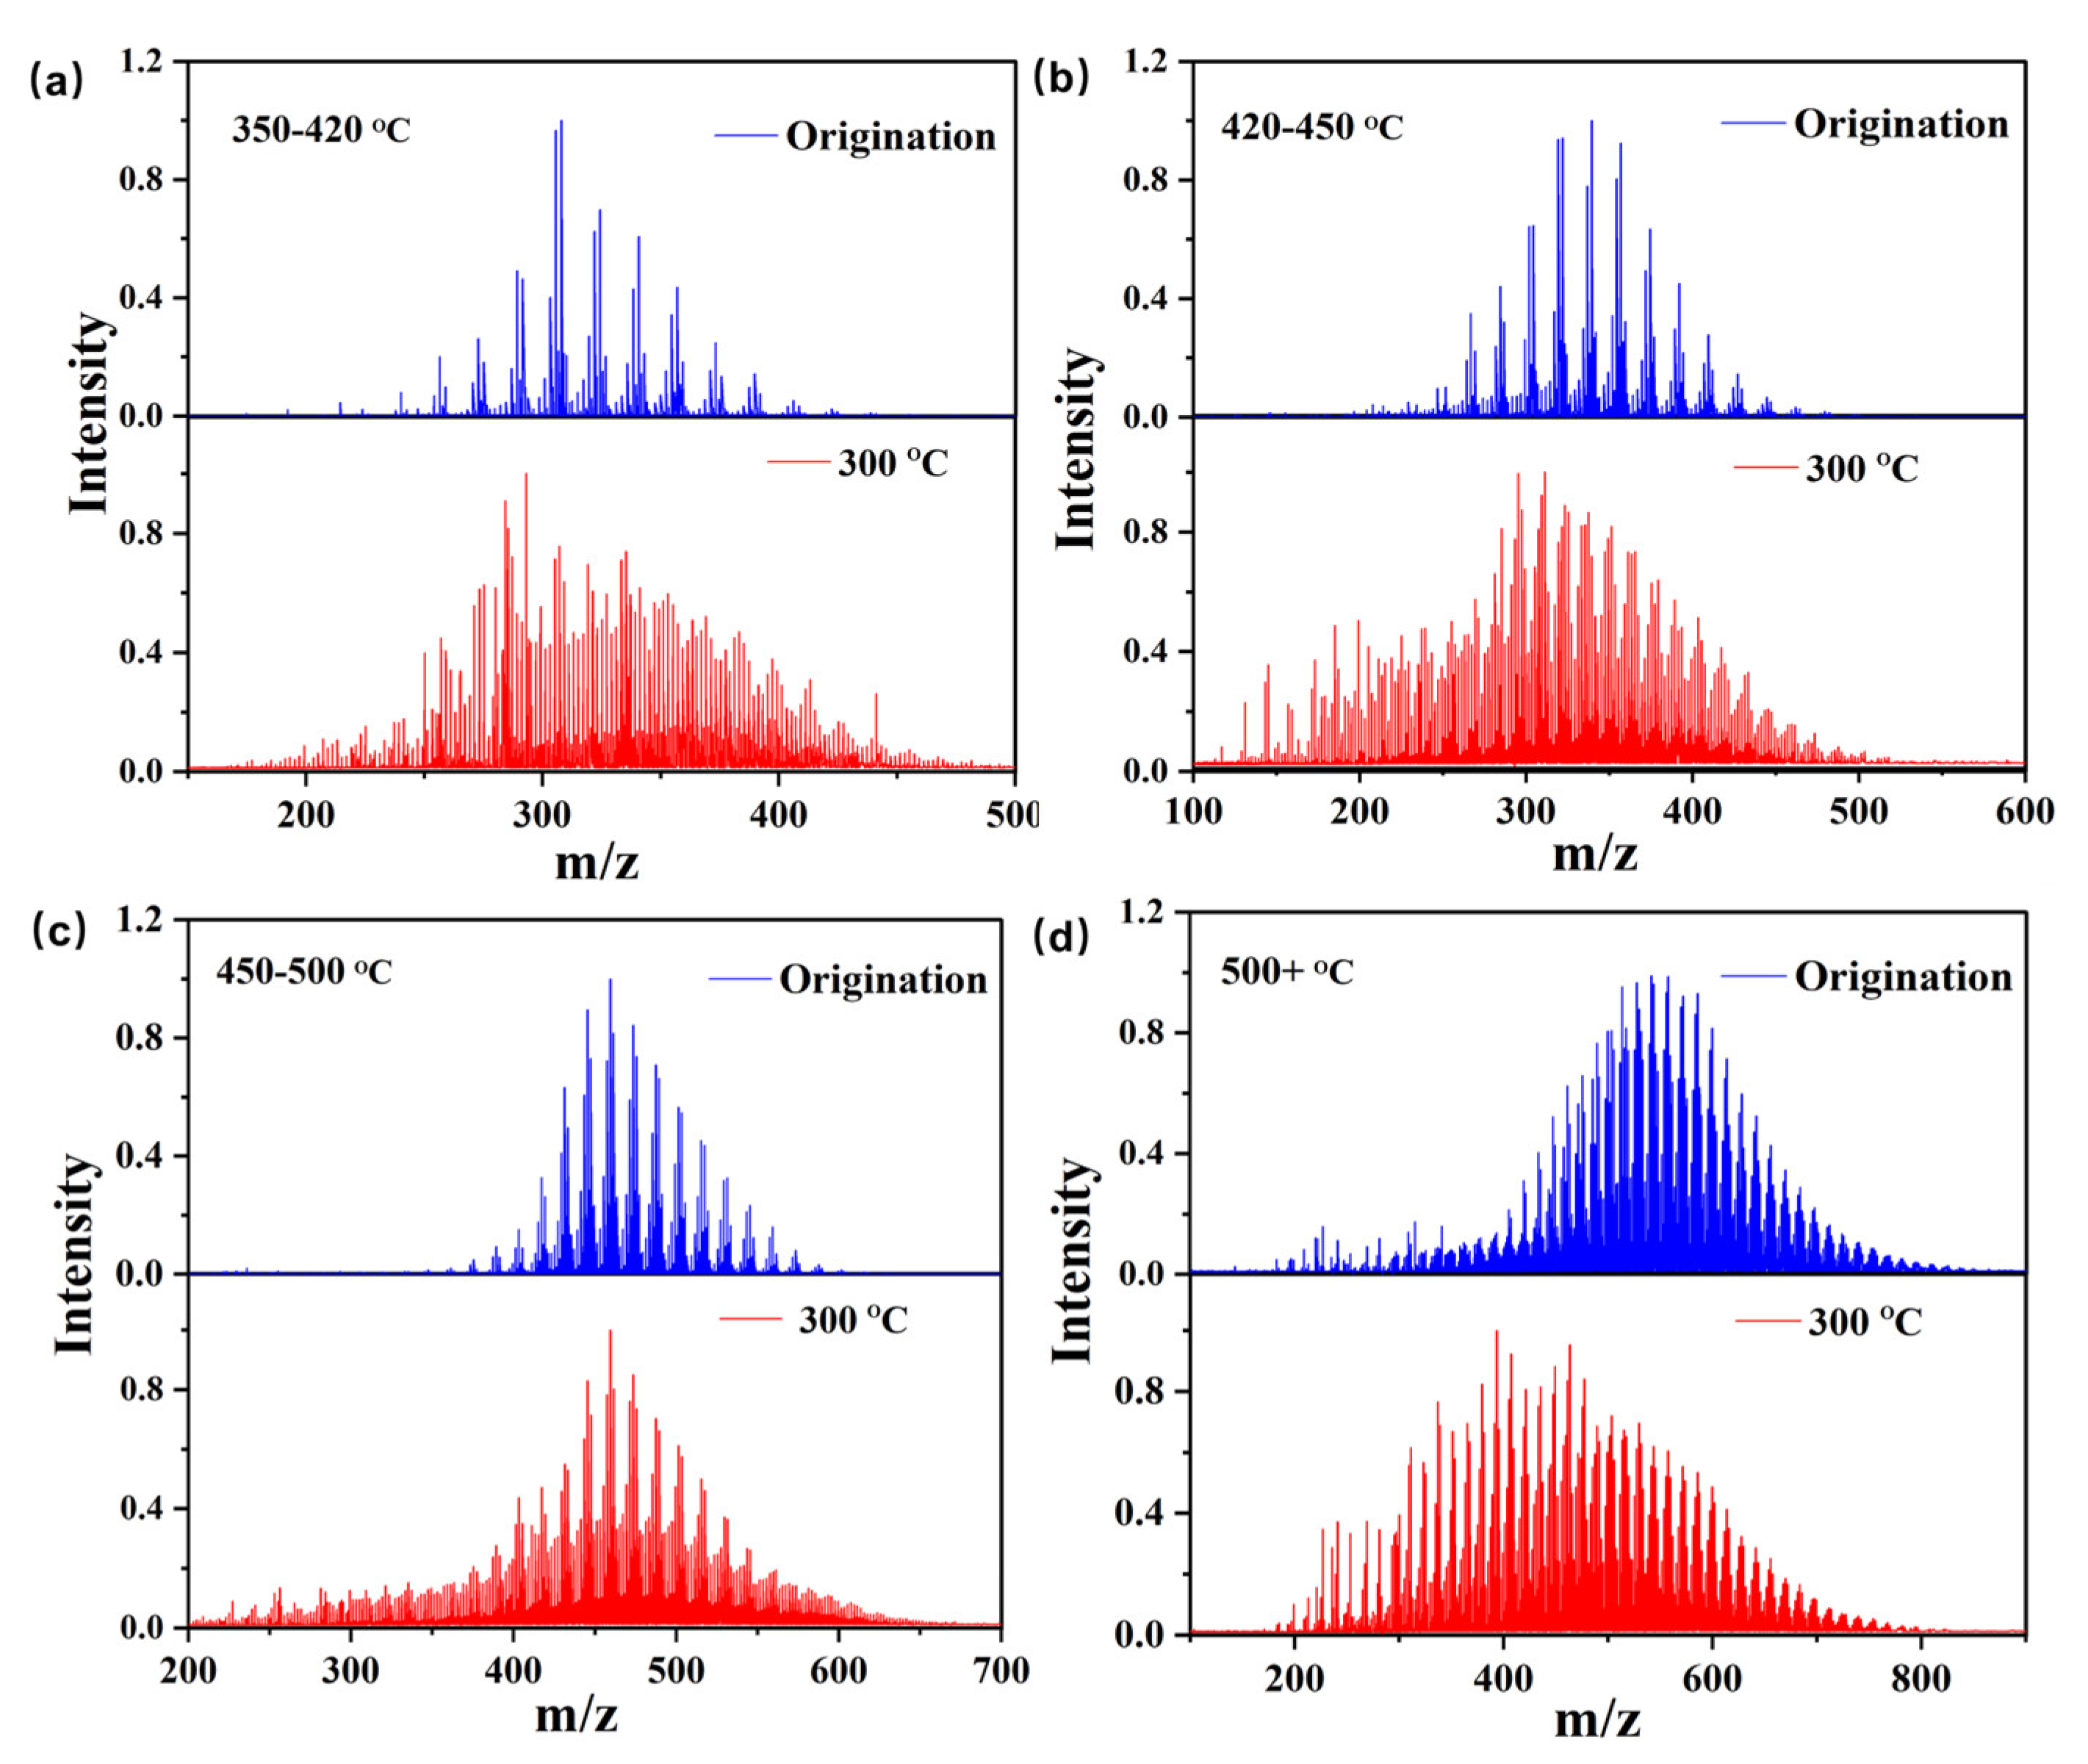
Figure 5.
Heteroatom types and relative abundances of pseudo-components: (a) oxygen-containing compounds; (b) nitrogen-containing compounds.
Figure 5.
Heteroatom types and relative abundances of pseudo-components: (a) oxygen-containing compounds; (b) nitrogen-containing compounds.
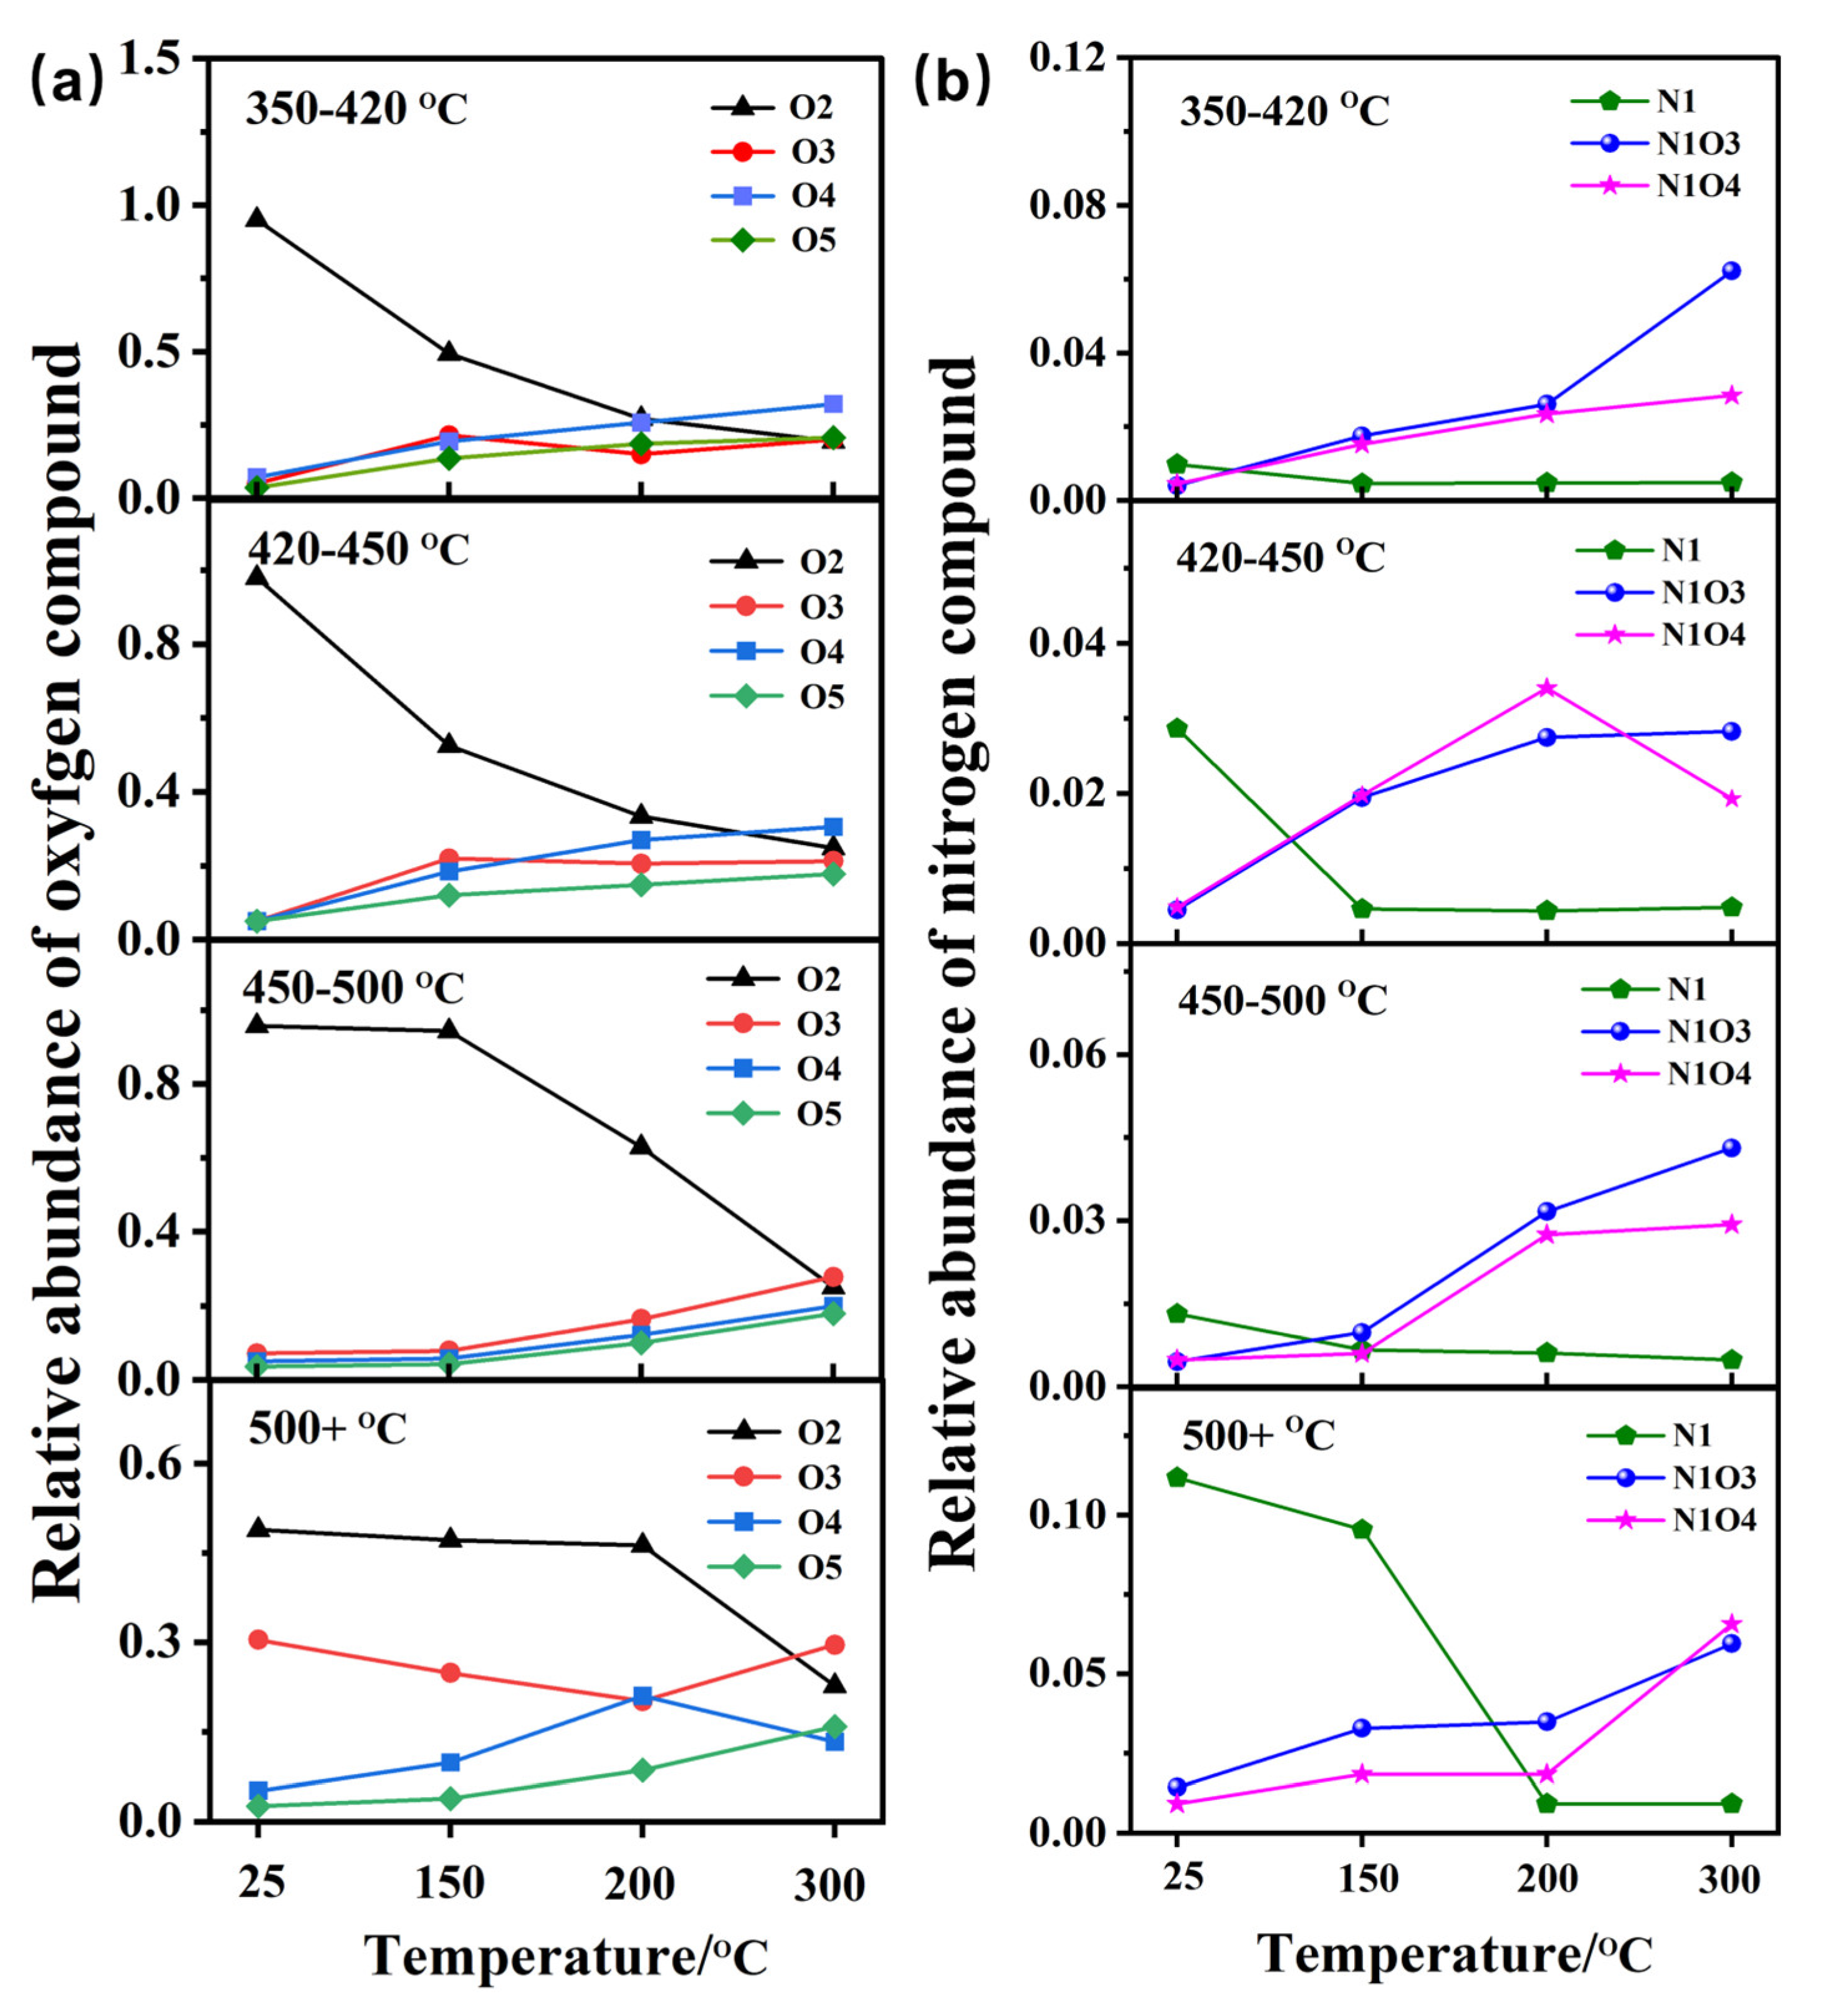
Figure 6.
High resolution mass spectra of C12H9N and C13H9NO at 200 °C.
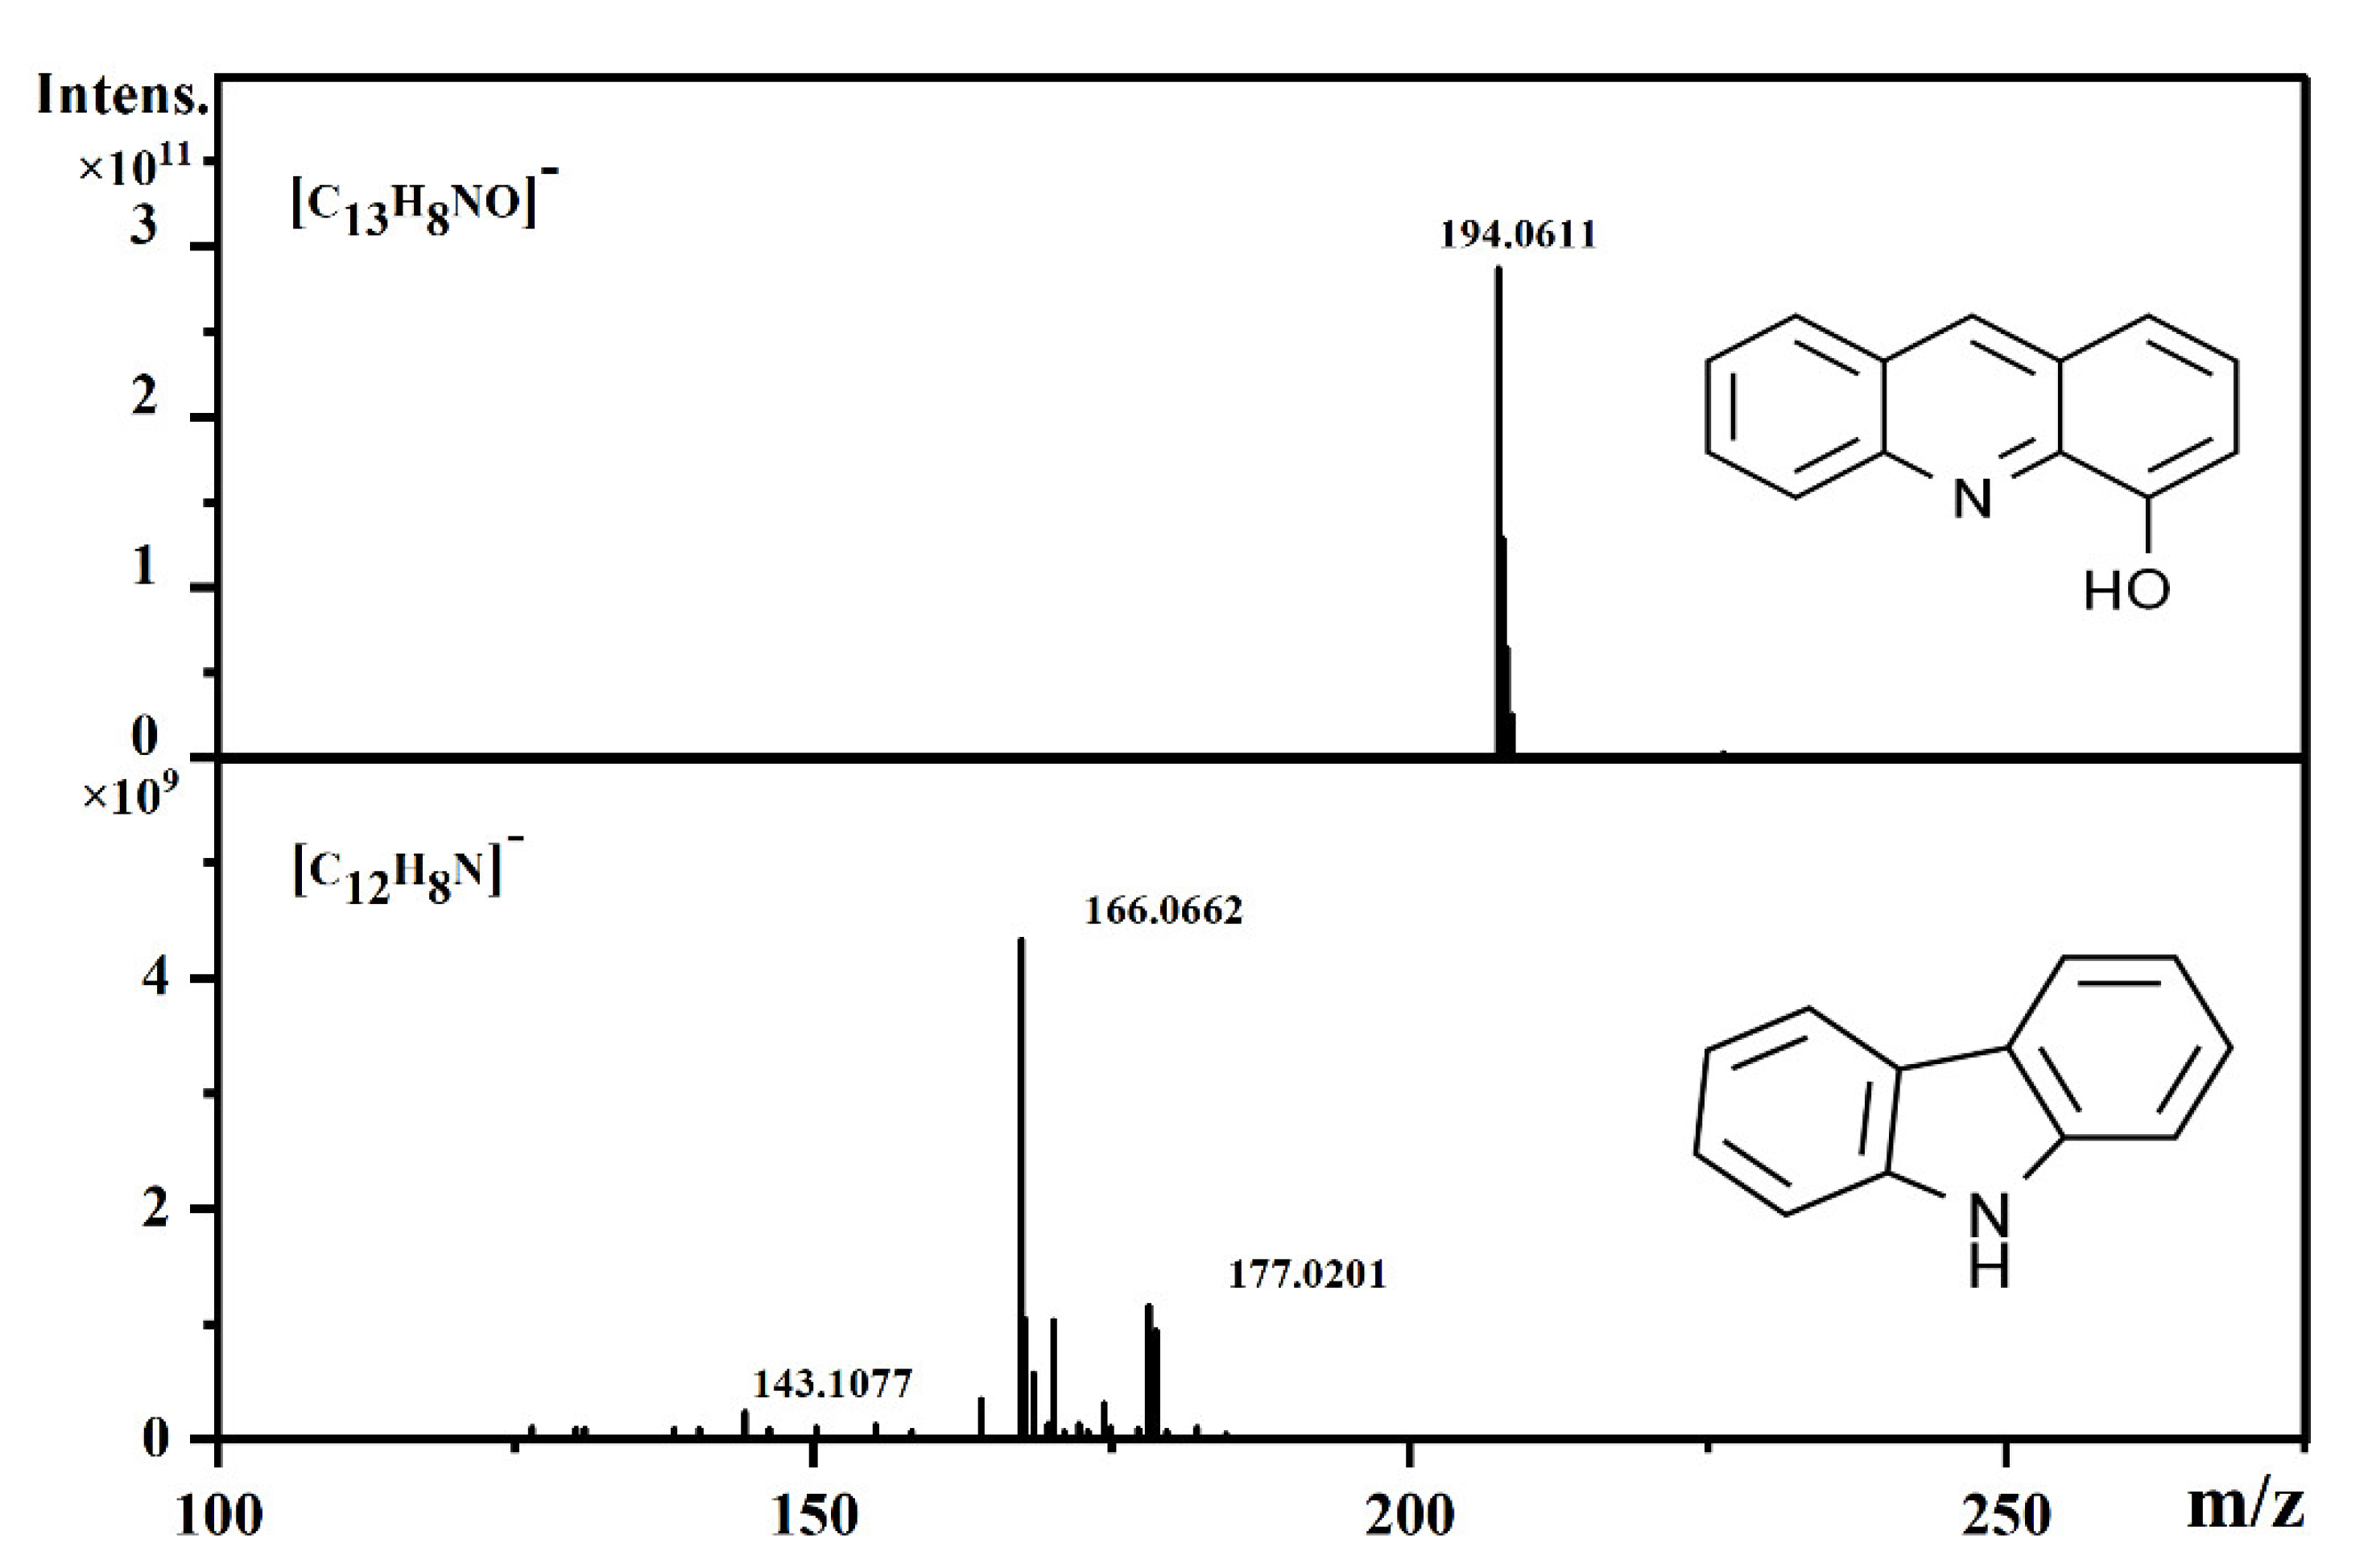
Figure 7.
Carbon number and DBE diagram of O2 compounds.

Table 1.
Mass distribution of pseudo-components in different boiling ranges of the sample.
| Boiling Range (°C) | Content (%) |
|---|---|
| <200 | 1.312 |
| 200–300 | 9.544 |
| 300–350 | 9.783 |
| 350–420 | 11.436 |
| 420–450 | 9.277 |
| 450–500 | 14.163 |
| 500+ | 44.485 |
Table 2.
Parameters of the kinetic cell experiments.
| Inlet Pressure (MPa) | Outlet Pressure (MPa) | Gas Injection Rate (L/min) | Heating Rate (°C/min) | Temperature Range (°C) | Oil Sand Quality (g) |
|---|---|---|---|---|---|
| 1.70 | 1.50 | 2.00 | 3.83 | 25–150 25–200 25–300 | 10.50 |
Table 3.
Oxygen consumption of pseudo-components at different temperature ranges (mol).
| Boiling Range | 350–420 °C | 420–450 °C | 450–500 °C | 500+ °C | |
|---|---|---|---|---|---|
| Temperature Range | |||||
| Room temperature—150 °C | 1.33 × 10⁻⁴ | 5.42 × 10⁻⁵ | 4.73 × 10⁻⁵ | 0 | |
| Room temperature—200 °C | 6.36 × 10⁻³ | 6.56 × 10⁻³ | 1.64 × 10⁻⁴ | 3.60 × 10⁻⁵ | |
| Room temperature—300 °C | 0.0247 | 0.0259 | 0.0266 | 0.0119 | |
Table 4.
Carbonaceous gas production of pseudo-components at different temperature ranges (mol).
| Boiling Range | 350–420 °C | 420–450 °C | 450–500 °C | 500+ °C | |
|---|---|---|---|---|---|
| Temperature Range | |||||
| Room temperature—150 °C | 2.96 × 10⁻⁵ | 9.23 × 10⁻⁶ | 0 | 0 | |
| Room temperature—200 °C | 3.73 × 10⁻⁴ | 1.19 × 10⁻⁴ | 4.12 × 10⁻⁵ | 1.19 × 10⁻⁵ | |
| Room temperature—300 °C | 0.0116 | 0.0124 | 0.0135 | 0.00581 | |
Table 5.
RCOx/O2 of pseudo-components at different temperature ranges.
| Boiling Range | 350–420 °C | 420–450 °C | 450–500 °C | 500+ °C | |
|---|---|---|---|---|---|
| Temperature Range | |||||
| Room temperature—150 °C | 0.223 | 0.170 | 0 | 0 | |
| Room temperature—200 °C | 0.059 | 0.018 | 0.251 | 0.330 | |
| Room temperature—300 °C | 0.470 | 0.478 | 0.508 | 0.488 | |
Publisher’s Note: MDPI stays neutral with regard to jurisdictional claims in published maps and institutional affiliations. |
© 2022 by the authors. Licensee MDPI, Basel, Switzerland. This article is an open access article distributed under the terms and conditions of the Creative Commons Attribution (CC BY) license (https://creativecommons.org/licenses/by/4.0/).
Share and Cite
MDPI and ACS Style
Zhao, R.; Wang, T.; Chen, L.; Pan, J.; Li, S.; Zhao, D.; Chen, L.; Wang, J. Evolution of the Pseudo-Components of Heavy Oil during Low Temperature Oxidation Processes. Energies 2022, 15, 5201. https://doi.org/10.3390/en15145201
AMA Style
Zhao R, Wang T, Chen L, Pan J, Li S, Zhao D, Chen L, Wang J. Evolution of the Pseudo-Components of Heavy Oil during Low Temperature Oxidation Processes. Energies. 2022; 15(14):5201. https://doi.org/10.3390/en15145201
Chicago/Turabian StyleZhao, Renbao, Tiantian Wang, Lijuan Chen, Jingjun Pan, Shutong Li, Dong Zhao, Long Chen, and Jiaying Wang. 2022. "Evolution of the Pseudo-Components of Heavy Oil during Low Temperature Oxidation Processes" Energies 15, no. 14: 5201. https://doi.org/10.3390/en15145201
Note that from the first issue of 2016, this journal uses article numbers instead of page numbers. See further details here.