Article

A Bidirectional DHC-LT Resonant DC-DC Converter with Research on Improved Fundamental Harmonic Analysis Considering Phase Angle of Load Impedance

1
Faculty of Electrical Engineering, Beijing Jiaotong University, Beijing 100044, China
2
Beijing Dynamic Power Co., Ltd., Beijing 100070, China
*
Author to whom correspondence should be addressed.
These authors contributed equally to this work.
Energies 2022, 15(14), 5281; https://doi.org/10.3390/en15145281
Submission received: 16 June 2022 / Revised: 13 July 2022 / Accepted: 15 July 2022 / Published: 21 July 2022
(This article belongs to the Section F3: Power Electronics)

Abstract

:
This paper presents a novel 400 V–50 V bidirectional DHC-LT resonant DC-DC converter. By adding a resonant capacitor and an auxiliary transformer based on LLC, zero-voltage switching (ZVS) and zero-current switching (ZCS) are achieved, while the output voltage gain range is broadened in two directions. Operation principles and robustness are discussed with equations. Then, the error factor of fundamental harmonic analysis (FHA) in resonant converters is analyzed. Considering the phase difference between the output voltage and resonant tank current, an improved method is proposed to describe the behavior of the DHC-LT converter more precisely. A comparison is conducted to prove the effectiveness of the proposed FHA. Furthermore, in order to reduce the output voltage and provide a ripple-free charging current, a fixed-frequency phase-shift strategy is introduced in the DHC-LT converter. ZVS can be realized through the reasonable design of dead time and phase-shift angle. Finally, a 2.5 kW prototype of the DHC-LT resonant DC-DC converter with a digital signal processor (DSP) platform and a battery/PV DC test system is established in the lab to validate the theoretical analysis.

1. Introduction

At present, many power electronics applications, such as renewable energy storage systems (RESSs), automobiles and microgrids, need bidirectional DC-DC converters (BDCs) to transmit power between two different DC buses [1,2,3,4,5,6,7,8]. Since galvanic isolation is an important security guarantee for many applications, isolated bidirectional DC-DC converters are widely used, which can be classified into two kinds: PWM converters and resonant converters [9]. Many PWM converters benefit from zero-voltage switching (ZVS) and a wide output voltage range [10,11,12,13,14,15]. Meanwhile, power can be transmitted naturally between the two sides [16,17,18]. However, as zero-current switching (ZCS) cannot be realized easily in many PWM converters, the switching loss cannot be further reduced. By means of resonance between inductors and capacitors, the AC currents in resonant BDCs present as sinusoidal waveforms. Therefore, ZCS can be realized by reasonable design, and efficiency can be further increased. A large number of resonant BDCs with a wide voltage range have been studied recently [19,20,21,22,23,24].
Thanks to its excellent features of ZVS and ZCS, LLC has attracted attention [25,26,27]. However, without magnetic inductance, LLC is a traditional series-resonant DC-DC converter when power is transmitted backward, whose voltage gain cannot be increased further. According to [23], with a new control strategy to increase the output voltage, it is possible to achieve a voltage gain greater than 1. Unfortunately, the efficiency is not high enough. To overcome the disadvantage in backward mode, in [24], an auxiliary inductor is added between the midpoints of bridge arms to make the topology symmetrical in any operating mode, and the power flow can be automatically switched between forward mode and backward mode. Although the prototype in [24] is 1 kW, a greater power rating needs to be verified. To increase the power rating, a 5 kW CLTC BDC is proposed in [28]. Based on LLC, SRC and CLLC, a new auxiliary transformer and an extra resonant capacitor are added, and the CLTC resonant DC-DC converter can achieve ZVS + ZCS. Furthermore, CLTC can achieve high voltage gain with high power load. Based on CLTC, a bidirectional CDT-LC resonant DC-DC converter is proposed [29]. With a similar structure, the converter achieves a beneficial voltage gain characteristic. A wide output voltage range is obtained within a narrow frequency range. To reduce the resonant tank current, an LLCL-type BDC is proposed in [30]. In the LLCL BDC, an inductor is paralleled with a transformer to participate in the main resonance, while the resonant capacitor is moved to the other side of the resonant inductor to improve the gain curve in backward mode. Unfortunately, the capacitors in CLTC, CDT-LC and LLCL BDCs are all in the LVS of the converter, and their conduction loss is quite big. In addition, they have a large volume, which is not good for power density.
In addition to research in topology, research in the modeling of resonant DC-DC converters needs to be conducted for the design of resonant converters. Time-domain analysis [31,32,33,34] and FHA [35,36,37] are two common methods to analyze resonant DC-DC converters. Using time-domain analysis, the calculation results are more accurate. However, the calculation procedure usually utilizes numerical nonlinear programming techniques to solve state equations, which are complicated and not easy to use in engineering applications. Compared to time-domain analysis, FHA is a rather simple and straightforward approach for modeling. It is proposed in [35] to analyze half-bridge resonant converters. Instead of a square wave, a sine wave of voltage appears on the input side of the resonant tank, and resistance appears on the output side. Considering the effect of the filter in the resonant tank, classical AC analysis techniques are adopted, and the calculation is quite simple. However, when the switching frequency is away from the main resonant frequency, the waveforms in the resonant tank are not an ideal sine wave, which may reduce the estimation accuracy. Therefore, an approximate analysis with modification of equivalent AC resistance for the LLC resonant converter is presented in [36]. The comparison shows that the proposed model predicts gain more accurately in discontinuous mode (DCM), which is quite important in the design. Based on [36], a modified gain model and a corresponding design method are proposed in [37]. Compared with traditional FHA, the resonant factor and the load factor are considered and discussed in detail by combining the time domain and the frequency domain, which improves the accuracy of the gain model. However, in the FHA methods mentioned above, the reactive power of the AC load in the resonant tank has not been included. The phase angle between the fundamental components of the AC output voltage and current has not been taken into consideration. Thus, the behavior of the resonant converter is not properly described.
The main objective of the present work is to derive a novel DHC-LT resonant BDC topology and an improved FHA method for resonant converters. Compared to CLTC or CDT-LC BDC in [28,29], by shifting the position of the resonant capacitor from the LVS to the HVS, the volume and conduction loss of the resonant capacitor can be reduced. The power density and efficiency of the proposed BDC can be further improved, which saves physical space and reduces energy consumption in the DC power systems of buildings and community microgrids. Moreover, to improve the accuracy of FHA, the phase angle of the AC load impedance in the resonant tank is taken into consideration. By calculation of the output voltage in secondary resonance and Fourier decomposition, the fundamental components of the output voltage and current are acquired. Thus, the phase angle of the AC load impedance is acquired. The reactive power of the AC load is described. In this way, the behavior of the DHC-LT BDC can be described more precisely, and the accuracy can be increased further. The comprehension of the FHA methodology is updated in this article, which is significant in the design of resonant converters.
This paper is organized as follows: Section 2 introduces the topology structure and operation principles of the proposed DHC-LT BDC. Section 3 analyzes the error factor of the traditional FHA method and proposes an improved FHA method with modification of the AC load impedance. Section 4 compares the proposed improved FHA with the experimental results, simulation, traditional FHA and FHA with an improved model of the AC port equivalent resistance to prove the effectiveness of the improved FHA in this paper. Section 5 shows the waveforms of the 2.5 kW DHC-LT prototype and PV/battery system, which proves the ZVS + ZCS characteristics and wide voltage gain range. Section 6 concludes this paper.

2. Topology Structure and Characteristics

The topology of the proposed DHC-LT BDC is illustrated and analyzed in this section. Then, the operation principles in step-down mode and step-up mode are given. The following sections are demonstrated based on this section.

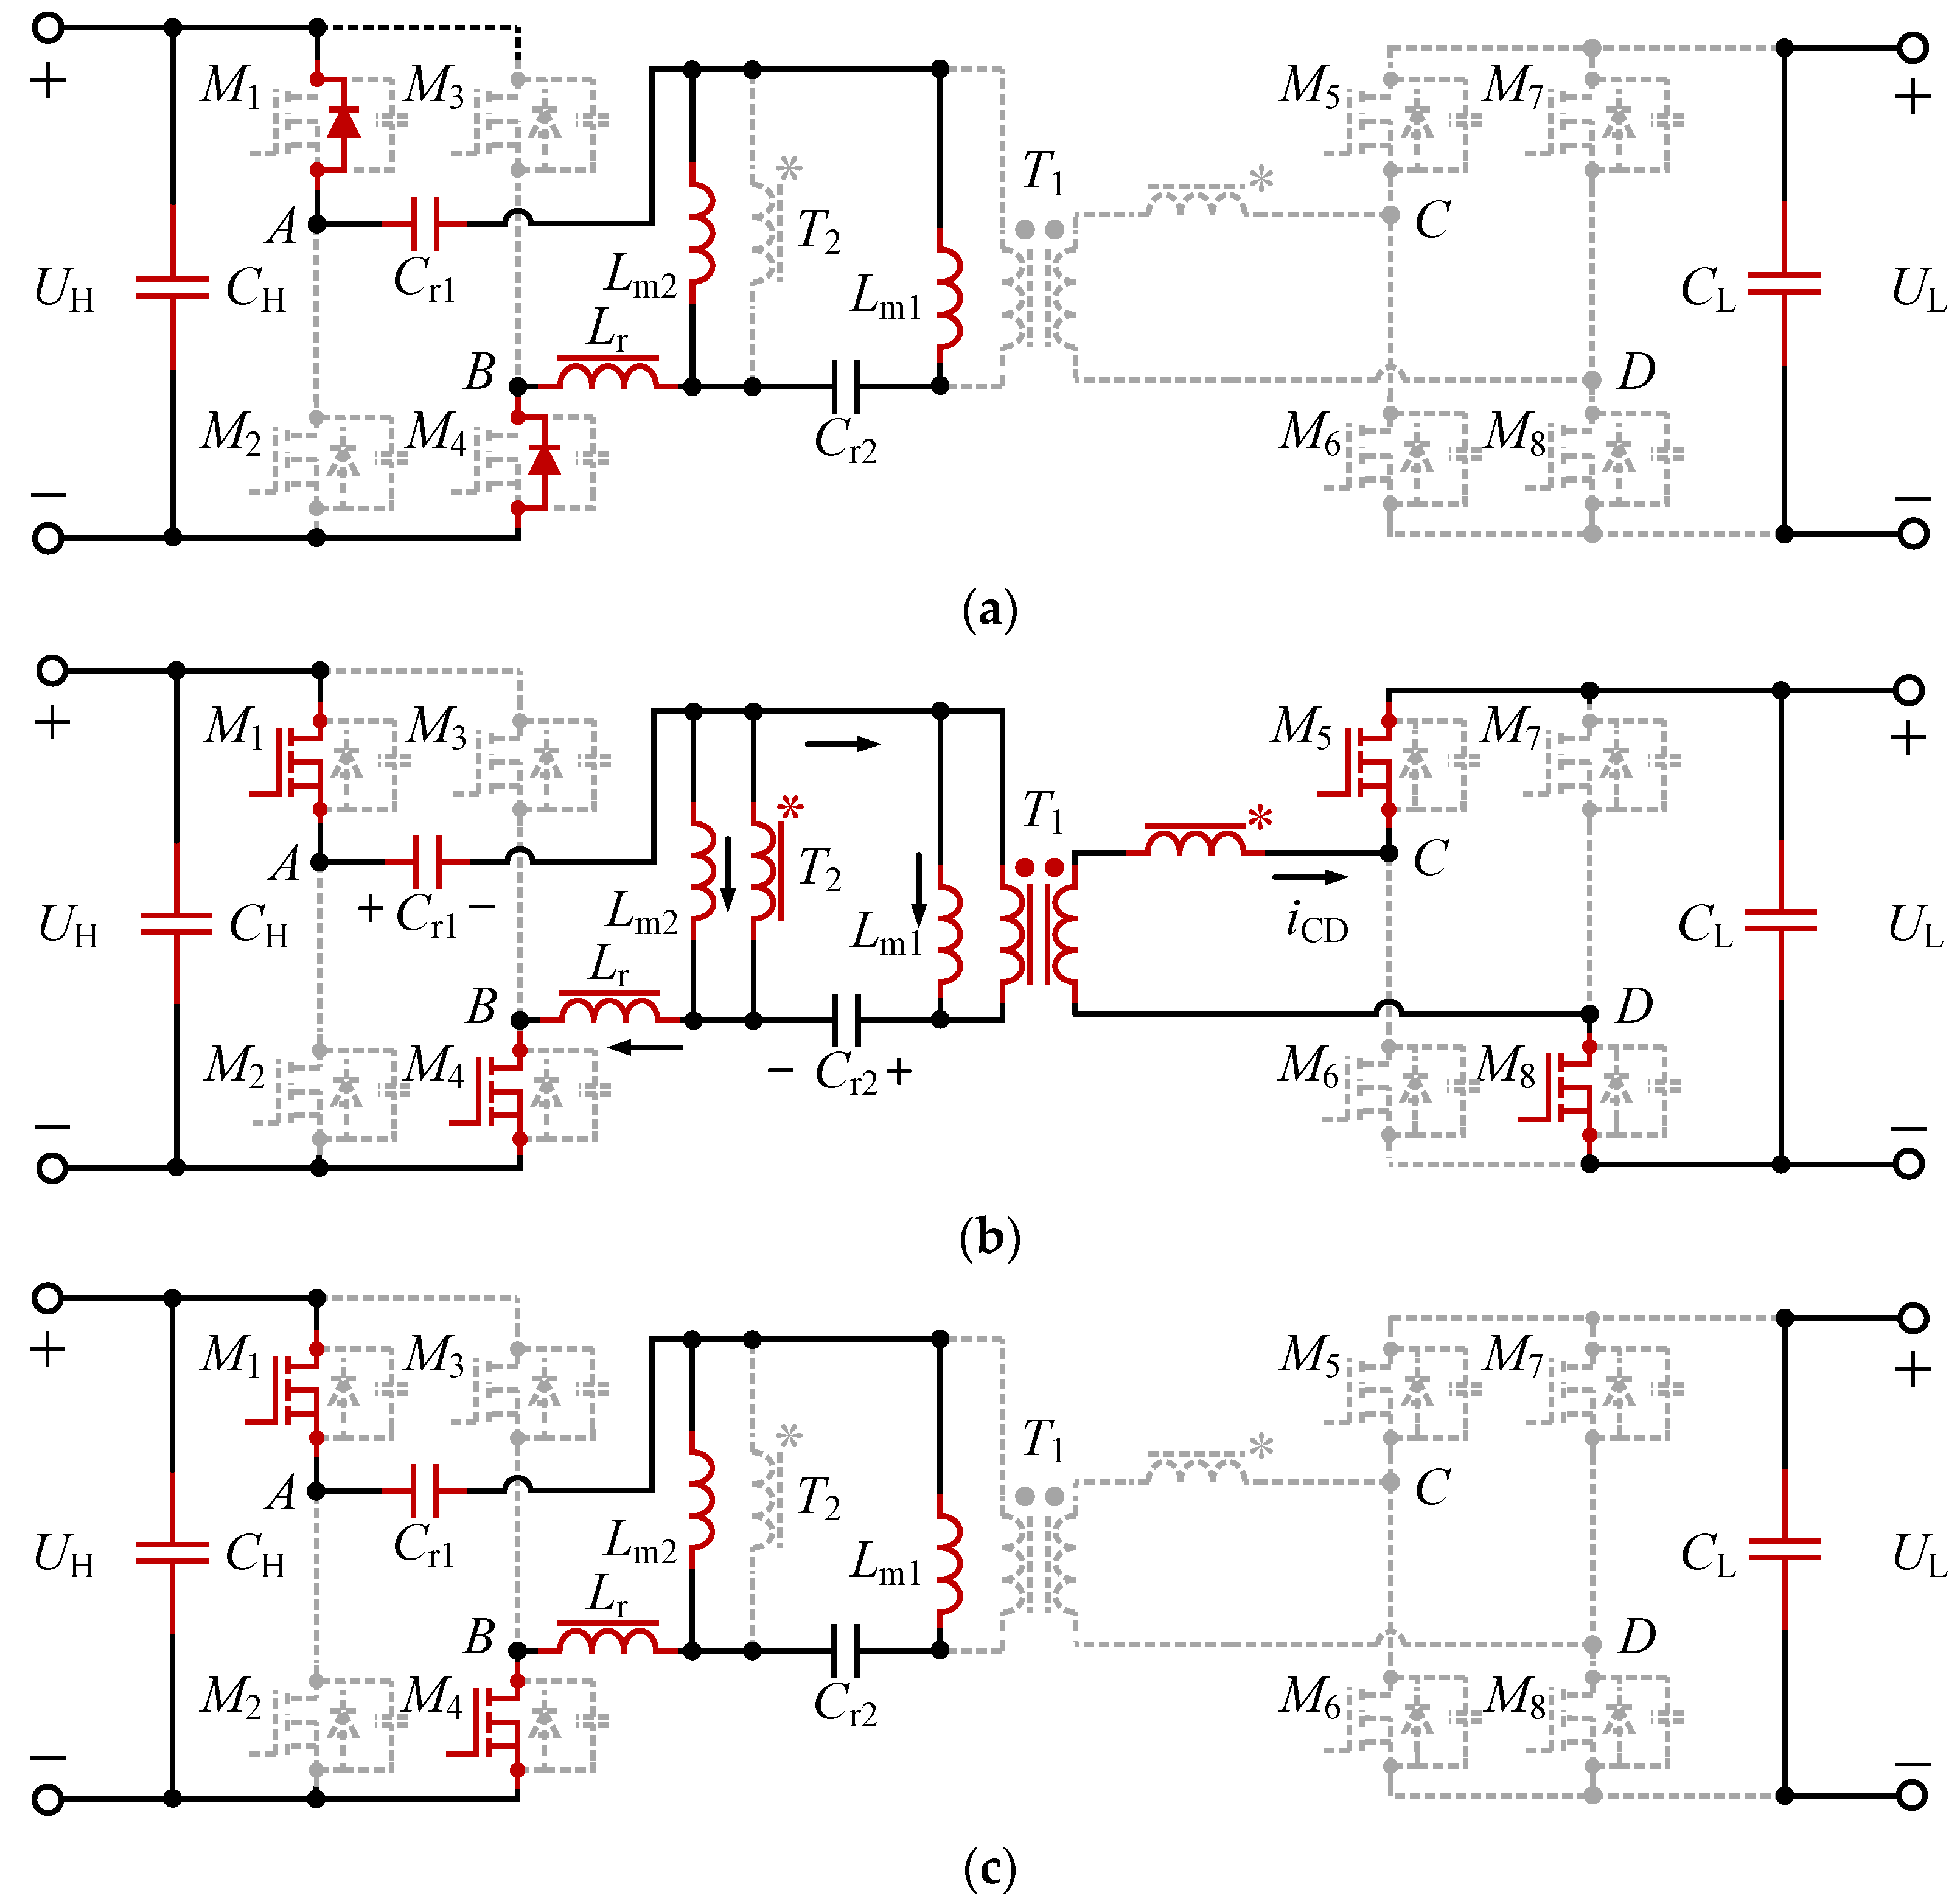
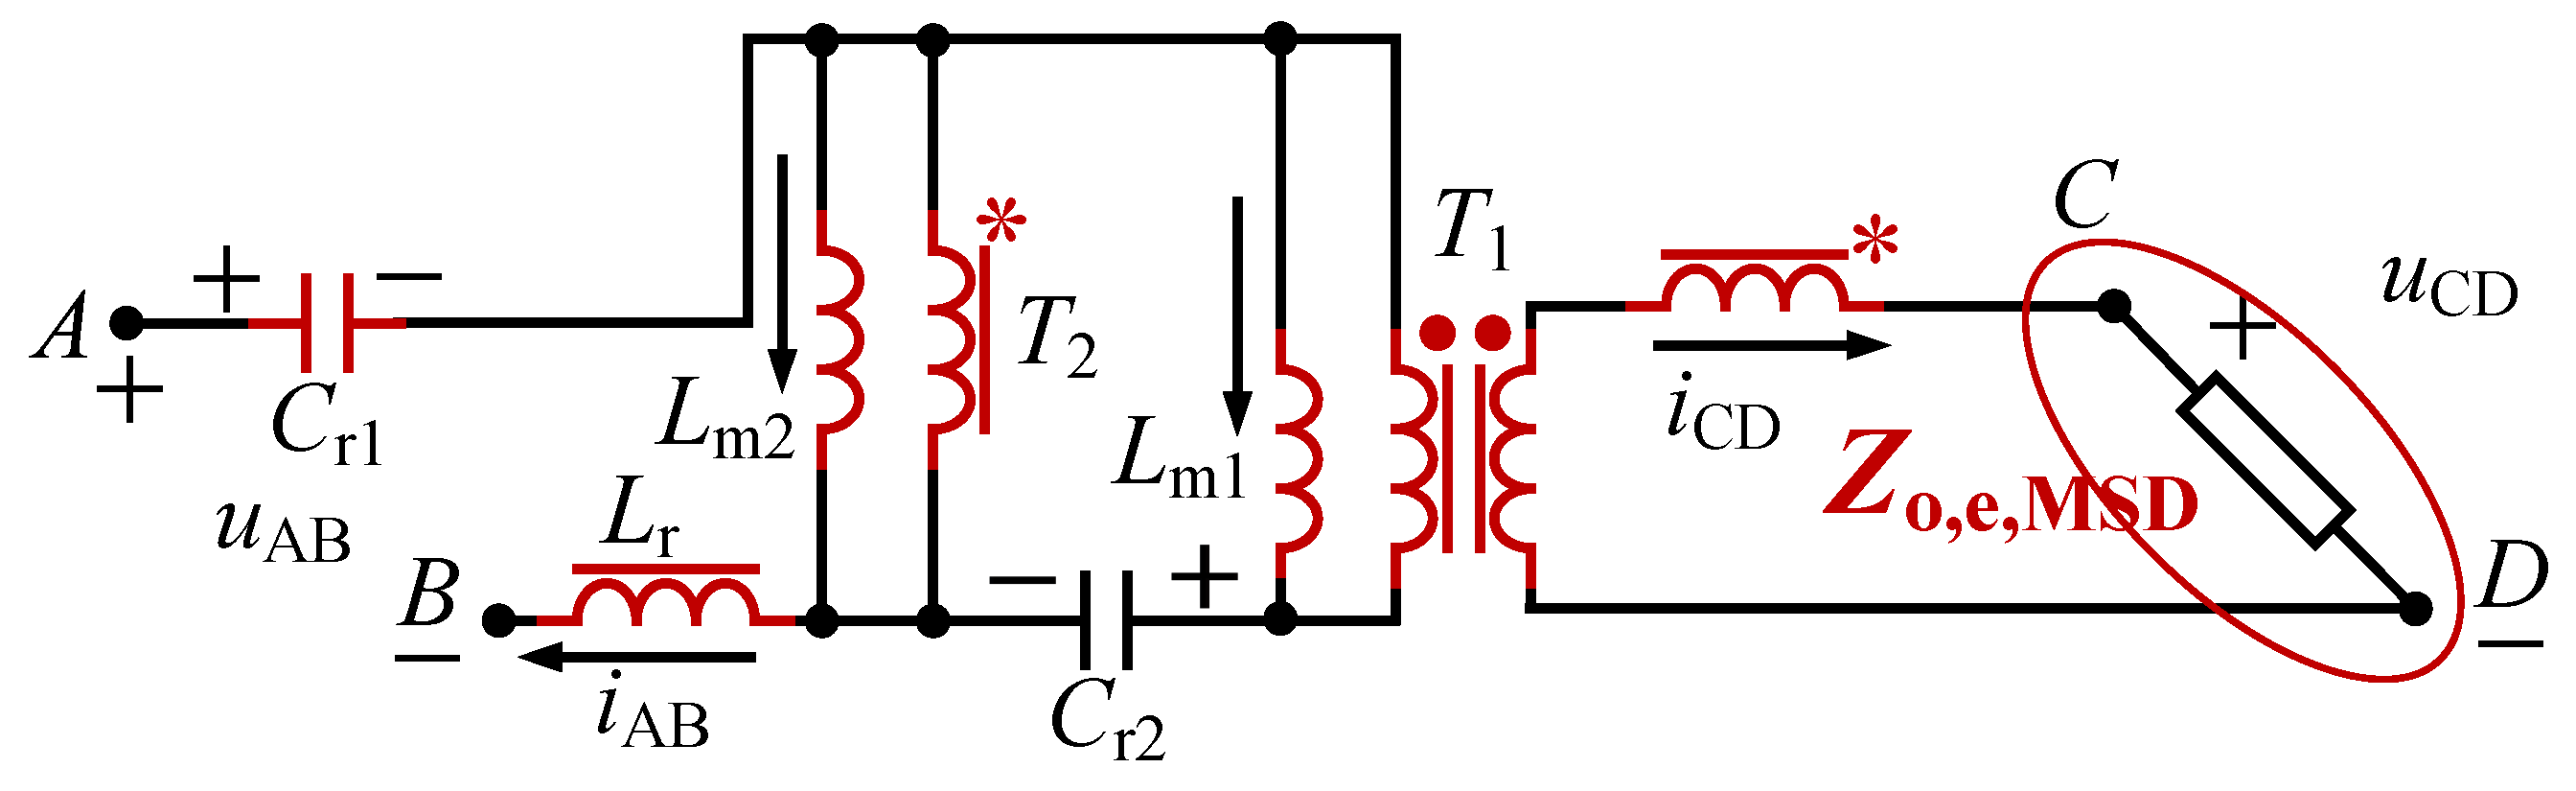
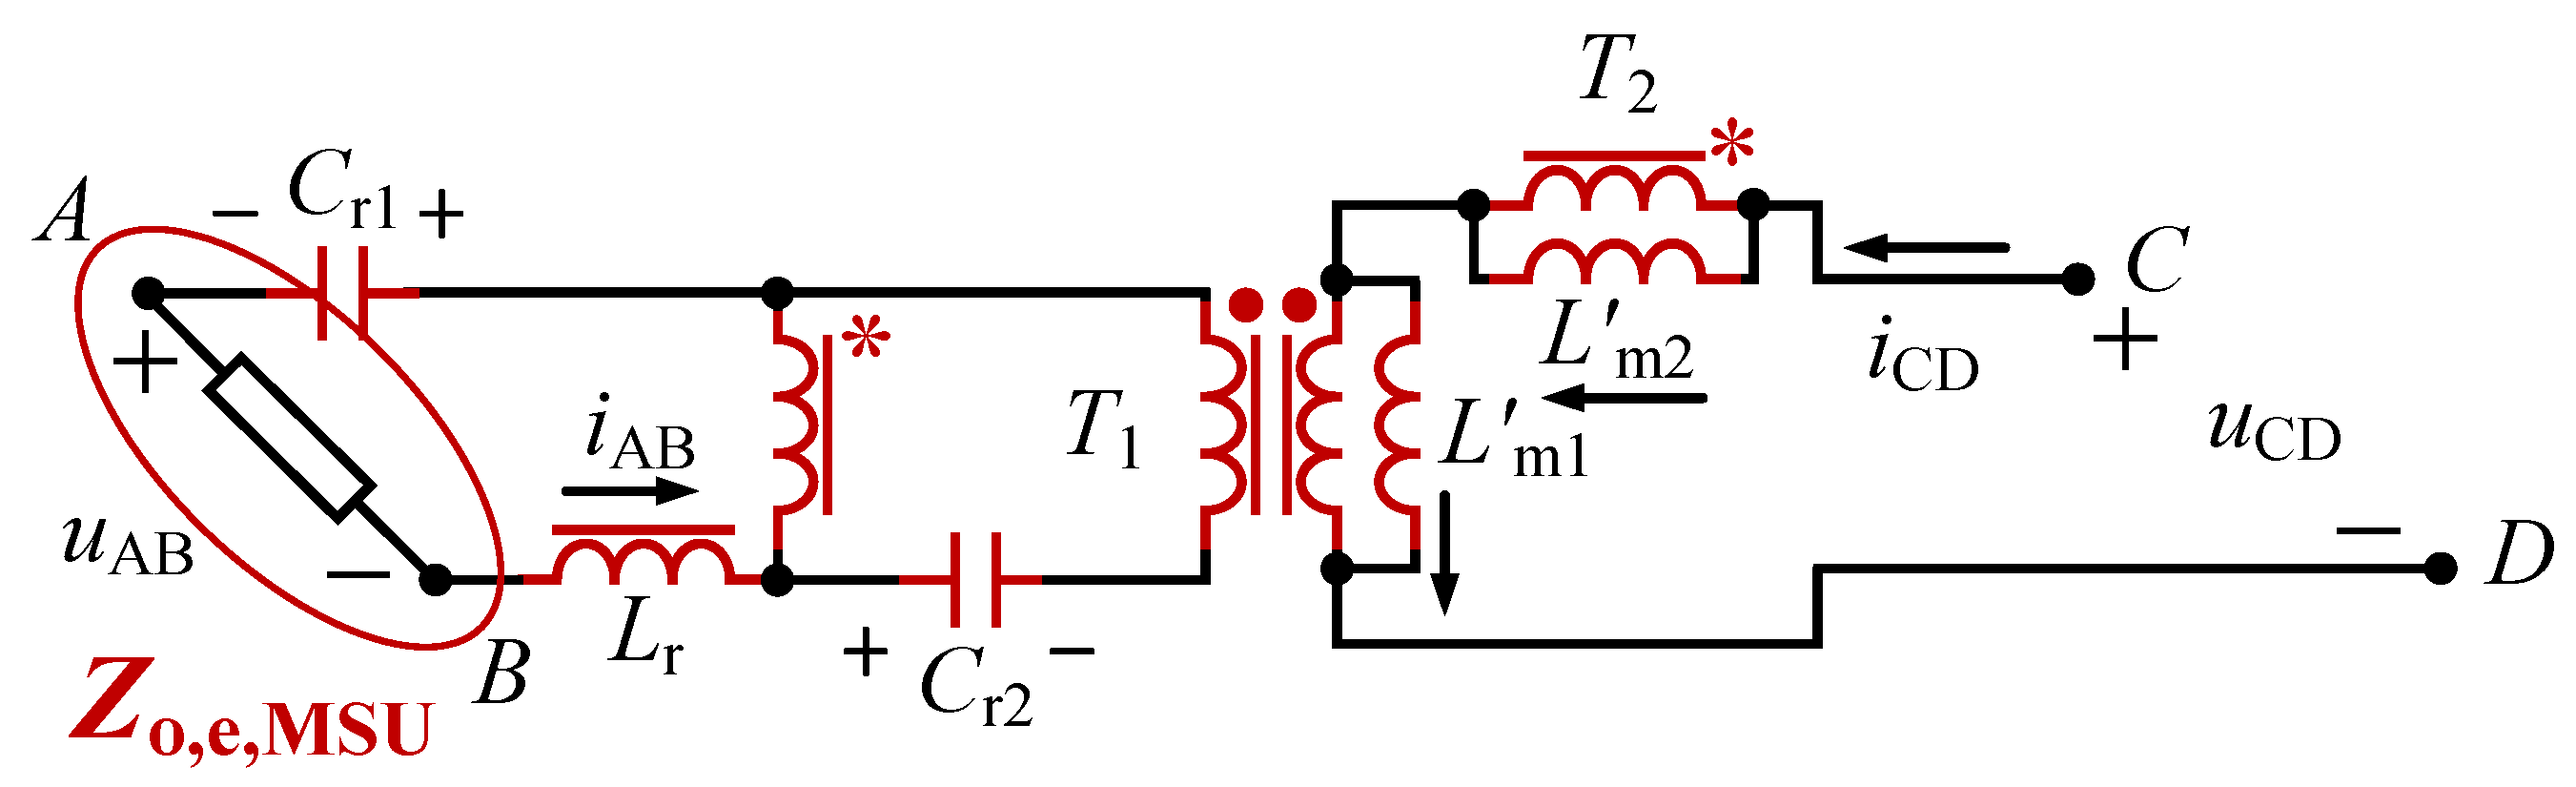
2.1. Topology Structure

The topology of the DHC-LT BDC is shown in Figure 1. DHC means double high-voltage side (HVS) capacitors. UH represents the high-voltage port, referring to the high-voltage lithium battery system or DC bus, while UL represents the low-voltage DC link voltage. Two full-bridge networks are formed with eight power switches, where M1, M2, M3 and M4 constitute the high-voltage full bridge, and M5, M6, M7 and M8 constitute the low-voltage full bridge of the proposed converter. The biggest difference between DHC-LT, CLTC, CDT-LC is the position of Cr2. In CLTC or CDT-LC, the resonant capacitor Cr2 is located in the low-voltage side (LVS) of the resonant tank. In order to reduce conduction loss and improve power density, Cr2 is placed in the HVS of the resonant tank. The resonant inductor Lr and the resonant capacitor Cr1 are at the same position as the CLTC or CDT-LC converter. T1 is the main transformer, similar to the transformer in the LLC resonant converter. The magnetic inductor of T1, Lm1, is used to obtain a voltage gain greater than 1. T2, the auxiliary transformer, is used to make the resonant tank symmetrical. The symbols of “.” mean dotted terminals of T1, and the symbols of “*” mean dotted terminals of T2. In this way, the topology can obtain a voltage gain greater than 1 in step-up mode. The DHC-LT converter is modulated with pulse-frequency modulation (PFM). In step-down mode, M5, M6, M7 and M8 are driven by synchronous rectification (SR). In step-up mode, SR is not used, and antiparallel diodes of M1M4, D1D4, work to realize rectification.

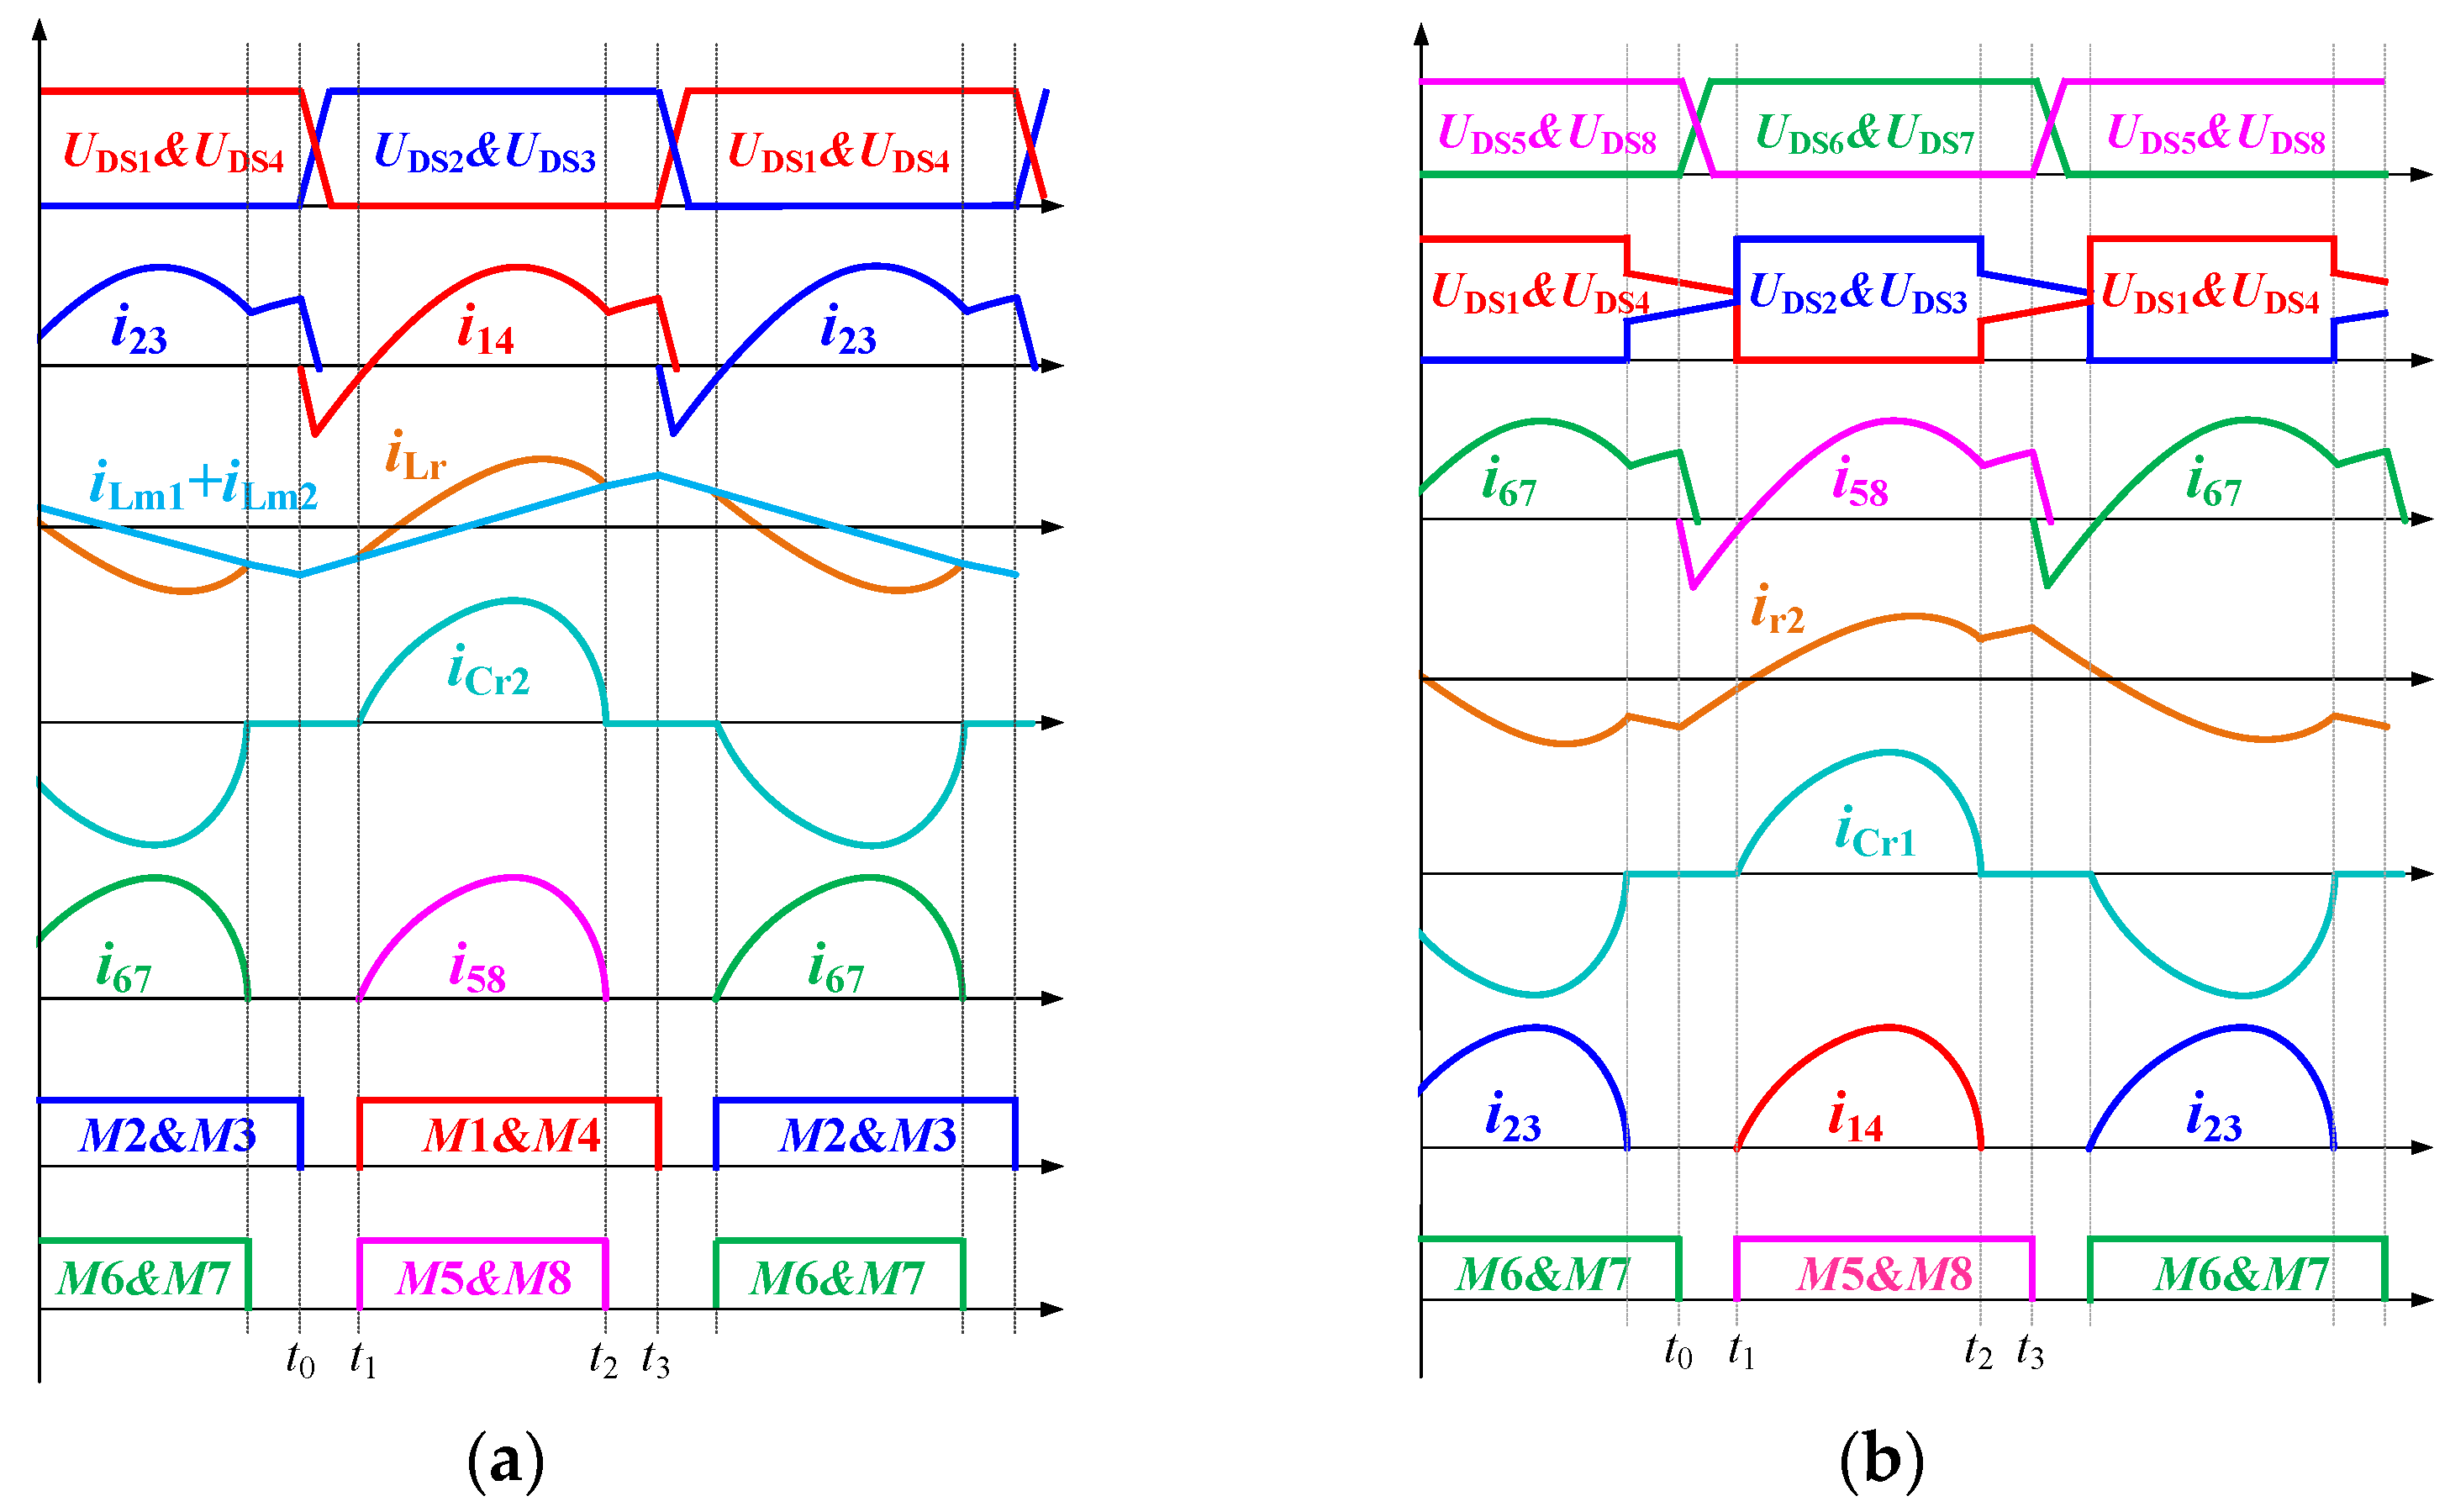
2.2. Operation Principles

In order to simplify the analysis, the operation waveforms of currents, voltages and gate signals are depicted in Figure 2. In Figure 2, i14 is the drain-source current flowing through M1 and M4, i23 is the drain-source current flowing through M2 and M3, i58 is the drain-source current flowing through M5 and M8, and i67 is the drain-source current flowing through M6 and M7. iLm1 is the excitation current of transformer T1 on the HVS, iLm2 is the excitation current of transformer T2 on the HVS, iLr is the current flowing through resonant inductor Lr, iLm1 is the excitation current of transformer T1 on the LVS, iLm2 is the excitation current of transformer T2 on the LVS, iCr1 is the current flowing through resonant capacitor Cr1, and iCr2 is the current flowing through resonant capacitor Cr2. UDS14 is the drain-source voltage of M1 and M4, UDS23 is the drain-source voltage of M2 and M3, UDS58 is the drain-source voltage of M5 and M8, and UDS67 is the drain-source voltage of M6 and M7. M1 and M4 are the driving signals of M1 and M4, M2 and M3 are the driving signals of M2 and M3, M5 and M8 are the driving signals of M5 and M8, and M6 and M7 are the driving signals of M6 and M7.

2.2.1. Step-Down Mode
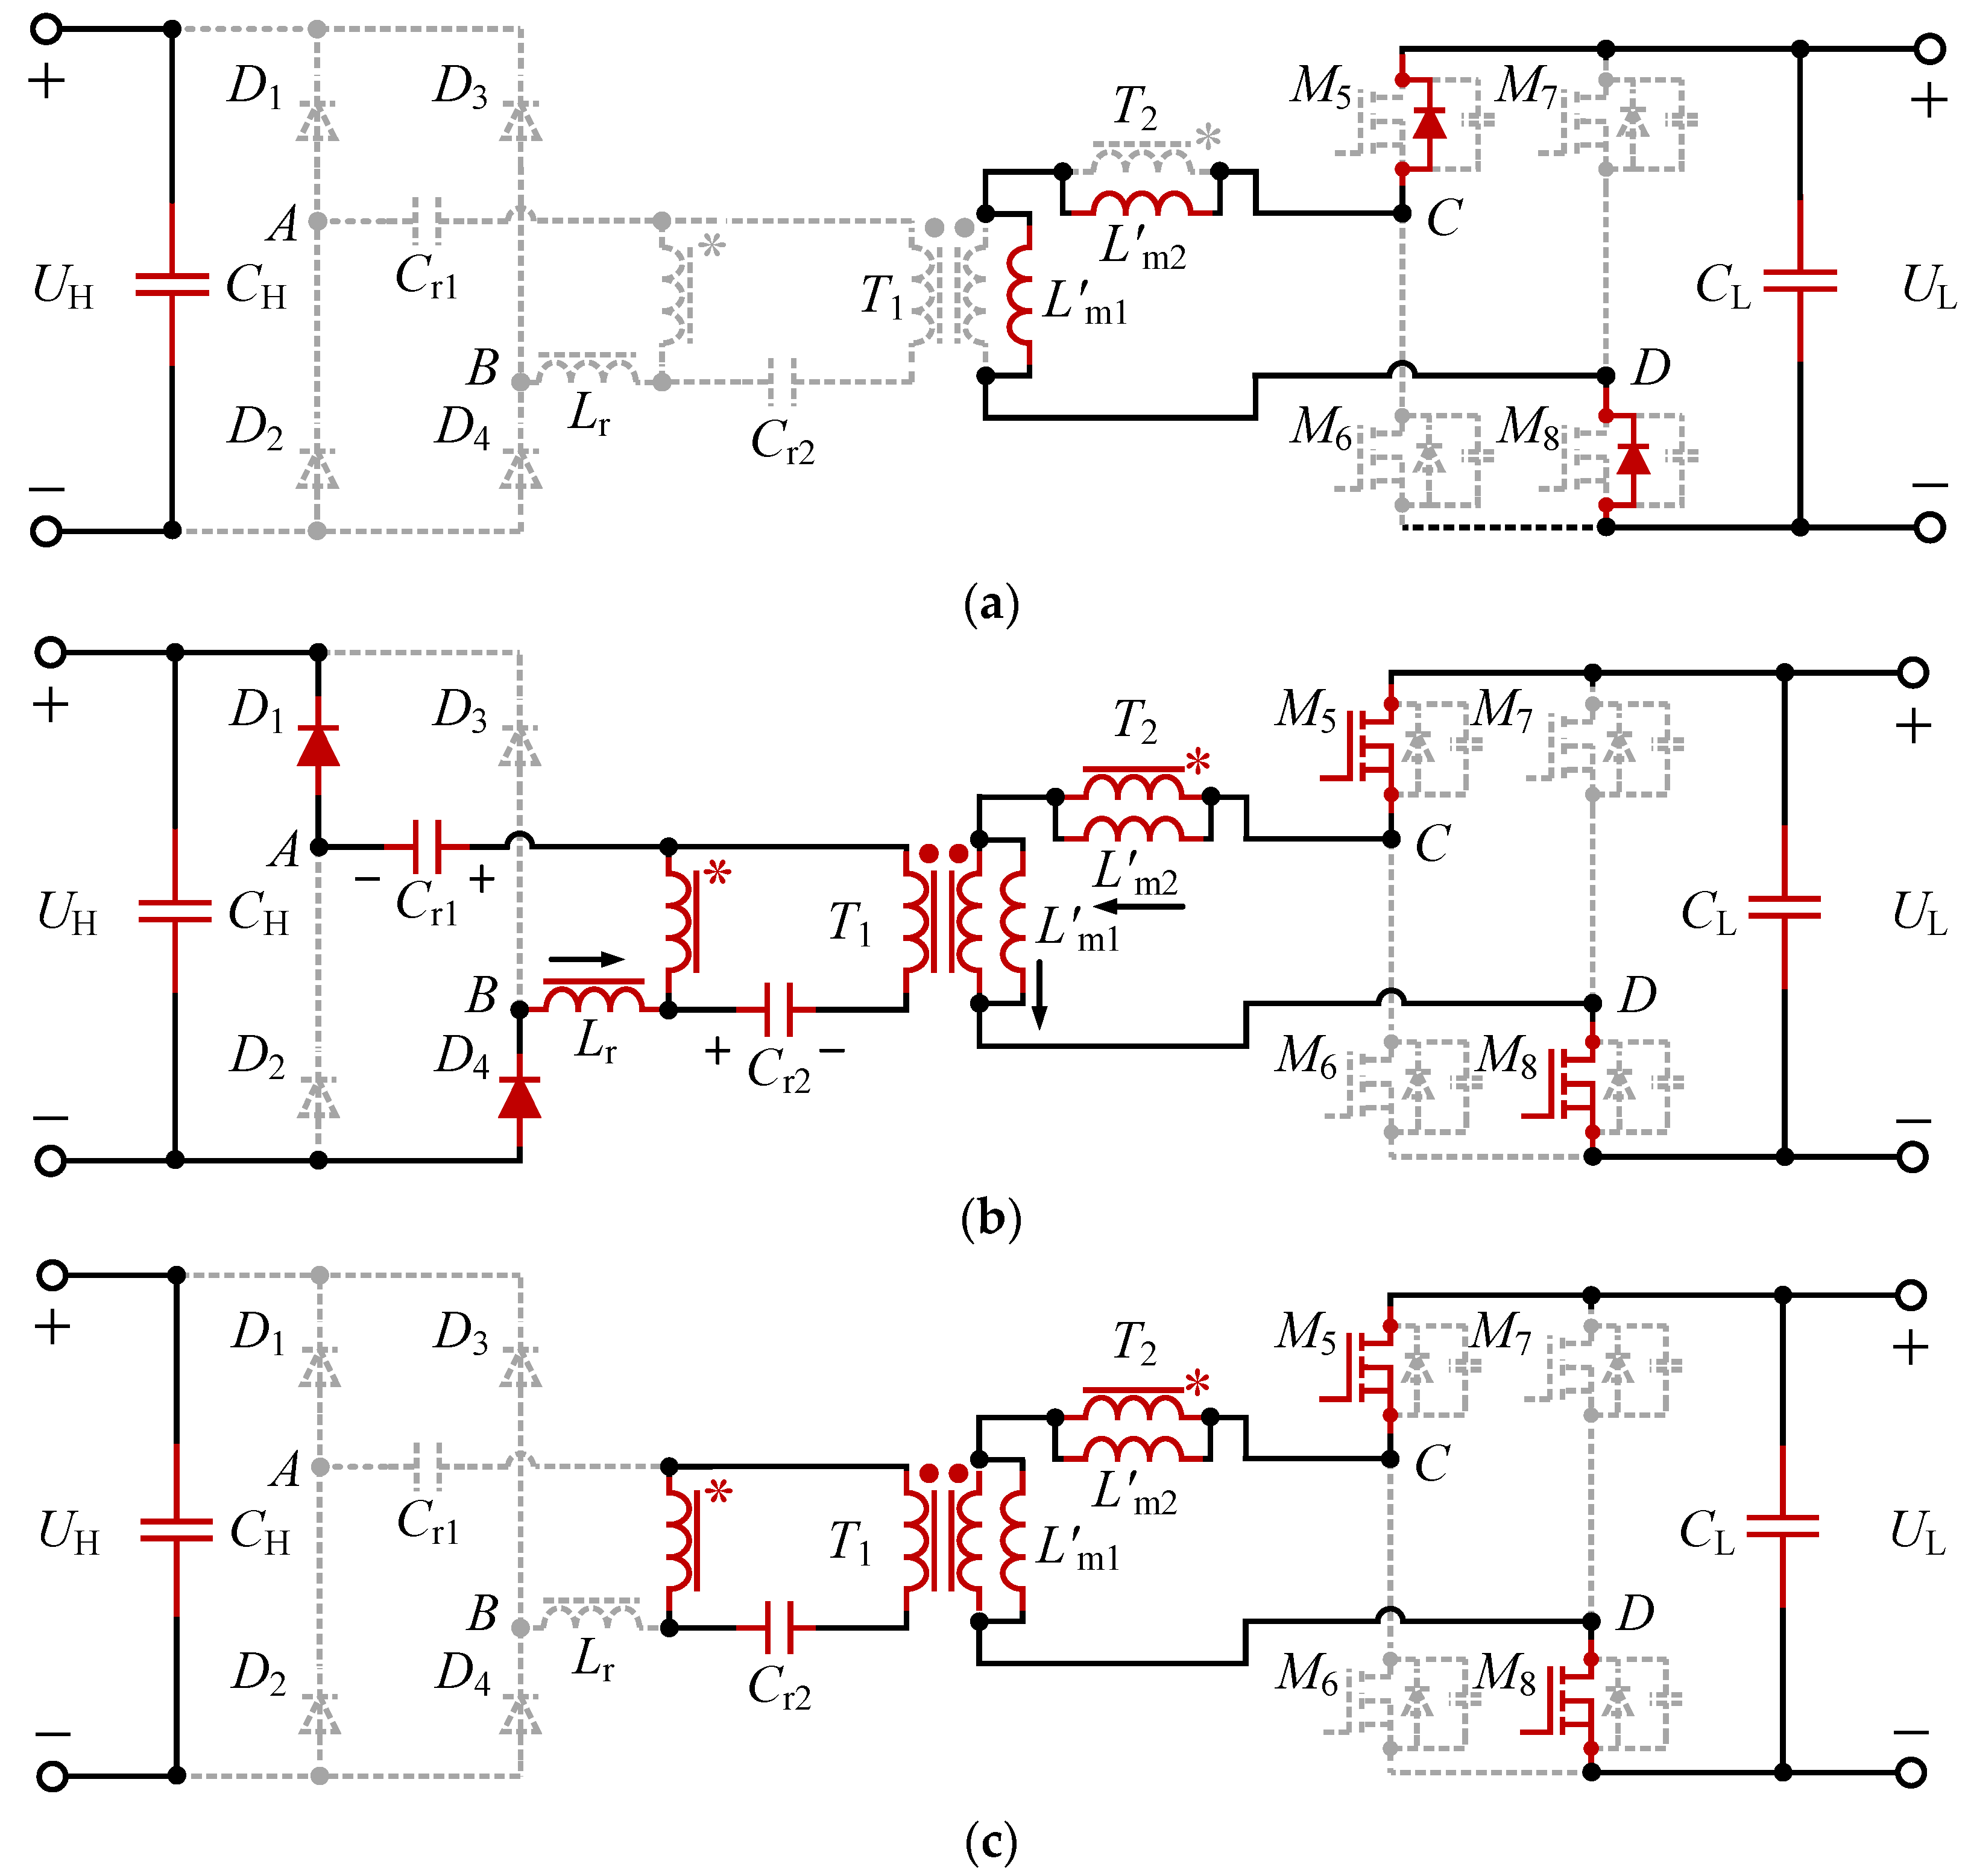
The equivalent circuits when power flows from the HVS to the LVS are listed in Figure 3. The DHC-LT BDC can work in DCM and continuous current mode (CCM). When the switching frequency is lower than the main resonant frequency and higher than the secondary resonant frequency, DCM appears. On the contrary, the switching frequency is equal to or bigger than the main resonant frequency, and DHC-LT works in CCM. Working in DCM, DHC-LT has three intervals in a half cycle: Intervals A, B and C, as Figure 3 shows. Meanwhile, in CCM, DHC-LT has two intervals: Intervals A and B. Detailed descriptions and explanations of the operational modes in the half period are shown as follows:
Interval A [t0t1]: This interval is the dead time of the HVS switches. At the beginning of this interval, t0, M2 and M3 are turned off. The HVS resonant current, iLr, charges the output capacitors of M2 and M3 and discharges the output capacitor of M1 and M4. Then, the voltage of M1 and M4 decreases to 0, and the HVS current passes through the antiparallel diode of M1 and M4, which makes the switches turn on under the ZVS condition. The directions of the state variables are shown in Figure 3a. The relevant expressions in this interval are listed below:
{ u DS 1 ( t ) = u DS 4 ( t ) = U H C r 1 C oss _ H [ u Cr 1 ( t ) u Cr 1 ( t 0 ) ] u DS 2 ( t ) = u DS 3 ( t ) = C r 1 C oss _ H [ u Cr 1 ( t ) u Cr 1 ( t 0 ) ]
Interval B [t1t2]: At t1, M1, M4, M5 and M8 turn on, and power is transmitted from the HVS to the LVS. The resonant current changes in a sine wave with main resonant frequency fr. At t2, iLr is equal to the sum of iLm1, and iLm2, iCr2 and i58 become zero. The directions of the state variables are shown in Figure 3b. The relevant expressions in Interval B are listed below:.
{ C r 2 d u Cr 2 ( t ) d t = i Lm 1   ( t ) + i CD ( t ) n 1   C r 1 d u Cr 1 ( t ) d t = i Lr ( t ) L m 1 d i Lm 1 ( t ) d t = n 1 u Cr 2 ( t ) + n 1 n 2 U L n 1 + n 2 L m 2 d i Lm 2 ( t ) d t = n 2 u Cr 2 ( t ) + n 1 n 2 U L n 1 + n 2 L r d i Lr ( t ) d t = U H u Cr 1 ( t ) n 2 u Cr 2 ( t ) + n 1 n 2 U L n 1 + n 2
Interval C [t2t3]: M1 and M4 are still on in this interval, but M5 and M8 turn off. As iCr2 and i58 are zero in t2, M5 and M8 turn off under the ZCS condition. The HVS goes into secondary resonance with the frequency of fr2d. At t3, M1 and M4 are off, and the dead time begins. The relevant expressions in Interval C are listed below:
{ C r 1 d u Cr 1 ( t ) d t = i Lr   ( t ) + i Lm 2   ( t )   C r 2 d u Cr 2 ( t ) d t = i Lr   ( t ) = i Lm 1   ( t ) L m 2 d i Lm 2 ( t ) d t = U H u Cr 1 ( t ) ( L m 1 + L r ) d i Lm 1 ( t ) d t = U H u Cr 1 ( t ) u Cr 2 ( t )

2.2.2. Step-Up Mode

The equivalent circuits in step-up mode are listed in Figure 4. Similar to step-down mode, DHC-LT can work in CCM mode and DCM mode. Interval C disappears when the working frequency is higher than the main resonant frequency. The corresponding waveforms are described as follows:
Interval A [t0t1]: This interval begins at t0 when M6 and M7 turn off. During this interval, the parasite capacitors of M5 and M8 charge while those of M6 and M7 discharge. When the capacitors complete charging and discharging, the LVS current passes through the antiparallel diode of M5 and M8. The relevant expressions in this interval are listed below:
{ u D S 5 ( t ) = u D S 8 ( t ) = U L t 0 t i Lm 1 ( x ) d x C oss _ L u D S 6 ( t ) = u D S 7 ( t ) = t 0 t i Lm 1 ( x ) d x C oss _ L
Interval B [t1t2]: M5 and M8 turn on under ZVS at t1; D1 and D4 also turn on, and power is transmitted from the LVS to the HVS. The resonant current on the LVS changes in a sine wave until t2. The relevant expressions in this interval are listed below:
{ C r 1 d u Cr 1 ( t ) d t = ( 1 + n 1 n 2 ) i Lr   ( t ) + 1 n 2 [ i   L     m 1   ( t ) i   L     m 2   ( t ) ] C r 2 d u Cr 2 ( t ) d t = i Lr ( t ) L m 2 d i   L     m 2 ( t ) d t = 1 n 2 [ U H + u Cr 1 ( t ) ] L m 1 d i   L     m 1 ( t ) d t = U L 1 n 2 [ U H + u Cr 1 ( t ) ] L r d i Lr ( t ) d t = n 1 [ U L 1 n 2 U H 1 n 2 u Cr 1 ( t ) ] U H u Cr 1 ( t ) u Cr 2 ( t )
Interval C [t2t3]: M5 and M8 are still on in this interval, but no power is transmitted from the LVS to the HVS. The LVS goes into secondary resonance with the frequency of fr2u. The resonant tank is rebuilt by Cr2, T1 and T2. The output current is supplemented by capacitor CH. Since no current flows through the diodes of the HVS, the switch voltages at the HVS are clamped to UH/2. The relevant expressions in this interval are listed below:
{ C r 1 d u Cr 1 ( t ) d t = 0 C r 2 d u Cr 2 ( t ) d t = i Lr   ( t ) = i   L     m 2 ( t ) L m 2 d i   L     m 2 ( t ) d t = n 1 U L U Cr 2 n 1 + n 2 L r L m 2 L m 1 d i   L     m 1 ( t ) d t = U L n 1 U L U Cr 2 n 1 + n 2 L r L m 2

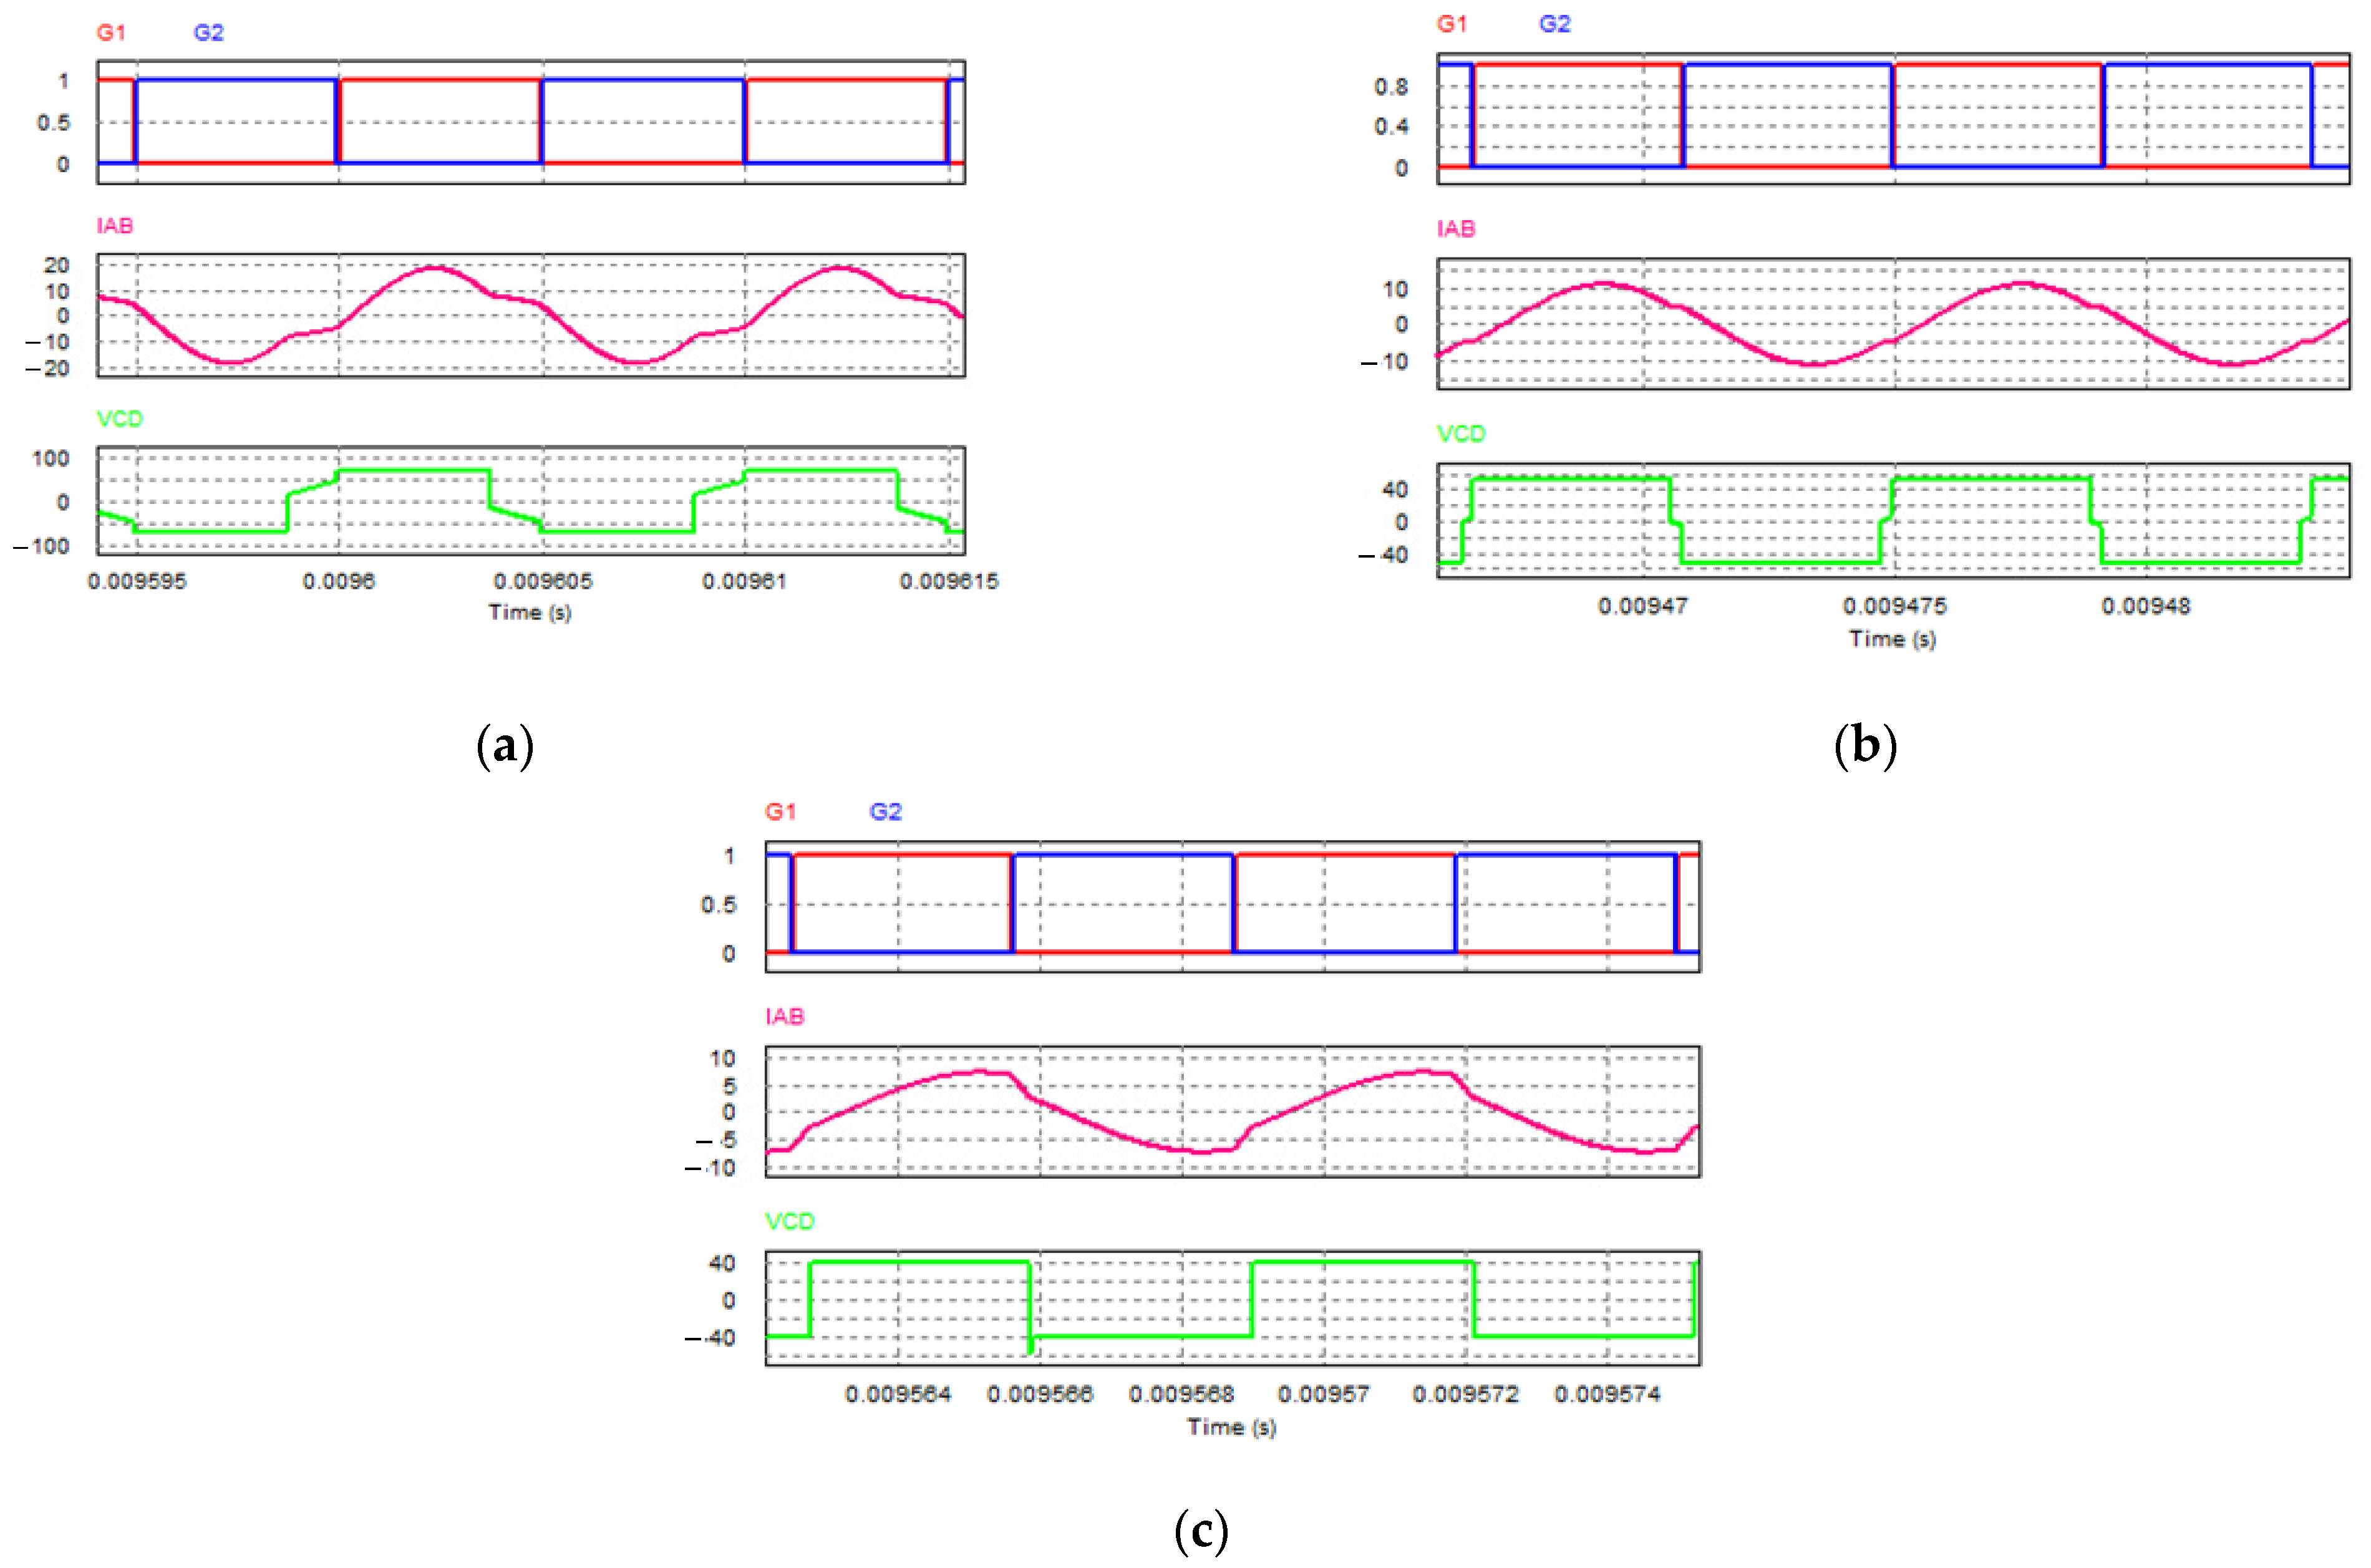
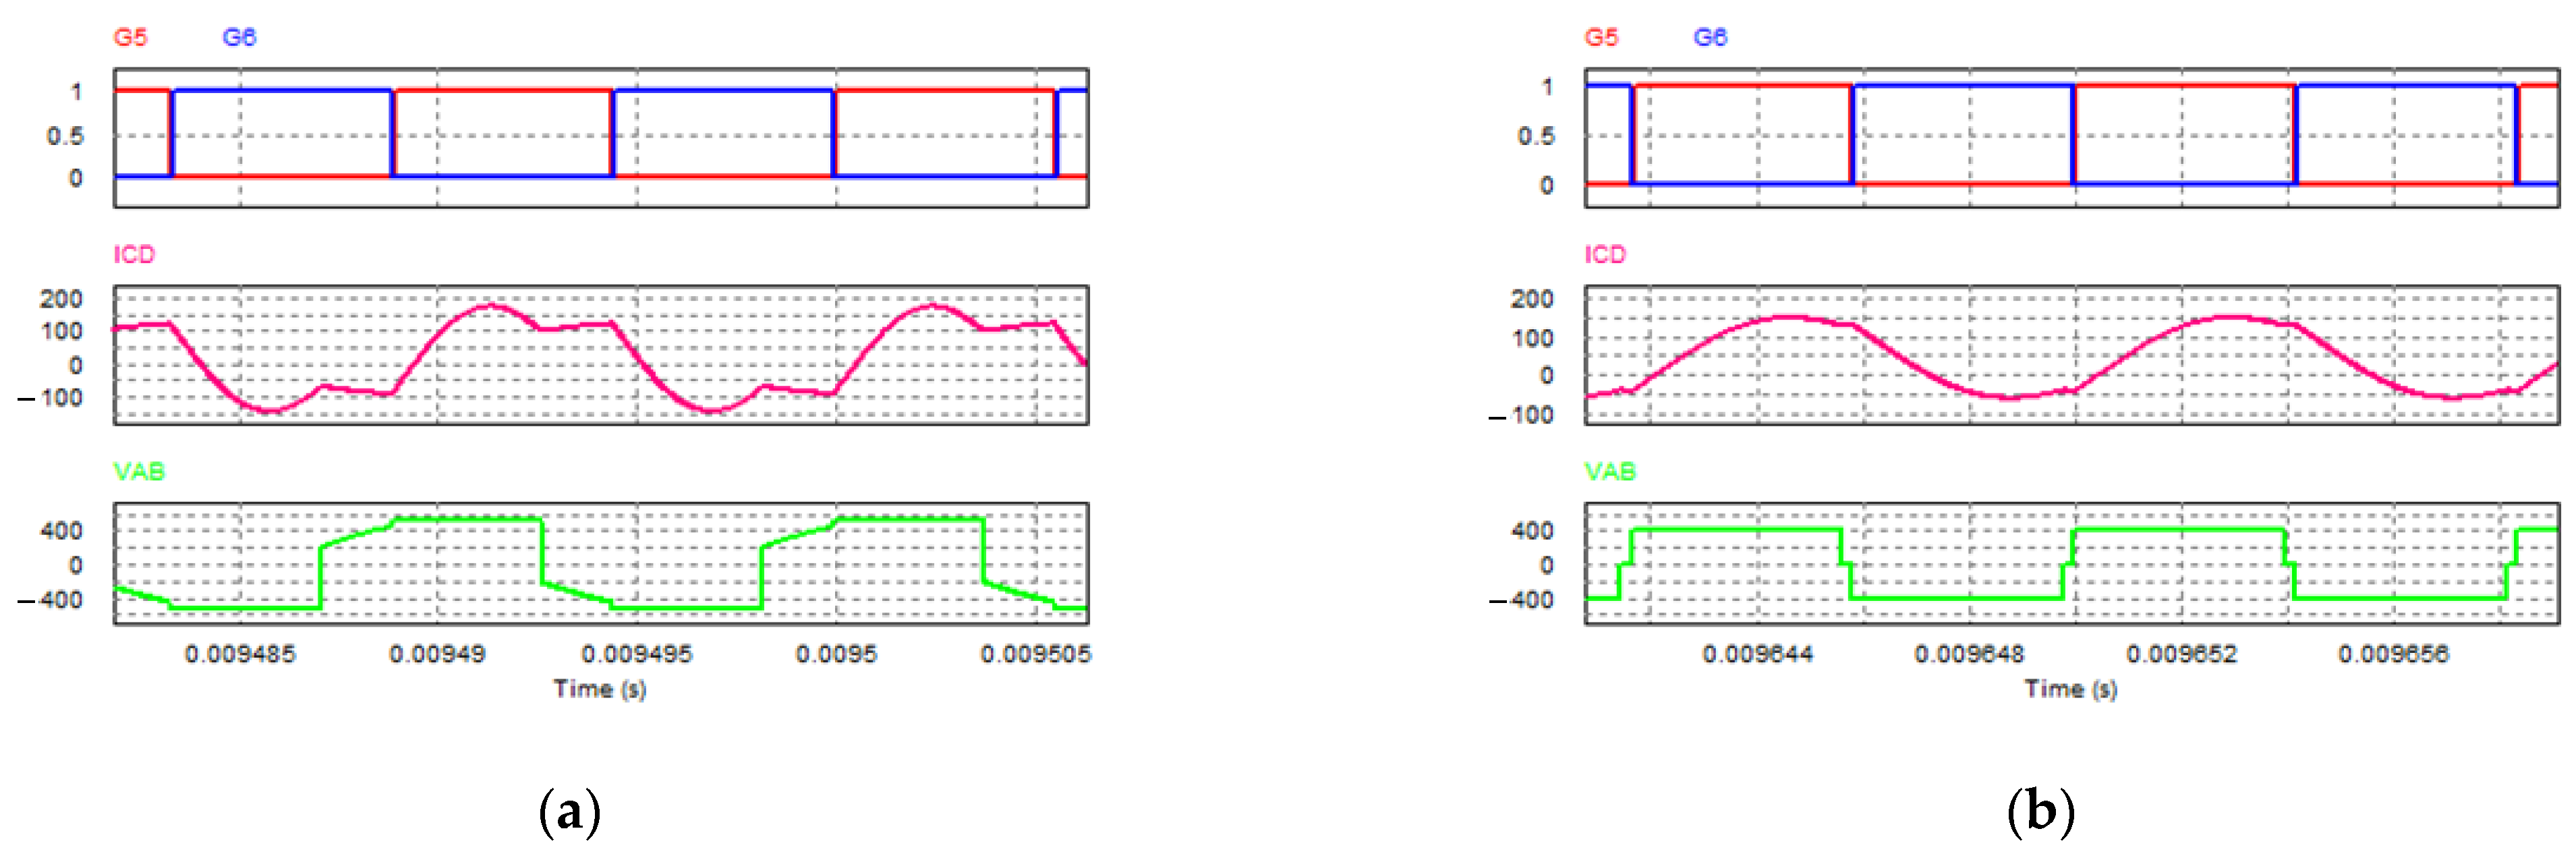
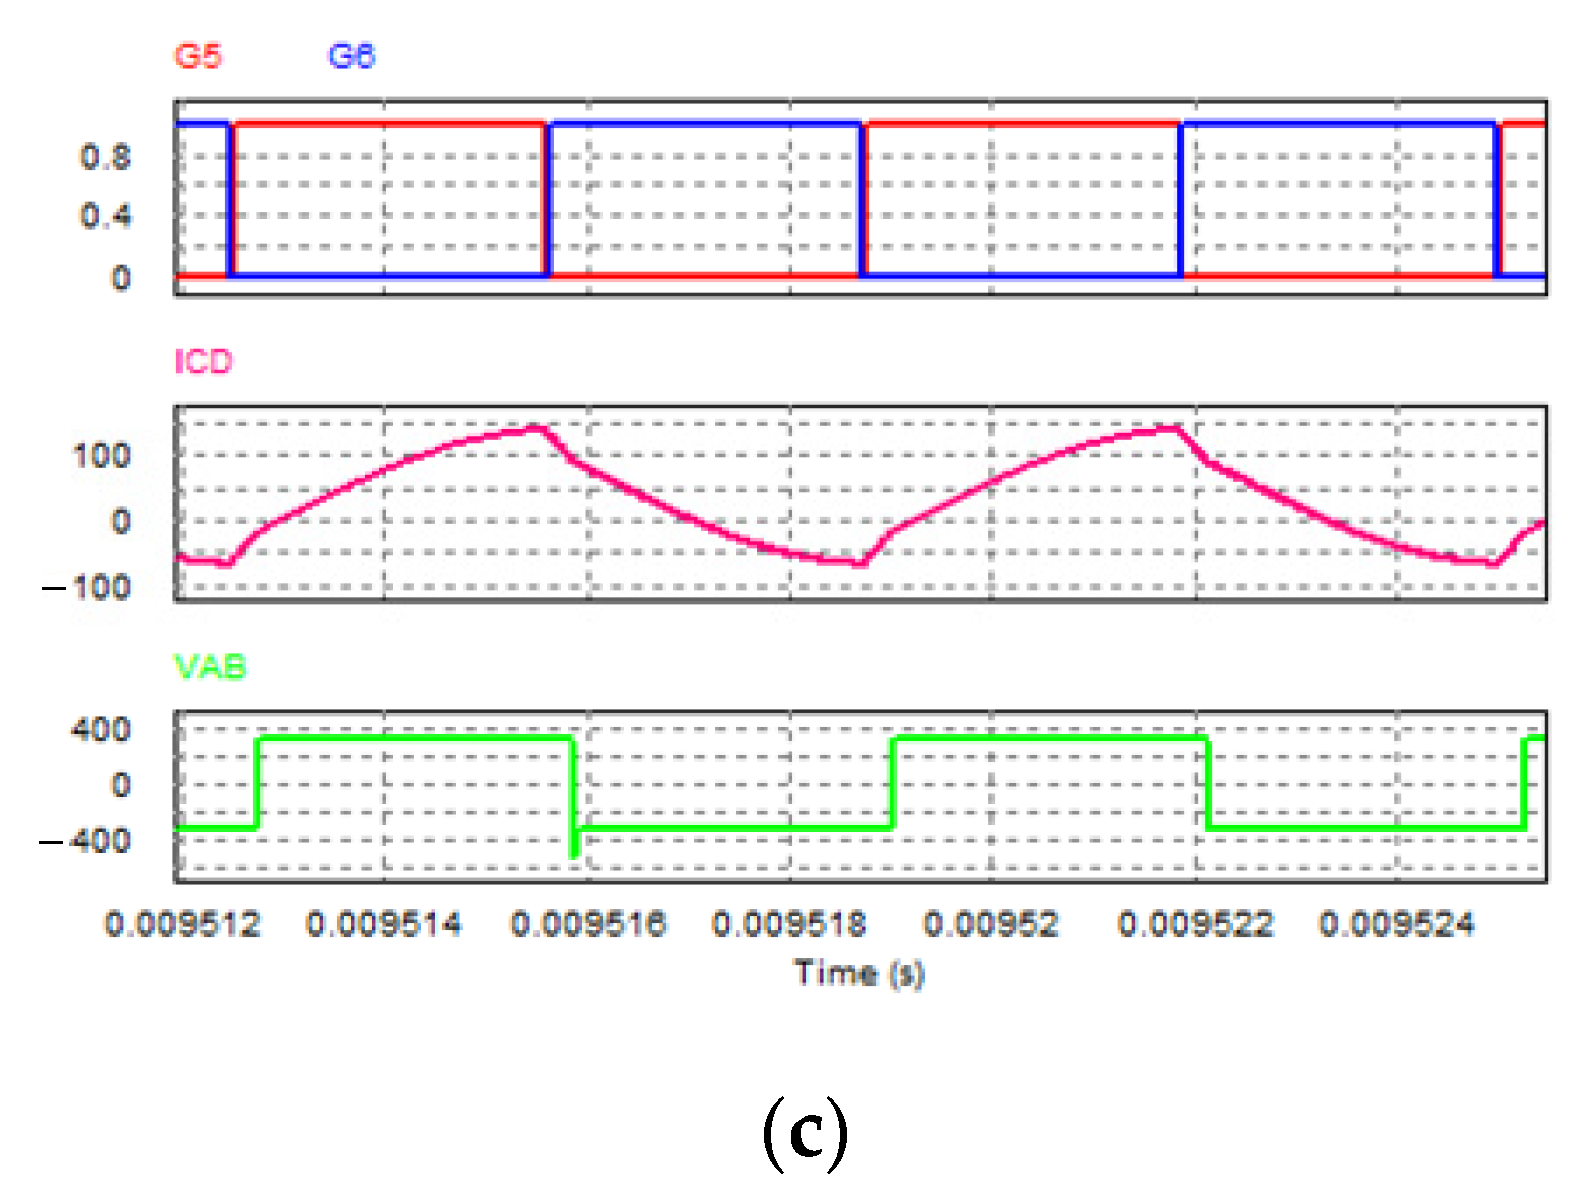
2.3. Simulation Verification

A simulation in PSIM software is used to verify the analysis. In PSIM, idealized components are used to build circuits, and the trapezoidal method is adopted to solve system equations. In this way, the simulation velocity is increased, and the robustness of the simulation is improved. Figure 5 shows the simulation model of the DHC-LT BDC. Rmos_H, Rmos_L, RCr1, RCr2, RLr, RT1_H, RT2_H, RT1_L, RT2_L, ESRCH and ESRCL are the resistances of the components. In Figure 6a,b and Figure 7a,b, the waveforms in two directions are shown, proving that secondary resonance exists in DCM mode. The output voltages VCD and VAB are not clamped to UL and UH when secondary resonance appears. On the contrary, in Figure 6c and Figure 7c, when the switching frequency increases beyond the main resonant frequency, the resonant currents in the tank, iAB and iCD, are continuous. VCD and VAB are clamped to UL and UH in the half period.

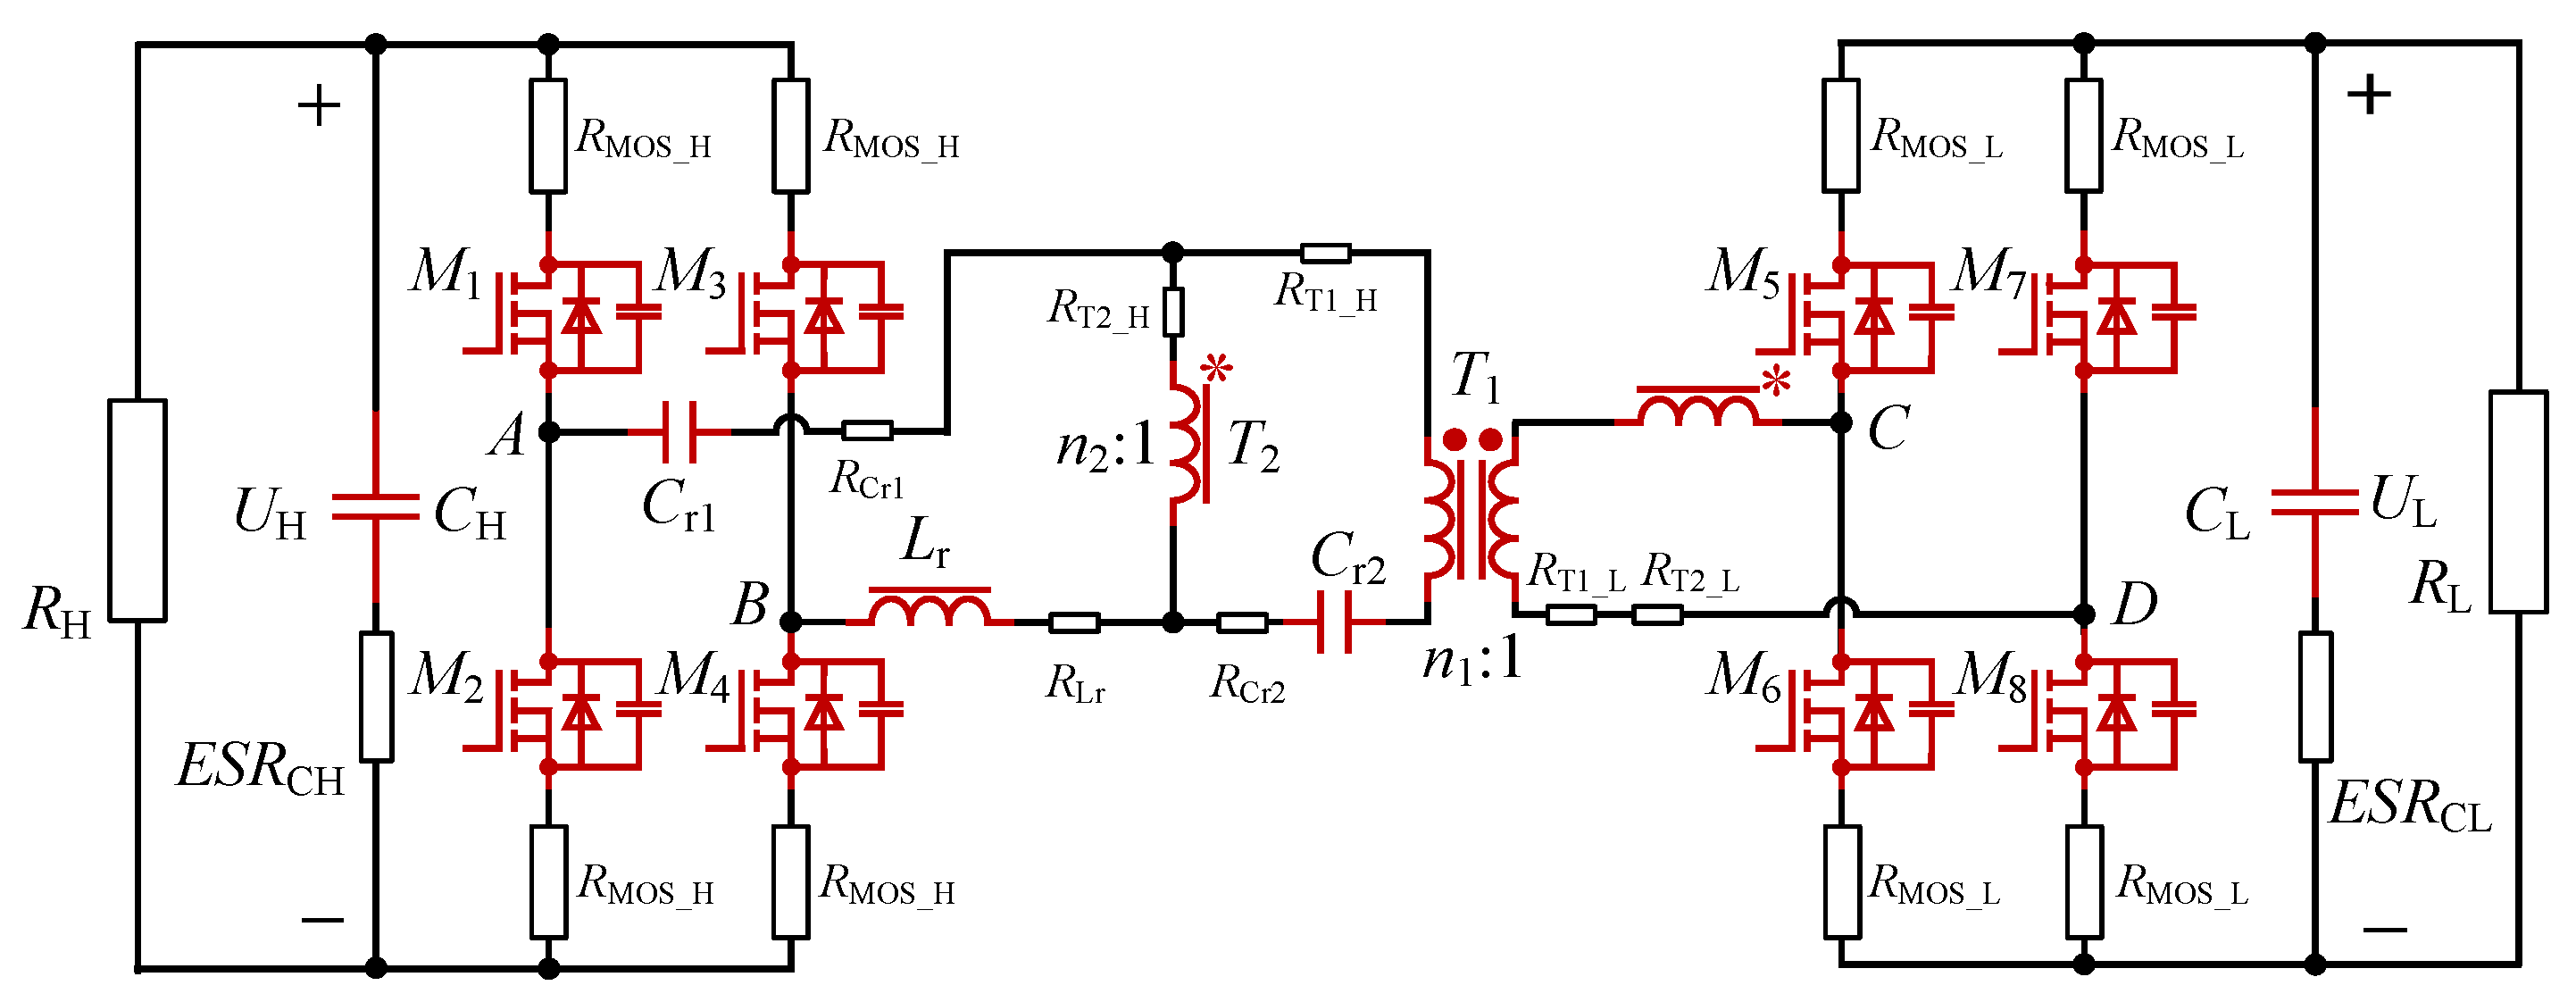
2.4. Small-Signal Modeling

By applying the EDF concept and derivation procedures in [27] to the DHC-LT resonant converter, the small-signal mode is illustrated in this section. The open-loop transfer function from the control to the output voltage is shown in List 1 of the Appendix A. As shown in Figure 8, the low-frequency gain is about −55 dB, so the robustness of the proposed converter is strong, but the dynamic response is slow, which is similar to the LLC resonant converter. As the two sides of the DHC-LT converter are controlled by other converters or clamped by batteries, the fast dynamic response of the DHC-LT converter is not needed to make the DC power system stable, so it can be inferred that the DHC-LT converter is suitable in the DC power use of buildings and community microgrids.

3. Improved FHA with Modification of AC Load Impedance

In this section, an improved FHA method is proposed to improve the accuracy of calculation. The main work is modifying the AC load impedance in the FHA, considering the phase angle of the AC load.
Traditional FHA is a simple and direct method to calculate voltage gain, which is essential for the design of resonant DC-DC converters, such as LLC and series-resonant converters. Compared to traditional FHA, the improved FHA method establishes the fundamental waveforms of the AC output voltage and current in DCM mode. Thus, the phase angle of the AC load impedance is obtained by Fourier decomposition and taken for calculation. The procedure of the improved FHA is: (1) calculate the output voltage of the resonant tank in Interval C, USD or USU; (2) extract the fundamental components of the output voltage and current; (3) compute the output impedance of the resonant tank considering its phase angle; (4) calculate the new DC voltage gain using the output impedance in (3) as the AC output load.

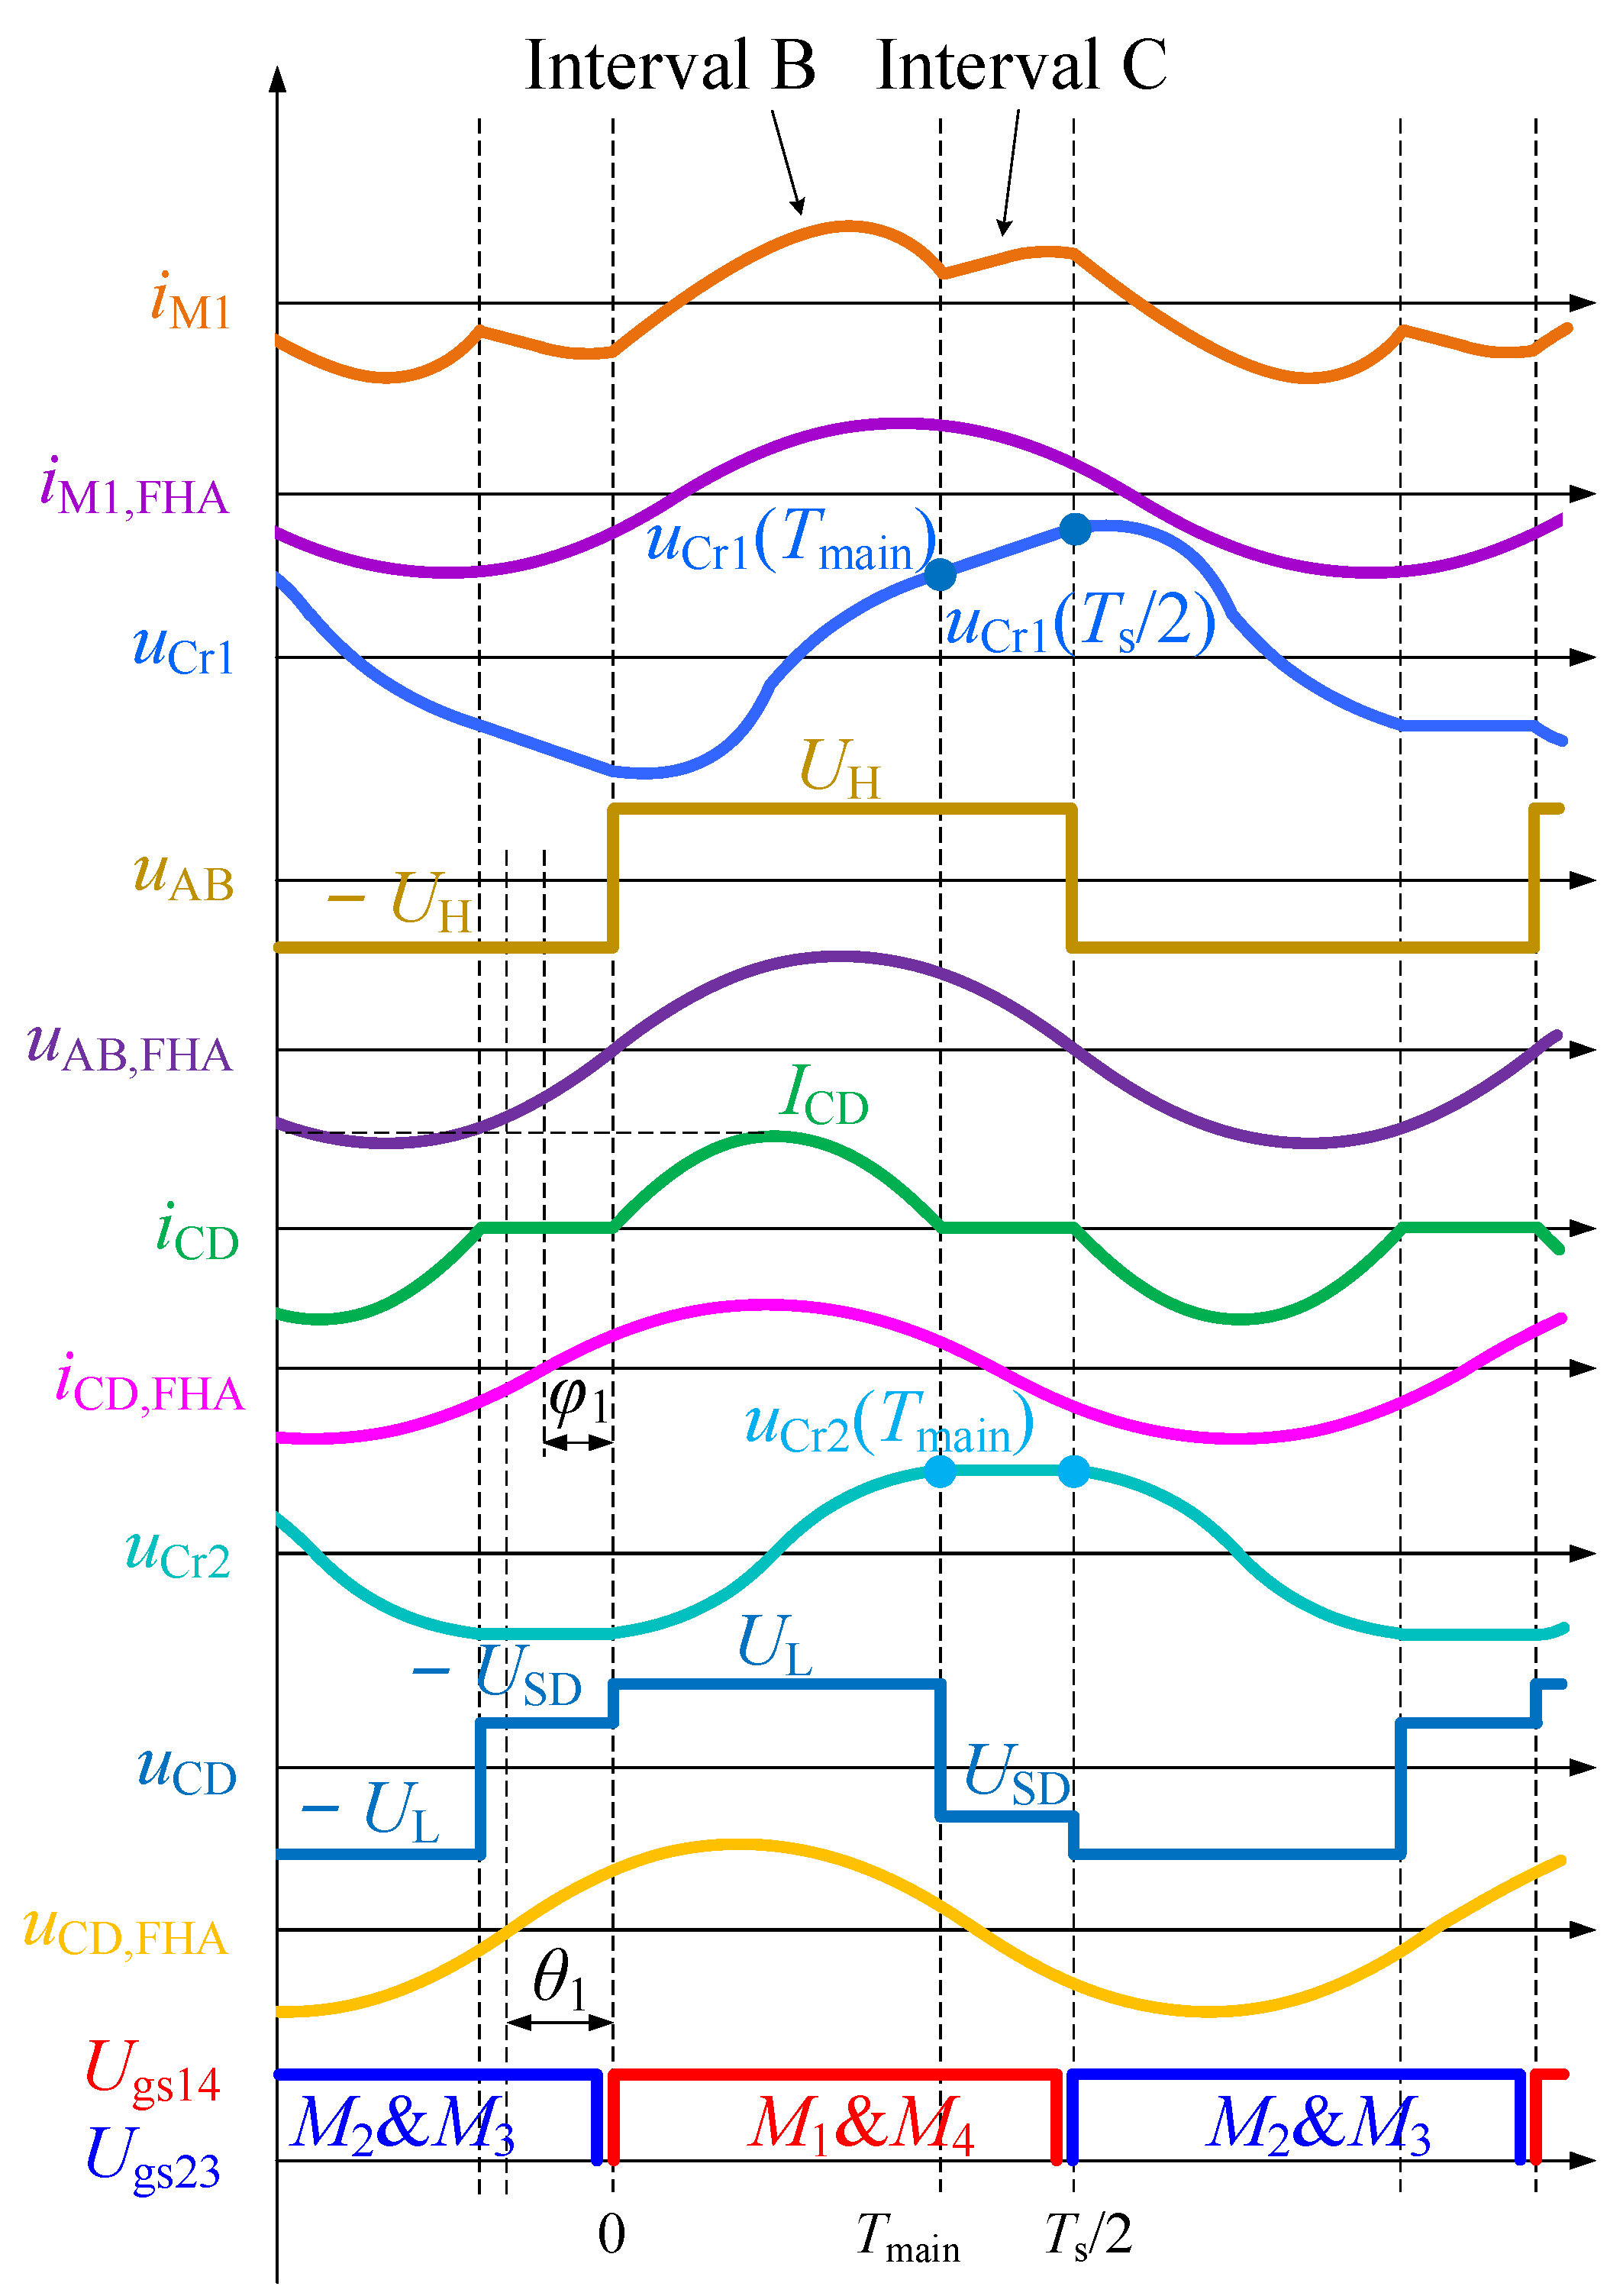
3.1. Improved FHA in Step-Down Mode

The equivalent FHA circuit in step-down mode is shown in Figure 9, and relevant waveforms are shown in Figure 10.

Assuming

(a)
The main resonance interval (Interval B) lasts half of the main resonant period, and Tmain is equal to 1/2fr.
(b)
In Interval C, the voltage between the neutral points of the two arms of the rectifier bridge remains constant, USD. The current flowing through Lm1 remains constant, ILm1, and the current flowing through Lm2 remains constant, ILm2.
(c)
The efficiency of the DHC-LT resonant circuit is 100%.
The output voltage of the resonant tank in Tmain, USD, is shown in List 2 of the Appendix A.
With the method of Fourier decomposition, the angle between the fundamental wave of the output AC current iCD and the fundamental wave of the input AC voltage uCD, φ 1 , is estimated as
φ 1 = π 2 ( 1 f s f r )
The angle between the fundamental wave of the output AC voltage uCD and the fundamental wave of the input AC voltage uAB, θ 1 , is estimated as
θ 1 = arctan ( U L A 1 + U SD B 1 U L C 1 + U SD D 1 )
In the above equation
A 1 = 2 sin ( 2 π f s · T main ) π B 1 = 2 sin ( 2 π f s · T main ) π C 1 = 2 2 cos ( 2 π f s · T main ) π D 1 = 2 + 2 cos ( 2 π f s · T main ) π
Therefore, the output AC impedance is
Z o , e , MSD = R o , e , MSD + j · R o , e , MSD · tan ( θ 1 φ 1 )
R o , e , MSD is obtained by Reference [36]. Ro,SD is the DC load in step-down mode.
R o , e , MSD = n 2 R o , SD 2 [ 1 ( f s f r ) 2 ] 2 cos 2 ( f s f r )
The RMS value of the output AC peak voltage, UCD,FHA, is expressed as
U CD , FHA = U CD ( A 1 + U SD U L B 1 ) 2 + ( C 1 + U SD U L D 1 ) 2
The RMS value of the input AC peak voltage uAB, FHA, is expressed as
U AB , FHA = 4 π U AB
The modified voltage conversion ratio is
M SD = U CD U AB = U CD U CD , FHA U CD , FHA U AB , FHA U AB , FHA U AB = 4 H 1 s C r 1 + s L r H 1 + s L m 2 G 1 π ( A 1 + U SD U L B 1 ) 2 + ( C 1 + U SD U L D 1 ) 2
In the above equation
E 1 = s · ( 1 + n 1 / n 2 ) L m 1 + n 1 2 Z o , e , MSD s 2 · n 1 C r 2 ( 1 + n 1 / n 2 ) L m 1 + n 1 2 / n 2 F 1 = n 1 U Cr 2 / n 2 + n 1 Z o , e , MSD s ( 1 + n 1 / n 2 ) L m 1 G 1 = U Cr 2 + n 1 Z o , e , MSD s ( 1 + n 1 / n 2 ) L m 2 H 1 = F 1 + G 1 + 1 / n 1 + 1 / n 2

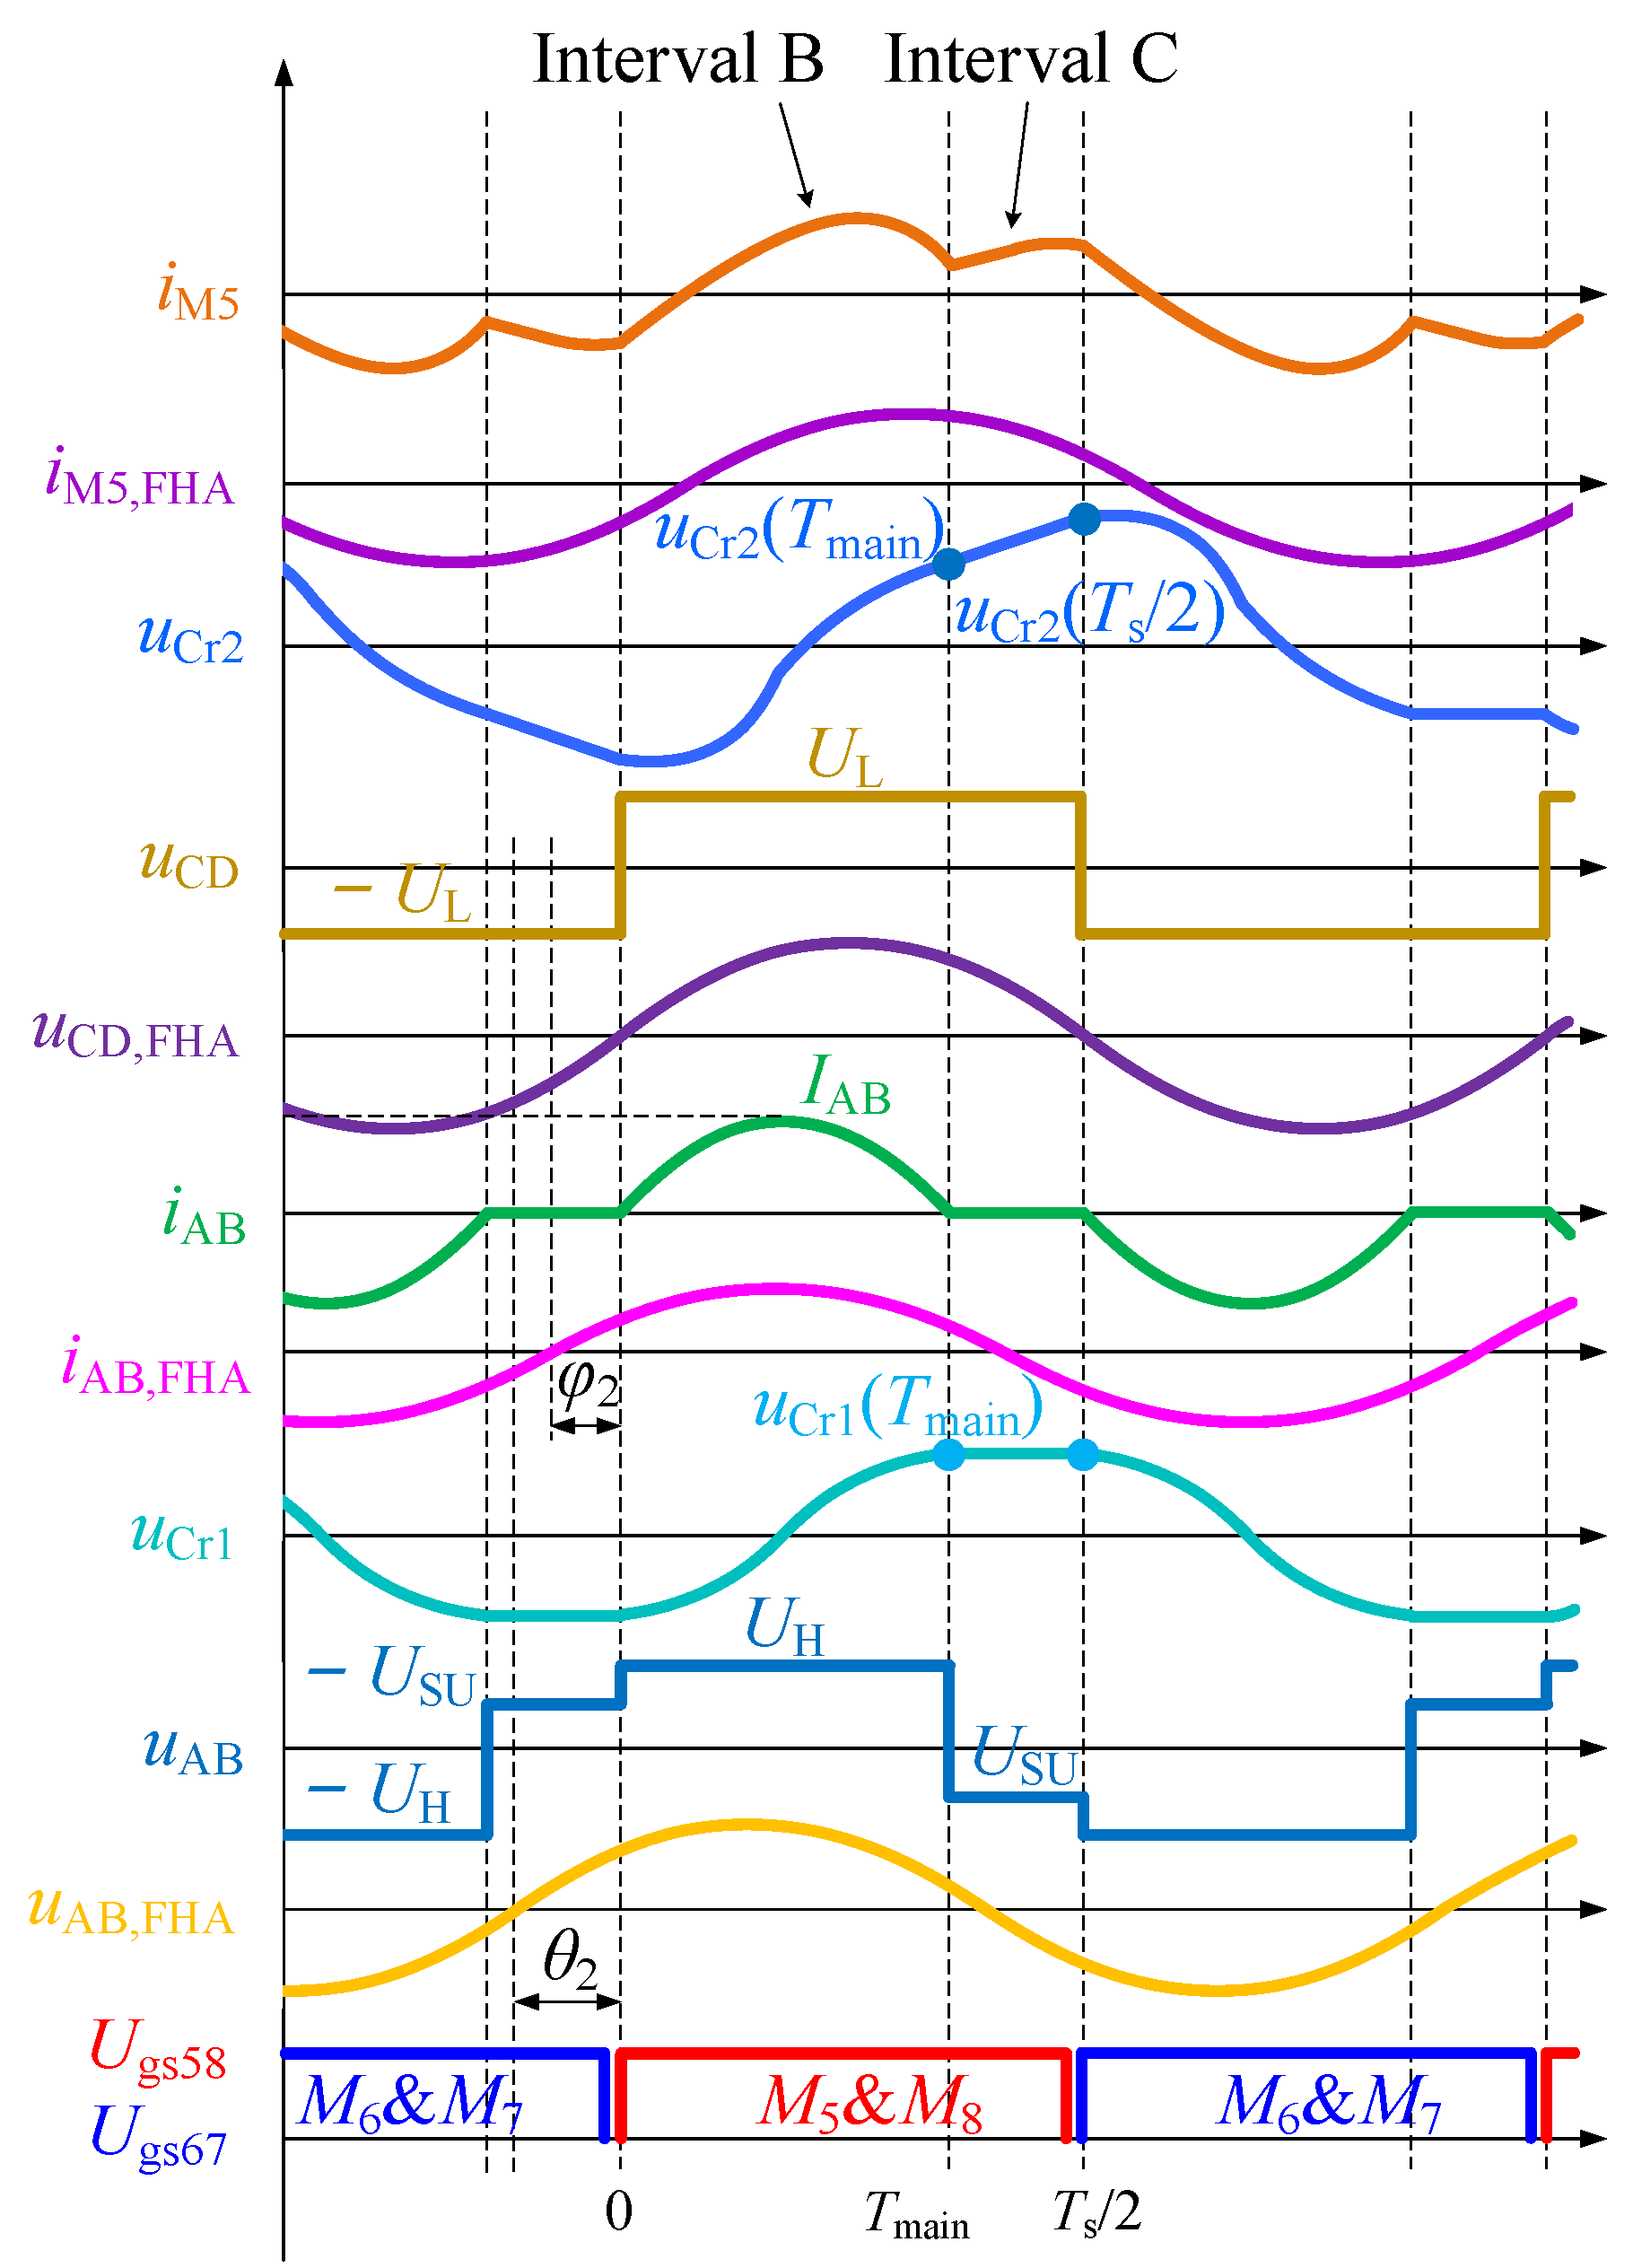
3.2. Improved FHA in Step-Up Mode

The equivalent FHA circuit in step-up mode is shown in Figure 11, and relevant waveforms are shown in Figure 12.
The output voltage of the resonant tank in Tmain, USU, is shown in List 3 of the Appendix A.
With the method of Fourier decomposition, the angle between the fundamental wave of the output AC current iAB and the fundamental wave of the input AC voltage uAB, φ 2 , is estimated as
φ 2 = π 2 ( 1 f s f r )
The angle between the fundamental wave of the input AC voltage uCD and the fundamental wave of the output AC voltage uAB, θ 2 , is estimated as
θ 2 = arctan ( U H A 1 + U SU B 1 U H C 1 + U SU D 1 )
Therefore, the output AC impedance in the HVS is
Z o , e , MSU = R o , e , MSU + j · R o , e , MSU · tan ( θ 2 φ 2 )
R o , e , MSU is obtained by Reference [36]. Ro,SU is the DC load in step-up mode.
R o , e , MSU = n 2 R o , SU 2 [ 1 ( f s f r ) 2 ] 2 cos 2 ( f s f r )
The modified voltage conversion ratio is
M SU = U AB U CD = 4 Z o , e , MSU I 1 + J 1 n 1 + I 1 n 2 π ( A 1 + U SU U H B 1 ) 2 + ( C 1 + U SU U H D 1 ) 2
In the above equation
I 1 = 1 s C r 1 + s L r + Z o , e , MSU J 1 = n 2 + I 1 s n 2 L m 2 I 1 s n 1 L m 1 ( n 1 + n 2 ) s C r 2 + 1 s n 1 L m 1

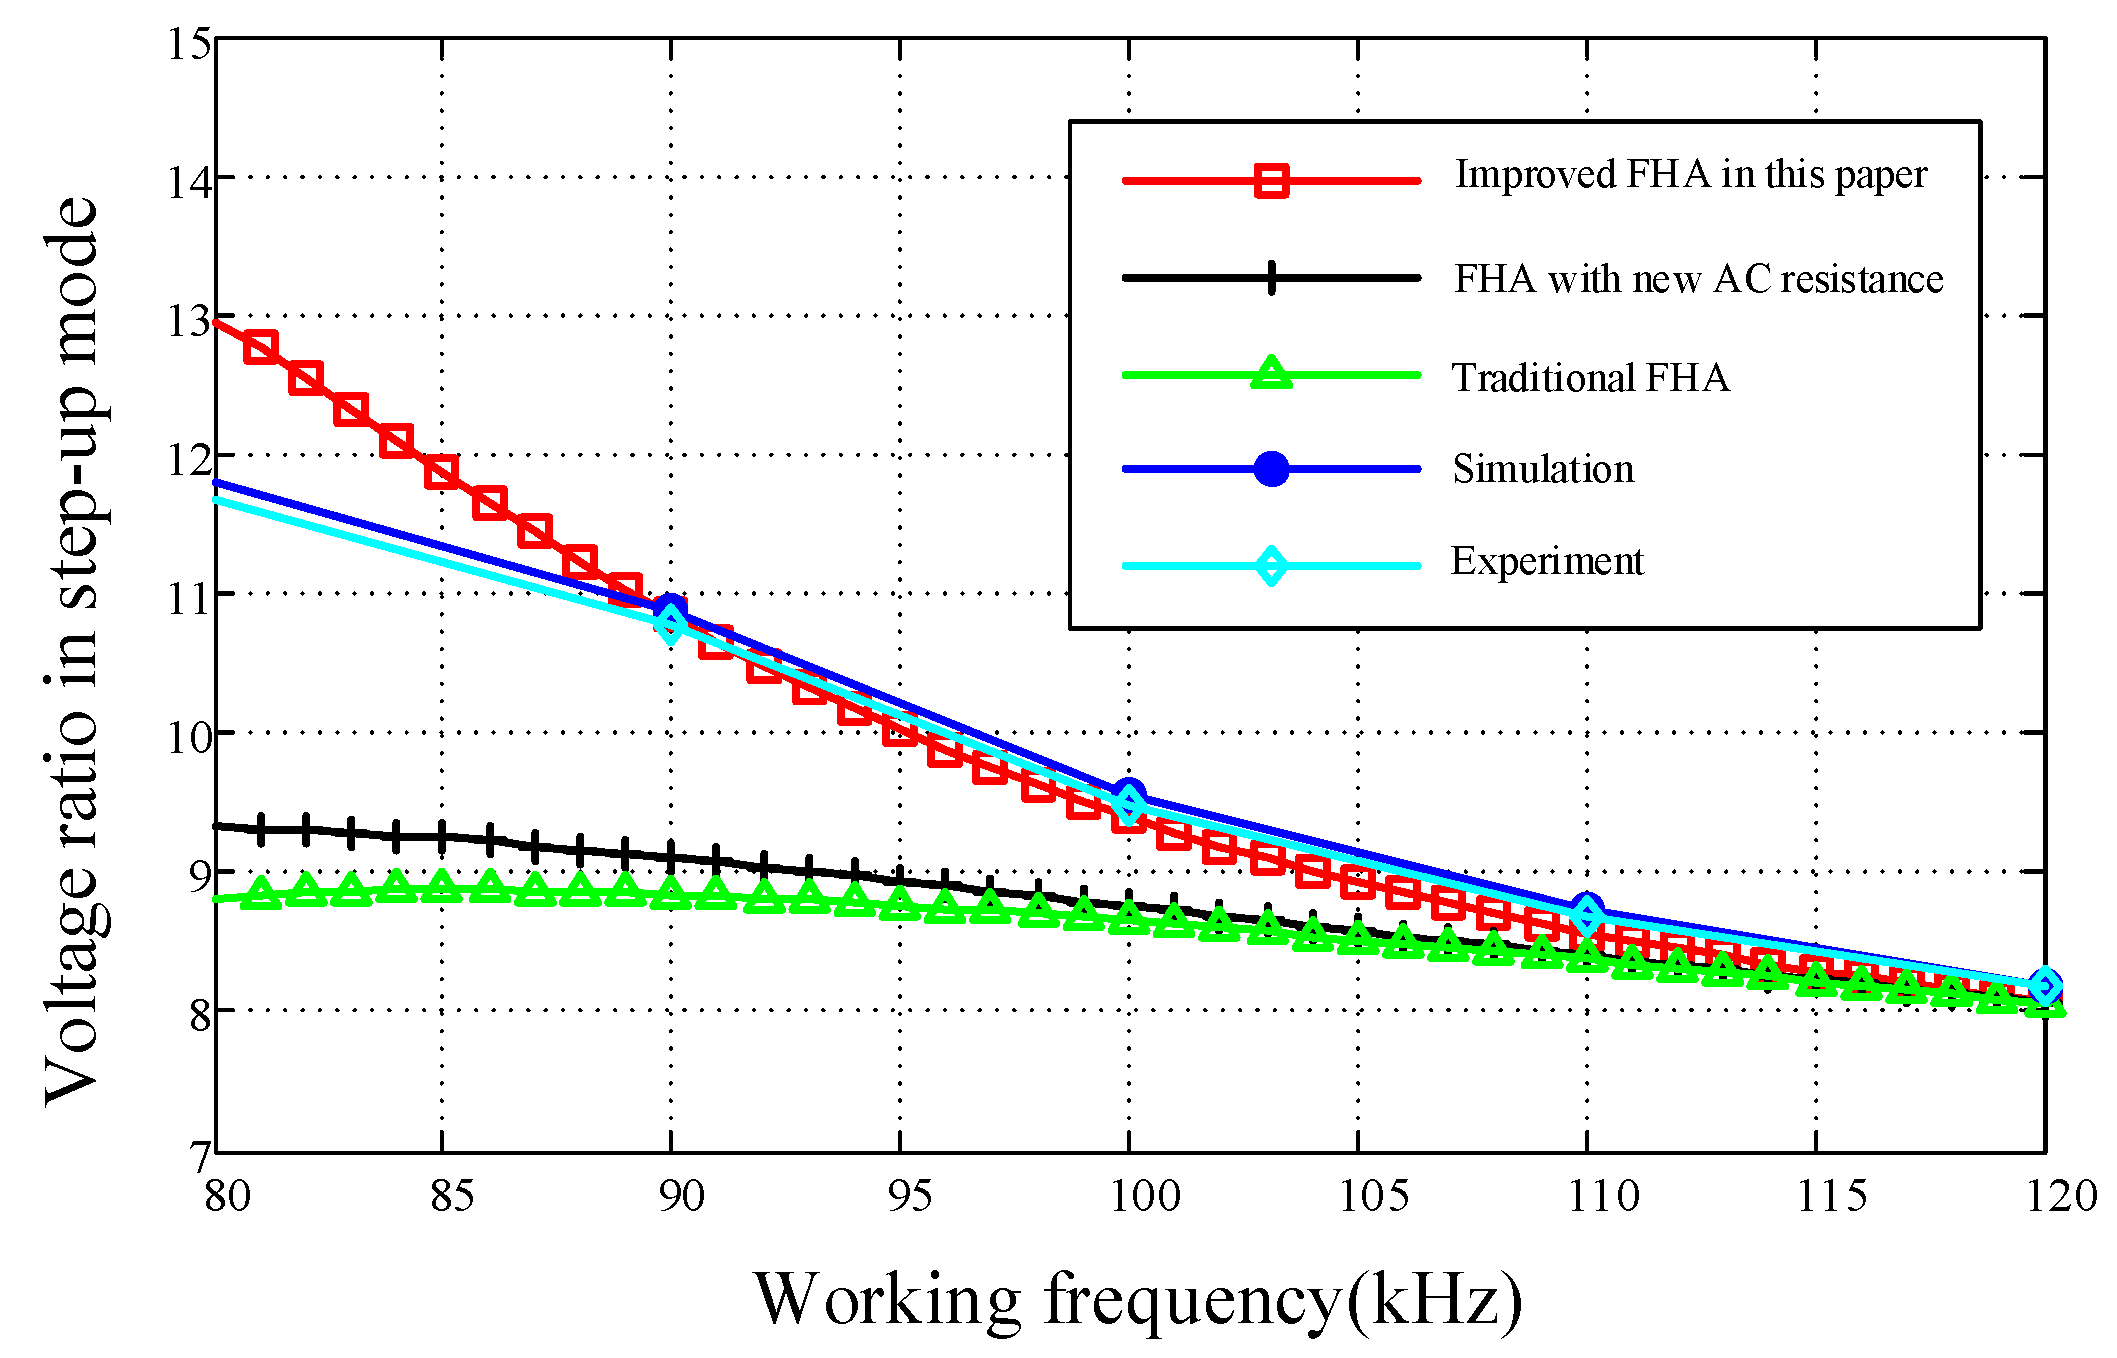
4. Comparison of Different Modeling Approaches

In order to prove the effectiveness of the improved FHA method proposed in this paper, the methods of the experiment, the improved FHA in this paper, traditional FHA, FHA with an improved model of the AC port equivalent resistance in [36] and simulation are used simultaneously. The simulation results almost coincide with the experimental results, which means that the simulation model is effective. The parameters of the experimental prototype are listed in Section 5. In Figure 13 and Figure 14, the errors between the experimental results and other methods are minimum around the main resonant frequency. The reason is that, when the DHC-LT converter is working around the main resonant frequency, resonant voltages and resonant currents in the tank are sinusoidal waveforms, and nearly no distortion exists. As the working frequency is reduced, the methods of traditional FHA and FHA with the improved model of the AC port equivalent resistance have a major error. However, when the phase angle of the AC load is considered, in Figure 13, from 80 kHz to 120 kHz, the biggest error between the improved FHA in this paper and the experimental results is around 9%, less than the other methods. Similarly, in Figure 14, from 80 kHz to 120 kHz, the biggest error between the improved FHA in this paper and the experimental results is around 10%. The working frequencies under the peak voltage gain in the improved FHA and experiments are almost the same. The theoretical work is verified by experiments and found to be in good agreement. Therefore, the improved FHA method in Section 3 of this paper is effective in describing the gain characteristics of the DHC-LT converter.

5. Experimental Results

A 2.5 kW experimental prototype was established in the lab. Table 1 shows its parameters. A DSP of TMS320F280048 is used to control the proposed DHC-LT converter. To realize ZVS, Lm1 and Lm2 are set comparatively small. The power is transmitted mainly from T1, so the ratio of T1 is mainly designed by the voltage gain of the converter. As a result, n1 is significantly smaller than n2. Compared to CDT-LC, the capacitance of Cr2 is much smaller than that of the LVS resonant capacitor, which is 4.5 μF in [29]. The MOSFET on the HVS, SRC60R022FB, has a fast-recovery body diode, which is an advantage when power is transmitted from the LVS to the HVS. The MOSFET on the LVS, FDP2D3N10C, is used as a synchronous rectifier to attain higher efficiency.

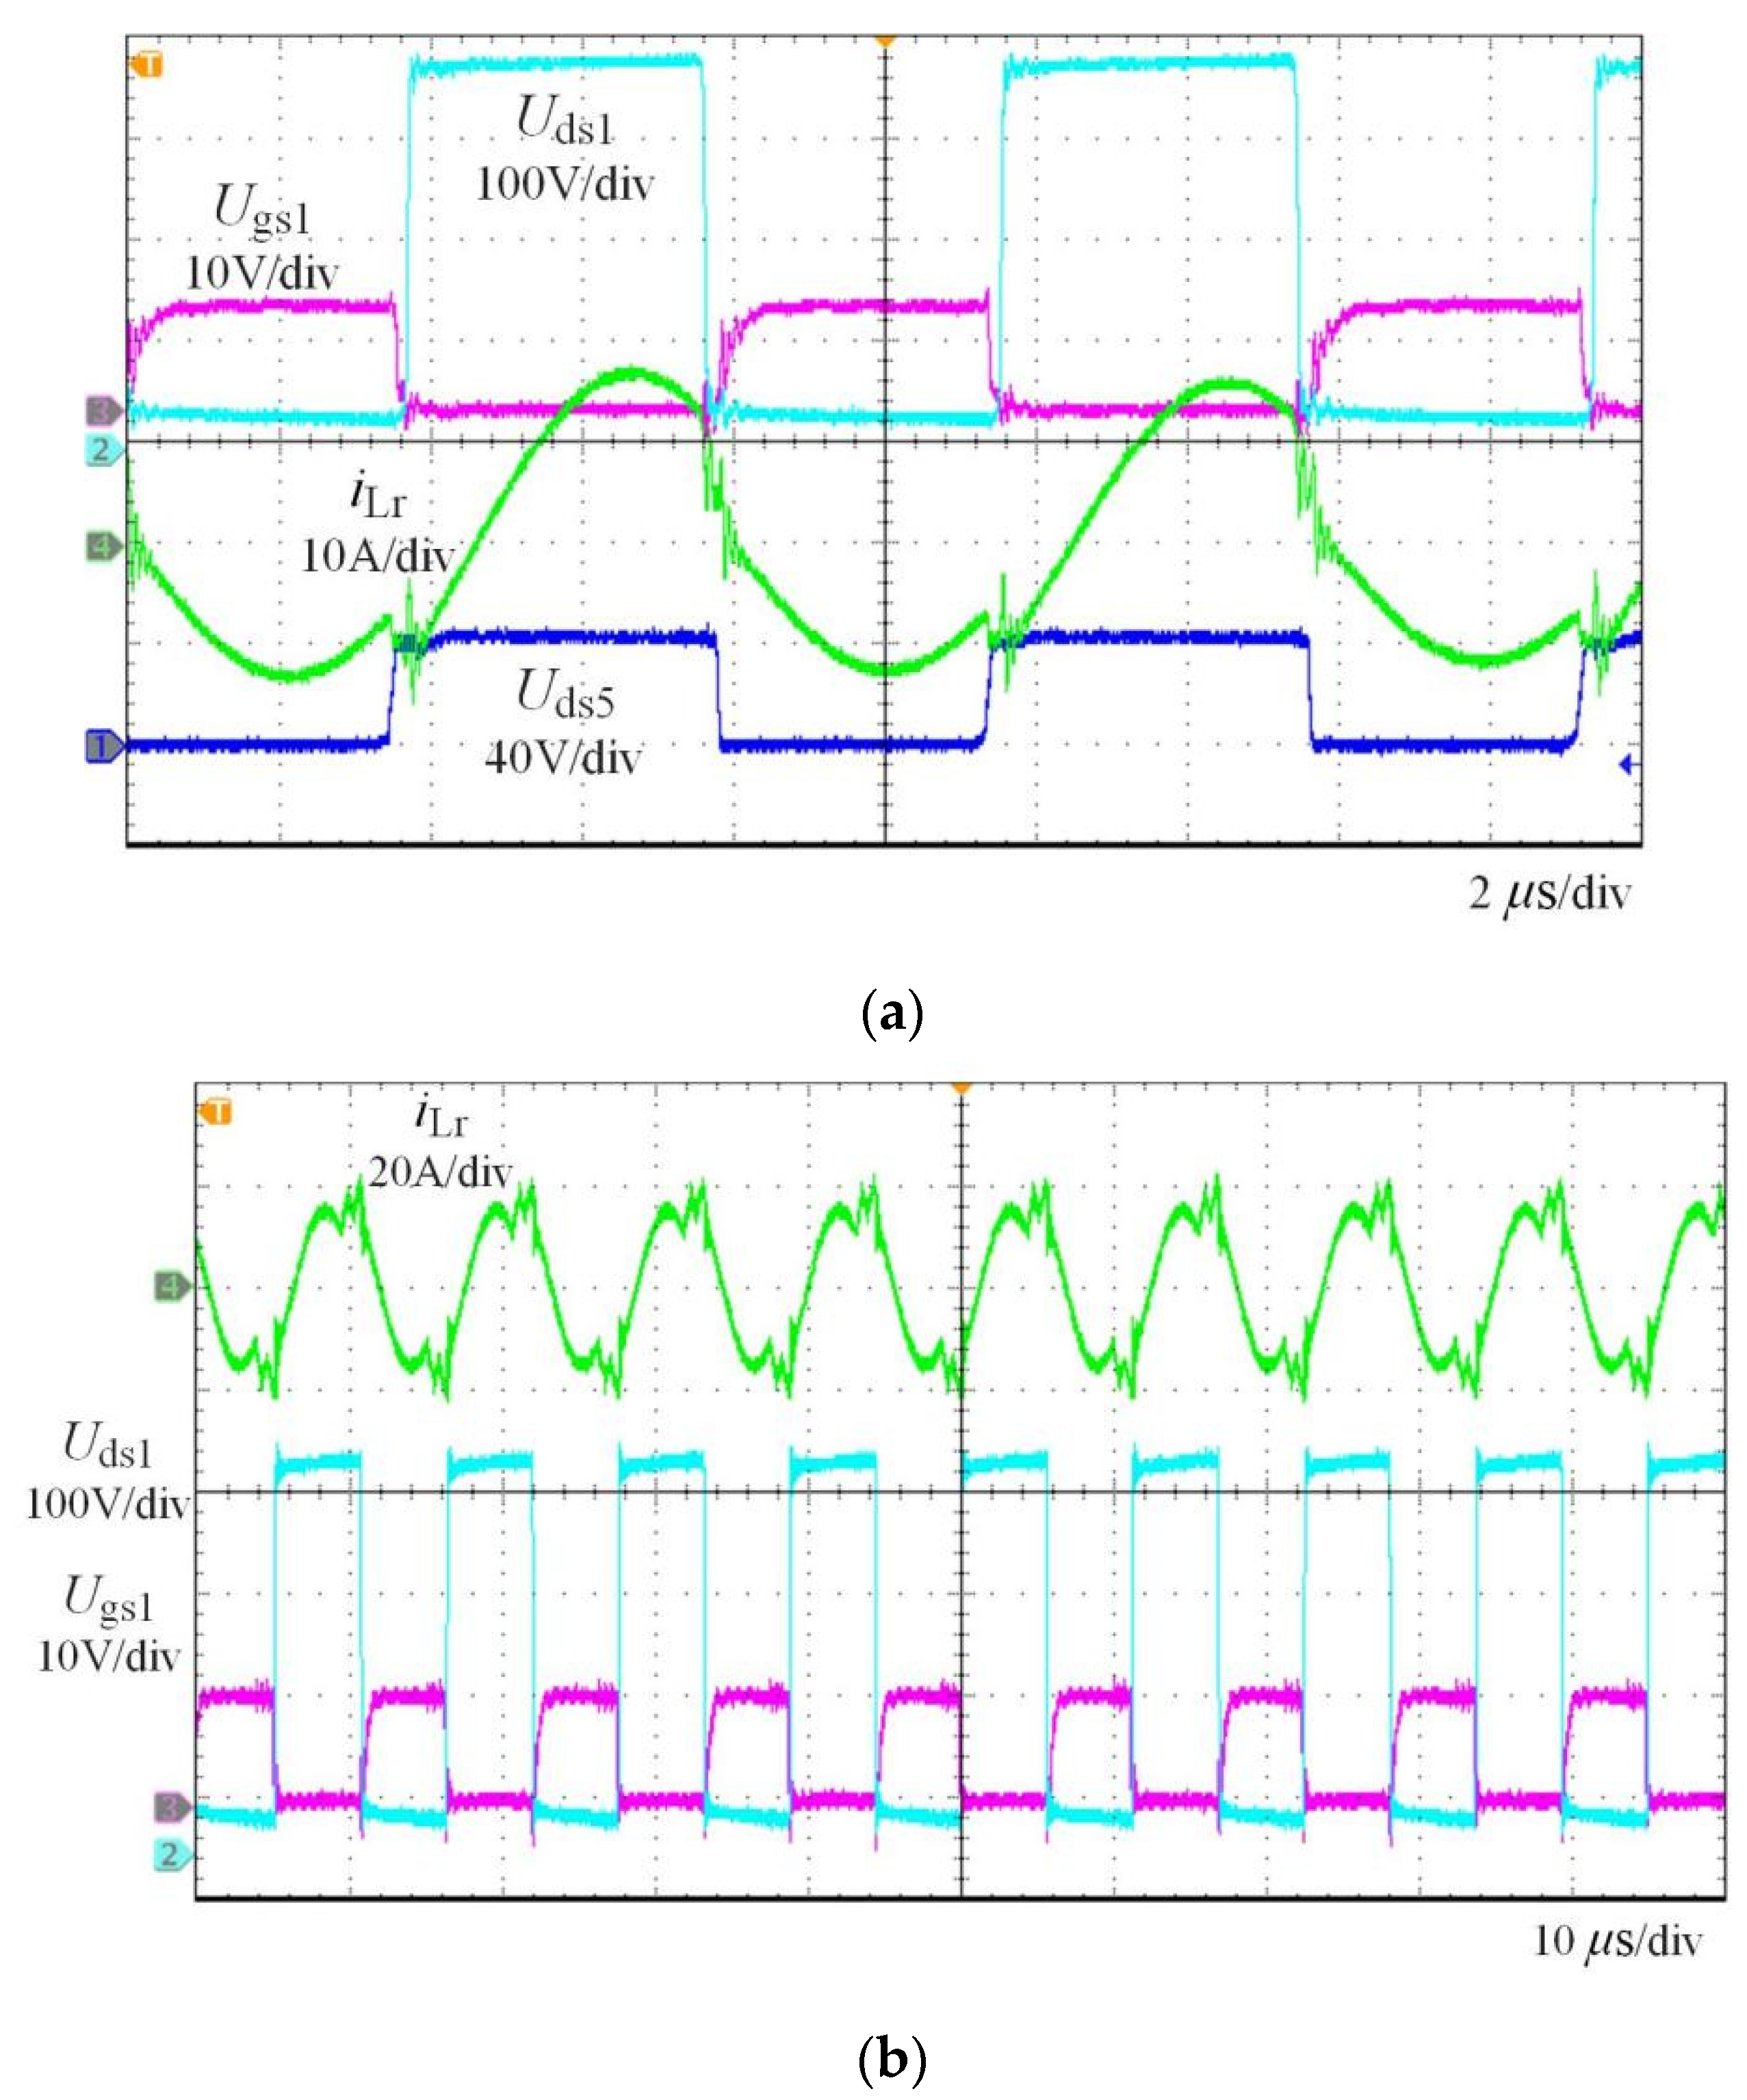
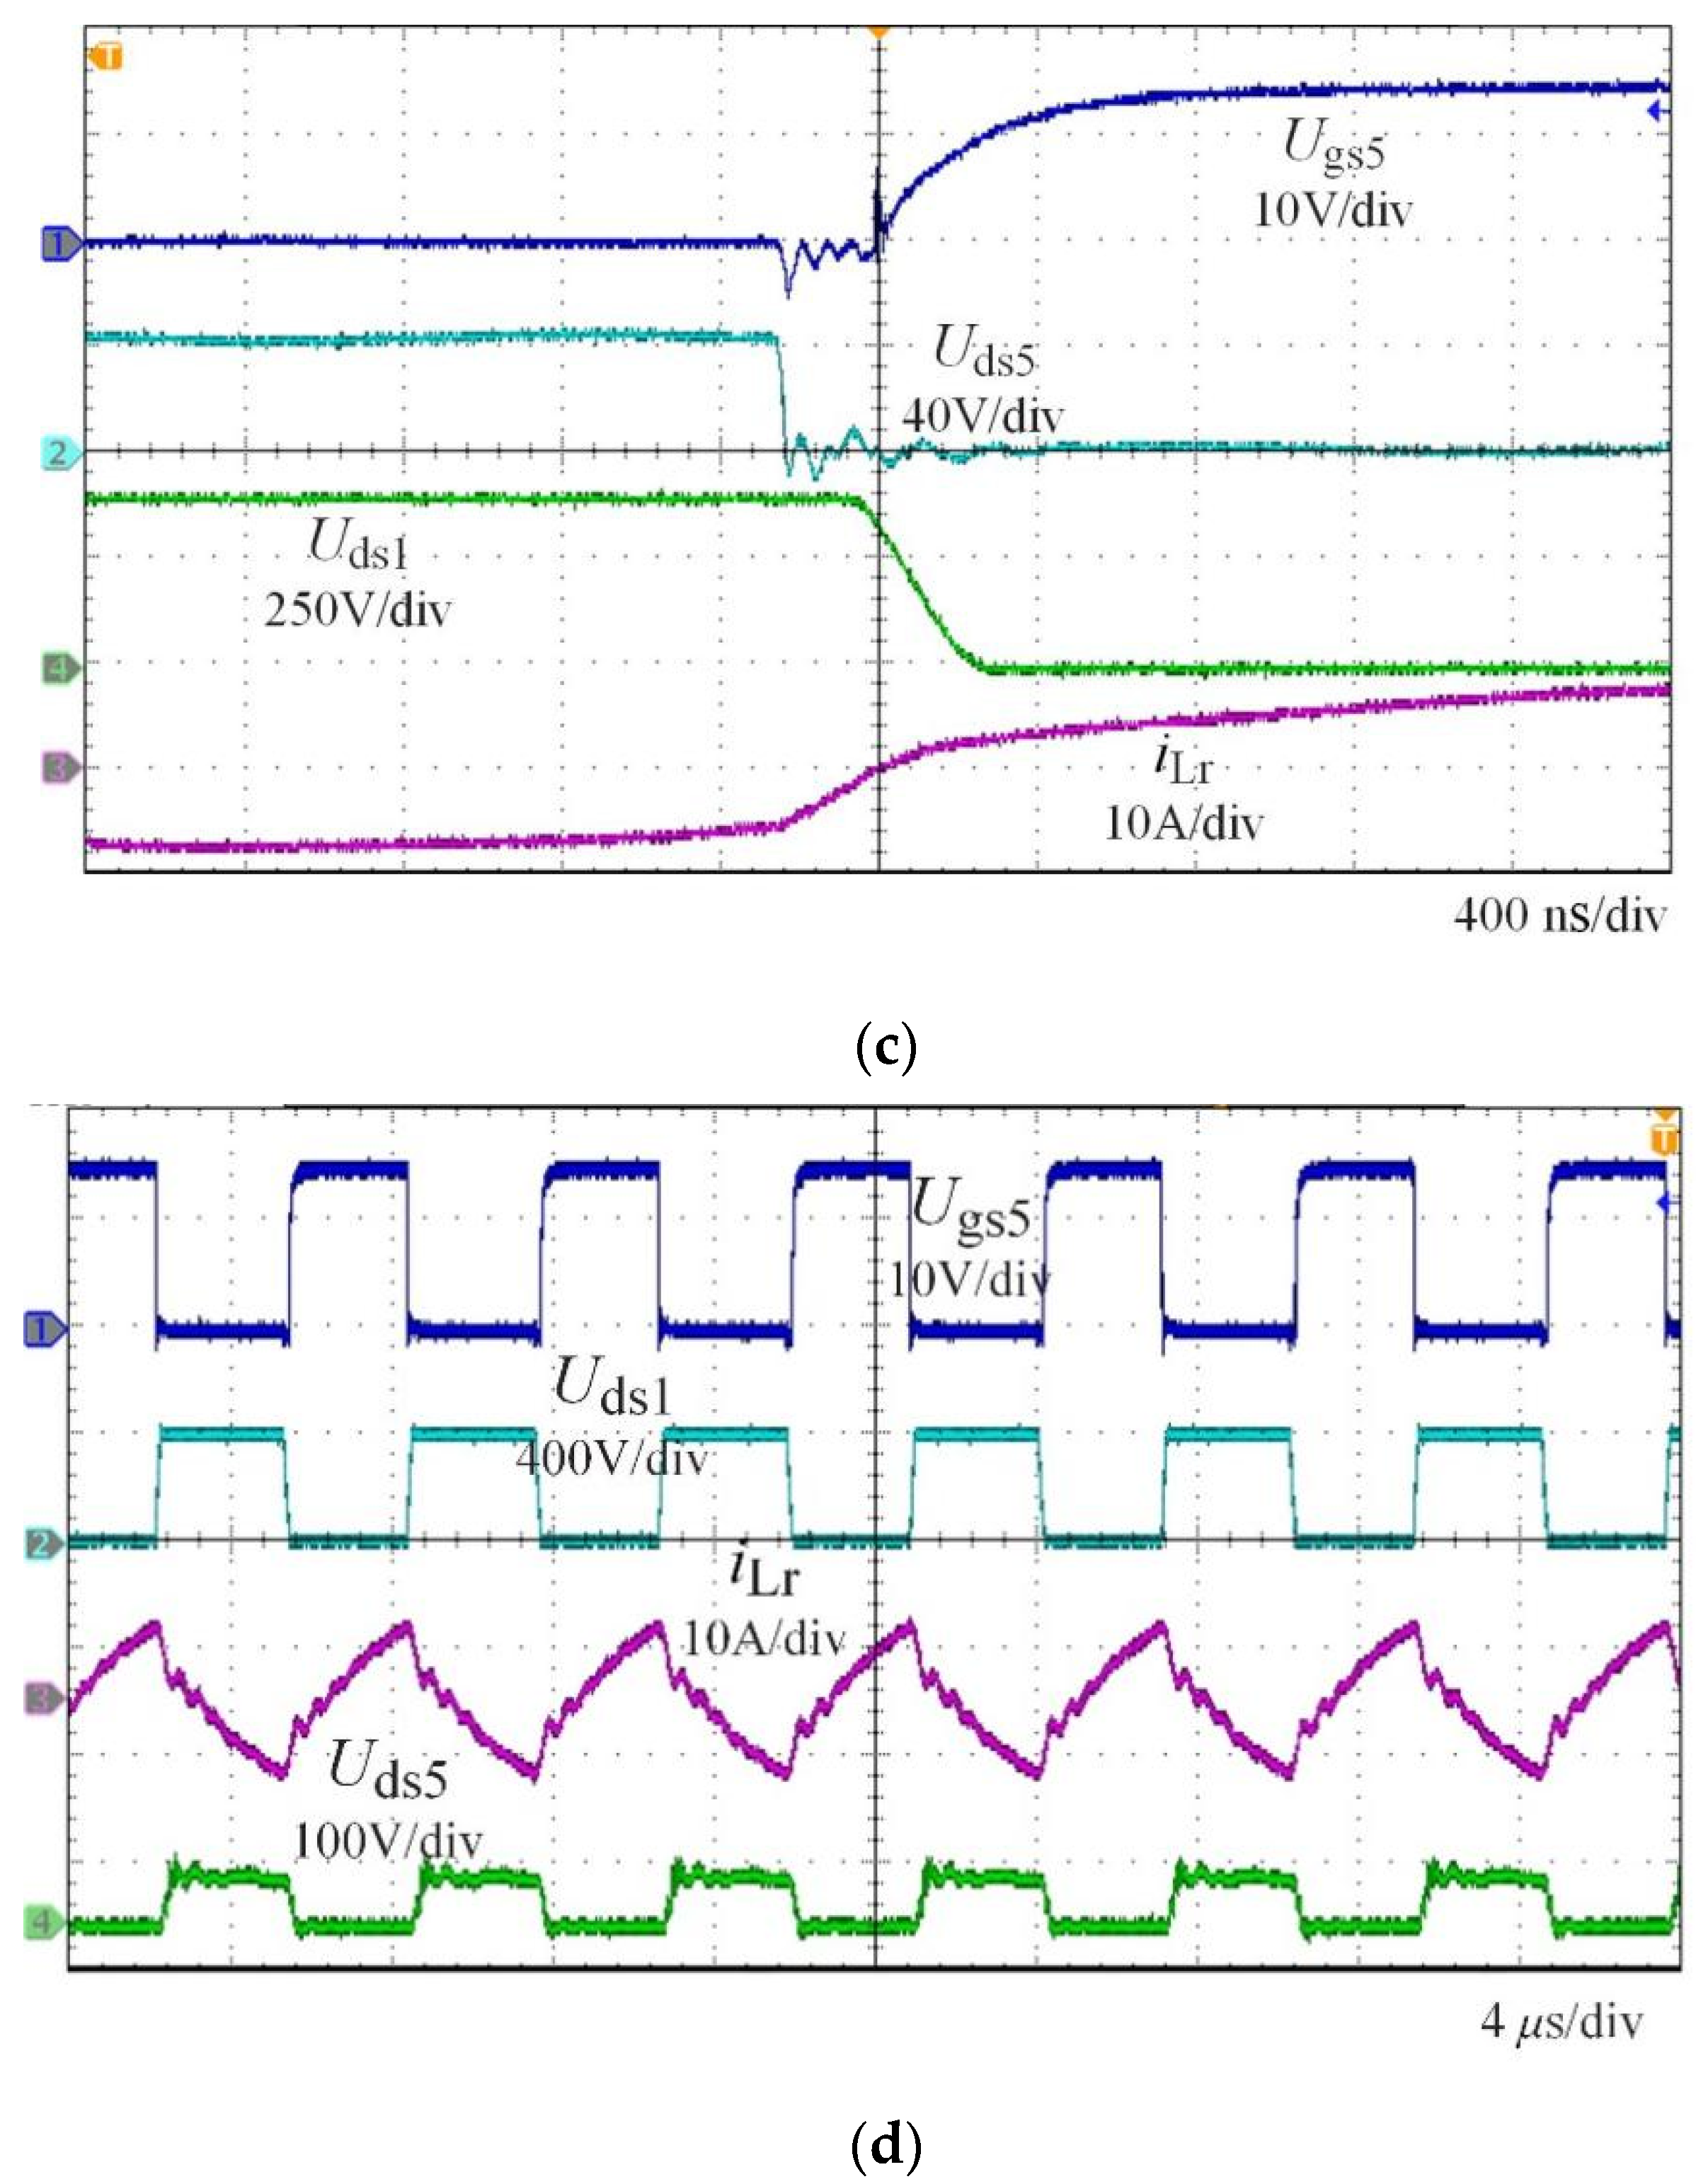
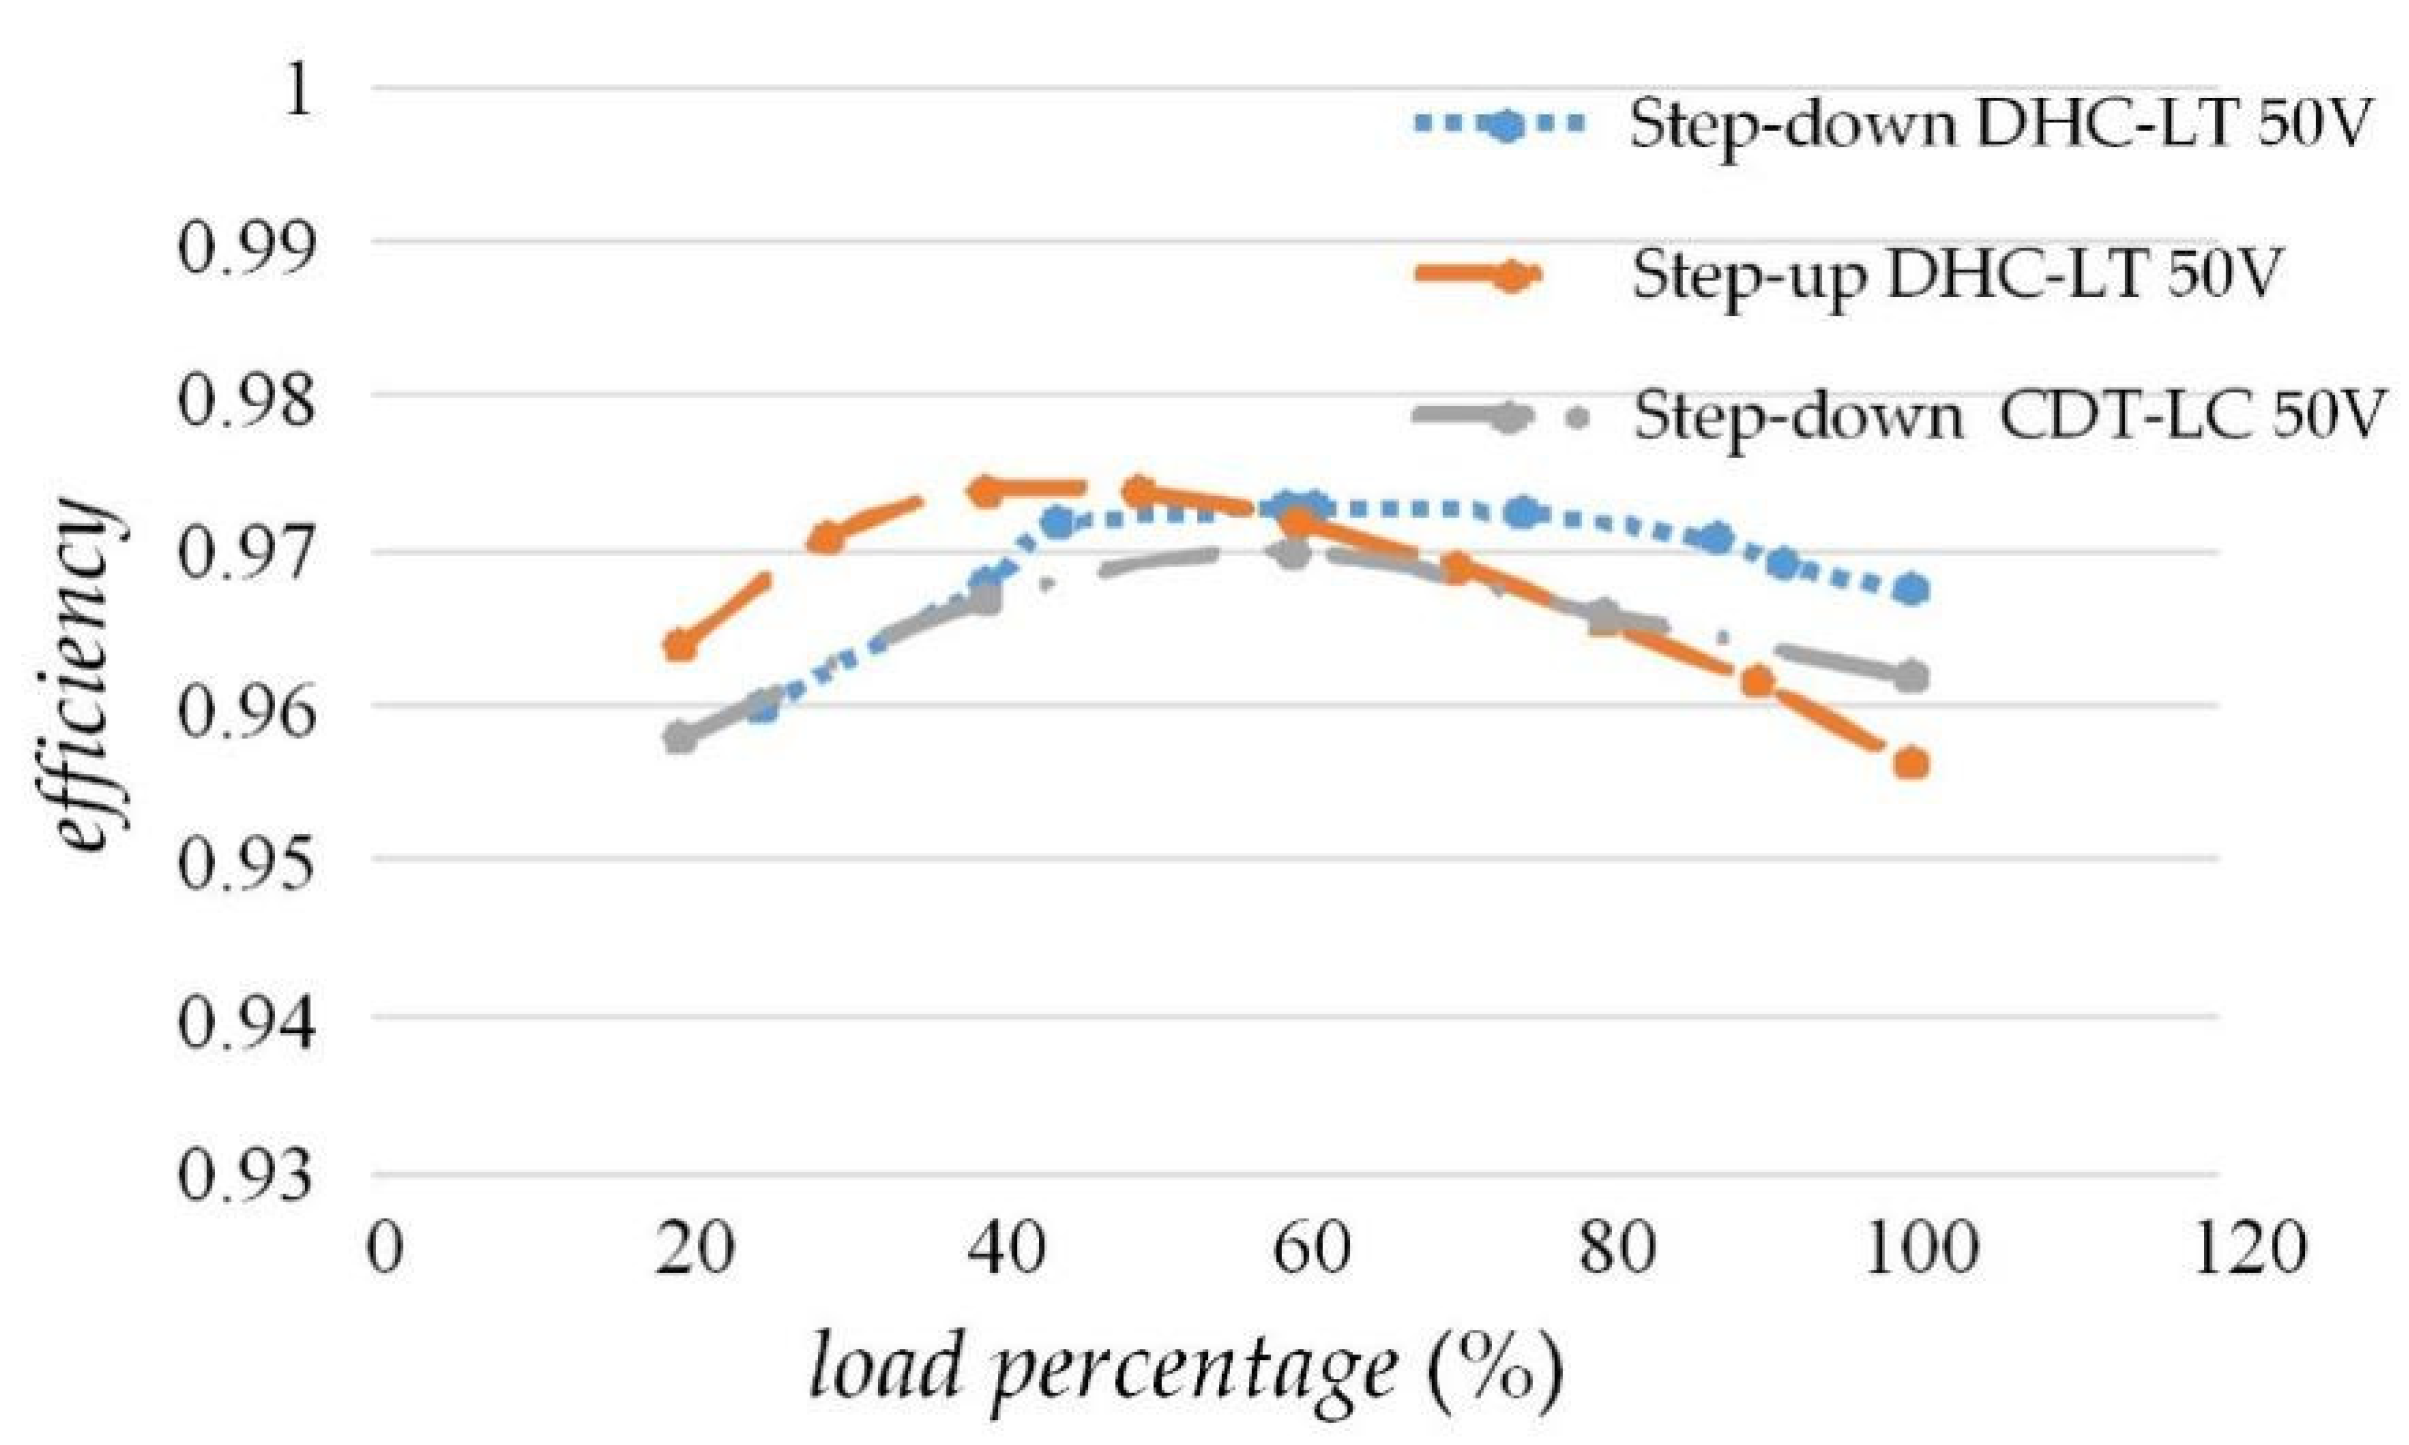
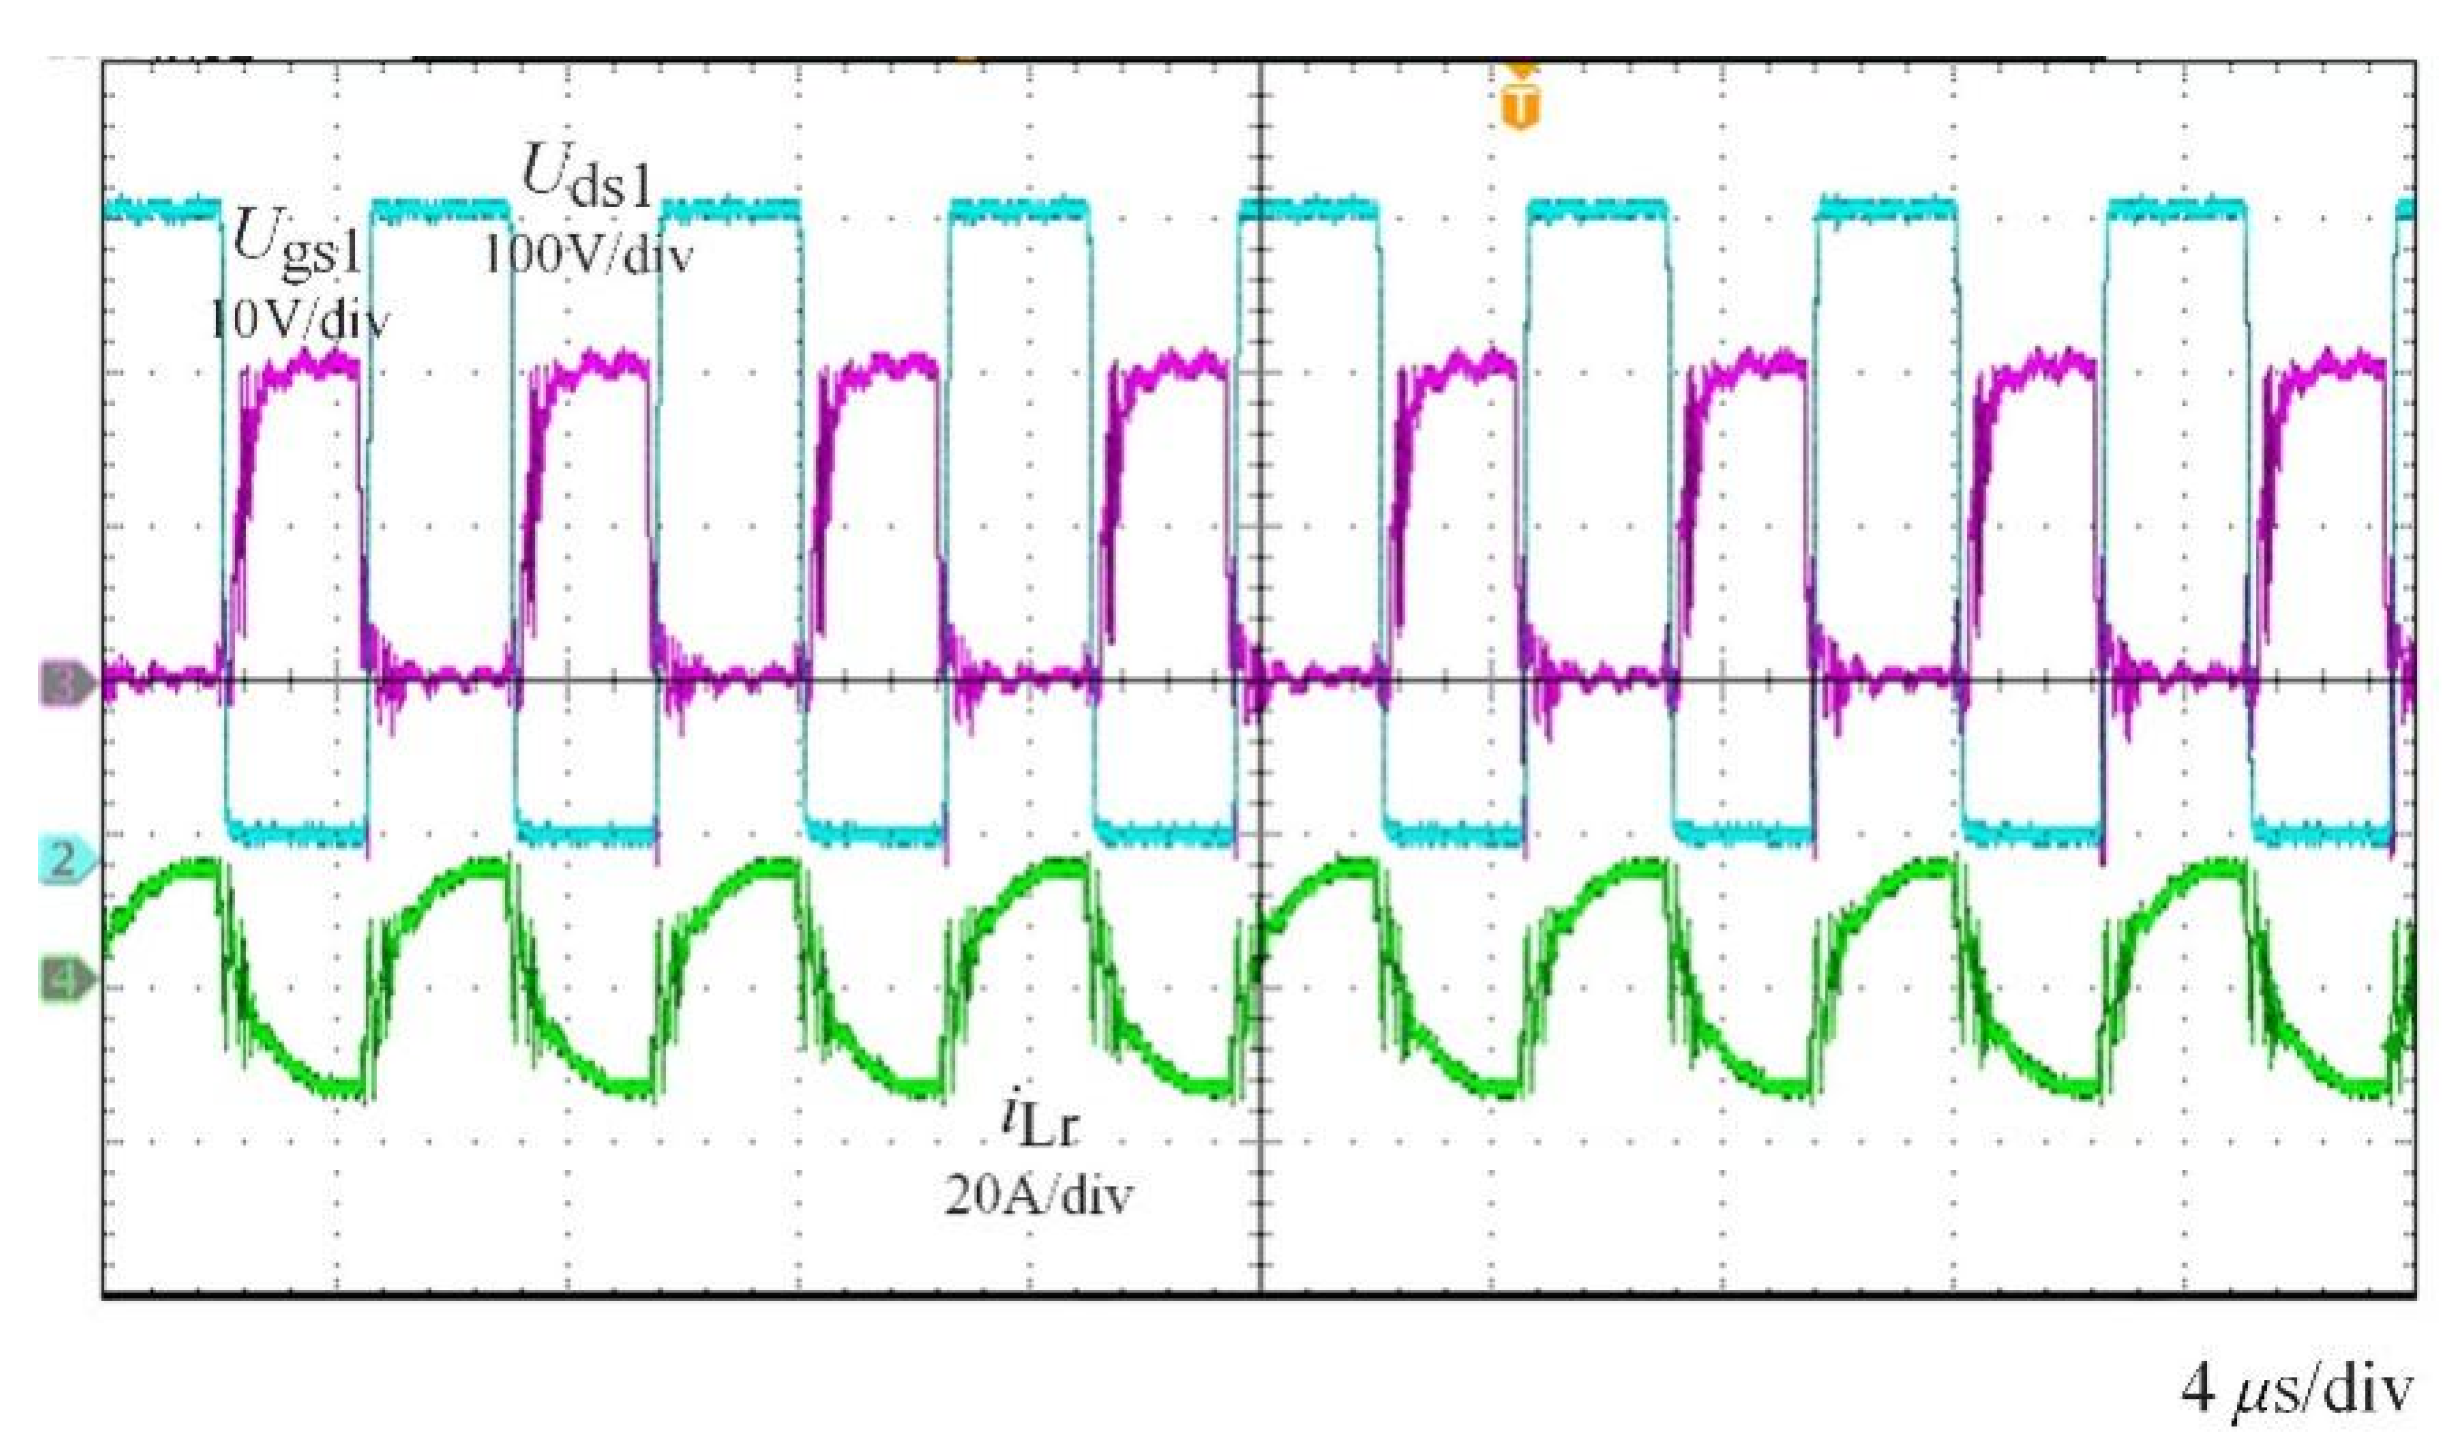
5.1. Experimental Results of Steady-State Operation

Figure 15 shows the experimental results of the prototype converter. In Figure 15, Ugs1 is the drive signal of M1, Uds1 is the D-S voltage of M1, Ugs5 is the drive signal of M5, Uds5 is the D-S voltage of M5 and iLr is the current of the resonant inductor.
Figure 15a,b shows the experimental results in step-down mode. In Figure 15a, the working frequency is around 125 kHz, which is the main resonant frequency. Therefore, the currents in the resonant tank are almost sinusoidal, which is determined by the designed resonant network. In Figure 15b, the working frequency is around 90 kHz, and secondary resonance happens when the main resonance ends.
Figure 15c,d shows the experimental results in step-up mode. In Figure 15c, ZVS is realized. Uds5 decreases to 0, before Ugs5 comes. The dead time of 300 ns in this prototype is wide enough for both the HVS and LVS power switches, while the efficiency is not affected. In Figure 15d, as the working frequency is higher than the main resonant frequency, secondary resonance does not exist, which is consistent with Section 2.2.2.
The efficiency curves of the DHC-LT converter are shown in Figure 16, which were obtained by experiments. In step-down mode, the peak efficiency is 97.3% when the LVS voltage is 50 V, while the efficiency with 100% load is 96.8%. In step-up mode, the peak efficiency is 97.4% when the LVS voltage is 50 V, while the efficiency with 100% load is 95.7%. The resonant capacitor Cr2 is moved from the LVS to the HVS, and the heat it produces decreases. As a result, it can be seen that the efficiency of the 2.5 kW DHC-LT converter is higher than that of the 2.5 kW CDT-LC in step-down mode [29]. The advantage of DHC-LT is shown through comparison.

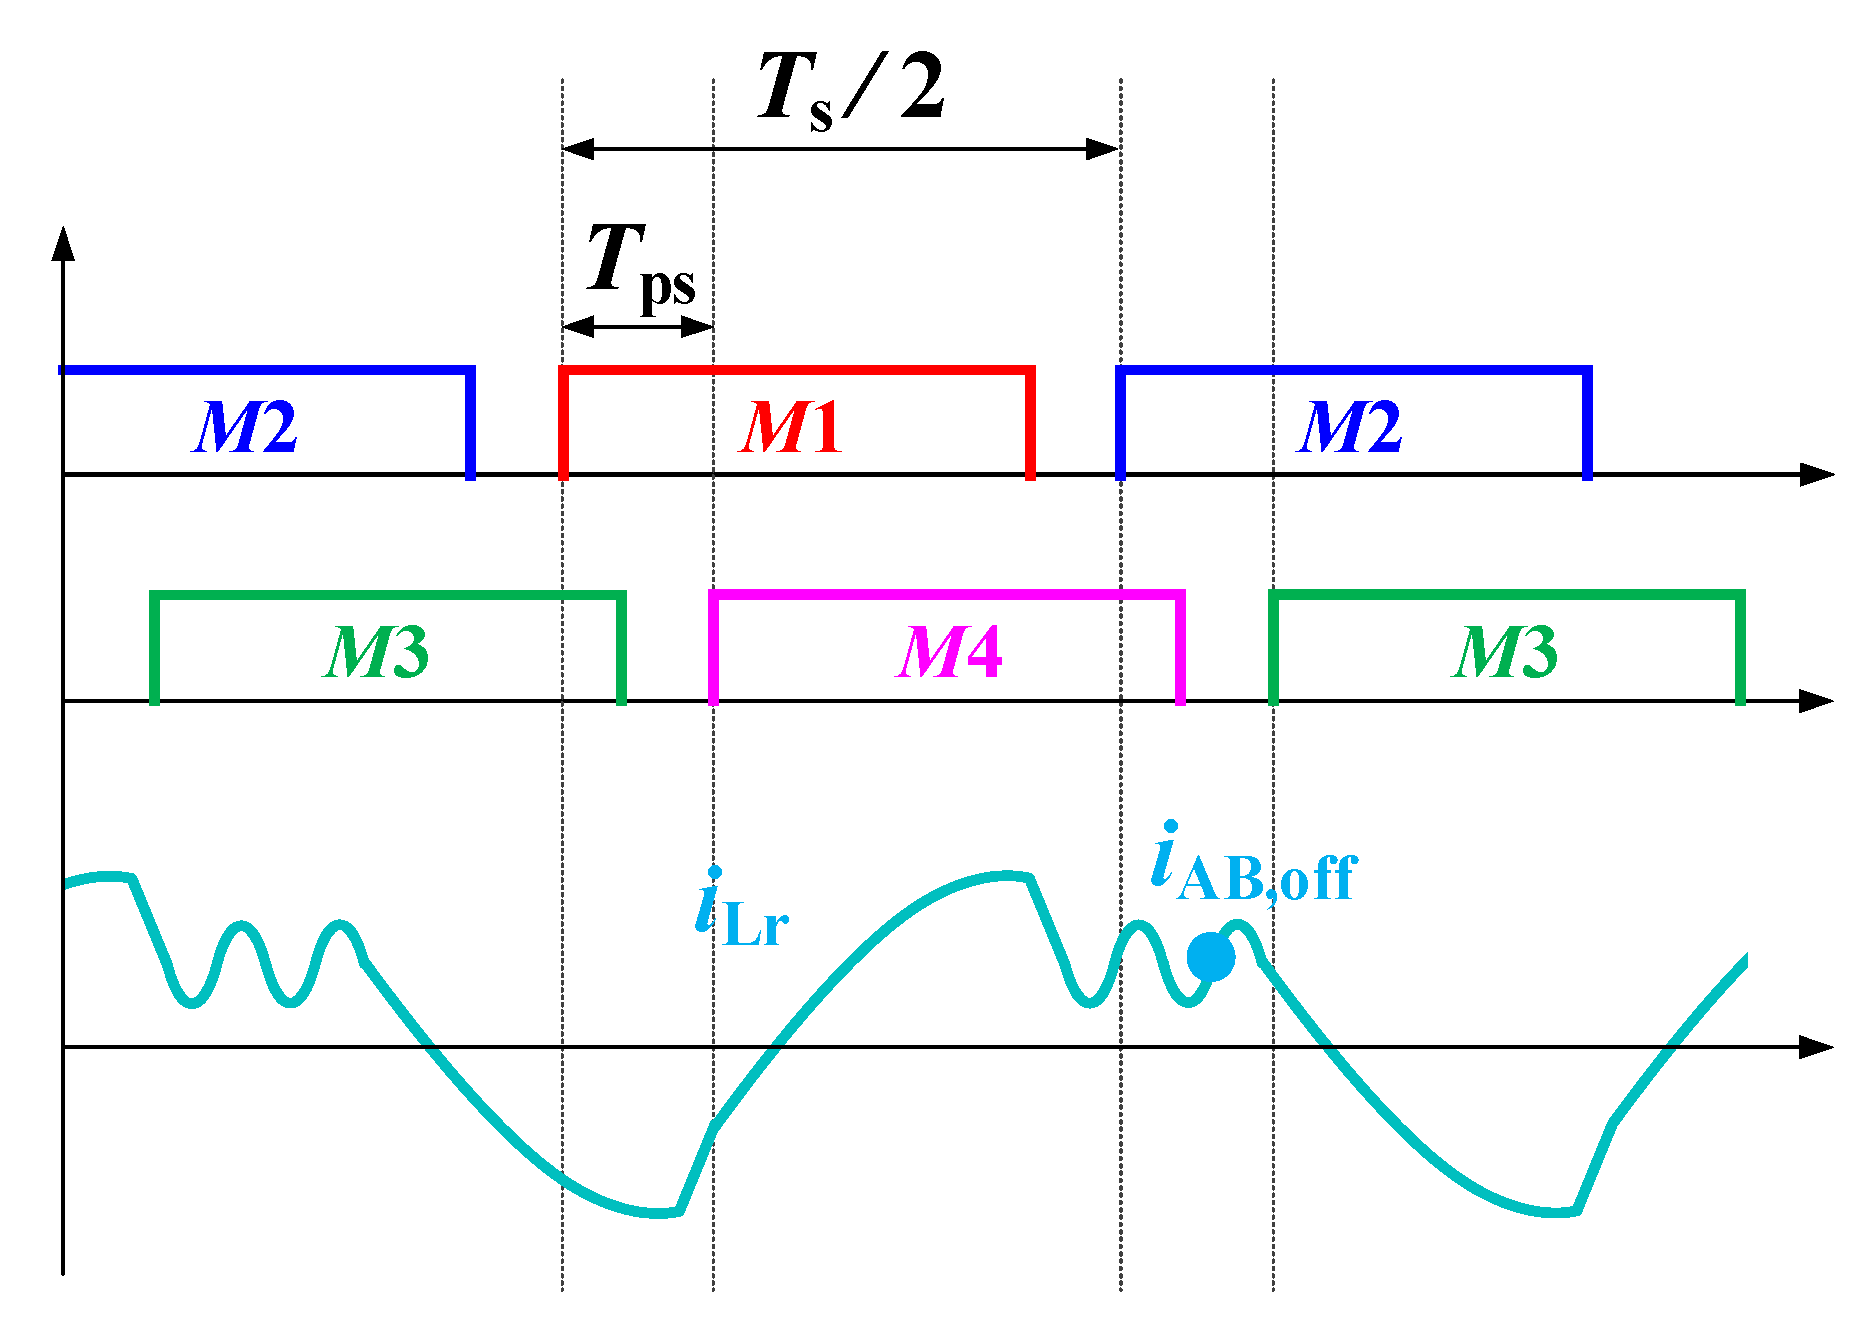
5.2. Discussion of Phase-Shift Control

In order to reduce the output voltage, broaden the output voltage range and provide a ripple-free charging current for batteries, a fixed-frequency phase-shift strategy is introduced according to the DHC-LT converter [38]. When the voltage gain is high, traditional PFM control is adopted. The gate signals of M1 and M4 are the same. M1 and M2 conduct alternately, as do M3 and M4. When the voltage gain decreases, the switching frequency increases until it reaches its upper limit, 200 kHz. Then, as shown in Figure 17, when the fixed-frequency phase-shift strategy is adopted in step-down mode, the switching frequency remains constant, and the phase angle between gate signals of M1 and M4, M2 and M3 increases. When the phase angle increases, the RMS of the input voltage of resonant tank uAB decreases. As a result, the voltage gain is further reduced compared to eht traditional PFM control.
In Figure 17, as the turn-off current of the leading leg, M1 and M2, is higher than that of the lagging leg, M3 and M4, in order to guarantee ZVS of four MOSFETs, the dead time of the HVS MOSFETs should meet the requirement
t dt _ SD 4 0 U H C oss _ H d u AB i AB , off
iAB,off can be obtained when the voltage of Cr1 and Cr2 is 0.
i AB , off = U H ( T s 2 T ps ) 2 ( L r + L m 1 L m 2 L m 1 + L m 2 )
Figure 18 shows the waveforms using the fixed-frequency phase-shift strategy in step-down mode. iLr decreases when MOSFETs on the leading leg turn off and MOSFETs on the lagging leg turn on. The working frequency reaches its upper limit, 200 kHz. ZVS is realized as the phase-shift angle is small.

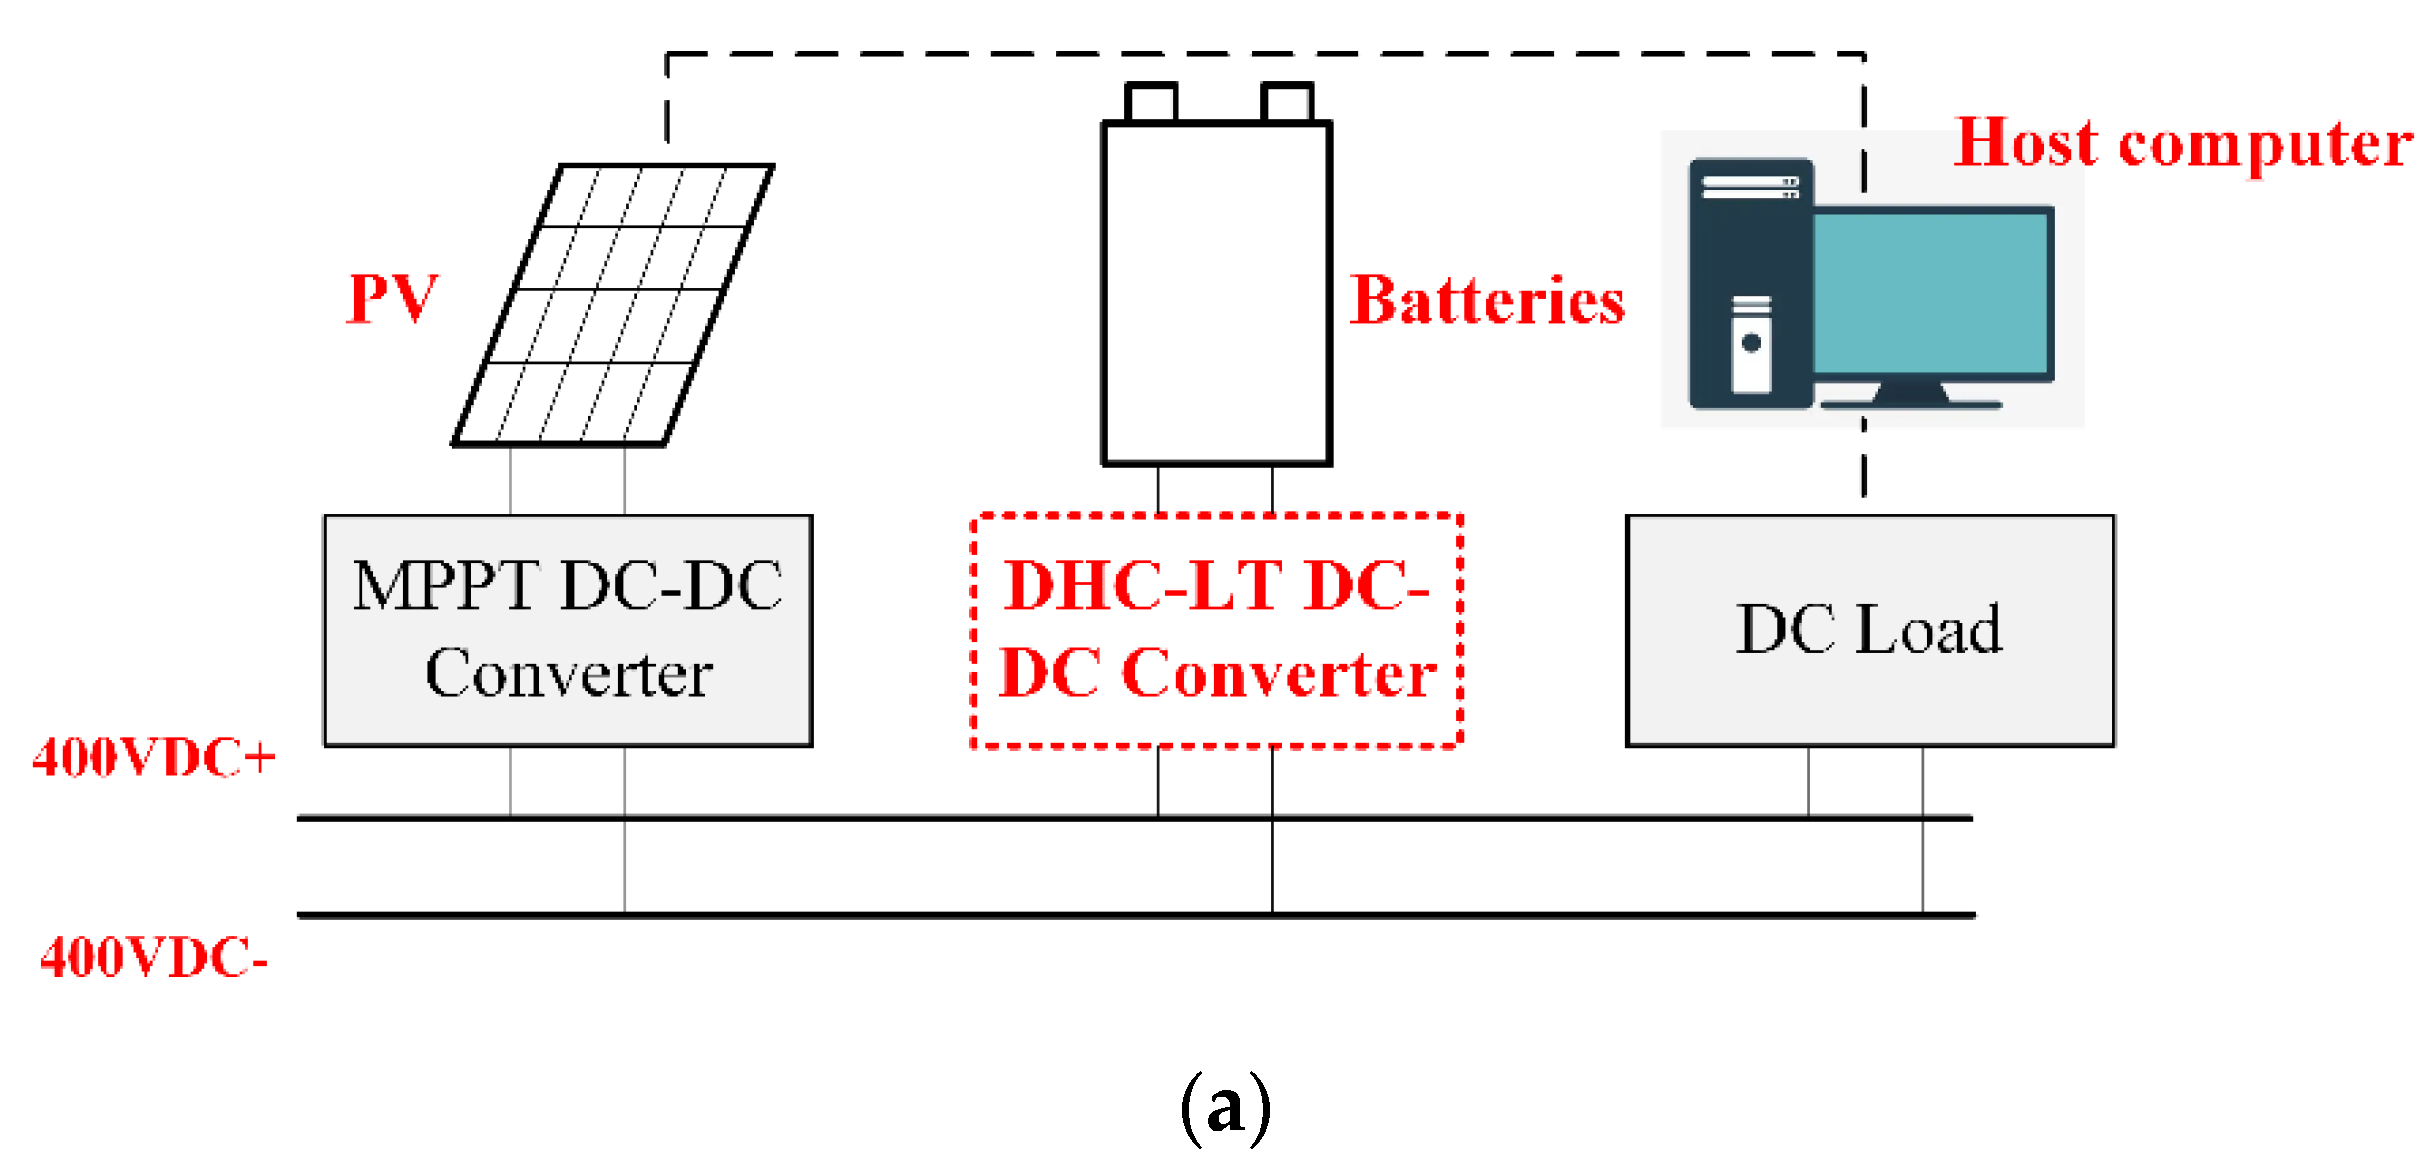
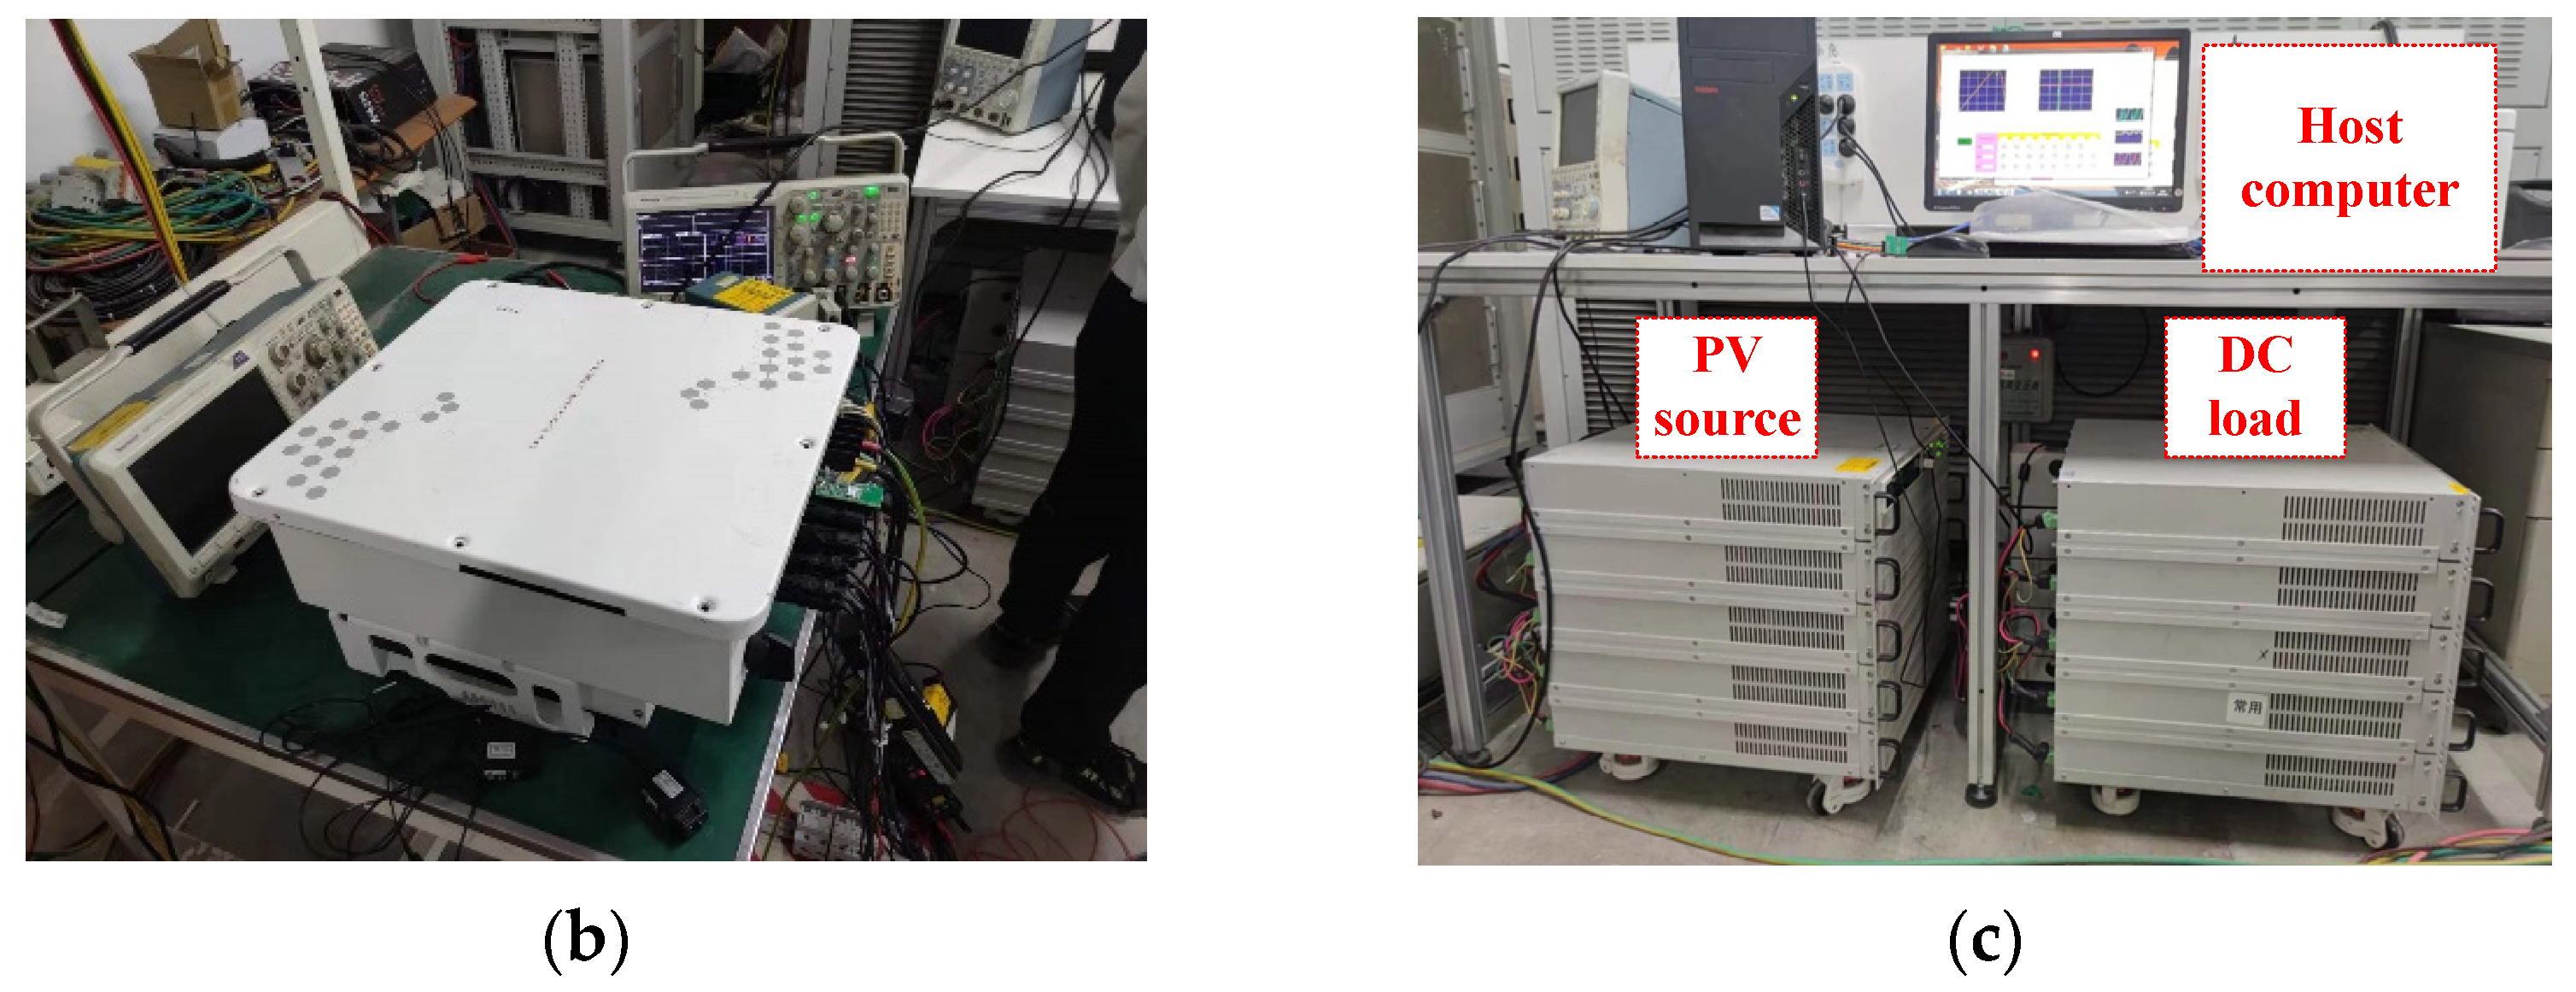
5.3. Verification in Battery/PV System

To verify the proposed DHC-LT converter in a battery/PV system, the battery/PV test system diagram is shown in Figure 19. In Figure 19a, the maximum power point tracking (MPPT) DC-DC converter and the DHC-LT bidirectional DC-DC converter transfer the energy from the PV and batteries to the 400 V DC bus. The power PV generated is stored in batteries and expended in the DC load. When the DC load is heavier than the power PV generated, the batteries start to release power to the DC bus and the DC load. Figure 19b shows the prototype of the DC power system, which consists of the MPPT DC-DC converter, the DHC-LT DC-DC converter and their control system. In Figure 19c, one DC source is used to simulate PV, while the other electronic load is used as the DC load on the 400 V bus. They are both controlled by the host computer on the desk.
Waveforms in the battery/PV test system are shown in Figure 20. Figure 20a,b shows the variation of battery voltage Ubat and battery current Iba, when the DC load changes. Ubat changes little because the battery voltage is mainly determined by the ideal voltage source inside. Figure 20c shows the waveforms, and when the illumination intensity decreases, the PV current Ipv decreases as a result. Then, the MPPT arithmetic works, Ipv increases and PV voltage Upv decreases to reach the new maximum power point.

6. Conclusions

A novel 400 V–50 V bidirectional DHC-LT converter is proposed in this paper. The topology structure and operation principles are discussed in detail. By moving the resonant capacitor from the LVS to the HVS, the volume and the conduction loss of the DHC-LT converter are decreased, the ZVS + ZCS characteristics are reserved, and a wide voltage range is obtained as well, which is proved by simulation. The Bode plot of the DHC-LT converter shows the converter is robust and suitable for DC power use of buildings and microgrids. To increase the accuracy of the FHA in the DHC-LT converter, the error factor of the FHA in resonant converters is analyzed, which are the AC output resistance and the phase angle. Then, an equivalent AC impedance model of the rectifier valid for DCM is proposed. By exacting FHA components from the output voltage and rectifier current, the phase angle of the AC impedance is taken into consideration. Therefore, the behavior in the resonant tank is described more precisely; the biggest relative error of voltage gain in step-down mode is around 9%, and that in step-up mode is around 10%, which is clearly lower than that of traditional FHA. The improved FHA method is proved to be effective. Then, a 2.5 kW DHC-LT prototype is established in the lab. The waveforms in CCM and DCM are presented, and the operation principles are confirmed. The peak efficiency is 97.3% in step-down mode, while the peak efficiency is 97.4% in step-up mode. By moving the resonant capacitor, the efficiency increases compared to the CDT-LC. A fixed-frequency phase-shift strategy is adopted to reduce the voltage gain, while ZVS is reserved by setting the dead time and the phase-shift angle reasonably. Finally, a battery/PV test system is established to verify the effectiveness of the DHC-LT converter in DC buildings and community microgrids.

Author Contributions

Conceptualization, methodology, validation and writing—original draft preparation are done by S.Z. Writing—review and editing and supervision are done by X.W. Validation is done by Z.Z. Software is done by X.Z. All authors have read and agreed to the published version of the manuscript.

Funding

This research received no external funding.

Conflicts of Interest

The authors declare no conflict of interest.

Appendix A

1.
Open-loop transfer function of the DHC-LT converter.
u ^ L ω ^ s = 2.64 × 10 12 s 11 + 0.032 s 10 + 26488.05 s 9 + 2.64 × 10 11 s 8 + 4.96 × 10 17 s 7 + 3.02 × 10 23 s 6 + 1.28 × 10 30 s 5 + 1.67 × 10 35 s 4 + 1.00 × 10 42 s 3 + 1.41 × 10 47 s 2 + 1.78 × 10 53 s + 2.81 × 10 58 s 11 + 1.42 × 10 6 s 10 + 4.21 × 10 12 s 9 + 4.56 × 10 18 s 8 + 5.33 × 10 24 s 7 + 4.53 × 10 30 s 6 + 2.47 × 10 36 s 5 + 1.57 × 10 42 s 4 + 3.52 × 10 47 s 3 + 1.74 × 10 53 s 2 + 5.14 × 10 56 s + 1.96 × 10 61
2.
Derivation of UCD and ICD in step-down mode.
In Interval C of step-down mode, iAB is approximately constant. Its value remains near the value of iAB in Tmain and iAB(Tmain). Because the calculation of iAB(Tmain) is complicated, it is estimated by half of the peak input current in the HVS resonant tank.
To facilitate the calculation, MrSD is defined as the voltage ratio at the main resonant frequency in step-down mode. The MrSD is obtained by the traditional FHA method when the switching frequency is equal to the main resonant frequency.
M rSD = U L U H
In Interval C, uCr2 remains almost unchanged.
u Cr 2 ( T main ) = u Cr 2 ( T s / 2 ) = u Cr 2 ( 0 )
C r 2 [ u Cr 2 ( T main ) - u Cr 2 ( 0 ) ] = 0 T main i Cr 2   d t = 1 n 1 0 T main i CD   d t = U L T s 2 n 1 R oSD
Thus
u Cr 2 ( T main ) = u Cr 2 ( T s / 2 ) = U L T S 4 n 1 C r 2 R oSD
0 T main i CD   d t = U L T s 2 R oSD
In Interval C, iLm1 and iLm2 change a little, and iLr is small, so the voltage of magnetizing inductance Lm1 and Lm2 in the HVS, uLm1(Tmain) and uLm2(Tmain), can form the following equations.
{ u Lm 2 ( T main ) u Lm 1 ( T main ) = u Cr 2 ( T main ) u Lm 1 ( T main ) L m 1 = u Lm 2 ( T main ) L m 2
uLm1(Tmain) and uLm2(Tmain) can be expressed by
{ u Lm 1 ( T main ) = ( L m 2 / L m 1 1 ) u Cr 2 ( T main ) u Lm 2 ( T main ) = L m 2 ( L m 2 / L m 1 + 1 ) / L m 1 · u Cr 2 ( T main )
The output voltage of the resonant tank in Tmain is
U SD = 1 n 1 u Lm 1 ( T main ) + 1 n 2 u Lm 2 ( T main )
As a result, uCD can be described as
u CD ( t ) = { U L   U SD     0 t < T main T main t 1 / ( 2 f s )
iCD can be described as
i CD ( t ) = { I CD   sin ( 2 π f r t ) 0     0 t < T main T main t 1 / ( 2 f s )
3.
Derivation of UAB and IAB in step-up mode.
Just like List 2 of the Appendix A, it can be obtained that
u Cr 1 ( T main ) = u Cr 1 ( T s / 2 ) = 1 2 C r 1 0 T main i AB   d t = U H T S 4 C r 1 R oSU
To facilitate the calculation, MrSU is defined as the voltage ratio at the main resonant frequency in step-up mode. The MrSU is obtained by the traditional FHA method when the switching frequency is equal to the main resonant frequency in step-up mode.
M rSU = U H U L
The average value of the input current is estimated by
i CD _ avg = U H M rSU R oSU
The peak value of the input current is
i CD _ pk = 2 k R _ a U H M rSU R oSU
KR_a is 1.1, which transforms the average value into an RMS value.
k R _ a = 1.1
Thus, iCD(Tmain) is estimated by half of iCD_avg
i CD ( T main ) = 2 k R _ a U H M rSU 2 R oSU
It can be obtained that
T main T s / 2 i CD   d t = 2 k R _ a U H n 1 M rSU T s ( f r f s ) 4 R oSU f r
0 T main i CD   d t = M rSU U H T S 2 R oSU
Therefore
0 T s / 2 i CD   d t = M rSU U H T S 2 R oSU + 2 k R _ a U H n 1 M rSU T s ( f r f s ) 4 R oSU f r
Thus
u Cr 2 ( T s / 2 ) = 1 2 n 1 C r 2 0 T s / 2 i CD   d t = M rSU U H T S 4 n 1 C r 2 R oSU + 2 k R _ a U H M rSU T s ( f r f s ) 8 C r 2 R oSU f r
u Cr 2 ( T main ) = 1 2 n 1 C r 2 0 T main i CD   d t = M rSU U H T S 4 n 1 C r 2 R oSU
To simplify the calculation, the value of uCr2 in Interval C is the average of uCr2(Tmain) and uCr2(Ts/2) in the following part.
U Cr 2 _ SU = [ u Cr 2 ( T main ) + u Cr 2 ( T s / 2 ) ] / 2
Thus, the voltage of magnetizing inductance Lm1 and Lm2 in the LVS, uLm1 and uLm2, can form the following equations
{ u Lm 1 ( T main ) + u Lm 2 ( T main ) = U H / M rSU n 1 u Lm 1 ( T main ) n 2 u Lm 2 ( T main ) = U Cr 2 _ SU
uLm1 and uLm2 can be expressed by
{ u Lm 1 ( T main ) = n 2 U H / M rSU + U Cr 2 _ SU n 1 + n 2 u Lm 2 ( T main ) = n 1 U H / M rSU U Cr 2 _ SU n 1 + n 2
The current flowing through Cr1 and Lr is 0, and as a result
u Lr ( T main ) = 0
The output voltage of the resonant tank in Tmain, USU is
U SU = u Lm 2 ( T main ) u Cr 1 ( T main )
As a result, uAB can be described as
u AB ( t ) = { U H U SU     0 t < T main T main t 1 / ( 2 f s )
iAB can be described as
i AB ( t ) = { I AB   sin ( 2 π f r t ) 0     0 t < T main T main t 1 / ( 2 f s )

References

  1. Xu, W.; Chan, N.H.L.; Or, S.W.; Ho, S.L.; Chan, K.W. A New Control Method for a Bi-Directional Phase-Shift-Controlled DC-DC Converter with an Extended Load Range. Energies 2017, 10, 1532. [Google Scholar] [CrossRef] [Green Version]
  2. Yong, H.; Li, X.; Wu, X.; Li, M.; Wang, Y. Stability Control Design for TAB-Based Three-Port Bidirectional DC/DC Converters in PV-Battery Grid-Connected Applications. In Proceedings of the 46th Annual Conference of the IEEE Industrial Electronics Society (IECON 2020), Singapore, 18–21 October 2020; pp. 3469–3474. [Google Scholar]
  3. Sha’aban, Y.A.; Ikpehai, A.; Adebisi, B.; Rabie, K.M. Bi-Directional Coordination of Plug-In Electric Vehicles with Economic Model Predictive Control. Energies 2017, 10, 1507. [Google Scholar] [CrossRef] [Green Version]
  4. Fiaz, M.F.; Calligaro, S.; Iurich, M.; Petrella, R. Analytical Modeling and Control of Dual Active Bridge Converter Considering All Phase-Shifts. Energies 2022, 15, 2720. [Google Scholar] [CrossRef]
  5. Onar, O.C. A Bidirectional High-Power-Quality Grid Interface With a Novel Bidirectional Noninverted Buck–Boost Converter for PHEVs. IEEE Trans. Veh. Technol. 2012, 61, 2018–2032. [Google Scholar] [CrossRef]
  6. Chen, B.-Z.; Liao, H.; Chen, L.; Chen, J.-F. Design and Implementation of the Bidirectional DC-DC Converter with Rapid Energy Conversion. Energies 2022, 15, 898. [Google Scholar] [CrossRef]
  7. Gierczynski, M.; Grzesiak, L.M.; Kaszewski, A. Cascaded Voltage and Current Control for a Dual Active Bridge Converter with Current Filters. Energies 2021, 14, 6214. [Google Scholar] [CrossRef]
  8. He, P.; Khaligh, A. Comprehensive Analyses and Comparison of 1 kW Isolated DC–DC Converters for Bidirectional EV Charging Systems. IEEE Trans. Transp. Electrif. 2017, 3, 147–156. [Google Scholar] [CrossRef]
  9. Wang, C.S.; Zhang, S.H.; Wang, Y.F.; Chen, B.; Liu, J.H. A 5-kW Isolated High Voltage Conversion Ratio Bidirectional CLTC Resonant DC–DC Converter With Wide Gain Range and High Efficiency. IEEE Trans. Power Electron. 2019, 34, 340–355. [Google Scholar] [CrossRef]
  10. Can, E.; Sayan, H.H. Development of fractional sinus pulse width modulation with β gap on three step signal processing. Int. J. Electron. 2022, 1–20. [Google Scholar] [CrossRef]
  11. Zhao, B.; Song, Q.; Liu, W.; Sun, Y. Overview of Dual-Active-Bridge Isolated Bidirectional DC–DC Converter for High-Frequency-Link Power-Conversion System. IEEE Trans. Power Electron. 2014, 29, 4091–4106. [Google Scholar] [CrossRef]
  12. Chen, G.; Lee, Y.S.; Hui, S.Y.R.; Xu, D.; Wang, Y. Actively clamped bidirectional flyback converter. IEEE Trans. Ind. Electron. 2000, 47, 770–779. [Google Scholar] [CrossRef]
  13. Li, H.; Peng, F.Z.; Lawler, J.S. A natural ZVS medium-power bidirectional DC-DC converter with minimum number of devices. IEEE Trans. Ind. Appl. 2015, 39, 525–535. [Google Scholar] [CrossRef] [Green Version]
  14. Cui, S.; He, D.; Chen, Z.; Habetler, T.G. A Wide Input Voltage Range ZVS Isolated Bidirectional DC-DC Converter for Ultra-capacitor Application in Hybrid and Electric Vehicles. In Proceedings of the 2012 IEEE International Electric Vehicle Conference, Greenville, SC, USA, 4–8 March 2012; pp. 1–6. [Google Scholar]
  15. Roggia, L.; Costa, P.F.S. Comparative analysis between integrated full-bridge-forward and dual active bridge DC–DC converters. Electron. Lett. 2018, 54, 231–233. [Google Scholar] [CrossRef]
  16. Núñez, R.O.; Oggier, G.G.; Botterón, F.; Garcia, G.O. Analysis of the Transformer Influence on a Three-Phase Dual Active Bridge DC-DC Converter. IEEE Lat. Am. Trans. 2016, 14, 3048–3055. [Google Scholar] [CrossRef]
  17. Jin, K.; Liu, C. A Novel PWM High Voltage Conversion Ratio Bidirectional Three-Phase DC/DC Converter With Y–Δ Connected Transformer. IEEE Trans. Power Electron. 2015, 31, 81–88. [Google Scholar] [CrossRef]
  18. Lee, S.; Park, J.; Choi, S. A Three-Phase Current-Fed Push–Pull DC–DC Converter With Active Clamp for Fuel Cell Applications. IEEE Trans. Power Electron. 2011, 26, 2266–2277. [Google Scholar] [CrossRef]
  19. Min, J.; Ordonez, M. Bidirectional Resonant CLLC Charger for Wide Battery Voltage Range: Asymmetric Parameters Methodology. IEEE Trans. Power Electron. 2021, 36, 6662–6673. [Google Scholar] [CrossRef]
  20. Jung, J.H.; Kim, H.S.; Ryu, M.H.; Baek, J.W. Design Methodology of Bidirectional CLLC Resonant Converter for High-Frequency Isolation of DC Distribution Systems. IEEE Trans. Power Electron. 2012, 28, 1741–1755. [Google Scholar] [CrossRef]
  21. Lin, F.; Zhang, X.; Li, X.; Chaohui, L.; Ma, H. Parameter Design for Symmetrical CLLC-Type DC Transformer Considering Cascaded System Stability and Power Efficiency. IEEE J. Emerg. Sel. Top. Power Electron. 2020, 9, 6219–6231. [Google Scholar] [CrossRef]
  22. Li, X.; Huang, J.; Ma, Y.; Wang, X.; Yang, J.; Wu, X. Unified Modeling, Analysis, and Design of Isolated Bidirectional CLLC Resonant DC-DC Converters. IEEE J. Emerg. Sel. Top. Power Electron. 2022, 10, 213–223. [Google Scholar] [CrossRef]
  23. Ibanez, F.; Echeverria, J.M.; Fontan, L. Novel technique for bidirectional series-resonant DC/DC converter in discontinuous mode. IET Power Electron. 2013, 6, 1019–1028. [Google Scholar] [CrossRef]
  24. Jiang, T.; Zhang, J.; Wu, X.; Sheng, K.; Wang, Y. A Bidirectional LLC Resonant Converter with Automatic Forward and Backward Mode Transition. IEEE Trans. Power Electron. 2014, 30, 757–770. [Google Scholar] [CrossRef]
  25. Musavi, F.; Craciun, M.; Gautam, D.S.; Eberle, W. Control Strategies for Wide Output Voltage Range LLC Resonant DC–DC Converters in Battery Chargers. IEEE Trans. Veh. Technol. 2014, 63, 1117–1125. [Google Scholar] [CrossRef]
  26. Çalışkan, E.; Ustun, O. Smart Efficiency Tracking for Novel Switch—LLC Converter for Battery Charging Applications. Energies 2022, 15, 1861. [Google Scholar] [CrossRef]
  27. Chang, C.; Cheng, C.; Cheng, H. Modeling and Design of the LLC Resonant Converter Used as a Solar-Array Simulator. IEEE J. Emerg. Sel. Top. Power Electron. 2014, 2, 833–841. [Google Scholar] [CrossRef]
  28. Zhang, S.-H.; Wang, Y.-F.; Chen, B.; Han, F.-Q.; Wang, Q.-C. Studies on a Hybrid Full-Bridge/Half-Bridge Bidirectional CLTC Multi-Resonant DC-DC Converter with a Digital Synchronous Rectification Strategy. Energies 2018, 11, 227. [Google Scholar] [CrossRef] [Green Version]
  29. Chen, B.; Wang, P.; Wang, Y.F.; Zhang, S.H.; Yang, L.; Ji, R.L. A Bidirectional CDT-LC Resonant DC-DC Converter with a Wide Voltage Range. IEEE Trans. Ind. Electron. 2020, 67, 2009–2020. [Google Scholar] [CrossRef]
  30. Ma, X.; Wang, P.; Bi, H.; Wang, Z. A Bidirectional LLCL Resonant DC-DC Converter With Reduced Resonant Tank Currents and Reduced Voltage Stress of the Resonant Capacitor. IEEE Access 2020, 8, 125549–125564. [Google Scholar] [CrossRef]
  31. Liu, T.; Zhou, Z.; Xiong, A.; Zeng, J.; Ying, J. A Novel Precise Design Method for LLC Series Resonant Converter. In Proceedings of the INTELEC 06—Twenty-Eighth International Telecommunications Energy Conference, Providence, RI, USA, 10–14 September 2006; pp. 1–6. [Google Scholar]
  32. Can, E. The design and experimentation of the new cascaded DC-DC boost converter for renewable energy. Int. J. Electron. 2019, 106, 1374–1393. [Google Scholar] [CrossRef]
  33. Hu, Z.; Wang, L.; Wang, H.; Liu, Y.F.; Sen, P.C. An Accurate Design Algorithm for LLC Resonant Converters—Part I. IEEE Trans. Power Electron. 2016, 31, 5435–5447. [Google Scholar] [CrossRef]
  34. Hu, Z.; Wang, L.; Qiu, Y.; Liu, Y.F.; Sen, P.C. An Accurate Design Algorithm for LLC Resonant Converters—Part II. IEEE Trans. Power Electron. 2016, 31, 5448–5460. [Google Scholar] [CrossRef]
  35. Steigerwald, R.L. A Comparison of Half-bridge Resonant Converter Topologies. IEEE Trans. Power Electron. 2002, 3, 174–182. [Google Scholar] [CrossRef]
  36. Ivensky, G.; Bronshtein, S.; Abramovitz, A. Approximate Analysis of Resonant LLC DC-DC Converter. IEEE Trans. Power Electron. 2011, 26, 3274–3284. [Google Scholar] [CrossRef]
  37. Liu, J.; Zhang, J.; Zheng, T.Q.; Yang, J. A Modified Gain Model and the Corresponding Design Method for an LLC Resonant Converter. IEEE Trans. Power Electron. 2017, 32, 6716–6727. [Google Scholar] [CrossRef]
  38. Abdel-Rahim, O.; Alamir, N.; Abdelrahem, M.; Orabi, M.; Kennel, R.; Ismeil, M.A. A Phase-Shift-Modulated LLC-Resonant Micro-Inverter Based on Fixed Frequency Predictive-MPPT. Energies 2020, 13, 1460. [Google Scholar] [CrossRef] [Green Version]
Figure 1. The proposed DHC-LT BDC (The symbols of “*” are dotted terminals of T2).
Energies 15 05281 g001
Figure 2. Operation principles of DHC-LT BDC: (a) waveforms in step-down mode; (b) waveforms in step-up mode.
Energies 15 05281 g002
Figure 3. Equivalent circuits in step-down mode: (a) Interval A; (b) Interval B; (c) Interval C (The symbols of “*” are dotted terminals of T2).
Energies 15 05281 g003
Figure 4. Equivalent circuits in step-up mode: (a) Interval A; (b) Interval B; (c) Interval C (The symbols of “*” are dotted terminals of T2).
Energies 15 05281 g004
Figure 5. Simulation model for DHC-LT BDC (The symbols of “*” are dotted terminals of T2).
Energies 15 05281 g005
Figure 6. Simulation waveforms in step-down mode, 400 V, 1 Ω: (a) 90 kHz; (b) 120 kHz; (c) 160 kHz.
Energies 15 05281 g006
Figure 7. Simulation waveforms in step-up mode, 50 V, 64 Ω: (a) 100 kHz; (b) 120 kHz; (c) 160 kHz.
Energies 15 05281 g007aEnergies 15 05281 g007b
Figure 8. Transfer function from control to output voltage.
Energies 15 05281 g008
Figure 9. Equivalent FHA circuit in step-down mode (The symbols of “*” are dotted terminals of T2).
Energies 15 05281 g009
Figure 10. Waveforms in step-down mode.
Energies 15 05281 g010
Figure 11. Equivalent FHA circuit in step-up mode. (The symbols of “*” are dotted terminals of T2).
Energies 15 05281 g011
Figure 12. Waveforms in step-up mode.
Energies 15 05281 g012
Figure 13. Voltage gain in step-down mode.
Energies 15 05281 g013
Figure 14. Voltage gain in step-up mode.
Energies 15 05281 g014
Figure 15. Experimental results of the prototype converter: (a) working frequency is 125 kHz, and load is 1 Ω, step-down mode; (b) working frequency is 90 kHz, and load is 2.5 Ω, step-down mode (c) ZVS in step-up mode; (d) working frequency is 160 kHz, and load is 1.4 Ω, step-down mode.
Energies 15 05281 g015aEnergies 15 05281 g015b
Figure 16. Efficiency curves of DHC-LT and CDT-LC.
Energies 15 05281 g016
Figure 17. Schematic diagram using fixed-frequency phase-shift strategy in step-down mode.
Energies 15 05281 g017
Figure 18. Waveforms using fixed-frequency phase-shift strategy in step-down mode.
Energies 15 05281 g018
Figure 19. Diagram of battery/PV test system: (a) schematic diagram of the whole DC test power system; (b) prototype of DC power system; (c) DC source, DC load and host computer.
Energies 15 05281 g019aEnergies 15 05281 g019b
Figure 20. Waveforms in Battery/PV test system: (a) battery output current increases with the increase of load; (b) battery output current declines with the decrease of load; (c) regulating process when illumination intensity decreases.
Energies 15 05281 g020
Table 1. Parameters of the DHC-LT converter.
ComponentModel/Value
M1,M2,M3,M4SRC60R022FB
M5,M6,M7,M82 paralleled FDP2D3N10C
Cr1108 nF
Cr236 nF
Lm1160 μH
n110
Lm280 μH
n218
Lr40 μH
Publisher’s Note: MDPI stays neutral with regard to jurisdictional claims in published maps and institutional affiliations.

