
Study on Combustion and Emissions of a Spark Ignition Engine with Gasoline Port Injection Plus Acetone–Butanol–Ethanol (ABE) Direct Injection under Different Speeds and Loads
Abstract
:Highlights
- ABE is an excellent alternative fuel for spark ignition engines
- ABE fuel enables spark ignition engines to have good power performance and emissions performances
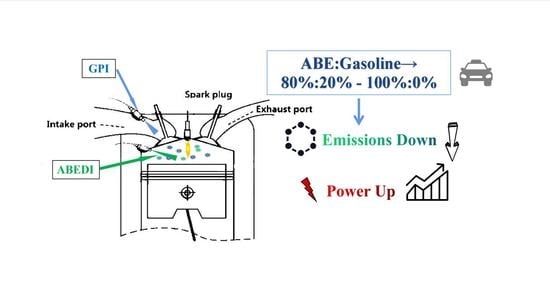
- Gasoline port injection plus ABE direct injection was adopted in this paper
- In total, an 80% ABE direct injection ratio can obtain excellent power performance at low and medium engine speeds and loads
- With the further increase in the engine speed and load, pure ABE is optimal to meet power demands
- A direct injection ratio between 60% and 80% ABE can keep gaseous and particle emissions at low levels
- ABE plus gasoline combined injection can improve the combustion performance and emission performances effectively
Abstract
1. Introduction
2. Experimental Setup and Procedure
2.1. Engine and Test Equipment
2.2. Experiment Fuels and Properties
2.3. Experimental Procedure
3. Results and Discussion
3.1. Combustion Characteristics
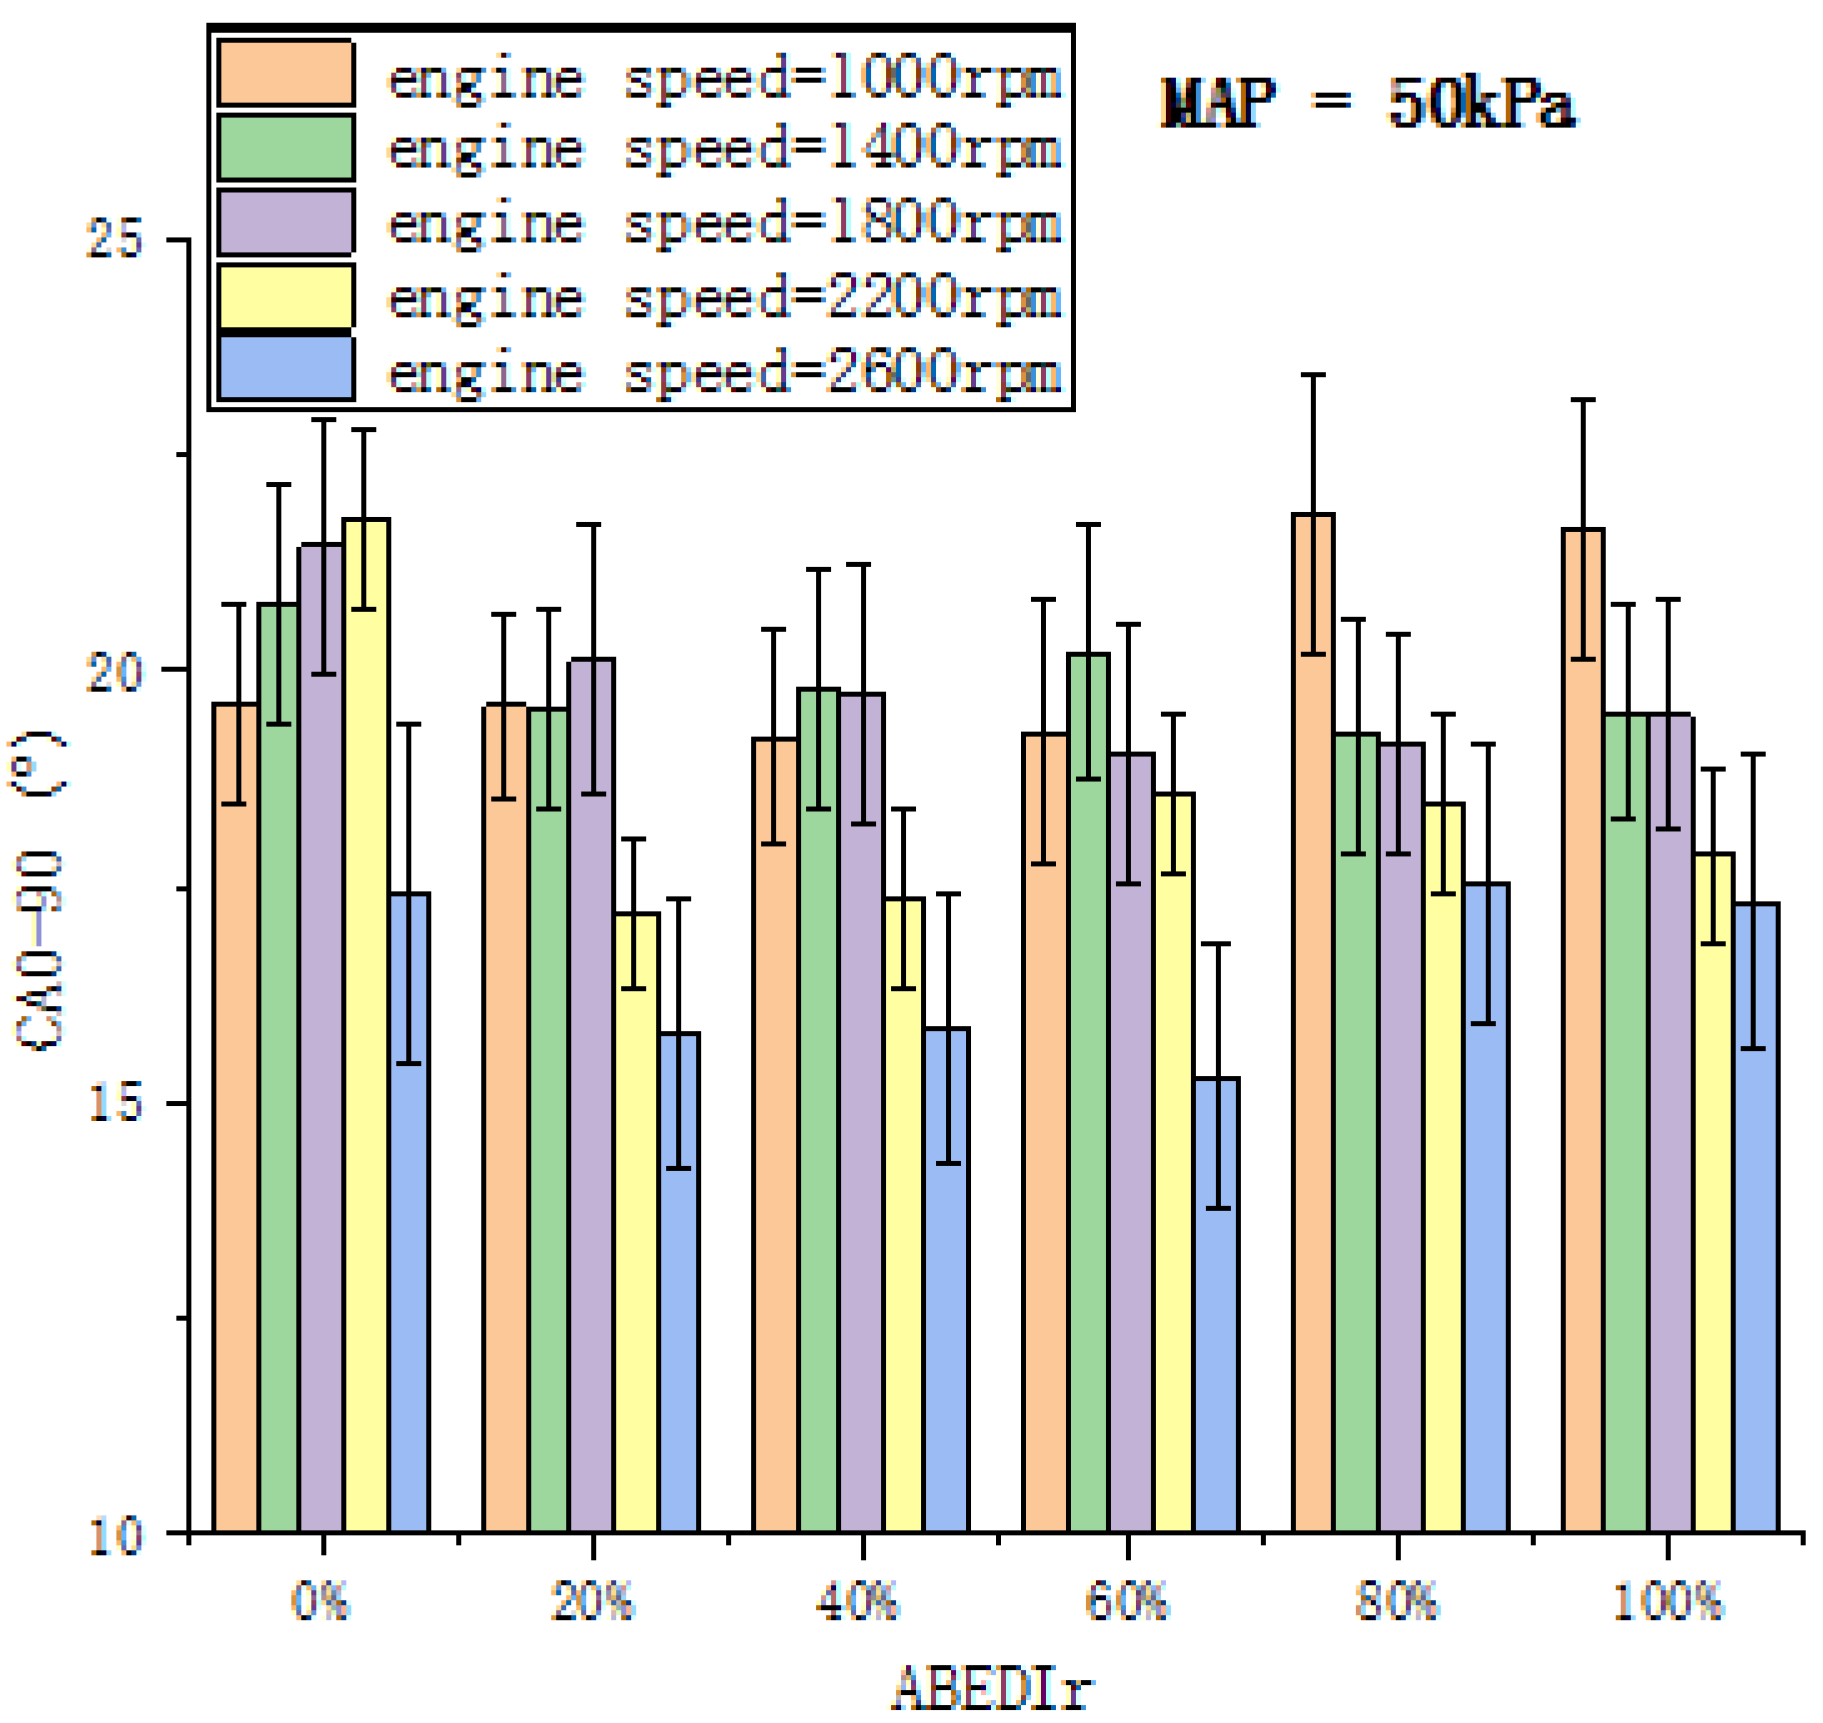
3.1.1. CA0-90
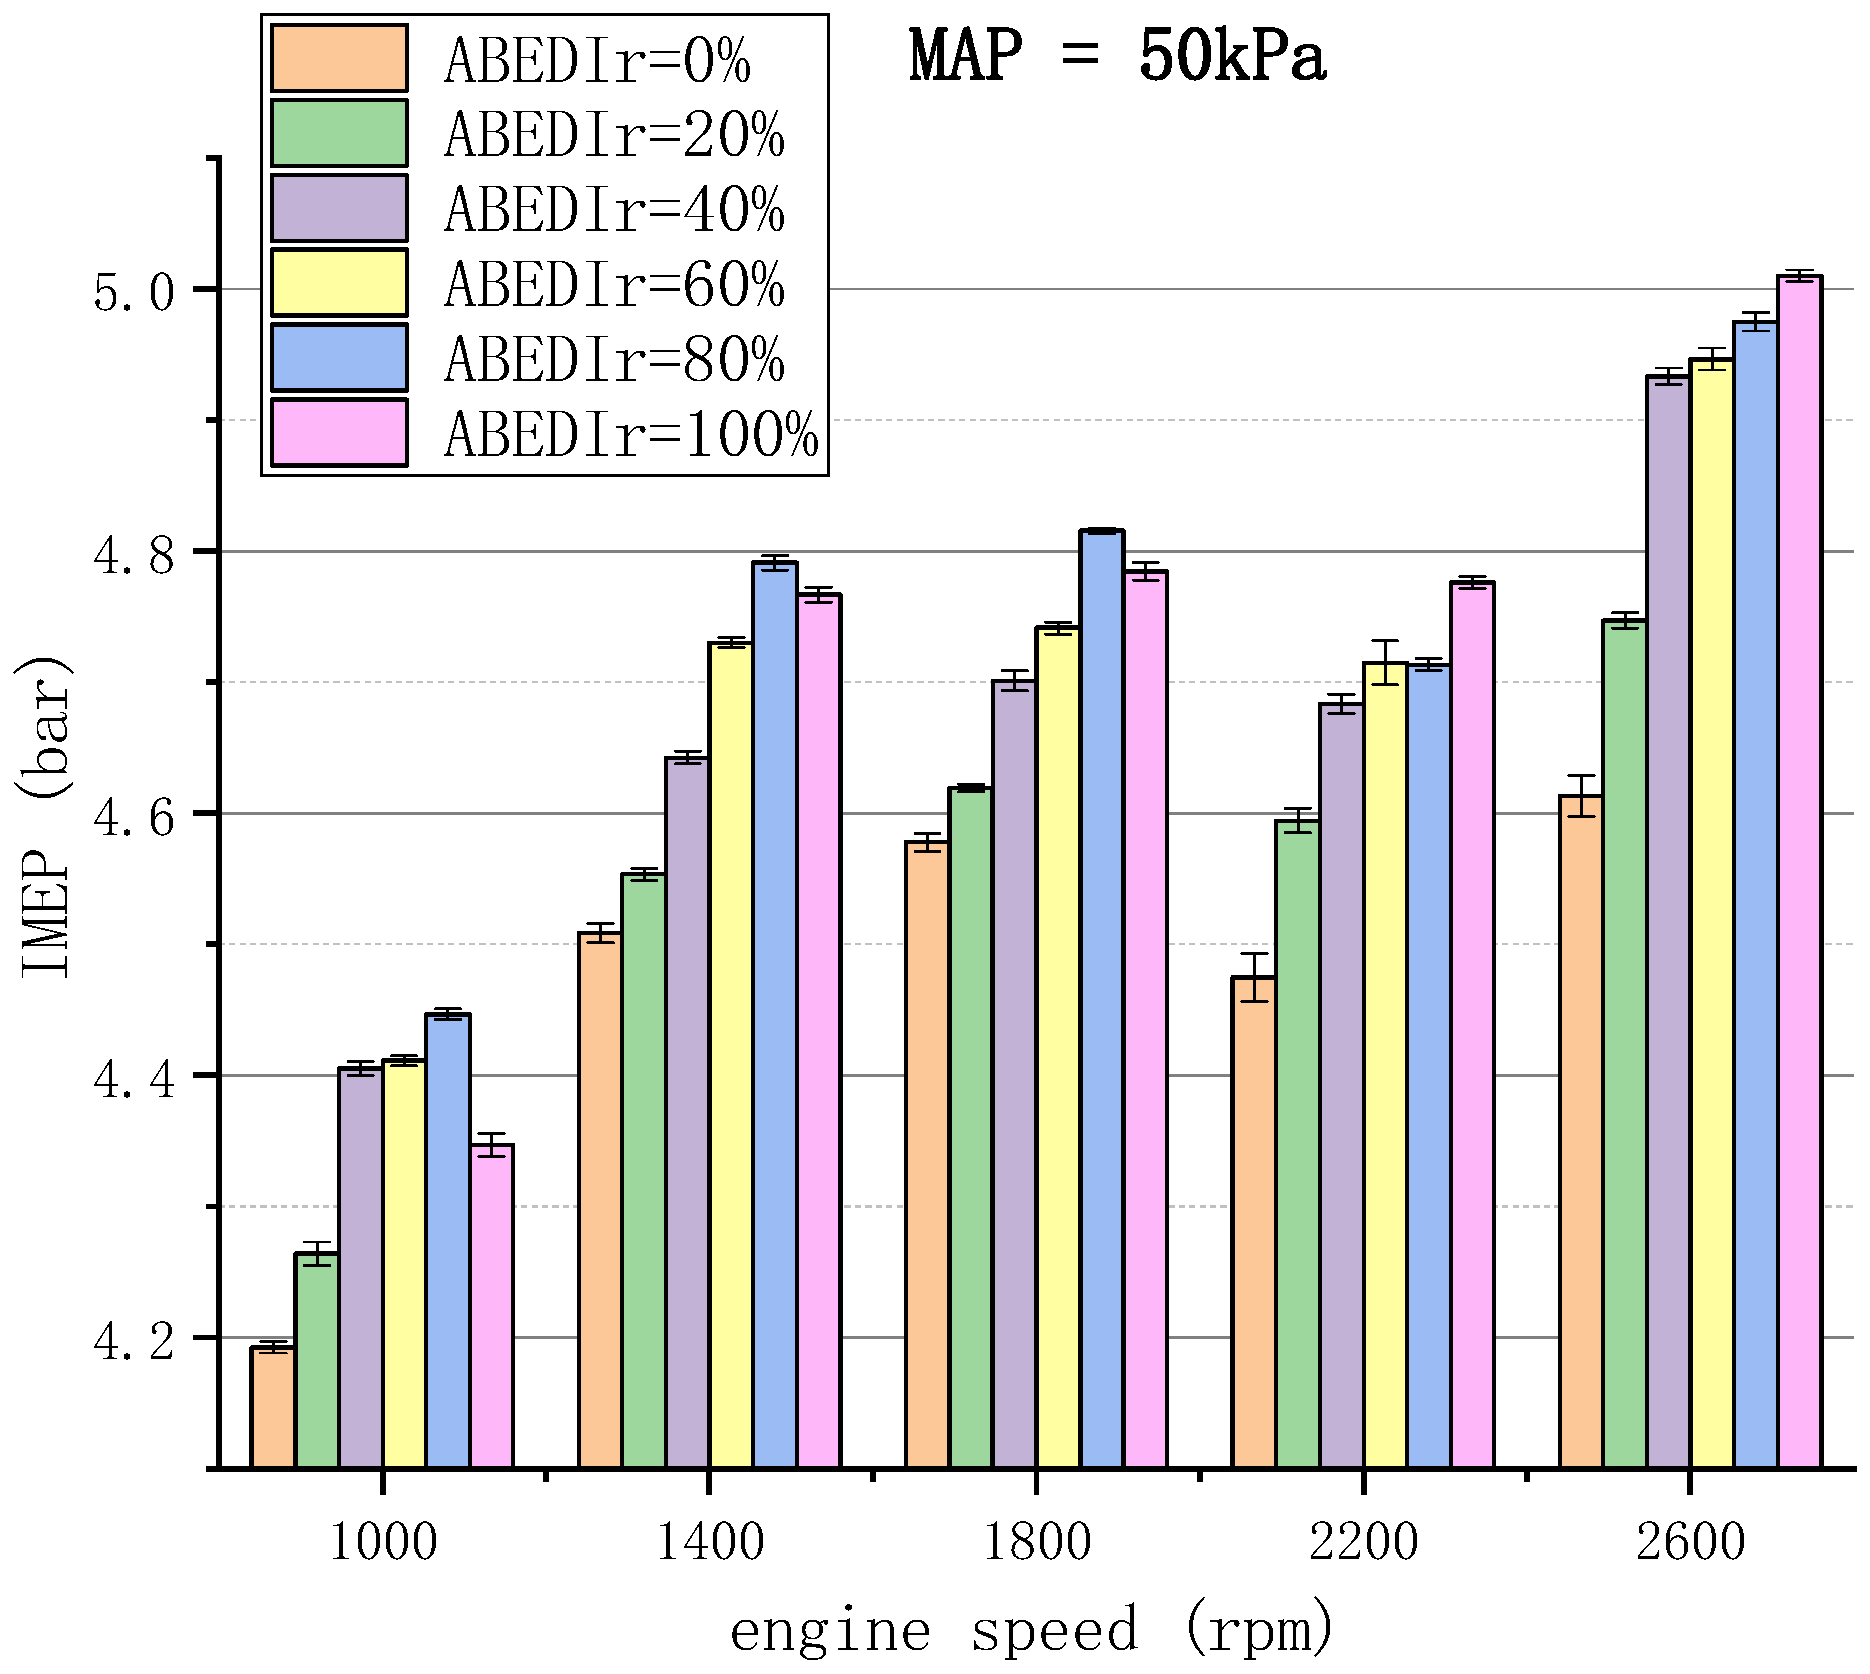
3.1.2. IMEP
3.2. Gaseous Emissions
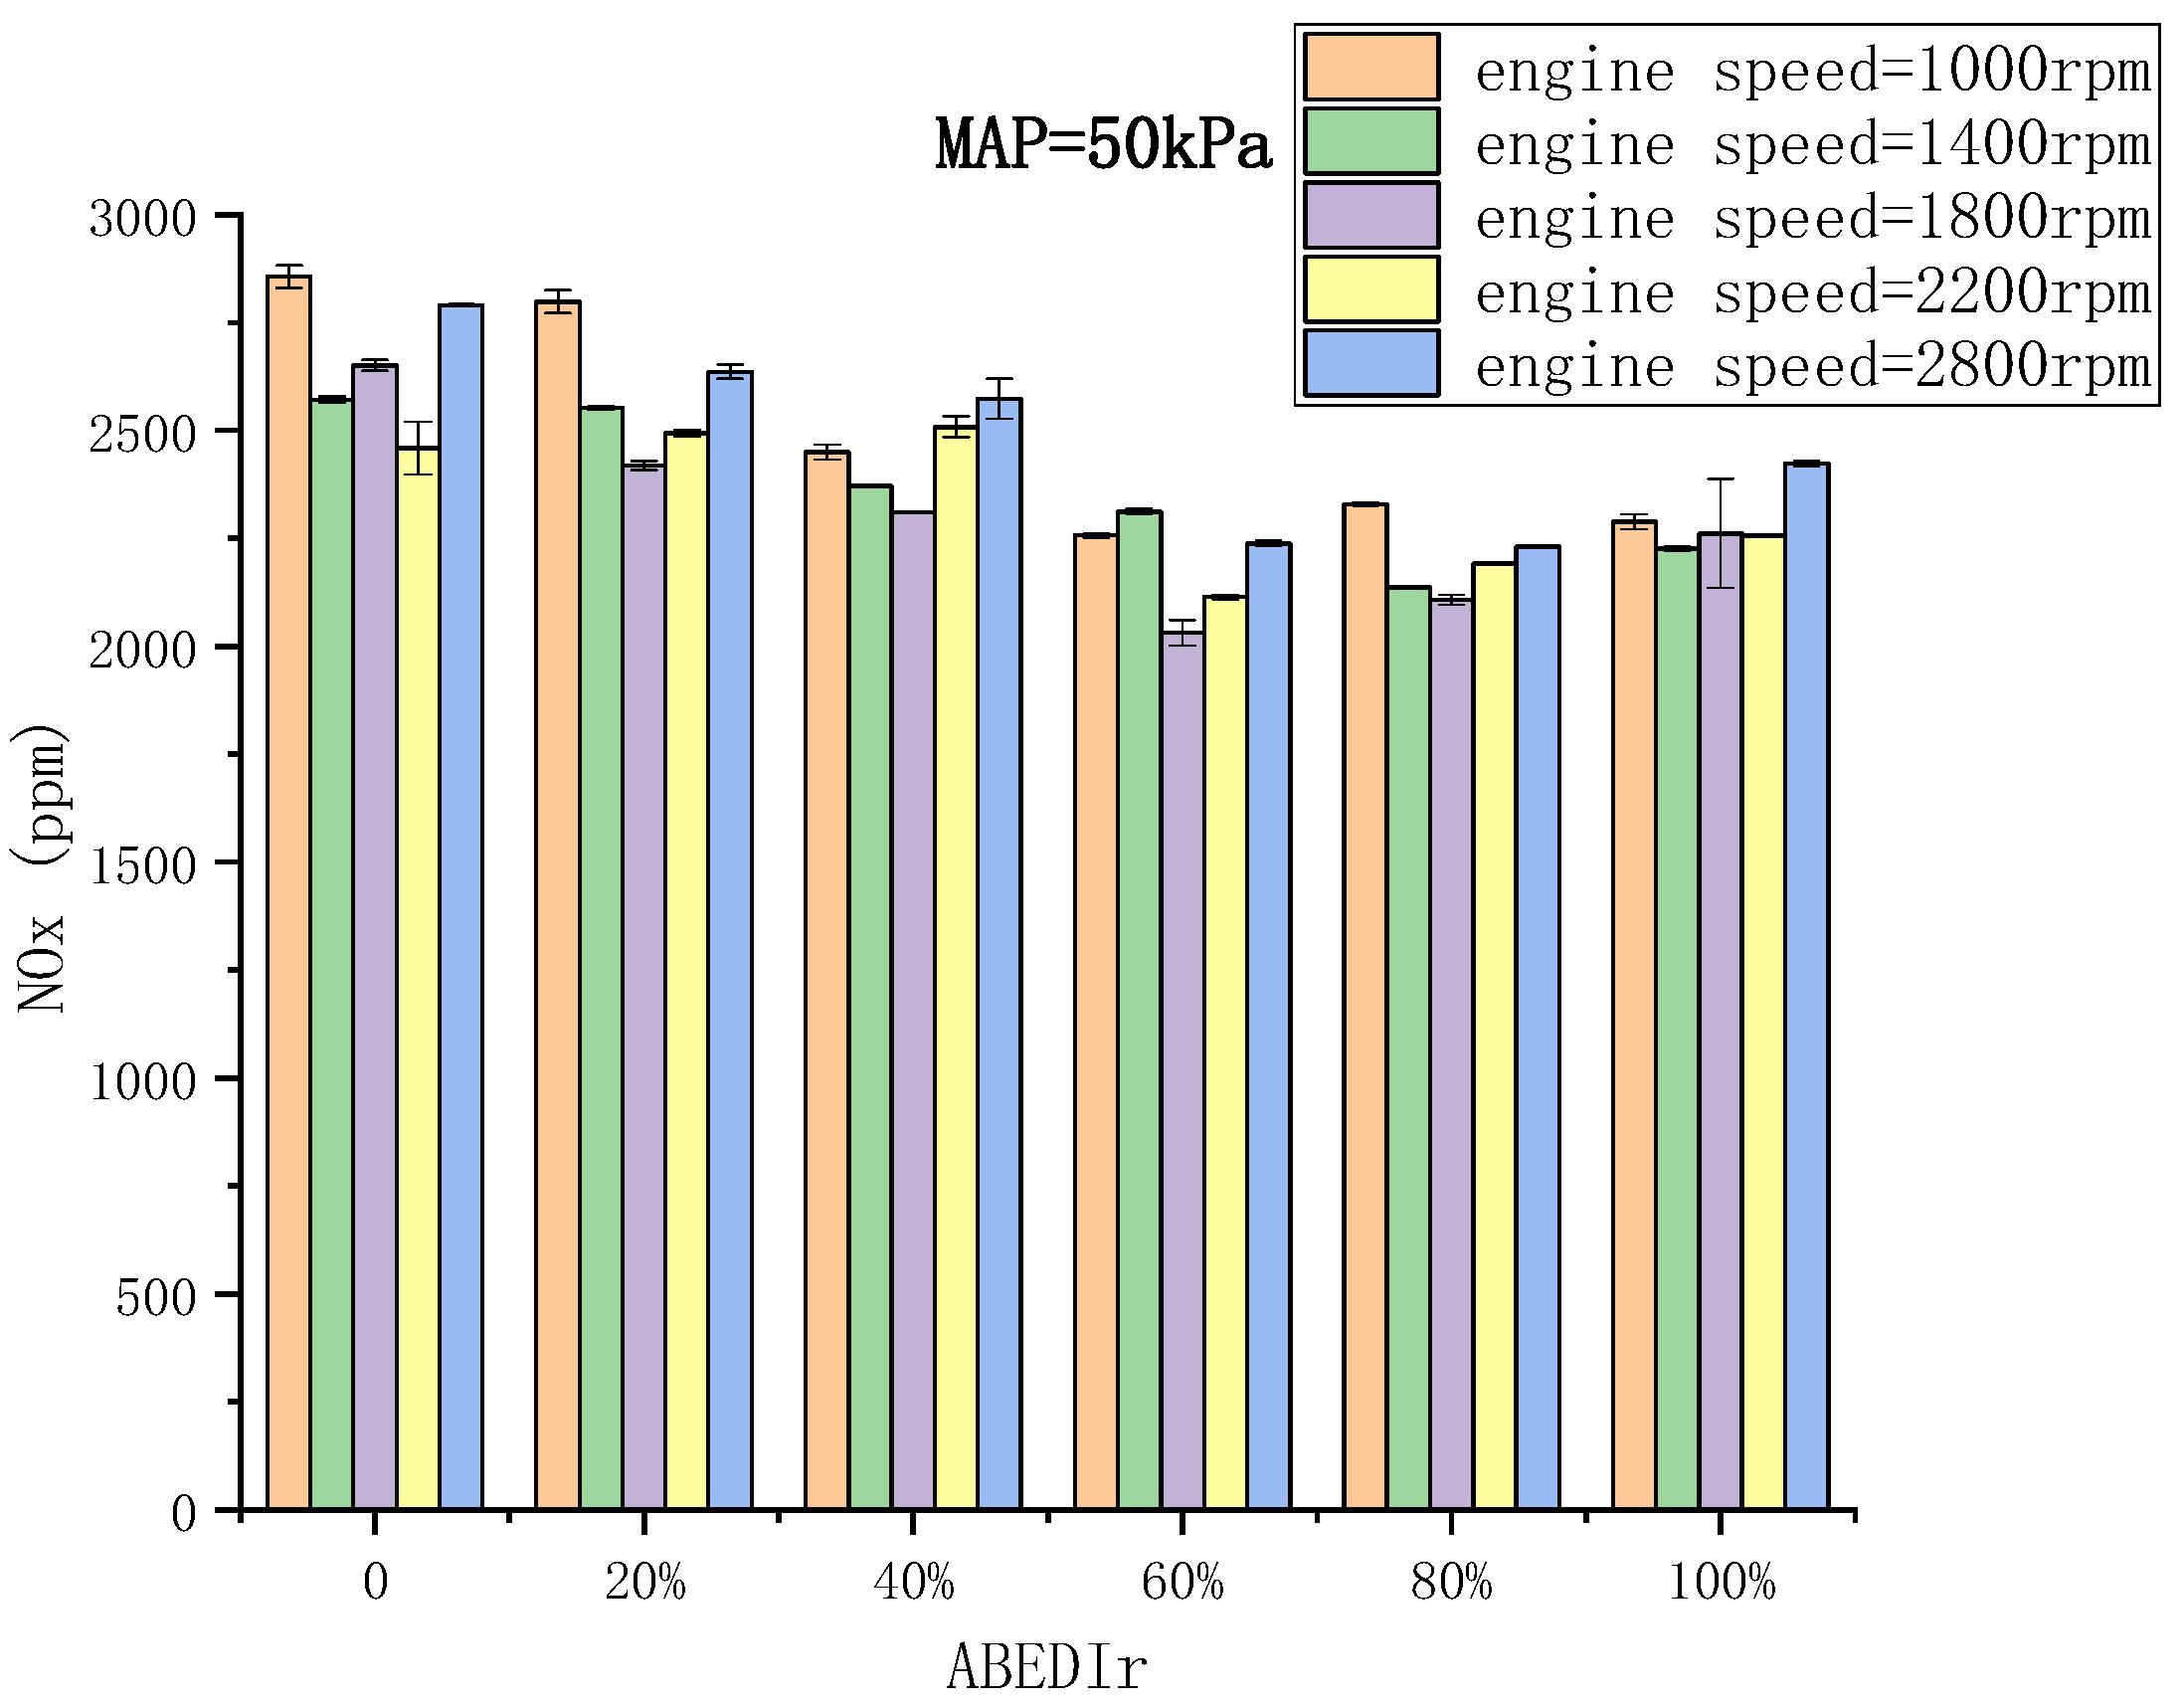
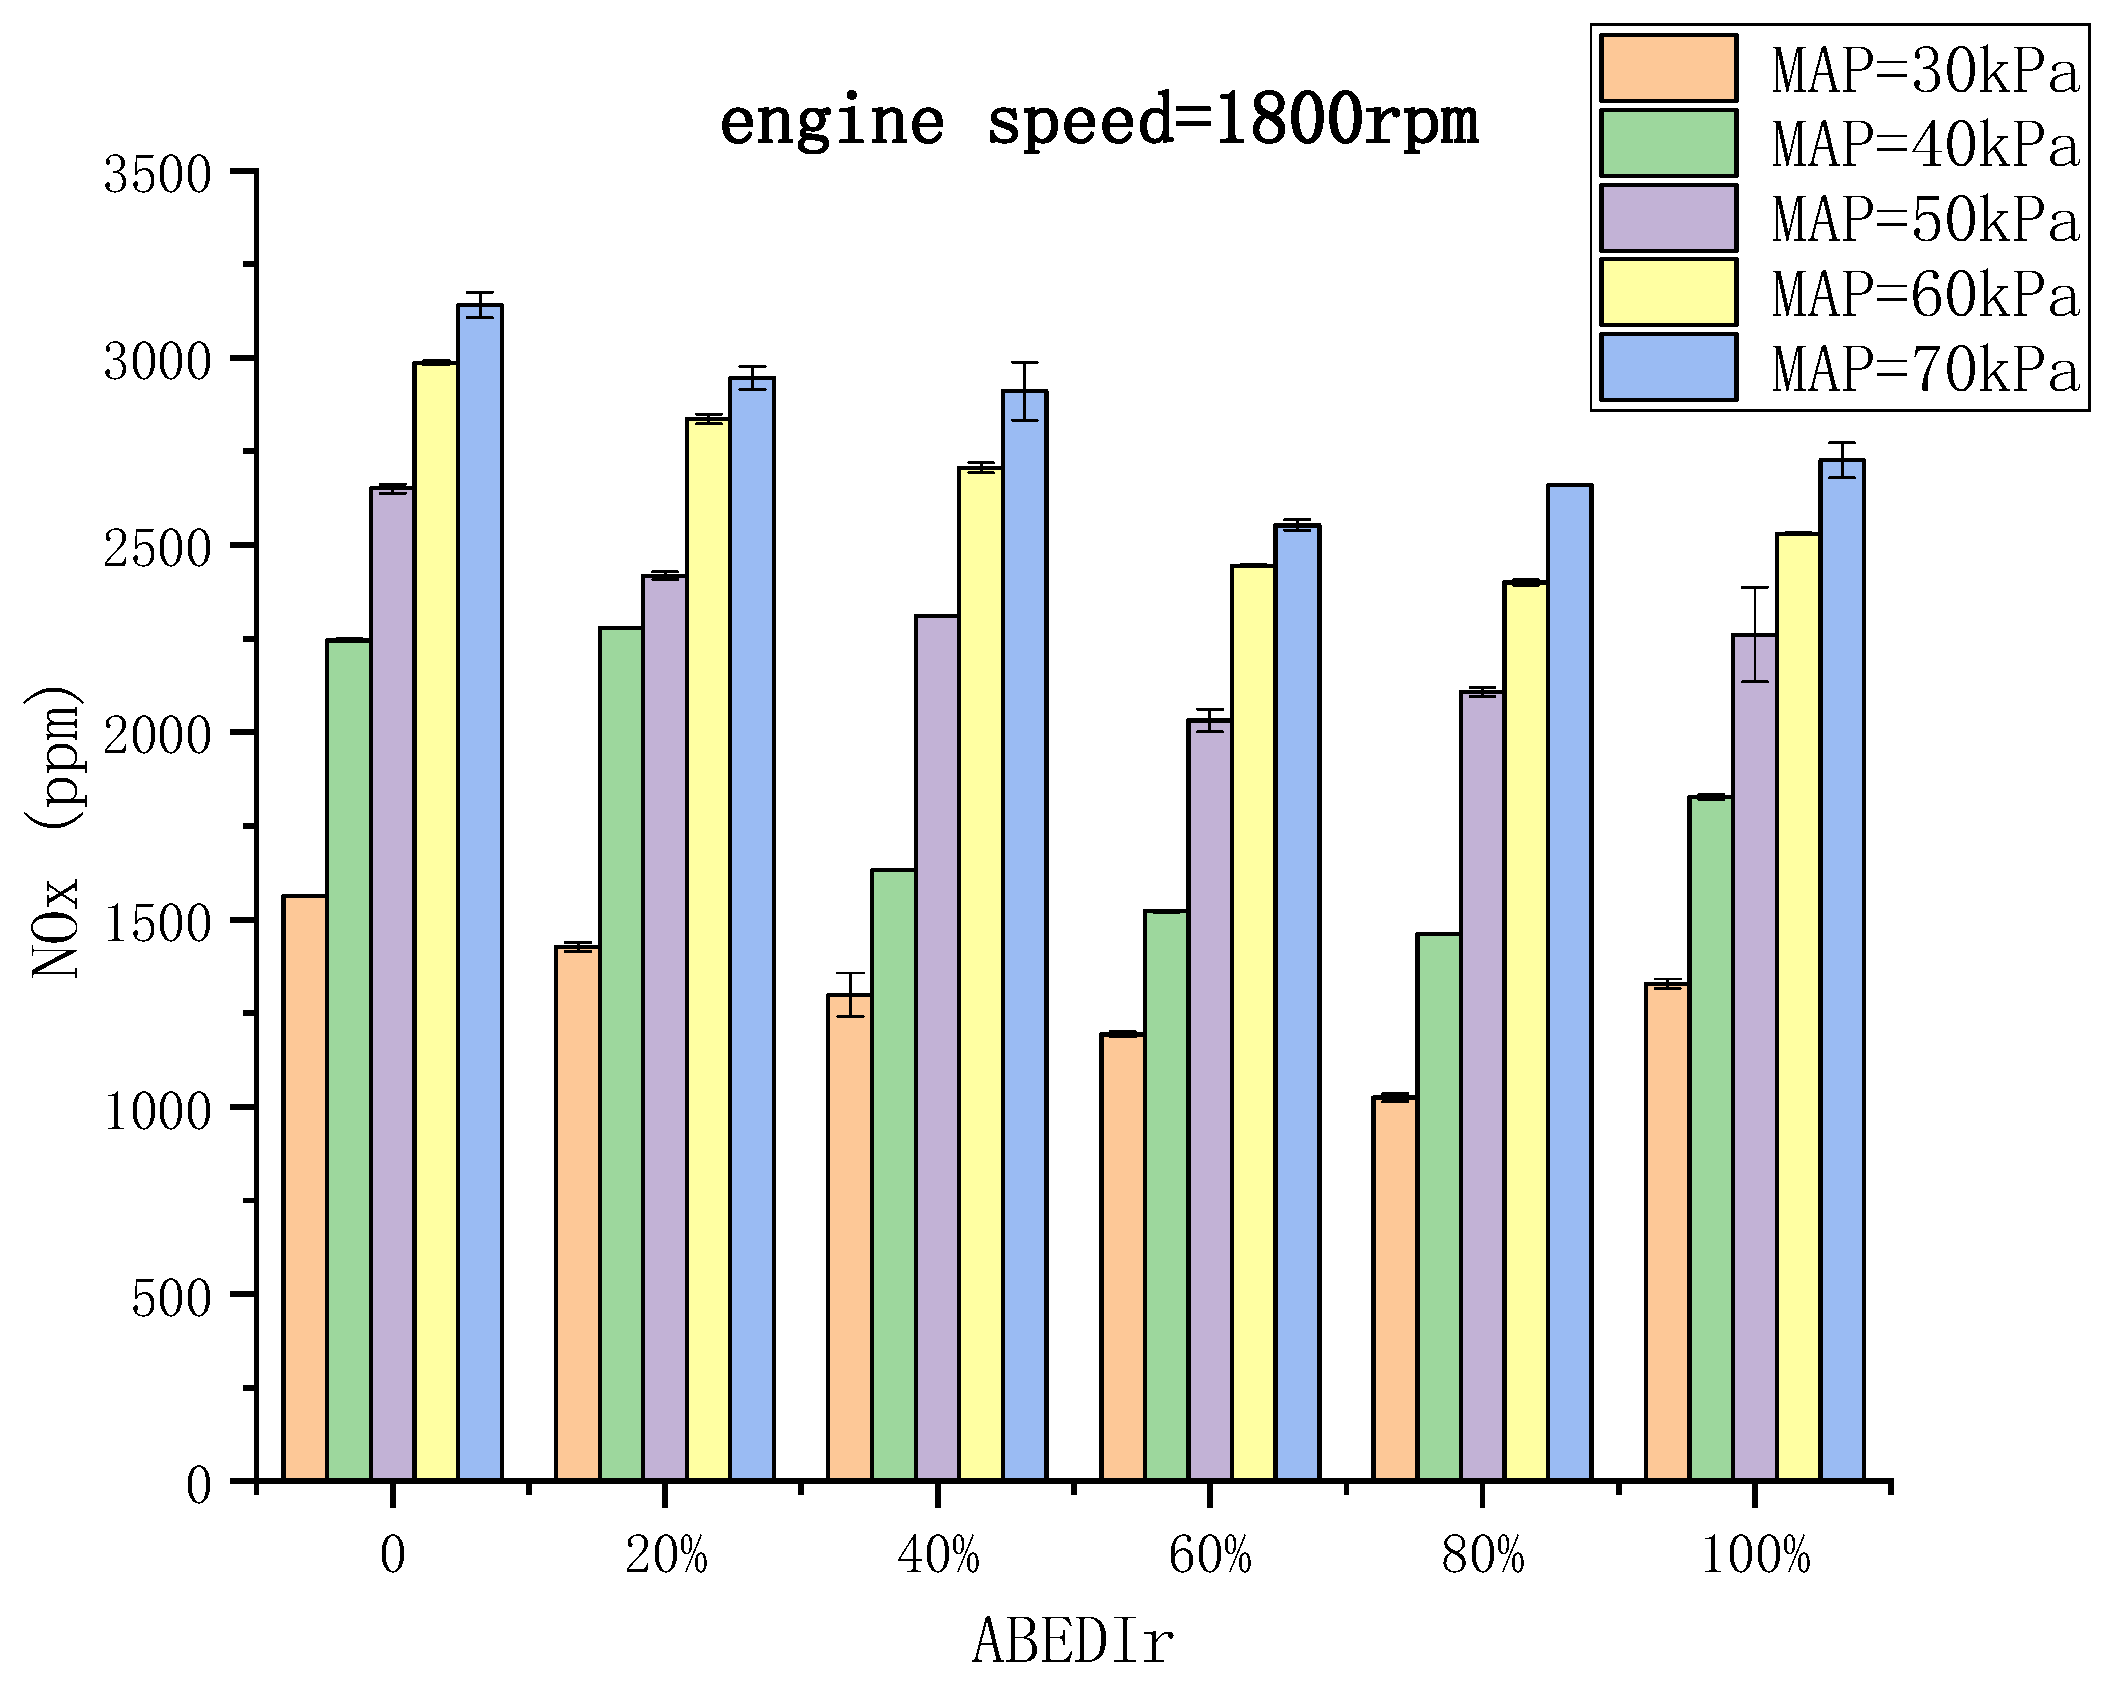
3.2.1. NOx Emissions
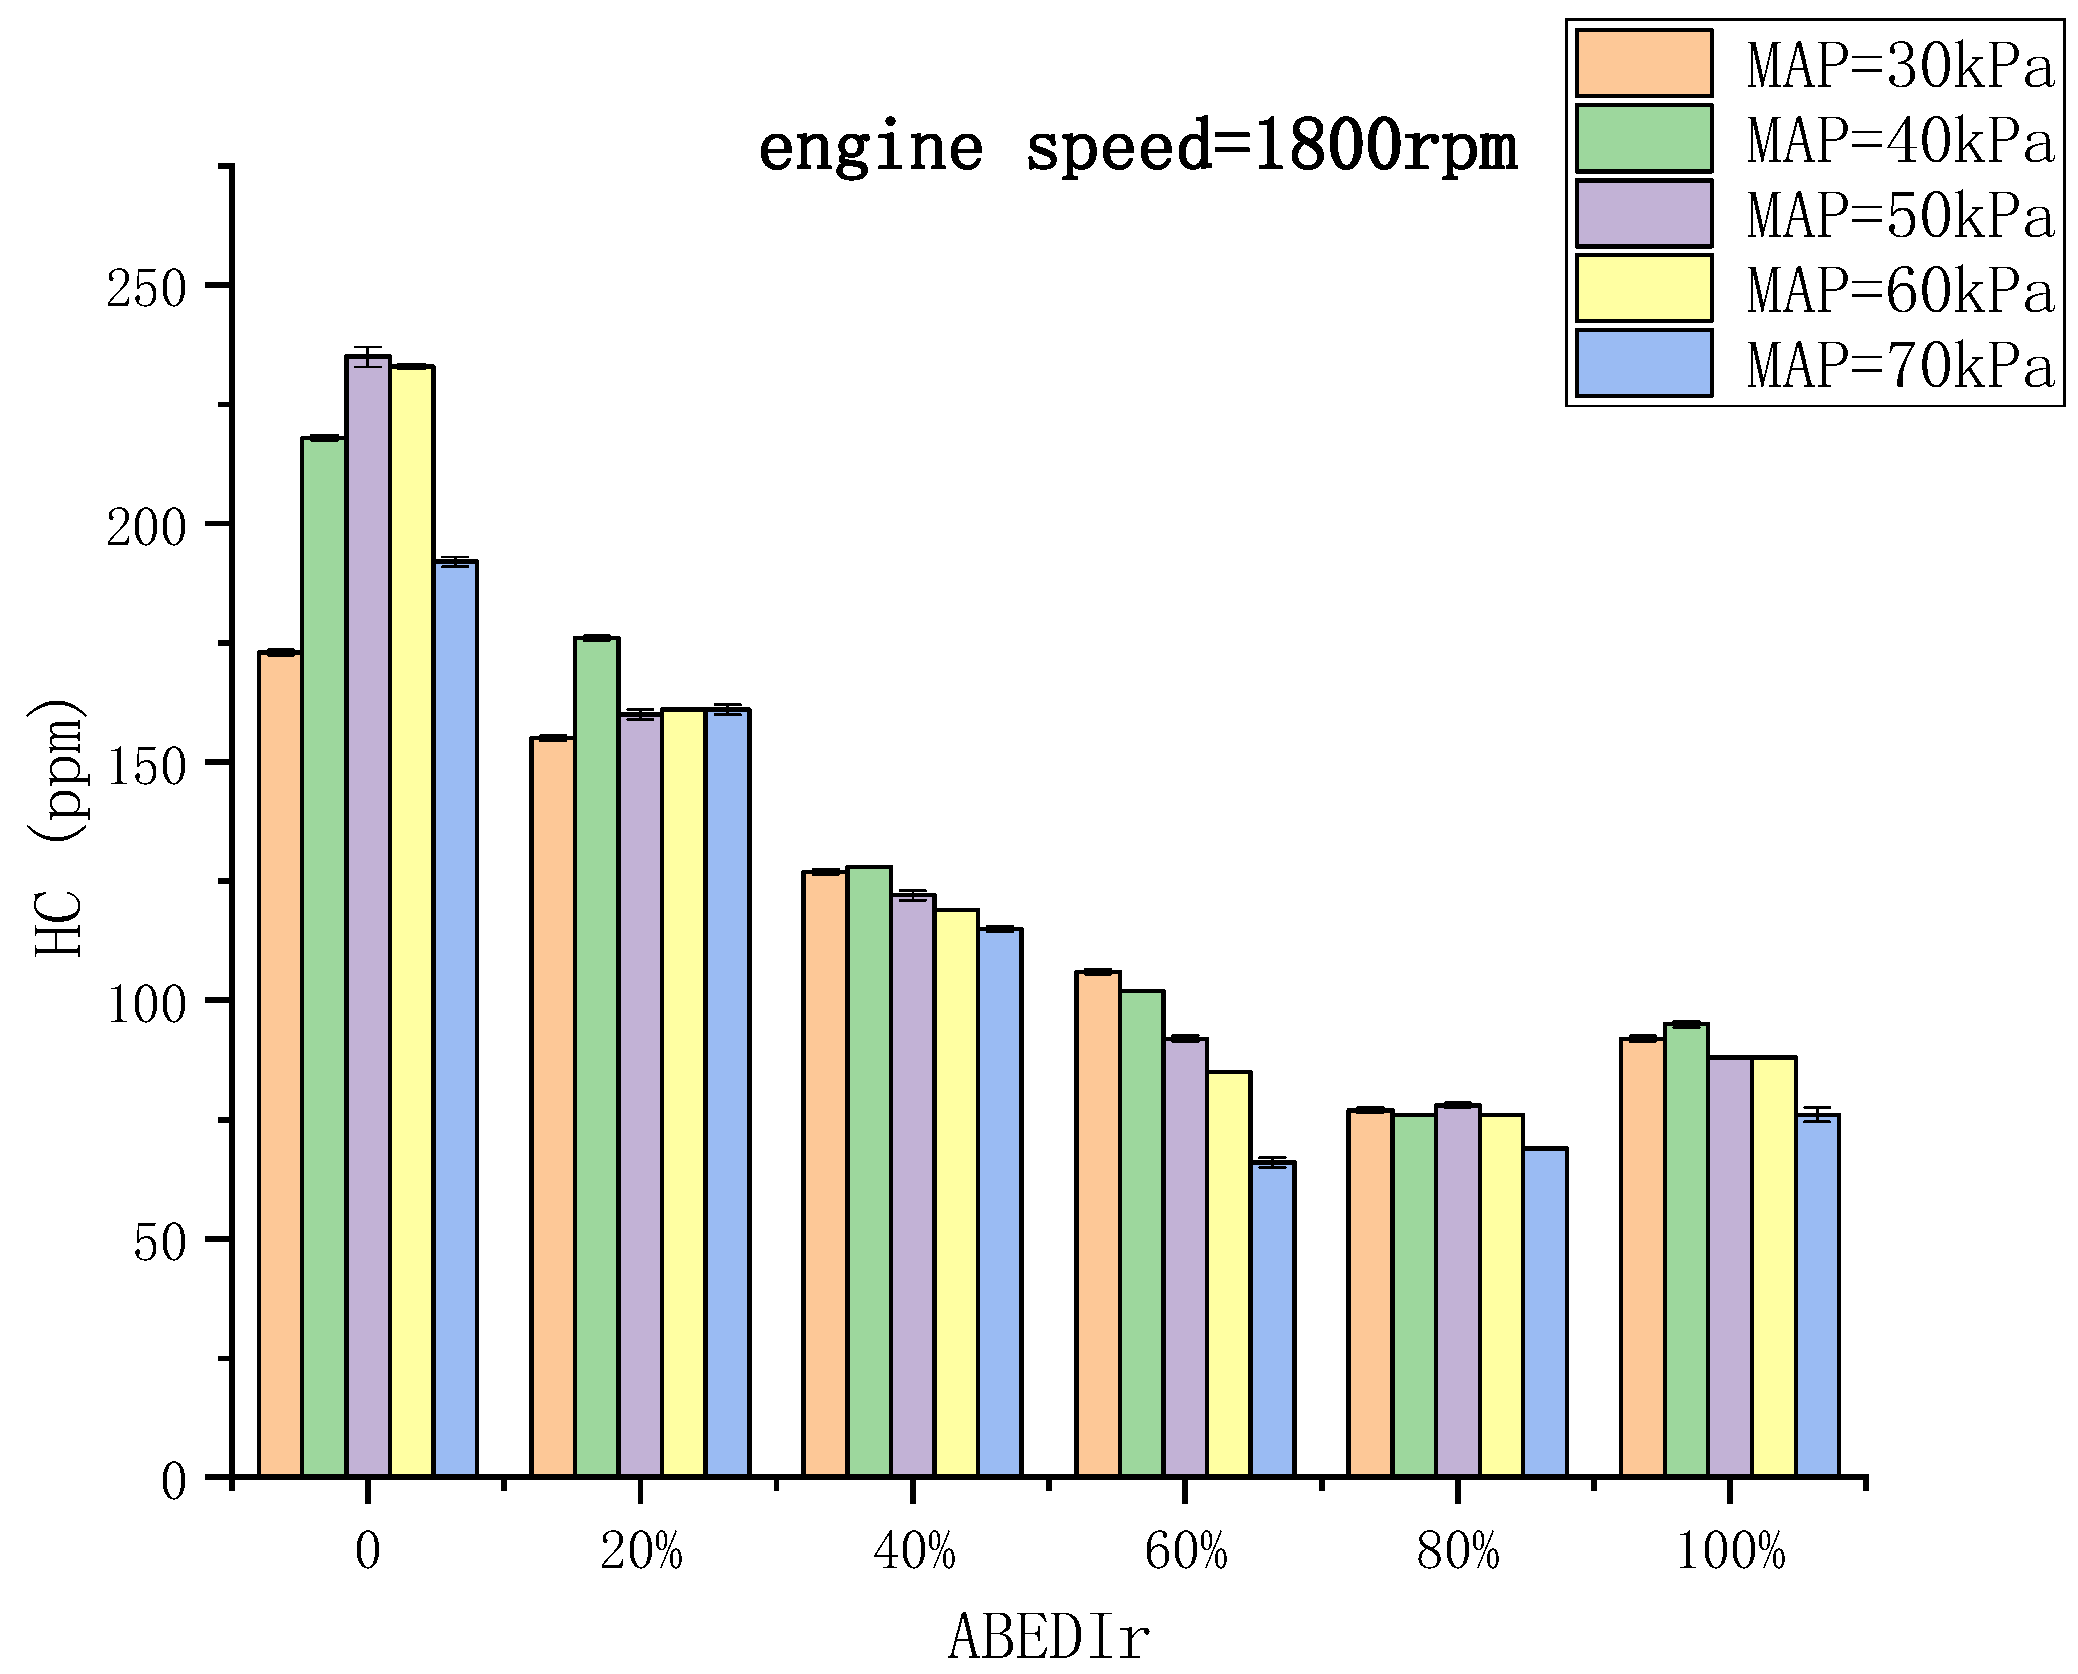
3.2.2. HC Emissions
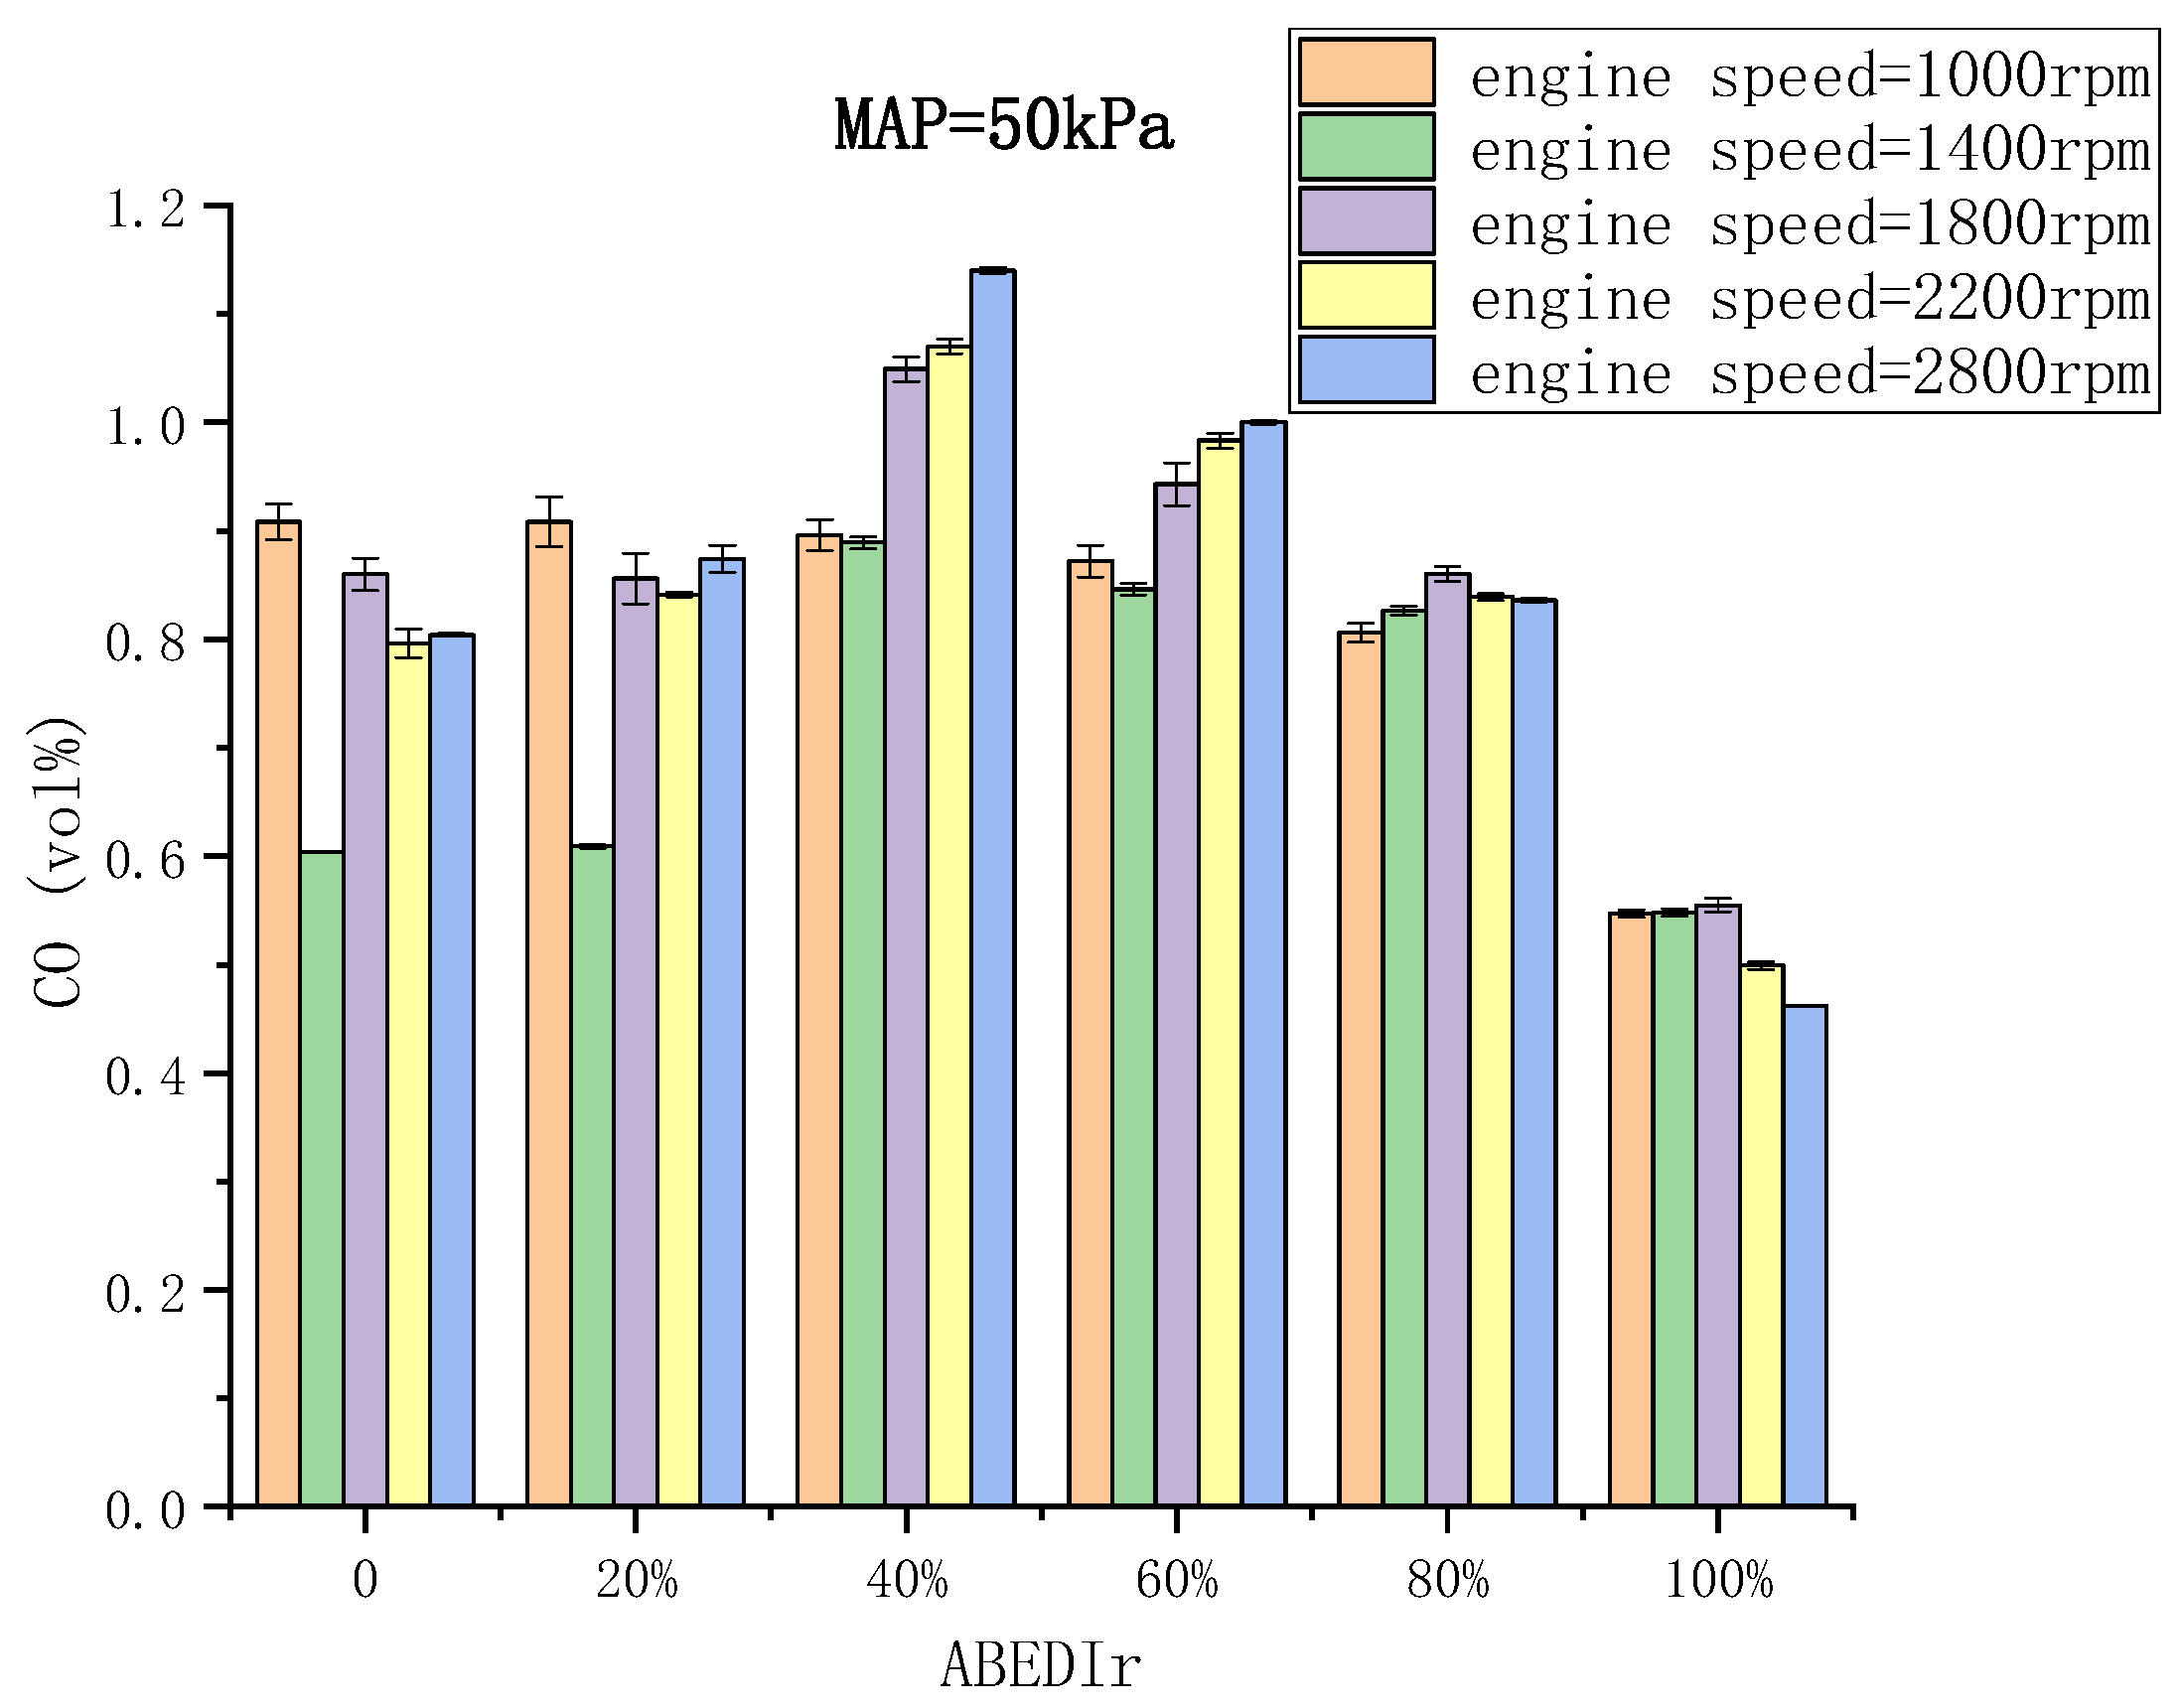
3.2.3. CO Emissions
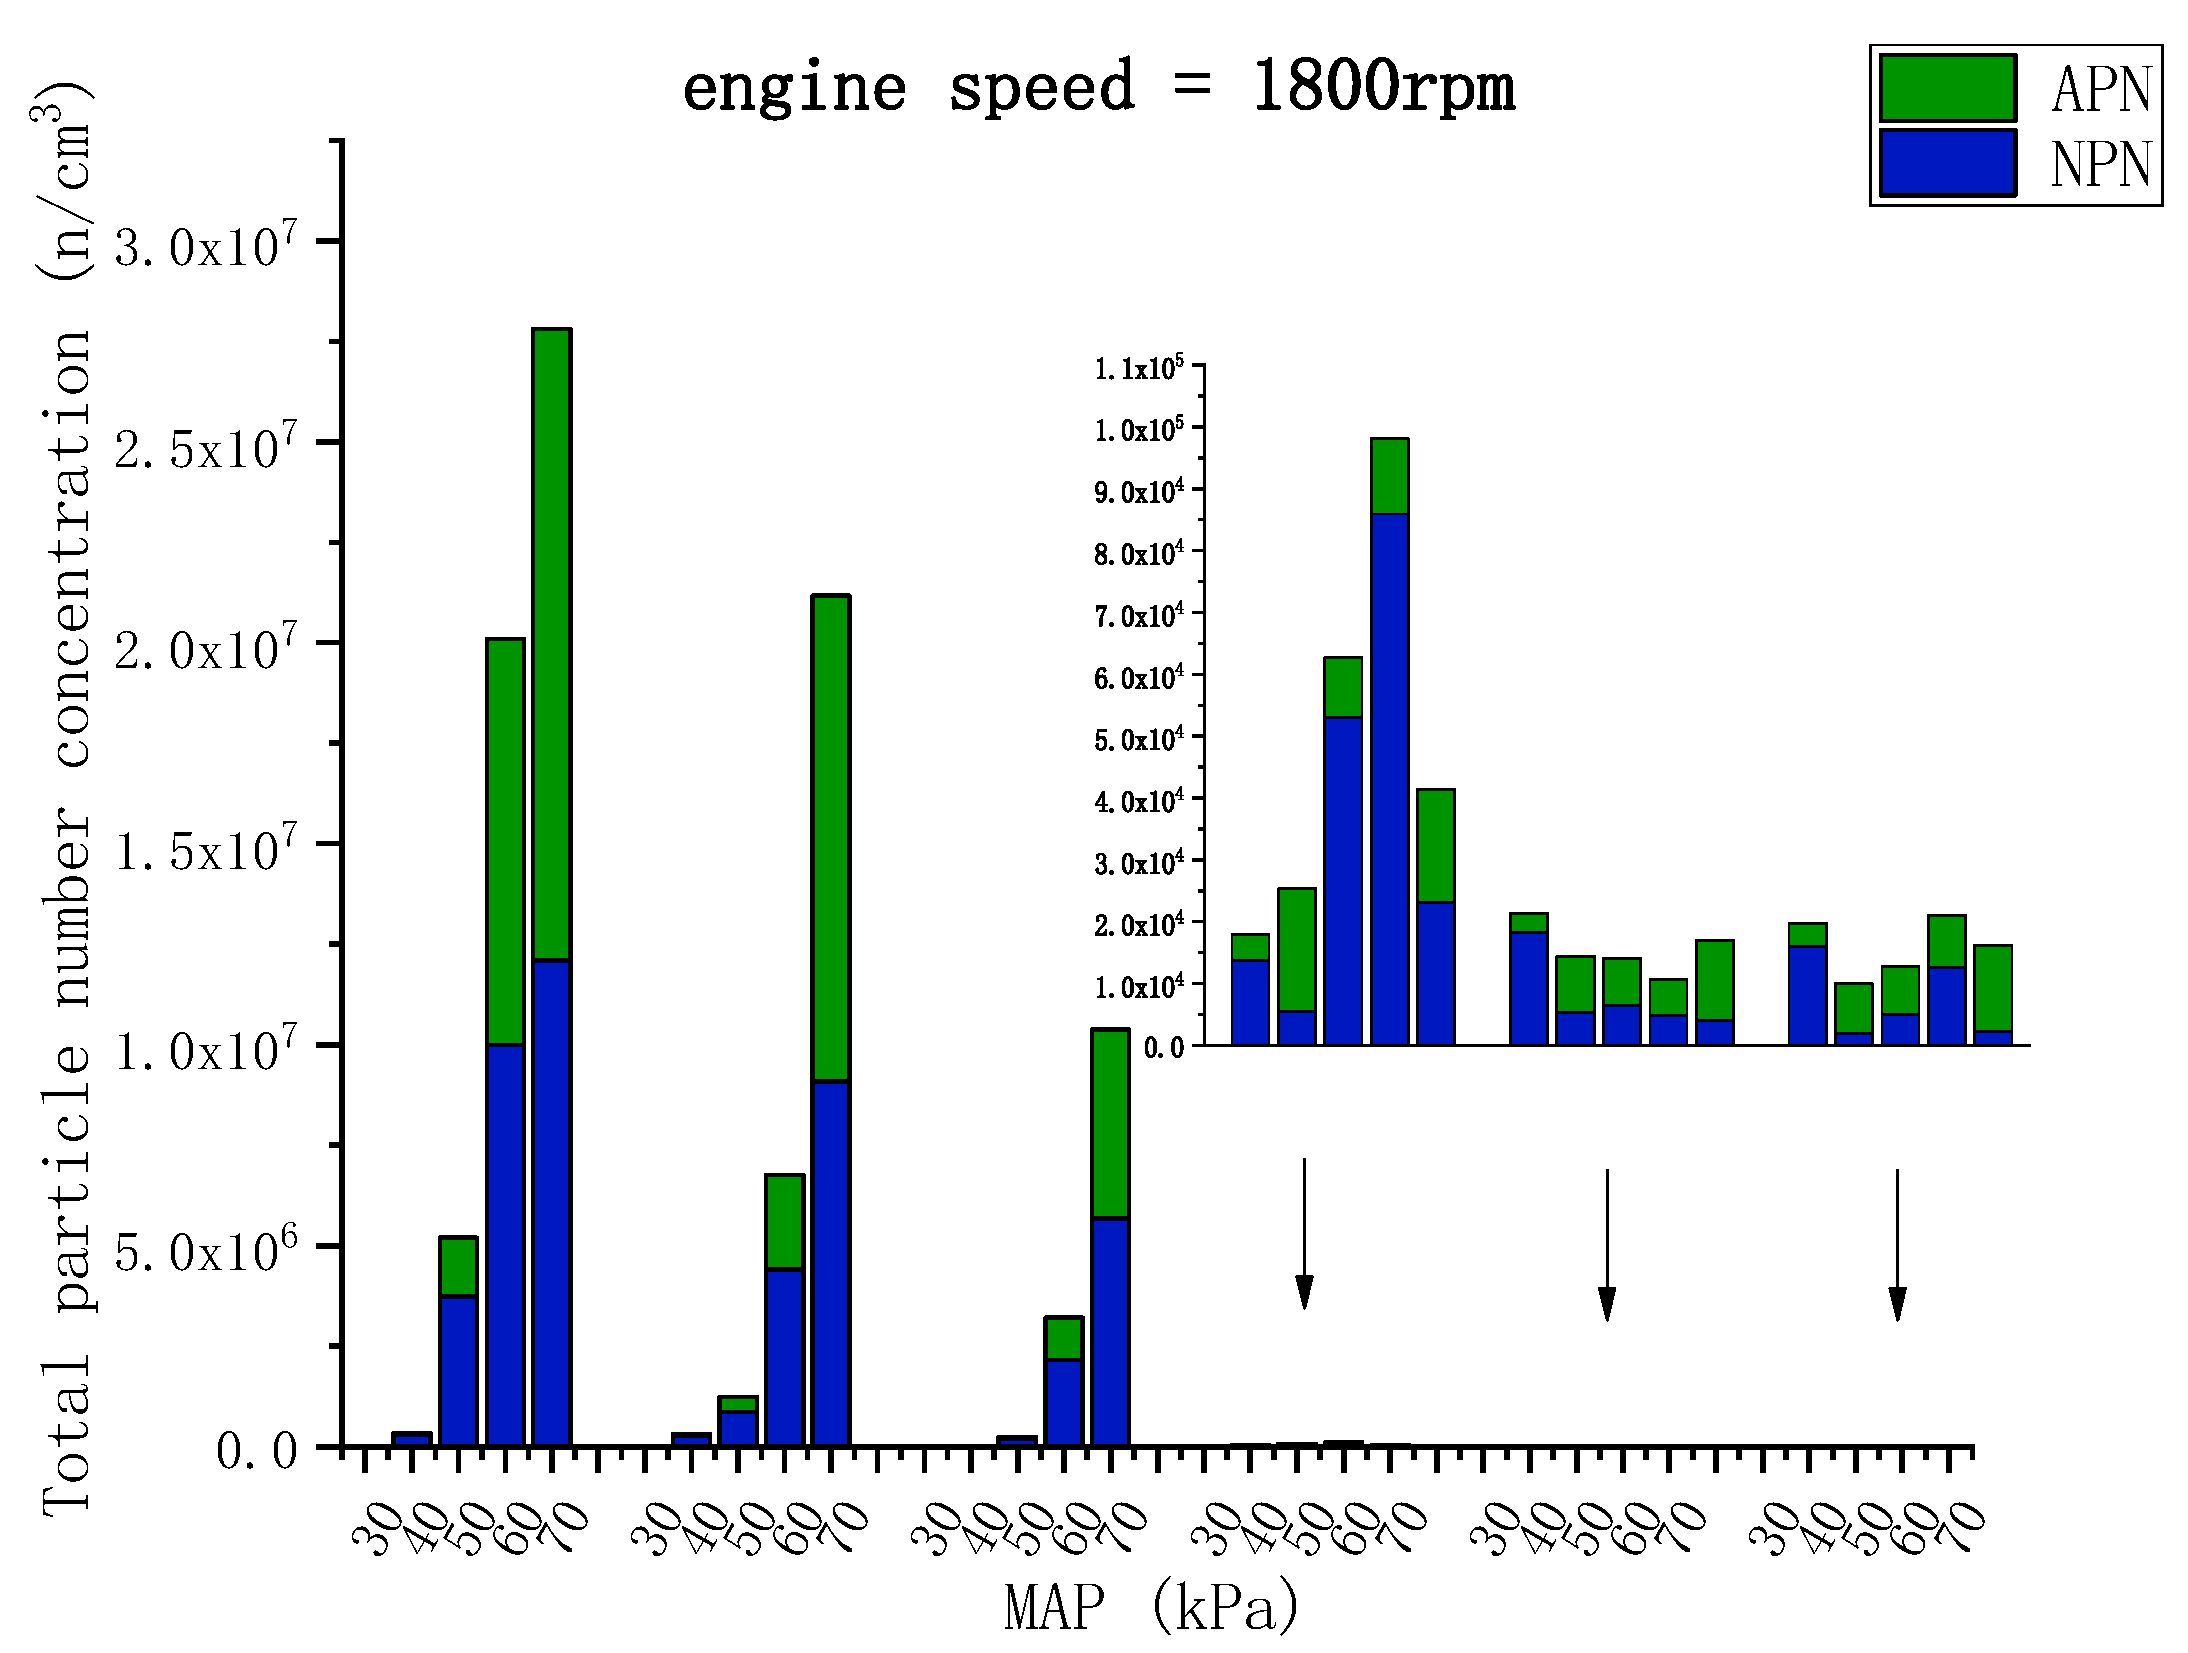
3.3. Particle Emissions
4. Conclusions
- In a fixed engine MAP = 50 kPa, when the engine speed was 1000–1800 rpm, 80% of ABEDIr can make the engine’s IMEP maximum. At the engine speeds of 2200 and 2600 rpm, 100% ABEDIr can reach the best IMEP. In the study with a fixed engine speed = 1800 rpm, when MAP = 30, 40, and 50 kPa, IMEP reached the maximum value at ABEDIr of 60%, 80%, and 80%, respectively. When the engine ran under loads of MAP = 60 and 70 kPa, IMEP increased continuously with the increase in ABEDIr, which suggests that pure ABE can attain better dynamic performance than gasoline;
- In a fixed engine MAP = 50 kPa, at all speeds, 60% ABEDIr can achieve the best HC and NOx emissions. The CO emissions were the best when the ABEDIr was 100%. In the study of fixed engine speed = 1800 rpm, the NOx emissions reached the lowest when the ABEDIr was 60%. When the ABEDIr was between 60% and 100%, HC emissions were less than half of those of pure gasoline. However, only when ABEDIr was greater than or equal to 80%, could the CO emissions be lower than those of gasoline;
- In the study of fixed engine MAP = 50 kPa, when ABEDIr was 60–100%, PN at the speed of 1800–2600 rpm was much lower than that of pure gasoline. In the study of a fixed engine speed = 1800 rpm, when ABEDIr was 0–40%, the NPN, APN, and TPN increased continuously with the increasing MAP. When the ABEDIr was 60–100%, PN reached very low levels at a MAP of 30–70 kPa, which is lower than 4 × 10⁴ n/cm3 at 80% and 100% ABEDIr. At least 60% ABEDIr should be used to control PN at medium and high loads;
- Overall, at low engine speeds and low loads, the dynamic performance of 80% ABEDIr was optimal. At higher speeds and loads, ABEDIr = 100% was optimal if the power performance was the main demand; otherwise, 80% ABEDIr can be selected to control emission performance and power performances at all operating states;
- According to the above research contents, it can be proved that a higher proportion of ABE in-cylinder direct injection can be applied to the engine instead of gasoline under many engine working conditions, which can bring great power performance and emissions performances.
Author Contributions
Funding
Institutional Review Board Statement
Informed Consent Statement
Conflicts of Interest
Nomenclature
| SI | Spark ignition | MAP | Intake manifold absolute pressure |
| CA | Crank angle | IMEP | Indicated mean effective pressure |
| GPI | Gasoline port injection | λ | Excess air ratio |
| NOx | Nitrogen | MBT | Minimum advance for best torque |
| CO | Carbon monoxide | BTDC | Before top dead center |
| HC | Hydrocarbon | PN | Particle number |
| ABEDI | ABE direct injection | TPN | Total particle number |
| ABEDIr | ABE direct injection ratio | APN | Accumulation mode particle number |
| LHV | Lower heating value | NPN | Nucleation mode particle number |
| LFS | Laminar flame speed | LHOV | Latent heat of vaporization |
| CA0-90 | The duration of the CA from ignition to 90% heat release | ||
| CI | Compression ignition | ABE | Acetone-butanol-ethanol |
| DIT | Direct injection timing | PAHs | Polycyclic aromatic hydrocarbons |
| BTE | Brake thermal efficiency | PFI | Port fuel injection |
| BSFC | Brake specific fuel consumption | rpm | Revolutions per minute |
References
- Hansen, A.C.; Zhang, Q.; Lyne, P.W.L. Ethanol-diesel fuel blends—A review. Bioresour. Technol. 2005, 96, 277–285. [Google Scholar] [CrossRef] [PubMed]
- Sangeeta; Moka, S.; Pande, M.; Rani, M.; Gakhar, R.; Sharma, M.; Rani, J.; Bhaskarwar, A.N. Alternative fuels: An overview of current trends and scope for future. Renew. Sustain. Energy Rev. 2014, 32, 697–712. [Google Scholar] [CrossRef]
- Catapano, F.; Di Iorio, S.; Magno, A.; Sementa, P.; Vaglieco, B.M. Measurement of Sub-23 nm Particles Emitted from PFI/DI SI Engine Fueled with Oxygenated Fuels: A Comparison between Conventional and Novel Methodologies. Energies 2022, 15, 2021. [Google Scholar] [CrossRef]
- Catapano, F.; Di Iorio, S.; Magno, A.; Vaglieco, B.M. Effect of fuel quality on combustion evolution and particle emissions from PFI and GDI engines fueled with gasoline, ethanol and blend, with focus on 10–23 nm particles. Energy 2022, 239, 122198. [Google Scholar] [CrossRef]
- Turner, J.W.G.; Lewis, A.G.J.; Akehurst, S.; Brace, C.J.; Verhelst, S.; Vancoillie, J.; Sileghem, L.; Leach, F.; Edwards, P.P. Alcohol fuels for spark-ignition engines: Performance, efficiency and emission effects at mid to high blend rates for binary mixtures and pure components. Proc. Inst. Mech. Eng. Part D J. Automob. Eng. 2018, 232, 36–56. [Google Scholar] [CrossRef]
- Yu, X.; Guo, Z.; Sun, P.; Wang, S.; Li, A.; Yang, H.; Li, Z.; Liu, Z.; Li, J.; Shang, Z. Investigation of combustion and emissions of an SI engine with ethanol port injection and gasoline direct injection under lean burn conditions. Energy 2019, 189, 116231. [Google Scholar] [CrossRef]
- Allam, S.; Elsaid, A.M. Parametric study on vehicle fuel economy and optimization criteria of the pleated air filter designs to improve the performance of an I.C diesel engine: Experimental and CFD approaches. Sep. Purif. Technol. 2020, 241, 116680. [Google Scholar] [CrossRef]
- Neumann, D.; Schäfers, L.; Muthyala, P.; Andert, J.; Pischinger, S. Reduction of Transient Engine-Out NOx-Emissions by Advanced Digital Combustion Rate Shaping. Automot. Innov. 2020, 3, 181–190. [Google Scholar] [CrossRef]
- Dziubak, T.; Karczewski, M. Experimental Study of the Effect of Air Filter Pressure Drop on Internal Combustion Engine Performance. Energies 2022, 15, 3285. [Google Scholar] [CrossRef]
- Wang, Y.; Yu, X.M.; Ding, Y.K.; Du, Y.D.; Chen, Z.; Zuo, X.Y.N. Experimental comparative study on combustion and particle emission of n-butanol and gasoline adopting different injection approaches in a spark engine equipped with dual-injection system. Fuel 2018, 211, 837–849. [Google Scholar] [CrossRef]
- Martins, J.; Brito, F.P. Alternative Fuels for Internal Combustion Engines. Energies 2020, 13, 4086. [Google Scholar] [CrossRef]
- Chen, Z.; Yang, F.; Xue, S.; Wu, Z.K.; Liu, J.P. Impact of higher n-butanol addition on combustion and performance of GDI engine in stoichiometric combustion. Energy Convers. Manag. 2015, 106, 385–392. [Google Scholar] [CrossRef]
- Yu, X.M.; Li, D.C.; Yang, S.; Sun, P.; Guo, Z.Z.; Yang, H.; Li, Y.N.; Wang, T.Q. Effects of hydrogen direct injection on combustion and emission characteristics of a hydrogen/Acetone-Butanol-Ethanol dual-fuel spark ignition engine under lean-burn conditions. Int. J. Hydrog. Energy 2020, 45, 34193–34203. [Google Scholar] [CrossRef]
- Kukharonak, H.; Ivashko, V.; Pukalskas, S.; Rimkus, A.; Matijošius, J. Operation of a Spark-ignition Engine on Mixtures of Petrol and N-butanol. Procedia Eng. 2017, 187, 588–598. [Google Scholar] [CrossRef]
- Freitas, E.S.D.C.; Guarieiro, L.L.N.; da Silva, M.V.I.; Amparo, K.K.d.S.; Machado, B.A.S.; Guerreiro, E.T.d.A.; de Jesus, J.F.C.; Torres, E.A. Emission and Performance Evaluation of a Diesel Engine Using Addition of Ethanol to Diesel/Biodiesel Fuel Blend. Energies 2022, 15, 2988. [Google Scholar] [CrossRef]
- Veza, I.; Said, M.F.M.; Latiff, Z.A. Recent advances in butanol production by acetone-butanol-ethanol (ABE) fermentation. Biomass Bioenergy 2021, 144, 105919. [Google Scholar] [CrossRef]
- Pratto, B.; Chandgude, V.; de Sousa Junior, R.; Goncalves Cruz, A.J.; Bankar, S. Biobutanol production from sugarcane straw: Defining optimal biomass loading for improved ABE fermentation. Ind. Crops Prod. 2020, 148, 112265. [Google Scholar] [CrossRef]
- Niglio, S.; Marzocchella, A.; Rehmann, L. Clostridial conversion of corn syrup to Acetone-Butanol-Ethanol (ABE) via batch and fed-batch fermentation. Heliyon 2019, 5, e01401. [Google Scholar] [CrossRef]
- Parisutham, V.; Kim, T.H.; Lee, S.K. Feasibilities of consolidated bioprocessing microbes: From pretreatment to biofuel production. Bioresour. Technol. 2014, 161, 431–440. [Google Scholar] [CrossRef]
- Palmqvist, E.; Hahn-Hagerdal, B. Fermentation of lignocellulosic hydrolysates. II: Inhibitors and mechanisms of inhibition. Bioresour. Technol. 2000, 74, 25–33. [Google Scholar] [CrossRef]
- Cao, L.; Lei, S. Research on Optimization Model of China’s Bio-fuel Ethanol Subsidy. In Proceedings of the 2nd International Conference on Energy and Environmental Protection (ICEEP 2013), Guilin, China, 19–21 April 2013; pp. 283–287. [Google Scholar]
- Estefan, R.M.; Brown, J.G. Evaluation of Possible Methanol Fuel Additives for Reducing Engine Wear and/or Corrosion; SAE International: Warrendale, PA, USA, 1990. [Google Scholar]
- Celik, M.B. Experimental determination of suitable ethanol-gasoline blend rate at high compression ratio for gasoline engine. Appl. Therm. Eng. 2008, 28, 396–404. [Google Scholar] [CrossRef]
- Serdar Yucesu, H.; Sozen, A.; Topgul, T.; Arcaklioglu, E. Comparative study of mathematical and experimental analysis of spark ignition engine performance used ethanol-gasoline blend fuel. Appl. Therm. Eng. 2007, 27, 358–368. [Google Scholar] [CrossRef]
- Balat, M.; Balat, H.; Oz, C. Progress in bioethanol processing. Prog. Energy Combust. Sci. 2008, 34, 551–573. [Google Scholar] [CrossRef]
- Sarkar, N.; Ghosh, S.K.; Bannerjee, S.; Aikat, K. Bioethanol production from agricultural wastes: An overview. Renew. Energy 2012, 37, 19–27. [Google Scholar] [CrossRef]
- Huang, Y.; Hong, G.; Huang, R. Investigation to charge cooling effect and combustion characteristics of ethanol direct injection in a gasoline port injection engine. Appl. Energy 2015, 160, 244–254. [Google Scholar] [CrossRef]
- Huang, Y.; Hong, G.; Huang, R. Numerical investigation to the dual-fuel spray combustion process in an ethanol direct injection plus gasoline port injection (EDI + GPI) engine. Energy Convers. Manag. 2015, 92, 275–286. [Google Scholar] [CrossRef]
- Dawang, L.; Li, J.; Haozhe, T.; Chuang, W. Research Progress on Biofuel Butyl Alcohol as Fuel for Automobile. Transp. Energy Conserv. Environ. Prot. 2019, 15, 4. [Google Scholar]
- Rakopoulos, C.D.; Dimaratos, A.M.; Giakoumis, E.G.; Rakopoulos, D.C. Study of turbocharged diesel engine operation, pollutant emissions and combustion noise radiation during starting with bio-diesel or n-butanol diesel fuel blends. Appl. Energy 2011, 88, 3905–3916. [Google Scholar] [CrossRef]
- Gu, X.; Huang, Z.; Cai, J.; Gong, J.; Wu, X.; Lee, C.-F. Emission characteristics of a spark-ignition engine fuelled with gasoline-n-butanol blends in combination with EGR. Fuel 2012, 93, 611–617. [Google Scholar] [CrossRef]
- Zhang, J.; Niu, S.; Zhang, Y.; Tang, C.; Jiang, X.; Hu, E.; Huang, Z. Experimental and modeling study of the auto-ignition of n-heptane/n-butanol mixtures. Combust. Flame 2013, 160, 31–39. [Google Scholar] [CrossRef]
- Sileghem, L.; Alekseev, V.A.; Vancoillie, J.; Van Geem, K.M.; Nilsson, E.J.K.; Verhelst, S.; Konnov, A.A. Laminar burning velocity of gasoline and the gasoline surrogate components iso-octane, n-heptane and toluene. Fuel 2013, 112, 355–365. [Google Scholar] [CrossRef] [Green Version]
- Zhifang, C. Investigation of Combustion Process and Emission Character of Butanol and Butanol/Gasoline Blends. Master’s Thesis, Hefei University of Technology, Hefei, China, 2013. [Google Scholar]
- Han, W. Investigation on Spray and Combustion Characteristics of ABE/Diesel Blends. Ph.D. Thesis, Chang’an Univesity, Chang’an, China, 2015. [Google Scholar]
- Zhou, N.; Huo, M.; Wu, H.; Nithyanandan, K.; Lee, C.-F.F.; Wang, Q. Low temperature spray combustion of acetone-butanol-ethanol (ABE) and diesel blends. Appl. Energy 2014, 117, 104–115. [Google Scholar] [CrossRef]
- Chang, Y.-C.; Lee, W.-J.; Wu, T.S.; Wu, C.-Y.; Chen, S.-J. Use of water containing acetone-butanol-ethanol for NOx-PM (nitrogen oxide-particulate matter) trade-off in the diesel engine fueled with biodiesel. Energy 2014, 64, 678–687. [Google Scholar] [CrossRef]
- Nithyanandan, K.; Zhang, J.; Li, Y.; Wu, H.; Lee, T.H.; Lin, Y.; Lee, C.-F.F. Improved SI engine efficiency using Acetone-Butanol-Ethanol (ABE). Fuel 2016, 174, 333–343. [Google Scholar] [CrossRef]
- Zhang, S.; Lee, T.H.; Wu, H.; Pei, J.; Wu, W.; Liu, F. Experimental and Kinetical Study of Component Volumetric Effects on Laminar Flame Speed of Acetone-Butanol-Ethanol (ABE). Energy Fuels 2018, 32, 6278–6292. [Google Scholar] [CrossRef]
- Li, Y.; Nithyanandan, K.; Lee, T.H.; Donahue, R.M.; Lin, Y.; Lee, C.-F.; Liao, S. Effect of water-containing acetone-butanol-ethanol gasoline blends on combustion, performance, and emissions characteristics of a spark-ignition engine. Energy Convers. Manag. 2016, 117, 21–30. [Google Scholar] [CrossRef]
- Li, Y.; Meng, L.; Nithyanandan, K.; Lee, T.H.; Lin, Y.; Lee, C.-F.F.; Liao, S. Experimental investigation of a spark ignition engine fueled with acetone-butanol-ethanol and gasoline blends. Energy 2017, 121, 43–54. [Google Scholar] [CrossRef]
- Nithyanandan, K.; Wu, H.; Huo, M.; Lee, C.F. A Preliminary Investigation of the Performance and Emissions of a Port-Fuel Injected SI Engine Fueled with Acetone-Butanol-Ethanol (ABE) and Gasoline; SAE Technical Paper; SAE: Warrendale, PA, USA, 2014. [Google Scholar]
- Guo, Z.; Yu, X.; Sang, T.; Chen, Z.; Cui, S.; Xu, M.; Yu, L. Experimental study on combustion and emissions of an SI engine with gasoline port injection and acetone-butanol-ethanol (ABE) direct injection. Fuel 2021, 284, 119037. [Google Scholar] [CrossRef]
- Guo, Z.; Yu, X.; Li, G.; Sun, Y.; Zhao, Z.; Li, D. Comparative study of different injection modes on combustion and particle emission of acetone-butanol-ethanol (ABE) and gasoline in a dual-injection SI engine. Fuel 2020, 281, 118786. [Google Scholar] [CrossRef]
- Guo, Z.; Yu, X.; Dong, W.; Sun, P.; Shi, W.; Du, Y.; Shang, Z.; Zhao, Z.; Li, D.; Wang, T. Research on the combustion and emissions of an SI engine with acetone-butanol-ethanol (ABE) port injection plus gasoline direct injection. Fuel 2020, 267, 117311. [Google Scholar] [CrossRef]
- Graham, L.A.; Belisle, S.L.; Baas, C.-L. Emissions from light duty gasoline vehicles operating on low blend ethanol gasoline and E85. Atmos. Environ. 2008, 42, 4498–4516. [Google Scholar] [CrossRef]
- Veloo, P.S.; Wang, Y.L.; Egolfopoulos, F.N.; Westbrook, C.K. A comparative experimental and computational study of methanol, ethanol, and n-butanol flames. Combust. Flame 2010, 157, 1989–2004. [Google Scholar] [CrossRef]
- Chong, C.T.; Hochgreb, S. Measurements of laminar flame speeds of acetone/methane/air mixtures. Combust. Flame 2011, 158, 490–500. [Google Scholar] [CrossRef]
- Van Geem, K.M.; Cuoci, A.; Frassoldati, A.; Pyl, S.P.; Marin, G.B.; Ranzi, E. An Experimental and Kinetic Modeling Study of Pyrolysis and Combustion of Acetone–Butanol–Ethanol (ABE) Mixtures. Combust. Sci. Technol. 2012, 184, 942–955. [Google Scholar] [CrossRef]
- Coratella, C.; Parry, L.; Li, Y.; Xu, H. Experimental Investigation of the Rail Pressure Fluctuations Correlated with Fuel Properties and Injection Settings. Automot. Innov. 2021, 4, 215–226. [Google Scholar] [CrossRef]
- Dziubak, T.; Karczewski, M. Experimental Studies of the Effect of Air Filter Pressure Drop on the Composition and Emission Changes of a Compression Ignition Internal Combustion Engine. Energies 2022, 15, 4815. [Google Scholar] [CrossRef]
- Guan, C.; Cheung, C.S.; Li, X.; Huang, Z. Effects of oxygenated fuels on the particle-phase compounds emitted from a diesel engine. Atmos. Pollut. Res. 2017, 8, 209–220. [Google Scholar] [CrossRef]
- Zhao, Z.; Liu, W.; Li, F.; Fan, Q.; Wang, Z. Distributed Gas Ignition Using Injection Strategy for High Efficiency and Clean Combustion Under Lean Condition. Automot. Innov. 2020, 3, 366–373. [Google Scholar] [CrossRef]


| Engine Type | Spark Ignition, Four Cylinder, Combined Injection |
|---|---|
| Compression ratio | 9.6:1 |
| Displacement | 1.984 L |
| Bore × stroke | 82.5 × 92.8 mm |
| Maximum power | 137 kW (5000 rpm) |
| Maximum torque | 320 N·m (1600–4000 rpm) |
| Measured Parameters | Equipment Model | Measuring Accuracy | Measuring Range | Uncertainty (%) |
|---|---|---|---|---|
| Torque | CW160 | ≤±0.28 N·m | 0–600 N·m | ±2 |
| Speed | CW160 | ≤±1 rpm | 0–6000 rpm | ±0.07 |
| Cylinder pressure | AVL-GU13Z-24 | ≤±0.5% | 0–20 MPa | ±0.5 |
| Crank angle (CA) | Kistler-2614B | ≤±0.5° | 0–720° | ±0.07 |
| Excess air ratio (λ) | LAMBDA LA4 | ≤±0.1 | 0.700–32.767 | ±1 |
| CO | AVL-GAS 1000 | ≤±0.01% | 0–15% vol | ±3.5 |
| HC | AVL-GAS 1000 | ≤±1 ppm | 0–30,000 ppm vol | ±3.5 |
| NOx | AVL-GAS 1000 | ≤±1 ppm | 0–5000 ppm vol | ±2 |
| Particle number | DMS 500 | ≤±1.4 × 10⁴ dN/dlgDp(cm3) | 0–1011 dN/dlgDp(cm3) | ±1 |
| Gasoline mass flow rate | Ono Sokki DF-2420 | ≤±0.01 g/s | 0.2–82 kg/h | ±0.03 |
| Acetone | Butanol | Ethanol | ABE (3:6:1) | Gasoline | |
|---|---|---|---|---|---|
| Chemical formula | C3H6O | C4H9OH | C2H5OH | C3.5H8.4O | C4-C12 |
| Research octane number | 117 | 96 | 100 | 102.7 | 88–99 |
| C/H atom ratio | 0.50 | 0.40 | 0.33 | 0.42 | 0.44 |
| Oxygen content (wt.%) | 27.6 | 21.6 | 34.8 | 24.7 | — |
| Density at 288 K (kg/m3) | 791 | 813 | 795 | 804.6 | 770 |
| LHV (MJ/kg) | 29.6 | 33.1 | 26.8 | 31.4 | 43.5 |
| LHOV at 298 K (kJ/kg) | 518 | 582 | 904 | 595 | 380–500 |
| Stoichiometric air–fuel ratio | 9.5 | 11.2 | 9.0 | 10.5 | 14.7 |
| Laminar flame speed (cm/s) | 34 B | 48 C | 48 C | 37 B | 33–44 A |
| Variable Values | Engine Test Conditions | |
|---|---|---|
| Part I | Engine speed = 1000, 1400, 1800, 2200, 2600 rpm ABEDIr = 0, 20%, 40%, 60%, 80%, 100% | λ = 1.0 |
| Ignition timing = MBT | ||
| PFI injection timing = 340 °CA BTDC | ||
| PFI pressure = 0.3 MPa | ||
| ABEDI injection timing = 300 °CA BTDC | ||
| ABEDI injection pressure = 9 MPa | ||
| MAP = 50 kPa | ||
| Part II | MAP = 30, 40, 50, 60, 70 kPa ABEDIr = 0, 20%, 40%, 60%, 80%, 100% | λ = 1.0 |
| Ignition timing = MBT | ||
| PFI injection timing = 340 °CA BTDC | ||
| PFI pressure = 0.3 MPa | ||
| ABEDI injection timing = 300 °CA BTDC | ||
| ABEDI injection pressure = 9 MPa | ||
| Engine speed = 1800 rpm |
| G100 (Pure Gasoline) | ABE20 | ABE40 | ABE60 | ABE80 | ABE100 (Pure ABE) | |
|---|---|---|---|---|---|---|
| ABEDIr | 0% | 20% | 40% | 60% | 80% | 100% |
| GPI ratio | 100% | 80% | 60% | 40% | 20% | 0% |
| Total energy change | 0% | 0.2% | 0.4% | 0.6% | 0.8% | 1% |
Publisher’s Note: MDPI stays neutral with regard to jurisdictional claims in published maps and institutional affiliations. |
© 2022 by the authors. Licensee MDPI, Basel, Switzerland. This article is an open access article distributed under the terms and conditions of the Creative Commons Attribution (CC BY) license (https://creativecommons.org/licenses/by/4.0/).
Share and Cite
Zhang, J.; Yu, X.; Guo, Z.; Li, Y.; Zhang, J.; Liu, D. Study on Combustion and Emissions of a Spark Ignition Engine with Gasoline Port Injection Plus Acetone–Butanol–Ethanol (ABE) Direct Injection under Different Speeds and Loads. Energies 2022, 15, 7028. https://doi.org/10.3390/en15197028
Zhang J, Yu X, Guo Z, Li Y, Zhang J, Liu D. Study on Combustion and Emissions of a Spark Ignition Engine with Gasoline Port Injection Plus Acetone–Butanol–Ethanol (ABE) Direct Injection under Different Speeds and Loads. Energies. 2022; 15(19):7028. https://doi.org/10.3390/en15197028
Chicago/Turabian StyleZhang, Jufang, Xiumin Yu, Zezhou Guo, Yinan Li, Jiahua Zhang, and Dongjie Liu. 2022. "Study on Combustion and Emissions of a Spark Ignition Engine with Gasoline Port Injection Plus Acetone–Butanol–Ethanol (ABE) Direct Injection under Different Speeds and Loads" Energies 15, no. 19: 7028. https://doi.org/10.3390/en15197028