Article

Effects of Radial and Circumferential Flows on Power Density Improvements of Tubular Solid Oxide Fuel Cells

State Key Laboratory of Automotive Safety and Energy, School of Vehicle and Mobility, Tsinghua University, Beijing 100084, China
*
Author to whom correspondence should be addressed.
Energies 2022, 15(19), 7048; https://doi.org/10.3390/en15197048
Submission received: 9 August 2022 / Revised: 12 September 2022 / Accepted: 14 September 2022 / Published: 25 September 2022

Abstract

:
Improving the power density of SOFC stacks will accelerate their integration into mobile applications. We developed a 3D Multiphysics model validated by experimental results from early studies to examine the effect of radial and circumferential flows on the power density improvements in a micro-tubular SOFC. The inserts were placed inside the fuel channel to generate flow in different directions. The effects of geometric parameters of these inserts on flow and mass transfer in the fuel channel and porous anode were analyzed. We demonstrate that the radial flow enables the fuel to penetrate directly into the porous anode, increasing the local fuel concentration and enhancing the fuel diffusion to the anode triple-phase boundaries. We found that the circumferential flow has a negligible effect on the diffusion process in the anode and on the increase in power density. The impact of local convective and diffusive mass transfer mechanisms on power density improvement is analyzed using the local Péclet number along the axial direction. Enlarging the radial velocity component perpendicular to the porous anode could effectively increase the power density of the micro-tubular SOFC by 37%. This study helps improve our understanding of mass transfer in fuel channels and helps build a foundation for SOFC channel designs and optimizations.

1. Introduction

The increasing demand for energy has a detrimental impact on the environment [1]. There are intense research efforts that are focused on finding efficient, inexpensive, and environmentally friendly ways to produce energy. A significant portion of this effort is devoted to fuel cell technology, which is an energy conversion system that produces electricity directly from oxidizing a fuel through electrochemical reactions [2]. Compared to other power generation systems, fuel cells have a high electrical efficiency of 40 to 60% [3]. Fuel cells come in several types, such as alkaline fuel cells (AFC), proton exchange membrane fuel cells (PEMFC), and solid oxide fuel cells (SOFC). Among these fuel cell technologies, the alkaline fuel cell (AFC) was one of the first fuel cell technologies used in real-world applications and made electrical power generation from hydrogen feasible [4]. It has the benefit of operating almost instantly without pre-heating requirements, even at below-freezing temperatures [5]. Alkaline fuel cell stacks are used in spacecrafts to generate electricity and provide drinkable water for astronauts [6]. PEMFC stacks are considered a good candidate for powering vehicles [7]. They have the advantage of a fast start-up process and a high volumetric power density [8]. Solid oxide fuel cell stacks are attracting great attention from both the automotive and aircraft industries [9,10,11] due to their fuel flexibility [12], compact design, and high-power efficiency [13,14,15]. The electrochemical reactions in SOFC stacks do not require a platinum catalyst [16]. Early studies of SOFC stacks were mainly concerned with their potential application in stationary power generation [17]. Recently, the application of solid oxide fuel cells (SOFC) in powering vehicles has consistently evolved. Several successful demonstrations of SOFC in mobile applications have been made, including the integration of a SOFC heat engine within a passenger car [18], a SOFC-based auxiliary power unit for a heavy-duty long-haul truck [19], and a regional jet [20]. Other research institutes developed miniaturized SOFC stacks to power drones and to replace the lithium-ion batteries in cellphones and laptops [21]. However, several challenges are holding back the full integration of this technology in mobile applications, such as long start-up time, poor thermal cycling durability, and low stack power density. Recent studies made significant progress in reducing the start-up time [22,23,24] and improving the thermal cycling reliability [25,26,27]. Recently, the problem of low output power density has been receiving more and more attention for both stationary and mobile applications. Improving the output power density can effectively reduce the commercialization cost and the size of the SOFC stack to meet the requirements of the automotive and aircraft industries.
Rigorously understanding the influence of fluid dynamics of the reactants on electrochemical reactions contributes significantly to improving the output power density of SOFC stacks. The local distribution and consumption of these reactants largely depend on the channel design of the SOFC stack. The flow characteristics could primarily influence the local electrochemical reaction in the SOFC stack. In the literature, the flow field designs are classified into three main categories: designing different inlet and outlet manifolds, designing various channel shapes, and placing inserts in flow channels.
The purpose of inlet and outlet manifolds design is to evenly distribute the airflow inside the SOFC stack. Numerous studies have examined the influence of various manifold designs on the performance of SOFC stacks. A detailed examination of the manifold design influence on the performance of a single MT-SOFC using three different flow manifold configurations, including single inlet/outlet line-type and single and double inlet/outlet Z-type, was conducted by Yu et al. [28]. Their investigation showed that compared to the single inlet/outlet line-type and Z-type, the double inlet/outlet Z-type could better improve the airflow distribution quality. A later study examined single inlet/outlet line-type, double inlet/outlet U-type, and modified external airflow path type for a 49-tubular SOFC stack [29]. They discovered that reducing the width of the exhaust header and the first tube row to half in the modified type was essential in increasing SOFC performance. The improved external airflow channel provided enough air and better gas distribution compared to the other types. The influence of manifold design on SOFC power density was further investigated with other channel flow field designs, including helical design, traditional parallel and modified parallel designs, as well as single-, double-, and triple-entry serpentine designs [30]. The results showed that the triple-entry serpentine flow field design outperforms the single and double serpentine designs in terms of performance by 5.18%. Another previous study investigated the effect of inlet/outlet manifolds on flow uniformity in planar SOFC stacks [31]. It is important to note that their research found that the width ratio of the inlet manifold to the outlet manifold was the most crucial element affecting flow uniformity. They found that increasing the width ratio of the inlet to outlet manifold could increase the flow uniformity index. However, they mention that increasing the flow uniformity index above 0.80 could negatively affect the volumetric power density. Valery et al. [32] tried to improve the performance of a planar SOFC by intensifying the mass transfer with radial guides in straight channels. They found that the cell performance of the new guided flow channel design achieves a more uniform velocity distribution, current density, and species concentration when compared to the conventional parallel flow channel design. Similarly, Huang et al. [33] examined the influence of four different interconnect designs on the power density of a planar SOFC. They found that the design with small, evenly spaced guide vanes resulted in a more uniform flow distribution than the other designs. It also eliminated the local hot spots and increased the peak power density by 11%.
The shape of the channel is another factor that affects the convective heat and mass transfer characteristics in SOFC stacks. Different flow channel shapes, such as rectangular, triangular, and trapezoidal, have been investigated. Khazaee studied the influence of the three-flow channel shapes on a planar SOFC performance [34]. In their research, they found that the rectangular channel resulted in higher performance when compared to the triangular and trapezoidal. Rectangular and triangular flow channels resulted in a 27% and 22% increase in power density, respectively, compared to the trapezoidal design. Liu’s study realized that when optimizing the channel rib-geometry for a pitch greater than 2 mm, the interconnect rib width had a noticeable impact on the SOFC output current density, which increased by 10 to 20% compared to the conventional interconnect rib design [35]. Another related study examined the influence of the interconnect flow channel design on the performance of a planar SOFC [36]. They found that substituting the cathode flow channel with a porous current collector can increase the power density by 6.3% and the electrical efficiency by 8.6% compared to the conventional interconnect design. In order to increase the volumetric power density of SOFC, Christman sought to increase the reaction area inside the flow channel by adopting the cross-flow roughness technique with four rib-geometries [37]. In their research, they reported that the increase in the surface area of the electrolyte was proportional to the increase in power density. While at low Reynolds numbers, the cross-flow roughness geometries had a negligible effect on flow mixing. The cross-flow roughness geometries could enhance the volumetric power density and the active area of the cells without compromising their thermal stability.
The performance of the SOFC stack can also be enhanced using an insert structure in fuel channels. Huang et al. [33] successfully increased the peak power density up to 14% by placing a Ni-mesh insert as the contact layer between the anode and the interconnect. This inspired Canavar et al. to develop an innovative flow field design using woven nickel meshed wire insert inside the anode channel for a large-sized tubular SOFC [38]. The experiment showed that the flow field created solely by the woven nickel meshed insert results in a peak power density of 36% compared to the conventional flow field design. The increase in power density may result from secondary flow (the cross-sectional flow perpendicular to the main flow direction) since the flow characteristics directly affect the mass transfer characteristics inside the porous electrode. Although these early studies proved that the secondary flow created by the insert structure has a great potential to increase the power density, the influence of the secondary flow on the mass transfer of reactants and the electrochemical reactions needs further investigation. Our early study analyzes the working mechanisms of the recirculating flows in the air channels on heat transfer enhancement [39], but the influences of different insert structures on mass transfer characteristics in fuel channels are not well-discussed. The secondary flow in a tubular SOFC includes both radial and circumferential flows. Our recent study partially covered the effect of radial flows on electrochemical reactions [40]. However, there was no discussion on how the width of the inserts affected the electrochemical reactions. The mixing effect in the fuel channels due to the circumferential flows was also not investigated.
In this study, we compared the effects of two different insert structures in fuel channels on power density improvements and gas-phase pressure drop of the micro-tubular SOFC. The first is cone-insert, which induces the flow in the radial direction and enlarges the velocity component perpendicular to the electrode, forcing the fuel to enter the anode. The other is a helical screw insert that induces the flow in the circumferential direction, which enhances fuel-mixing in fuel channels. The flow and mass transfer characteristics in the fuel channel and porous anode were simulated, and we discuss the relationship between flow characteristics and power density improvement. The influence of insert parameters such as gap, width, and pitch variations on the power density improvement of the micro-tubular SOFC were investigated. We propose a criterion based on the local Péclet number along the axial direction to analyze the effect of the local convective and diffusive mass transfer mechanism on the power density improvements. The cell mole fraction distribution, normalized power density, and pressure drop are also plotted and compared to a micro-tubular SOFC without inserts.
In Section 2, we provide a brief overview of model development, boundary conditions, and experimental validation. In Section 3, we present and discuss the influences of the radial and circumferential flows on the electrochemical reactions and gas-phase pressure drop.

2. Model Description

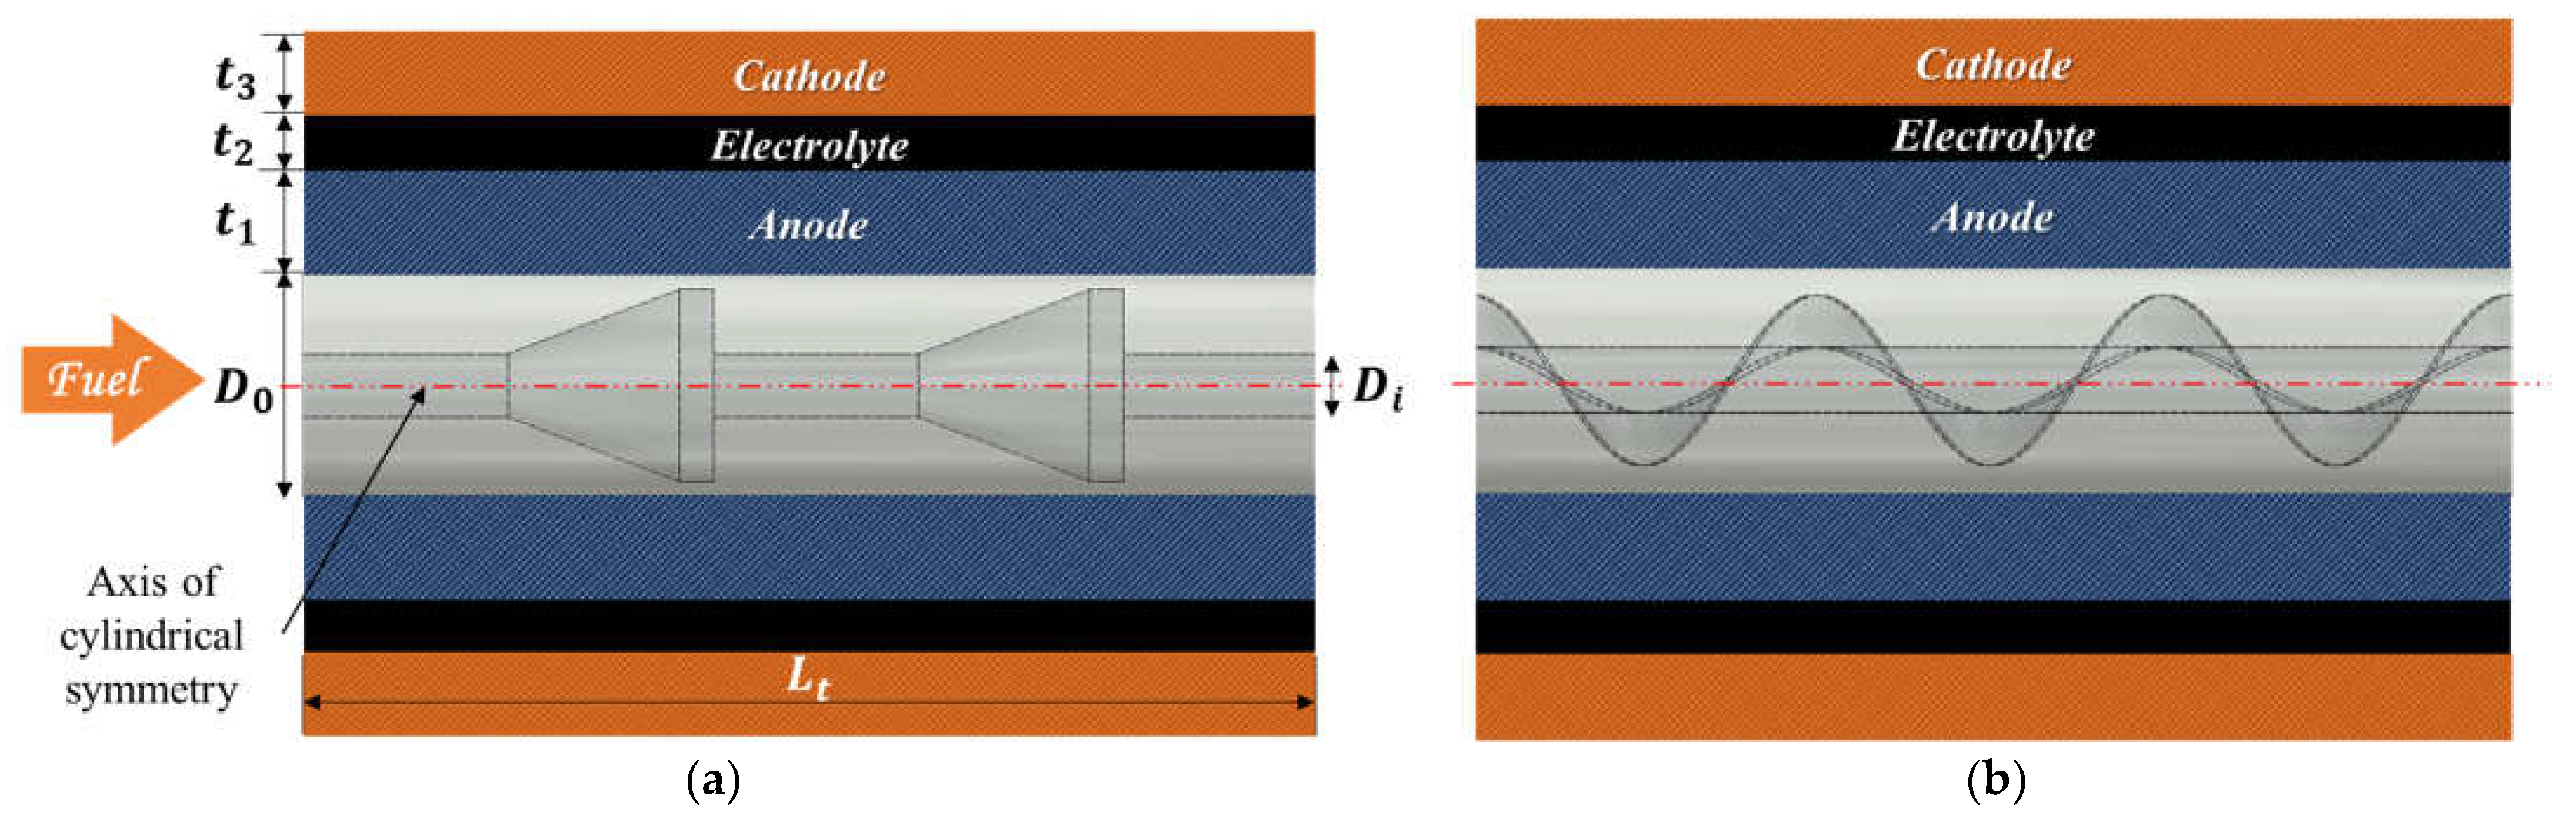
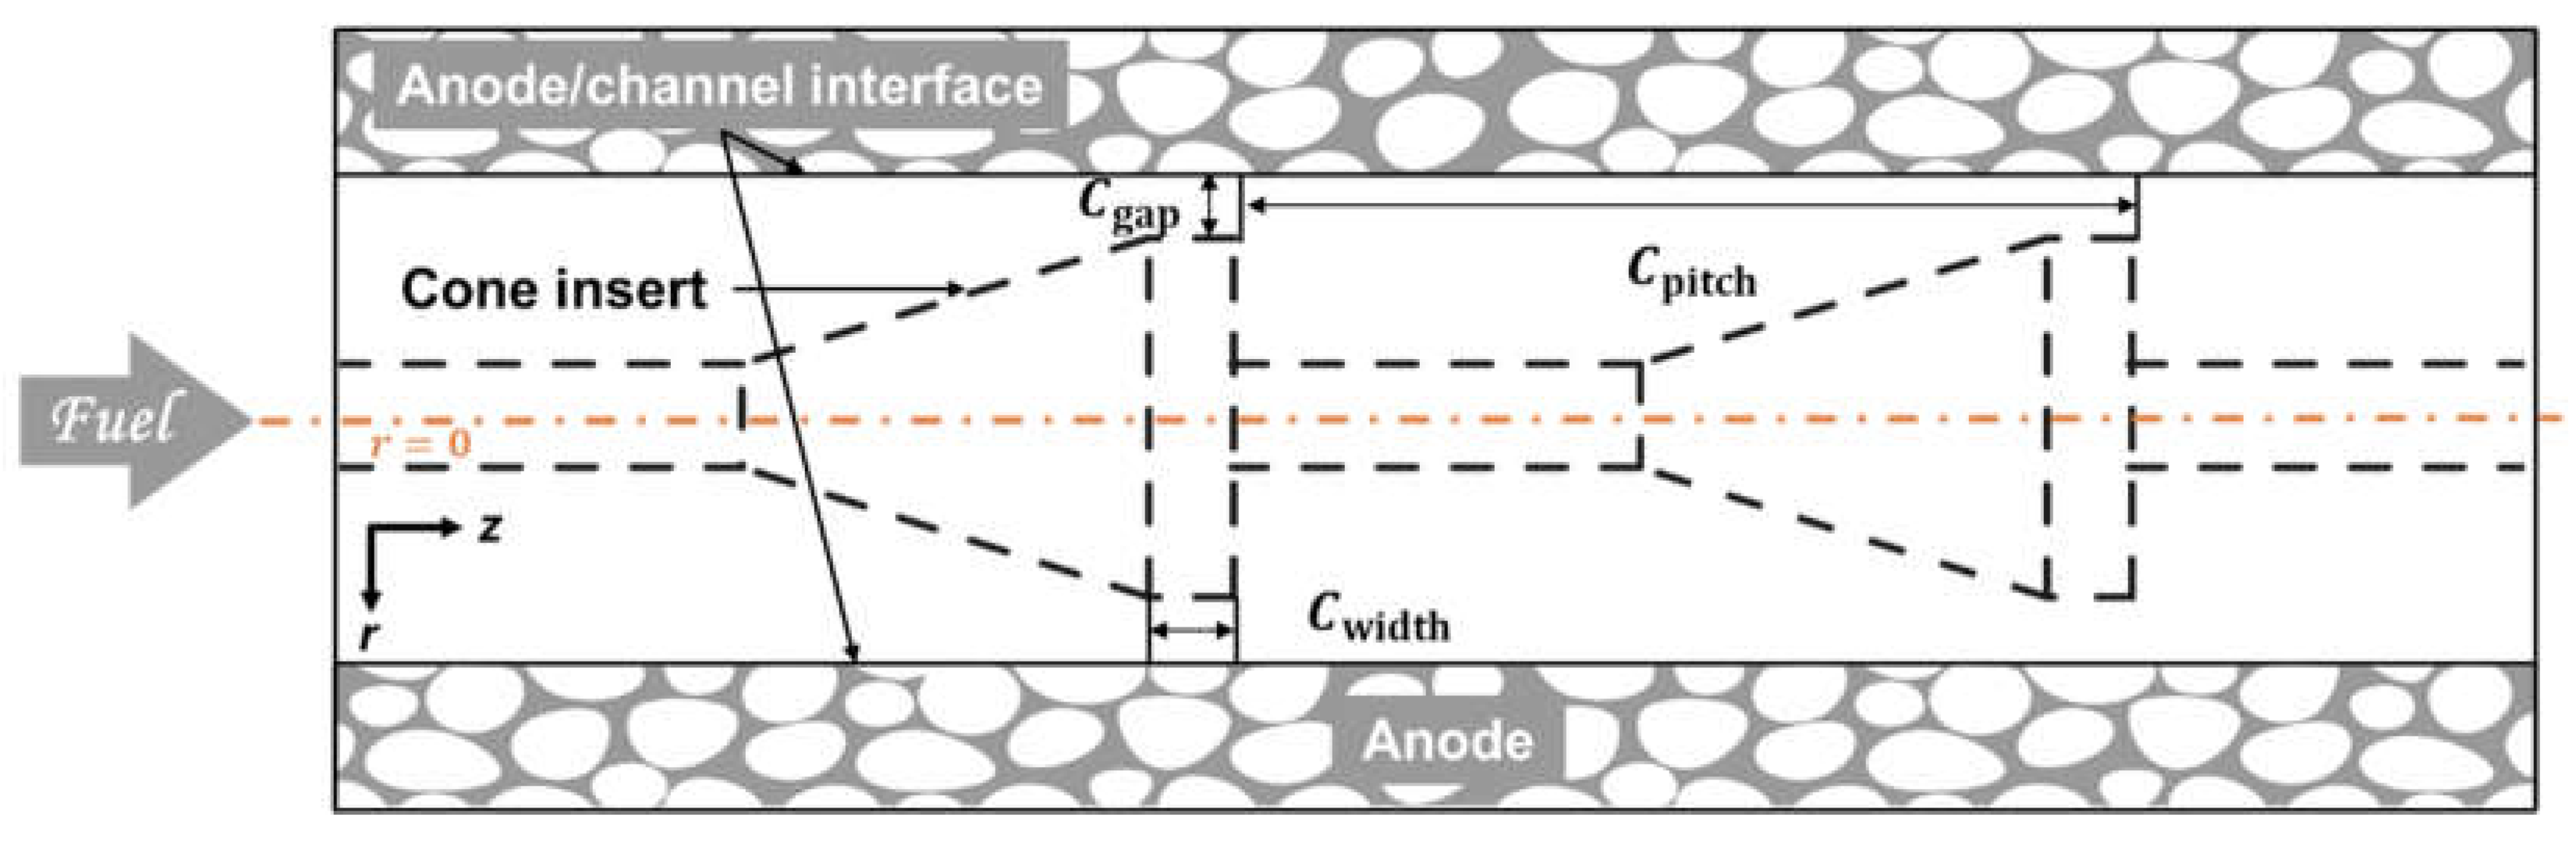
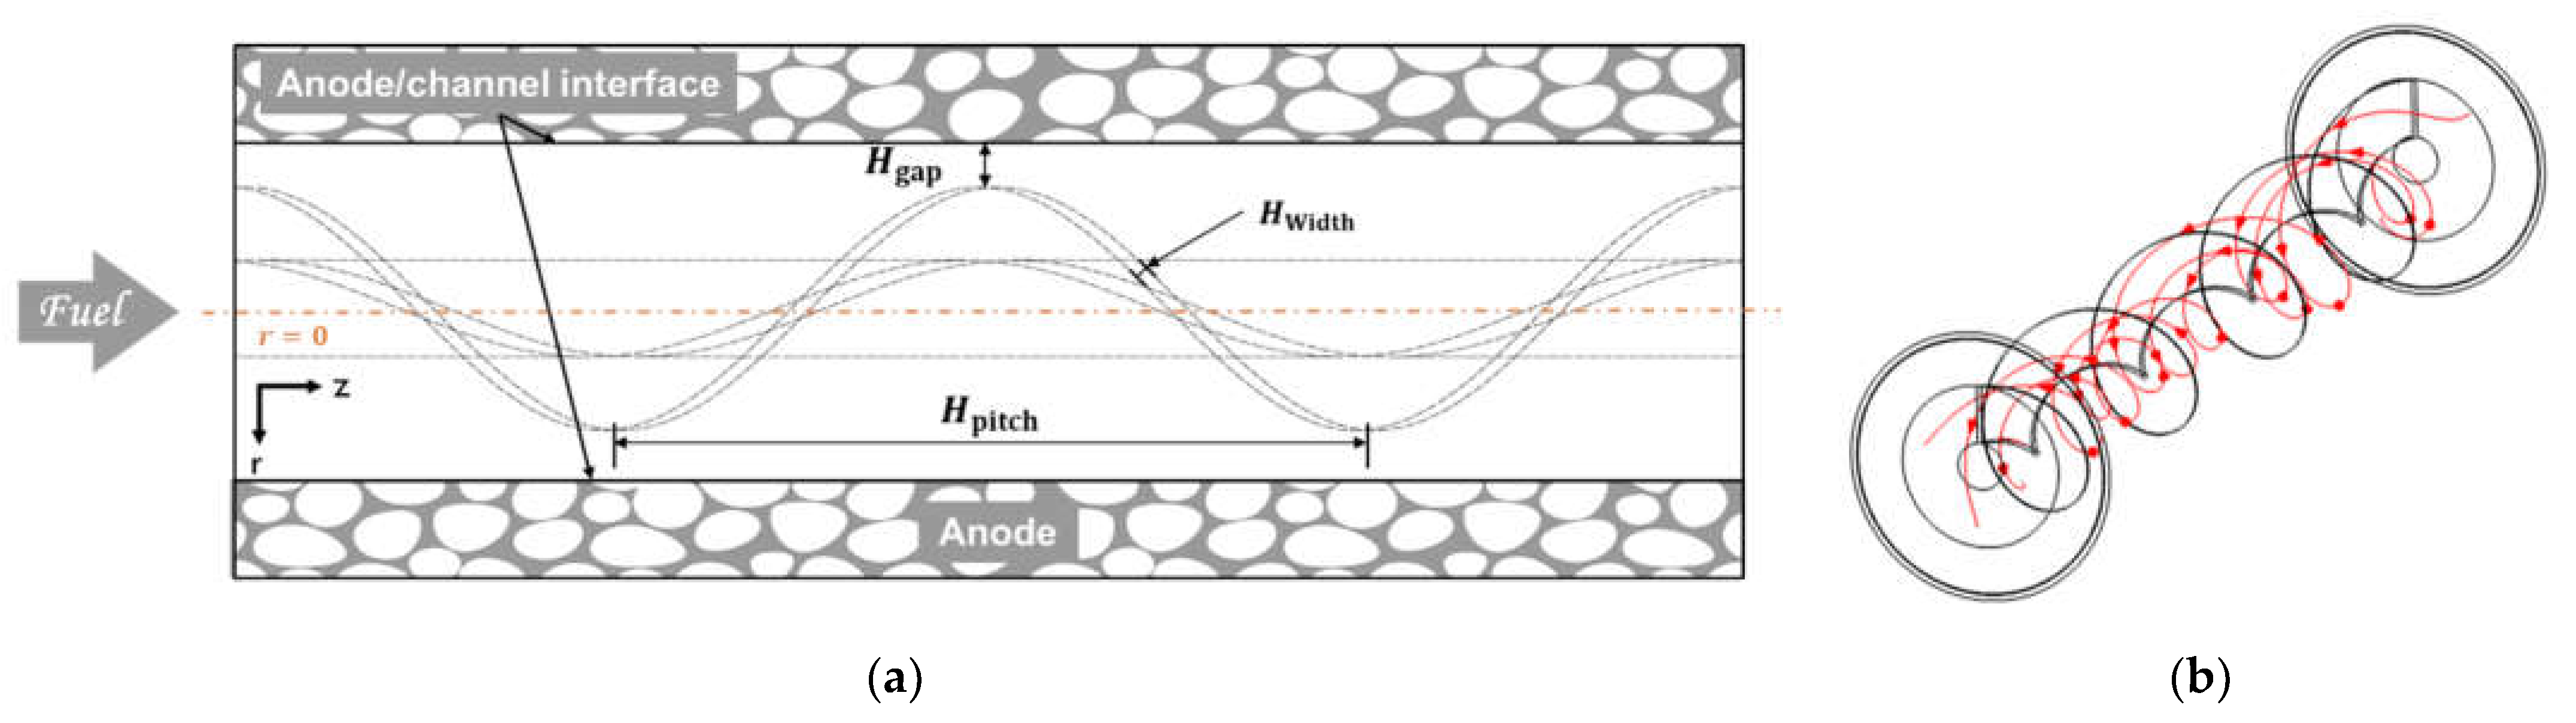
2.1. Geometry Description

A 3D Multiphysics model was developed in this study to examine the flow and mass transfer characteristics of a single anode-supported micro-tubular solid oxide fuel cell with inserts placed in fuel channels. As illustrated in Figure 1, this model considered two types of inserts: cones and helical screw inserts. The cone-inserts mainly induced the radial flows, while the helical screw inserts aimed to generate the circumferential flows. Table 1 summarizes the geometrical parameters of the micro-tubular SOFC.

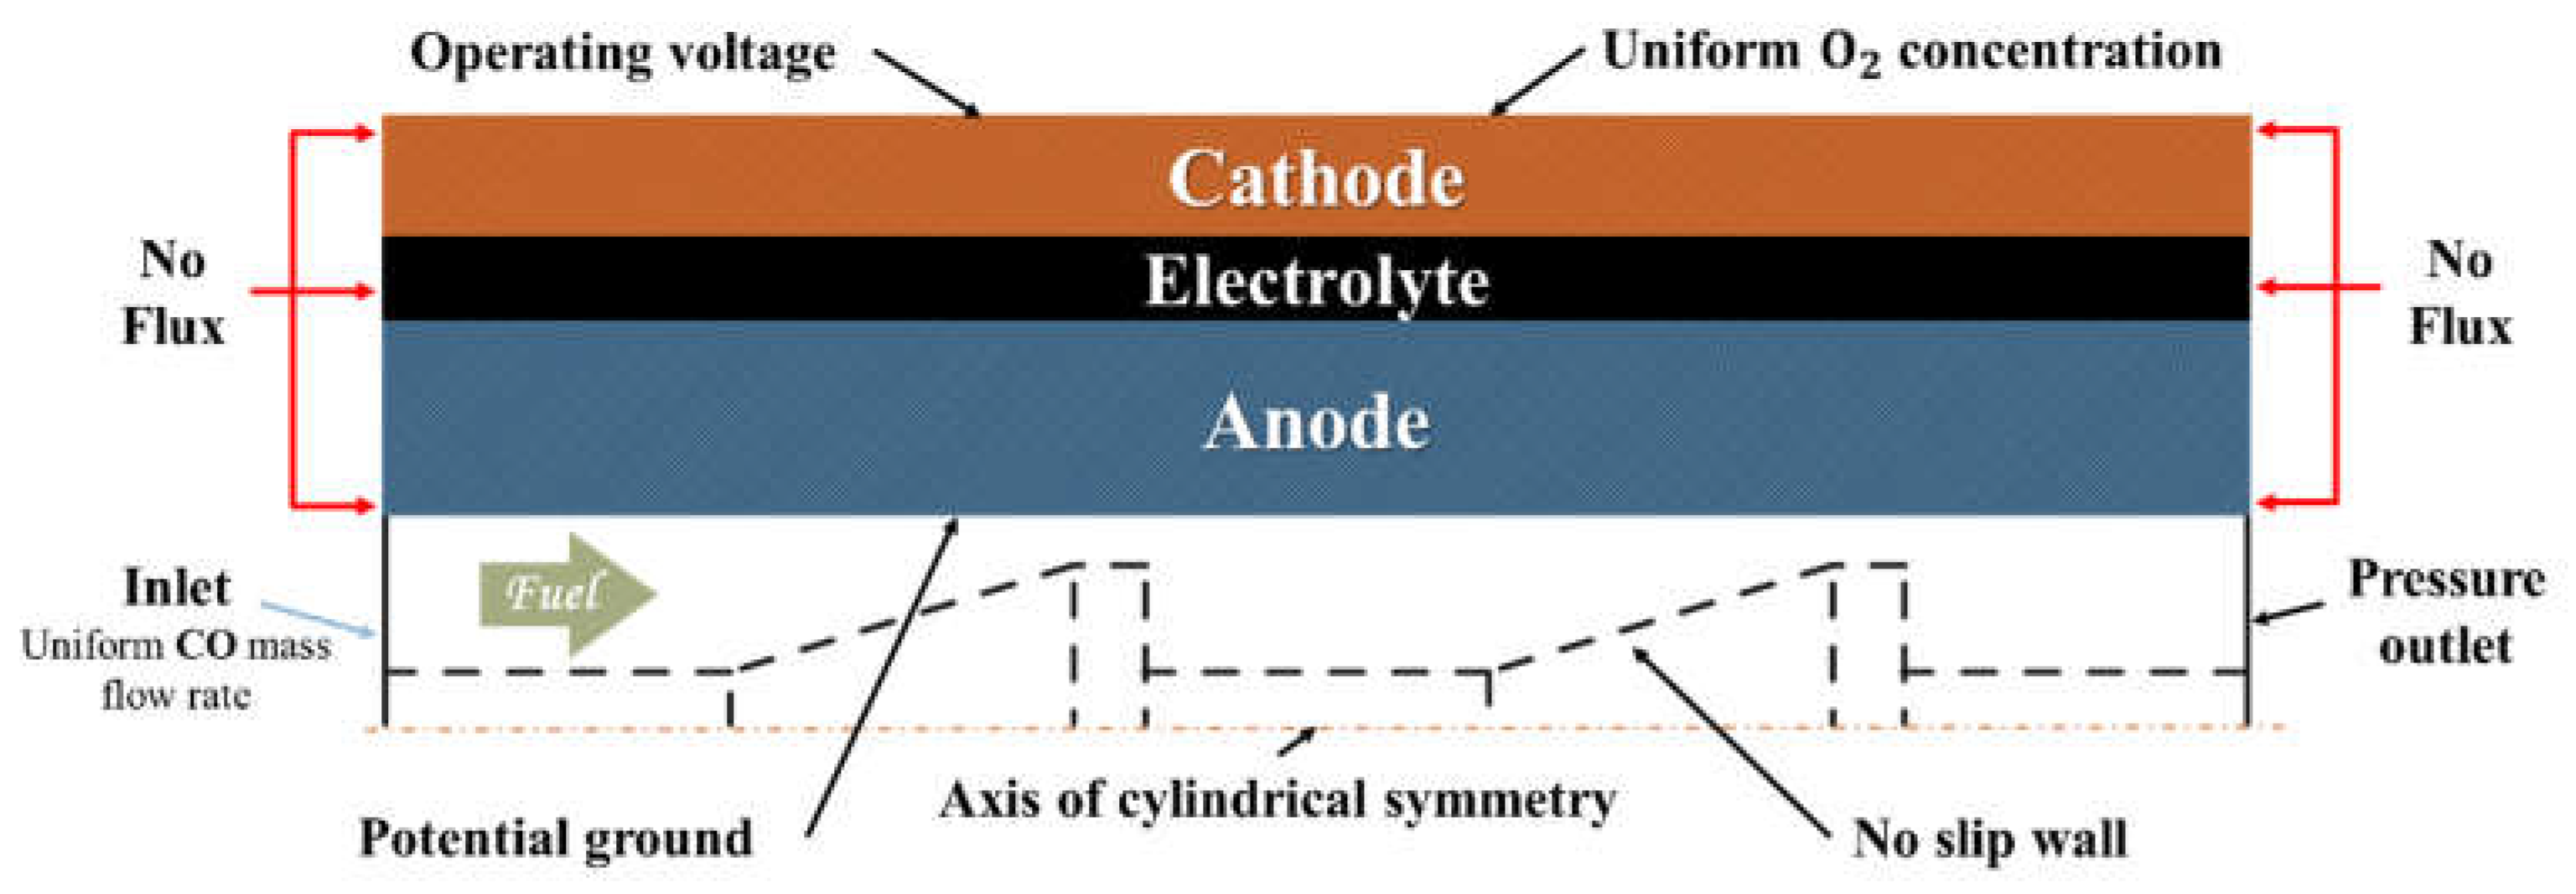
2.2. Numerical Model

2.2.1. Electrochemical Reactions

In this study, we limited ourselves to a carbon-monoxide-fueled SOFC. As the hydrocarbon fuel was reformed, hydrogen and carbon monoxide were produced for the electrochemical reactions. Since hydrogen diffusion in anodes is much faster than carbon monoxide due to the molecular size, we mainly focused on examining the effect of the radial and circumferential flows on the mass transfer characteristics of the carbon monoxide in the fuel channel and anode of a micro-tubular SOFC. The overall reaction is
2 CO + O 2 2 CO 2
Through the porous cathode, the oxygen molecules diffuse to reach the cathode’s triple-phase boundaries (TPB), where they are reduced to oxygen ions as
O 2 + 4 e 2 O 2
The oxygen ions produced are then transported through the electrolyte to the triple-phase boundaries in the anode and combine with the carbon monoxide to produce electrons and carbon dioxide as
2 O 2 + 2 CO 2 CO 2 + 4 e
The operational potential of this electrochemical reaction, E, is determined as follows:
E = E OCV η act , a η act , c η ohmic
Here, EOCV is the equilibrium potential at a current density equal to zero. The subscript a is for the anode electrode and c is for the cathode electrode. ηact represents the activation overpotential, and the ηohmic represents the ohmic overpotential. The open-circuit voltage potential is expressed as
E OCV = 1.46713 0.0004527 T + R T 2 F ln [ P CO P CO 2 P O 2 P atm ]
Here, P denotes the local gas partial pressure at the triple-phase boundaries, and CO, O2, and CO2 denote the specific gas components. Patm is the ambient pressure [41]. The Butler–Volmer equations are used to calculate the activation overpotential:
i a = A υ , a i 0 , CO ( P CO P CO , ref exp ( ( n υ α 1 ) F η act R T ) P CO 2 P CO 2 , ref exp ( α 1 F η act R T ) )
i c = A υ , c i 0 , O 2 ( P O 2 P O 2 , ref exp ( ( n υ α 2 ) F η act R T ) exp ( α 2 F η act R T ) )
Here, ia and ic are the anodic and cathodic current density at the reference temperature Tref, respectively. n is the number of electrons transferred per υ molar reactant in the electrochemical reaction. α1 and α2 are the cathodic direction transfer coefficient defined in an early study [42], which are 1 and 2, respectively. The Faraday constant is F. i0 is the reference exchange current density (A/m2). This can be stated in the form of Equations (8) and (9) using the Arrhenius expression [43]:
i 0 , CO = i CO , ref exp [ E a R ( 1 T 1 T ref ) ]
i 0 , O 2 = i O 2 , ref exp [ E c R ( 1 T 1 T ref ) ]  
The ohmic losses generated by electron/ion conduction are calculated from
i l = σ l , eff ϕ l
i s = σ s , eff ϕ s
Here, σeff is the effective conductivity, and ϕ is the potential. The subscript l is for the electrolyte, and s is for the electrodes. The effective conductivities of the porous electrodes and the structural factors are defined as follows:
σ l , eff = σ l · V l τ l
σ s , eff = σ s · V s τ s
Here, V is the volume fraction and τ is the tortuosity.

2.2.2. Momentum Transport

The steady-state continuity and Navier–Stokes equations are solved to obtain the velocity and pressure distributions of the gas mixture in the anode gas channel as
  ·   ( ρ u ) = 0
ρ ( u · ) u = · [ P + μ { u + ( u ) T 2 3 ( · u ) } ]
Here, ρ, μ, and u denote the density, dynamic viscosity, and gas mixture velocity. P represents pressure. We can calculate the gas mixture density from the ideal gas law:
ρ = P M R T
M = i = 1 n x i M i
Here, R is the universal gas constant, M is the molar mass, and T is the temperature. The viscosity of the mixture inside the porous media is expressed by Wilke’s method [44] as
μ = i = 1 n x i μ i j = 1 n x j ϕ i j
Here, the subscript i and j represent different gas components, while ϕij is defined as
ϕ i j = ( M j M i ) 1 2
The Brinkman equations are used to compute and obtain the velocity and pressure distributions inside the porous electrodes, as shown in Equations (20) and (21).
· ( ρ u ) = Q m
ρ ε ( u · ) u ε = [ p + μ ε { u + ( u ) T 2 3 ( · u ) } ] ( μ k + Q m ε 2 ) · u
Q m = i a 2 F ( M CO 2 M CO )
Here, ε is the electrode porosity and k denotes the permeability of the porous media. The source term Qm that appears in the mass and momentum equations is a result of the electrochemical reactions, as shown in Equation (20).

2.2.3. Mass Transport

The mass transfer of gas mixture in the micro-tubular SOFC is mainly caused by diffusion and convection. The concentration of each gas component of the multi-component mixture is described and analyzed by the species conservation equation:
( ρ ω i   D eff , i j . x j + ( x j ω j )   p p · u ) + ρ ( u · ) ω i = S i
where ω is the mass fraction and Si is the source term as a result of the generated species due to electrochemical reactions. The molecular diffusion coefficients can be calculated as
D i j = 101 T 1.75 · ( 1 M i + 1 M j ) 0.5 p . ( v i 1 / 3 + v j 1 / 3 ) 2
where M is the molar mass (kg·kmol−1) and v is the diffusion volume (cm3).
The porosity (ε) and tortuosity (τ) are used to correct the effective diffusion coefficient since it depends on the porous material structure and reduced diffusivity in the porous electrodes, as follows [45]:
D eff , i j = ε τ ( D i j D k , i j D i j + D k , i j )
The Knudsen diffusion coefficient can be calculated from [46];
D k , i j = 2 3 r p 8 R T π M i j  
Here, rp is the effective pore radius of the electrodes.

2.3. Numerical Model

The boundary conditions applied to the micro-tubular solid oxide fuel cells are illustrated in Figure 2. We applied a uniform O2 concentration to the outer surface of the porous cathode, a uniform CO mass flow rate at the fuel inlet, and the ambient pressure at the fuel outlet. The CO mole fraction was fixed as 0.95 at the fuel inlet for all cases investigated. The operating potential was applied to the cathode surface, while the zero potential is applied to the anode surface. At the insert walls, we used a no-slip boundary condition. The temperature is assumed to be 800 ℃ everywhere in the SOFC. The carbon deposition inside the porous electrode is not considered in this simulation. Table 2 summarizes the parameters used in this study.

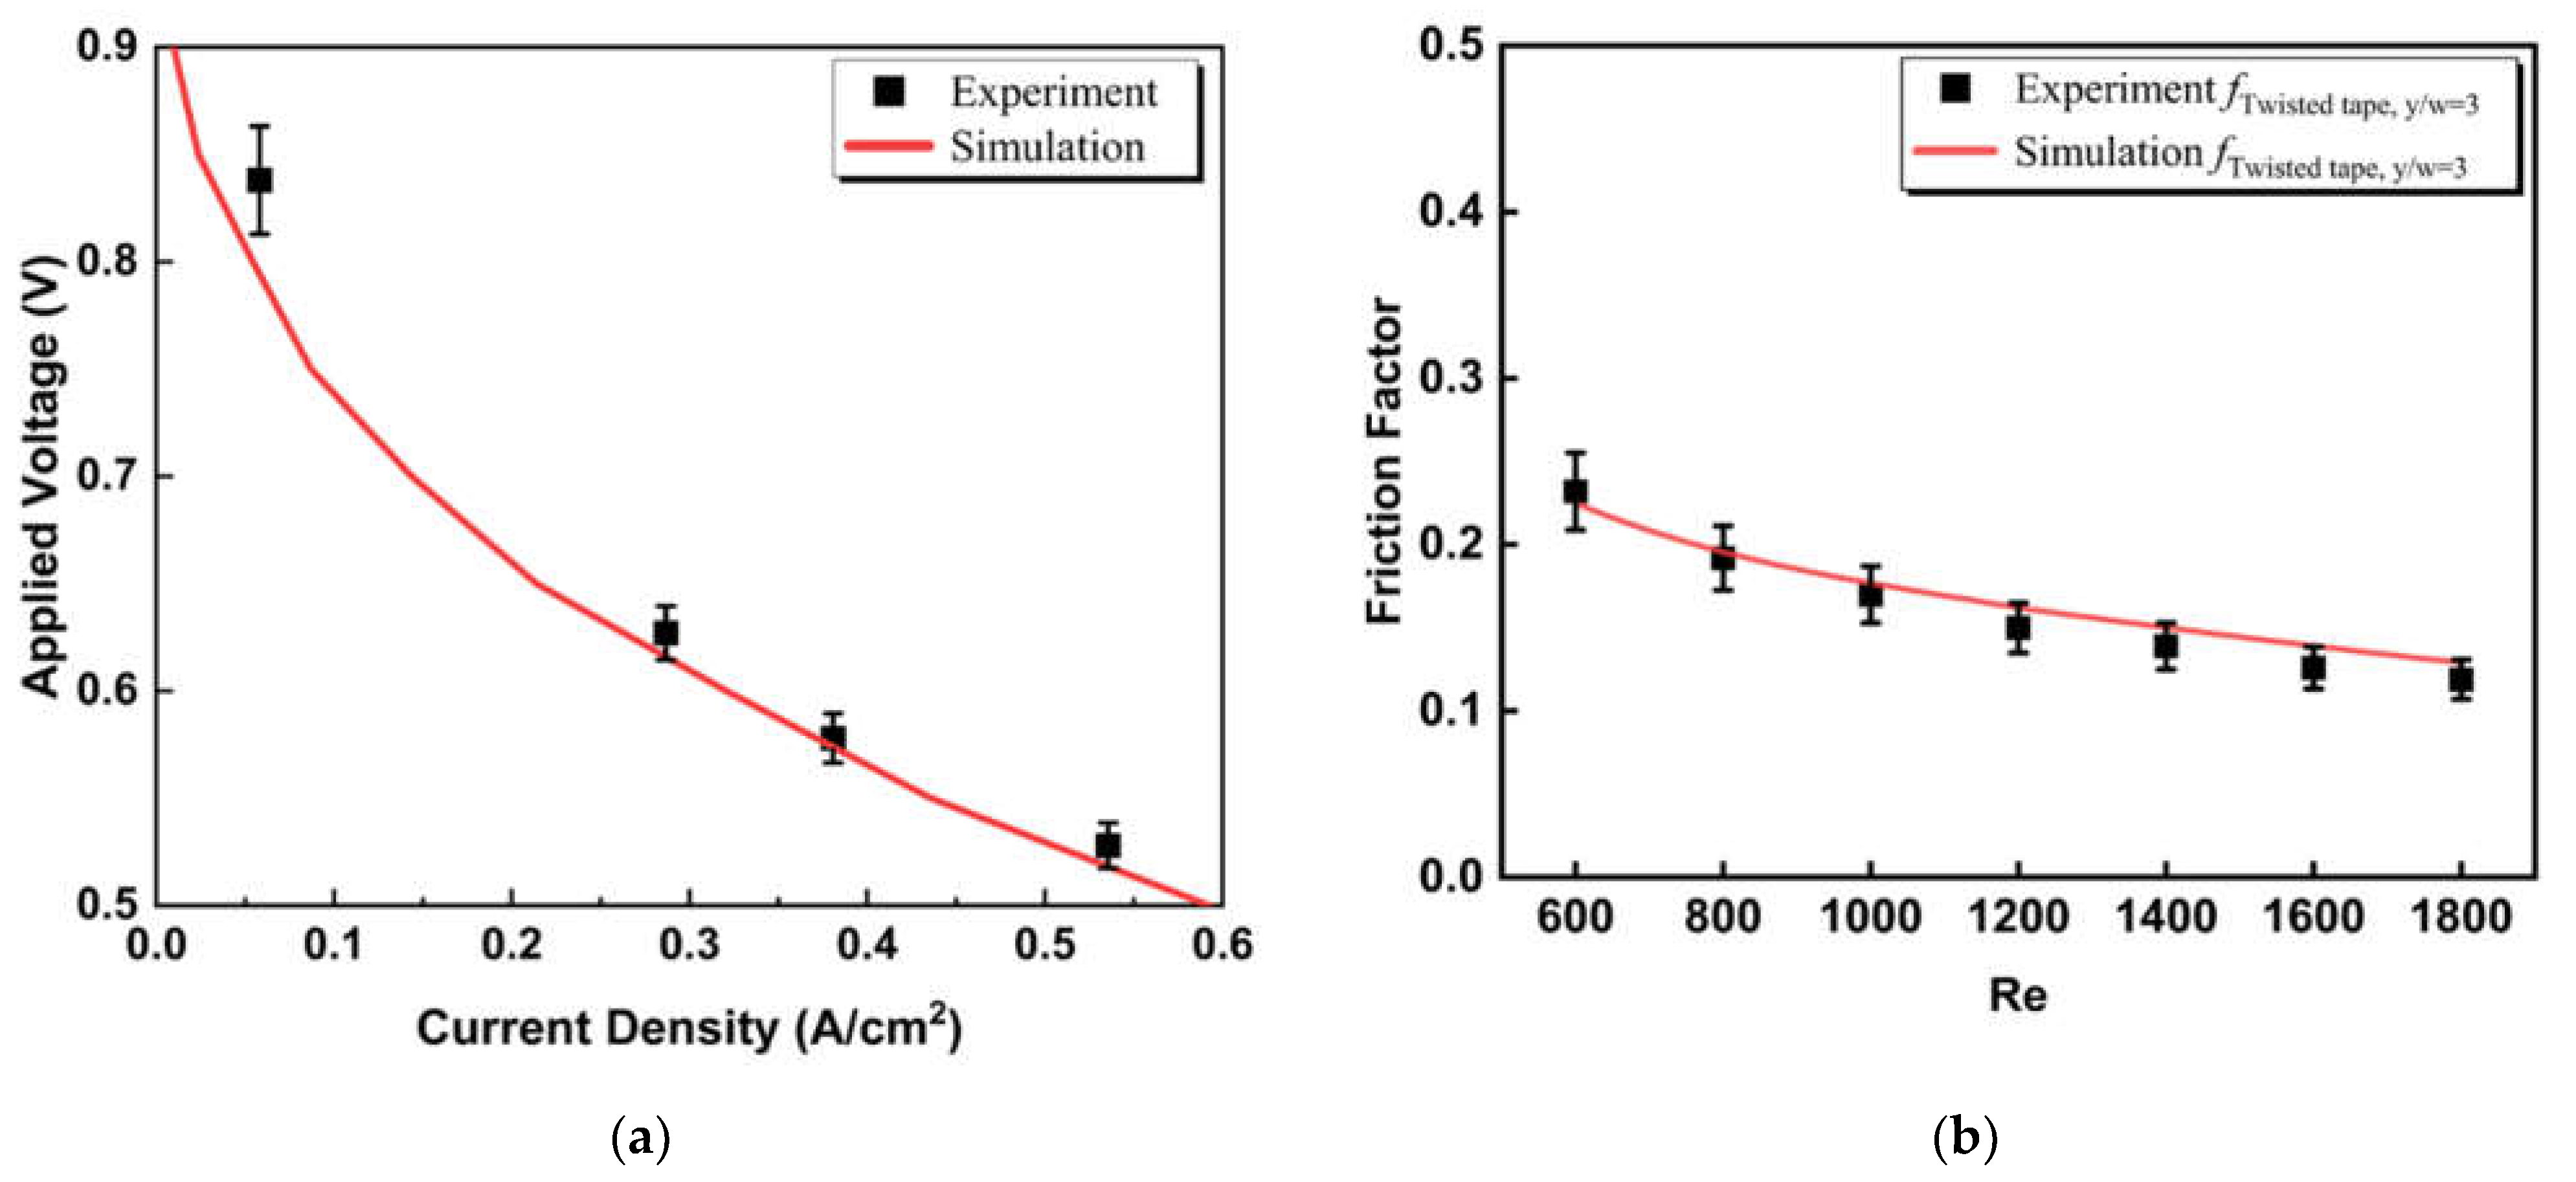
2.4. Model Validation

We applied mapped mesh for the fuel channel, cone-inserts, and the PEN (positive electrode, electrolyte, and negative electrode) structure to ensure the generation of a fully structured mesh of the micro-tubular SOFC. We compared the simulation results obtained from the model with four different total mesh numbers, which are 150,000, 250,000, 350,000, and 450,000, respectively. A mesh number larger than 250,000 does not affect the steady-state solutions by more than 1%. We, therefore, used 250,000 mesh elements for our simulations.
Experimental data from Mirahmadi’s study was used to validate the SOFC Multiphysics model [43]. The polarization curves generated from our simulation and those measured in their experimental data are shown in Figure 3a. Our simulated current density, measured at a given voltage, agrees well with the experimental results. The flow transport characteristics in the micro-tubular SOFC fuel channel were validated by comparing the friction factor as a function of the Reynolds number between our simulation and the experimental data from an earlier study [54]. The results indicate that our calculated friction factor matches well with the experimental data within 10% due to the experimental uncertainty reported, proving that the transfer process of the flow is properly simulated in our study.
The frictional factor of the internal pipe flow shown in Figure 3b is defined as
f = 2 D ρ u 2 Δ p L
where Δp is the pressure difference between the area averaged pressure at the inlet and outlet cross sections of the fully developed region, L is the length of the fully developed region, D is the hydraulic diameter, and ρ and u are the fluid density and velocity.

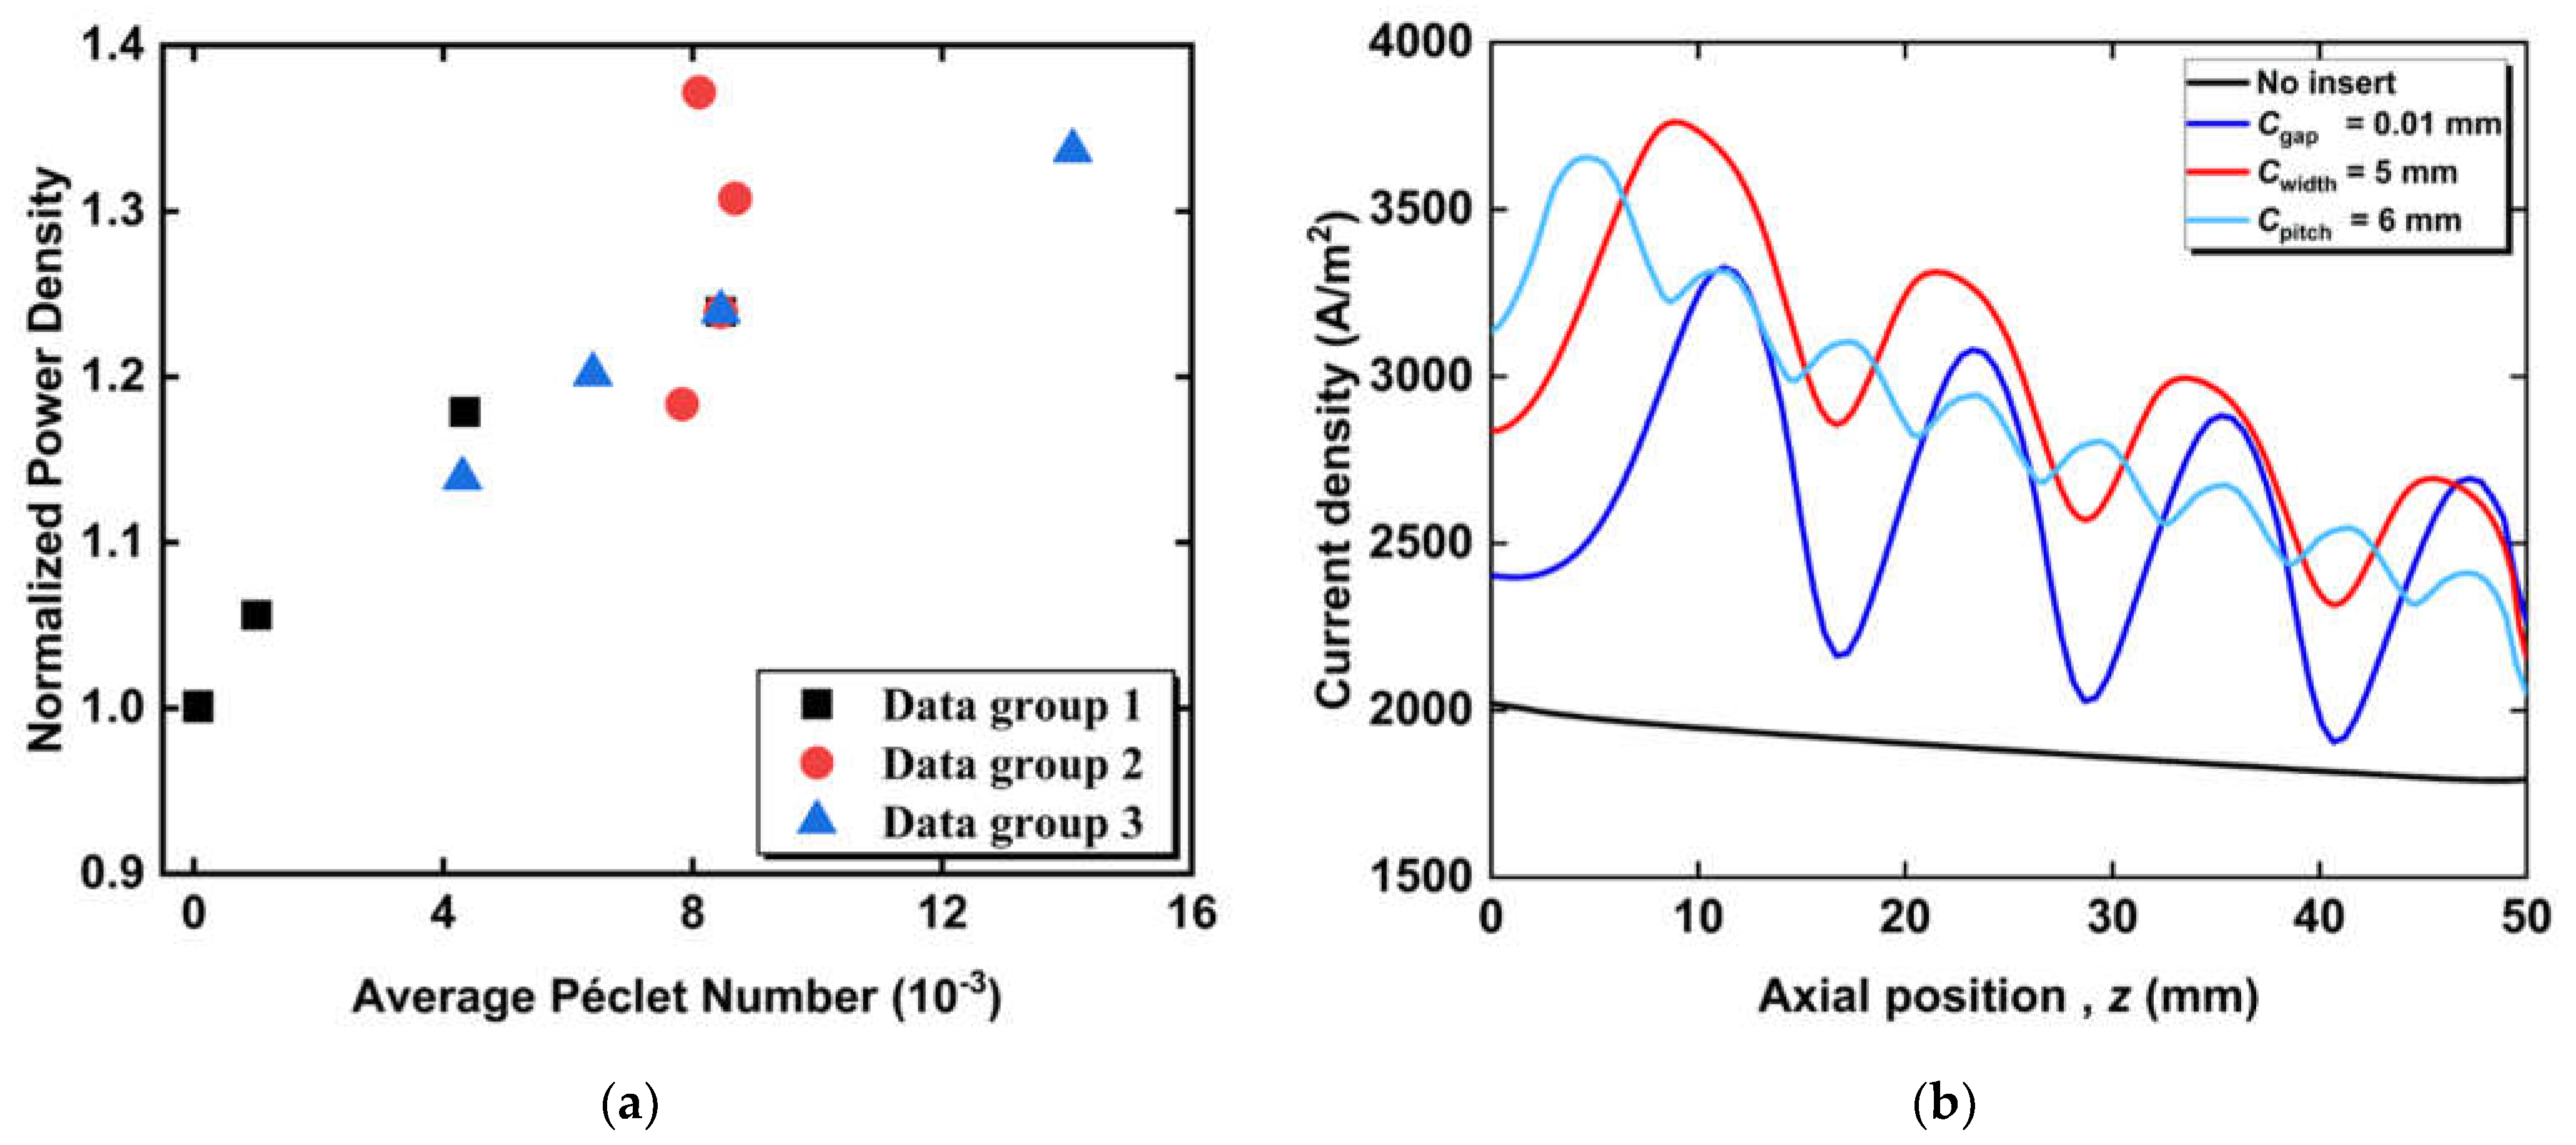
3. Results and Discussion

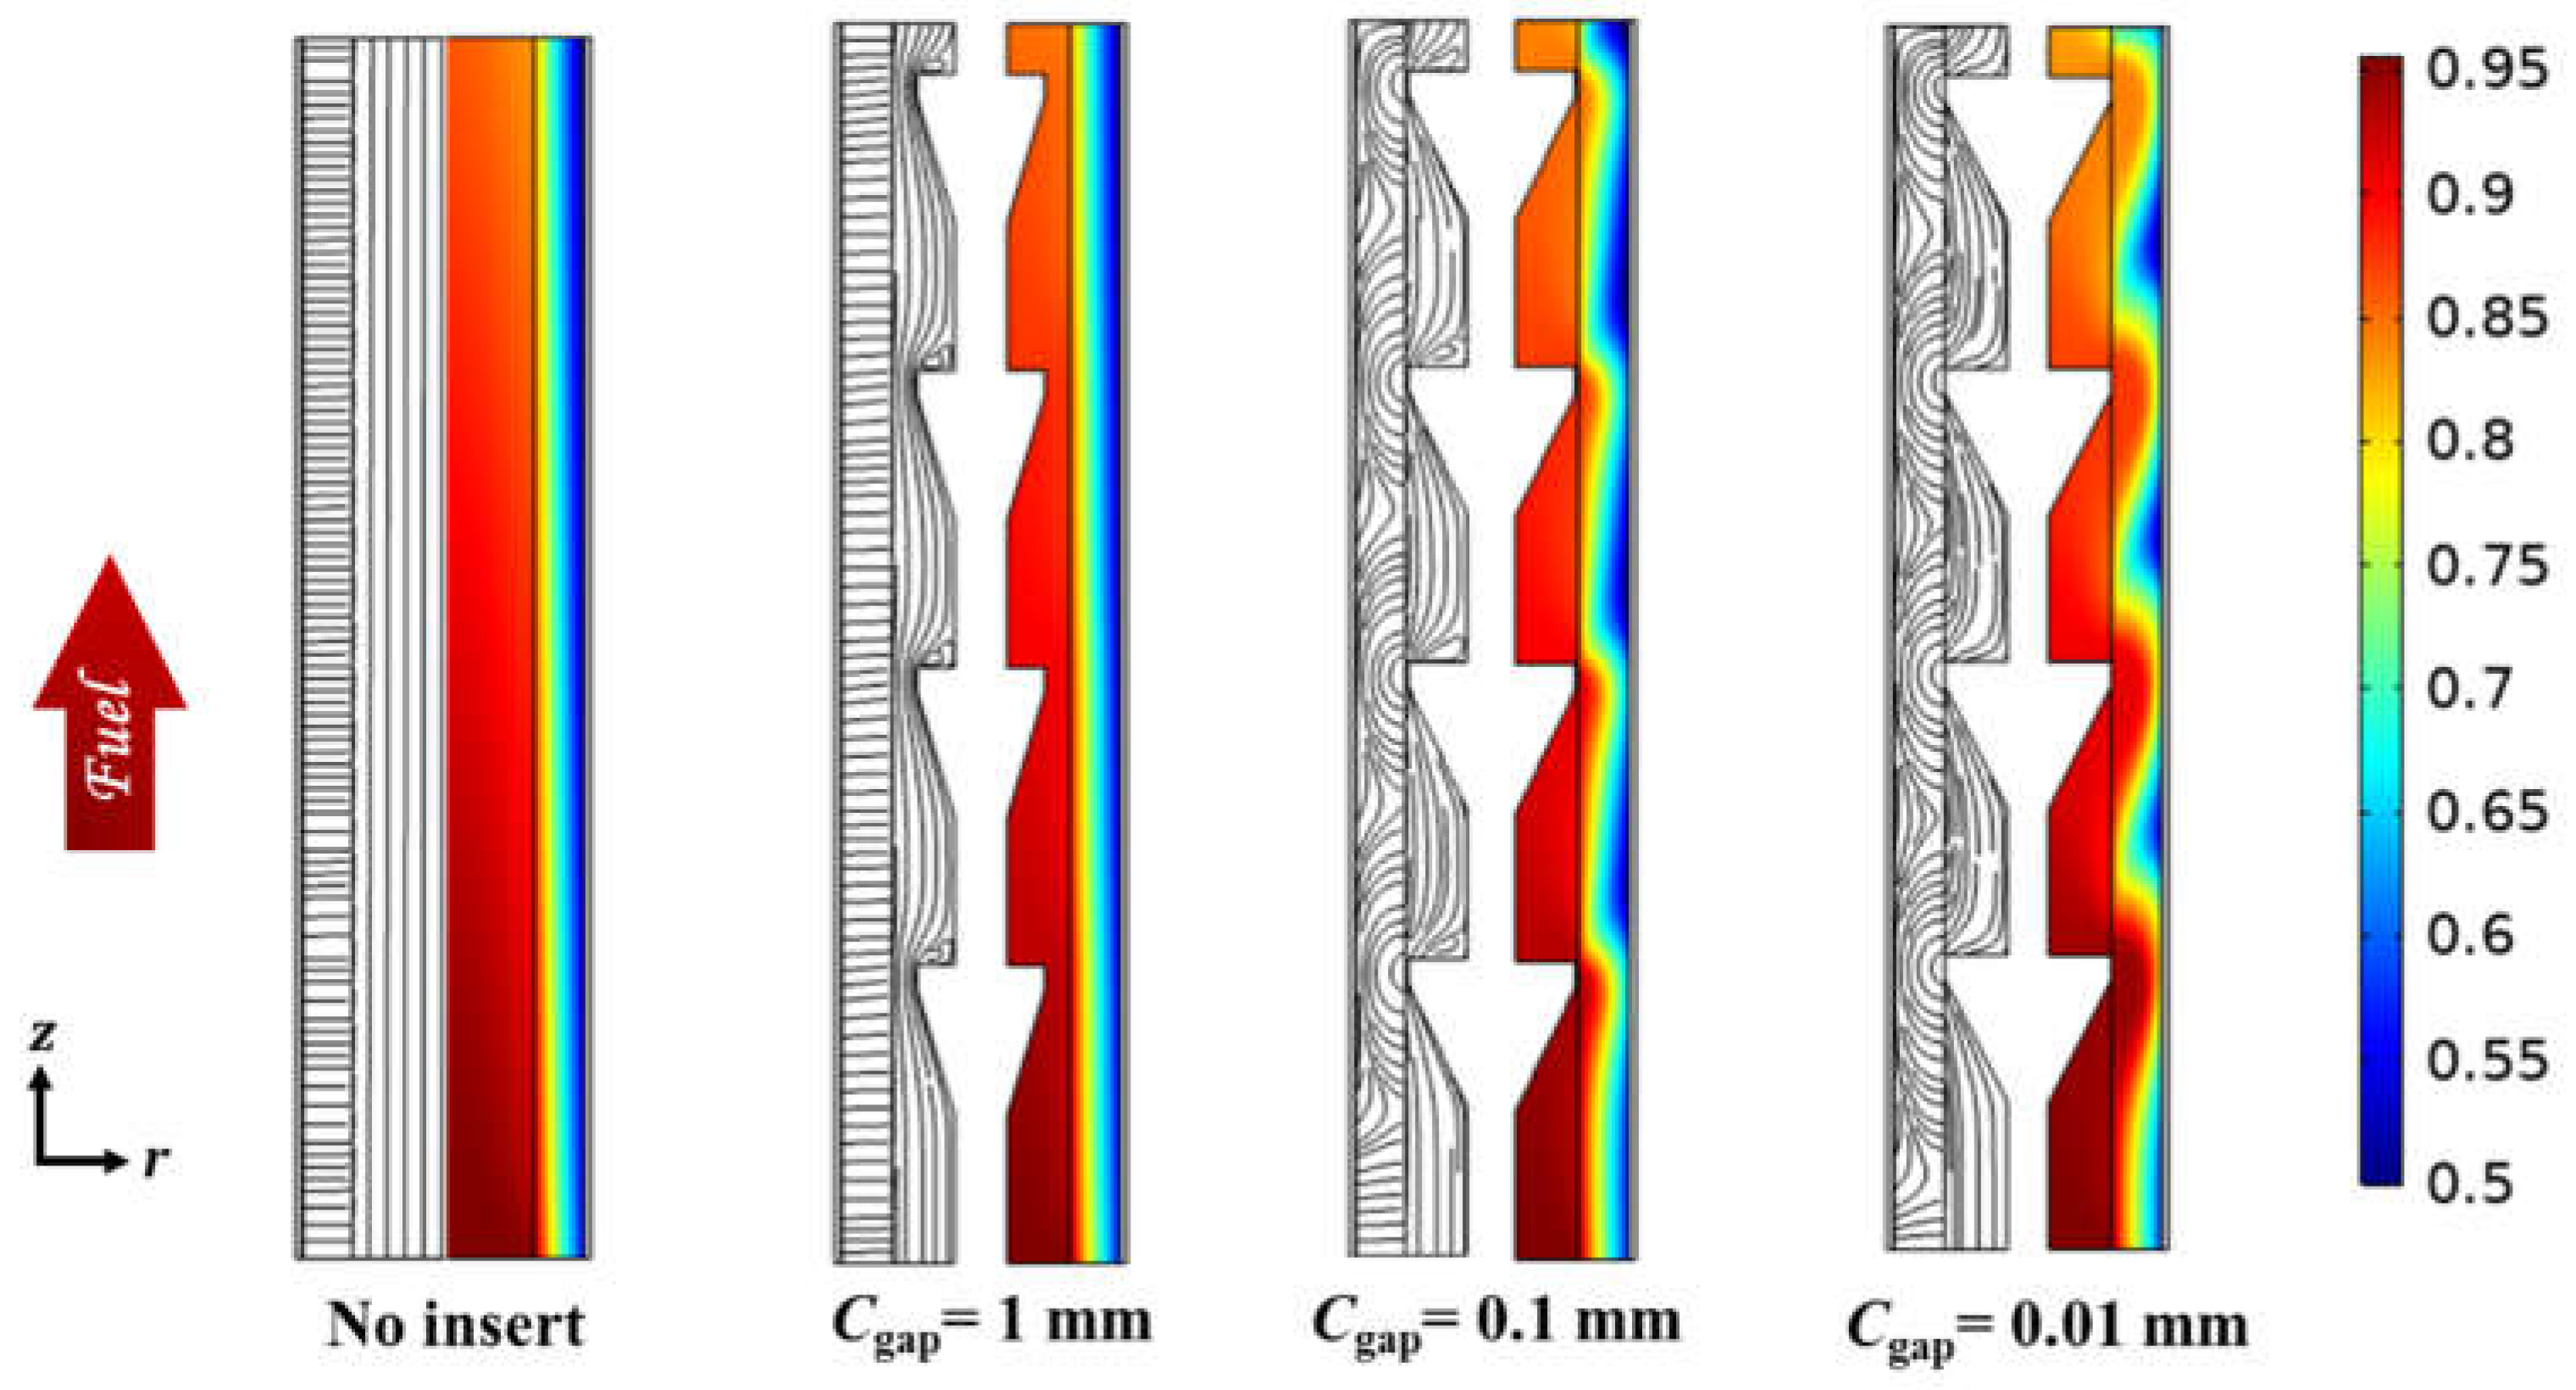
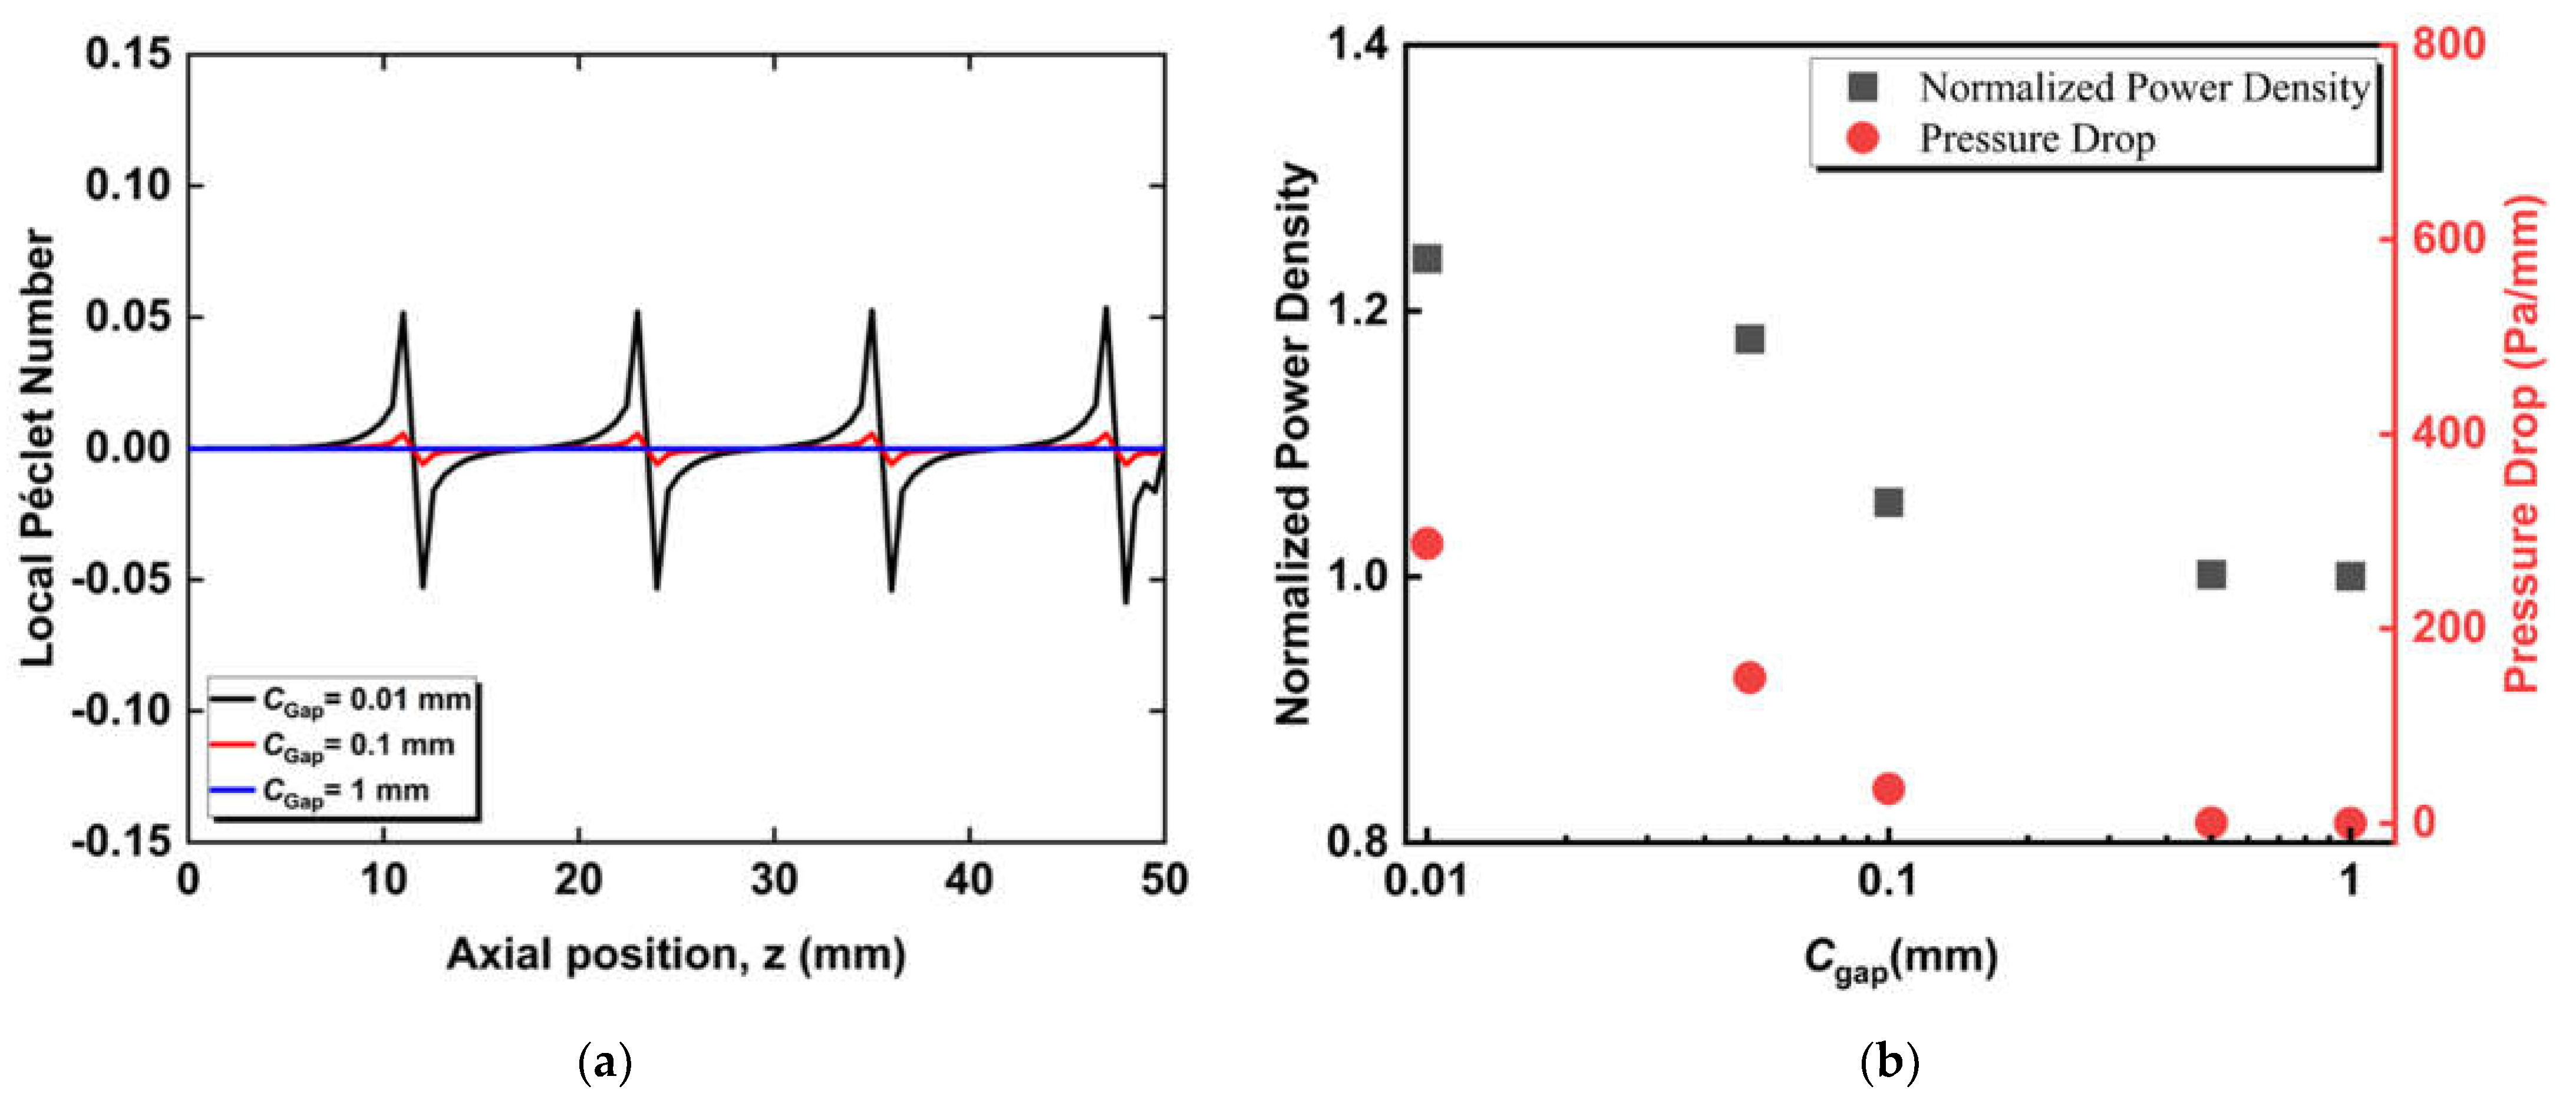
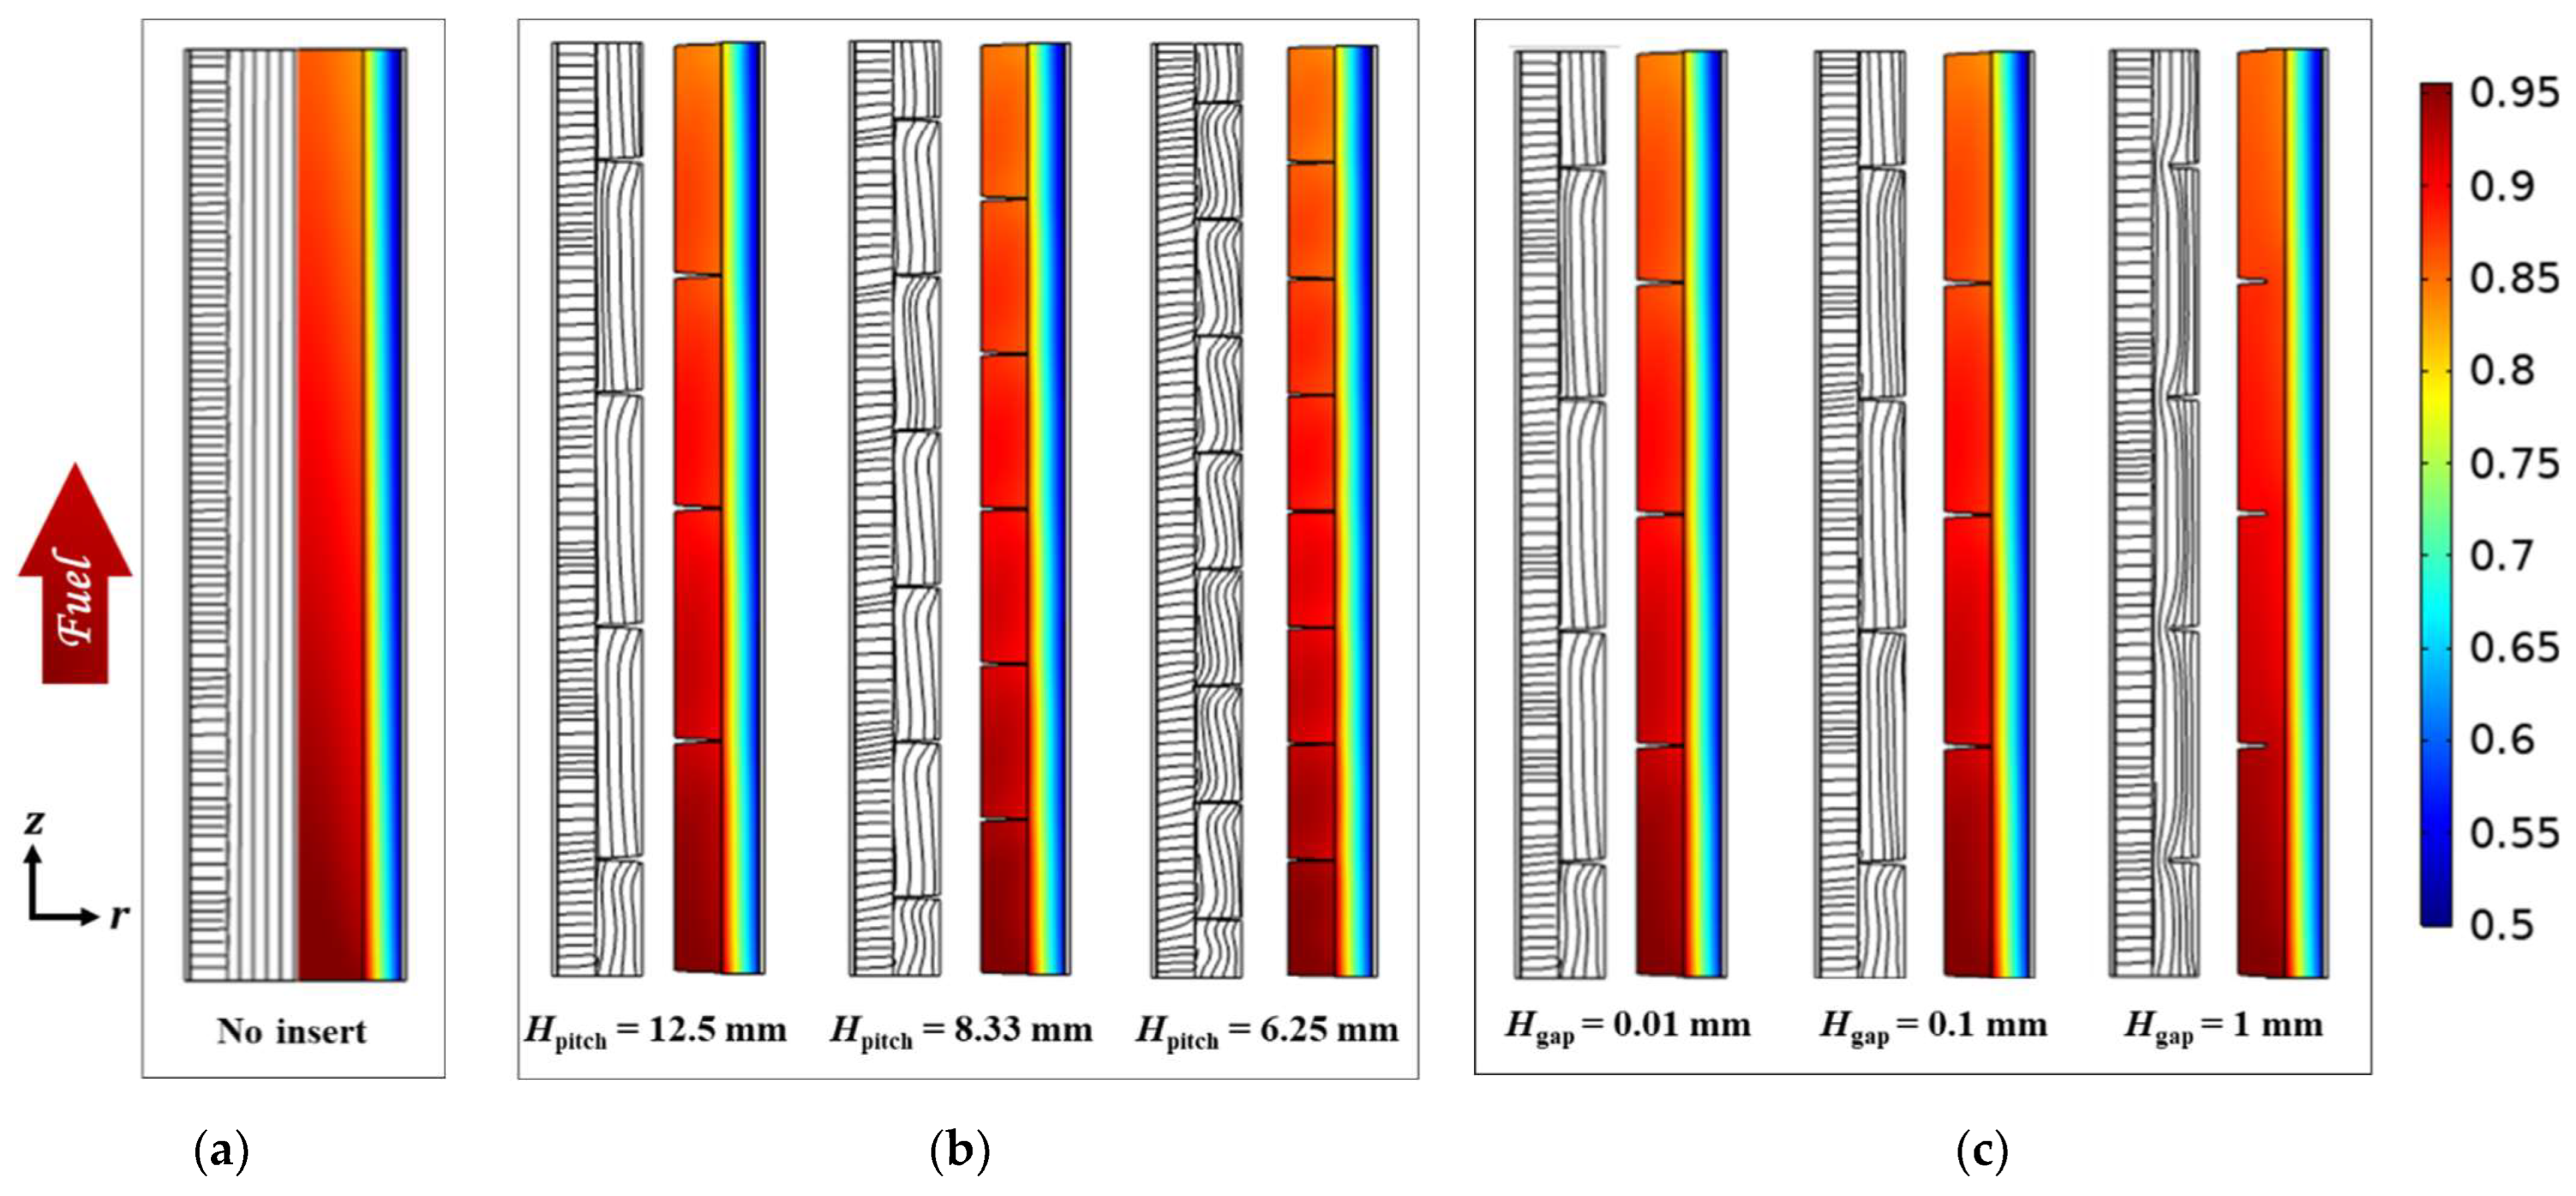
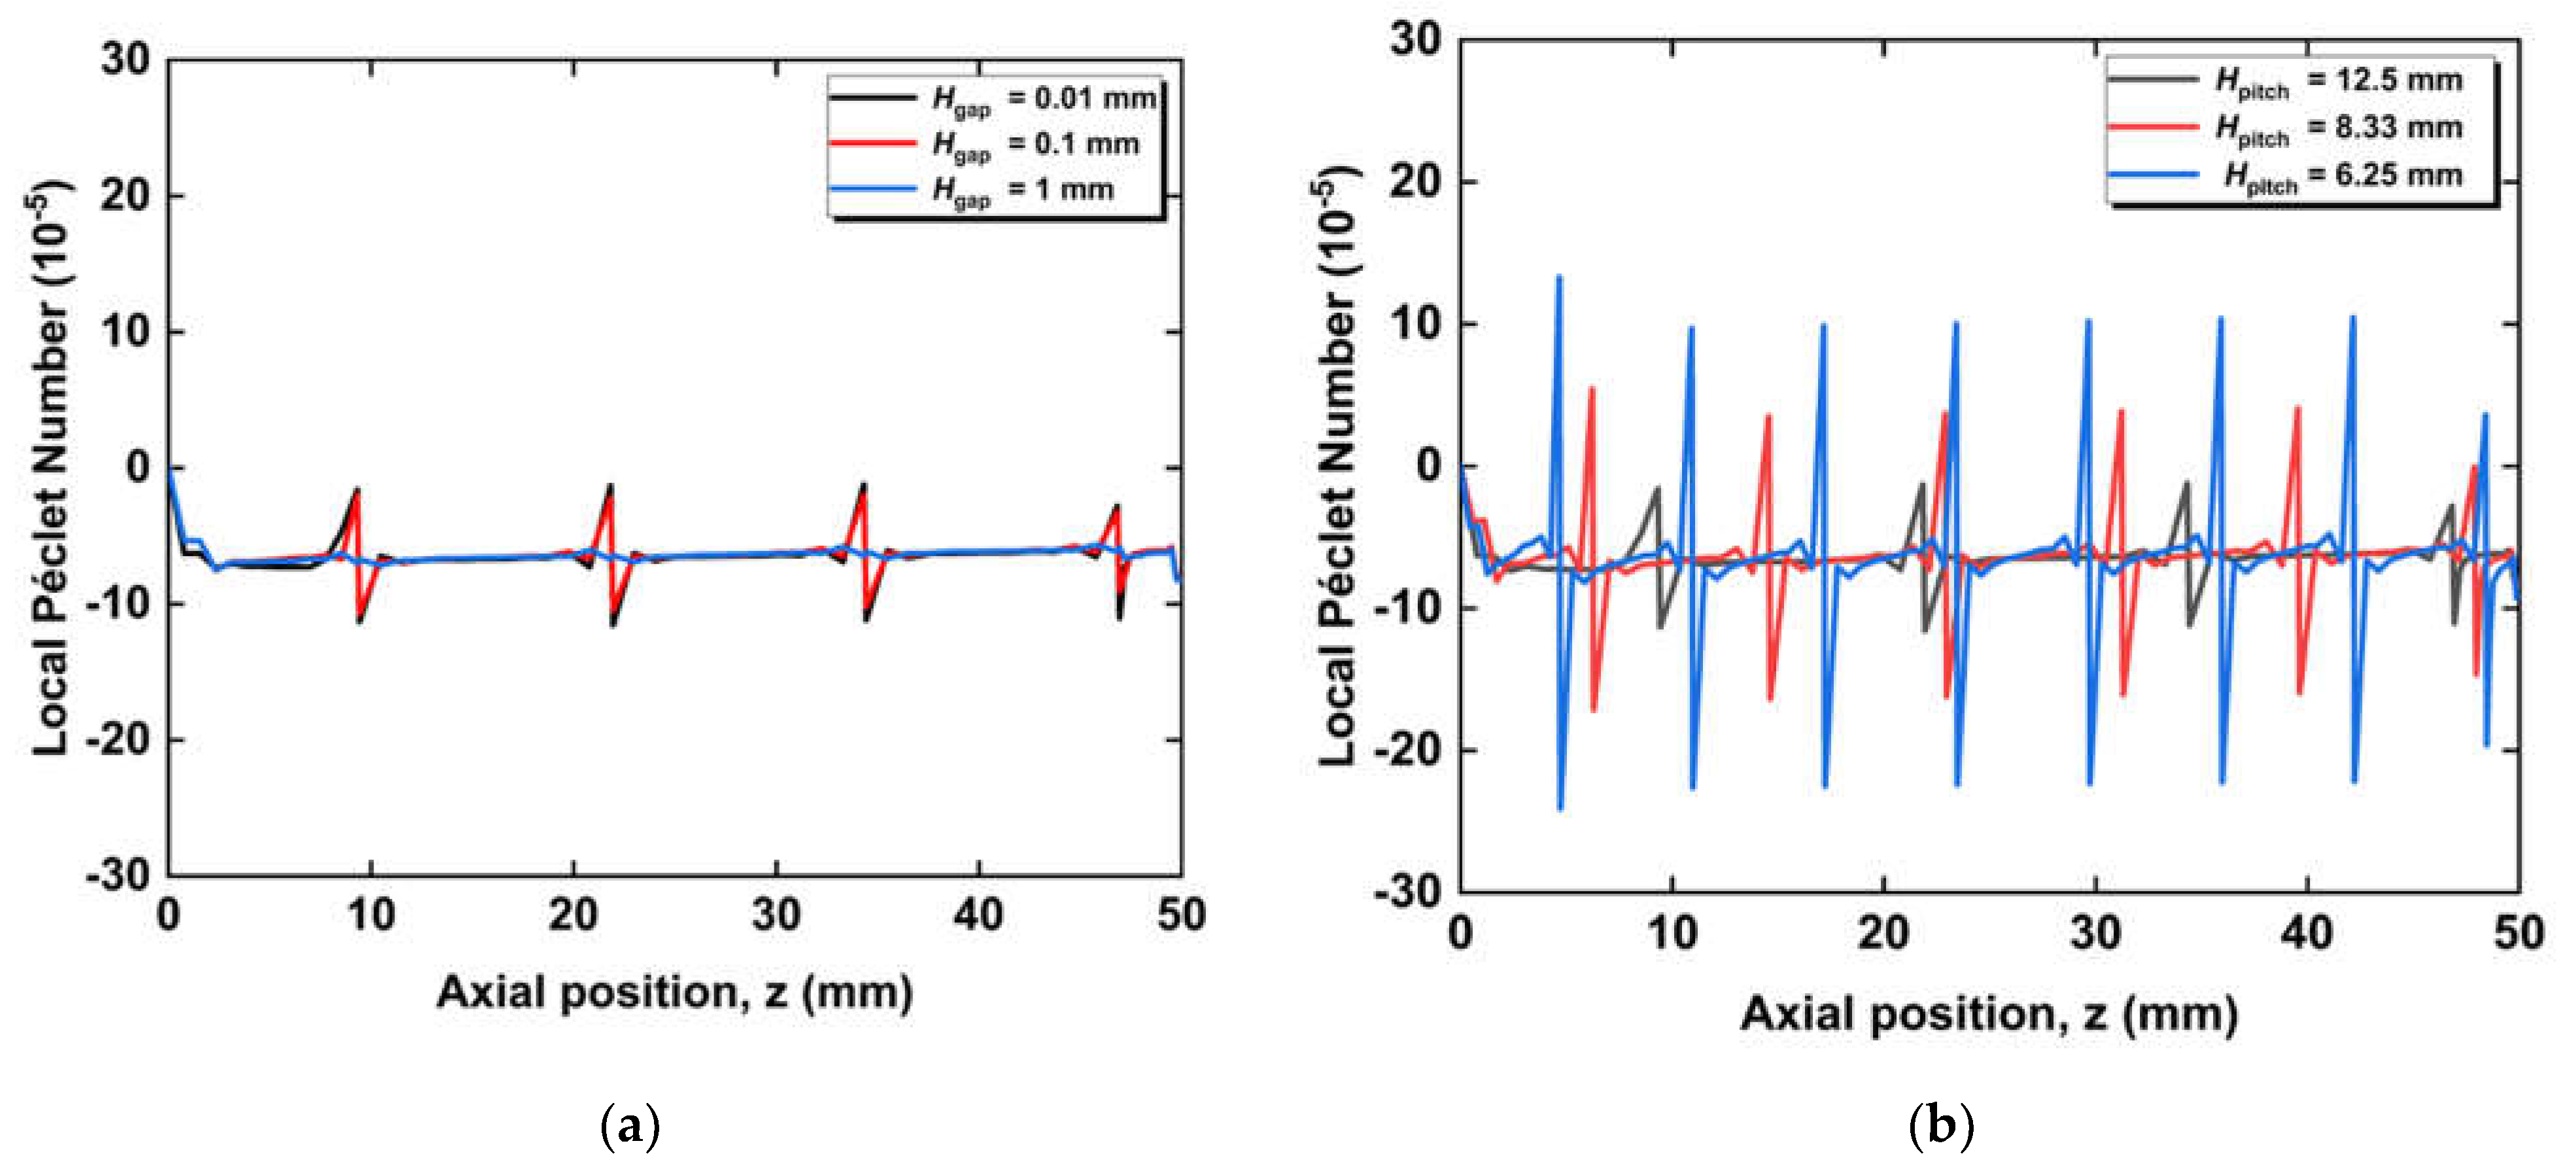
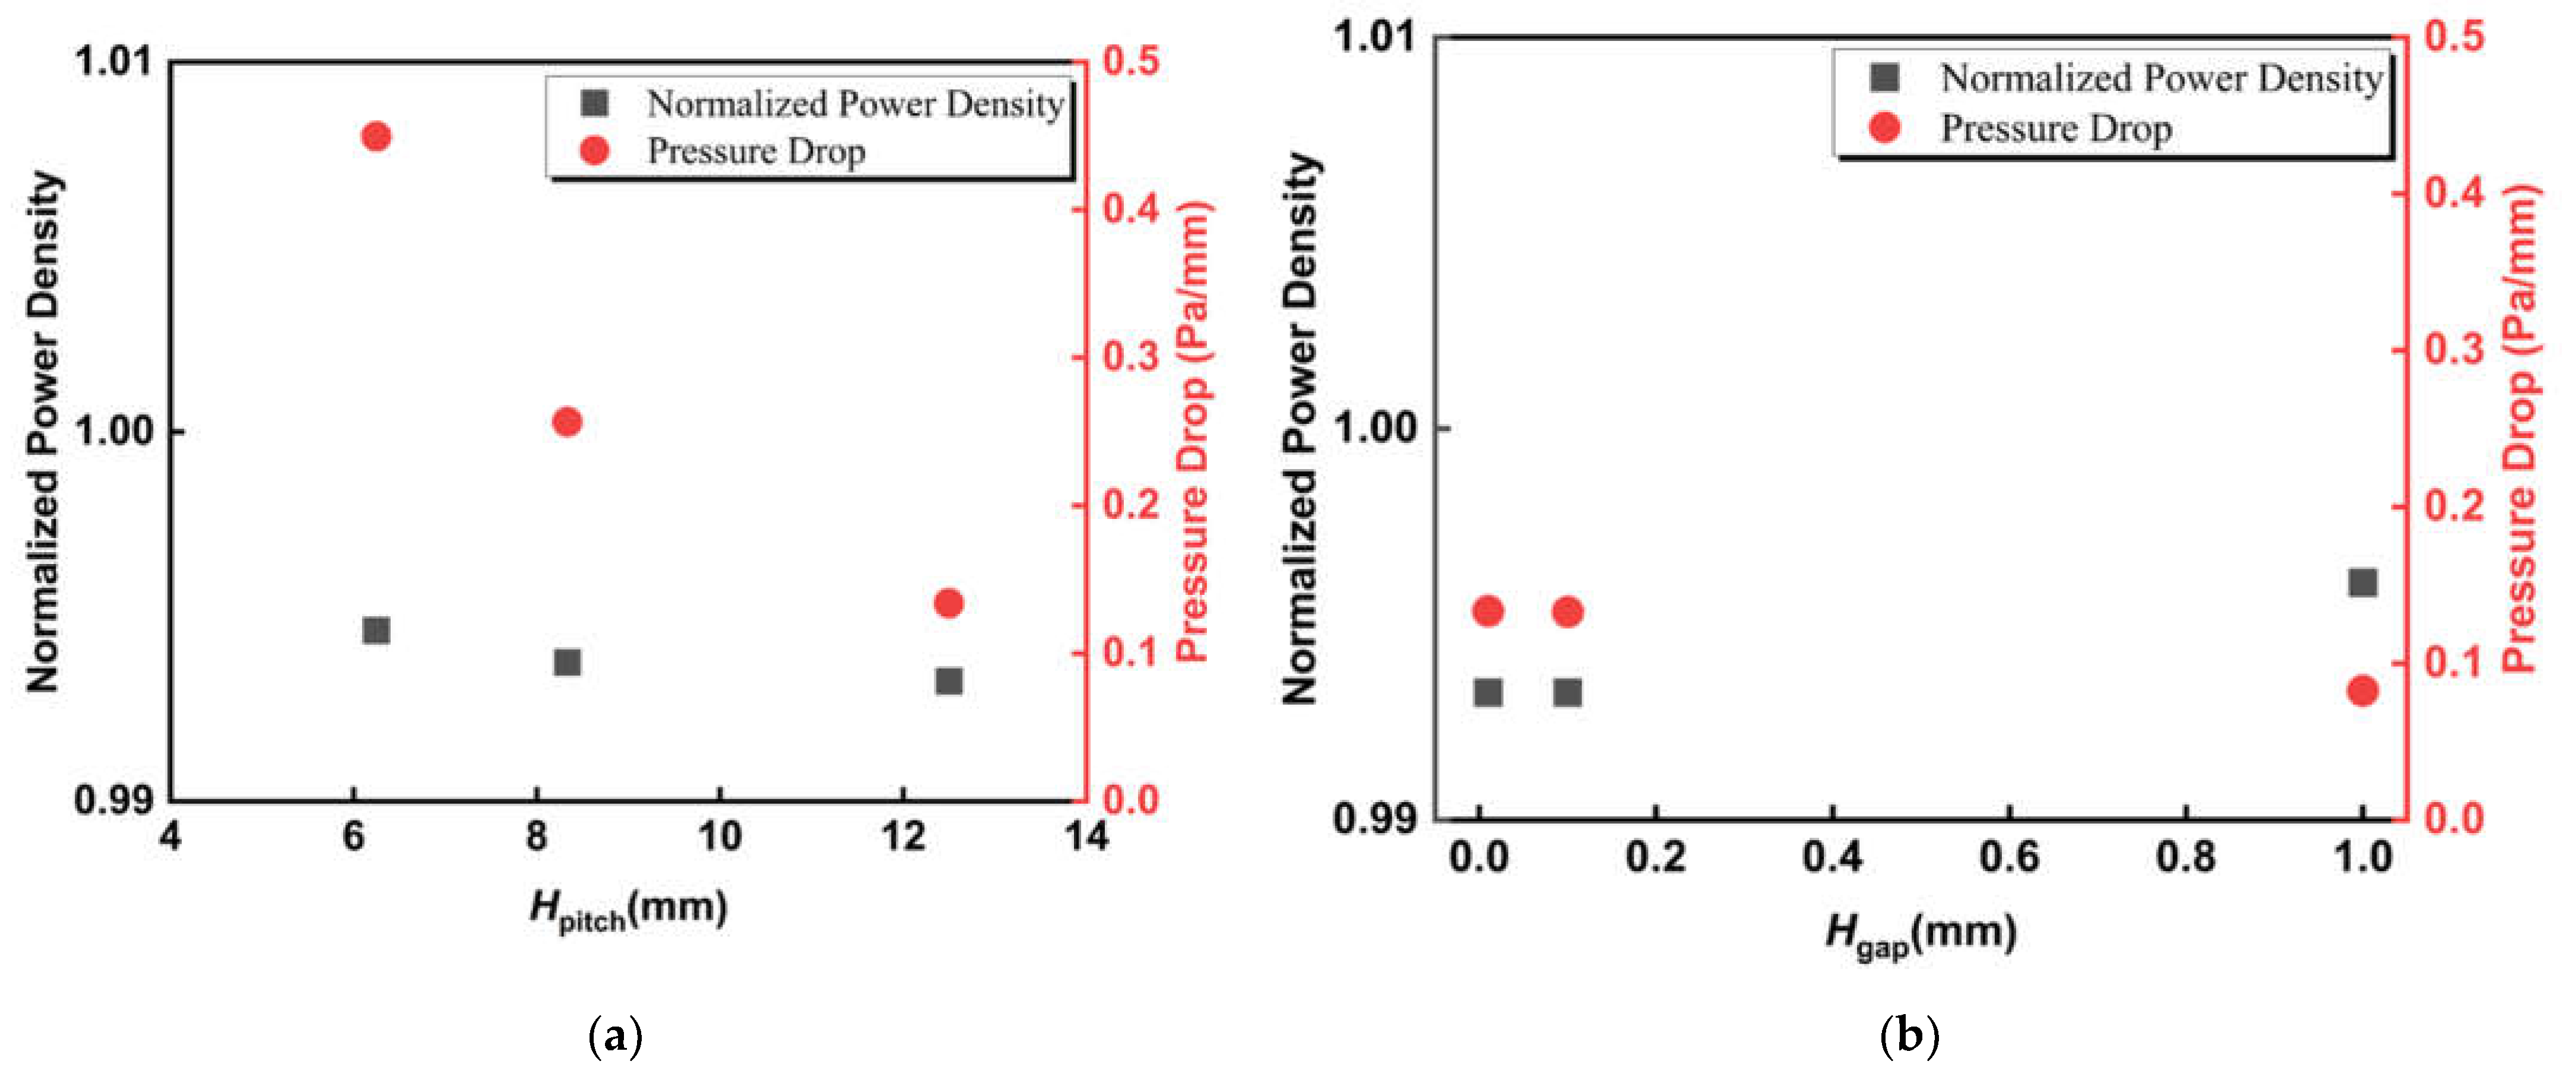
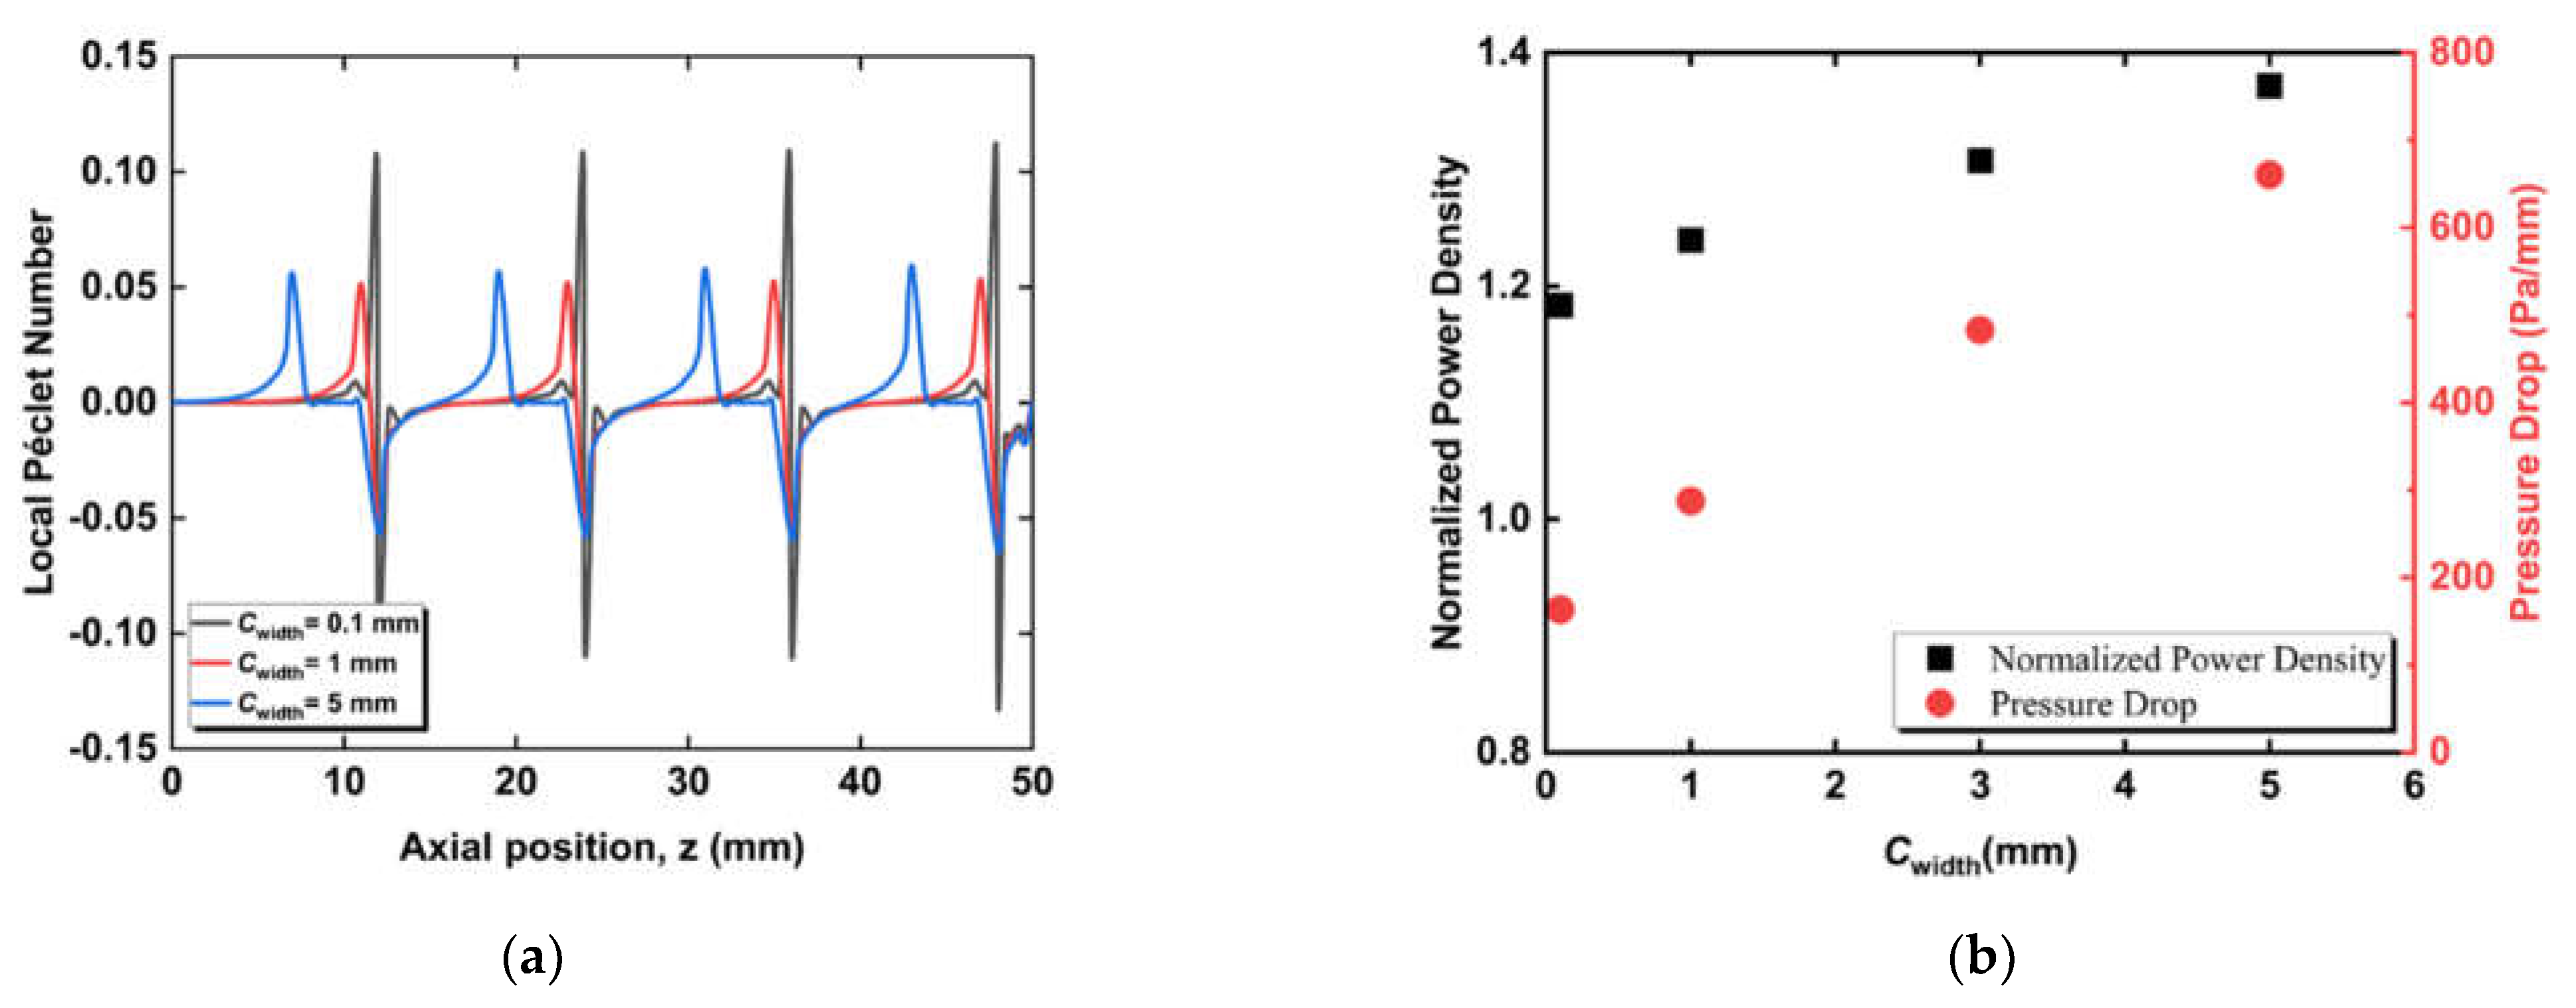
3.1. Effect of Radial Flows

We first examined the effect of the radial flows on the mass transfer characteristics of fuel and the overall output power density of the micro-tubular SOFC. A cone-insert was applied to generate the flow in the radial direction, as illustrated in Figure 4. The effects of different gaps, widths, and pitches on the flow and mass transfer characteristics in fuel channels of micro-tubular SOFCs with cone-inserts were studied. The cone-insert gap, Cgap, is defined as the clearance between the cone-insert and the anode-fuel channel interface, while the width, Cwidth, is the thickness of the cone base and the pitch, Cpitch, is the distance between two successive cones.
We initially examined the effect of cone-insert gap variation “Cgap” on flow and mass transfer characteristics in a micro-tubular SOFC. Figure 5 plots the predicted streamlines and CO mole fractions in the mid-plane throughout the central axis of the SOFC. The streamlines in the flow channel were parallel to the anode-fuel channel interface (z-direction) for the case without the insert. The streamlines within the anode were oriented radially, showing the direction of fuel diffusion. The streamlines exhibited tiny fluctuations at the corners of the cone-inserts for the case with a 1 mm gap, as illustrated in Figure 5. The influence of these fluctuations on fuel diffusion is negligible. As the gap was further decreased from 1 mm to 0.1 mm or 0.01 mm, the fuel was forced into the porous anodes, which significantly affects the fuel diffusion, as observed from the streamlines in the anodes.
The same trend can also be observed from the CO mole fraction distributions. For the no-insert case, the mole fraction of CO gradually decreases along the flow direction (z-direction) due to the electrochemical reaction. The cone-insert case with a 1 mm gap exhibits a similar trend as the case without an insert. As the gap decreases, the CO mole fraction begins to fluctuate along the r-direction, as represented by the wavy patterns shown in the contours of CO mole fractions of the case with 0.1 mm and 0.01 mm gaps. This indicates that decreasing the gap is able to drive more fuel into anode pores through the convective mass transfer, which could facilitate the fuel diffusion process inside porous anodes.
The effect of the radial flow induced by the cone-insert could be characterized by the local Péclet number at the anode-fuel channel interface. The local Péclet number, Pe, is the ratio of convection to diffusion and is expressed as
Pe = r p · u r D coco 2 , eff
In this equation, ur is the characteristic velocity in the r-direction, rp is the effective pore radius, and Dcoco2,eff is the effective diffusion coefficient. Figure 6a compares the local Péclet numbers as a function of axial locations for the cases with gaps of 1 mm, 0.1 mm, and 0.01 mm. The local Péclet number for the no-insert case is at the order of magnitude of 10−5, indicating a small convective mass transfer at the anode-fuel channel interface. The case with a 1 mm gap is comparable to the no-insert case, showing insignificant peaks at the order of 10−5, which indicates a low r-direction velocity at the anode-fuel channel interface. This is in part because most of the fuel can flow through the 1 mm gap between the cone-insert and the anode-fuel channel interface instead of entering the anode. As the gap is decreased from 1 mm to 0.1 mm, the local Péclet number is increased, and it reaches the maximum value at the base of the cones, indicating that the fuel enters the anode pores at a relatively large r-direction velocity. The case with a 0.1 mm gap shows a maximum local Péclet number of 0.005. As the gap is further decreased to 0.01 mm, these peaks become significantly higher and wider, indicating that more fuel is delivered into the porous anode. The positive and negative peaks highlight that the fuel enters or leaves the anode, respectively. The local Péclet number peaks with a higher order of magnitude, indicating that convective and diffusive mass transfer of fuel in the radial direction are comparable at the anode-fuel channel interface. The convective mass transfer along the radial direction enables more fuel to reach the triple-phase boundaries and therefore has the potential to improve the SOFC power density.
Figure 6b shows the influence of the gap between inserts and anode-fuel channel interface on the output power density and gas-phase pressure drop of the micro-tubular SOFCs with cone-inserts. In order to compare the power density improvement of the tubular SOFC with an insert and the conventional SOFC without an insert, we used the normalized power density, Pn, which is the ratio of the power density of the micro-tubular SOFC with inserts to that with no insert, expressed as
P n = P in P 0
Here, Pin represents the power density from the micro-tubular SOFC with an insert, while P0 represents the power density from the conventional micro-tubular SOFC without an insert. The gas-phase pressure drop is calculated from the difference between the fuel inlet and outlet divided by the total length of the SOFC. A smaller gap between inserts and the anode-channel interface drives more fuel to enter the porous anode, leading to a higher CO concentration and a large concentration gradient inside the porous anode. This facilitates the fuel diffusion to the triple-phase boundaries and improves the output power density. A 0.01 mm gap could improve the output power density of SOFC by 24%. However, the increase in the SOFC power density coexists with the increase in pressure drop. As more CO fuel is forced to travel through the porous anode, a higher pump power is required to overcome the friction between the gas and porous electrode. A cone-insert could lead to a pressure drop of around 300 Pa/mm for the case with a 0.01 mm gap.
We then studied the effect of the cone-insert base width variation “Cwidth” on the mass transfer of fuel in the micro-tubular SOFC. Figure 7 shows the effect of width variations of the cone-insert base on the streamlines and CO mole fractions distributions in micro-tubular SOFCs. In these cases, the gap between cone-inserts and the anode-fuel channel interface was fixed at 0.01 mm, and the widths of the base of cone-inserts were 0.1 mm, 1 mm, and 5 mm, respectively. It can be seen from the streamline plots that the wavy patterns become wider as the width of the cone base increases. This is due in part to the fact that the fuel is forced to travel a longer distance for the case with a larger width. It also affects the radial variation of the CO mole fraction inside the porous anode. Compared to the case with 1 mm and 0.1 mm width, the cone-insert case of a 5 mm width shows a lower average molar concentration at the SOFC outlet, meaning more CO is consumed. This leads to the conclusion that forcing the fuel to travel inside the anode at a longer distance could result in a higher output power density.
We plotted the local Péclet number variations at the anode-fuel channel interface along the axial direction for the cases with different widths of the cone base to study their effect on the mass transfer characteristics. The cone-insert with a 0.1 mm width has the highest peaks at the order of magnitude of 0.14. The cases with 1 mm and 5 mm widths show peaks of comparable magnitude. This is due primarily to the surface area of the forced fuel to enter and travel inside the porous anode. The peak in the case with 0.1 mm width is the sharpest among the three cases, indicating that nearly all the fuel enters the anode and travels in a relatively smaller region than those with 1 mm and 5 mm widths. As the width of the cone base increases, the fuel travels longer in the anode, which could be observed between two successive peaks in Figure 8a.
Figure 8b illustrates the influence of the width variation on the SOFC power density and gas-phase pressure drop. For the same chosen gap, a wider width of the base of the cone allows fuel to travel a longer distance within the porous anode, resulting in large high-CO concentration zones. The high-concentration zone contributes to the diffusion of fuel to the triple-phase boundaries, therefore increasing the SOFC power density. The cone-insert with a 5 mm width has the potential to increase the output power density by 37%. The power density improvement is consistent with early observation [38], which experimentally examined the effect of the fuel channel with wire nickel meshes randomly placed inside. Their new channel design showed a 36% improvement in the peak power density. However, as with the gap cases, improving the SOFC power density comes at the cost of increasing the pressure drop due to the higher friction loss in the porous anode. Higher pump power is required to sustain the flow. A cone-insert with a width of 5 mm may result in a pressure drop of around 600 Pa/mm.
We next studied the effect of pitch variation “Cpitch” on flow and mass transfer characteristics in a micro-tubular SOFC. Figure 9 compares the streamlines and the CO mole fractions at the plane across the center axis for no insert and three cone-insert cases with a fixed gap of 0.01 mm and different pitches of 12 mm, 18 mm, and 24 mm. Figure 9 demonstrates that the wave interactions caused by the presence of the cone-insert become weaker as the pitch increases, so increasing the pitch causes a decrease in the radial concentration. The number of wavy patterns is inversely proportional to the insert pitch. A smaller insert pitch could enable fuel to enter the anode repeatedly.
Figure 10a illustrates the axial Péclet number variations for the cases with pitches of 12 mm, 18 mm, and 24 mm, respectively. The Péclet number peaks have a relatively similar order of magnitude for all the cases. The location and the distance of the peaks vary depending entirely on the cone-insert location inside the fuel channel. The pitch case of 24 mm shows a slightly higher order of magnitude compared to 18 mm and 12 mm. This is mainly because the number of cones inserted directly affects the pressure and velocity profiles. As the pitch increases, the number of cones inserted decreases, which can be seen from the number of peaks.
As seen in Figure 10b, the cone-insert pitch has an effect on the overall power density and gas-phase pressure drop of the micro-tubular SOFC. For a smaller pitch, two successive cones are closer, which allows more fuel to enter and pass through the porous anode. This promotes the fuel diffusion to the triple-phase boundaries, improving the SOFC power density. A 6 mm pitch cone-insert has the ability to enhance the output power density by 33.6%. Similar to the gap and width cases, increasing the SOFC power density results in an increase in pressure drop. A cone-insert with a pitch of 6 mm may result in a pressure drop up to 500 Pa/mm.
To study the effect of the radial flow on the electrochemical reactions, we plotted the relationship between the normalized power density and the average Péclet numbers for all the cone-insert cases in Figure 11. The average Péclet number, Peave, is expressed as
Pe ave = 1 A       | u r | r p D coco 2 , eff d A
Here, ur is the local fuel velocity perpendicular to the anode surface at the anode-fuel channel interface, and A is the surface area of the interface between the fuel channel and porous anode. Figure 11a shows that, in general, an increase in the Péclet number leads to an increase in the SOFC power density. This is associated with the fact that radial flow facilitates fuel diffusion inside the porous anode, which then improves the electrochemical reactions and increases the power density. It should be noted from data group 2 that the normalized power densities are different for a similar average Péclet number. This proves that the distance fuel traveling inside the porous anode is another important factor for power density improvement, since a larger width of the cone base forces fuel to travel a longer distance in the anode. This is consistent with the observations in Figure 11b, which compares the current density distributions for the micro-tubular SOFCs with different cone-inserts. We demonstrate that the local current densities of the SOFC with inserts are systematically higher than that of the conventional micro-tubular SOFC, indicating that the electrochemical reactions are enhanced by the high local fuel concentration caused by radial flows. A smaller gap causes a higher current density peak, while a larger width also leads to a wider current density peak due to the long traveling distance of fuel in the anode. A decrease in the pitch leads to an increase in the number of peaks, which could effectively improve the output power density. However, it should be noted that increasing the local current density could also result in higher heat generations from electrochemical reactions. This may lead to local hotspots or high-temperature gradients, which might accelerate the degradation of the micro-tubular SOFC.

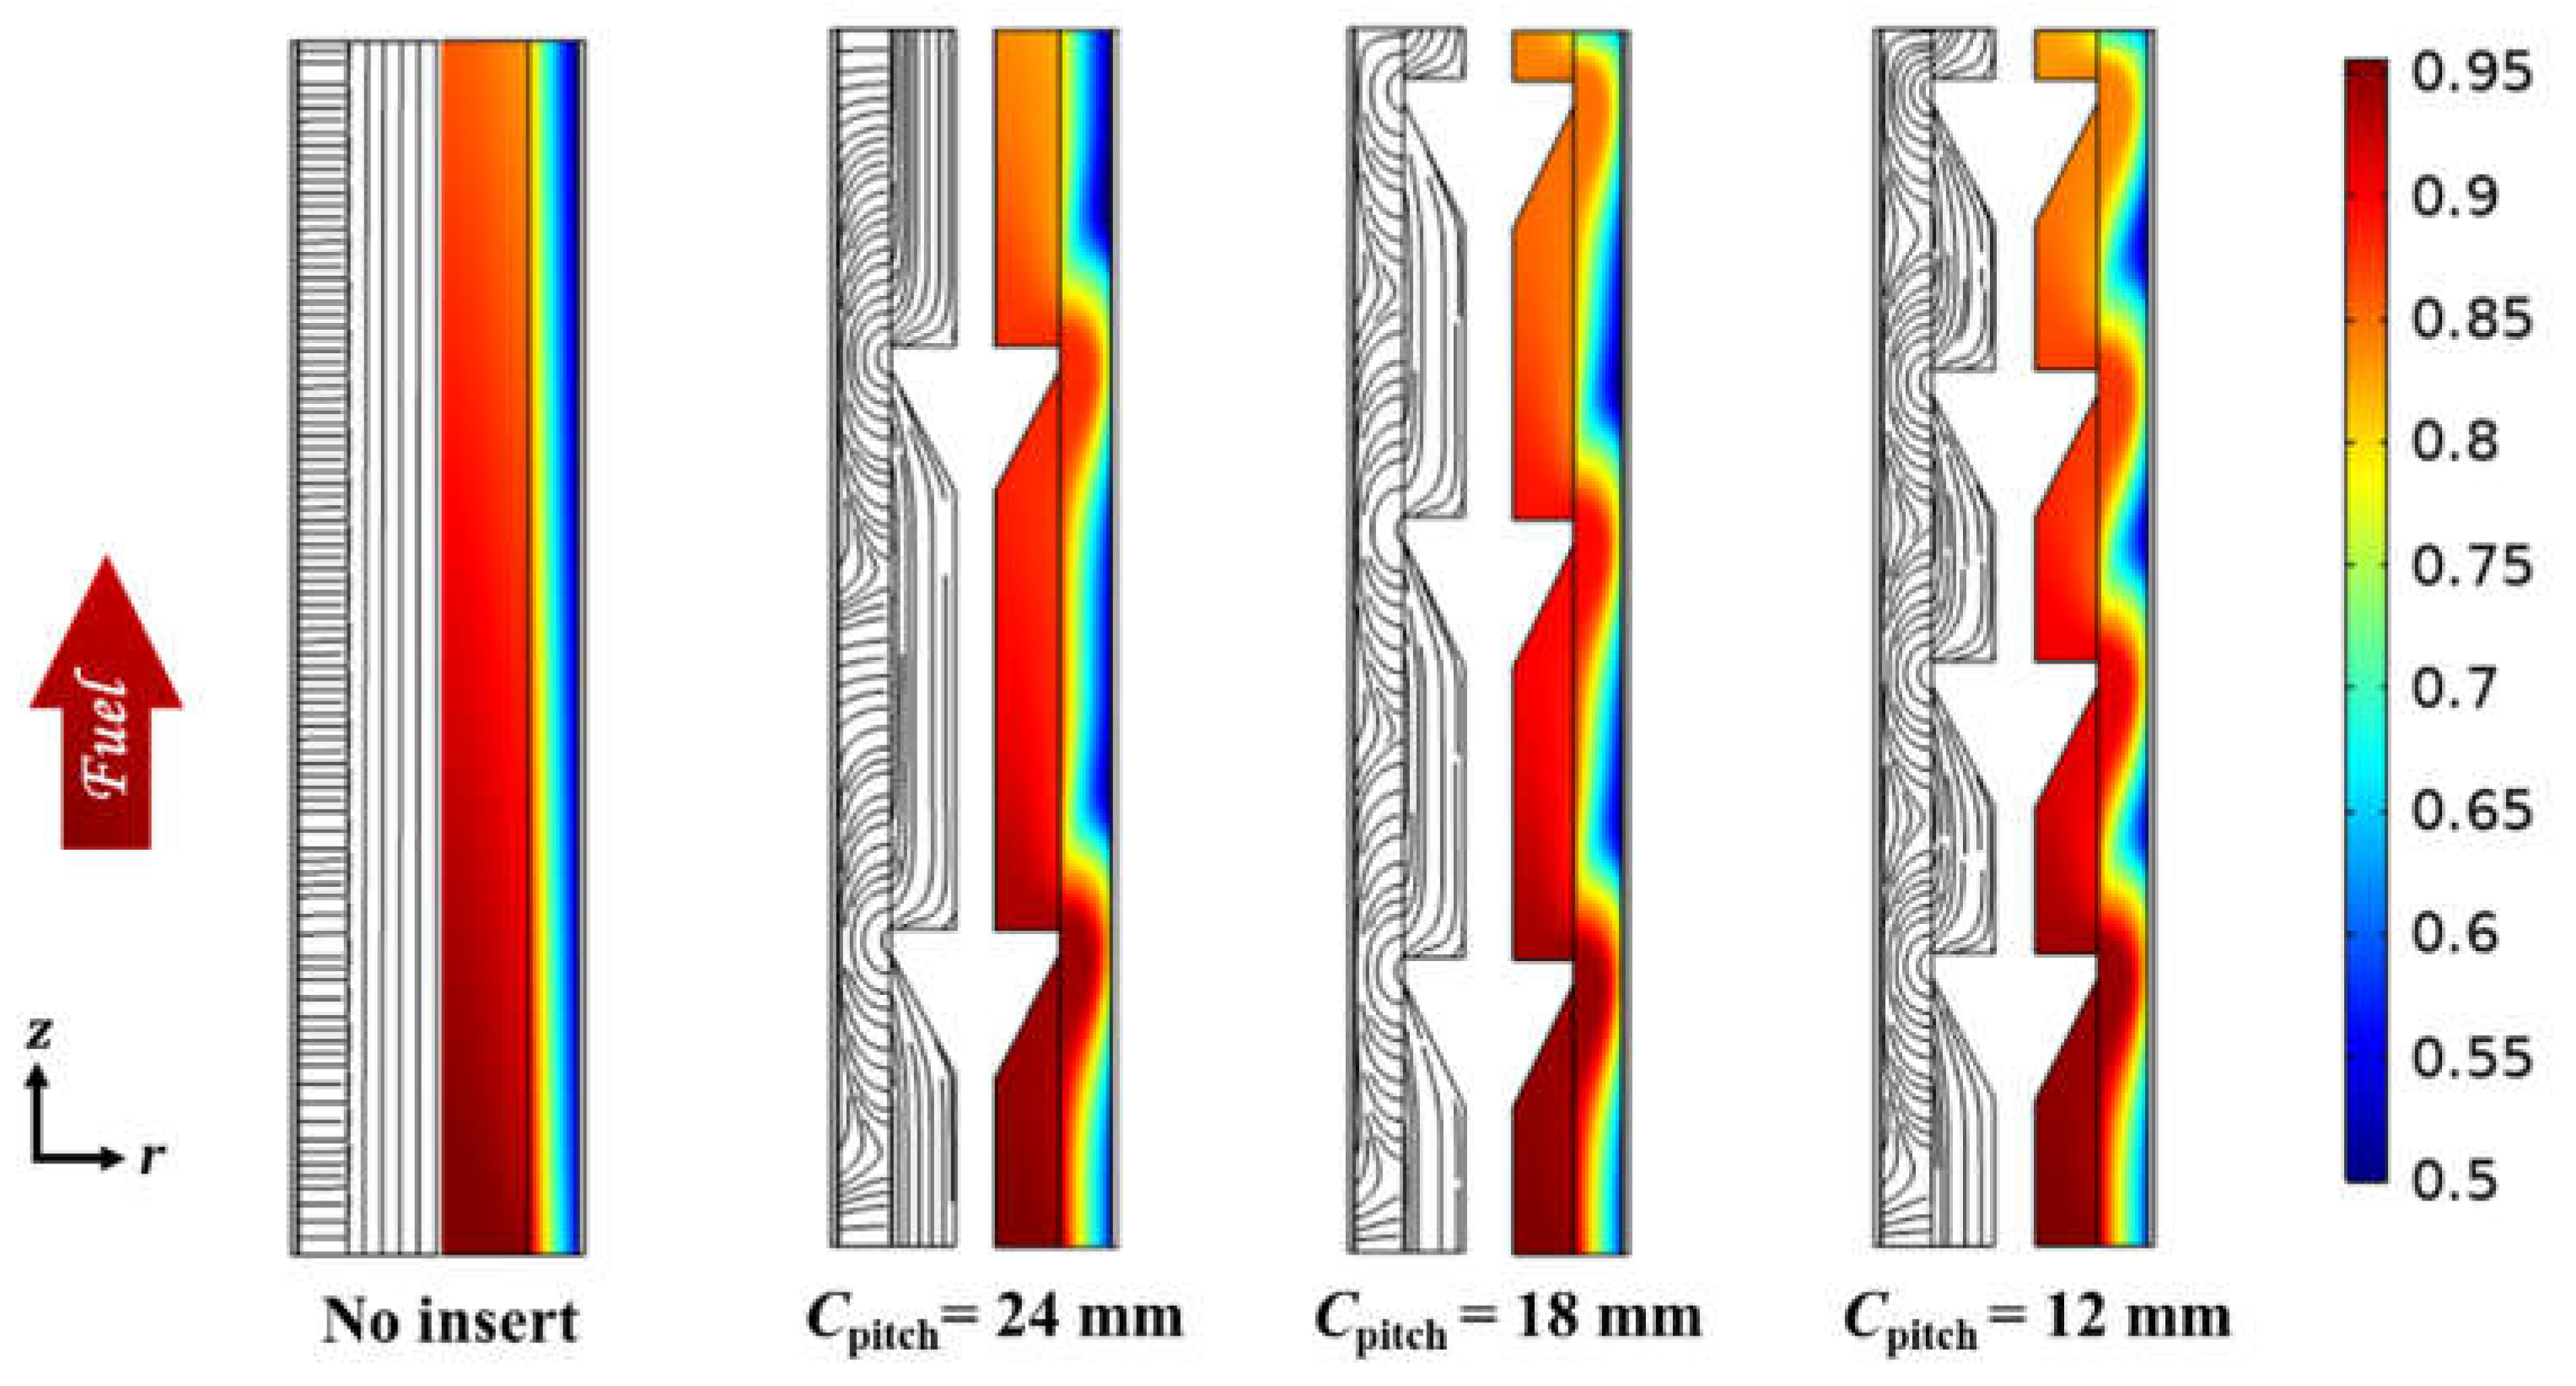
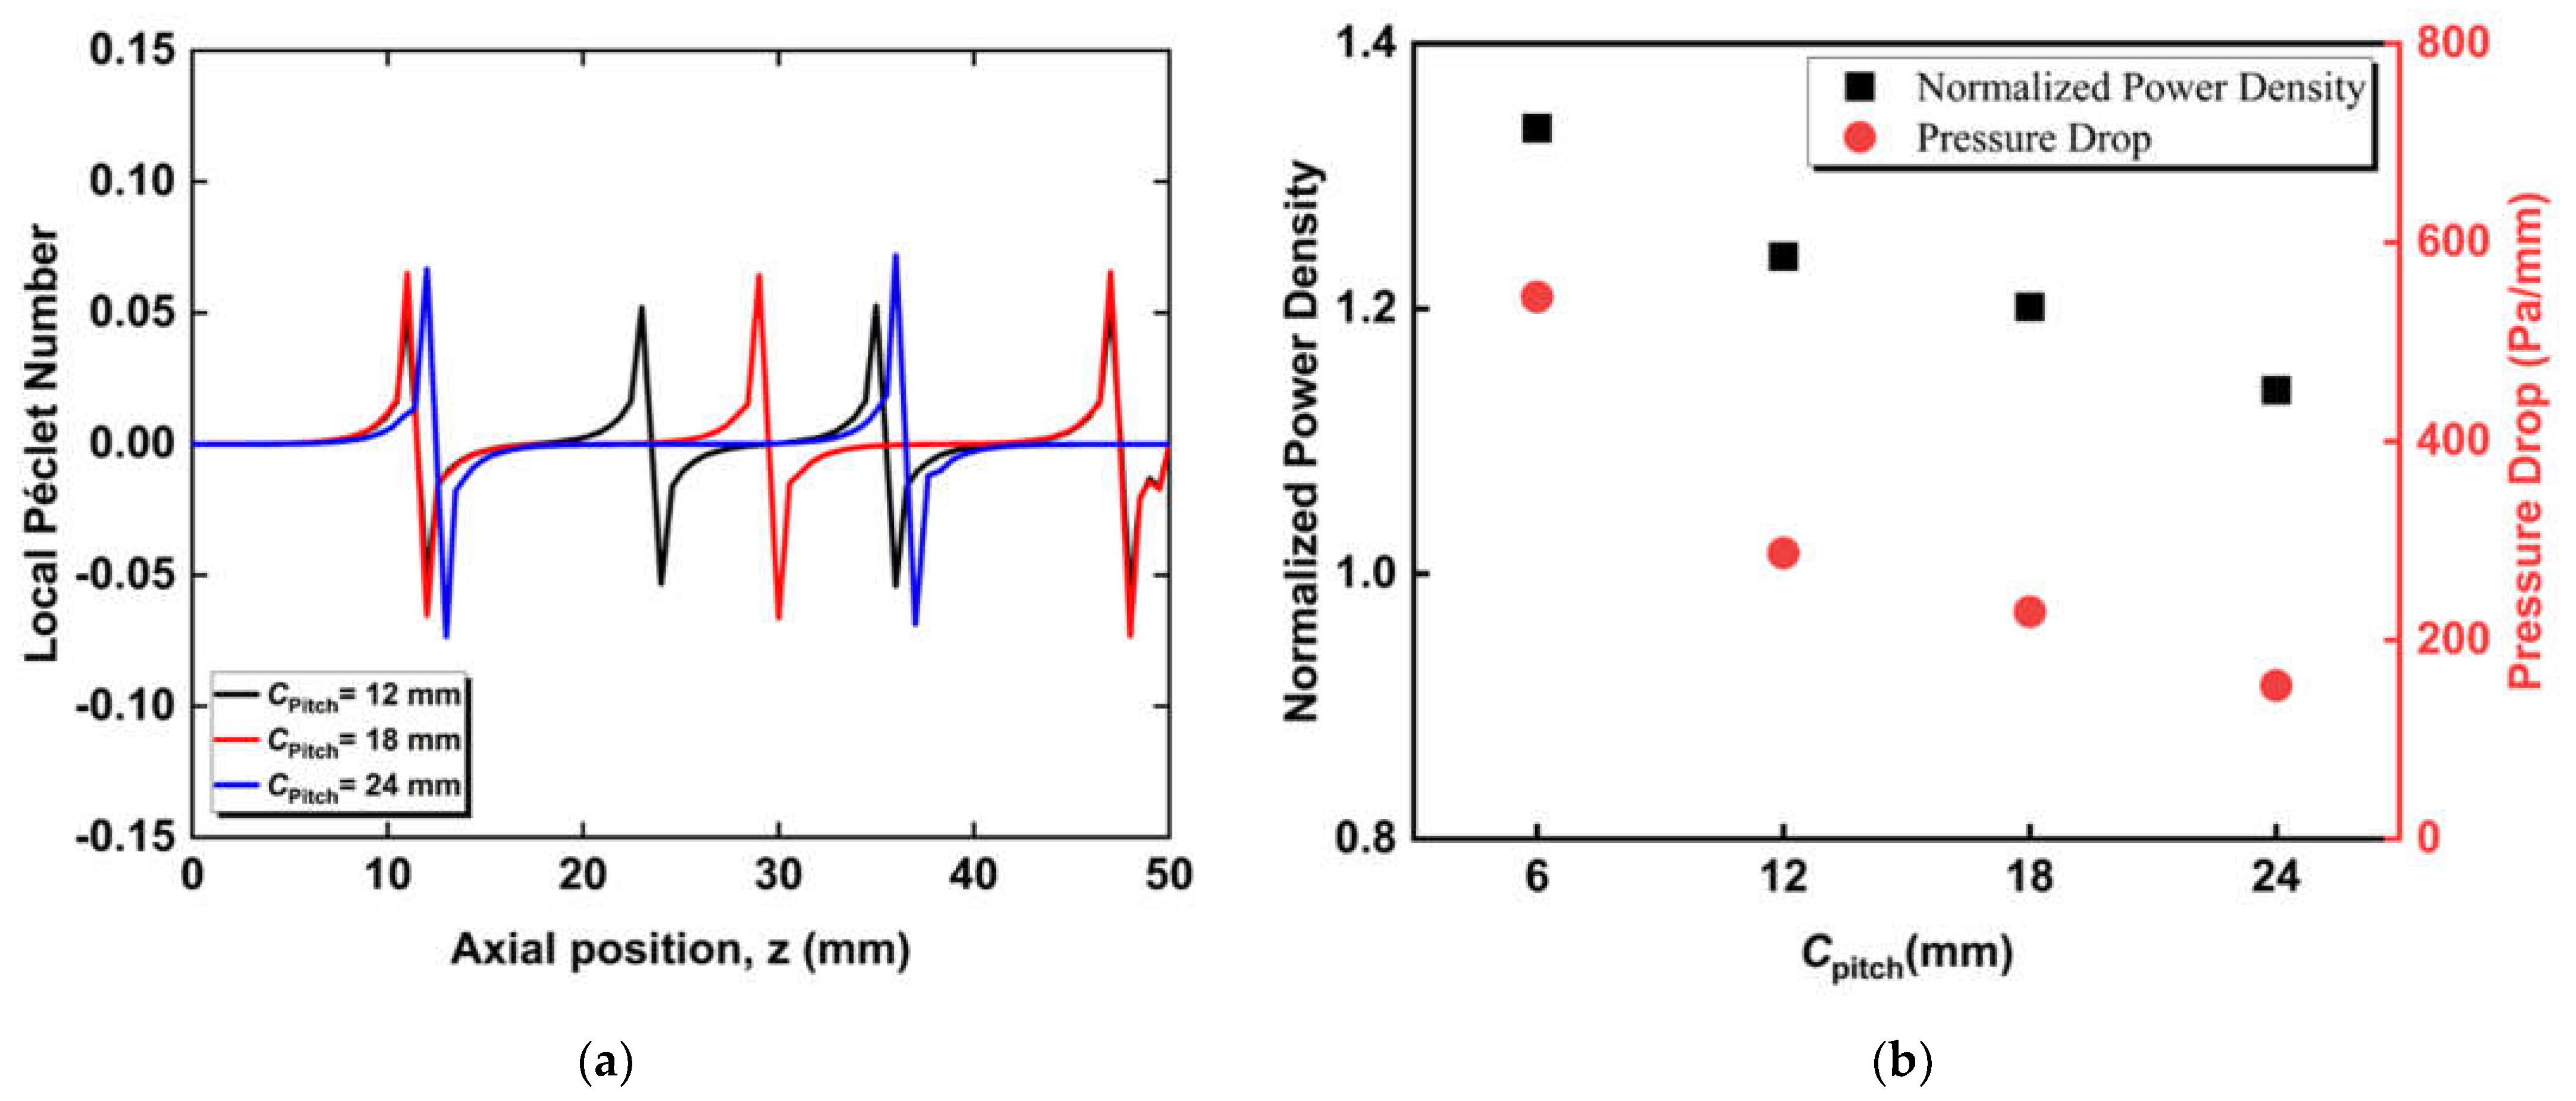
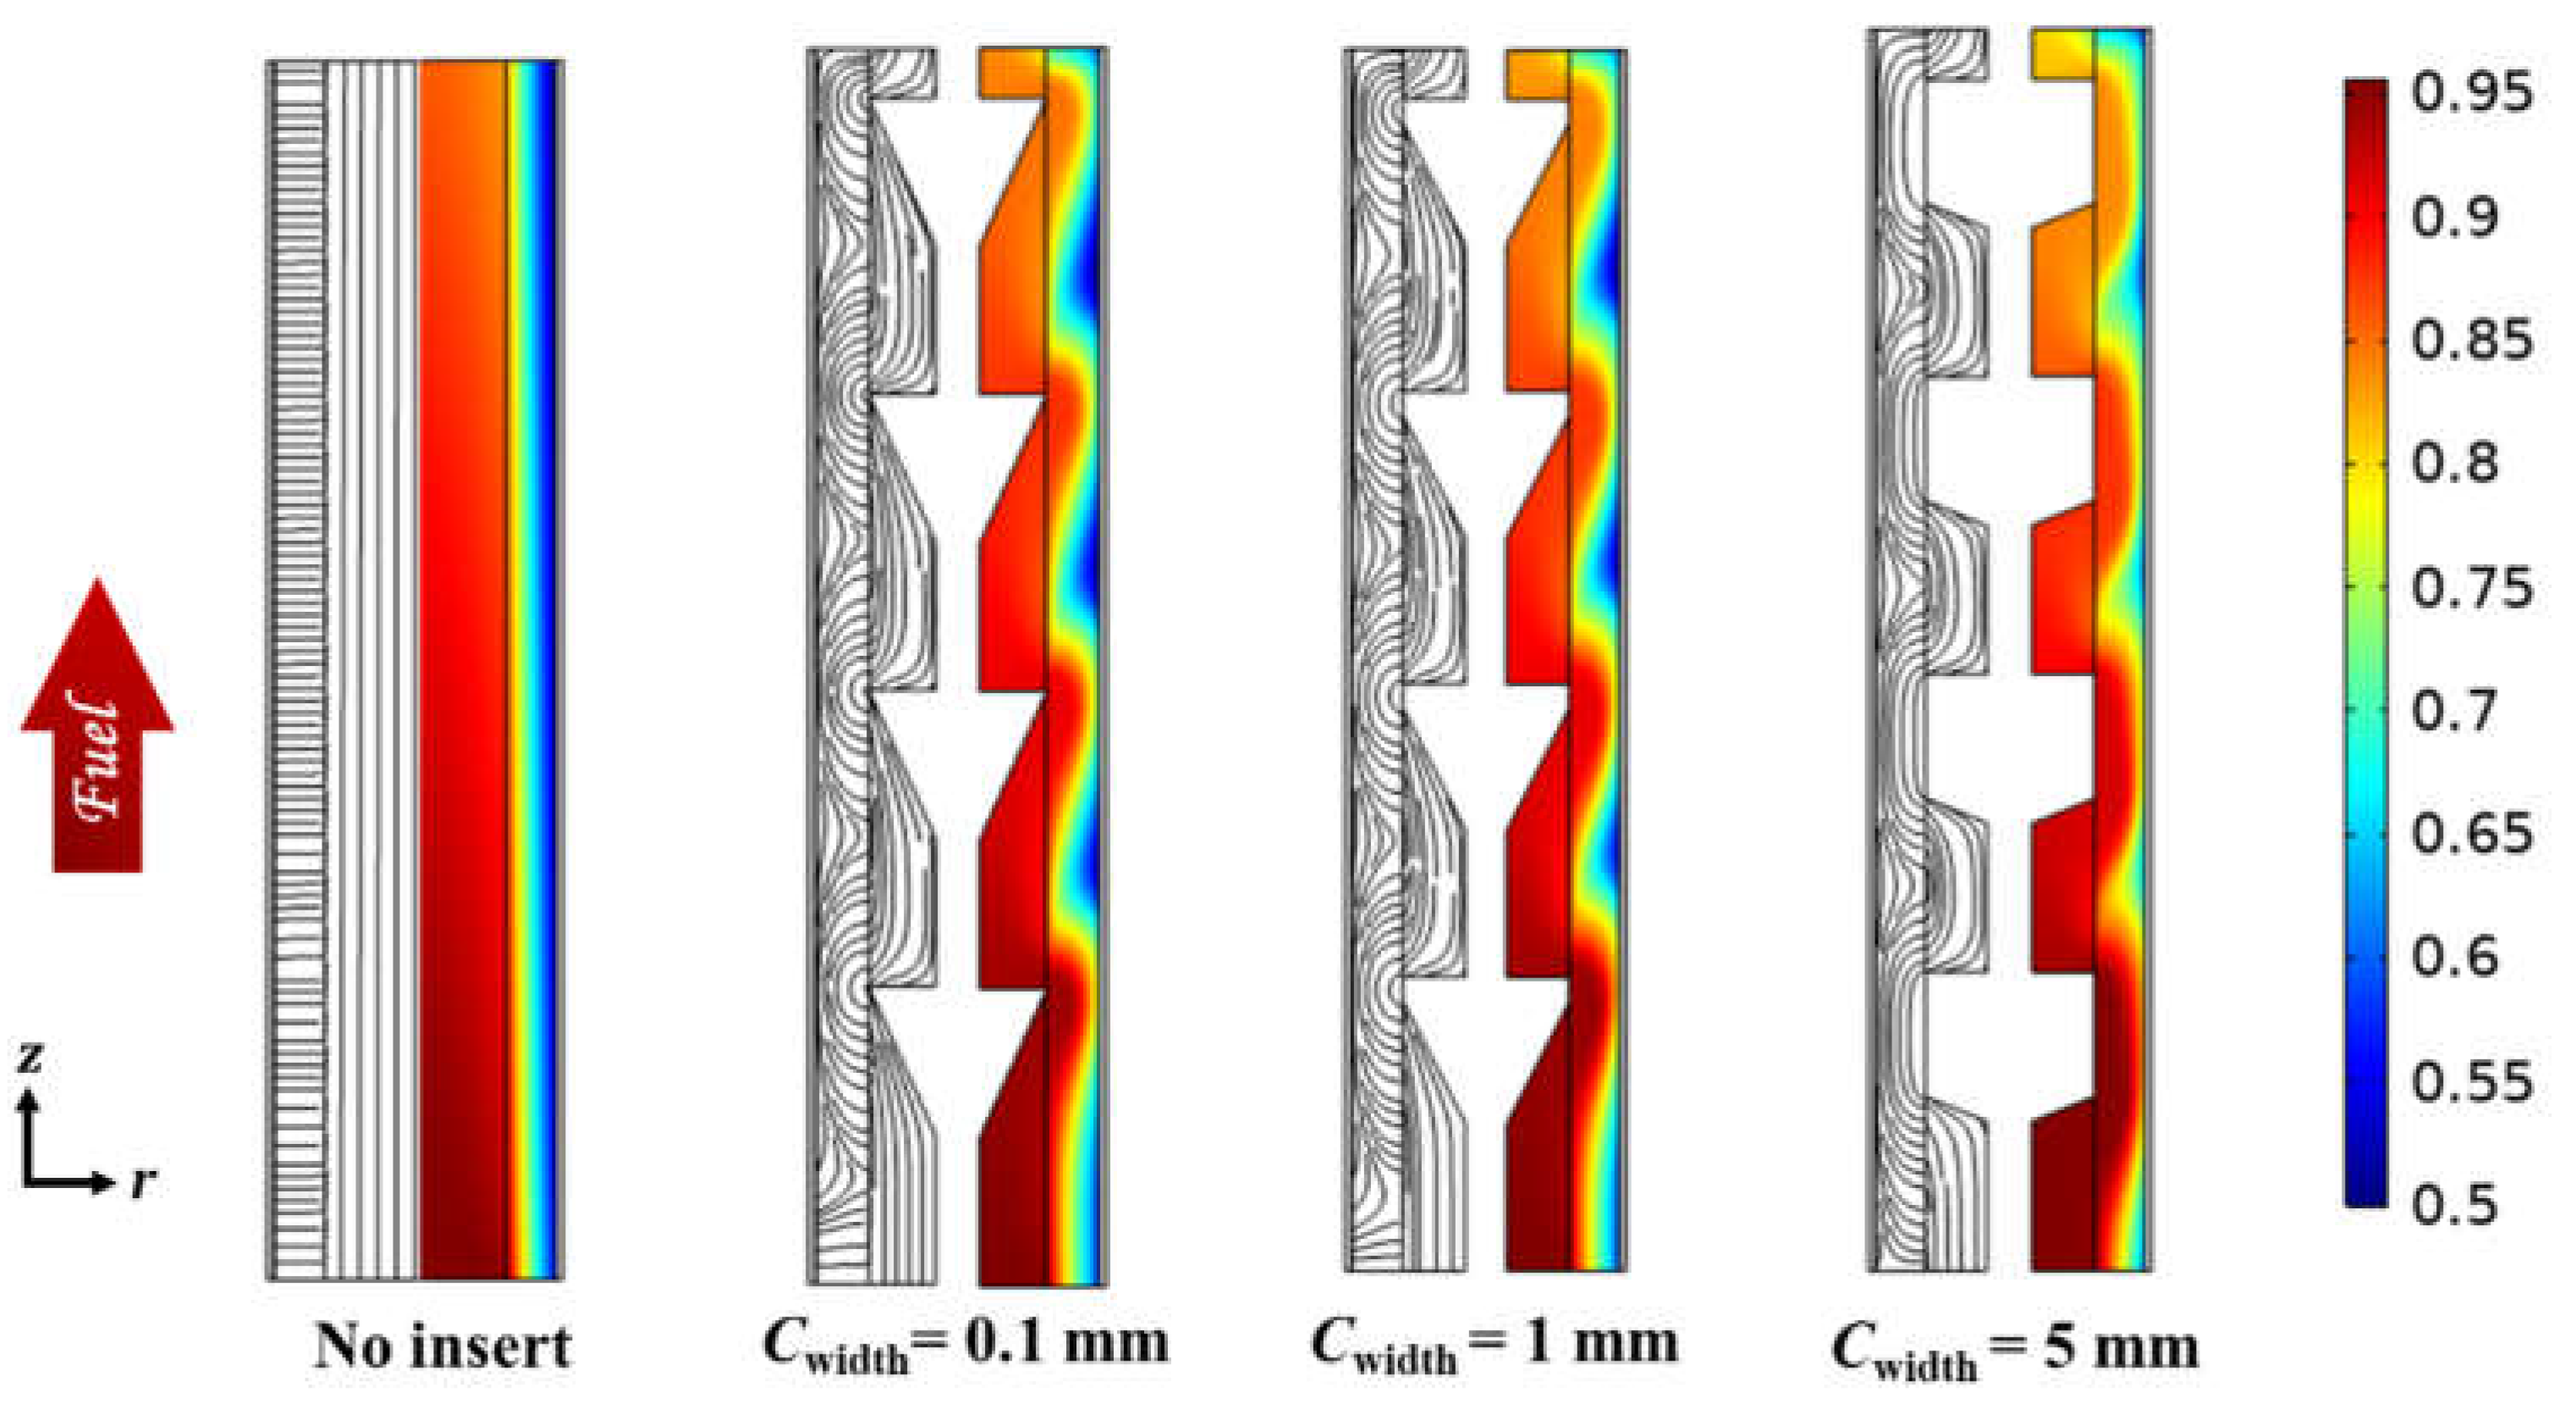
3.2. Effect of Circumferential Flow

We next studied the effect of circumferential flows on the mass transfer of carbon monoxide in the fuel channel and the anode of a micro-tubular SOFC. The flow in the circumferential direction is induced by the helical screw inserts.
The effects of different gaps and pitches of helical screw inserts on the power density enhancement were investigated, as illustrated in Figure 12a. The gap, Hgap, is the distance between the helical screw insert and the anode-fuel channel interface. The pitch, Hpitch, is the distance measured between two points on the same plane of the helix tape that is one turn apart and parallel to the axis. The width, Hwidth, is the thickness of the helix tape, and it was fixed as 0.2 mm in our study.
Figure 12b shows the 3D streamlines of a single MT-SOFC with a helical screw insert inside the fuel channel. The streamlines indicate that the fuel is rotating around the insert in the fuel channel. The helical screw inserts were able to generate circumferential flow. The influence of circumferential flow on the mass transfer characteristics of a tubular SOFC is illustrated in Figure 13.
We investigated the effect of the pitch and the gap of the helical screw insert on the flow and mass transfer in a micro-tubular SOFC. For all examined cases, the streamlines in the fuel channel are almost parallel to the anode-fuel channel interface, as shown in Figure 13. The streamlines display minor fluctuation for the case with a 6.25 mm pitch, and these fluctuations become weaker as the pitch increases. However, the streamlines in the anode are not affected by this fluctuation, which means that the helical screw insert cannot force the fuel to penetrate into the anode. As shown in the CO mole fraction contours, the concentration distribution in all cases with helical screw inserts is similar to the traditional SOFC. This implies that a helical screw insert cannot increase the amount of fuel diffused into anode pores regardless of the pitch or gap variation.
We further examined the effect of helical screw insert gap variation Hgap on the flow and mass transfer characteristics of micro-tubular SOFC in anode and fuel channels. Figure 13c illustrates the simulated streamlines and CO mole fractions in the mid-plane along the central axis of the micro-tubular SOFC. As can be observed, for all the examined cases, the streamlines in the fuel channel are almost parallel to the anode-fuel channel interface (z-direction). For the cases with 1 mm, 0.1 mm, and 0.01 mm gaps, the streamlines are nearly identical. The CO mole fraction in the radial direction inside the anode seems uniform in all cases, indicating that the helical screw insert cannot force the flow to penetrate into the porous anode. This confirms that the circumferential flow field generated by the helical screw insert, regardless of gap or pitch variation, cannot increase the amount of fuel diffused into anode pores and has a negligible impact on the power density.
Figure 14 shows the local Péclet number as a function of axial locations at the interface between the fuel channel and porous anode for the micro-tubular SOFCs with different helical screw inserts. It should be noted that the Péclet numbers for all cases are on the order of 10−5, indicating a small radial velocity induced by the helical screw inserts. The non-zero velocity at the anode-channel interface is due in part to the flow rotation caused by helical screw inserts in the fuel channel. Figure 14a shows the Péclet numbers for the cases with three different gaps. A 1 mm gap has a negligible impact on the Péclet number distribution, while the gaps of 0.1 and 0.01 mm slightly increase the local Péclet number, which is mainly due to the increase in radial velocities with the decreasing gap. However, the maximum radial velocity induced by helical screw inserts is still three orders of magnitude smaller than that induced by cone-inserts. This is because the helical screw inserts generate and enhance the flow velocity in the circumferential direction, while the cone-inserts generate and enhance the flow velocity in the radial direction. Figure 14b shows that the oscillation amplitude of the Péclet number increases with the decreasing pitch of the helical screw insert. This is in part because the smaller pitch leads to a stronger flow interaction between two subsequent helical ridges. It should be noted that the location of the Péclet number peaks depends entirely on the helical ridge locations.
Figure 15 illustrates the influence of the helical screw insert pitch and gap variations on the SOFC power density and gas-phase pressure drop. The gap and the pitch variations of the helical screw inserts have a negligible effect on the SOFC output power density. The normalized power density varies within 0.1% for all the cases examined in this section. Figure 14 also demonstrates that the gas-phase pressure drop is only at the order of magnitude of 0.1 Pa/mm, which is much smaller than the one caused by the cone-inserts. The gas-phase pressure drop decrease as the pitch of the helical screw inserts increase, indicating that reducing the number of helices leads to a reduction in the frictional loss. It also decreases with the increasing gap, which may be due to the lower friction loss in the region between the helical screw and the anode.

4. Conclusions

We developed a 3D Multiphysics model to examine the effects of radial and circumferential flows on the mass transfer characteristics in a micro-tubular SOFC. We inserted the cones and helical screw into the fuel channel for flow generation. The geometrical parameters of these inserts, such as different gaps, widths, and pitches, were examined to study their impact on the electrochemical performance of micro-tubular SOFCs.
We first examined the effect of the radial flow generated by the cone-inserts. The gap between cone-inserts and anode and the width of the cone base are two primary factors that affect mass transfer in the porous electrode. A smaller gap could force the fuel to enter the anode, resulting in a higher CO mole fraction in the radial direction compared to the conventional tubular SOFC. This facilitates the diffusion of the fuel to reach the triple-phase boundaries and therefore improves the SOFC power density by more than 20%. A larger width of the cone base could enable the fuel to travel a longer distance inside the anode, resulting in larger high concentration gradient zones, further enhancing the electrochemical reactions and increasing the power density up to 37%. The pitch is also an important factor, which has the potential to increase the power density since the cone-inserts with a smaller pitch could induce more radial flow in the fuel channel.
The Péclet number at the anode-fuel channel interface is proposed to characterize the impact of the radial and circumferential flows on the mass transfer characteristics and the power density of the tubular SOFC. A higher local Péclet number indicates a higher local velocity in the radial direction, indicating an improvement of the convective mass transfer at the anode-fuel channel interface. The power density of SOFC, in general, is proportional to the average Péclet number, meaning the convective mass transfer along the radial direction is one of the main factors in enhancing the power density. It should be noted that in all the cases of cone-inserts, the power density increases at the expense of a higher gas-phase pressure drop.
We also investigated the effect of different gaps and pitches on mass transfer within the fuel channel and porous anode using helical screw inserts. We demonstrated that regardless of the geometrical parameter variation, the circumferential flow has a negligible impact on the convective transport mechanism and the power density improvements of the tubular SOFC. In comparison, the radial flow has the potential to significantly enhance the electrochemical reactions in porous electrodes and increase the SOFC power density.

Author Contributions

Conceptualization, A.E. and Z.Z.; data curation, A.E.; formal analysis, A.E.; methodology, A.E.; software, A.E. and B.Z.; validation, A.E., C.H. and Z.Z.; investigation, A.E., Z.Z. and Y.Z; resources, Y.Z., W.Z. and Y.Q.; writing—original draft preparation, A.E.; writing—review and editing, A.E., Z.Z., B.Z. and Y.Z.; supervision, Z.Z., Y.Z. and W.Z.; project administration, Y.Z., W.Z. and Y.Q.; funding acquisition, Y.Z., W.Z. and Y.Q. All authors have read and agreed to the published version of the manuscript.

Funding

The present article is based on work supported in part by The Advanced Aviation Power Innovation institution and The Aero Engine Academy of China and supported by Tsinghua University Initiative Scientific Research Program.

Institutional Review Board Statement

Not applicable.

Informed Consent Statement

Not applicable.

Conflicts of Interest

The authors declare no conflict of interest. The funders had no role in the design of the study; in the collection, analyses, or interpretation of data; in the writing of the manuscript; or in the decision to publish the results.

References

  1. Dincer, I. Energy and Environmental Impacts: Present and Future Perspectives. Energy Sources 1998, 20, 427–453. [Google Scholar] [CrossRef]
  2. Stambouli, A.B.; Traversa, E. Solid Oxide Fuel Cells (SOFCs): A Review of an Environmentally Clean and Efficient Source of Energy. Renew. Sustain. Energy Rev. 2002, 6, 433–455. [Google Scholar] [CrossRef]
  3. Mekhilef, S. Comparative Study of Different Fuel Cell Technologies. Renew. Sustain. Energy Rev. 2012, 9, 981–989. [Google Scholar] [CrossRef]
  4. McLean, G.F.; Niet, T.; Prince-Richard, S.; Djilali, N. An Assessment of Alkaline Fuel Cell Technology. Int. J. Hydrogen Energy 2002, 20, 507–526. [Google Scholar] [CrossRef]
  5. Mulder, G.; Coenen, P.; Martens, A.; Spaepen, J. The Development of a 6 kW Fuel Cell Generator Based on Alkaline Fuel Cell Technology. Int. J. Hydrogen Energy 2008, 33, 3220–3224. [Google Scholar] [CrossRef]
  6. Kordesch, K.; Hacker, V.; Reichmann, K.; Cifrain, M.; Hejze, T.; Aronsson, R.R. The Safe and Economic Revival of Alkaline Hydrogen/Air Fuel Cells with Circulating Electrolytes, Recommended for Vehicles Using Battery Hybrid Systems and H2 from Ammonia Crackers. ECS Trans. 2008, 11, 167–185. [Google Scholar] [CrossRef]
  7. Lü, X.; Qu, Y.; Wang, Y.; Qin, C.; Liu, G. A Comprehensive Review on Hybrid Power System for PEMFC-HEV: Issues and Strategies. Energy Convers. Manag. 2018, 171, 1273–1291. [Google Scholar] [CrossRef]
  8. Cooper, N.J.; Smith, T.; Santamaria, A.D.; Park, J.W. Experimental Optimization of Parallel and Interdigitated PEMFC Flow-Field Channel Geometry. Int. J. Hydrogen Energy 2016, 41, 1213–1223. [Google Scholar] [CrossRef]
  9. Fernandes, A.; Woudstra, T.; van Wijk, A.; Verhoef, L.; Aravind, P.V. Fuel Cell Electric Vehicle as a Power Plant and SOFC as a Natural Gas Reformer: An Exergy Analysis of Different System Designs. Appl. Energy 2016, 173, 13–28. [Google Scholar] [CrossRef]
  10. Bessekon, Y.; Zielke, P.; Wulff, A.C.; Hagen, A. Simulation of a SOFC/Battery Powered Vehicle. Int. J. Hydrogen Energy 2019, 44, 1905–1918. [Google Scholar] [CrossRef]
  11. Luo, Y.; Shi, Y.; Cai, N. Chapter 4—High-Efficiency Hybrid Fuel Cell Systems for Vehicles and Micro-CHPs. In Hybrid Systems and Multi-energy Networks for the Future Energy Internet; Academic Press: Cambridge, MA, USA, 2021; Volume 27. [Google Scholar]
  12. Eguchi, K. Fuel Flexibility in Power Generation by Solid Oxide Fuel Cells. Solid State Ion. 2002, 152–153, 411–416. [Google Scholar] [CrossRef]
  13. Nehter, P.; Wildrath, B.; Bauschulte, A.; Leites, K. Diesel Based SOFC Demonstrator for Maritime Applications. ECS Trans. 2017, 78, 171–180. [Google Scholar] [CrossRef]
  14. Maru, H.C.; Singhal, S.C.; Stone, C.; Wheeler, D. 1–10 KW Stationary Combined Heat and Power Systems Status and Technical Potential: Independent Review. 2010. Available online: https://www.osti.gov/servlets/purl/993647 (accessed on 1 September 2022).
  15. Ellamla, H.R.; Staffell, I.; Bujlo, P.; Pollet, B.G.; Pasupathi, S. Current Status of Fuel Cell Based Combined Heat and Power Systems for Residential Sector. J. Power Sources 2015, 293, 312–328. [Google Scholar] [CrossRef]
  16. Zhu, B. Advantages of Intermediate Temperature Solid Oxide Fuel Cells for Tractionary Applications. J. Power Sources 2001, 93, 82–86. [Google Scholar] [CrossRef]
  17. Zhao, Y.; Jing, R.; Zhang, Z. Feasibility of Solid Oxide Fuel Cell Stationary Applications in China’s Building Sector and Relevant Progress. In Design and Operation of Solid Oxide Fuel Cells; Elsevier: Amsterdam, The Netherlands, 2020; pp. 359–393. ISBN 978-0-12-815253-9. [Google Scholar]
  18. Winkler, W.; Lorenz, H. Design Studies of Mobile Applications with SOFC–Heat Engine Modules. J. Power Sources 2002, 6, 338–343. [Google Scholar] [CrossRef]
  19. Rechberger, J.; Kaupert, A.; Hagerskans, J.; Blum, L. Demonstration of the First European SOFC APU on a Heavy Duty Truck. Transp. Res. Procedia 2016, 14, 3676–3685. [Google Scholar] [CrossRef]
  20. Santarelli, M.; Cabrera, M.; Calì, M. Solid Oxide Fuel Based Auxiliary Power Unit for Regional Jets: Design and Mission Simulation With Different Cell Geometries. J. Fuel Cell Sci. Technol. 2010, 7, 021006. [Google Scholar] [CrossRef]
  21. Korean Researchers Create Miniaturised SOFC to Power Drones. Fuel Cells Bull. 2016, 2016, 5. [CrossRef]
  22. Kendall, K. Progress in Microtubular Solid Oxide Fuel Cells. Int. J. Appl. Ceram. Technol. 2010, 7, 1–9. [Google Scholar] [CrossRef]
  23. Leah, R.T.; Bone, A.; Hammer, E.; Selcuk, A.; Rahman, M.; Clare, A.; Mukerjee, S.; Selby, M. Development Progress on the Ceres Power Steel Cell Technology Platform: Further Progress Towards Commercialization. ECS Trans. 2017, 78, 87–95. [Google Scholar] [CrossRef]
  24. Mukerjee, S.; Leah, R.; Selby, M.; Stevenson, G.; Brandon, N.P. Life and Reliability of Solid Oxide Fuel Cell-Based Products. In Solid Oxide Fuel Cell Lifetime and Reliability; Elsevier: Amsterdam, The Netherlands, 2017; pp. 173–191. ISBN 978-0-08-101102-7. [Google Scholar]
  25. Kendall, K.; Dikwal, C.M.; Bujalski, W. Comparative Analysis of Thermal and Redox Cycling for Microtubular SOFCs. ECS Trans. 2019, 7, 1521–1526. [Google Scholar] [CrossRef]
  26. Campana, R.; Merino, R.I.; Larrea, A.; Villarreal, I.; Orera, V.M. Fabrication, Electrochemical Characterization and Thermal Cycling of Anode Supported Microtubular Solid Oxide Fuel Cells. J. Power Sources 2009, 192, 120–125. [Google Scholar] [CrossRef]
  27. Matus, Y.; Dejonghe, L.; Jacobson, C.; Visco, S. Metal-Supported Solid Oxide Fuel Cell Membranes for Rapid Thermal Cycling. Solid State Ion. 2005, 176, 443–449. [Google Scholar] [CrossRef]
  28. Yu, Z.; Xu, Y.; Hu, B.; Liu, S.; Zhang, X. Comparing the Air Flow Distribution Qualities Among Three Different Air Flow Path Configurations for Tubular Solid Oxide Fuel Cell Stacks. Int. J. Electrochem. Sci. 2016, 11, 9100–9109. [Google Scholar] [CrossRef]
  29. Chen, D.; Xu, Y.; Hu, B.; Yan, C.; Lu, L. Investigation of Proper External Air Flow Path for Tubular Fuel Cell Stacks with an Anode Support Feature. Energy Convers. Manag. 2018, 171, 807–814. [Google Scholar] [CrossRef]
  30. Saied, M.; Ahmed, K.; Nemat-Alla, M.; Ahmed, M.; El-Sebaie, M. Performance Study of Solid Oxide Fuel Cell with Various Flow Field Designs: Numerical Study. Int. J. Hydrogen Energy 2018, 43, 20931–20946. [Google Scholar] [CrossRef]
  31. Bi, W.; Chen, D.; Lin, Z. A Key Geometric Parameter for the Flow Uniformity in Planar Solid Oxide Fuel Cell Stacks. Int. J. Hydrogen Energy 2009, 34, 3873–3884. [Google Scholar] [CrossRef]
  32. Danilov, V.A.; Tade, M.O. A CFD-Based Model of a Planar SOFC for Anode Flow Field Design. Int. J. Hydrogen Energy 2009, 34, 8998–9006. [Google Scholar] [CrossRef]
  33. Yuan, H. Compare New Designed Flow Channels of Interconnect for Planar SOFCs with Typical Channels. 2009, p. 7. Available online: https://www.ht.energy.lth.se/fileadmin/ht/Kurser/TFRF05/09_project/Yung_Huang.pdf (accessed on 1 September 2022).
  34. Khazaee, I.; Rava, A. Numerical Simulation of the Performance of Solid Oxide Fuel Cell with Different Flow Channel Geometries. Energy 2017, 119, 235–244. [Google Scholar] [CrossRef]
  35. Liu, S.; Kong, W.; Lin, Z. Three-Dimensional Modeling of Planar Solid Oxide Fuel Cells and the Rib Design Optimization. J. Power Sources 2009, 194, 854–863. [Google Scholar] [CrossRef]
  36. Wei, S.-S.; Wang, T.-H.; Wu, J.-S. Numerical Modeling of Interconnect Flow Channel Design and Thermal Stress Analysis of a Planar Anode-Supported Solid Oxide Fuel Cell Stack. Energy 2014, 69, 553–561. [Google Scholar] [CrossRef]
  37. Christman, K.L.; Jensen, M.K. Solid Oxide Fuel Cell Performance With Cross-Flow Roughness. J. Fuel Cell Sci. Technol. 2011, 8, 024501. [Google Scholar] [CrossRef]
  38. Canavar, M.; Mat, A.; Celik, S.; Timurkutluk, B.; Kaplan, Y. Investigation of Temperature Distribution and Performance of SOFC Short Stack with/without Machined Gas Channels. Int. J. Hydrogen Energy 2016, 41, 10030–10036. [Google Scholar] [CrossRef]
  39. Zeng, Z.; Hao, C.; Zhao, B.; Qian, Y.; Zhuge, W.; Wang, Y.; Shi, Y.; Zhang, Y. Local Heat Transfer Enhancement by Recirculation Flows for Temperature Gradient Reduction in a Tubular SOFC. Int. J. Green Energy 2022, 19, 1132–1147. [Google Scholar] [CrossRef]
  40. Zhao, B.; Zeng, Z.; Hao, C.; Essaghouri, A.; Qian, Y.; Zhuge, W.; Wang, Y.; Shi, Y.; Zhang, Y. A Study of Mass Transfer Characteristics of Secondary Flows in a Tubular Solid Oxide Fuel Cell for Power Density Improvement. Int. J. Energy Res. 2022, 1–19. [Google Scholar] [CrossRef]
  41. Ni, M. Modeling of SOFC Running on Partially Pre-Reformed Gas Mixture. Int. J. Hydrogen Energy 2012, 37, 1731–1745. [Google Scholar] [CrossRef]
  42. Guidelli, R.; Compton, R.G.; Feliu, J.M.; Gileadi, E.; Lipkowski, J.; Schmickler, W.; Trasatti, S. Defining the Transfer Coefficient in Electrochemistry: An Assessment (IUPAC Technical Report). Pure Appl. Chem. 2014, 86, 245–258. [Google Scholar] [CrossRef]
  43. Mirahmadi, A.; Valefi, K. Study of Thermal Effects on the Performance of Micro-Tubular Solid-Oxide Fuel Cells. Ionics 2011, 17, 767–783. [Google Scholar] [CrossRef]
  44. Poling, B.E.; Prausnitz, J.M.; O’Connell, J.P. The Properties of Gases and Liquids, 5th ed.; McGraw-Hill: New York, NY, USA, 2001; ISBN 978-0-07-011682-5. [Google Scholar]
  45. Wesselingh, J.A.; Krishna, R.; Krishna, R. Mass Transfer in Multicomponent Mixtures, 1st ed.; VSSD: Delft, The Netherlands, 2006; ISBN 978-90-71301-58-2. [Google Scholar]
  46. Lemcoff, N.O.; Tweedie, M. CFD Modeling and Analysis of a Planar Anode Supported Intermediate Temperature Solid Oxide Fuel Cell. 2014, p. 7. Available online: https://www.semanticscholar.org/paper/CFD-Modeling-and-Analysis-of-a-Planar-Anode-Solid-Tweedie-Lemcoff/f87d81d31581cc90c8caaa1994beaed0b1cf1b6e (accessed on 1 September 2022).
  47. Nagata, S.; Momma, A.; Kato, T.; Kasuga, Y. Numerical Analysis of Output Characteristics of Tubular SOFC with Internal Reformer. J. Power Sources 2001, 101, 60–71. [Google Scholar] [CrossRef]
  48. Chen, B.; Xu, H.; Tan, P.; Zhang, Y.; Xu, X.; Cai, W.; Chen, M.; Ni, M. Thermal Modelling of Ethanol-Fuelled Solid Oxide Fuel Cells. Appl. Energy 2019, 237, 476–486. [Google Scholar] [CrossRef]
  49. Akhtar, N.; Decent, S.P.; Kendall, K. A Parametric Analysis of a Micro-Tubular, Single-Chamber Solid Oxide Fuel Cell (MT-SC-SOFC). Int. J. Hydrogen Energy 2011, 36, 765–772. [Google Scholar] [CrossRef]
  50. Williford, R.E.; Chick, L.A.; Maupin, G.D.; Simner, S.P.; Stevenson, J.W. Diffusion Limitations in the Porous Anodes of SOFCs. J. Electrochem. Soc. 2003, 150, A1067. [Google Scholar] [CrossRef]
  51. Chen, B.; Xu, H.; Ni, M. Modelling of SOEC-FT Reactor: Pressure Effects on Methanation Process. Appl. Energy 2017, 185, 814–824. [Google Scholar] [CrossRef]
  52. Todd, B.; Young, J.B. Thermodynamic and Transport Properties of Gases for Use in Solid Oxide Fuel Cell Modelling. J. Power Sources 2002, 110, 186–200. [Google Scholar] [CrossRef]
  53. Ni, M. Computational Fluid Dynamics Modeling of a Solid Oxide Electrolyzer Cell for Hydrogen Production. Int. J. Hydrogen Energy 2009, 34, 7795–7806. [Google Scholar] [CrossRef]
  54. Manglik, R.M.; Bergles, A.E. Heat Transfer and Pressure Drop Correlations for Twisted-Tape Inserts in Isothermal Tubes: Part I—Laminar Flows. J. Heat Transf. 1993, 115, 881–889. [Google Scholar] [CrossRef]
Figure 1. Schematic of micro-tubular solid oxide fuel cells with (a) cone-insert and (b) helical screw insert.
Energies 15 07048 g001
Figure 2. A summary of boundary conditions of the micro-tubular solid oxide fuel cells.
Energies 15 07048 g002
Figure 3. The comparison between (a) the applied voltage and current density of a micro-tubular SOFC, (b) friction factor as a function of Reynolds numbers from our simulation and the results from previous study.
Energies 15 07048 g003
Figure 4. Schematic of the porous anode and cone-insert inside the fuel channel of micro-tubular SOFC.
Energies 15 07048 g004
Figure 5. The streamlines (left) and CO mole fractions (right) of the micro-tubular SOFCs, without an insert and with inserts of three different gaps.
Energies 15 07048 g005
Figure 6. The influence of cone-insert of different gaps on (a) local Péclet number variation in the anode-fuel channel interface along the axial direction, (b) the output power density and the gas-phase pressure drop of the micro-tubular SOFC.
Energies 15 07048 g006
Figure 7. The streamlines and CO mole fractions of the micro-tubular SOFCs, without an insert and with cone-inserts of different widths (the thickness of the cone base).
Energies 15 07048 g007
Figure 8. The influence of cone-insert of different widths on (a) local Péclet number variation in the anode-fuel channel interface along the axial direction, (b) the output power density and gas-phase pressure drop of micro-tubular SOFC.
Energies 15 07048 g008
Figure 9. The streamlines and CO mole fractions of the micro-tubular SOFCs, without an insert and with cone-inserts of different pitches.
Energies 15 07048 g009
Figure 10. The influence of cone-insert of different pitches on (a) local Péclet number variation in the anode-fuel channel interface along the axial direction, (b) the output power density and gas-phase pressure drop of micro-tubular SOFC.
Energies 15 07048 g010
Figure 11. Comparison of (a) the power density increasement as a function of the average Péclet numbers for all the cases examined in Section 3.1. Data group 1, 2, and 3 respectively denotes the cases with gap, width, and pitch variations. (b) axial current density distributions for the micro-tubular SOFCs with and without cone-inserts.
Energies 15 07048 g011
Figure 12. (a) A schematic of the porous anode and helical screw insert inside the fuel channel and (b) the predicted streamlines in the fuel channel of a micro-tubular SOFC with a helical screw insert.
Energies 15 07048 g012
Figure 13. The streamlines (left) and CO mole fractions (right) of the micro-tubular SOFCs (a) without an insert; and with helical screw inserts of different (b) pitches (c) gaps.
Energies 15 07048 g013
Figure 14. Local Péclet number variation in the anode-fuel channel interface along the axial direction with helical screw insert for three different (a) gap cases and (b) pitch cases.
Energies 15 07048 g014
Figure 15. The influence of helical screw insert of different (a) pitches and (b) gaps on normalized power density and pressure drop of micro-tubular SOFC.
Energies 15 07048 g015
Table 1. The geometry details of the micro-tubular solid oxide fuel cells investigated in this study.
ParametersSymbolValueUnit
Fuel channel diameterD07mm
Internal diameterDi1mm
Total lengthLt50mm
Anode thicknessta2mm
Electrolyte thicknesste50µm
Cathode thicknesstc250µm
Table 2. A summary of parameters used in this study.
ParametersSymbolsValuesUnitsRef.
Activation energy for the anode reactionEa120kJ mol−1[47]
Activation energy for the cathode reactionEc130kJ mol−1[47]
Electrode porosityε0.35-[43]
Specific surface area of the anodeAυ,a2.33 × 105m−1[48]
Specific surface area of the cathodeAυ,c2.46 × 105m−1[48]
Permeabilityk1 × 10−11m2[49]
Electrode tortuosityτ4-[50]
Viscosity, COμCO4.1877 × 10−5Pa·s[44]
Viscosity, O2μO25.1343 × 10−5Pa·s[44]
Viscosity, CO2μCO24.1904 × 10−5Pa·s[44]
Viscosity, N2μN24.3529 × 10−5Pa·s[44]
Electrical conductivity, anodeσNi30,316S·m−1[51]
Electrical conductivity, cathodeσLSM12,793S·m−1[51]
Ionic conductivity, electrolyteσYSZ2.2669S·m−1[51]
Diffusion volume, COυCO18.0cm3[52]
Diffusion volume, O2υO216.3cm3[52]
Diffusion volume, CO2υCO226.7cm3[52]
Diffusion volume, N2υN218.5cm3[52]
Effective radius of the poresrp0.5µm[53]
Ambient pressurePatm101.325kPa[41]
Inlet mass flow rate at the anodeQfuel6.27 × 10−6kg s−1-
Inlet mole fraction, COxCO0.95--
Inlet mole fraction, O2xO20.21--
Reference temperatureTref800°C-
Operating potentialE0.6V-
Publisher’s Note: MDPI stays neutral with regard to jurisdictional claims in published maps and institutional affiliations.

