
Experimental Study on the Factors of the Oil Shale Thermal Breakdown in High-Voltage Power Frequency Electric Heating Technology
1
Construction Engineering College, Jilin University, Changchun 130026, China
2
National-Local Joint Engineering Laboratory of In-Situ Conversion, Drilling and Exploitation Technology for Oil Shale, Changchun 130021, China
3
Key Laboratory of Drilling and Exploitation Technology in Complex Condition, Ministry of Land and Resource, Changchun 130026, China
4
School of Engineering and Technology, China University of Geosciences, Beijing 100083, China
5
Department of Electrical Engineering and Energy Technology, University of Vaasa, P.O. Box 700, FIN-65101 Vaasa, Finland
*
Authors to whom correspondence should be addressed.
Energies 2022, 15(19), 7181; https://doi.org/10.3390/en15197181
Submission received: 9 September 2022
/
Revised: 25 September 2022
/
Accepted: 26 September 2022
/
Published: 29 September 2022
(This article belongs to the Special Issue Research and Development Progress in Oil Shale)
Abstract
:We conducted an experimental study on the breakdown process of oil shale by high-voltage power frequency electric heating in-situ pyrolyzing (HVF) technology to examine the impact mechanisms of the electric field intensity, initial temperature, and moisture content on a breakdown, using Huadian oil shale samples. A thermal breakdown occurred when the electric field intensity was between 100 and 180 V/cm. The greater the electric field intensity, the easier the thermal breakdown and the lower the energy consumption. The critical temperature of the oil shale thermal breakdown ranged from 93 to 102 °C. A higher initial temperature increases the difficulty of breakdown, which is inconsistent with the classical theory of a solid thermal breakdown. The main factor that affects the electrical conductivity of oil shale is the presence of water, which is also a necessary condition for the thermal breakdown of oil shale. There should be an optimal moisture content that minimizes both the breakdown time and energy consumption for oil shale’s thermal breakdown. The thermal breakdown of oil shale results from heat generation and dissipation. The electric field intensity only affects the heat generation process, whereas the initial temperature and moisture content impact both the heat generation and dissipation processes, and the impacts of moisture content are greater than those of the initial temperature.
1. Introduction
As an unconventional energy source rich in organic matter [1,2,3,4], oil shale has a great potential to become an alternative to conventional fossil fuel energy because of its abundant reserves worldwide [2,4,5,6,7,8]. There are two ways to exploit oil shale: the aboveground exploitation and the underground in-situ exploitation; the latter has become the key direction for future development and utilization due to its advantages of environmental friendliness and low cost [4,6,9,10].
High-voltage power frequency electric heating in-situ pyrolyzing (HVF) technology is a novel oil shale underground in-situ exploitation method. In general, HVF processing can be divided into three processes [11]: (1) breaking down oil shale with high-voltage power to form a conductive channel which converts oil shale from an insulator to a conductor; (2) heating oil shale with frequency power through the Joule heating effect of the conductive channel so that kerogen in oil shale is pyrolyzed and converted into oil and gas; (3) the heating and pyrolyzing area expands to the periphery, resulting in a large volume of pyrolysis. This process is shown in Figure 1.
A breakdown determines the implementability and efficiency of HVF, which represents an essential process requiring further investigation. HVF technology is derived from the mechanism of a solid dielectric breakdown, which can be classified into three types—electrical, thermal, and electrochemical breakdown [12,13,14,15]—according to the relationship between the electric field intensity and the electric field action time, as shown in Figure 2. (1) An electrical breakdown is a phenomenon where the dielectric is directly damaged and loses its insulation property due to the action of the electric field because the charged particles in the medium connect instantaneously after the energy accumulation [16,17]. The electric field intensity of the electrical breakdown is generally high, about 106–107 V/cm, for a very short time, generally 10−8 s [15]. There are many theories about electrical breakdowns, including the avalanche breakdown theory [18,19,20,21], the charge trap theory, the collision ionization breakdown theory, etc. [19]. (2) A thermal breakdown occurs at a relatively lower electric field intensity, which is insufficient to induce an electrical breakdown. When the heat generation caused by the dielectric loss is greater than the heat dissipation, the temperature of the dielectric will continuously rise, causing decomposition and carbonization of the dielectric and resulting in insulation failure [17,22,23,24]. Temperature is an important factor affecting a thermal breakdown, and increasing the temperature of the dielectric would reduce the breakdown field intensity, according to Wagner’s theory, which is a classical theory of thermal breakdown [25,26]. (3) An electrochemical breakdown refers to the irreversible deterioration of the dielectric chemical properties due to a partial discharge in the dielectric under the long-term action of a low electric field intensity, which gradually reduces the insulation performance and causes a breakdown [27,28,29].
Yang initially researched HVF, finding that oil shale could be broken down, and demonstrated the relationship between voltage, current, and electrode distance versus the breakdown time [11]. Li discovered that there was a specific critical breakdown temperature for oil shale under aerobic conditions, although no breakdown existed for oil shale in an anaerobic environment because the heat generation was always lower than the heat dissipation [30]. These studies focus on the impact of external factors without fully considering the impact of oil shale itself on a breakdown.
This study addressed this research gap by investigating a wide range of factors, including the electric field intensity, initial temperature, moisture content, and their combined effects on the breakdown characteristics of oil shale, to determine the overall breakdown mechanism. The findings will provide theoretical support for improvement in the breakdown efficiency of HVF technologies.
2. Materials and Methods
2.1. Apparatus and Materials
Figure 3 shows the HVF experimental platform, including an HVF regulator, a reactor, a vacuum pump, temperature sensors with a measurement accuracy of ±1 °C, a data recorder, graphite electrodes, oil shale samples, etc.
The HVF regulator could achieve 0–8000 V AC breakdown and 220 V AC power frequency electric heating; the reactor was equipped with electric heaters to maintain a specific environmental temperature; the shells of the temperature sensor were insulated with corundum armor; the data recorder was used to collect data from all sensors; and the electrodes were made of graphite with a melting point of up to 3850 ± 50 °C.
The oil shale samples were taken from the Huadian formation in the Huadian Basin of Jilin Province, China. The samples were fresh, intact, and close to in situ conditions, and each piece was not smaller than 20 cm × 15 cm × 10 cm, because a larger dimension would bring the experiment closer to the in-situ state of oil shale. Organic elements, Fischer assay analysis, compositions and mineral components of the samples are shown in Table 1, Table 2, Table 3 and Table 4, respectively.
2.2. Experimental Methods
2.2.1. Experimental Procedure
The experimental procedure consisted of the following processes:
- (1)
- Oil shale samples with different initial temperatures and moisture contents were prepared.
The samples were preheated to the specified initial temperatures by the reactor within a nitrogen environment, following the subsequent steps: the reactor was pumped to vacuum conditions, and nitrogen was injected into the reactor until it reached a normal pressure; the nitrogen was heated in the reactor with the electric heaters to heat the oil shale; then, the oil shale was heated to the required initial temperature at a heating rate of 50 °C/h for 6 h. The purpose of pre-heating was to verify whether the thermal breakdown of the oil shale conforms to Wagner’s theory, which states that increasing the initial temperature will reduce the electric field intensity of a thermal breakdown.
The original oil shale sample with a moisture content of 3.1% was desiccated at 300 °C for 10 h in a nitrogen environment in the reactor to obtain a dried oil shale sample with a moisture content of 0 when conducting the breakdown experiment with different moisture contents. Then, a vacuum water-saturated device was used to prepare the saturated oil shale samples by soaking them in a 0.8 MPa pressure environment for 24 h. As a result, the water-saturated oil shale sample obtained here had a moisture content of 5.8%.
- (2)
- Electrodes and temperature sensors were arranged in the oil shale samples.
The electrodes were arranged perpendicular to the direction of the oil shale bedding, and the distance between the electrodes and the edge of the oil shale was no less than 5 cm, with the electrode arrangement at a depth of 7 cm. The depth of 7 cm has several purposes: (i) to ensure a good contact between the graphite electrode and the oil shale; (ii) to make the breakdown occur inside the oil shale as much as possible, not at the edge, so that its temperature change is less affected by the external ambient temperature. One temperature sensor was arranged at the electrodes’ midpoint, and another, on the mid-perpendicular point of the two electrodes’ connection 5 cm away from the midpoint, as shown in Figure 4.
- (3)
- The sample was placed in the reactor, the electrodes were connected to the power supply, and the temperature sensors were connected to the data recorder.
- (4)
- The reactor was sealed and set to the designed gas environment.
- (5)
- The breakdown experiments were carried out. The HVF regulator was adjusted to the breakdown mode and the voltage was set to the initial value. If the current did not surge after applying the voltage for some time, and the temperature of the oil shale did not rise continuously, it was judged that the oil shale could not be broken down under this voltage; when the current increased sharply, the HVF regulator was switched to 220 V AC power frequency heating mode. If the oil shale could be heated continuously, it was judged that the oil shale was broken down; otherwise, it was not. At this time, the breakdown voltage was increased and the experiment was continued.
2.2.2. Experimental Parameters
The experimental parameter variations are described below.
- (1)
- Electric field intensity
Taking the electric field intensities of 10, 20, 30, 40, 50, 60, 70, 80, 90, 100, 140, 180, 200, 300, and 400 V/cm, the oil shale breakdown experiments were carried out with an electrode distance of 10 cm, an initial voltage of 100 V, an initial temperature of the oil shale of 21 °C, ambient temperature of 21 °C, and moisture content of the oil shale of 3.1%.
- (2)
- Initial temperature
Experiments were carried out based on the initial temperatures of 160 °C and 260 °C for the sample, where the electric field intensities were 10, 20, 30, 40, 50, 60, 70, 80, 90, 100, 140, 180, 200, 300, and 400 V/cm, the electrode distance was 10 cm, the initial voltage was 100 V, the ambient temperature was 21 °C, and the moisture content of the oil shale was 3.1%.
- (3)
- Moisture content
With moisture contents of 0%, 3.1%, and 5.8% as the parameters, the breakdown experiments were carried out where the electric field intensities were 70, 100, and 140 V/cm, the electrode distance was 10 cm, the initial voltage was 70 V, the initial temperature of oil shale was 21 °C, and the ambient temperature was 21 °C.
3. Results and Discussion
3.1. Effect of the Electric Field Intensity on the Oil Shale Breakdown
The effect of the electric field intensity on the oil shale breakdown was evaluated from the perspectives of temperature change, heat generation power, energy consumption, and breakdown time. Heat generation power refers to the electric power consumed by oil shale and is equal to the product of the voltage applied to the oil shale and the current through the oil shale. The energy consumption is the integral of the heat generation power over time, and can be calculated as follows:
where Q is the energy consumption, J; U is the voltage applied to the oil shale, V; I is the current through the oil shale, A; t is the time, s; and t0 is the breakdown time, s.
In the experiments where the electric field intensities were 10–60 V/cm, no breakdown or significant temperature change occurred in the oil shale, which will not be discussed in detail.
In the experiments with the electric field intensities of 70, 80, and 90 V/cm, no breakdown occurred, while the temperature showed a slow rise and then tended to be stable; the stable temperatures gradually increased with the increase in the electric field intensity and were 65, 81, and 82 °C, respectively, as shown in Figure 5. The heat generation power exhibited a rapid increase at first and then a slow decline; with the increase in electric field intensity, heat generation power gradually increased to 67, 89, and 138 W, respectively, as shown in Figure 6.
When the electric field intensities were 100, 140, and 180 V/cm, the breakdown of the oil shale occurred after some time; the time gradually shortened—269, 53 and 20 s, respectively, as shown in Figure 7. With the increase in the electric field intensity, the heating of the oil shale was gradually accelerated; in contrast, the energy consumption gradually decreased, with the values of 22,152, 16,475, and 8610 J, respectively, as shown in Figure 7. The temperatures of the oil shale breakdown were 102, 95, and 93 °C, respectively, as shown in Figure 5.
As shown in Figure 6, in the experiment where the electric field intensity was 100 V/cm, the heat generation power increased rapidly to approximately 100 W, then decreased slowly and surged to about 950 W before breakdown. In the experiments with an electric field intensity of 140 V/cm, the heat generation power rose rapidly and surged to about 1520 W before breakdown. When the electric field intensity reached 180 V/cm, the heat generation power increased more rapidly and surged to approximately 1505 W before breakdown. With the increase in the electric field intensity, the oil shale heated up faster and the heat generation power increased because a higher electric field intensity would generate a higher current in the oil shale.
For all of the electric field intensity experiments, the heat generation power increased rapidly in the first 60 s, and then decreased. The increase is due to the increase in temperature, the activity of the conductive ions in water increases, and the conductivity increases. The reason for the decrease is that with the increase in temperature, water evaporation decreases, and the conductivity of the oil shale is reduced when the moisture content decreases to a certain level.
In the experiments with electric field intensities of 200, 300, and 400 V/cm, the oil shale samples were broken down instantaneously with no temperature change, indicating that the breakdown should be electrical. Thus, we could conclude that the critical electric field intensity of the thermal breakdown for oil shale is between 100 and 180 V/cm.
When the electric field intensity increased, the breakdown time decreased, finally approaching 0, meaning that the breakdown would occur instantaneously when the electric field intensity is large enough. The main reason for the decreased breakdown time is that with the rise of the electric field intensity, the Joule heat effect of the oil shale conductive channel increases, generating more heat and causing the oil shale to rise faster to the critical temperature for the breakdown.
As the electric field intensity rises, the energy consumption decreases because the higher heat generation power caused by the higher electric field intensity leads to a smaller and more concentrated heating area.
3.2. Effect of the Initial Temperature on the Oil Shale Breakdown
When the initial temperatures were 160 and 260 °C and the electric field intensities were 10–400 V/cm, no significant current or temperature changes were detected, showing that breakdown could not be realized. The resistance of the oil shale was still more than 40 MΩ after the experiments.
During the temperature rise process, the composition of the oil shale changes, affecting its macroscopic and microscopic characteristics, physical and chemical structures, and then its electrophysical and thermophysical properties.
The critical electric field intensity of the general materials’ thermal breakdown decreases with the temperature increase [25,31]; however, no thermal breakdown or significant current occurred when the initial temperature rose to 160 or 260 °C, and the temperature showed a downward trend and the decline was faster when the initial temperature was 260 °C, as shown in Figure 8. The main reasons are as follows: (1) Compared with the initial temperature of 21 °C, when the initial temperatures are 160 and 260 °C, free water evaporates from the oil shale, the dissolved mineral ions decrease, the electric conductivity decreases, the dielectric constant of the oil shale decreases, and the heat generation power decreases significantly. (2) When the temperature rises, the specific heat capacity of the oil shale decreases, the thermal conductivity increases, and the temperature difference with the environment increases, so the heat dissipation power of the oil shale increases. At this time, the heat generation power is less than the heat dissipation power; thus, the internal temperature of the oil shale cannot rise. (3) When the initial temperature increases from 160 to 260 °C, the small molecular free hydrocarbons in the pores of the oil shale are released, usually saturated hydrocarbons such as methane and ethane, of which the presence reduces the electrical conductivity of the oil shale and increases the thermal conductivity of the oil shale. So, the contents of the hydrocarbon elements are reduced, the porosity increases, the electrical conductivity improves, and the thermal conductivity reduces. However, the temperature differences with the environment increase, which increase the heat dissipation of the oil shale, and finally lead to an increased temperature drop.
When the initial temperature was 21 °C, the temperature of the thermal breakdown of the oil shale was 93–102 °C, which has limited impacts on the oil shale’s physical and chemical composition and properties. Consequently, the thermal breakdown is due to the joint action of the temperature and the electric field intensity.
3.3. Effect of the Moisture Content on the Oil Shale Breakdown
Compared with the experiment where the initial temperature was 21 °C, when the initial temperature was 160 and 260 °C, the maximum variable of the oil shale was the moisture content, which significantly impacted the breakdown. Hence, the impacts of the moisture content on the oil shale breakdown should be studied.
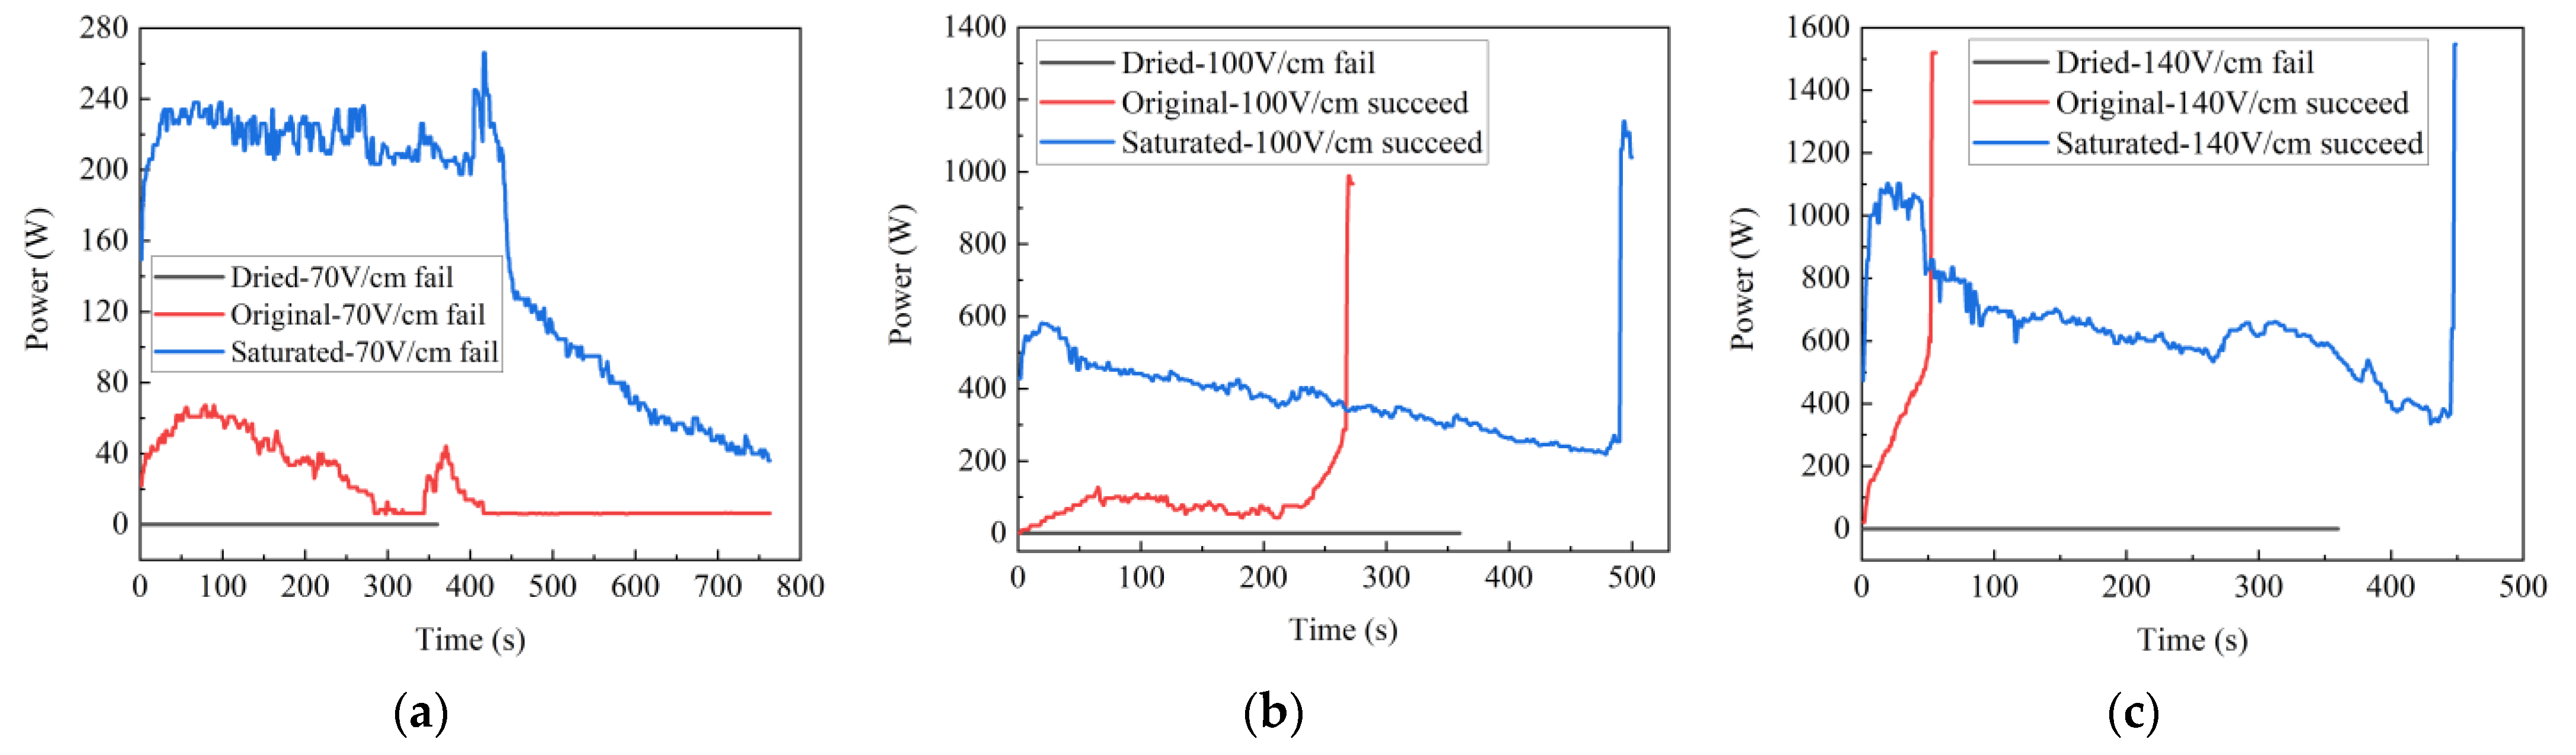
With an electric field intensity of 70 V/cm, the oil shale with all three kinds of moisture content showed no breakdown. The temperature of the dried sample exhibited no change, and the heating trend of the original and saturated samples was the same: both rose rapidly at first and then tended to be stable. The saturated sample’s temperature was always higher than that of the original sample, and the peak temperatures were 111 and 65 °C, respectively, as shown in Figure 9a. The heat generation power of the saturated and original samples showed a downward trend. First, the heat generation power rose slightly at the initial stage, declined slowly, and then showed a small peak, but finally approached 0. The heat generation power of the saturated sample was consistently greater than that of the original sample; the average values of the heat generation power of the saturated and original samples in the initial flat section were about 220 and 45 W, and the values of peak heat generation power were 266 and 68 W, respectively, as shown in Figure 10a.
The dried samples failed to break down with the electric field intensity of 100 V/cm, whereas the original samples and saturated samples did. The breakdown time was 269 and 490 s, respectively; the corresponding breakdown temperatures were 102 and 150 °C. The dried sample’s temperature did not change, and the saturated sample’s temperature was consistently higher than that of the original sample. The temperature increases in both the original and the saturated samples showed a steady upward trend, as shown in Figure 9b. The heat generation power of the original and the saturated samples s displayed a trend of a slight increase in the beginning, then declined, and eventually surged. The surge occurred before the breakdown, and the heat generation power values of the water-saturated and original samples were close, at 950 and 1089 W, respectively, as shown in Figure 10b.
The dried samples did not break down with an electric field intensity of 140 V/cm, but the original and saturated samples did; the breakdown time of the original and saturated samples was 53 and 448 s, and the corresponding breakdown temperatures were 95 and 176 °C, respectively. The temperature of the dried sample showed no change, and the temperature of the saturated sample was consistently higher than the original sample before it reached 95 °C. When the temperature rose to 95 °C, the original sample broke down, its heating rate increased sharply, and then its temperature exceeded the saturated sample temperature, as shown in Figure 9c. The heat generation power of the saturated samples decreased slowly and then increased sharply; the original sample’s heat generation power increased rapidly at first and then surged. At the moment of breakdown, the heat generation power of the original and saturated samples surged, with values of 1520 and 1547 W, respectively, as shown in Figure 10c.
In conclusion, comparing the breakdown experiments of the dried, original, and saturated samples with the same electric field intensity, it can be seen that water comprehensively impacts the breakdown of oil shale.
As shown in Figure 10a–c, with the different electric field intensities, the heat generation power of the original and water-saturated samples showed a rapidly increasing trend in the first 60 and 30 s, respectively. The water-saturated sample has a higher moisture content and a better conductivity; therefore, the heat generation power increases more rapidly, making water evaporate earlier, and eventually, the heat generation power peaks sooner. As the temperature rises and the water evaporates continuously, the conductivity of oil shale declines, and the heat generation power decreases steadily.
Figure 10a–c indicate that in the experiments with different moisture contents and the electric field intensities of 70, 100, and 140 V/cm, there was an instantaneous surge in the heat generation power of the original and saturated samples. When the electric field intensity was 70 V/cm, the heat generation power decreased rapidly after the surge, and the sample was not broken down. However, when the electric field intensities were 100 V/cm and 140 V/cm, the heat generation power surged, and the samples were broken down. It can be seen that the water in the pores of the oil shale continues to heat up, and when the temperature reaches the boiling point of water, the gaseous water fills the pores. Under the effect of the electric field, the gaseous water is broken down instantly, and the current increases rapidly, accompanied by the rapid decrease in the moisture content of the oil shale. When the electric field intensity is 70 V/cm, the temperature in the conductive channel increases because of the increased current but causes no irreversible physical or chemical changes in the oil shale. When the heating continues, the moisture content and heat generation power decrease, resulting in no breakdown. When the electric field intensities are 100 and 140 V/cm, the current instantaneously increases exponentially, resulting in the temperature of the conductive channel rising to the temperature where oil shale undergoes irreversible physical and chemical changes, making the internal current in the oil shale continue and breakdown occur.
It can be seen from Figure 10a–c that the overall trend in original oil shale’s heat generation power under the electric field intensity of 140 V/cm differed from other experiments because the electric field intensity was high enough that the conductive channel temperature rose rapidly and the oil shale reached the critical breakdown temperature before the negative effect of the water evaporation occurred.
Prior to the breakdown, the heat generation power of the saturated sample was consistently greater than that of the original sample, as shown in Figure 10b,c. The breakdown time is longer for the saturated sample than for the original sample because the heat loss is much larger than the original sample due to more water evaporation.
Both the maximum temperature without breakdown and the critical temperature of the breakdown for the water-saturated sample are higher than that of the original sample because the evaporation process of water transfers heat to the oil shale around the conductive channel in the form of convection. The water’s impacts on the water-saturated sample are more significant than that of the original sample, resulting in a larger heating volume of the water-saturated sample. The temperature of the original sample is relatively more concentrated, leading to an early breakdown of the original oil shale.
Compared with the original and water-saturated samples, the dried samples could not be broken down even under 400 V/cm, indicating that water is the main factor for the oil shale’s conductivity and a necessary condition for breakdown.
With the same electric field intensity, in terms of breakdown time and energy consumption, an insufficient moisture content would lead to a longer breakdown time and more heat dissipation, increasing the breakdown energy consumption; the excess moisture content would also lead to a longer breakdown time, making water evaporation take away more heat and eventually causing more energy consumption. Therefore, there should be an optimal moisture content that minimizes both the breakdown time and energy consumption.
4. Conclusions
This study explored the impacts of the comprehensive factors on the oil shale breakdown characteristics and mechanisms through laboratory experiments. According to the research results, the following conclusions can be drawn:
- (1)
- Under the same experimental conditions, the thermal breakdown occurred when the electric field intensity was between 100 and 180 V/cm. The greater the electric field intensity, the easier the thermal breakdown and the lower the energy consumption. The critical thermal breakdown temperatures of the oil shale were between 93 and 102 °C.
- (2)
- A higher initial temperature increases the difficulty of breakdown, which is inconsistent with the classical theory of the solid thermal breakdown because increasing the initial temperature leads to a reduction in water in the oil shale, which significantly affects the electrophysical properties of the oil shale. When the temperature rises, the oil shale’s components change, affecting its macro and micro physical and chemical structures and altering its electrophysical and thermophysical properties.
- (3)
- The main factor that affects the electrical conductivity of the oil shale is the existence of water, which is also a necessary condition for the oil shale’s thermal breakdown. In addition, there should be an optimal moisture content to minimize both the breakdown time and the energy consumption.
- (4)
- The thermal breakdown of the oil shale results from the heat generation and dissipation, which are affected by many factors. The electric field intensity only affects the heat generation process, whereas the initial temperature and the moisture content impact both the heat generation and dissipation processes, and the impacts of the moisture content are more significant than that of the initial temperature.
Author Contributions
Conceptualization, S.L. and Q.L.; Investigation, S.L.; Methodology, Y.S., Q.L. and S.L.; Writing—original draft, S.L., Q.L. and X.L. All authors have read and agreed to the published version of the manuscript.
Funding
This work was supported by the National Key R&D Program of China (Grant No. 2019YFA0705502, Grant No. 2019YFA0705501), the Young and Middle-aged Excellent Team Project for Scientific and Technological Innovation of Jilin Province of China (Grant No. 20220508135RC), the Independent Innovation Capacity Project of Jilin Province Development and Reform Commission (Grant No. 2022C021) the Program for JLU Science and Technology Innovative Research Team (Grant No. 2020TD-05), the National Natural Science Foundation of China (Grant No. 41972324), the Academy of Finland (STARCLUB, Grant No. 324023), and the Fundamental Research Funds for the Central Universities.
Conflicts of Interest
The authors declare no conflict of interest.
References
- Han, X.; Kulaots, I.; Jiang, X.; Suuberg, E.M. Review of oil shale semicoke and its combustion utilization. Fuel 2014, 126, 143–161. [Google Scholar] [CrossRef]
- Taheri-Shakib, J.; Kantzas, A. A comprehensive review of microwave application on the oil shale: Prospects for shale oil production. Fuel 2021, 305, 121519. [Google Scholar] [CrossRef]
- Liu, Z.; Meng, Q.; Dong, Q.; Zhu, J.; Guo, W.; Ye, S.; Liu, R.; Jia, J. Characteristics and Resource Potential of Oil Shale in China. Oil Shale 2017, 34, 15–41. [Google Scholar] [CrossRef]
- Kang, Z.; Zhao, Y.; Yang, D. Review of oil shale in-situ conversion technology. Appl. Energy 2020, 269, 115121. [Google Scholar] [CrossRef]
- Dyni, J.R. Geology and resources of some world oil-shale deposits. Oil Shale 2003, 20, 193–252. [Google Scholar]
- Liu, R.; Liu, Z. Oil shale resource situation and multi-purpose development potential in China and abroad. J. Jilin Univ. 2006, 36, 892–898. [Google Scholar]
- Huang, X.; Yang, D.; Kang, Z. Study on the Pore and Fracture Connectivity Characteristics of Oil Shale Pyrolyzed by Superheated Steam. Energies 2020, 13, 5716. [Google Scholar] [CrossRef]
- Al Asfar, J.J.; AlShwawra, A.; Sakhrieh, A.; Hamdan, M.A. Combustion characteristics of solid waste biomass, oil shale, and coal. Energy Sources Part A: Recovery Util. Environ. Eff. 2018, 40, 335–342. [Google Scholar] [CrossRef]
- Al Asfar, J.J.; Hammad, A.; Sakhrieh, A.; Hamdan, M.A. Two-dimensional numerical modeling of combustion of Jordanian oil shale. Energy Sources Part A: Recovery Util. Environ. Eff. 2016, 38, 1189–1196. [Google Scholar] [CrossRef]
- He, W.; Sun, Y.; Shan, X. Organic matter evolution in pyrolysis experiments of oil shale under high pressure: Guidance for in situ conversion of oil shale in the Songliao Basin. J. Anal. Appl. Pyrolysis 2021, 155, 105091. [Google Scholar] [CrossRef]
- Yang, Y. Theoretical and Experimental Research of Oil Shale In-Situ Pyrolysis by High Voltage-Power Frequency Electrical Heating Method. Ph.D. Thesis, Jilin University, Changchun, China, 2014. [Google Scholar]
- Yan, F.; Lin, B.; Zhu, C.; Zhou, Y.; Liu, X.; Guo, C.; Zou, Q. Experimental investigation on anthracite coal fragmentation by high-voltage electrical pulses in the air condition: Effect of breakdown voltage. Fuel 2016, 183, 583–592. [Google Scholar] [CrossRef]
- Zhang, J.; Wang, F.; Li, J.; Ran, H.; Li, X.; Fu, Q. Breakdown Voltage and Its Influencing Factors of Thermally Aged Oil-Impregnated Paper at Pulsating DC Voltage. Energies 2017, 10, 1411. [Google Scholar] [CrossRef] [Green Version]
- Wang, W.W.; Li, S.T. Research status and development of insulation breakdown in engineering solid dielectrics. Chin. Sci. Bull.-Chin. 2020, 65, 3461–3474. [Google Scholar] [CrossRef]
- Danikas, M.G.; Vardakis, G.E.; Sarathi, R. Some Factors Affecting the Breakdown Strength of Solid Dielectrics: A Short Review. Eng. Technol. Appl. Sci. Res. 2020, 10, 5505–5511. [Google Scholar] [CrossRef]
- Frohlich, H. Dielectric properties of dipolar solids. Proc. R. Soc. London. Ser. A Math. Phys. Sci. 1946, 185, 399–414. [Google Scholar]
- Michaels, J.A.; Wood, D.R.; Froeter, P.J.; Huang, W.; Sievers, D.J.; Li, X.L. Effect of Perforation on the Thermal and Electrical Breakdown of Self-Rolled-Up Nanomembrane Structures. Adv Mater Interfaces 2019, 6, 1901022. [Google Scholar] [CrossRef]
- O’dwyer, J. The theory of avalanche breakdown in solid dielectrics. J. Phys. Chem. Solids 1967, 28, 1137–1144. [Google Scholar] [CrossRef]
- Kao, K.C. New theory of electrical discharge and breakdown in low-mobility condensed insulators. J. Appl. Phys. 1984, 55, 752–755. [Google Scholar] [CrossRef]
- Hippel, A.v. Elektrische Festigkeit und Kristallbau. Z. Für Phys. 1932, 75, 145–170. [Google Scholar] [CrossRef]
- Saffian, H.A.; Talib, M.A.; Lee, S.H.; Tahir, P.M.; Lee, C.H.; Ariffin, H.; Asa’ari, A.Z.M. Mechanical Strength, Thermal Conductivity and Electrical Breakdown of Kenaf Core Fiber/Lignin/Polypropylene Biocomposite. Polymers 2020, 12, 1833. [Google Scholar]
- Dissado, L.A.; Fothergill, J.C. Electrical Degradation and Breakdown in Polymers; IET: London, UK, 1992; Volume 9. [Google Scholar]
- Christensen, L.R.; Hassager, O.; Skov, A.L. Electro-Thermal model of thermal breakdown in multilayered dielectric elastomers. Aiche J. 2019, 65, 859–864. [Google Scholar]
- Zhang, C.B.; Yan, T.; Yang, Z.Q.; Ren, W.T.; Zhu, Z.P. A 3-D Theoretical Model of Thermal Breakdown in Semiconductor Devices Under Multiple Pulses. IEEE T Plasma Sci. 2019, 47, 5180–5185. [Google Scholar] [CrossRef]
- Christensen, L.R.; Hassager, O.; Skov, A.L. Electro-thermal and -mechanical model of thermal breakdown in multilayered dielectric elastomers. Aiche J. 2020, 66, 859–864. [Google Scholar] [CrossRef]
- Wagner, K.W. The physical nature of the electrical breakdown of solid dielectrics. J. Am. Inst. Electr. Eng. 1922, 41, 1034–1044. [Google Scholar] [CrossRef]
- Mon, G.R.; Orehotsky, J.; Ross, R.; Whitla, G. Predicting Electrochemical Breakdown in Terrestrial Photovoltaic Modules. In Proceedings of the 17th IEEE Photovoltaic Specialists Conference, Kissimmee, FL, USA, 1–4 May 1984; pp. 682–692. [Google Scholar]
- Chung, N.X.; Gatty, H.K.; Lu, X.; Zhang, M.; Linnros, J. Optimized electrochemical breakdown etching using temporal voltage variation for formation of nanopores in a silicon membrane. Sens. Actuators B Chem. 2021, 331, 129323. [Google Scholar] [CrossRef]
- Liu, L.; Chen, H.L.; Li, B.; Wang, Y.J.; Li, D.C. Thermal and strain-stiffening effects on the electromechanical breakdown strength of dielectric elastomers. Appl. Phys. Lett. 2015, 107, 5. [Google Scholar] [CrossRef]
- Jiasheng, L. Experimental Study on Resistance and Electrode Materials with Oil Shale In-situ Pyrolysis by High Voltage-Power Frequency Electric Heating. Master’s Thesis, Jilin University, Changchun, China, 2014. [Google Scholar]
- Ran, H.H.; Li, J.; Zhang, J.; Li, X.D.; Chen, J.S. Influence of Temperature and Thermal Aging on Breakdown Voltage of Oil-paper Insulation. In Proceedings of the IEEE International Conference on High Voltage Engineering and Application (ICHVE), Chengdu, China, 19–22 September 2016. [Google Scholar]
Figure 1.
Schematic diagram of high-voltage power frequency electric heating in-situ pyrolyzing (HVF) processes for oil shale.
Figure 1.
Schematic diagram of high-voltage power frequency electric heating in-situ pyrolyzing (HVF) processes for oil shale.

Figure 2.
Relationship between the electric field intensity and the action time related to the breakdown types.
Figure 2.
Relationship between the electric field intensity and the action time related to the breakdown types.
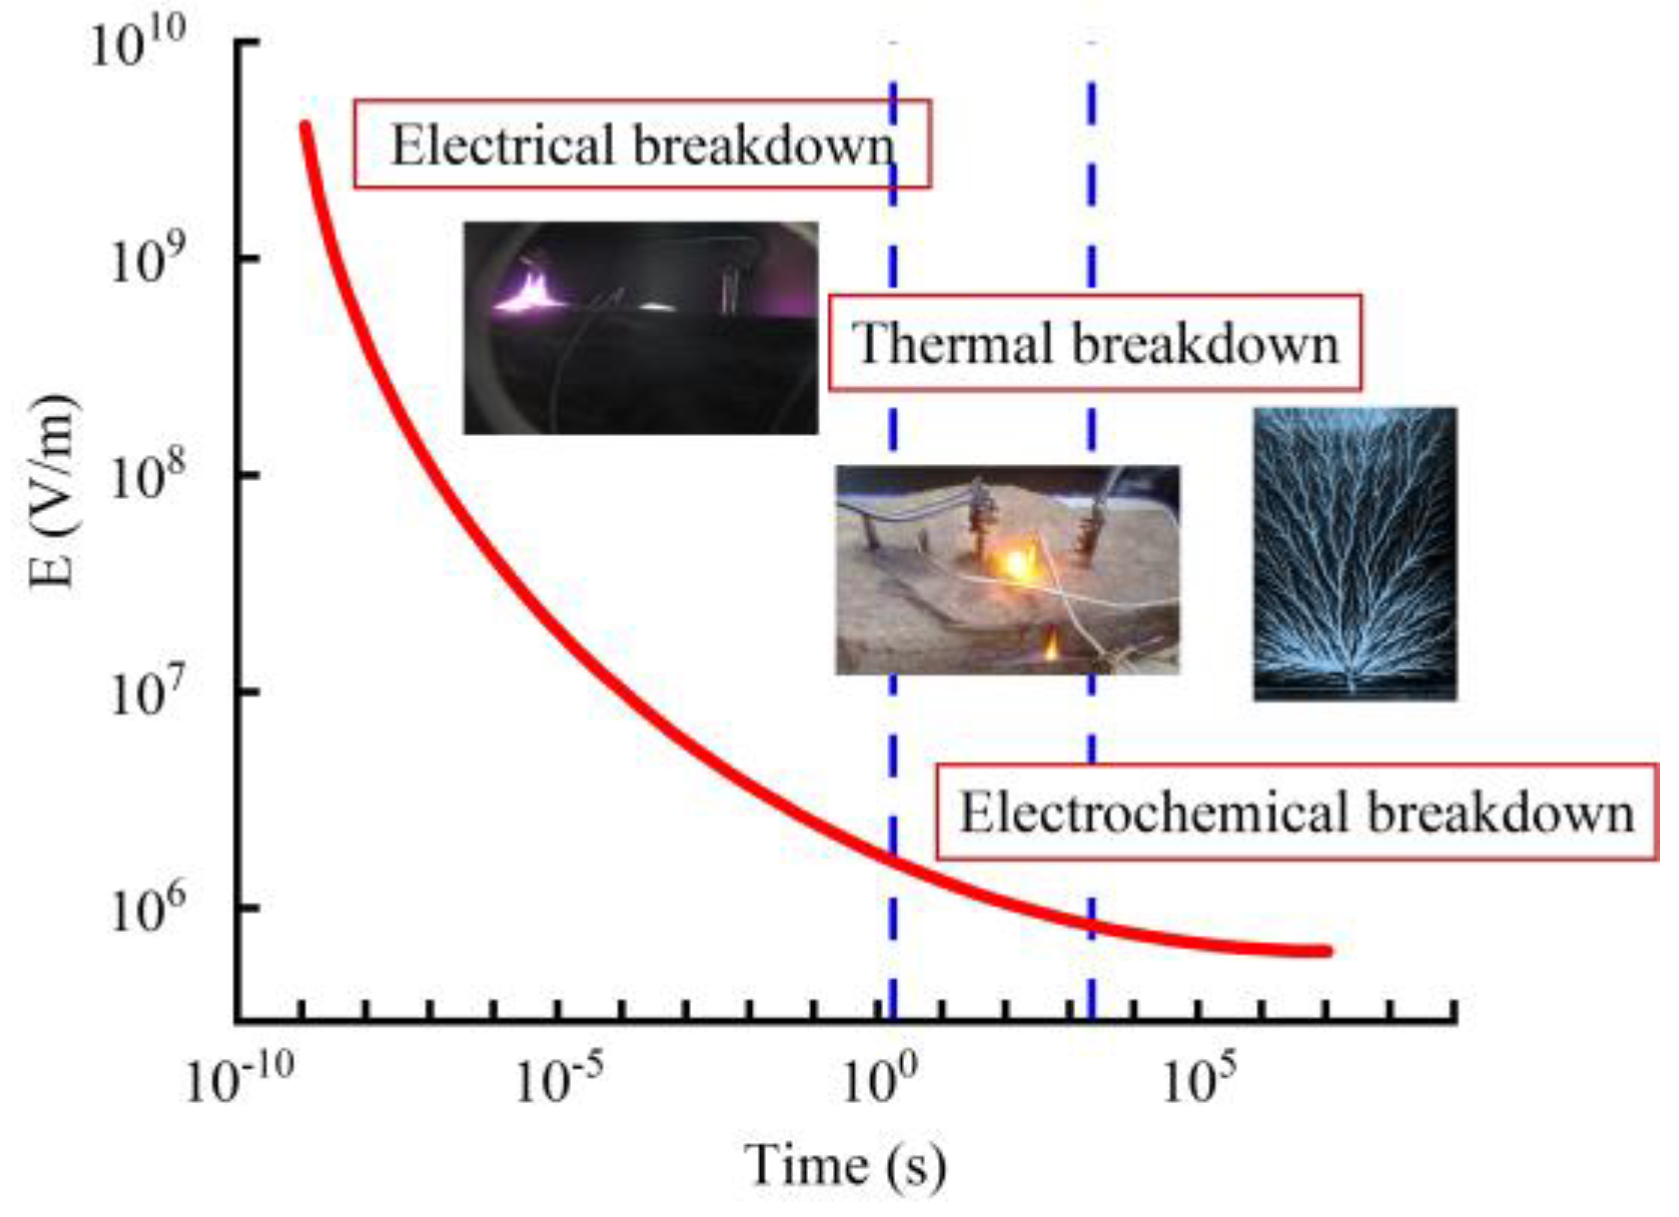
Figure 3.
Schematic diagram of the HVF experimental platform.
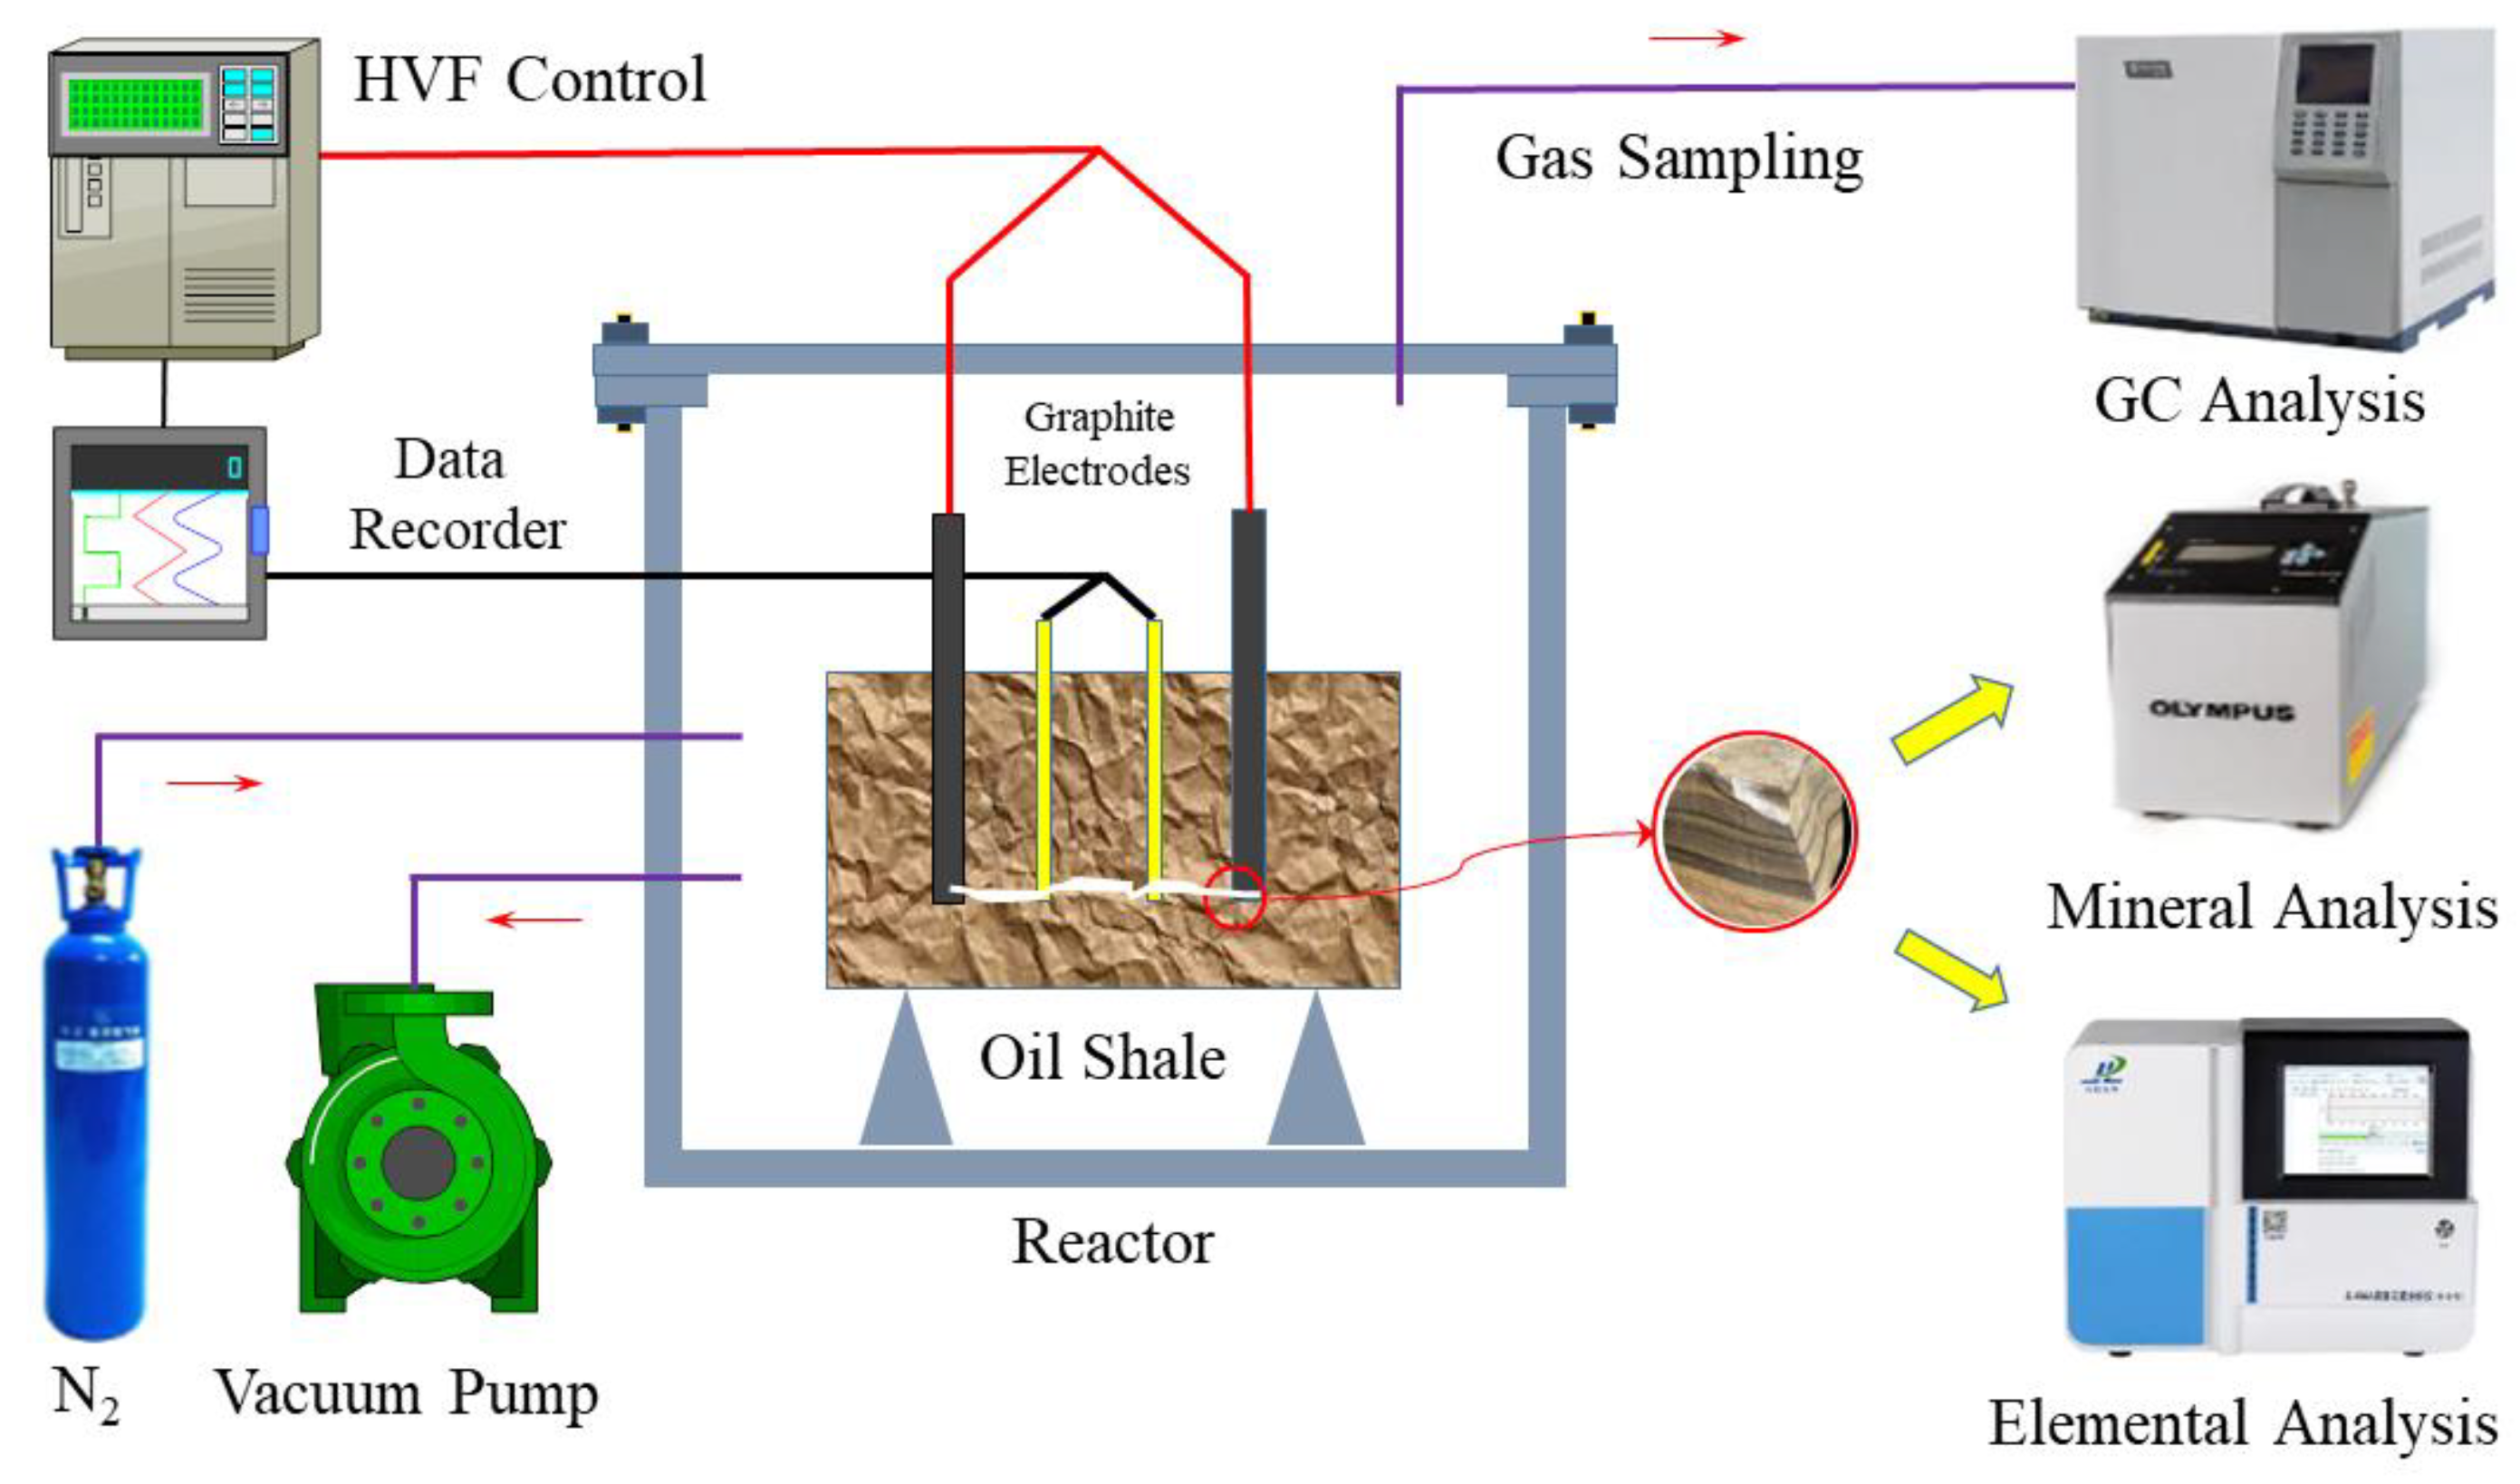
Figure 4.
Arrangement of the electrodes and the temperature sensors in an oil shale sample.
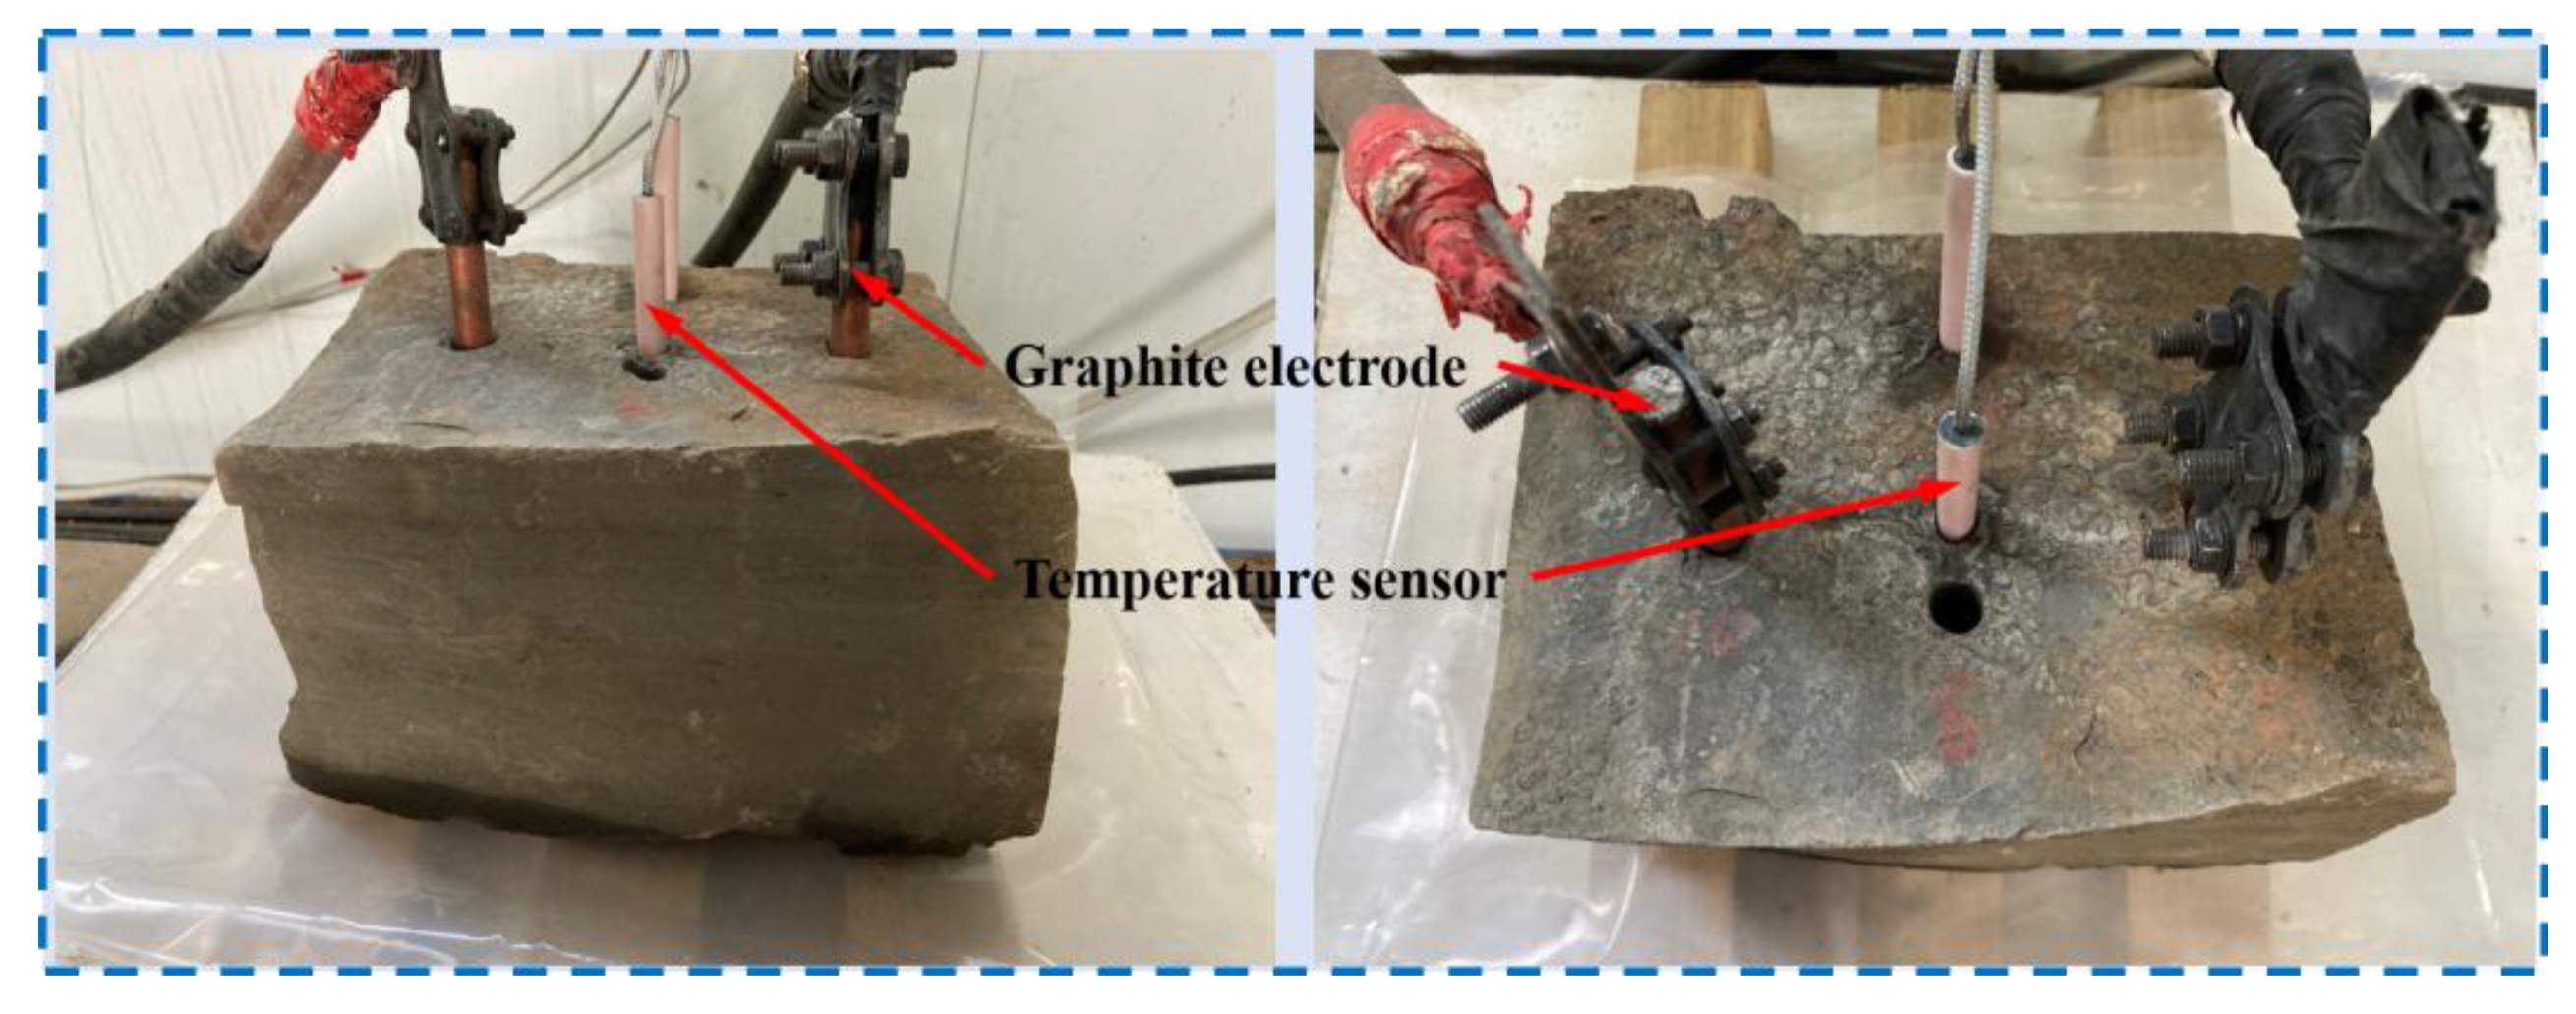
Figure 5.
Temperature changes of the oil shale with time under different electric field intensities.
Figure 5.
Temperature changes of the oil shale with time under different electric field intensities.
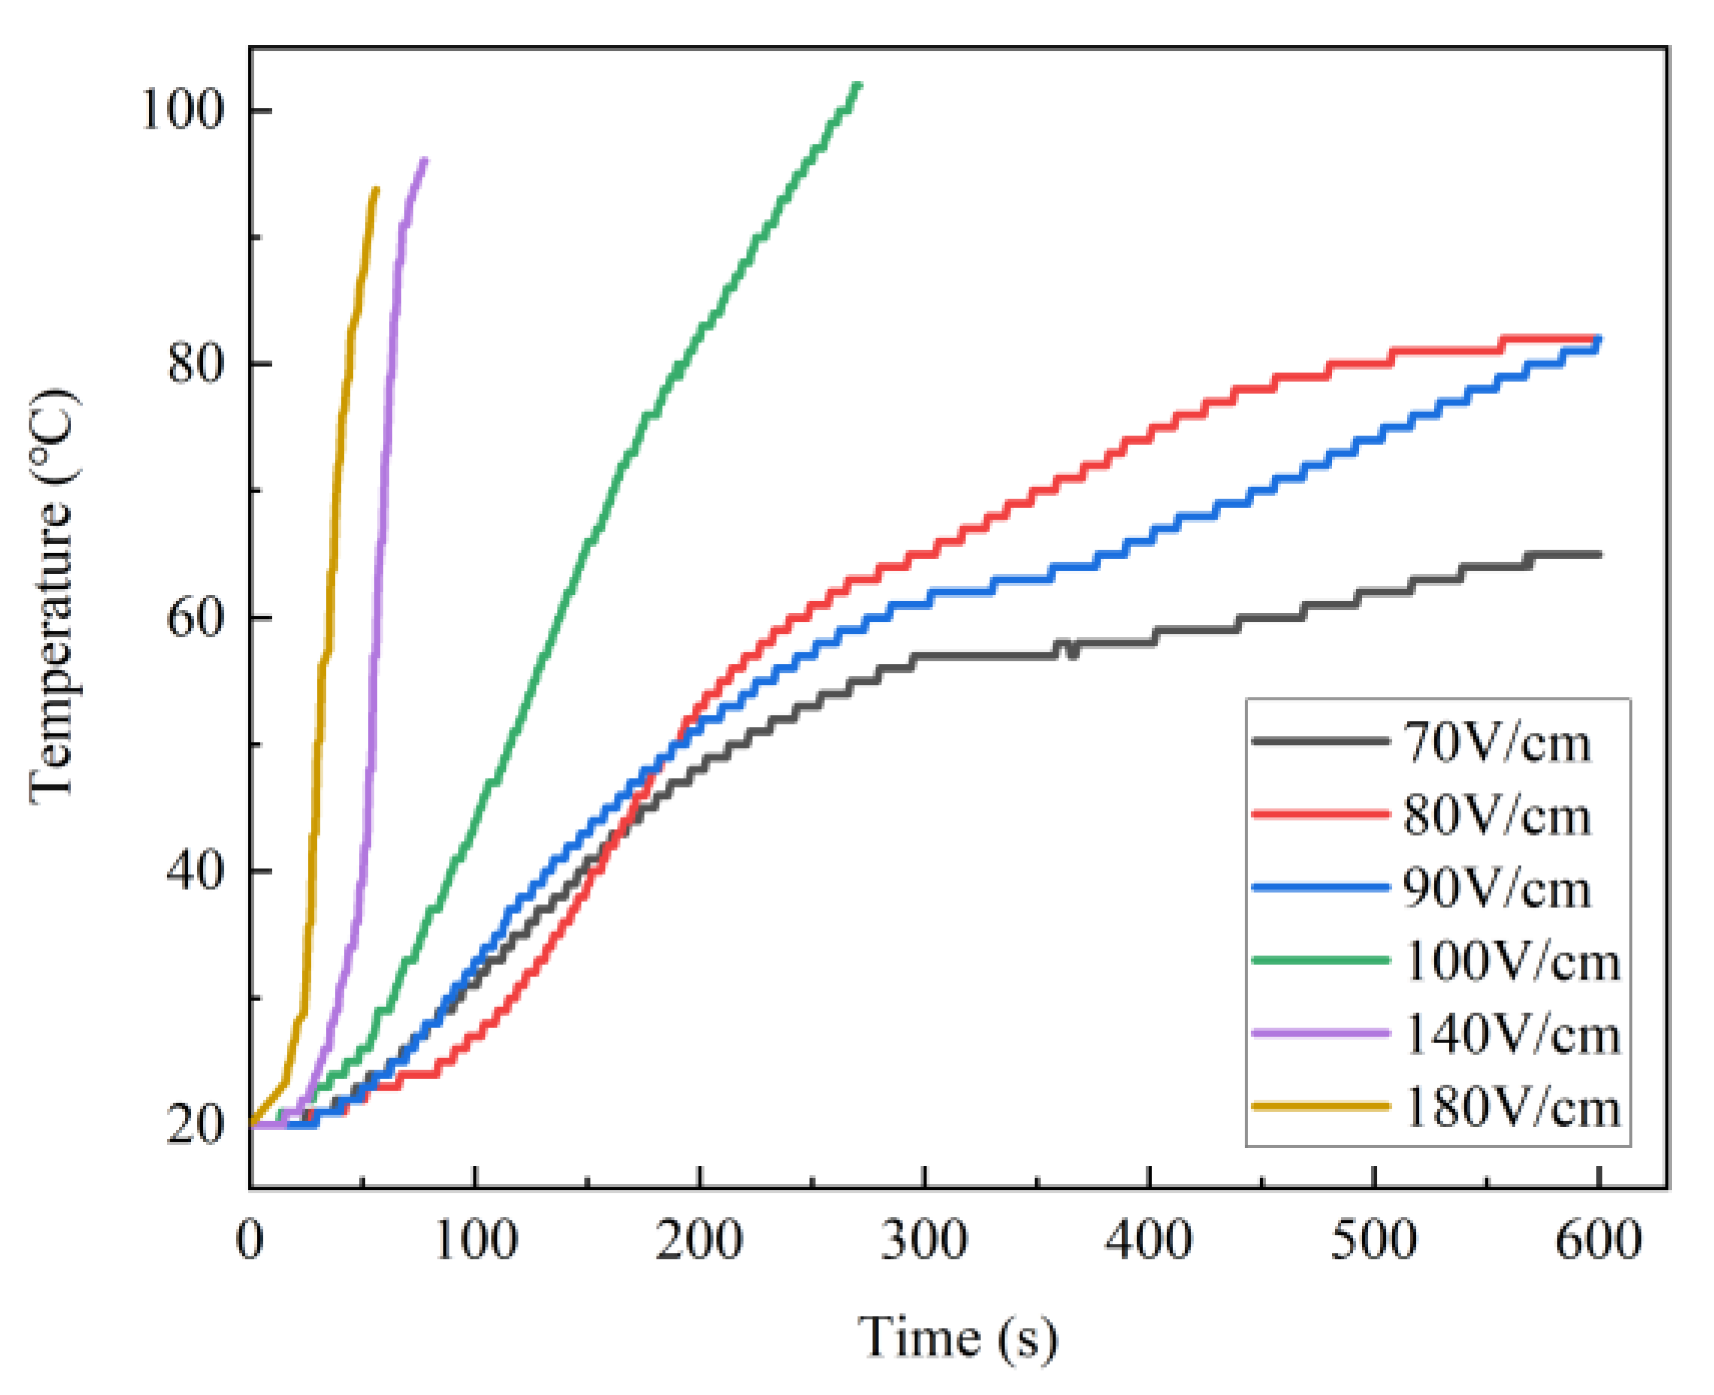
Figure 6.
Variation in heat generation power with time under different electric field intensities.
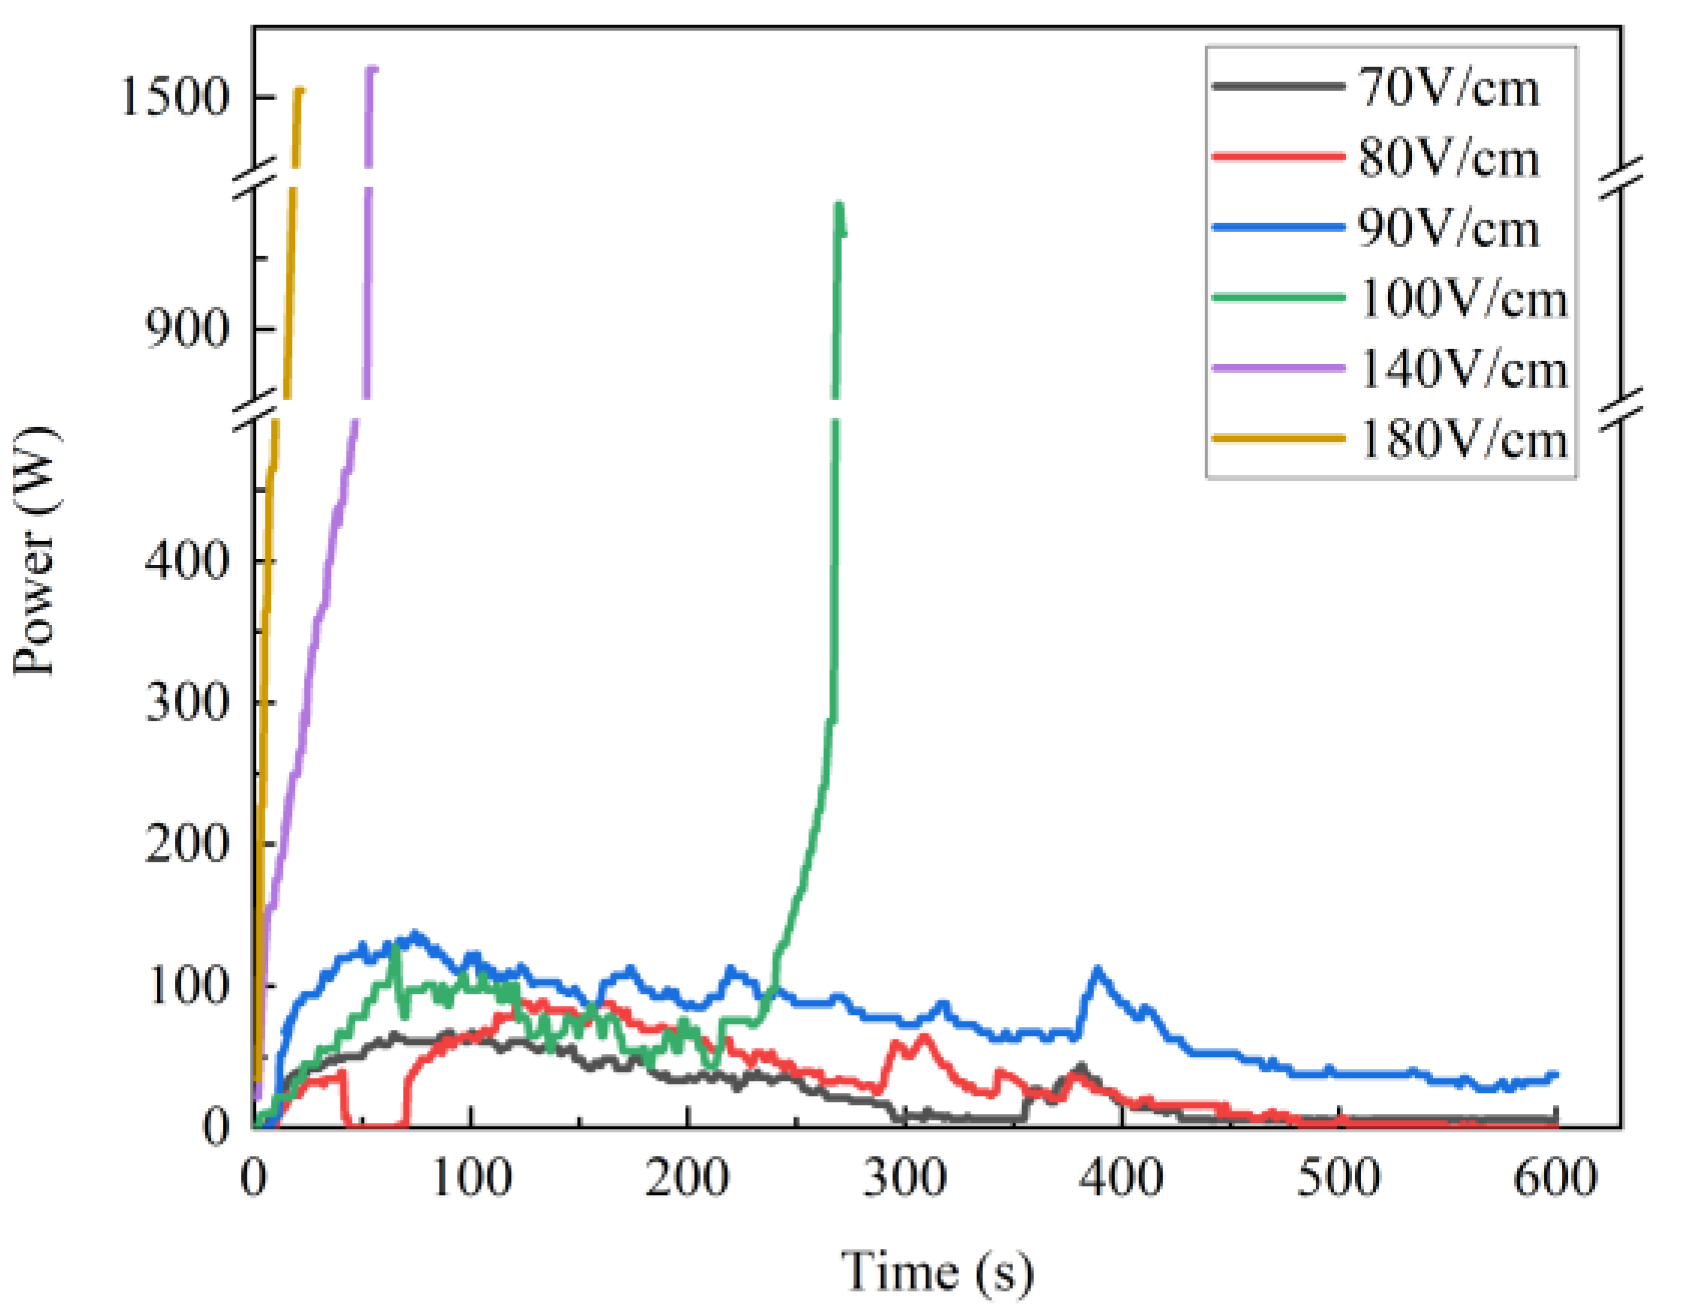
Figure 7.
Changes in the breakdown time and energy consumption with different electric field intensities.
Figure 7.
Changes in the breakdown time and energy consumption with different electric field intensities.
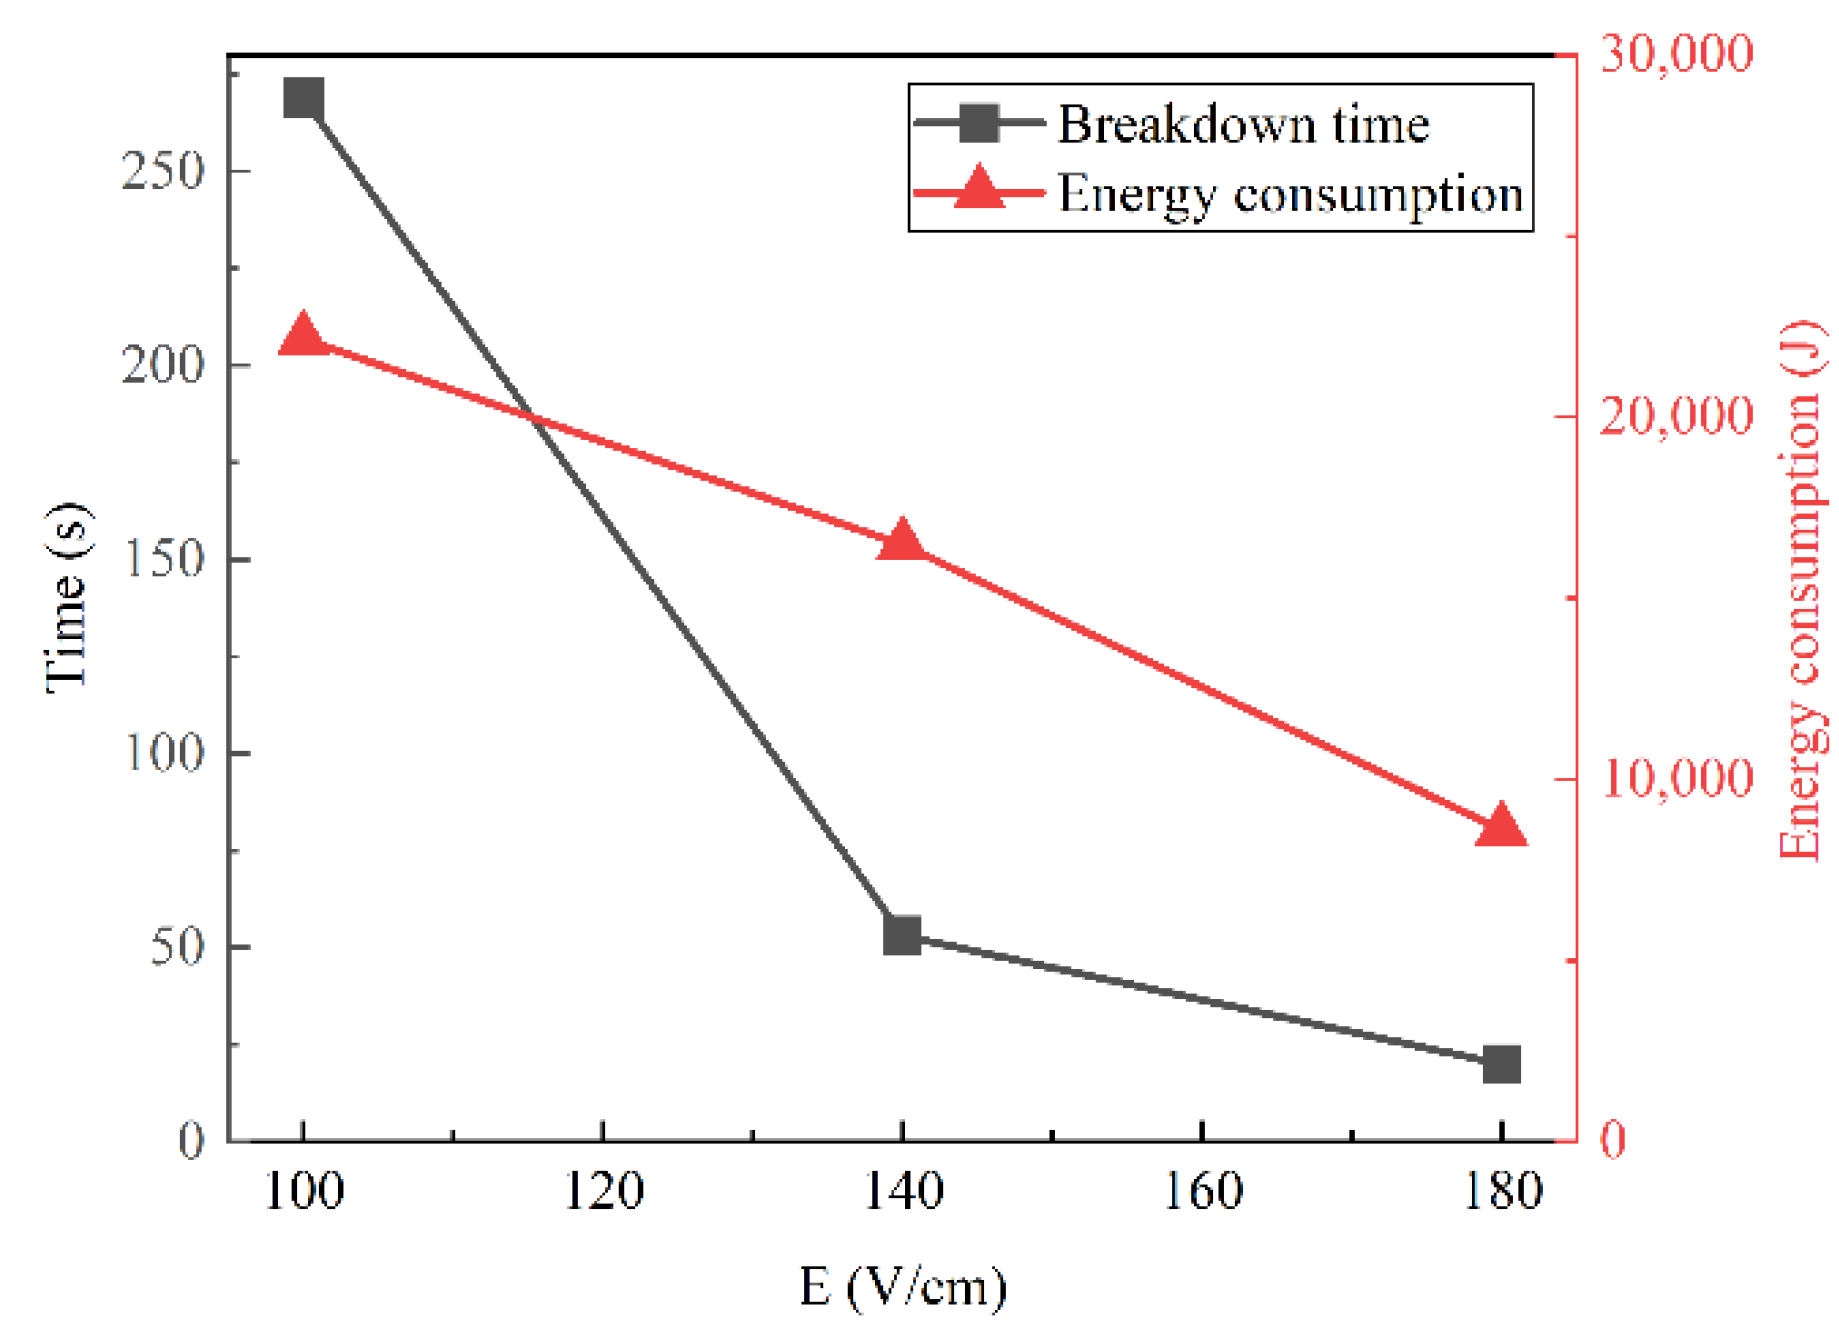
Figure 8.
Oil shale temperature changes with the initial temperatures of 160 °C and 260 °C.
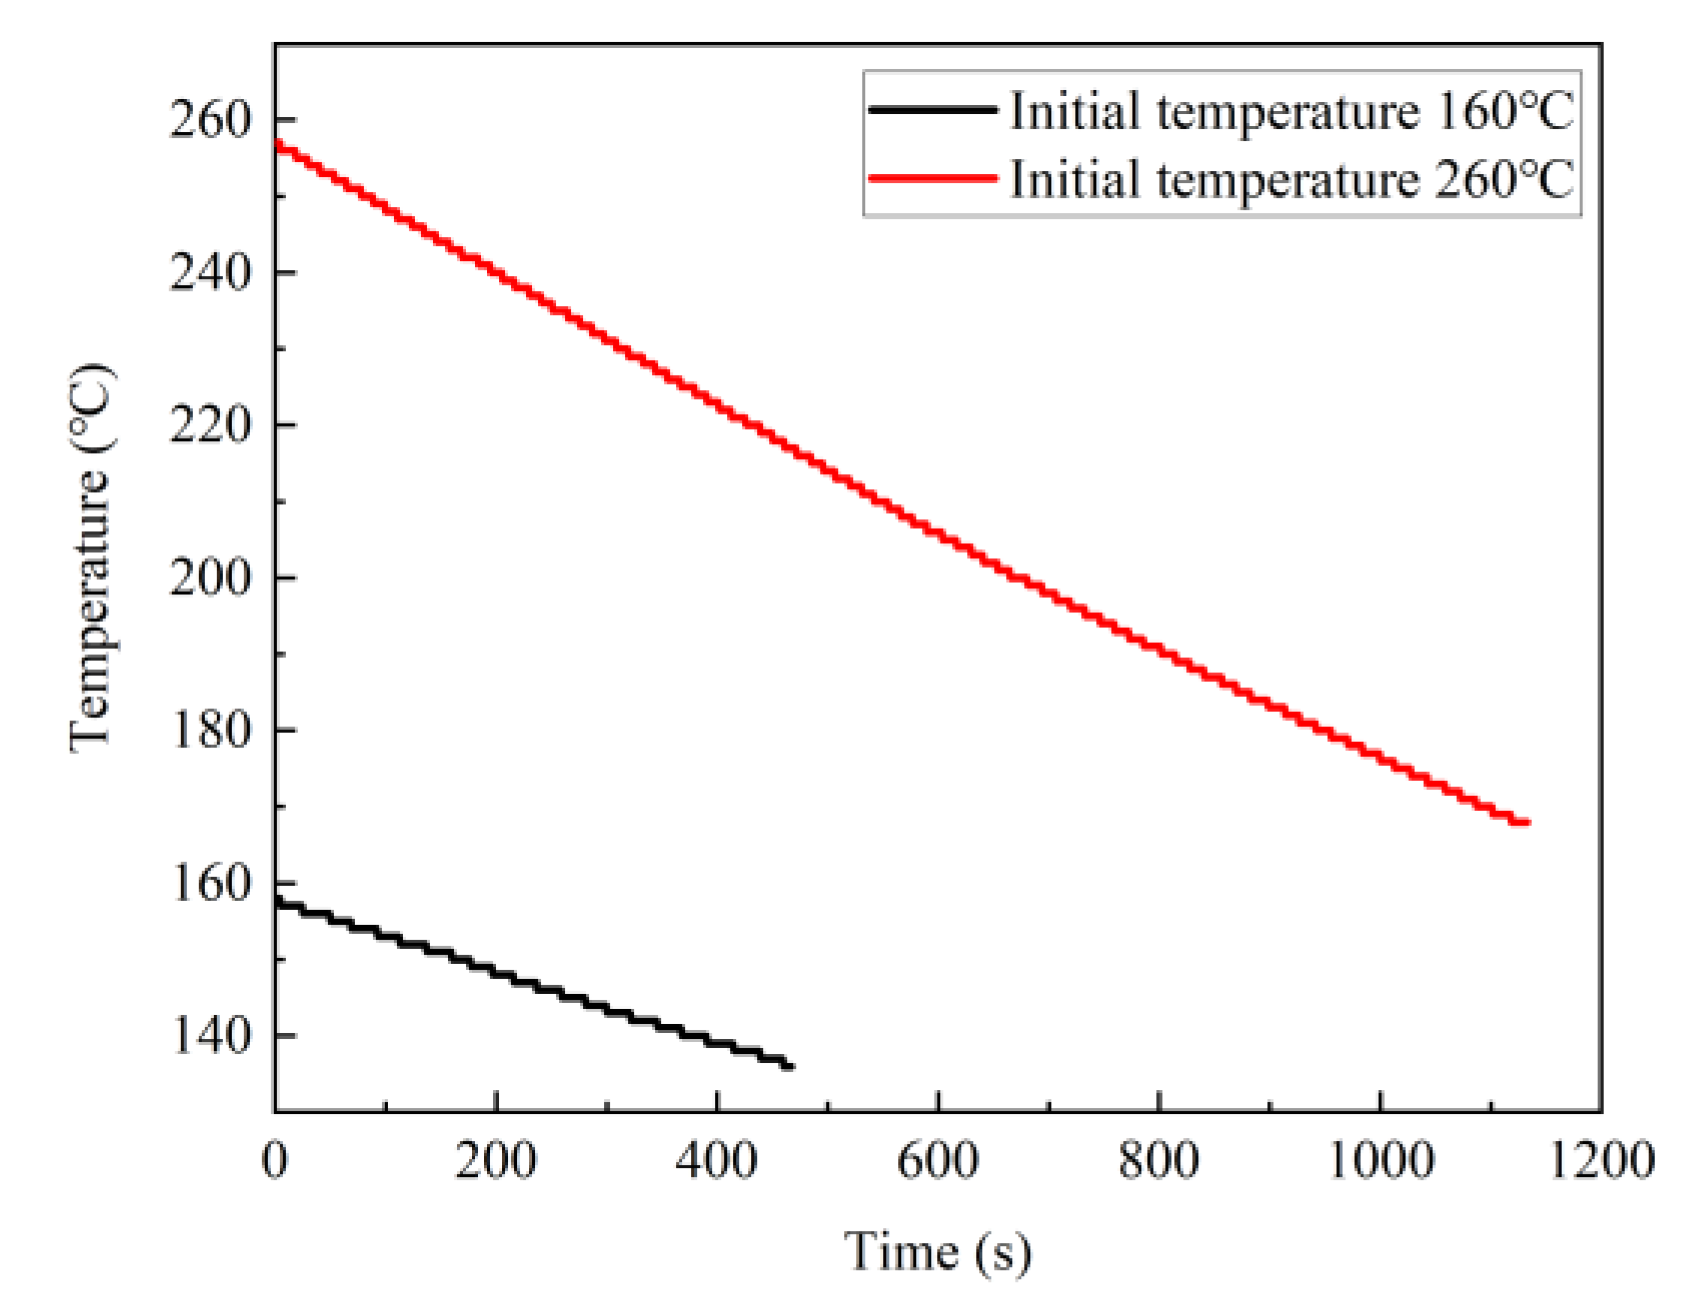
Figure 9.
Oil shale temperature changes with time in the different moisture content experiments. (a) Electric field intensity of 70 V/cm; (b) electric field intensity of 100 V/cm; (c) electric field intensity of 140 V/cm.
Figure 9.
Oil shale temperature changes with time in the different moisture content experiments. (a) Electric field intensity of 70 V/cm; (b) electric field intensity of 100 V/cm; (c) electric field intensity of 140 V/cm.

Figure 10.
Heat generation power variation with time in the different moisture content experiments. (a) Electric field intensity of 70 V/cm; (b) electric field intensity of 100 V/cm; (c) electric field intensity of 140 V/cm.
Figure 10.
Heat generation power variation with time in the different moisture content experiments. (a) Electric field intensity of 70 V/cm; (b) electric field intensity of 100 V/cm; (c) electric field intensity of 140 V/cm.

Table 1.
Organic elements of Huadian oil shale.
| Elements % | H/C | O/C | |||||
|---|---|---|---|---|---|---|---|
| N | C | O | H | S | HF | ||
| 2.36 | 59.60 | 7.82 | 7.16 | 0.57 | 14.65 | 1.44 | 0.10 |
Table 2.
Fischer assay analysis (wt. %).
| Shale Oil | Gas | Water | Residue |
|---|---|---|---|
| 18.32 | 5.27 | 5.99 | 70.42 |
Table 3.
Composition of the Huadian oil shale.
| SiO2 (%) | Al2O3 (%) | TFe2O3 (%) | CaO (%) | MgO (%) | K2O (%) | Na2O (%) | TiO2 (%) | P2O5 (%) | MnO (%) | LOI (%) | Sum (%) |
|---|---|---|---|---|---|---|---|---|---|---|---|
| 52.73 | 15.75 | 5.77 | 1.74 | 2.11 | 3.38 | 2.15 | 0.58 | 0.33 | 0.06 | 15.16 | 99.76 |
Table 4.
Relative content of the mineral components determined by the X-diffraction for Huadian oil shale.
Table 4.
Relative content of the mineral components determined by the X-diffraction for Huadian oil shale.
| Q (%) | Fs (%) | Pl (%) | Cc (%) | Do (%) | Sid (%) | Fy (%) | Ana (%) | I/S (%) | I (%) | K (%) |
|---|---|---|---|---|---|---|---|---|---|---|
| 29.0 | 6.0 | 10.0 | 12.0 | 3.0 | 4.0 | 2.0 | 2.0 | 10.0 | 20.0 | 6.0 |
Note: Q—Quartz, FS—Alkaline Feldspar, Pl—Plagioclase, Cc—Calcite, Do—Dolomite Sid—Siderite, Ana—Analcime, I—Illite, K—Kaolin, I/S—Illite/smectite formation.
Publisher’s Note: MDPI stays neutral with regard to jurisdictional claims in published maps and institutional affiliations. |
© 2022 by the authors. Licensee MDPI, Basel, Switzerland. This article is an open access article distributed under the terms and conditions of the Creative Commons Attribution (CC BY) license (https://creativecommons.org/licenses/by/4.0/).
Share and Cite
MDPI and ACS Style
Sun, Y.; Liu, S.; Li, Q.; Lü, X. Experimental Study on the Factors of the Oil Shale Thermal Breakdown in High-Voltage Power Frequency Electric Heating Technology. Energies 2022, 15, 7181. https://doi.org/10.3390/en15197181
AMA Style
Sun Y, Liu S, Li Q, Lü X. Experimental Study on the Factors of the Oil Shale Thermal Breakdown in High-Voltage Power Frequency Electric Heating Technology. Energies. 2022; 15(19):7181. https://doi.org/10.3390/en15197181
Chicago/Turabian StyleSun, Youhong, Shichang Liu, Qiang Li, and Xiaoshu Lü. 2022. "Experimental Study on the Factors of the Oil Shale Thermal Breakdown in High-Voltage Power Frequency Electric Heating Technology" Energies 15, no. 19: 7181. https://doi.org/10.3390/en15197181
Note that from the first issue of 2016, this journal uses article numbers instead of page numbers. See further details here.