
Novel Methodology to Assess Advanced Biofuel Production at Regional Level: Case Study for Cereal Straw Supply Chains


1
Ca.Re. For. Engineering, Via Giovanni Boccaccio 71, 50133 Firenze, Italy
2
Dipartimento di Energia, Politecnico di Milano, via Lambruschini 4, 20156 Milan, Italy
*
Author to whom correspondence should be addressed.
Energies 2022, 15(19), 7197; https://doi.org/10.3390/en15197197
Submission received: 29 August 2022
/
Revised: 23 September 2022
/
Accepted: 26 September 2022
/
Published: 30 September 2022
(This article belongs to the Special Issue Sustainable Biomass Supply Integration for Bioenergy within the Broader Bioeconomy)
Abstract
:Nowadays, there is an urgent necessity for breakthrough technologies able to reduce process complexity and to lower costs to make the biomass-based biodiesel supply chain competitive. This paper presents an innovative methodology for the identification of secondary biomass potentials for biofuel production. The methodology, divided into four steps, defines the criteria that allow identification of promising scenarios of biomass supply chains for commercial application of innovative technologies. The model set up a scoring procedure based on carbon emission avoidance, efficient resource exploitation and sustainability indexes. Applying the four levels of analysis (biomass availability, suitability analysis, regionalization and multi-criteria analysis), the cereal straw supply chains in four European districts (Scandinavian, Hanseatic, Central European and Mediterranean) have been identified and grouped in 18 biomass supply regional clusters (BSRCs). The clusters represent the most promising hotspots where biomass availability, logistics and feedstock requirements for a novel conversion technology meet. Central European and Mediterranean districts are those with the highest cereal straw bioeconomic potentials which allow mono-feedstock supply chains and relatively high capacity of a conversion technology at 200 MWth and beyond. Central Europe has an overall bioeconomic potential of 16.249 kt (232.359 TJ) distributed over 36 regions and organized in 12 BSRCs. The Mediterranean district has an overall bioeconomic potential of 3541 kt (50.630 TJ) distributed over nine regions and organized in four BSRCs.
1. Introduction
During recent decades, the EU policy has strongly promoted bioenergy chains, starting from liquid biofuel certification with the aim to reach the CO2,eq reduction targets. In order to endorse better environmental performances, the RED II promotes a gradually increasing sub-target for advanced biofuels (see Annex IX, Part A of RED II) up to at least 3.5% by 2030.
Chiaramonti et al. [1] highlight that biofuels and advanced biofuels together will constitute more than 17% of the fuels by 2050 and advanced biofuels are expected to be the majority of the total biofuel volume by 2040.
The Directive introduced a methodology for evaluating the environmental sustainability of the biofuels, considering the biomass sources and all the biofuel production steps. The environmental sustainability is mainly measured in terms of CO2eq savings calculated versus the reference fossil energy scenario. Therefore, the biofuels have to guarantee at least the CO2,eq savings required to access the EU energy market and the design of the biomass supply chain is a critical step that determines the convenience of the energetic production system.
According to Guo [2], the biomass supply chain has to be optimized by reducing costs and environmental impacts and ensuring continuous feedstock supply. In practice, the identification of a general and optimal solution for the biomass supply chain, that is usually designed and set up according to specific and complex needs, is not straightforward. Indeed, the relatively low energy density and the bulky, distributed nature of the feedstock require a tailored-made analysis [3]. For these reasons, it is important that comprehensive planning of the supply chain accounting for the energy conversion technology is carried out [4].
The review paper of Wang et al. [5] indicates that the Life Cycle Assessment (LCA) methodology is the most implemented approach for evaluating the environmental performances of the bioenergy chains, but a more appropriate focus is needed for estimating the land availability and its potential as biomasses sources.
Focusing on specific geographical areas with high diversification level of feedstock is important for improving local energy security, supporting the local economy and increasing the regional stability of the energy market [6]. Locally produced biofuels can reduce the energy import, exploiting the environmental, economic and social sustainability of the energy system.
In this framework, this paper proposes a new methodology for the identification of the optimal advanced biomass supply chain at a regional level. The methodology will account for biomass availability, suitability class allocation, regional cluster identification and Multi-Criteria Analysis (MCA) for identifying the most promising scenarios for biomass supply chains in different EU regions, under different conditions and environmental constraints.
The proposed methodology has been designed for the comparison and the selection of the most profitable biomass supply chain for feeding a flexible and not feedstock-specific bioenergy conversion technology. In the present paper, the case study of cereals’ straw will be implemented as it is a residual biomass available in all the EU regions and feasible supply chains will be identified. In fact, this biomass allows mono-feedstock supply chains with relatively high capacity for large conversion plants of 200 MWth and beyond.
The supply chain is applied here to an innovative process that is part of advanced biodiesel production, making it more efficient and less expensive than current technologies, developed within the CONVERGE project [7].
The development of a proper methodology for biomass supply represents a very important key aspect of the CONVERGE project, with the available feedstock being fundamental in defining plant capacity and costs. These studies and research on the biomasses are conducted at early stage together with the deployment of the biomass conversion technologies to TRL 5. The process involves an indirect gasification step, followed by syngas conditioning and methanol synthesis through five innovative integrated solutions. This process scheme is very flexible and not feedstock-specific, allowing a wide range of biomass feedstock to be considered for processing, e.g., ligno-cellulosic residues from agriculture, forestry and industrial activity, or waste. Hence, the selection of the most promising location for implementing a full-scale technology at the demonstration stage, not commercially available, is quite challenging.
In general, the existing studies focus on net availability of a single investigated biomass as technical potential, excluding the comparison of different biomass supply chains and their logistical aspects and/or local factors such as settlement structure, etc.
Indeed, studies that use consistent data and methodology to estimate total technical availability of cereal straw or other ligno-cellulosic residues from agro-forestry sectors for bioenergy uses are quite common. Additionally, GIS-based assessment of cereal straw energy resources in the European Union has been widely applied in the field of bioenergy installations [8,9,10,11].
In the presented methodology, the use of different biomass types with different seasonalities and multi-feedstock supply chains is considered for a certain technology, such as the CONVERGE process. The application of the MCA approach takes into consideration factors beyond the technical potential of the biomasses, their seasonality and the logistic complexity of the related supply chains, as detailed in the following paragraphs. The MCA’s results, when combined with techno-economic evaluation of the technology under investigation, can be useful decision tools for the selection of the most profitable solution.
2. Methodology for the Enhanced Biomass Availability Assessment
The proposed methodology for the assessment of the biomass supply chains applied to a selected technology at a commercial level consists of four steps (Figure 1):
- first level availability assessment of the bioeconomic potential;
- second level availability assessment for the suitability class allocation;
- spatial distribution at regional level;
- MCA identifying the most promising supply chains and locations for a specific technology.
2.1. First Level Availability Assessment
The first level availability is defined as the amount of each biomass in a specific district, taking into account limitations due to technical accessibility, ecological share for primary residues and competing uses.
To have homogeneous and standardized information, the basic data (cultivation surfaces, primary productions and related residue productions) are preferably collected from statistical database (i.e., EUROSTAT) primary sources. At least four years of data are included in order to mitigate the effect of annual fluctuations of agricultural land use, climate factors and market conditions.
A distinction between three levels of biomass potential is applied: theoretical, technical and bioeconomic [12,13].
Theoretical potential (TrP) includes all parts of the total harvested biomass (H) that have no direct use in food, feed or industrial production and that is considered as gross residue:
where PP is the primary production. According to art. 3, paragraph 17, of Regulation EC 178/2002, primary production is intended here as the yield of the main product of the agriculture production cycle for which the crop is cultivated, for example, in the case of cereals, grains.
TrP = H − PP,
Technical potential (TchP) is the amount of residue that can be removed from the field or forest or collected without any technical, legislative and sustainability constraints (R):
TchP = TrP − R.
TchP is the net residue, that is effectively exploitable for individual and alternative uses.
Bioeconomic potential (BeP) is the share of technical potential that is not necessarily used in competing applications (Ca) with respect to a specific purpose.
BeP = TchP − Ca
The last contribution to bioeconomic potential evaluation is the assessment of competing applications, which is affected by lack of reliable data, resulting in the most critical step of the methodology. Data for competing conventional uses, potential novel competitors and technical constraints or ecological issues present high levels of uncertainty. This uncertainty is managed by the introduction of a precautionary reduction factor for biomass availability. The use of agricultural biomass in the industrial sectors of biochemicals, bioplastics and, in general, bio-based materials is still one of the major data gaps. Therefore, if detailed regional data are available, the bioeconomic potential might be further split into high value added bioproduct potential and advanced biofuel potential. Although precious information is missing, it has been assumed that the quantity of biomass at stake is small. Anyway, if this flux of biomass materials is material, the broad picture of inter-sectorial biomass flows is not distorted [8].
2.2. Second Level Availability Assessment: Suitability Class Allocation
The second level availability assessment identifies the biomass bioeconomic potential with respect to the plant feedstock requirements. This allows classification of each considered area (EU country or region) by means of suitability categories. In particular, four different categories are identified:
- no operational limit: the bioeconomic potential of a mono-feedstock supply chain is beyond the amount needed to run a selected plant capacity of a certain technology;
- operational limit: the bioeconomic potential of a mono-feedstock supply chain is only enough to cover the amount needed to run one selected plant capacity of a certain technology;
- operational risk: the bioeconomic potential of a mono-feedstock supply chain is not enough to cover the amount needed to run one selected plant capacity of a certain technology, therefore a multi-feedstock supply chain is necessary to operate the plant at full capacity;
- no suitability: the bioeconomic potential of the biomass is not enough to operate the plant capacity of a certain technology.
2.3. Spatialization at Regional Level
This step considers a site-specific analysis to assess feedstock availability and accessibility assessment, conventional biomass uses and feedstock competition, logistics, etc. A regional breakdown allows assessment of whether the biomass availability (kt/y) in a given area is able to supply a commercial-scale conversion plant [8]. For each type of biomass, the regional bioeconomic potential and the feeding needs of the technology for different nominal capacities of the commercial plant are investigated and described.
The data at a regional level can be collected from a statistical database (i.e., EUROSTAT), from relevant projects (i.e., S2BIOM, BIORAISE, AGROCYCLE) or from specific works [14,15]. When the quantitative data are collected, the use of GIS tools is considered the proper solution for analyzing in detail the biomass supply [16], optimizing the transportation costs [17] or determining locations, sizes and number of bioenergy facilities [18]. In particular, in this work, spatialization deals with the analysis of site-specific non-technological barriers, as mentioned before, resulting in a quantitative ranking of possible regions to collect biomass for a given plant capacity.
Due to the intrinsic presence of local peculiarities, the involvement of stakeholders from the investigated districts is fundamental to verify and validate the actual potential and the statistically based estimates.
2.4. MCA of the Biomass Supply Chains
The selection of the most promising supply chain for biomass, considering a specific industrial-scale conversion technology as an application, is performed through an approach based on MCA. This tool is indeed able to manage large variability and complexity of possible scenarios [19]. The MCA is implemented considering the following steps: (i) scenario definitions for each type of supply chain, (ii) decision criteria identification, (iii) criteria weight definition, (iv) MCA result interpretation. Technical feasibility, cost/effectiveness analysis and environmental pressure are collected from literature reviews and experimental data collections, allowing for the definition of state-of-the-art supply chains to be used in operative scenarios.
For each criterion, measurable indicators are identified and for each indicator three different levels of performance are defined and scored. The indicators are set for evaluating environmental, economic and logistic aspects; specific weights are already applied in order to highlight the most important objectives to be primarily reached. In fact, some indicators may support the judgment concerning different aspects; for instance, the GHG emissions calculated for a supply chain allow assessment of the environmental sustainability, but also the economic value of the biofuel or bioproduct (i.e., the lower the emissions, the higher the market value). The selection of indicators provided in Table 1 is based on the over ten years of experience of the authors in supply chain analysis, applied to the goals foreseen for the specific task of the CONVERGE project. Anyway, they can be adapted according to the specific target of the analysis.
The unit weight (1) has been applied to the regional availability of the biomass and the GHG emissions of the supply chain indicators since they are assumed to be the most important aspects to be considered in this analysis. The reduced biomass competition or transport distances, high levels of chain standardization, limited number of chain processes, low traceability complexity and adequate biomass characteristics for facilitating the logistics have been assigned lower weights according to their estimated importance as reported in Table 1. The numerical scores and their ranges have been chosen on the basis of the literature analysis for the MCA and for the investigated supply chains (see comments on MCA in the Introduction and Methodology sections) in addition to the answers to questionnaires received as a result of the stakeholder engagement activity of the authors.
In this work, Multi-Criteria Analysis (MCA) and Life Cycle Assessment (LCA) approaches are integrated, the first for the identification of the more profitable solutions, the second for further assessing the environmental pressure more deeply and for defining the associated business cases. The preliminary classification based on MCA significantly reduces the effort and the time needed for the LCA and business case implementation, since they have to be performed on a reduced number of pre-selected scenarios.
3. Case Study for Cereal Straw Supply Chains
In this work, the methodology is implemented for the cereal straw supply chain in Europe and concerns biomethanol production with the process developed within the CONVERGE project [7]. Straw from cereals has been identified as one of the best potential biomass feedstocks in Europe [20] and it may play an important role in advanced biofuels in the future. The use of straw is considered to be an environmentally beneficial and socially acceptable option for bioenergy provision; there is low competition with other land uses and thus comparably low corresponding land use change effects. Nevertheless, there are a number of uncertainties with regard to the actual potential of agricultural residues such as straw that could be used for the production of bioenergy in a sustainable manner [21].
3.1. Biomass Characterization and Logistics
Straw is an agricultural residue consisting of the dry stalks of cereal plants after the grain has been harvested [22]. According to the definitions indicated in the Directive (UE) 2018/2001, straw is classified as residue and is listed in Part A of Annex IX under point “e” Straw. The cereal straw physical–chemical characteristics have been collected from the literature [23,24] as illustrated in Table 2.
Concerning the primary production, the harvestable residues of cereal crops in Europe have been retrieved from EUROSTAT 2019—cereals for the production of grain (including seed), harvested production in EU standard humidity (1000 t) during the period 2015–2018. Data set from Eurostat 2019 is reported in Table A1 (Appendix A).
The data refer to fifteen different kinds of cereal crops (Figure 2) and the main assumptions concern the grain maize:
- grain maize harvested by hand, corn-picker, corn-sheller or combine harvester, regardless of the use, including grain for silage, is considered. Grain harvested together with parts of the cob, but with humidity higher than 20% and used for silage (so-called corn-cob-mix, MC 30–35%) is included, too;
- sweet corn cobs for human consumption are included in “Other vegetables cultivated for fruit n.e.c.” (V3900);
- maize harvested green for fodder or renewable energy use (moisture between 65 and 70%) is accounted for within “Green maize” maslin (G3000) and neglected for this calculation. It presents different yield and residue-to-crop ratio in comparison to other crops, and it is a crop with very low sustainability (super intensive, depletion of soil fertility).
Classes include all cereals harvested dry for grain, regardless of the use (including cereals used for renewable energy production). It is assumed that cereal grains are harvested just before maturity. Primary production is obtained for each EU country by EUROSTAT as yield data (kt/y) and data extraction was carried out at 2 different statistical levels, NUTS0 (Table A1 in Appendix A) and NUTS2. In any case, the primary production (cereal grains) and the theoretical potential sum to the total biomass.
The analysis of the logistics of supply chains is necessary to apply properly and with awareness the multi-criteria analysis and its scores. In Figure 3, the fundamental steps of cereal straw supply chain are briefly presented. Harvesting of straw does not present any particular technical and operational difficulty; it takes place from June–July after the grain is harvested.
The operating machines are ordinarily kept in the machinery park by the cereal and forage producing companies: baling pickers (parallelepiped bales with 1 m side) or packing roto (cylindrical bales 1.5 m ø). The only limitation is the reduced period for collecting straw (usually 3 days) in the case of second-crop growing. After baling, straw should continue to have moisture contents below 20 percent for storage. Storing at moisture contents above 20 percent will result in some molding and heating, as well as dry matter and component loss (Table 3). Pre-treatments of sizing (e.g., shredding) are necessary. Additionally, drying could be needed if the moisture content is not adequate for the conversion plant (moisture content >25%). The range of full costs and CO2 emissions for the preparation and supply of cereal straw depends on transport distance and means of transport (Table 4).
3.2. Bioeconomic Potential Assessment
Theoretical potential of cereal straw is calculated from a non-linear variation in straw/grain ratio [9], as Figure 4 illustrates. The higher the yield, the lower the straw/grain ratio depending on the concept of biophysical maximum of a plant.
With a precautionary approach adopted in the CONVERGE project, the residue-to-crop ratio of 0.625 has been considered. Only the technical potential, as a fraction of the straw theoretical potential, is accessible for further utilization, due to factors such as affordability, sustainable harvesting practices, e.g., balancing humus quality [28,29], and legislation [21].
The estimation of a potential supply of removable straw is obtained by reducing the quantity of harvestable straw by a coefficient of sustainability (to maintain the soil carbon balance and soil fertility) which defines, in holistic approaches, the level of removable straw compatible with maintaining the rate of Soil Organic Matter (SOM): it varies from 20 to 50% and usually 33% is adopted [20]. Bioeconomic potentials of cereal straw have been estimated on the basis of the JRC Policy and Science Report [8] that indicates the share of collected crop residues and allows estimation of the competing applications for straw according to the following equation:
where
Sbp = Straw bioeconomic potential;
Step = Straw technical potential;
Sthp = Straw theoretical potential;
0.25 = Crop-type residue collection coefficients.
Competing applications further restrict technical potential; for cereal straw, they are:
- conventional uses (livestock littering, industrial, green building, etc.);
- energy production (heat and power).
For cereal straw, an in-depth understanding of each value chain and of current concepts for managing residues is needed. In addition, analysis of statistical data for competing applications (e.g., livestock littering in a certain region) and review of the literature and industry reports are required. Moreover, according to [30], in order to allocate straw demand of competing applications to a regional level, different scenarios should be analyzed to reflect changing demand patterns as a result of different conditions such as legislation, prices or subsidies. Straw for litter is used for animal bedding; this application accounts for the largest straw demand [9] and is expensive and labor-intensive. The amount of straw used for litter (or bedding) can significantly vary due to the type of livestock and the country (Figure 5).
The major straw-consuming livestock are dairy cows, other cows, buffaloes, goats, sheep and horses for an overall amount of about 61 million metric tons of dry matter. Horses have been identified as a significant competitive user, but no statistical data are available in EUROSTAT databases. Straw mulching is relevant in the field of ecological farming. Interviews with farmers revealed that up to 100% of the produced straw on the farm is used for surface mulching. Straw delivers important nutrients, improves humus development, prevents soil erosion and reduces the use of artificial fertilizers. Energy is the main non-agricultural competitive use for straw. According to Helin et al. [20], Denmark, Hungary, Sweden, Spain and the United Kingdom are the most advanced countries in terms of use of straw for energy (Table 5).
All the EU power plants using straw to produce energy consume about 2 million metric tons of straw which represents about 1% of the annual quantity of harvestable straw in Europe and up to 30% of the harvestable straw at a regional scale (NUTS2). Agro-industrial applications are also relevant: mushroom and strawberry cultivation needs straw previously composted or directly incorporated into the soil, respectively. Moreover, natural materials are becoming increasingly important in modern times, especially in the context of construction material, even if, compared to the other alternative uses, the building sector absorbs minor amounts [31].
At a national level (NUTS0 area), the bioeconomic potentials of cereal straw residues seem to be largely widespread in most of the countries. Three countries produce 46% of the biomass potential for straw: France, Germany and Poland. France is the top producer of straw, particularly of wheat and maize. Germany is the next biggest producer of straw, mainly wheat and barley. Poland’s production of straw is largely oilseed rape, wheat and triticale. Romania is dominated by maize and wheat, while the top producers of rice in Europe are Italy, followed by Spain, Greece, Portugal, France, Romania, Bulgaria and Hungary.
The cereal straw potentials are shown in Figure 6.
Moreover, to account for the use of agricultural biomass in the manufacture of bio-based chemicals and bio-based plastics (high added value bio-based materials), which remains one of the major data gaps, a precautionary scenario has been considered by a reduction factor to assign the share of biomass available as feedstock for advanced biofuel production. It considers the biomass potential for advanced biofuel between 45 and 10% of the bioeconomic potential.
The distribution of the cereal straw in the EU countries according to the precautionary scenario is shown in Table 6.
3.3. Suitability Class Allocation
The biomass is converted into methanol in an innovative process developed within the CONVERGE project. The plant is modeled in ASPEN modeling, determining the mass and energy balances of the integrated plant for a given capacity of biomass input (i.e., 100 MWth). The results (i.e., mass flows and thermal duties) can be linearly scaled to other biomass inputs. For instance, for CONVERGE technology, the hypothesis of 100 MWth and 200 MWth plant capacity allows the assessment of the plant feedstock requirements for a preliminary speculation (Table 7). For cereal straw, the specific conversion concept requires 138 and 275 kt/y of biomass for a plant thermal capacity of 100 and 200 MWth, respectively. Figure 7 shows the cut-off for a plant of 200 MWth.
3.4. Data Spatialization for Cereal Straw
Afterwards, the spatialization of the data was completed for every EU-27 country and the data collection at the European regional level (NUTS2) was conducted with statistical database EUROSTAT. Moreover, in the CONVERGE project a specific questionnaire composed of 5 sections and containing 40 description fields was provided to producers, first gathering entities and industrial and research institutions (in total 43 entities) able to give back localized information about the current flows of residual biomass treated or studied by them.
The regional data, available in EUROSTAT as NUTS2 data, were analyzed by QGIS v3.8-Zanzibar. The adoption of GIS solutions provides the distribution of bioeconomic potential of biomass in the European administrative units (NUT32) at a glance.
The most conservative precautionary bioeconomic potential (45% scenario) has been arranged by an ordinal scale on the basis of the availability of data amplitude (Figure 8).
The area around Paris (Centre—Val de Loire) is one of the most promising regions. Regions with an undersupply of straw tend to import such biomass to satisfy straw demand. This happens, for example, for some regions in the Netherlands [32]. Moreover, the introduction of suitability classes gives additional details with respect to the regional breakdown maps, scoring the different regions according to their potential in scaling up the proposed conversion solution at commercial size. In fact, this solution matches the cereal straw bioeconomic potential and the feeding request of the conversion technology, identifying potential biomass supply bottlenecks (Figure 9). Forty-eight regions belong to the class “No operational limit” where the biomass can be used for mono-feedstock supply of plants with over 200 MWth of capacity (Table A2 in Appendix A). These regions were grouped in eighteen biomass supply regional clusters (Table A3 in Appendix A). In each of the four EU districts, several clusters are present, representing the hotspots for commercial scaling up of the CONVERGE technology. Actually, these regions are able to provide a sufficient amount of mono-feedstock to plants over 200 MWth, without limitations from the upstream logistics.
3.5. MCA of the Cereal Straw Supply Chain
The scenarios provided by MCA which depict the different options and all their different implications in terms of technical feasibility, cost/effectiveness analysis and environmental pressures are chosen, hypothesizing their implementation in a specific geographical area, i.e., Hanseatic, Scandinavian, Mediterranean and Central European.
For cereal straw supply chain assessment, thirteen measurable indicators have been identified. For each of them, three different levels of performance are defined and scored (Table 1). For each indicator, a weight has been set (1, 0.6 and 0.3) in order to highlight the indicators considered fundamental for reaching the proposed objectives in terms of environmental sustainability, economic performances and logistical optimization.
MCA methodology is selected for the analysis of cereal straw supply chains, to point out the most promising regional clusters for feedstock provision in the EU. In Central Europe, the cereal straw is the most interesting chain, reaching a score of 15.7, due to a combination of high availability (i.e., the possibility to feed large plants) and low moisture content of the biomass (i.e., low complexity of storage). In the Scandinavian region, the cereal straw supply chain is less profitable with a score of 13.4, followed by the Hanseatic and the Mediterranean regions with 12.5 and 12.0, respectively. The implementation of the MCA allows application of preference modeling to the most promising supply chain for each EU district, by a scoring and weighting process (Table 8). In particular, the cereal straw is also very promising in Scandinavia even if the competition uses are more critical, in Mediterranean countries where the storage complexity rises and in the Hanseatic area where the supply chain is standardized and the storage management easier. Anyway, these three districts have a reduced number of the most promising regions if compared with the Central EU. Therefore, in this framework, for the Mediterranean and North Sea regions, the CONVERGE project implemented the MCA for multi-feedstock supply chains, useful for reaching the quantities of biomass suitable for a large plant’s continuous operation. Anyway, a low level of logistic and economic optimization is required because of the complexity of different and integrated storage, transport and pre-treatment solutions.
4. Conclusions
The EU Member States set the ambitious target to improve the share of renewable energy within the final consumption of energy in the road and rail transportation sector by at least 14% by 2030. The residual biomasses represent a versatile key renewable energy source from which advanced liquid biofuels, sensu RED II Annex IX, Part A, can be generated. However, within the next 10 years, feedstock access could become very likely increasingly challenging, and the biomass potential is expected to become a relevant constraint for the continuous operation of the biorefineries. Therefore, it is very important to build up a constant, reliable and cost-efficient supply system of biomass in addition to the distribution system of biofuel on the basis of actual scenarios, sustainability criteria and bioeconomy cluster approach at the regional level.
Moreover, since the consumption of wood feedstock for energy production is continuously increasing, non-forestry ligno-cellulosic material should be proposed and used to satisfy the demand for biomass, especially in certain EU geographical districts, prevent the overexploitation of forestry resources and enhance forest conservation. This paper presented an innovative methodology to identify the potential of residual biomasses for biofuel production at the regional level, applying the methodology to a cereal straw case study and CONVERGE conversion plant.
The developed methodology applies four different levels of analysis to account for (i) supply limits, (ii) requested thermal input for the conversion plant, (iii) availability at the regional level (i.e., NUTS2 at European level) and (iv) a multi-criteria analysis. The four levels of analysis allowed the identification of the cereal straw supply chains in the four EU districts (Scandinavian, Hanseatic, Central European and Mediterranean). The most promising hotspots where biomass availability, logistics and feedstock requirements meet have been subsequently grouped in 18 biomass supply regional clusters (BSRCs).
Through the application of preference modeling of the supply chain for each EU district, by a scoring and weighting process of the MCA, the most promising scenarios for each EU district under investigation were defined. From the model application, it was found that Central Europe and Mediterranean districts are those with the highest cereal straw bioeconomic potentials. In practice, they allow mono-feedstock supply chains and relatively high capacity of the CONVERGE technology of 200 MWth and beyond:
- (i)
- Central Europe has an overall bioeconomic potential of 16.249 kt (232.359 TJ) distributed over 36 regions and organized in 12 BSRCs. Cereal straw is indeed the most representative biomass supply chain of the district including 36 regions that together provide 96% of the whole bioeconomic potential of the district: 70% is held by France and Germany and the remaining 30% by Romania, Slovakia, Bulgaria and Poland. The biggest cluster is located in France (see Central Europe in Table 6 and Table A3 in Appendix A) and includes the regions of Centre—Val de Loire, Poitou-Charentes, Pays de la Loire, Bretagne, Bourgogne (in total 2.978 kt; 42.590 TJ);
- (ii)
- the Mediterranean district has an overall bioeconomic potential of 3541 kt (50.630 TJ) distributed over nine regions and organized in four BSRCs.
The provided approach for supply chain definition allows implementation of business cases considering the different regions’ suitability. This last item is particularly important because biofuel cost can be reduced by supply chain optimization, helping to improve competitiveness with conventional fossil fuels. Many different conversion processes and biomass streams can be evaluated by the presented methodology, as well as in regions where the suitability class “No operational limit” is less represented and a dominant type of biomass supply chain is missing.
These aspects are relevant assuming the strong competition for the residual biomasses from today up to 2030; the industrial plants have to not be feedstock-specific to reduce the issues related with competing for a specific local biomass as feedstock.
For the Mediterranean and Hanseatic regions, the methodology implemented for multi-feedstock supply chains highlights that multi-feedstock solutions are useful for reaching the biomass quantities required by the conversion plant. In addition, the resulting biomass mix overcomes the complexity in terms of storage, transport and pre-treatment necessity of a single feedstock, leveraging logistical and economic optimization strategies. Given this preliminary outcome, future works will focus on further applications and improvements of the methodology, mainly focusing on:
- (i)
- comparative analysis of all the biomass supply chains suitable for the advanced biofuel production;
- (ii)
- combination of the discussed methodology with a supply chain optimization tool for advanced biofuel production;
- (iii)
- multi-feedstock solutions for the Mediterranean and Hanseatic regions;
- (iv)
- integration with a dynamic model for calculating lifecycle GHG emissions of the ligno-cellulosic biomass supply chains for advanced biofuels for road transportation markets, based on the calculation rules of the Revised Renewable Energy Directive (RED-II).
Author Contributions
Conceptualization, M.U. and G.M.; methodology, M.U.; software, L.R.; validation, M.U. and L.R.; formal analysis, M.U.; investigation, L.R.; resources, M.U.; writing—original draft preparation, M.U. and L.R.; writing—review and editing, G.M. and G.G.; visualization, L.R. and G.G.; supervision, G.M.; project administration, G.G.; funding acquisition, G.M. All authors have read and agreed to the published version of the manuscript.
Funding
This research was funded as part of the CONVERGE project that has received funding from the European Union’s Horizon 2020 research and innovation programme under Grant Agreement No. 818135.
Data Availability Statement
Publicly available datasets were analyzed in this study, as from the referenced sources (e.g., Eurostat). The results presented in this study are available on request from the corresponding author.
Conflicts of Interest
The authors declare no conflict of interest.
Appendix A

Table A1.
Data set from Eurostat 2019, average data of the harvest campaigns from 2015 up to 2018, theoretical potential of cereal straw.
Table A1.
Data set from Eurostat 2019, average data of the harvest campaigns from 2015 up to 2018, theoretical potential of cereal straw.
| Year | 2015 | 2016 | 2017 | 2018 | Average |
|---|---|---|---|---|---|
| Geographical labels | |||||
| European Union—28 countries | 316,628.57 | 301,748.74 | 309,984.25 | 295,171.77 | 305,883.33 |
| France | 71,788.59 | 53,579.13 | 67,728.63 | 61,840.31 | 63,734.17 |
| Germany | 48,917.70 | 45,401.00 | 45,593.20 | 37,974.80 | 44,471.68 |
| Turkey | 38,637.00 | 35,724.93 | 36,604.93 | 34,705.75 | 36,418.15 |
| Poland | 27,481.72 | 29,293.87 | 31,331.01 | 26,281.55 | 28,597.04 |
| Romania | 19,332.82 | 21,764.82 | 27,138.88 | 31,553.28 | 24,947.45 |
| United Kingdom | 24,591.19 | 21,710.58 | 22,733.55 | 20,839.83 | 22,468.79 |
| Spain | 20,783.82 | 24,955.45 | 17,188.44 | 25,358.14 | 22,071.46 |
| Italy | 16,405.76 | 18,363.10 | 16,554.95 | 16,850.67 | 17,043.62 |
| Hungary | 14,107.34 | 16,594.35 | 13,979.39 | 14,890.26 | 14,892.84 |
| Bulgaria | 8728.97 | 8945.12 | 9737.28 | 10,110.55 | 9380.48 |
| Denmark | 9907.84 | 9024.03 | 9882.96 | 6923.90 | 8934.68 |
| Serbia | 8436.97 | 10868.00 | 6793.30 | n.a. | 8699.42 |
| Czechia | 8183.51 | 8596.41 | 7456.78 | 6970.92 | 7801.91 |
| Sweden | 6168.80 | 5480.50 | 5958.40 | 3260.10 | 5216.95 |
| Lithuania | 6085.05 | 5120.82 | 5074.19 | 3999.50 | 5069.89 |
| Austria | 4826.90 | 5671.46 | 4847.27 | 4785.62 | 5032.81 |
| Slovakia | 3805.71 | 4847.85 | 3484.06 | 4070.76 | 4052.10 |
| Greece | 3588.78 | 3983.13 | 3015.72 | 3043.33 | 3407.74 |
| Finland | 3729.91 | 3609.38 | 3462.12 | 2768.19 | 3392.40 |
| Croatia | 2773.95 | 3472.83 | 2678.79 | 3268.48 | 3048.51 |
| Latvia | 3021.50 | 2703.20 | 2692.50 | 2057.30 | 2618.63 |
| Belgium | 3133.68 | 2228.79 | 2642.25 | 2431.04 | 2608.94 |
| Ireland | 2497.93 | 2184.32 | 2259.53 | 1784.91 | 2181.67 |
| Bosnia and Herzegovina 1 | 1150.87 | 1677.52 | 1176.89 | 1764.10 | 1442.35 |
| Netherlands | 1629.08 | 1344.30 | 1370.62 | 1315.25 | 1414.81 |
| Norway | 1342.11 | 1310.58 | 1205.81 | n.a. | 1286.17 |
| Estonia | 1535.30 | 934.10 | 1311.90 | 919.83 | 1175.28 |
| Portugal | 1252.36 | 1152.27 | 1128.59 | 1115.62 | 1162.21 |
| Switzerland | 901.75 | 752.06 | 986.72 | 876.48 | 879.25 |
| Albania | 695.50 | 698.40 | n.a. | n.a. | 696.95 |
| Slovenia | 624.05 | 638.06 | 546.99 | 596.66 | 601.44 |
| North Macedonia | 483.81 | 640.91 | 447.71 | 598.31 | 542.69 |
| Kosovo 2 | 443.60 | 562.90 | 477.90 | n.a. | 494.80 |
| Luxembourg | 178.57 | 139.43 | 149.81 | 157.65 | 156.37 |
| Cyprus | 88.13 | 10.42 | 36.45 | 24.71 | 39.93 |
| Montenegro | 7.09 | 7.69 | 7.87 | 8.02 | 7.67 |
| Iceland | n.a. | 6.00 | 8.00 | 3.95 | 5.98 |
| Malta | - | - | - | - | - |
| Liechtenstein | n.a. | n.a. | n.a. | n.a. | n.a. |
n.a. = not available; 1 estimated; 2 under United Nations Security Council Resolution 1244/99.
Table A2.
List of the EU regions that belong to the suitability class “No operational limit”.
| Progr. | Country | NUTs2 Region | Precautionary Scenario (kt/y) | Progr. | Country | NUTs2 Region | Precautionary Scenario (kt/y) |
|---|---|---|---|---|---|---|---|
| 1 | DE | Bayern | 940.14 | 25 | PL | Lubelskie | 372.55 |
| 2 | FR | Centre-Val de Loire | 932.09 | 26 | HR | Kontinentalna Hrvatska | 356.17 |
| 3 | ES | Castilla y León | 854.06 | 27 | FR | Nord-Pas-de-Calais | 352.22 |
| 4 | DE | Niedersachsen | 771.92 | 28 | RO | Nord-Est | 351.83 |
| 5 | RO | Sud-Muntenia | 699.29 | 29 | DK | Midtjylland | 330.05 |
| 6 | FR | Picardie | 631.36 | 30 | IT | Lombardia | 318.36 |
| 7 | RO | Sud-Est | 612.53 | 31 | FR | Haute-Normandie | 318.21 |
| 8 | FR | Champagne-Ardenne | 605.39 | 32 | SK | Západné Slovensko | 317.08 |
| 9 | FR | Poitou-Charentes | 576.25 | 33 | DE | Sachsen | 314.68 |
| 10 | DE | Nordrhein-Westfalen | 557.79 | 34 | DE | Brandenburg | 312.22 |
| 11 | LT | Vidurio ir vakaru Lietuvos regionas | 555.77 | 35 | DK | Syddanmark | 308.83 |
| 12 | FR | Pays de la Loire | 551.22 | 36 | FR | Lorraine | 308.37 |
| 13 | FR | Bretagne | 492.67 | 37 | PL | Mazowiecki regionalny | 307.77 |
| 14 | PL | Wielkopolskie | 489.13 | 38 | IT | Veneto | 303.64 |
| 15 | FR | Midi-Pyrénées | 454.16 | 39 | FR | Île de France | 301.28 |
| 16 | DE | Mecklenburg-Vorpommern | 444.73 | 40 | PL | Kujawsko-Pomorskie | 298.08 |
| 17 | ES | Castilla-la Mancha | 441.64 | 41 | DE | Thüringen | 297.22 |
| 18 | DE | Sachsen-Anhalt | 428.22 | 42 | IT | Piemonte | 297.13 |
| 19 | FR | Bourgogne | 426.11 | 43 | BG | Severoiztochen | 295.90 |
| 20 | RO | Sud-Vest Oltenia | 419.55 | 44 | PL | Dolnoslaskie | 288.47 |
| 21 | FR | Aquitaine | 417.81 | 45 | BG | Severozapaden | 287.33 |
| 22 | DE | Baden-Württemberg | 406.34 | 46 | IT | Emilia-Romagna | 286.49 |
| 23 | ES | Aragón | 404.62 | 47 | DE | Schleswig-Holstein | 284.31 |
| 24 | RO | Vest | 384.61 | 48 | ES | Andalucía | 278.44 |
Table A3.
Regional biomass supply cluster for cereal straw.
| District | Country | Regions | Cluster Progress ID |
|---|---|---|---|
| Scandinavia | Denmark | Midtjylland Syddanmark | 1 |
| Hanseatic countries | Lithuania | Vidurio ir vakaru Lietuvos regionas | 2 |
| Central EU | France | Centre—Val de Loire Poitou-Charentes Pays de la Loire Bretagne Bourgogne | 3 |
| Picardie Champagne-Ardenne Nord-Pas-de-Calais Haute-Normandie Lorraine Île de France | 4 | ||
| Aquitaine Midi-Pyrénées | 5 | ||
| Germany (NUTS1) | Bayern Baden-Württemberg | 6 | |
| Niedersachsen Nordrhein-Westfalen | 7 | ||
| Mecklenburg-Vorpommern Sachsen-Anhalt Sachsen Brandenburg Schleswig-Holstein Thüringen | 8 | ||
| Poland | Wielkopolskie Dolnoslaskie Kujawsko-Pomorskie Lubelskie Mazowiecki regionalny | 9 | |
| Romania | Sud—Muntenia Sud-Est Sud-Vest Oltenia Nord-Est | 10 | |
| Vest | 11 | ||
| Slovakia | Západné Slovensko | 12 | |
| Bulgaria | Severozapaden | 13 | |
| Severoiztochen | 14 | ||
| Mediterranean EU | Spain | Castilla y León Aragón | 15 |
| Castilla-la Mancha Andalucía | 16 | ||
| Croatia | Kontinentalna Hrvatska | 17 | |
| Italy | Piemonte Lombardia Veneto Emilia-Romagna | 18 |
References
- Chiaramonti, D.; Talluri, G.; Scarlat, N.; Prussi, M. The challenge of forecasting the role of biofuel in EU transport decarbonisation at 2050: A meta-analysis review of published scenarios. Renew. Sustain. Energy Rev. 2021, 139, 110715. [Google Scholar] [CrossRef]
- Guo, X.; Voogt, J.; Annevelink, B.; Snels, J.; Kanellopoulos, A. Optimizing Resource Utilization in Biomass Supply Chains by Creating Integrated Biomass Logistics Centers. Energies 2020, 13, 6153. [Google Scholar] [CrossRef]
- Tallaksen, J. Biomass Gasification: A Comprehensive Demonstration of a Community-Scale Biomass Energy System B; USDA Final Report, Grant Agreement 68-3A75-5-232; West Central Research and Outreach Center: Morris, MN, USA, 2009. [Google Scholar]
- Tallaksen, J. Guidelines for Developing a Sustainable Biomass Supply Chain; Final Report to USDA Rural Development, 2011 Grant 68-3A75-5-232; West Central Research and Outreach Center: Morris, MN, USA, 2011. [Google Scholar]
- Wang, J.; Yang, Y.; Bentley, Y.; Geng, X.; Liu, X. Sustainability Assessment of Bioenergy from a Global Perspective: A Review. Sustainability 2018, 10, 2739. [Google Scholar] [CrossRef]
- Chiaramonti, D.; Maniatis, K. Security of supply, strategic storage and Covid19: Which lessons learnt for renewable and recycled carbon fuels, and their future role in decarbonizing transport? Appl. Energy 2020, 271, 115216. [Google Scholar] [CrossRef] [PubMed]
- Carbon Valorisation in Energy-Efficient Green Fuels, H2020 Project, Grant Agreement No. 818135. Available online: https://www.converge-h2020.eu/ (accessed on 28 August 2022).
- Camia, A.; Robert, N.; Jonsson, R.; Pilli, R.; García-Condado, S.; López-Lozano, R.; van der Velde, M.; Ronzon, T.; Gurría, P.; M’Barek, R.; et al. Biomass Production, Supply, Uses and Flows in the European Union. First Results from an Integrated Assessment; JRC Science for Policy Report; Publications Office of the European Union: Luxembourg, 2018. [Google Scholar]
- Edwards, R.A.H.; Súri, M.; Huld, T.A.; Dallemand, J.F. Gis-based assessment of cereal straw energy resource in the european union. In Proceedings of the 14th European Biomass Conference & Exhibition, Biomass for Energy, Industry and Climate Protection, Paris, France, 17–21 October 2005. [Google Scholar]
- Kappler, G.; Leible, L.; Kälber, S.; Niecke, E.; Wintzer, D. D GIS-based analyses and optimization of wood and straw supply for energy purposes at local level. In Proceedings of the Conference Bioenergy in Wood Industry, Jyväskylä, Finland, 12–15 September 2002. [Google Scholar]
- Bharti, A.; Paritosh, K.; Mandla, V.R.; Chawade, A.; Vivekanand, V. GIS Application for the Estimation of Bioenergy Potential from Agriculture Residues: An Overview. Energies 2021, 14, 898. [Google Scholar] [CrossRef]
- Vis, M.W.; van de Berg, D. Harmonization of Biomass Resource Assessment: Best Practices and Methods Handbook; Biomass Energy Europe: Freiburg, Germany, 2010; Volume 1. [Google Scholar]
- Thran, D.; Pfeiffer, D. Method Handbook: Material Flow Oriented Assessment of Greenhouse Gas Effects; German Biomass Research Centre (DBFZ): Leipzig, Germany, 2015. [Google Scholar]
- Garcia-Galindo, D.; Gomez-Palmero, M.; Pueyo, E.; Germer, S.; Pari, L.; Afano, V.; Dyjakon, A.; Sagarna, J.; Rivera, S.; Poutrin, C. Agricultural pruning as biomass resource: Generation, potentials and current fates. An approach to its state in Europe. In Proceedings of the 24th EUBCE, Amsterdam, The Netherlands, 6–9 June 2016. [Google Scholar]
- Verek, P.J.; Fitzgerald, J.B.; Datta, P.; Dees, M.; Hengeveld, G.M.; Linder, M.; Zudin, S. Spatial distribution of the potential forest biomass availability in Europe. For. Ecosyst. 2019, 6, 5. [Google Scholar] [CrossRef]
- Sacchelli, S.; Zambelli, P.; Zatelli, P.; Ciolli, M. Biomasfor: An open-source holistic model for the assessment of sustainable forest bioenergy. iForest 2013, 6, 285–293. [Google Scholar] [CrossRef]
- Moller, B.; Nielsen, P.S. Analyzing Transport Cost of Danish Forest Wood Chip Resources by Means of Continuous Cost Surfaces. Biomass Bioenergy 2007, 31, 291–298. [Google Scholar] [CrossRef]
- Sultana, A.; Kumar, A. Optimal Siting and Size of Bioenergy Facilities Using Geographic Information System. Appl. Energy 2012, 94, 192–201. [Google Scholar] [CrossRef]
- Recchia, L.; Boncinelli, P.; Sarri, D.; Cini, E.; Vieri, M.; Garbati Pegna, F. Multicriteria Analysis and LCA Techniques—Approach to Agro-Engineering Problems; Springer: London, UK, 2011; ISBN 9780857297037. [Google Scholar] [CrossRef]
- Helin, T.; Vesterinen, P.; Ahola, H.; Niemelä, K.; Doublet, S.; Couturier, C.; Piotrowski, S.; Carus, M.; Tambuyser, B.; Hasija, R.; et al. Availability of Lignocellulosic Biomass Types of Interest in the Study Regions; Deliverable D1.1, BIOCORE—BIOCOmmodity Refinery, H2020 Projec, Grant Agreement no.: FP7-241566; 2012. Available online: http://www.biocore-europe.org/file/D1_1%20Availability%20of%20lignocellulosic%20biomass%20types%20of%20interest%20in%20the%20study%20regions.pdf (accessed on 15 January 2015).
- Gawor, M.; Majer, S.; Thrän, D. Impact of Promotion Mechanisms for Advanced and Low-iLUC Biofuels on Markets: Straw for Bioenergy; IEA Bioenergy Task 40; 2104. Available online: https://www.ieabioenergy.com/iea-publications/ (accessed on 28 August 2022).
- Tassinari, G. Manuale dell’Agronomo; Reda: Brescia, Italy, 2018. [Google Scholar]
- Trezzini, D. Analisi Tecnico-Economica di un Moderno Impianto di Generazione Elettrica da Energie Rinnovabili (Biomasse). Master’s Thesis, Politecnico di Milano, Milan, Italy, 2013. [Google Scholar]
- ENAMA. Biomasse ed Energia; ENAMA: Roma, Italy, 2010. [Google Scholar]
- Eurostat Handbook for Annual Crop Statistics. 2017. Available online: http://www.eumuda.eu/media/files/table_of_crop_areas/Eurostat_Handbook_apro_acs_esms_an1.pdf (accessed on 28 August 2022).
- Source: U.S. Dairy Forage Research Center in Madison, WI. Available online: https://www.ars.usda.gov/midwest-area/madison-wi/us-dairy-forage-research-center/ (accessed on 28 August 2022).
- Leible, L.; Kälber, S.; Kappler, G.; Lange, S.; Nieke, E.; Fürniss, B. Fischer-Tropsch synfuels from cereal straw via fast pyrolysis and gasification—Costs and benefits. In Proceedings of the 15th European Biomass Conference, Berlin, Germany, 7–11 May 2007. [Google Scholar]
- Helwig, T.; Jannasch, R.; Samson, R.; DeMaio, A.; Caumartin, D. Agricultural Biomass Residue Inventories and Conversion Systems for Energy Production in Eastern Canada; Final Report, Prepared for Natural Resources-Canada Contract #23348-016095/001/SQ; Resource Efficient Agricultural Production (REAP): Quebec, Canada, 2002. [Google Scholar]
- Münch, J. Sustainably Usable Wheat Straw in Germany; Positionspapier of the Institute for Energy and Environmental Research (IFEU): Heidelberg, Germany, 2008. [Google Scholar]
- Thorenz, A.; Wietschel, L.; Stindt, D.; Tuma, A. Assessment of agroforestry residue potentials for the bioeconomy in the European Union. J. Clean. Prod. 2018, 176, 348–359. [Google Scholar] [CrossRef] [PubMed]
- Kretschmer, B.; Allen, B.; Hart, K. Mobilising Cereal Straw in the EU to Feed Advanced Biofuel Production; Report Produced for Novozymes; Institute for European Environmental Policy: London, UK, 2012. [Google Scholar]
- UN Comtrade, 2016 UN Comtrade [WWW Document]. Available online: https://comtrade.un.org/data/ (accessed on 28 August 2022).
Figure 1.
Methodology scheme for country-specific supply chains.

Figure 2.
Hierarchy of cereal crops from [25]. Code C refers to classes of cereals, as labeled in the boxes.
Figure 2.
Hierarchy of cereal crops from [25]. Code C refers to classes of cereals, as labeled in the boxes.

Figure 3.
Operational phases of the cereal straw supply chain.
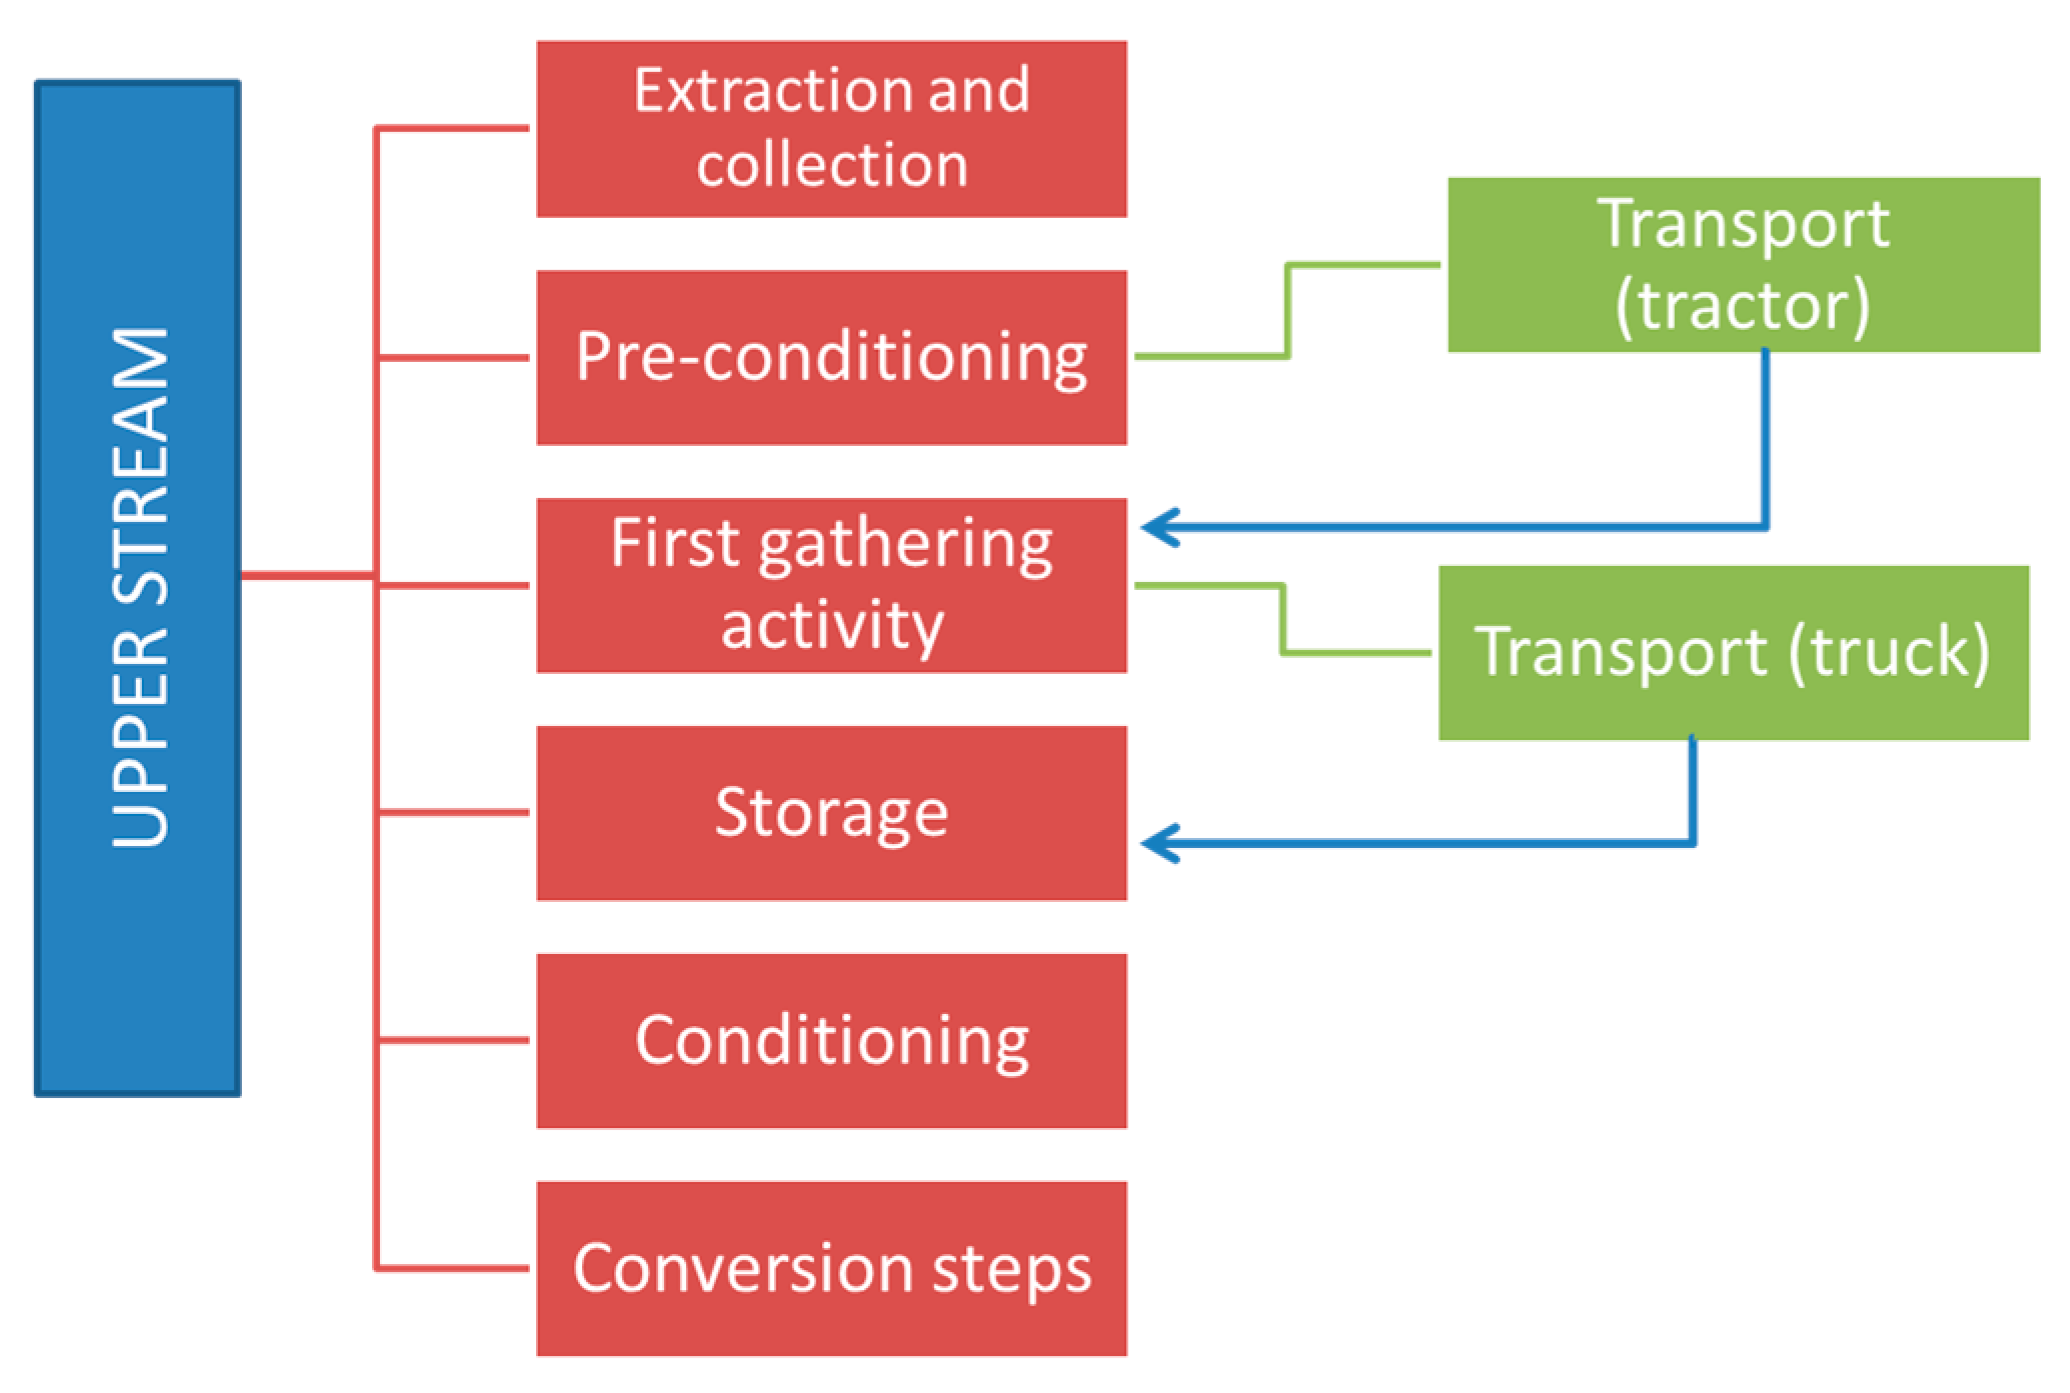
Figure 4.
Straw-to-grain ratio for wheat and barley production [9].
Figure 4.
Straw-to-grain ratio for wheat and barley production [9].
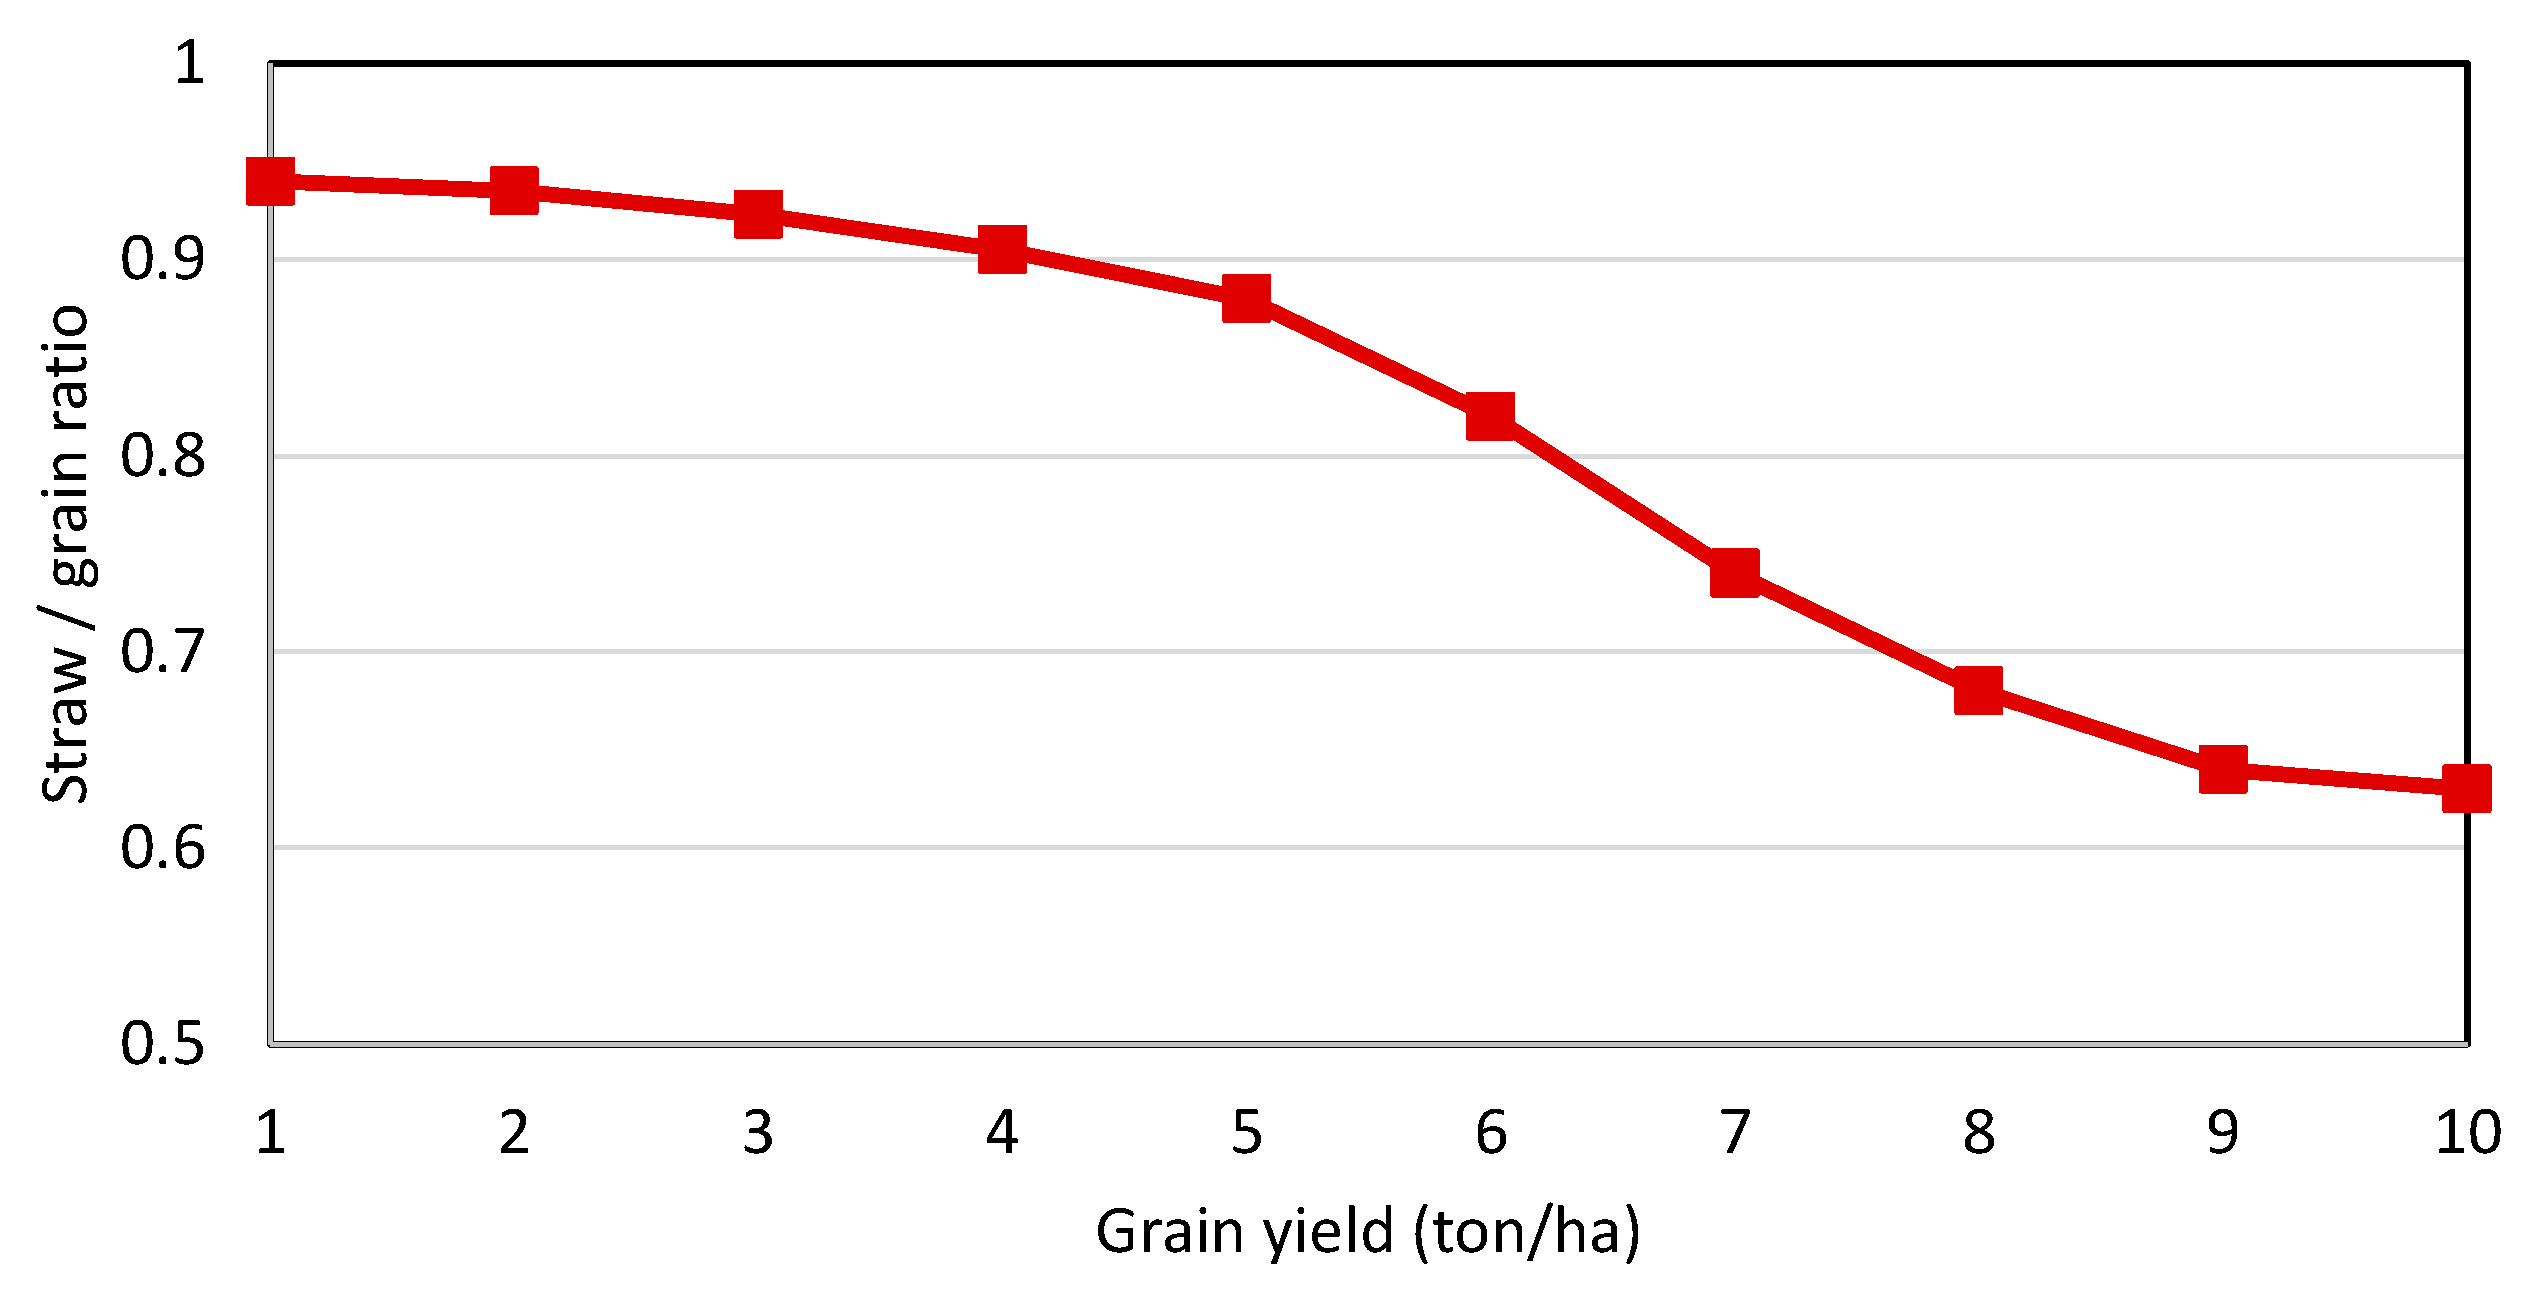
Figure 5.
Distribution of cereal straw for litter in the EU countries [21].
Figure 5.
Distribution of cereal straw for litter in the EU countries [21].


Figure 7.
Cross checks of bioeconomic potential and the thresholds (cut-off) of the plant feeding requests for cereal straw. Red line (275 kt/y) is the required amount to steady operate a 200 MWth conversion plant, for reference.
Figure 7.
Cross checks of bioeconomic potential and the thresholds (cut-off) of the plant feeding requests for cereal straw. Red line (275 kt/y) is the required amount to steady operate a 200 MWth conversion plant, for reference.

Figure 8.
Regional breakdown of the bioeconomic precautionary potential (kt/y) for cereal straw.
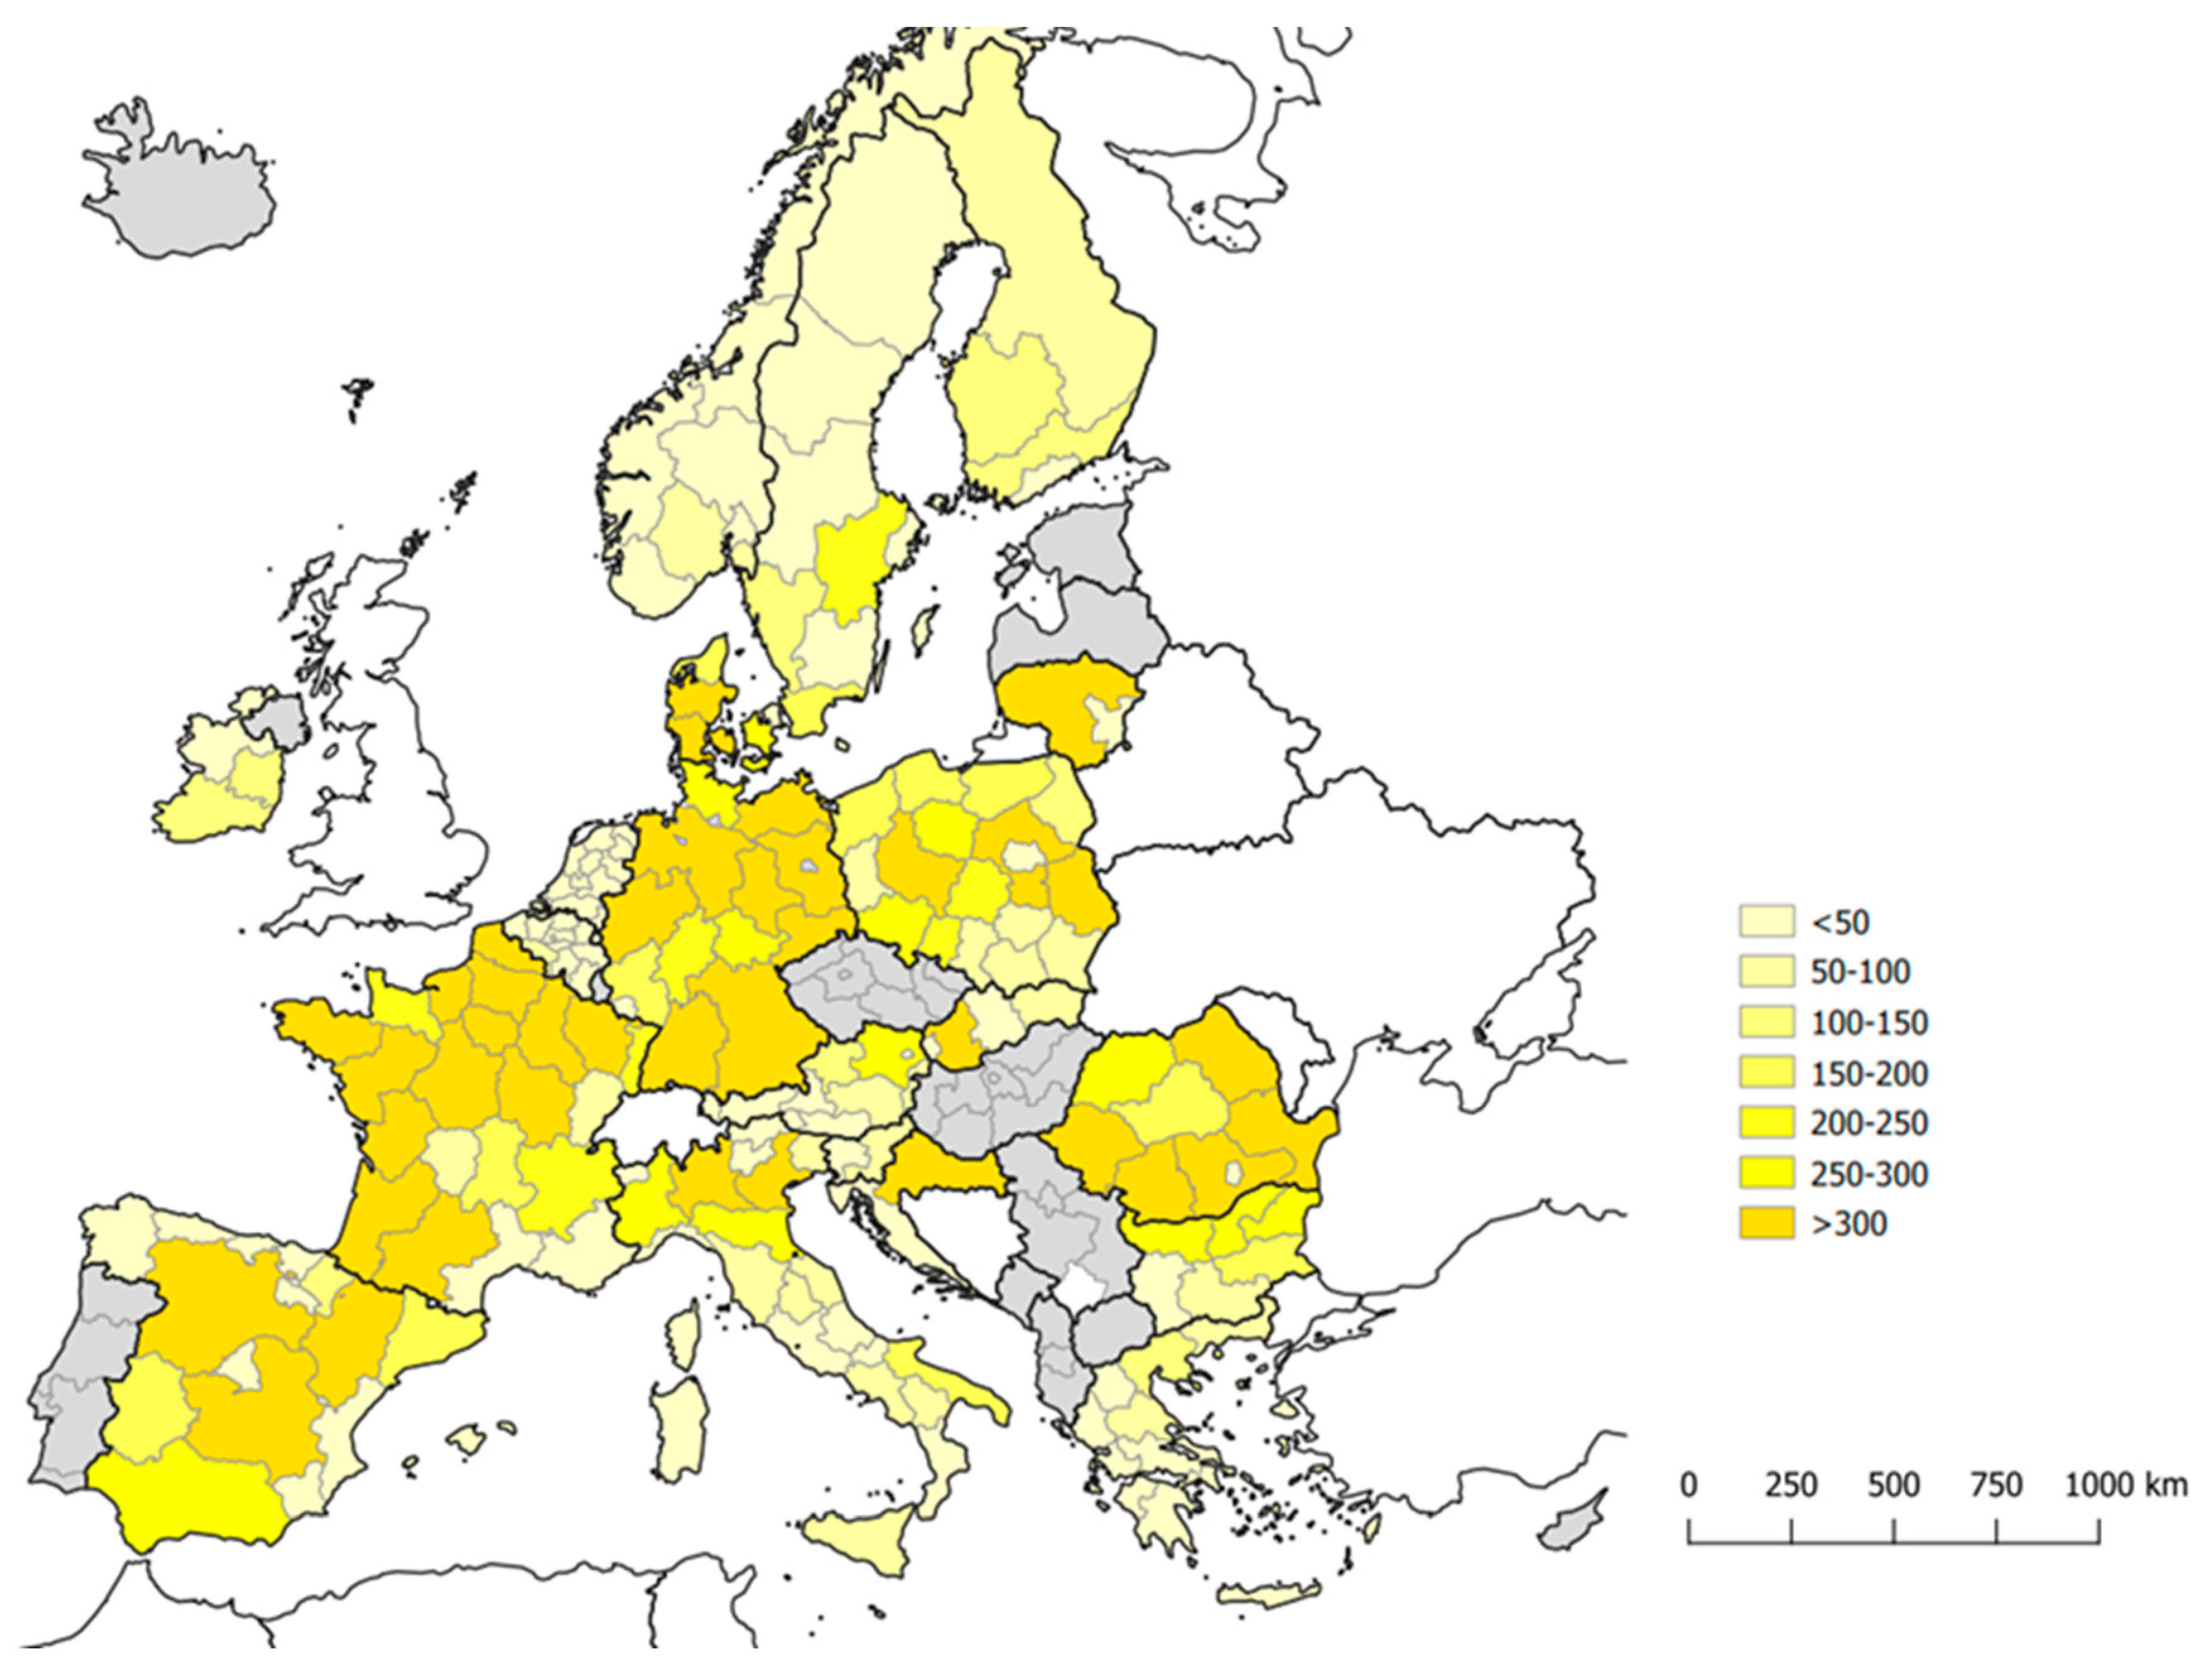
Figure 9.
Regional suitability for cereal straw. Suitability class allocation of the EU regions.
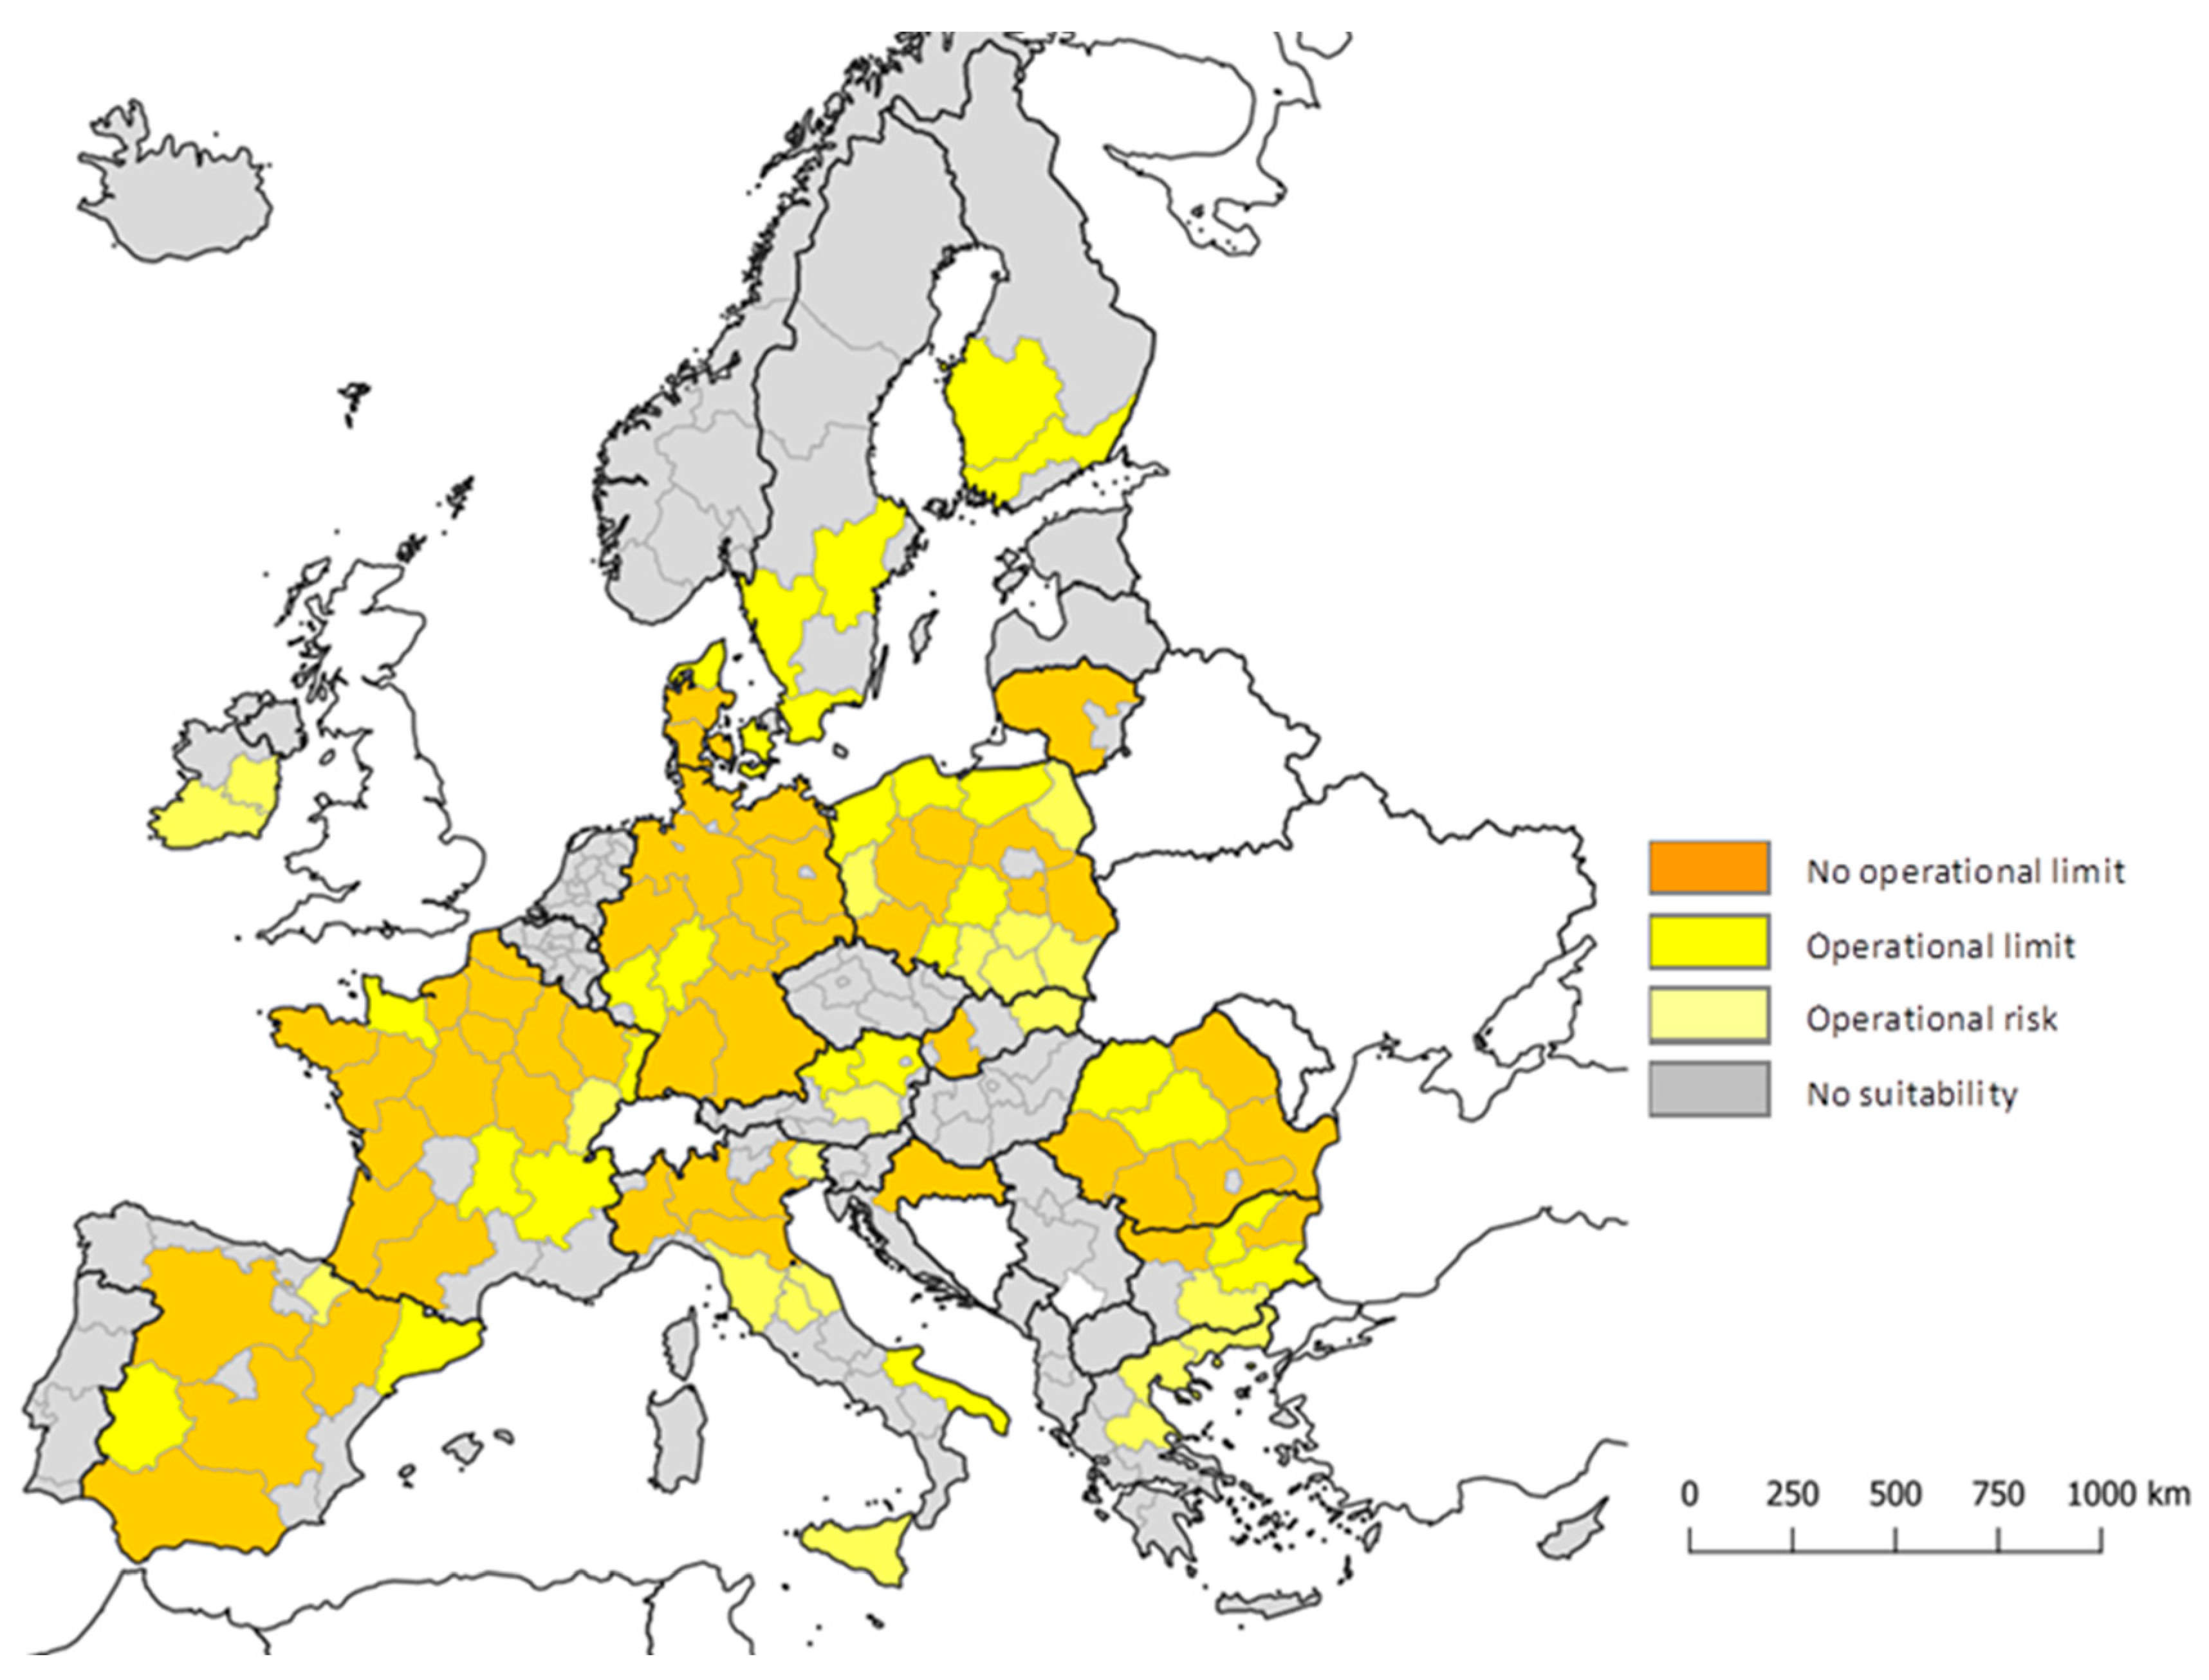
Table 1.
MCA indicators and relative scores.
| Indicator | Weight | Score | ||
|---|---|---|---|---|
| High (3) | Medium (2) | Low (1) | ||
| Second level availability | 1 | no operational limit | operational limit | operational risk |
| No. of regions | 1 | >8 | 4–8 | <4 |
| Transport complexity | 0.3 | by-product | residue | waste |
| Production seasonality | 0.3 | <8 months | 4–8 months | <4 months |
| Storage complexity | 0.3 | MC < 20% | MC 20–50% | MC > 50% |
| Biomass competition | 0.6 | low market demand | medium market demand | high market demand |
| Supply chain complexity | 0.3 | low no. of processes | medium no. of processes | high no. of processes |
| Standardization of supply chain | 0.3 | low no. of solutions | medium no. of solutions | high no. of solutions |
| Nominal plant capacity | 0.6 | >200 MW | 100–200 MW | <100 MW |
| Transport distance | 0.6 | <50 km | 50–100 km | >100 km |
| Pre-treatment necessity | 0.3 | No | size and M reduction | size or M reduction |
| Traceability complexity | 0.3 | 1 operative subject | 2–3 operative subjects | >3 operative |
| GHG emissions | 1 | transport | collection and transport | collection, transport and pre-treatments |
Table 2.
LHV, moisture (MC), ash and ultimate analysis for cereal straw.
| LHV | MC | Ash | C | H | O | N | S | Cl |
|---|---|---|---|---|---|---|---|---|
| MJ/kgdm | % | %dm | %wb | %wb | %wb | %wb | %wb | %wb |
| 18.5 | 15 | 11.4 | 43.2 | 5.0 | 39.4 | 0.61 | 0.11 | 0.28 |
Table 3.
Dry matter (DM) loss and storage moisture direct relation [26].
Table 3.
Dry matter (DM) loss and storage moisture direct relation [26].
| Storage Moisture Content | Dry Matter Loss |
|---|---|
| 11 to 20% | 4.50% |
| 20 to 25% | 7.90% |
| 25 to 34% | 10.90% |
Table 4.
Costs and CO2 emissions regarding the supply of cereal straw (DM content 86%; bulk density 0.13 mg/m3—square bales) [27].
Table 4.
Costs and CO2 emissions regarding the supply of cereal straw (DM content 86%; bulk density 0.13 mg/m3—square bales) [27].
| Transport Distance a) (km) | Means of Transport | Supply Costs (€/Mg DM) | CO2 Emissions (kg CO2,eq/Mg DM) | ||
|---|---|---|---|---|---|
| a Total of | Thereof for Transport | a Total of | Thereof for Transport | ||
| 10 | Tractor | 65 | 12 | 11 | 3 |
| 30 | 71 | 18 | 14 | 6 | |
| 30 | Truck | 75 | 22 | 16 | 8 |
| 100 | 87 | 34 | 29 | 21 | |
| 250 | 110 | 57 | 58 | 50 | |
| 100 | Rail a | 113 | 60 | 21 | 13 |
| 250 | 134 | 81 | 28 | 20 | |
| 100 | Ship a | 97 | 44 | 26 | 18 |
| 250 | 105 | 52 | 33 | 25 | |
| 800 | 134 | 81 | 59 | 51 | |
a This includes a pre-carriage with truck: for rail 30 km; for ship 50 km.
Table 5.
Straw for energy, power plants and quantity of straw (kilotons). CHP means combined heat and power [20].
Table 5.
Straw for energy, power plants and quantity of straw (kilotons). CHP means combined heat and power [20].
| Countries | Straw (kt) | Plants |
|---|---|---|
| Denmark | 110 | 55 district heating and CHP plants |
| Sweden | 135 | 8 district heating and CHP plants + 1 large power plant |
| Spain | 160 | 1 large power plant |
| Poland | 5 | 2 boilers |
| Hungary | 270 | 1 large power plant |
| UK | 200 | 1 large power plant |
| France | 6 | 2 boilers |
| Total | 1900 |
Table 6.
Synthesis of the results for cereal straw potentials.
| Cereal Straw | Country | Theoretical Potential | Technical Potential | Bioeconomic Potential JRC | Precautionary Scenario (45%) | Precautionary Scenario (10%) |
|---|---|---|---|---|---|---|
| Central Europe | France | 39,833.85 | 26,688.68 | 16,730.22 | 7528.60 | 1673.02 |
| Germany | 27,794.80 | 18,622.51 | 11,673.81 | 5253.22 | 1167.38 | |
| Poland | 17,873.15 | 11,975.01 | 7506.72 | 3378.03 | 750.67 | |
| Romania | 15,592.16 | 10,446.74 | 6548.71 | 2946.92 | 654.87 | |
| Hungary | 9308.02 | 6236.37 | 3909.37 | 1759.22 | 390.94 | |
| Bulgaria | 5862.80 | 3928.08 | 2462.38 | 1108.07 | 246.24 | |
| Serbia | 5437.14 | 3642.88 | 2283.60 | 1027.62 | 228.36 | |
| Czechia | 4876.19 | 3267.05 | 2048.00 | 921.60 | 204.8 | |
| Austria | 3145.51 | 2107.49 | 1321.11 | 594.50 | 132.11 | |
| Slovakia | 2532.56 | 1696.81 | 1063.67 | 478.65 | 106.37 | |
| Bosnia and Herz. | 901.47 | 603.98 | 378.62 | 170.38 | 37.86 | |
| Switzerland | 549.53 | 368.19 | 230.80 | 103.86 | 23.08 | |
| Slovenia | 375.90 | 251.85 | 157.88 | 71.05 | 15.79 | |
| Mediterranean Europe | Spain | 13,794.66 | 9242.42 | 5793.76 | 2607.19 | 579.38 |
| Italy | 10,652.26 | 7137.02 | 4473.95 | 2013.28 | 447.4 | |
| Greece | 2129.84 | 1426.99 | 894.53 | 402.54 | 89.45 | |
| Croatia | 1905.32 | 1276.56 | 800.23 | 360.11 | 80.02 | |
| Portugal | 726.38 | 486.68 | 305.08 | 137.29 | 30.51 | |
| Albania | 435.59 | 291.85 | 182.95 | 82.33 | 18.29 | |
| North Macedonia | 339.18 | 227.25 | 142.45 | 64.1 | 14.25 | |
| Scandinavia | Denmark | 5584.18 | 3741.40 | 2345.35 | 1055.41 | 234.54 |
| Sweden | 3260.59 | 2184.60 | 1369.45 | 616.25 | 136.94 | |
| Finland | 2120.25 | 1420.57 | 890.51 | 400.73 | 89.05 | |
| Norway | 803.85 | 538.58 | 337.62 | 151.93 | 33.76 | |
| North Seas | Lithuania | 3168.68 | 2123.02 | 1330.85 | 598.88 | 133.08 |
| Latvia | 1636.64 | 1096.55 | 687.39 | 309.33 | 68.74 | |
| Belgium | 1630.59 | 1092.49 | 684.85 | 308.18 | 68.48 | |
| Ireland | 1363.55 | 913.58 | 572.69 | 257.71 | 57.27 | |
| Netherlands | 884.26 | 592.45 | 371.39 | 167.12 | 37.14 | |
| Estonia | 734.55 | 492.15 | 308.51 | 138.83 | 30.85 | |
| Luxembourg | 97.73 | 65.48 | 41.05 | 18.47 | 4.10 | |
| TOTAL | 185,351.18 | 124,185.29 | 77,847.49 | 35,031.37 | 7,784.75 |
Table 7.
Straw feedstock requirements on the basis of types of biomass and plant capacity.
| Parameter | Unit | System Simulation | Case 1 | Case 2 |
|---|---|---|---|---|
| Plant power | MWth | 10 | 100 | 200 |
| Plant operation | h | 8400 | 8400 | 8400 |
| Energy requirements | TJ/y | 197 | 1969 | 3937 |
| Straw MC | % | 35 | 35 | 35 |
| LHV | MJ/kg | 13.11 | 13.11 | 13.11 |
| Feedstock | kt/y | 15 | 150 | 300 |
Table 8.
MCA scoring of the cereal straw supply chain in the investigated districts.
| Region Indicator | Scandinavian | Central European | Mediterranean | Hanseatic |
|---|---|---|---|---|
| 2nd level availability | 3 | 3 | 3 | 2 |
| Number of most promising regions | 1 | 3 | 2 | 1 |
| Transport complexity | 2 | 2 | 2 | 2 |
| Production seasonality | 1 | 1 | 1 | 1 |
| Storage complexity | 2 | 3 | 2 | 3 |
| Biomass competition in the geographical region | 2 | 3 | 3 | 1 |
| Supply chain complexity | 2 | 2 | 2 | 2 |
| Standardization of the supply chain | 3 | 3 | 3 | 3 |
| Nominal capacity of the plant | 3 | 3 | 3 | 2 |
| Average total transport distance | 2 | 1 | 2 | 2 |
| Pre-treatment necessity | 2 | 2 | 2 | 2 |
| Traceability complexity and certification costs | 2 | 2 | 2 | 2 |
| GHG emissions due to supply chain complexity | 1 | 1 | 1 | 2 |
| Total score | 26 | 29 | 28 | 25 |
| Weighted total score | 13.4 | 15.7 | 15.0 | 12.5 |
Publisher’s Note: MDPI stays neutral with regard to jurisdictional claims in published maps and institutional affiliations. |
© 2022 by the authors. Licensee MDPI, Basel, Switzerland. This article is an open access article distributed under the terms and conditions of the Creative Commons Attribution (CC BY) license (https://creativecommons.org/licenses/by/4.0/).
Share and Cite
MDPI and ACS Style
Ugolini, M.; Recchia, L.; Guandalini, G.; Manzolini, G. Novel Methodology to Assess Advanced Biofuel Production at Regional Level: Case Study for Cereal Straw Supply Chains. Energies 2022, 15, 7197. https://doi.org/10.3390/en15197197
AMA Style
Ugolini M, Recchia L, Guandalini G, Manzolini G. Novel Methodology to Assess Advanced Biofuel Production at Regional Level: Case Study for Cereal Straw Supply Chains. Energies. 2022; 15(19):7197. https://doi.org/10.3390/en15197197
Chicago/Turabian StyleUgolini, Marco, Lucia Recchia, Giulio Guandalini, and Giampaolo Manzolini. 2022. "Novel Methodology to Assess Advanced Biofuel Production at Regional Level: Case Study for Cereal Straw Supply Chains" Energies 15, no. 19: 7197. https://doi.org/10.3390/en15197197
Note that from the first issue of 2016, this journal uses article numbers instead of page numbers. See further details here.