
Impact of Exposure to Supercritical Carbon Dioxide on Reservoir Caprocks and Inter-Layers during Sequestration
1
Department of Chemical and Environmental Engineering, Faculty of Engineering, University of Nottingham, University Park, Nottingham NG7 2RD, UK
2
Geo-Energy Research Centre, University of Nottingham, University Park, Nottingham NG7 2RD, UK
*
Author to whom correspondence should be addressed.
Energies 2022, 15(20), 7538; https://doi.org/10.3390/en15207538
Submission received: 14 September 2022
/
Revised: 4 October 2022
/
Accepted: 6 October 2022
/
Published: 13 October 2022
(This article belongs to the Section B3: Carbon Emission and Utilization)
Abstract
:The long-term exposure of rocks to supercritical carbon dioxide (scCO2) during sequestration creates structural and chemical changes. In turn, these lead to changes in the permeability of inter-layers and caprocks that can alter plume migration behaviour and/or lead to the loss of the sealing efficiency of caprocks. This review first surveys experimental studies of changes to the pore structure and mass transport properties of caprocks and interlayers, including novel experimental protocols and data analysis methods. These methods provide more accurate measures of basic parameters, such as surface area, as well as new information on pore network features that are essential to properly understanding changes to mass transport properties. The subsequent evolution of rocks exposed to scCO2 involves a complex coupling of geomechanics, geochemistry, and mass transport processes over different length and time scales. The simultaneous combination of all three factors together is rarely considered and this review also surveys such fully integrated work to understand the complex interplay and feedback arising between the different processes. We found that it was necessary to include all three coupled processes to obtain truly representative behaviour in reservoir simulations; otherwise, counter-intuitive effects are missed. These include the unexpected greater sealing efficiency of thin shale layers.
1. Introduction
One of the major causes of global warming is the excessive emission and accumulation of greenhouse gases in the atmosphere, especially carbon dioxide (CO2). One of the methods to control the increase in global temperature is CO2 storage in subsurface geological formations. This method has been in practice since the early 1970s [1]. Knowledge concerning mature technologies has been gained from the injection and storage of CO2 from many existing enhanced oil recovery and acid gas projects [2,3]. In addition, several commercial sequestration projects are functioning nowadays, such as the Sleipner, Weyburn, and In Salah projects, and these indicate that it is feasible to store CO2 in geological formations as a promising solution for reducing CO2 emissions to the atmosphere [4]. The geological formation should have certain characteristics, including that the depth should be greater than 800 m below the ground surface, with acceptable porosity and permeability to store a significant amount of CO2. Additionally, for the CO2 to be stored safely for thousands of years, it is necessary for the storage formation to have an overlying impermeable confining layer, commonly referred to as caprock or seal. The main geological storage units that have the aforementioned features are depleted oil and gas reservoirs and, in addition, deep saline formations [5].
CO2 sequestration is not a straightforward process, since challenges may arise during CO2 storage such as maintaining the integrity of an impermeable caprock layer. Caprocks generally fall into three main types: (i) argillaceous rocks, which are highly compacted clays, shales, or mudstones; (ii) consolidated clastic rocks, which have been compacted and highly cemented due to long-term diagenesis; and (iii) evaporites, which are precipitated chlorides, sulphates, and carbonates [6]. The caprock provides a seal against the upwards leakage of free CO2 or CO2-saturated reservoir brine, caused by the buoyancy force, into the overlying strata and back to the atmosphere. The rise of buoyant supercritical (sc)-CO2 plumes is expected to continue for centuries, if not thousands of years, until the CO2 eventually dissolves into the formation brine. The generally accepted target for the allowable leakage rate is that it should be limited to <1% [6].
As shown schematically in Figure 1, in this review we first survey previous experimental work considering the geochemical interactions of CO2 with caprocks and inter-layers, and the resulting evolution of the mineralogy, pore structure, and transport properties, with special attention paid to work on the caprock of the Sleipner field, namely, the Nordland shale. This survey also highlights areas where conflictual findings have been obtained concerning the apparent changes to rocks following exposure to scCO2 due to the limitations of the structural characterisation methods used. We then go on to describe novel or rarely-used rock core characterisation techniques that have recently been shown to resolve some of the conflictual findings that have emerged from the said experimental geochemical studies, but which are not generally discussed in the literature in this area. Finally, in this review we consider field-scale, reservoir simulations of scCO2 sequestration that include flow, geochemical, and geomechanical phenomena in various combinations, with a view to demonstrating the need to include all three in order to obtain truly physically representative field-scale simulations that can include all effects, including counter-intuitive ones, that would be unanticipated without the comprehensive simulation of the sequestration processes. The importance of considering all three coupled processes is rarely examined. However, this review does not cover the influence of coupled heat-flow processes in detail, as the temperature variation in the types of reservoirs considered is relatively low. This work also does not consider applications of machine learning to reservoir simulation and optimisation, but more details on this approach can be found elsewhere [7,8,9,10,11,12].
Therefore, this review was constructed in three main sections, with the first two considering pore- and core-scale phenomena, and the third section examining reservoir-scale phenomena. The first section describes work on the interactions of scCO2 with rocks, with special emphasis on the evolution of the pore structure. The second section describes new rock core characterisation methods and how they can resolve the issues highlighted in the first section. The third section considers reservoir-scale work.
1.1. Interaction of Supercritical Carbon Dioxide with Rocks
Understanding the geochemical interactions between supercritical CO2 (scCO2) and shale is essential when assessing the viability of potential CO2 storage reservoirs where shale is used as a seal [13]. Changes in porosity and the pore network can lead to increased permeability over time. If the nature and scale of interactions are large enough, there is a possibility that shale caprock integrity can be compromised [14]. This area of research is also of importance to enhanced hydrocarbon recovery (e.g., EOR) projects, which use scCO2 to mobilise residual hydrocarbons [15,16]. Another industry which could likewise be affected is hydraulic fracturing, where water and CO2 are used as agents in contact with hydrocarbon-rich shale. The efficiency of this process can be favourably or adversely affected [17,18].
In this section, a targeted overview of possible rock interactions caused as a result of CO2 injection, and where they may occur, is presented. This is followed by a summary of previous investigations into specific singular minerals. Whole shale sample studies are then assessed. These reactions are extremely site-specific, and depend on the particular mineralogy, pore water chemistry, and in situ pressure and temperature [14]. Consequently, our focus is on minerals/shales and conditions which are similar to those found in the Sleipner system, which is used as a key example. Experimental procedures, analysis tools used, and resulting changes in mineral composition are discussed. Finally, the limited previous experiments into scCO2/shale interactions on Sleipner Nordland shale caprock itself are evaluated.
1.2. Overview
Mineralogical reactions are highly complex, and are the result of interdependent thermodynamic, kinetic, flow, and transport processes [14]. As described by Gaus [19], CO2–rock interactions can occur in a number of different locations. Figure 2 summaries these scenarios, which include contact between the injected CO2 and well materials, longer-term interactions between host rock and cap rock, leakage scenarios, and engineering practices which deliberately immobilise CO2. In the case of Sleipner, the storage reservoir is not breached by any old production wells, which could potentially form leakage pathways. Karstens et al. [20] investigated possible leakage through high-permeability chimneys in the caprock, but determined that the locations of these structures were too far from the injection point to be of any danger.
CO2 injection can create several different reaction phases. Each interact differently with the rock and tend to occur in different locations. These phases are:
- CO2 dissolved in brine;
- Dry CO2;
- Wet CO2 (brine water dissolved in CO2 phase); and
- Concentrated brine (due to the dissolution of dry scCO2 into brine water).
A brief description of each phase is given below; however, contact between scCO2 and the Sleipner reservoir shale interlayers is thought to be in the dry/wet CO2 phase. Therefore, these interactions are the main focus of the review.
1.3. Supercritical Carbon Dioxide (scCO2) Dissolved in Brine
Most experimental and modelling studies concerning mineral transformations in carbon storage reservoirs focus solely on scCO2 dissolved in brine [21]. CO2 can bond with water to produce carbonic acid (H2CO3), lowering the pH level:
CO2 + H2O ⇋ H2CO3
As the carbonic acid adsorbs to the shale surface, it can dissociate into H+ and HCO3−. In the presence of H+, some carbonate and/or silicate mineral components in the rock will react further, causing dissolution and corrosion. These reactions increase the pH level again (this is known as pH buffering). Mineral dissolution can increase the pore space volume; however, precipitation of new clays and secondary carbonates can occur, thereby reducing this again. The specific pore size ranges, which increase and then decrease in volume, do not necessarily overlap, and can potentially decrease reservoir permeability [22,23]. The magnitude of these processes, as well as the pore size ranges affected, depends on the mineral content of the shale [24,25]. This mineralisation of injected CO2 is desirable as a long-term trapping mechanism.
The reactivity of the system also depends on the maximum concentration of CO2 in the solution. The solubility is dependent on temperature and pressure. When modelling reaction networks, corrections are needed for the activity for dissolved species and density through the use of Pitzer’s formalism [26]. A model constructed by Duan and Sun [27] showed that solubility increases with temperature and pressure, ranging from 1–2 mols CO2/kg water for typical reservoir conditions. The rate of dissolution also varies with temperature, pressure, salinity, and the impurities present. The largest uncertainty comes from how much brine is in contact with the CO2 plume. This depends on four factors, as laid out by Hovorka and Lu [24]:
- -
- The geometry of the plume front and saturation within the plume (contact surface area);
- -
- Plume migration before becoming stable;
- -
- The presence of any hydrological flows within the reservoir; and
- -
- The development of convection currents due to brine densification when scCO2 is dissolved.
Field case studies have provided some information on the relative importance of these factors, but the research is incomplete [26].
1.4. Dry and Variably Wet scCO2
Dry and variably wet CO2–rock interactions have historically been overlooked, and, among the limited investigations, most are directed at host rock, rather than caprock, reactivity [28,29,30,31]. However, a number of recent studies have shown this CO2-rich phase to be geochemically significant [21]. Within the traditional carbon storage environment, these interactions occur in two scenarios. The first is close to the wellbore and within the host rock, and the second is at the caprock interface where migrated CO2 will accumulate. In the case of Sleipner, accumulation occurs within the body of the reservoir as well as at the upper limit due to the shale interlayers. Dry and variably wet CO2–rock interactions also have the potential to occur within the interlayers themselves.
Wet scCO2 can react with metal silicates, such as feldspars, to form carbonate minerals. A possible reversible reaction of this type, which might also be seen in the Sleipner caprock, is:
where NaAlSi3O8 (felspar: albite), NaAl(CO3)(OH)2 (dawsonite), and SiO2 (silicon dioxide) are solids, CO2 is a gas, and H2O is either as gas or liquid. The new products will precipitate on the surface of the rock and on the walls of the pores [32]. Dry scCO2 reactions can also occur via this process due to water occurring within the mineral structures themselves [33].
NaAlSi3O8 + CO2 + H2O ⇋ NaAl(CO3)(OH)2 + 3SiO2
Adsorption partitioning of water, from wet scCO2 to silicate surfaces in the host rock, can lead to the formation of films of water, which can facilitate carbonation [21]. The water film can acidify via CO2 dissolution, as described previously, thereby enabling the formation of bicarbonate ions, metal cation dissolution, and carbonation, followed by the precipitation of secondary minerals [34].
The variably wet CO2-rich phase is expected to reach the caprock, resulting in salt precipitation and mineral dehydration. Drying out of swelling clays such as smectites can cause shrinkage, resulting in fracturing and therefore creating higher-permeability leakage pathways in the seal [19]. However, these fractures may ‘self-heal’ after the scCO2 phase becomes saturated with brine and the clays rehydrate. Variably wet CO2–shale interactions are the focus of this review, and further detail relating to mineral reactions found in the Sleipner caprock are presented below.
1.5. Concentrated Brine
During injection, the creation of concentrated brine with high ionic strengths can occur in the direct vicinity of the well. This is a consequence of high dry-CO2 flux, which dissolves into the brine. Although not part of this review, this new brine phase is out of chemical equilibrium with the host rock and can induce precipitation reactions of kinetically fast reactions such as carbonates, sulphates, and evaporites. These reactions are dependent on the magnitude of dissolution and the initial brine composition [19].
1.6. Kinetics of Interactions with Rocks
However thermodynamically favourable an scCO2-rock reaction may be, its significance and impact will depend upon the speed at which it occurs [19]. When assessing the importance of particular reactions, the rate at which they happen must be compared with the timescales for geological storage, taking into account the changing phases and migration of the CO2 plume. Most carbonates, and certain sulphates, can react at rates high enough to be measured directly in the laboratory when exposed to CO2 dissolved in brine. Equilibrium can be reached within a couple of hours at ambient temperatures. Models of dissolution/precipitation rates in CO2 storage generally follow the simplified law given by [35]:
where m is the mineral index, A is the reactive surface per kg water, k(T) is the temperature-dependent rate constant, is the proton activity, n is the order of the reaction (0 < n < 1), K is the equilibrium constant for the mineral water reaction written for the dissolution of 1 mol of mineral, and Q is the corresponding ion activity product. Positive rate values indicate dissolution and negative values indicate precipitation [19].
The reactive surface area and kinetic rate constant are both sources of large error. Based on the assumptions regarding the geometry, or basic BET surface area calculations, the mean estimated values of the parameter Am can vary widely. Methods that provide more accurate surface area measurements for systems as chemically heterogeneous as rocks will be discussed in more detail below. The kinetic rate constant is similarly hard to quantify. Laboratory-based measurements of silicate reactions have been found to be 2–5 orders of magnitude faster than when measured in situ [28].
1.7. Link to Porosity and Permeability
It is well understood that geochemical reactions of the kind described in this section have the ability to change the porosity and permeability of the host or caprock. Only minute amounts of secondary mineral precipitation can change the geometry of the hydraulic capillaries [19]. Linking forecast reactions with actual value changes remains a challenging task, however. The simulation of coupled flow and geochemical reactions is discussed in more detail below.
1.8. Experimental Studies of Mineral Reactions
In this section, individual mineral reactions with variably wet CO2 are first discussed, followed by relevant shale (multi-mineral) interactions. Only minerals found in Nordland shale, according to the literature, are included. The majority of literature investigating non-aqueous CO2/shale interactions comes from the perspective of hydraulic fracturing. CO2 can be used to create the fractures necessary to produce hydrocarbons from low-permeability rocks.
1.9. Single Mineral Interactions
1.9.1. Illite
Illite is a silicate mineral and is the most abundant in many mudrocks. This clay group phyllosilicate is a layered alumino-silicate, structured in such a way that poorly hydrated potassium cations occupy the space between sheets. This inhibits swelling, meaning that illite classified as a non-expanding clay mineral. This property is important when considering the potential of dry CO2 to induce shrinkage/swelling of clay minerals.
Dissolved CO2, which forms carbonic acid, can cause carbonate precipitation in clay minerals. Illite can react with dissociated ions in the following way [36]:
1.9.2. Mica
Biotite is also a phyllosilicate, but belongs to the trioctahedral mica group. This group has been studied in relation to wet scCO2 reactions by various authors [21]. An investigation by Shao et al. [40] focused on phlogopite and showed no carbonation following treatment with water-saturated scCO2 at 103 bar and 95 °C for 159 h. Dissolution pits, and secondary precipitation of silica and kaolinite were observed, however. These results were in agreement with an experiment on muscovite conducted by Bryan et al. [41], who observed the same dissolution pits and secondary precipitation after a 14 day treatment in water-saturated scCO2 at 50 °C and 138 bar. Again, carbonation was not observed. The formation of kaolinite in these experiments is significant as there is a potential for detachment. This can in turn cause the migration of fines and pore throat blocking [42].
1.9.3. Feldspars
Orthoclase is a “framework” silicate mineral (tectosilicate) of the alkali (potassium) feldspar group. As is typical, this mineral is found in conjunction with the plagioclase feldspar albite. This intergrowth of two feldspars is called perthite. Due to the high content of alkali and alkaline earth metals found in these minerals, their potential for carbonation is high [21]. Plagioclase feldspars such as albite have been seen to be the most reactive crystalline phase in basalt and granite host formations [43,44]. Reversable reactions of K-feldspar and plagioclase with dissociated ions are [32]:
Wet CO2 treatment (14 days at 50 °C and 138 bar) experiments on albite conducted by Bryan et al. [41] showed dissolution features and the suspected precipitation of silica and phyllosilicates. A similar result was seen by Regnault et al. [45] when investigating another plagioclase feldspar, anorthite. Again, the authors found feldspar dissolution and phyllosilicate precipitation following exposure to wet CO2 for 60 days at 200 °C and 10.5 MPa.
Loring et al. [21] studied the carbonation of a plagioclase sample (labradorite) using in situ IR. These authors carried out four experiments, which were conducted with varying amounts of water present in the CO2 (values relative to saturation). The sample was held at 50 °C and 90 bar and IR measurements were taken every 3 h up to 24 h. Between 1466 and 1520 cm−1, asymmetric C-O stretching bands appeared on all but the 0% H2O sample. This is an indication of mineral carbonation [46,47], with calcite and minor amounts of sodium carbonate being the most probable product [21]. A dependence with time was also seen. When H2O was present, H-O-H bending was observed at circa 1640 cm−1, which also coincided with O-H stretching between 3000–3500 cm−1. This suggested that a thin H2O film was forming on the mineral surface. This film increased reactivity as it acted as a solvate, transporting ions to the mineral surface. Plagioclase dissolution and the precipitation of silica were shown by the negative net absorbance and subtle peaks between 750–1400 cm−1. Here, v2 bending and Si-O stretching bands indicated precipitation and dissolution, respectively [21]. The extent of reaction was estimated at 0.3% for the excess water sample, determined using the net change in absorbance at 958 cm−1. Similar features were found in experiments using anorthite and albite. The extent of reaction of albite was estimated at 0.5%. For this evaluation, a peak at c. 760 cm−1 was used, corresponding to Al-O-Si symmetric stretching modes. These bands are negative due to the dissolution of feldspar.
Loring et al. [21] also investigated the potassium feldspar microcline. The sample was obtained under the same conditions with varying water saturation levels. Only at excess water saturation was evidence for mineral carbonation and a large adsorbed H2O film seen, signalling that this film layer is necessary to initialise reactions. Some carbonation was seen at 75% water saturation, but Loring et al. [21] suggested that a thicker water film may be needed to sustain the reactions. Feldspars seem largely unreactive in dry scCO2, but with a thick enough film carbonic acid can form. This then dissociates to a hydrated proton and bicarbonate. Proton-promotion occurs with the metal silicate mineral, dissolving it [21].
1.9.4. Quartz
Another member of the tectosilicate grouping is the 3D-silicate mineral quartz. According to Liu et al. [15] and Kaszuba et al. [48], this hard, crystalline mineral does not readily react in the presence of CO2. Even dissolved CO2, which reduces the pH of the brine, has little effect on this mineral. Quartz grains do, however, provide a surface on which precipitation can occur. The kinetics of quartz dissolution is slow; therefore, this reaction is only seen in experiments performed over long periods of time [49] or at higher temperatures.
1.10. Shale Interactions (Multi-Mineral)
A series of three studies have recently been published by the same group investigating dry-CO2 interactions with Utica shale and evaluating the role water plays in these reactions [13,25,50]. In general terms, the minerology of the inorganic Utica shale is around 50% calcite, 20% clays (illite/mica/small amounts of kaolinite), 15% quartz, and 15% other (plagioclase/dolomite/pyrite) [51].
Sanguinito et al. [50] and Goodman et al. [13] identified and quantified chemical and physical alterations at the molecular scale and microscale. They also examined the surface interactions of two primary constituents of the shale: clays (illite-smectite, illite, chlorite, and kaolinite) and kerogen. Investigative tools used before and after exposure included FTIR, SEM, and N2, and CO2 adsorption. FTIR scans were conducted at 40 °C and at a series of CO2 pressures from 0.25 to 8.2 MPa. Scans were periodically conducted until the IR spectra stabilised. This took between 7 and 15 days. All other post-exposure experiments were performed on samples held at 40 °C and 10.3 MPa for 14 days.
The FTIR results showed that carbonate bands increased in intensity after CO2 exposure. This happened rapidly within the first 15 min, and the magnitude of the observed change was proportional to CO2 pressure. Sanguinito et al. [50] suggested that carbonate precipitation and dissolution (mostly calcite) occurred until equilibrium was established. Etching and pitting in the calcite matrix, with minor calcite precipitation, were also observed using FE-SEM. This appeared to increase macro-porosity. Quartz and pyrite grains were unaffected.
Using adsorption isotherm data for Utica shales, Sanguinito et al. [50] found that the standard BET (total) surface area measured for isotherm data from the so-called BET region (see below) remained relatively stable. However, quenched solid density functional theory (QSDFT) analysis, based on slit/cylindrical pores, performed on the same nitrogen isotherms, showed that the surface area and volume were largely just in the micropores, but that a substantial decrease in these parameters occurred after exposure to CO2. QSDFT-based analysis was additionally used to measure mesopore volume, and no significant change was seen in this range. Non-local density functional theory (NLDFT) was used to analyse CO2 absorption data to determine the volume and size distribution of ultra-micropores. Again, only very small changes were recorded in this range. DFT-calculated isotherms fitted the experimental data very well, with a maximum of 1% error. However, the apparently conflictual findings obtained by the different analysis methods for the adsorption data suggested the need for more accurate void space descriptors, which was addressed in subsequent work, as described below. Interestingly, CO2 adsorption on individual clay constituents demonstrated higher uptakes than those seen for the Utica shale sample itself (see Figure 3). This finding indicated that the constituents in the shale were inaccessible to CO2 even when the shale was ground to a fine powder.
Sanguinito et al. [50] concluded that, although research into the interactions of dry-CO2 with rocks is very limited, their experiments showed that reactions did occur with the kerogen and clay components of shale. Etching on the Utica shale surfaces showed cycling between carbonate dissolution and precipitation. These authors suggested that this is likely enabled by water retained in the interstitial pore space and matrix. Finally, they stated that, although adsorption takes place in mesopores and micropores, the mesopores may only be accessible through the narrow micropores. Similar suggestions have been made concerning an ‘hourglass-type’ geometry for the void space of Bowland shale based upon a comparison of mass transfer rates from mass uptake and adsorption calorimetry methods, which are discussed in more detail below. Sanguinito et al. [50] also found that decreases in the micropore surface area and volume after exposure to CO2 indicated possible alterations of the permeability and the fracture network.
Goodman et al. [13] conducted experiments in which shale rock was also exposed to wet CO2. Autoclave vessels were used to treat the samples with either dry scCO2 or a mixture of CO2 and water. For both types of treatment, the vessels were held at 40 °C and 10.3 MPa for 14 days. In the mixture treatment, samples were submerged in 100 mL of ultrapure water. A water-only treatment was also performed for comparison. Goodman et al. [13] found that the addition of water acted as a blocking agent between the CO2 and the sample. Interactions were no longer direct, but were primarily due to the dissolved CO2 lowering the pH level of the water layer. This was indicated by the presence of an absorption band centred at 2342 cm−1 in the FTIR spectrum. In general, the presence of water acted to exacerbate effects seen previously by Sanguinito et al. [48]. FE-SEM showed increased signs of etching and pitting in the calcite matrix, with calcite precipitation. Redistribution of calcite can occur when it has been dissolved and then transported within the aqueous phase. Adsorption experiments showed a further decreasing trend for the BET surface area, micropore surface area, and volume, between approximately 0.9 and 2 nm. However, the volume of mesopores increased due to carbonate dissolution.
More recent work by Goodman et al. [25] examined how fluids interact in the natural fractures and matrix pores of Utica shale. Two samples were tested; one from an outcrop in New York state and the other from a natural gas production zone in Eastern Ohio (from a depth of 3259 m). Both shale samples were largely inorganic carbonate, but the ‘production’ shale had c. 5% TOC. Several characterisation techniques were used to study the shales both before and after treatment. These included field emission-scanning electron microscopy (FE-SEM), CO2 and N2 sorption isotherms, mercury intrusion porosimetry, and small-angle X-ray scattering (SAXS) methods. The results showed pores both opening at the microscale and closing at the nanoscale, depending on their pore type and size classification. Etching and pitting were seen in FE-SEM results following both dry and wet CO2 treatments. Goodman et al. [25] found changes at the micropore scale due to carbonate dissolution and precipitation. An analysis of the region of pores with sizes between 1000 nm and 15,000 nm showed that their porosity increased from 1.8% to 7.6% following treatment with dry CO2, and up to 33% following treatment with wet CO2. These changes were associated with both intraparticle and interparticle pores within the mineral matter and natural fractures as carbonate was dissolved.
Pore volumes and pore size distributions in the shale were examined following treatment using a combination of CO2 and N2 sorption isotherms, as well as mercury intrusion porosimetry. Other metrics, such as bulk density, apparent density, and BET surface area, were also calculated. The sorption methods used were in the same way as described earlier for Sanguinito et al. [50]. The particular mercury contact angle used was not reported, nor was any comparison made between mercury porosimetry data and nitrogen desorption, which should be equivalent invasion percolation processes. The surface area (SA) was found to decrease following treatment in all cases. However, as seen in Figure 4, different pore size ranges reacted differently after treatment. Goodman et al. [25] suggested that carbonate dissolution and precipitation are accountable for the opening of the micropores, and this is consistent with the 30% rise in porosity seen in FE-SEM analysis. The decrease in nanopores may be due to an aggregation of clay and organic features and precipitating particles.
Finally, Goodman et al. [25] reported analyses based on ultra-small-angle X-ray scattering (USAXS), small angle X-ray scattering (SAXS), and wide-angle X-ray scattering (WAXS) that were consistent with the aforementioned results. When comparing these datasets with complementary data from sorption and mercury porosimetry, no consideration was given to the fact that scattering techniques can probe disconnected porosity as well. Figure 5 graphically summarises the trends found for pore sizes, and links shale fracture/pore types and size classes with the analytical techniques applied. The authors of that study concluded that CO2 and H2O reactivity with shale can dramatically change the pore scale variability by opening and closing pore networks over the meso- to nano-pore range. The time dependence of the reactions was not included in these studies; therefore, no conclusions can be made about how continuous and sustained these porosity changes are.
In other similar work, Bakken core fragments were exposed to both CO2-saturated synthetic formation brine and dry scCO2 by Lu et al. [53]. Dry samples were treated at 115 °C and 30 MPa for 23 days. The Bakken samples were fine-grained sandstone, and several of their constituent minerals are also to be found in Sleipner caprock. The porosity of the Bakken material was low since primary pores were filled with carbonate cements, pyrite, and clay-sized materials. XRD analysis showed that the minerology of unreacted Bakken consisted of 53.1% quartz, 22.2% dolomite, 7.6% illite, 7.0% calcite, 4.2% K-feldspar, 3.2% muscovite, 2.1% albite, and 0.7% pyrite. After dry scCO2 exposure, the largest changes seen were the increase in calcite content of 3% and a decrease in dolomite of 4.2%. However, Lu et al. [53] made clear that analytical errors (of up to 3%) and inherent heterogeneity between samples meant that the XRD method was not diagnostic of mineral reactions.
In addition, SEM-EDS results showed calcite surfaces were corroded and made rugged due to dissolution, but with reprecipitation elsewhere, such that there was little net mass loss to the fluid phase. The growth of fibres and needles of salt (halite and anhydrite) was observed on pyrite surfaces and on calcite grain boundaries. Lu et al. [53] suggested that the alteration of calcite and pyrite was likely enabled by the presence of water retained in the pores. This water evaporates into the dry scCO2, carrying dissolved materials and precipitating elsewhere at the rock/gas interface. Mercury porosimetry tests showed that there was no overall porosity change after submersion in dry CO2.
A set of five studies from the same group based in Chengdu, China, was undertaken concerning the evolution of rocks following treatment with CO2 [17,33,36,54,55]. The shale samples studied in this work came from the Longmaxi formation, the Wufeng formation, and the Yanchang formation. All contained various amounts of quartz, calcite, dolomite, feldspar, pyrite, and clay. The clay component was made up of illite, kaolinite, chlorite, and mixed layer illite/smectite. The TOC ranged from 2–5.6%. the experimental setups were very similar across the five studies, but the exposure times and temperature and pressure conditions tested were different. Jiang et al. [33] focused on how varying pressure (8–18 MPa) or temperature (40 °C–90 °C) affected pore structure changes over just 4 days. They found that as pressure increased, specific surface area and porosity slightly increased. This was said to be due to the scCO2 fluid density increasing and so the capability of dissolution into the water film also increased [33]. The temperature value was described as having a positive impact on dissolution at higher pressures (>16 MPa) but little effect below this.
Yin et al. [54] looked at longer-term reactivity over 30 days (T = 40 °C, P = 16 MPa). They used SEM, XRD, FTIR, and adsorption techniques. The specific surface area and number of micropores were found to decreased sharply, whereas the average pore size was enlarged. The fractal dimension of the shale was also reported to decrease. This implies a smoothing of the surface, which conflicts with the findings of aforementioned papers, in which pitting and etching were observed.
Ao et al. [17] treated Longmaxi shale with CO2 at 15 MPa and 35 °C for periods of 24, 48, 72, 96, and 120 h. Using low-pressure nitrogen adsorption data, they reported that the specific surface area of the shale had decreased, whereas the porosity and average pore size increased. Pores close to 2.32 nm were primarily enlarged. Complementary XRD data showed that the content of all minerals, except quartz, decreased.
Pan and co-workers [36,55] treated various shales with scCO2 at 15 MPa and 80 °C, with serial sampling after 10, 20, and 30 days. XRD was used to find the mineralogy before and after treatment, but Pan et al. [36,55] suggested that this type of analysis may not accurately detect the small changes that occurred in the minerals, and the sample heterogeneity itself may lead to variations of up to 5%. Elemental analysis was thought to be a more robust technique, and this showed that the carbon and hydrogen elemental content changed with increasing treatment time. Initially, the content of both elements decreased slightly after 10 days, before increasing thereafter. These results were attributed to the extraction of organic matter, as well as the chemical reactions in shale minerals caused by scCO2. These authors noted that any relative increase in quartz content was most likely caused by the dissolution of other minerals (such as feldspar and clay minerals), whereas a decrease was attributed to the dissolution of quartz itself. The kinetics of quartz dissolution is slow; therefore, this reaction is only observed in experiments conducted over long periods of time [49] or at higher temperatures.
As determined by CO2 and N2 adsorption isotherms, the volumes of micropores and fine mesopores in the Longmaxi shale significantly decreased, with a corresponding increase in volumes of larger meso- and macropores, following treatment. The opposite trend was observed for terrestrial Chang-7 shale. Both the surface fractal dimension and the pore structure fractal dimension of the Longmaxi sample showed a significant decrease with treatment, which again was opposite to that observed for terrestrial Chang-7 shale. Pan et al. [36,55] considered that the changes they observed were due to a combination of three mechanisms, namely, (1) organic matter extraction, (2) dissolution and precipitation of the minerals, and (3) adsorption-induced expansion.
Two experiments of note were reported by Lahann et al. [56]). Both were conducted on two New Albany shales containing pyrite, apatite, dolomite, illite, chlorite, and quartz. One shale had a low TOC, of about 6%, whereas that of the other was higher, at about 15%. The first experiment combined treatment with CO2 and distilled water at low pressure (3.8 MPa) and a temperature of 150 °C with a duration of 3–42 days. Control tests were conducted without CO2, using only distilled water or brine. They found that injecting CO2 in a small amount did not change the porosity or structure relative to the control tests. However, the second experiment involved treatment with CO2 and brine, at higher pressures ranging from 0.69 to 24.13 MPa and with a temperature of 80 °C, for 21 days. Testing the brine chemistry periodically, they observed an increase in carbonate minerals entering the solution. Ca and Mg ion concentrations increased with pressure due to further lowering of the brine pH level. Ion ratios suggested that dolomite/ankerite were the dissolving phases, along with variable amounts of calcite.
Although most investigations in the literature have used batch reactors, Hadian and Rezaee [57] used a flow reactor. Batch reactors are more representative of the static CO2 found pooling under the caprock or shale interlayers in the Sleipner case. Flow reactors model areas where CO2 is more mobile, such as when passing through the shale layers. Shale samples were pressure-saturated with simplified artificial pore water from a 30,000 ppm NaCl solution, before being held in a pressurised cell at 13.8 MPa and 60 °C for nine months. Wet scCO2 was then dynamically flowed throughout this time. The shales tested were Eneabba Basal shale and claystone-rich facies of the Yalgorup Member. Ten samples were tested, and an initial XRD analysis before treatment showed varying amounts of quartz, microcline, albite, anorthite, illite/mica, kaolinite, chlorite, goethite, hematite and halite. However, after treatment, XRD then revealed the dissolution of quartz, and aluminosilicates such as K-feldspar, as well as clay minerals such as kaolinite, were seen. Precipitation of muscovite (illite) was also detected. These changes resulted in an increase in the porosity of most samples. Mercury intrusion porosimetry showed a shift towards larger pore throat sizes.
Busch et al. [58] investigated the interactions of wet CO2 over 32 days at 15 MPa and 50 °C, with Muderong shale. XRD analysis was used to track mineralogical changes over time, and the example data given in Figure 6 shows that a marked change was observed after 6 days in illite and K-feldspar content. Although illite content decreased and K-feldspar content increased, Busch et al. [58] did not detail the chemical processes that were taking place. The content of quartz and the small amount of kaolinite showed very little change in this experiment.
To date, only one laboratory-based geochemical experiment has been conducted on the exposure of the Sleipner field caprock, Nordland shale, to CO2. This focused only on dissolved CO2 interactions, since the sample was submerged in porewater prior to CO2 injection. Bateman et al. [59] designed an investigation to evaluate the impact of CO2 on the sealing capacity of Nordland shale. Several ‘batch’ experiments were set up, running for up to 5 years. Each 100 mL container carried 8 g of caprock and 80 g of synthetic porewater. The porewater was based upon samples collected from the host reservoir rock, namely, the Utsira Sand. The samples were kept at 30 °C and injected with CO2 to a pressure of 8 MPa (approximate reservoir conditions). A control sample, consisting of a reactor under nitrogen, was also included for reference purposes. Reactant fluids were regularly sampled for the first 14 months and again at 5 years. Levels of pH, carbonate/bicarbonate, and various other cations/anions were tested. The caprock samples were characterised using XRD analysis on completion of the experiment, along with an untreated sample.
Bateman et al. [59] considered that the CO2 had reacted with the pore water relatively quickly. Most of these reactions would have occurred before any reaction with the rock samples. Although pH levels initially decreased over time, a slight increase was seen in the final measurement after 5 years. Bateman et al. [59] suggested that this may have been due to an increase in pH buffering. A general increase in bicarbonate concentration was observed, which was initially rapid up to 3200 mg L−1 after a few weeks, and which then continued more sedately to 3500 mg L−1 after 5 years. This response came directly from CO2 dissolution, as well as the dissolution of caprock sample carbonates caused by the lowering of the pH level. The slowing of the bicarbonate concentration increase after the initial burst was said to be due to a decelerating rate of carbonate mineral dissolution. A further cause was the slow reaction of aluminosilicate minerals, which ‘consume’ acidity and generate bicarbonate ions as a by-product. Dissolution of caprock sample carbonates was also indicated by the swift increase in the calcium ion concentration and those of other minor elements in the pore water samples. It was not clear whether an equilibrium was reached or whether total consumption of the carbonate phase in the sample had occurred.
XRD analysis showed that the calcium content had dropped from 2.4% to <0.5%, which is consistent with the pore water results. It was noted that the calcium content was present mostly as shell debris. No other significate mineralogical changes were detected. This included dawsonite, which was otherwise predicted to form in models developed by Johnson et al. [60].
Bateman et al. [59] also noted that reaction rates may have been accelerated by the continuous mixing of the solution, but this would also have prevented the formation of reaction fronts, which may occur in intact caprock. The lack of reactivity seen in the nitrogen control experiments may indicate equilibrium between caprock and synthetic porewater. This verified the accuracy of the chosen constituents of the water and indicated that caprock and host rock porewater were broadly similar.
2. Characterisation of the Structural Evolution of Rocks Following Exposure to Carbon Dioxide
As was made evident in the foregoing discussion of past work, the pore structure of rocks can be characterised via both direct methods, such as electron microscopy and X-ray tomography, and indirect methods, such as gas adsorption and mercury porosimetry. Although the former has the benefit of providing visualisations of the void space, these methods suffer from the drawbacks of a limited resolution and field-of-view, which can make the statistical representativeness of the data questionable for a system as heterogeneous as a rock sample. In contrast, indirect methods generally provide more representative data for larger sample volumes but suffer the drawback of the need to make certain assumptions about the nature of the void space to proceed with the analysis of the raw data. These assumptions can lead to apparent discrepancies in conclusions drawn from different data analysis methods, as described above. Hence, more appropriate data analysis methods are needed for samples as chemically and geometrically heterogeneous as shales, and recent studies have attempted to provide these requisite methods.
2.1. Surface Area Determination
As mentioned previously, the specific surface area of rocks is a key void space descriptor for estimating key parameters such as geochemical reaction rates, with errors in the input descriptors leading to great uncertainty in parameter predictions. In general, gas adsorption data, analysed using either the Langmuir or Brunauer–Emmett–Teller (BET) models, are used to obtain surface area [61]. However, both these models assume that the surface is homogeneous, such that the interaction with the adsorbate is the same everywhere, whereas rocks are complex mixtures of different minerals. The homotattic (meaning isoenergetic) patch model was introduced in order to account for the effect of the chemical heterogeneity of such surfaces on adsorption [62]. This model treats the surface of the adsorbent as a patchwork of zones with different types of adsorption site (like a checkerboard in the case of two different sites), where, perhaps in the case of rocks, these zones correspond to different mineral grains. The model assumes that each of the individual patches is large, so that edge effects, caused by interaction with other zones, are negligible. The observed adsorption thus consists of a composite of the behaviour of the set of patches, such that
where Ii is the isotherm equation describing adsorption on the ith patch, and θi is the fraction of the surface occupied by patches of type Ii, such that the various θi-values obey
Most past studies using the homotattic patch model have only distinguished each surface patch by means of a different adsorption energy, and have utilised the model simply as a way to curve-fit experimental isotherms a posteriori without using the fitted parameters to make any predictions regarding the other physical properties of the system. For example, Ng et al. [63] only fitted Langmuir-type isotherm models, which have only monolayer capacity and adsorption energy parameters, even into the multilayer and capillary condensation regions of the isotherms, with the latter being the region where models based only upon van-der-Waals interactions alone are not valid.
However, adsorbate interaction strength is not the only property of the particular surfaces within different patches that can be probed by adsorption isotherms. Natural rock surfaces are also typically rough at the molecular scale. The impact of roughness on adsorption is neglected in the simplest models of gas sorption, such as the standard ISO BET equation [64,65]. Irregularities in the surface, overall, cause the space for adsorbing the second and subsequent layers of an adsorption multi-layer to decrease with distance from the surface, such that the capacity of each successive layer declines. For surfaces that possess the special property of self-similarity over multiple length-scales, which are therefore fractals, the decline in the adsorbate capacity of each layer is given by the following equation [66]:
where A1 is the area in the first adsorbed layer, Ai is the area in the ith adsorbed layer, and d is the surface fractal dimension (2 ≤ d ≤ 3). As the degree of surface roughness increases, the fractal dimension increases from 2 (for a flat surface) towards 3. This effect can be incorporated into the standard BET model resulting in a fractal version. This is given by [67]:
where v is the amount adsorbed, vm is the monolayer capacity, c is the BET constant, and x is the relative pressure. The impact of the fractal roughness, as described by Equation (9), is to decrease the amount adsorbed for each successive layer of adsorbate. This makes the region of the adsorption isotherm, beyond the lower part known as ‘the BET region’, sensitive to differences in surface roughness. Hence, by utilising the homotattic patch model, the different surface patches can be characterised by both their surface adsorption energy and their roughness. These two characteristics can be probed independently since different parts of an adsorption isotherm are sensitive to each, with the low-pressure, monolayer region sensitive to the interaction strength (surface chemistry) and the higher-relative-pressure, multi-layer region sensitive to the roughness.
In previous work it was found that nitrogen adsorption isotherms for both as-received samples of Nordland shale from well 15/9-A11 in the Sleipner field and those treated with scCO2 under a variety of conditions were fitted best by a three-component (2 fractal BET + Henry’s Law) homotattic patch model, rather than the single-component, standard BET model using the ISO [64] method [68]. Furthermore, the surface area parameter obtained from the homotattic patch model was found to be more physically realistic, since it was predictive of the change in the gas phase mass transfer coefficient, following the various treatments with scCO2, whereas the ISO BET area was not. The homotattic patch model also offers an alternative approach to CXT with which to associate changes in mass transport flux to the appearance of particular types of pores, such as those surfaced with organic matter, when shale rocks (Utica) are hydrothermally treated (to mimic fracking and natural diagenetic processes) [69]. In other work, the parameters of the homotattic patch model have been independently, quantitatively validated, using solid state NMR and elemental analysis, for nitrogen adsorption on glassy materials [70].
2.2. Pore Volume Determination
Rocks, especially shales and carbonates, often have networks of micro-, meso-, and macro-pores, which makes them difficult to characterise with a single technique, even using standard indirect methods. For example, micropores are generally too small to intrude mercury during porosimetry, whereas nitrogen will not capillary-condense in macropores in standard adsorption experiments. Nonetheless, mercury porosimetry is popular for characterising rocks because it is one of the very few techniques that can probe the large range of length-scales, from ~100s µm to nanometres, found therein with just one experiment. However, high pressures of ~400 MPa are needed to probe nanoporosity, and thus there is a risk of crushing the sample. In contrast, the gas overcondensation method allows the probing of sizes from micro- to macro-pores with one technique and does not require high external pressure to probe smaller pores [61,71].
The gas overcondensation method has shown that conventional gas sorption experiments tend to miss much of the macroporosity present in shales [71]. Figure 7a–c indicate what might be expected from gas sorption for a range of idealised porous structures, and Figure 7d shows some experimental data for a real shale. As seen in Figure 7, in contrast to the conventional adsorption experiment, gas overcondensation can be used to probe both macroporosity and microporosity. Comparing the experimental data for the shale sample from conventional adsorption, given in Figure 7d, with the idealised isotherm in Figure 7a, and by comparing the experimental overcondensation data in Figure 7d with the idealised isotherm in Figure 7c, it can be seen that the combined experimental datasets reflect what would be expected if connected macroporosity in the shale was being missed in the conventional sorption experiment but detected by overcondensation.
The boundary overcondensation desorption experiment can also incorporate ascending gas adsorption scanning curves that can probe pore morphology. A scanning curve is defined as an isotherm, whereby the progressive change in pressure is halted and the direction of change reversed, before reaching one of either hysteresis closure points in the full boundary isotherms, which are the isotherms where complete pore-filling with condensate is achieved at the upper end, in terms of the amount adsorbed. For example, the crossing ascending scanning curves, even for the very wide hysteresis shown in Figure 7d, suggest that large voids with narrow windows are present in thermochemically-treated Rempstone shale, as seen within the macroporosity of the organic (carbon) phase observed in complementary electron microscopy data [71]. Furthermore, although the shape of the conventional isotherm hysteresis loop in Figure 7 might lead to a suggestion of slit-shaped pores based on literature classification schemes [72], instead, the overcondensation isotherm reveals that the conventional hysteresis loop is incomplete and thus the perceived shape is incorrect; therefore, any inferences drawn from it are flawed. The gas overcondensation method can thus reveal the true structural changes in pores as a result of exposure to scCO2 [68]. Indeed, the boundary desorption isotherm from overcondensation can be used, in conjunction with percolation theory, to measure changes to pore connectivity with exposure to scCO2. Previous work has shown that the pore connectivity of the macroporosity of Nordland shale declined when treated with scCO2 and deionised water for 4 h at 80 °C and 90 bar [68].
2.3. Void Space Segmentation Schemes
The void spaces of rocks are complex and, thus, in order to make them amenable to the understanding and prediction of the processes occurring therein, some sort of classification and characterisation scheme is required. This typically consists of breaking down the complex whole into a large assemblage of more manageable segments, which can be more easily classified and assigned descriptive parameters, which may then quantify change during exposure to CO2-rich phases. For example, for indirect methods, this segmentation process breaks the void space down into elements called ‘pores’, which possess a characteristic pore size as their key parameter. However, the exact definition of what is meant by a ‘pore’ is problematic [61]. For the traditional analysis of mercury porosimetry, this process involves effectively converting the discontinuous (as it consists of a series of small steps up in pressure) mercury intrusion curve into a histogram of pore volume (derived from measured intruded volume for a pressure step) as a function of pore size (derived from intrusion pressure and the Washburn equation) [61]. This treats the void space as if it consisted of a parallel bundle of cylindrical pores (a ‘wine-rack’-like structure). For more direct imaging methods, such as computerised X-ray tomography (CXT) or magnetic resonance imaging (MRI), the segmentation process of the reconstructed image usually depends upon some geometrical criterion, such as a pore-pore boundary being defined by a local minimum in some measure of characteristic size [61,73]. However, it is not clear whether these often arbitrarily chosen segmentation processes break up the void space into zones that actually matter in the physical process of interest occurring within the rock. For example, the advanced condensation, or cascade effect, during capillary condensation means that many pore elements, defined in a similarly simplistic way to that described above for imaging, would fill with liquid phase, together, during the same pressure-increase step, thus making the supposed distinction amongst pores superfluous [61,74].
However, segmentation methods based upon particular reference processes, occurring within the void space itself, have been developed, which are also of wider physical meaning since they are useful in predicting other physical processes besides the one used to define them. One such method is gas sorption scanning curves [61]. Figure 8 shows an example of this method applied to Nordland shale. The particular forms of the nitrogen sorption scanning curves obtained for this shale suggested that the void space could be considered a composite of two thermodynamically independent networks, denoted 1 and 2, in order of increasing pore size. This particular segmentation is indicated because, although the desorption scanning curve initiated from the adsorption boundary curve at a relative pressure of approximately 0.8 was converging on the lower hysteresis closure point, those initiated further up the isotherm, at relative pressures higher than 0.8, converged instead on a specific point on the boundary desorption isotherm at a relative pressure of 0.8. This latter finding indicated a concealed lower hysteresis closure point for a network of larger pores, denoted Network 2. The ascending scanning curves, initiated at this upper convergence point on the desorption branch, crossed directly to the adsorption branch, where they indicated the particular pressure (and thus the pore size from the Kelvin equation) that delimits the two networks. This form suggests they may be like the top flat plateau of the hysteresis loop for a network containing smaller mesopores, denoted Network 1, filling completely below relative pressures of ~0.8. The gentle rise in the crossing, ascending scanning curve arose from multi-layer adsorption occurring in the empty pores of Network 2. The overall forms of the scanning curves are thus consistent with the hysteresis loop region of the isotherm being a composite of two separate isotherms. The first is due to adsorption in smaller mesopores that fill below relative pressures of ~0.8, and the second is due to adsorption in larger pores in which capillary condensation occurs only above relative pressures of ~0.8. It was found that the general forms of the equivalent scanning curves for shale samples exposed to accelerated treatments with scCO2 were similar, which suggested that thermochemical treatment did not break down the distinction between Networks 1 and 2 [68]. It was further found that the pore volume of Network 1, as identified by the scanning curves, for each treated sample was predictive, along with the total surface area (determined with the homotattic patch model) of gas-phase mass transport rates in the different void spaces resulting from different thermochemical treatments of the shale. This shows that the void space segments identified with scanning curves have physical significance, rather than simply being abstract creations of image analysis algorithms.
2.4. Adsorption Calorimetry
A very rarely used technique for rock characterisation involves combining microcalorimetry with gas adsorption simultaneously. In addition to the usual thermodynamic parameters, such as the distribution of the heat of adsorption across different adsorption sites, and how these may change following exposure to scCO2, adsorption calorimetry can also be used to study mass transfer effects within rocks. As mentioned above, adsorption calorimetry has been used to show the impact of narrow micropores guarding access to much larger meso- and macro-pores in Bowland shale [75].
Figure 9 shows typical examples of the type of raw data obtained from adsorption calorimetry for carbon dioxide adsorption on the Above Marine Band Bowland shale, originally taken from Preese Hall Well 1 in north-western England. In Figure 9a, it can be seen that the form of the heat-flow for a typical adsorption step exhibits a skewed, asymmetric peak shape. There is an initial relatively steep rise in heat released, followed by a slower decrease. The decreasing part of the data in Figure 9a has been fitted to an exponential decay function with a time constant denoted τ. This characteristic parameter for heat-flow is said to be related to the rate of mass transport of the adsorbate [76]. Furthermore, Figure 9b shows the corresponding mass uptake response with time, for the same pressure step, along with a fit of the experimental data to the exponential growth functional form of the linear driving force (LDF) model, with a characteristic time constant, denoted 1/k, where k is a mass transfer coefficient [61].
Figure 10 shows the correlation of the characteristic mass transfer rate parameters, derived from the two aforementioned data-set types obtained from adsorption microcalorimetry (τ and 1/k), with each data-pair being for the same adsorption step over a range of saturation levels of carbon dioxide during adsorption experiments on an Above Marine Band sample of Bowland shale. It is noted that the observed LDF mass transfer coefficients, k, as obtained from plots such as Figure 9b, have been corrected for adsorption before plotting in Figure 10. From Figure 10, it can be seen that, initially, at lower values of the time constants, there is a good fit to a straight line, suggesting that both methods are probing the same mass transfer process. However, at the highest values of 1/k, which correspond to the highest carbon dioxide saturation levels tested, there is some deviation from the linear fit. Thereafter, the time constant for heat flow, τ, shows a tendency to plateau around a constant value, instead of continuing to increase.
The deviation from linear behaviour in Figure 10 suggests that, at higher CO2 saturation levels, the mass transfer processes probed by mass uptake and heat-flow data are different. Previous dynamic mean-field density function theory simulations of the kinetics of adsorption into carbon pore networks, consisting of pore bodies surrounded, and interspersed, by pore necks, has suggested that the early stages of adsorption are characterized by filling of the pore necks with plugs of adsorbate [77,78]. Subsequently, the more deeply buried pore bodies are progressively filled via a much slower process. In the light of these findings, it was suggested that the initial rapid adsorption at low saturation in the Bowland shale fills adsorption sites at narrow pore necks. However, as most of these necks become filled with adsorbed phase, access to larger pore bodies behind them would become more restricted. This pattern of adsorption would be evident in the adsorption calorimetry data because adsorbate initially adsorbing near a blocked neck site would release most of the heat of adsorption at that stage. Hence, the observed heat-flow parameter would thus be dominated by the rate of the initial adsorption only. However, this initial adsorption would be metastable since the more deeply buried adsorption sites represent a lower-energy configuration of the adsorbate. Hence, there would be a driving force for a slower re-configuration of the adsorbed phase to the more stable arrangement. This process would release much less heat of adsorption, and would do so over a longer period, than the initial metastable adsorption, and thus would be harder to detect with calorimetry. However, the facilitation of space for more adsorbate, obtained via the re-arrangement of the initial configuration, can be detected by means of the mass uptake method.
Hence, the form of the trend in the data shown in Figure 10 is consistent with what would be expected if the adsorbate was forced to ingress the Bowland shale via ‘hourglass-type’ restrictions. This suggestion is also consistent with the steep cavitation step in the corresponding nitrogen desorption isotherm (not shown) also observed for the Above Marine Band shale, which itself indicates that larger pore bodies are shielded by pore necks smaller than at least ~4 nm [76]. These data suggest that the ingress of (gas phase) CO2 into shale rocks is likely to be impeded by narrow necks guarding access to most of the storage capacity.
Data from the foregoing studies of the evolution of the mineralogy, pore structure, and transport properties of caprocks and inter-layers can be fed into field-scale simulations of how potential storage sites will perform during the long-term injection and storage of scCO2. This type of simulation is the subject of the next section.
3. Reservoir-Scale Simulations
The main objectives of a reservoir engineering study for CO2 sequestration include determining the overall reservoir capacity, the reservoir injectivity, the project cost, and the contributions of the various trapping mechanisms to the ultimate fate of the CO2, together with assessing the risks involved, such as reservoir stability and caprock integrity [79,80]. Due to the limited data available from the field, many studies involve reservoir simulations. Reservoir simulations also enable the testing of ‘what-if’ scenarios to trial potential reservoir engineering ideas, such as different injection regimes and well-placings [80]. Although two-dimensional (2D) models are practical and helpful, they cannot be fully representative of all the complexities of a geological formation, such as all of the stress and strain distributions resulting from the various interactions between different processes [81].
Potential leakage mechanisms in caprocks and interlayers include capillary pressure breakthrough, the diffusion of dissolved CO2, and migration along faults and fractures, which could occur during the upwards migration of the plume. Once leakage commences either, or both, positive and/or negative feedback processes can also eventually be initiated, which can enhance or curtail the leak. Therefore, it is crucial to understand the short- and long-term impact of CO2–brine–rock interactions during and after CO2 injection [82]. Once the CO2 invades the caprock, geochemical CO2–rock interaction may result in a change in porosity and permeability through mineral precipitation and dissolution. In addition, any change in the density and viscosity of the fluids, together with the change in the fluid pressure, will have an impact on the fluid flow and thus on the transportation rate of chemical species. Moreover, the overpressure introduced by the injection of scCO2 results in a change in loads or internal pressure, which leads to a change in the geo-mechanical and hydrological properties of the seal. These include, for example, stresses and deformation of the rock and capillary forces, respectively. The variation in the applied load will generate an expansion in the porous media of the seal and reservoir, which may lead to the stress state moving close to shear or tensile failure [82]. This may therefore compromise the seal integrity by opening up new flow paths via the sealing area. As a result, understanding the inter-relation between the various fluid flow–chemical–mechanical coupling phenomena plays a vital role in geological formation storage in terms of predicting capacity and ensuring safety [83]. A numerical simulation is an important tool for investigating the aforementioned complex issues regarding the operation of a geological carbon storage site. The majority of the models related to carbon storage consider two-phase flow problems (liquid and gas) conducted at a continuum scale to overcome computational constraints. Simulations involve the use of three-dimensional governing equations, including those for the permeability–saturation relationship, capillary pressure–saturation and residual saturation [84].
3.1. Seals and Interlayers
Since the primary safety concern for CO2 sequestration is effective sealing, a better understanding of the possible factors which play a vital role in affecting the sealing efficiency is crucial.
Well logs suggest that the Sleipner field Utsira Sand is interspersed with a serial stack of shale inter-layers [85]. The thickest of these is 5 m and lies just below the seal, with deeper inter-layers having thicknesses below seismic resolution, ranging from ~0.5 m to 5 m. Shale inter-layers may provide some storage capacity for CO2. Agarton et al. [86] suggested that low-permeability zones can be stores for dissolved chemicals, since, in their study of mass transport and dissolution during CO2 injection into a sandstone reservoir with multiple shale inter-layers, they found that the thicker and lower-permeability shale layers provided stable and long-term trapping, albeit with a smaller storage volume than that observed for sandstone. Parker et al. [87] showed that a single, thin clay bed with a thickness of only 0.2 m could store a significant amount of dissolved trichloroethene for several years.
The factors that may negatively influence the integrity of the sealing include geological heterogeneity, capillary entry pressure, geomechanics, and geochemistry. As a result, sealing capacity has received increasing attention [88,89]. However, little consideration has been given to the combination of all these factors in one study. Several studies have been performed to evaluate just some of these factors. Wangen [90] conducted a study which illustrated how vertical flow leakage through inter-layers was caused by overpressure build-up in more permeable regions of the reservoir for the Sleipner field, in a process known as the chimney effect. The study outcomes indicated that permeable fractures were caused by a pore pressure higher than the least compressive stress. Furthermore, Espinoza and Santamarina [91] conducted experiments to investigate the sealing integrity and the leakage rate of CO2 into the sealing sediment caused by capillary pressure breakthroughs. These studies led the authors to conclude that diffusive and advective CO2 leakage via a non-fractured seal was minor and would not influence the storage capacity. In addition, Alkan et al. [92] performed a numerical investigation of the impact of capillary pressure on the CO2–rock–brine interaction in a reservoir, but neglecting the geomechanical risk. The obtained results showed that significant capillary forces would reduce the amount of gravity separation, resulting in a more homogenous CO2 plume, which, in turn, would enhance the dissolution of CO2 into brine.
3.2. Geomechanical Processes
The injection of large volumes of scCO2 into the subsurface perturbs the pressure, followed by changes in the state of the stresses. As result, expansion of the subsurface porous media occurs and brings the stress state close to failure, which potentially leads to the upwards migration of scCO2 towards the atmosphere. The two main failure mechanisms that might arise are tensile fracturing and the shear-slip reactivation of cohesionless pre-existing fractures [93]. Tensile fracturing develops when the minimum effective stress becomes negative and its absolute magnitude exceeds the tensile strength of the rock matrix. Shear-slip reactivation occurs according to the Mohr–Coulomb criterion.
Hence, monitoring the geomechanical response to scCO2 injection is vital for ensuring the seal integrity. For example, Xiao et al. [83] found that a sharp front of reduction in effective stress migrated upward through the Morrow shale caprock with CO2 injection. Therefore, it is necessary to solve the hydromechanical coupling equations numerically. This is because ignoring the geo-mechanical effects would lead to misleading results, and there are several instances in the literature supporting this. For example, the build-up of pore pressure during CO2 injection increases the volumetric strain, and thus porosity, leading to increased permeability. This increased permeability results in negative feedback, wherein the pore pressure increase is slowed, and thus the effective stress changes are different compared to cases in which these mechanical effects on flow are neglected [94,95]. Furthermore, incorrect predictions of fracture pressure occur when simplified analytical solutions are used [94,95]. Purely hydraulic simulations fail to predict the correct response of the fluid pressure in the seal (since they predict an instant rise, whereas it actually decreases at the beginning of the injection due to dilatancy [96]) and purely hydraulic codes do not simulate the effect of the initial stress state, which has a great effect on the seal failure behaviour [97,98].
The importance of including geomechanics in assessments of seal integrity has been demonstrated by several studies. In terms of playing a critical role in CO2 injection sites, this was confirmed both by investigations [99] of the Mountaineer project in West Virginia, and also by the modelling and monitoring of the In Salah storage project located in Algeria [100,101,102]. These studies concluded that an increase in pore pressure, which was induced by CO2 injection, increases the potential for fault reactivation and for surface uplift, the magnitude of which is controlled by poro-elastic expansion arising from the pressure change within the adjacent caprock. Currently, geomechanical problems are gaining more attention from geological carbon stakeholders, especially following the publication of a paper by Zoback and Gorelick [103] which concluded that the injection of a large volume of CO2 would induce minor-to-moderate earthquakes, which would potentially threaten the seal integrity.
Furthermore, geomechanical numerical modelling is a vital aspect of the investigation of potential geological carbon storage in order to examine the site’s sustainability and to calculate the limitations in terms of the injection rate and sealing integrity. Several studies have been conducted to evaluate only the impact of geo-mechanical changes on seal integrity. Martinez et al. [104], Pan et al. [105], and Lee et al. [106] have all conducted studies to demonstrate the behaviour of natural fractures within the caprock during scCO2 injection. The results showed that the fractures will open due to a reduction in normal effective stress, and fracture re-activation will result in an increase in permeability across the caprock; thus, CO2 leakage could occur. Moreover, the modelling studies carried out by Siriwardane et al. [107] and Huang et al. [108] confirmed that pressure behaviour within the caprock in the presence of fractures was significantly different, to otherwise, and that the leakage pathway via the seal can be detected by monitoring any significant change in pressure within the caprock during CO2 injection. Furthermore, Wangen et al. [109] focused on modelling the geo-mechanical behaviour related to the subsurface uplift of only the reservoir under different CO2 injection rates, along with setting different boundary conditions using a simple model of the Sleipner site. The results showed that the key impact of the fluid pressure was the expansion of the Utsira sand formation, and, in addition, the Nordland shale (seal) was found to be soft due to the shale not being fully lithified from the top to the base. Thus, the ability of Nordland shale (seal) to adopt the dilation from the Utsira formation (reservoir) is possible. However, several areas within the Utsira formation have impermeable sites which would increase in terms of their pore pressure and expansion, and therefore the threat of fracturing and shear deformation remains a possibility.
Onoja et al. [79] studied the impact of a variety of sealing thicknesses and progressively transitioning layered lithologies, along with using different relative permeability curves, on the sealing integrity caused by the pressure evolution during injection. In particular, they studied how a gradation in rock properties at the base of the seal would affect the propagation of pressure. They considered the impact of the overpressure in the seal caused by the injection in both closed and open systems but neglected several other factors, such as heterogeneities in the body of the reservoir. The study outcomes indicated that the magnitude of pressure within the CO2 storage is influenced by the relative permeability and porosity variation of the caprock, which introduces the possibility of caprock failure. The type, orientation, and width of strata at the base of the caprock controlled the rate of pressure diffusion into the seal. The effect of the layering was significant, and the depth of heterogeneity covered the region where overpressure changes were substantial, which was the first few metres of the caprock. Additionally, a closed system resulted in the cycling of brine within the reservoir, which would potentially negatively affect the integrity of the caprock, especially near the injection zone. However, the expansion of the caprock pore volume, provided by the expansion of the formation due to the injection pressure, increased the storage capacity of the seal itself, as long as it did not result in geomechanical degradation of the seal.
The interaction of CO2 with caprocks containing swelling clays, such as smectite, can lead to potential local shear failure under unfavourable stress conditions [110]. The stress build-up caused by the poroelastic response of mudrocks, following the sorption of aqueous CO2 into swelling clays, can lead to fault reactivation and facilitate leakage. Laboratory tests have shown that swelling clays can develop swelling strain and swelling stress when in contact with CO2 [110]. This is because, depending upon the initial hydration state of the clay, the interlayer spaces between smectite platelets can greatly expand when the CO2 concentration therein increases. Busch et al. [110] examined the larger-scale consequences of such processes with a macroscopic model describing the elastic deformation of shale resulting from the diffusional and pressure-driven flux of CO2 dissolved in brine. In the model, the reservoir–caprock interface was considered sharp and smooth, with the caprock itself modelled as an isotropic and uniform linear poro-elastic rock surmounting a poro-elastic reservoir. The potential plastic/ductile properties of the shale were neglected. Since clay minerals are typically oriented perpendicularly to the largest stress, which would be the overburden stress, the swelling stress would mainly develop in the vertical direction. CO2 and water in the larger voids in the rock and the clay inter-layers were considered to be in local thermodynamic equilibrium, and migration of species between the pore volumes would arise through osmotic-like processes. The main factors that determine the response of the caprock to exposure to CO2 were found to include the mineralogy (specifically the swelling clay content), the geometry and stress conditions, the mechanical behaviour, and the permeability in the shear zone of the caprock [110]. In particular, it was found that, even with a high swelling-clay content, the build-up in shear stress with swelling only extends pervasively if there is significant discontinuity in the seal, such as a fault with an offset comparable in size to, but less than, the seal thickness [110]. However, the stress build-up may be relieved if there is substantial creep deformation possible in the caprock.
3.3. Geochemical Processes
In addition to geomechanical considerations, geochemical numerical modelling is also a vital aspect to be considered as a part of investigating potential geological carbon storage sites in order to examine the site sustainability and to obtain the limitations in terms of the injection rate and sealing integrity [111]. The injection of CO2 into the subsurface as a part of geological carbon storage would result in geochemical changes within and around the storage formation. In the clay-rich caprocks that typically lay on top of proposed storage sites, the chemical interactions with CO2 can include the dissolution and re-precipitation of carbonates, the dissolution of plagioclase feldspar and clay minerals (illite, chlorite, and kaolinite), and the precipitation of smectite [112]. However, due to the complex network of chemical reactions that can develop, prediction is difficult. In calcite-rich rocks, dissolution in preferable flow pathways can create positive feedback, leading to the rapid development of ‘wormhole structures’ [83]. Geochemical changes can lead to changes in the geomechanical properties of rock, such as its elastic behaviour, which has consequences for the stress and strain distributions and for fracture initiation and propagation [81]. For this activity to be carried out safely, and not damage the ecosystem, then sufficient isolation needs to be provided to prevent CO2 from escaping into the atmosphere. Therefore, monitoring the geochemical response is important. Accordingly, the IPPC special report on carbon capture and storage recommended that a geochemical reaction assessment, for both reservoir and seal rock, needs to be carried out. Therefore, several studies have monitored the impact of changes to geochemistry on the porosity and permeability of the reservoir and the seal, while ignoring geomechanical effects.
For example, Khan et al. [113] performed a simulation study to evaluate the influence of mineral precipitation and dissolution on alterations in the porosity and permeability of a reservoir. The results indicated that although a porosity increase occurred near the injection well area, caused by mineral dissolution, conversely, a porosity reduction was caused by mineral precipitation in areas far away from the well. In addition, permeability followed a similar trend to that of porosity. However, the change in porosity and permeability was minor [113]. The presence of CO2 in the pore water alters the chemical equilibria occurring in the rock. For simulations of the Shenhua carbon sequestration project, Yang et al. [114] found that the mudstone caprock ‘self-healed’ due to mineral precipitation in the lower part of the caprock exceeding dissolution. It was found that the K-feldspar content was the key mineral controlling the integrity of the caprock, with the lack of K-feldspar enhancing the self-sealing of the lower part of the caprock. They also found that the precipitation of carbonate minerals consumed CO2 in the caprock, resulting in a decrease in the CO2 concentration and rock permeability, thereby enhancing the seal’s efficiency. However, the greater precipitation of Ca-smectite and the dissolution of albite in the lower part of the caprock was the opposite to what was happening to these minerals in the top of the caprock. Additionally, Ma et al. [115] carried out geochemical modelling to evaluate the change in the caprock permeability due to the evolution of the mineralogy resulting from CO2 injection, with the outcomes showing that the dissolution of feldspar and albite minerals played a major role in increasing the permeability of the seal. On the other hand, some caprocks do not contain minerals within their pore throats that are sensitive to CO2 injection (such as carbonate), and therefore no precipitation and dissolution will occur. For example, a study performed by Armitage et al. [116] investigated the changes in the porosity and permeability of Mercia mudstone caused by mineral deposition during scCO2 injection. The results showed that a reduction in porosity occurred due to the enormous deposition of illite or abundant diagenetic carbonate and gypsum cement.
Most of the previous research has focused only on the reservoir efficiency in terms of the storage capacity itself but ignoring the seal/caprock integrity. For instance, Green and Ennis-King [117] investigated the variation of reservoir vertical permeability during CO2 sequestration. Furthermore, Khan et al. [113], Kumar et al. [118], and Liu et al. [119] attempted compositional reservoir simulations to investigate the rock–CO2–brine interaction to analyse the reservoir porosity and permeability changes but ignoring the changes in the petrophysical properties of the seal/caprock caused by geochemical reactions. Furthermore, Wang et al. [120], and Ghanbari et al. [121] compared the CO2 plume movement and the rate of dissolution involving homogeneous and heterogeneous porous media only within the reservoir alone.
3.4. Coupled Flow-Geomechanical-Geochemical Processes
It has been observed that several studies have separately addressed geomechanical or geochemical effects, but, due to the nature of the geological carbon storage sites, rocks are exposed to both mechanical loading and geochemical alterations caused by the injection of CO2. The impact on the plume flow of poromechanical loading also depends on whether the media is simultaneously experiencing chemical alterations. Therefore, evaluating the connection, and potential coupling, between geo-chemical and -mechanical alterations needs to be considered. Compared to a solely geochemical and geo-mechanical investigation, which does not provide a thorough analysis of caprock integrity, few studies have addressed coupled chemical-mechanical processes caused by CO2 injection [93]. The interaction of CO2 and brine on rocks can alter the frictional properties of faults, thus creating a seismicity hazard [112]. Furthermore, these studies focused on reservoir storage and ignored the seal integrity. For example, Yong et al. [122] performed two-way coupling modelling to simulate the CO2 plume movement with geochemical reactions and geomechanical effects within the reservoir. The authors of the study concluded that vertical displacement was observed during the injection, and also noted porosity and permeability changes near the wellbore. In contrast, only a limited number of experimental studies [112,123,124] have examined the coupled chemical-mechanical behaviour of the seal resulting from CO2 intrusion. Most of these studies have focussed on using carbonate-rich caprock samples, along with enormous CO2 partial pressure, to observe obvious chemical alterations within limited experimental times. However, Spokas et al. [124] found that it was the spatial distribution, rather than the abundance, of the least-reactive mineral that governed the evolution of the transmissivity of the caprock. Hence, the spatial heterogeneity in minerals can result in barriers to flow, as well as wormholing. They further found that the non-reactive areas present in heterogeneous fractures were not chemically-eroded and could therefore continue to provide mechanical support, which weakens the coupling between geochemical and geomechanical effects. Xiao et al. [83] also demonstrated the role of heterogeneity and the effects of coupled chemical-mechanical processes on the reservoir and caprock during carbon storage sequestration. Their key findings included the observation that, for Morrow shale, mineral precipitation resulted in a ~25% decrease in porosity at the caprock–reservoir boundary, reducing the potential for CO2 ingress, and, furthermore, that the caprock seal efficiency was not affected in terms of its mechanical stability, due to the low risk of induced fractures. This is in contrast with other studies, where chemical changes were found to have a great mechanical effect, for example, changing fault behaviour, which was neglected in this work. In other works, Ojala [125], and Fleury et al. [126] investigated the impact of coupled chemical-mechanical processes on the caprock sealing performance and their results showed that after thousands of years of exposure, only the lowest few meters of the caprock may be affected by the CO2-rich fluid, and the effect on its mechanical properties were minor.
Although a few studies have been performed including both fully coupled chemical-mechanical effects, together with two-phase flow modelling of CO2 injection into a relatively uniform geological formation, only minor attention has been given to the impact of impermeable inter-layers on directing plume migration during and after CO2 injection into a geological formation. For example, Alsayah and Rigby [127] investigated this matter via reservoir simulations which involved setting different (porosity and permeability) heterogeneity levels, thicknesses, and numbers of inter-layers to evaluate the effectiveness of such inter-layers in terms of preventing the upwards migration of CO2 in both the short and long term. Based on the simulation results, the behaviour of the CO2 plume with the presence of inter-layers was very different compared to more homogeneous reservoirs with very thick caprocks. For instance, counter-intuitively, a thinner (0.3 m) shale inter-layer was found to act as a more effective local seal than a thicker (3 m) inter-layer when all coupled processes, including geochemical, geomechanical, and petrophysical heterogeneity; hysteresis; capillary pressure; and diffusion, were included in one model. This odd leakage pattern occurred because the large change in stresses due to the injection process led to a larger increase in the vertical displacement within the thick inter-layer compared to the thin inter-layer, which contributed to the diffusive loss by enhancing the layer surface area. Additionally, the sandstone reservoir porosity increase was also larger (in the case with the thicker shale interlayer) due to the large pressure difference between the initial reservoir and the pore pressure, and this led to large CO2 accumulation under the ultra-low-permeability thick inter-layer, compared with the thinner inter-layer. This large accumulation resulted in significant capillary breakthrough pressure within the thick inter-layer, allowing more scCO2 to enter the inter-layer, which was initially saturated with brine. As a result, more extensive chemical processes occurred within the thick inter-layer, such as a change in pH, higher solubility of CO2 and lower brine salinity, and also faster reactive calcite dissolution, along with other minerals. All of these changes led to an enhancement in the levels of dissolved CO2 at the reservoir/inter-layer boundary, which, in turn, increased the diffusive loss via the thick inter-layer. This ultimately led to 20% of the CO2 leaking, via the thick inter-layer, to the overburden, which was substantially higher leakage than that which occurred for the thinner layer (as shown in Figure 11). This study showed how the inclusion of a fuller complement of coupled physical processes in the simulation can lead to unexpected findings that might otherwise not be predicted using simpler models.
Flow, geochemical, and geomechanical processes can be further coupled to heat flow and thermal effects. However, these latter processes only tend to be of importance when large temperature gradients and/or high temperatures are involved [122], and many injection scenarios are close enough to isothermal to neglect thermal effects.
4. Conclusions
For systems as chemically and geometrically heterogeneous as caprocks and inter-layers, the standard rock core characterisation techniques have been seen to lead to conflictual findings concerning the actual impact that scCO2 exposure has on the pore structure and transport properties of the rock. However, recent research described here has offered some alternatives that will often resolve the issues with standard methods and thus deliver new insights into how scCO2 treatment changes the rock properties. In particular, it has been found that the ISO BET surface area measurement is insufficient for systems as chemically and geometrically heterogeneous as rocks, but the homotattic patch model offers more accurate void space parameter estimations that are also predictive of the changes to mass transport following exposure to scCO2. Overcondensation has been shown to allow gas sorption to be used to probe changes to rock pores from the molecular scale all the way up to very large macropores, for large samples sizes, exceeding the pore size range possible with any single imaging modality, and without the need for the high pressures involved in mercury porosimetry that can damage mechanically weak rock structures. The potential value of the rarely used adsorption calorimetry technique for characterising the structural evolution of rocks has been demonstrated. Alternatives, involving gas sorption scanning, to the more abstract void space segmentation schemes used in direct imaging have been shown to identify physically meaningful sub-sections of the void space that are critical for controlling mass transport following exposure to scCO2. In addition, it has been demonstrated that field-scale reservoir simulations of carbon sequestration need to include all three processes—coupled flow, geochemical and geomechanical processes—to truly provide accurate predictions of plume behaviour that incorporate the critical but counter-intuitive effects that would not otherwise be anticipated for geologically heterogeneous reservoirs. For instance, it has been observed that the complex interaction of these three types of processes leads to thinner inter-layers providing a greater barrier to plume migration than slightly thicker layers.
Author Contributions
All authors have read and agreed to the published version of the manuscript.
Funding
The work of RS was supported by the Engineering and Physical Sciences Research Council (EPSRC) Grant Reference number EP/L016362/1. The work of AA was supported by the GeoNetZero CDT and the University of Nottingham.
Conflicts of Interest
The authors declare no conflict of interest.
References
- Mollaei, A. Forecasting of Isothermal Enhanced Oil Recovery (EOR) and Waterflood Processes. Ph.D. Thesis, University of Texas, Austin, TX, USA, 2011. [Google Scholar]
- Dai, Z.; Middleton, R.; Viswanathan, H.; Fessenden-Rahn, J.; Bauman, J.; Pawar, R.; Lee, S.-Y.; McPherson, B. An integrated framework for optimizing CO2 sequestration and enhanced oil recovery. Environ. Sci. Technol. Lett. 2014, 1, 49–54. [Google Scholar] [CrossRef]
- Dai, Z.; Viswanathan, H.; Middleton, R.; Pan, F.; Ampomah, W.; Yang, C.; Jia, W.; Xiao, T.; Lee, S.-Y.; McPherson, B.; et al. CO2 accounting and risk analysis for CO2 sequestration at enhanced oil recovery sites. Environ. Sci. Technol. 2016, 50, 7546–7554. [Google Scholar] [CrossRef] [PubMed]
- Shukla, R.; Ranjith, P.; Haque, A.; Choi, X. A review of studies on CO2 sequestration and caprock integrity. Fuel 2010, 89, 2651–2664. [Google Scholar] [CrossRef]
- IPCC. IPCC Special Report on Carbon Dioxide Capture and Storage. 2005. Available online: https://www.ipcc.ch/report/carbon-dioxide-capture-and-storage/ (accessed on 1 May 2021).
- Fitts, J.P.; Peters, C.A. Caprock fracture dissolution and CO2 leakage. Rev. Mineral. Geochem. 2013, 77, 459–479. [Google Scholar] [CrossRef]
- Safaei-Farouji, M.; Than, H.V.; Da, Z.; Mehbodniya, A.; Rahimi, M.; Ashraf, U.; Radwan, A.E. Exploring the power of machine learning to predict carbon dioxide trapping efficiency in saline aquifers for carbon geological storage project. J. Clean. Prod. 2022, 372, 133778. [Google Scholar] [CrossRef]
- Alalimi, A.; AlRassas, A.M.; Thanh, H.V.; Al-qaness, M.A.A.; Pan, L.; Ashraf, U.; Al-Alimi, D.; Moharam, S. Developing the efficiency-modeling framework to explore the potential of CO2 storage capacity of S3 reservoir, Tahe oilfield, China. Geomech. Geophys. Geo-Energy Geo-Resour. 2022, 8, 128. [Google Scholar] [CrossRef]
- Safaei-Farouji, M.; Thanh, H.V.; Dashtgoli, D.S.; Yasind, Q.; Radwan, A.E.; Ashraf, U.; Lee, K.-K. Application of robust intelligent schemes for accurate modelling interfacial tension of CO2 brine systems: Implications for structural CO2 trapping. Fuel 2022, 319, 123821. [Google Scholar] [CrossRef]
- Thanh, H.V.; Sugai, Y.; Sasaki, K. Application of artificial neural network for predicting the performance of CO2 enhanced oil recovery and storage in residual oil zones. Sci. Rep. 2020, 10, 18204. [Google Scholar] [CrossRef]
- Thanh, H.V.; Sugai, Y.; Nguele, R.; Sasaki, K. Integrated workflow in 3D geological model construction for evaluation of CO2 storage capacity of a fractured basement reservoir in Cuu Long Basin, Vietnam. Int. J. Greenh. Gas Control 2019, 90, 102826. [Google Scholar] [CrossRef]
- Thanh, H.V.; Sugai, Y.; Nguele, R.; Sasaki, K. Robust optimization of CO2 sequestration through a water alternating gas process under geological uncertainties in Cuu Long Basin, Vietnam. J. Nat. Gas Sci. Eng. 2020, 76, 103208. [Google Scholar] [CrossRef]
- Goodman, A.; Sanguinito, S.; Tkach, M. Investigating the role of water on CO2-Utica Shale interactions for carbon storage and shale gas extraction activities—Evidence for pore scale alterations. Fuel 2019, 242, 744–755. [Google Scholar] [CrossRef]
- Czernichowski-Lauriol, I.; Rochelle, C.; Gaus, I.; Azaroual, M.; Pearce, J.; Durst, P. Geochemical Interactions Between CO2, Pore-Waters and Reservoir Rocks; Springer: Dordrecht, Germany, 2006. [Google Scholar] [CrossRef]
- Liu, F.; Lu, P.; Griffith, C.; Hedges, S.W.; Soong, Y.; Hellevang, H.; Zhu, C. CO2-brine-caprock interaction: Reactivity experiments on Eau Claire shale and a review of relevant literature. Int. J. Greenh. Gas Control 2012, 7, 153–167. [Google Scholar] [CrossRef] [Green Version]
- Spanakos, D.; Rigby, S.P. Evaluation of impact of surface diffusion on methane recovery via carbon dioxide injection in shale reservoirs. Fuel 2022, 307, 121928. [Google Scholar] [CrossRef]
- Ao, X.; Lu, Y.; Tang, J.; Chen, Y.; Li, H. Investigation on the physics structure and chemical properties of the shale treated by supercritical CO2. J. CO2 Util. 2017, 20, 274–281. [Google Scholar] [CrossRef]
- Harrison, A.L.; Jew, A.D.; Dustin, M.K.; Thomas, D.L.; Joe-Wong, C.M.; Bargar, J.R.; Johnson, N.; Brown, G.E.; Maher, K. Element release and reaction-induced porosity alteration during shale-hydraulic fracturing fluid interactions. Appl. Geochem. 2017, 82, 47–62. [Google Scholar] [CrossRef]
- Gaus, I. Role and impact of CO2-rock interactions during CO2 storage in sedimentary rocks. Int. J. Greenh. Gas Control 2010, 4, 73–89. [Google Scholar] [CrossRef]
- Karstens, J.; Ahmed, W.; Berndt, C.; Class, H. Focused fluid flow and the sub-seabed storage of CO2: Evaluating the leakage potential of seismic chimney structures for the Sleipner CO2 storage operation. J. Mar. Petrol. Geol. 2017, 88, 81–93. [Google Scholar] [CrossRef]
- Loring, J.S.; Miller, Q.R.S.; Thompson, C.J.; Schaef, H.T. Experimental Studies of Reactivity and Transformations of Rocks and Minerals in Water-Bearing Supercritical CO2. In Science of Carbon Storage in Deep Saline Formations; Newell, P., Ilgen, A.G., Eds.; Elsevier: Cham, The Netherlands, 2019; pp. 63–88. [Google Scholar] [CrossRef]
- Gysi, A.P.; Stefánsson, A. Numerical modelling of CO2-water-basalt interaction. Mineral. Mag. 2008, 72, 55–59. [Google Scholar] [CrossRef]
- Hövelmann, J.; Austrheim, H.; Jamtveit, B. ‘Microstructure and porosity evolution during experimental carbonation of a natural peridotite’, Chemical Geology. Chem. Geol. 2012, 334, 254–265. [Google Scholar] [CrossRef]
- Hovorka, S.D.; Lu, J. Field observations of geochemical response to CO2 injection at the reservoir scale. In Science of Carbon Storage in Deep Saline Formations; Newell, P., Ilgen, A.G., Eds.; Elsevier: Cham, The Netherlands, 2019; pp. 33–61. [Google Scholar] [CrossRef]
- Goodman, A.; Sanguinito, S.; Kutchko, B.; Natesakhawat, S.; Cvetic, P.; Allen, A.J. Shale pore alteration: Potential implications for hydrocarbon extraction and CO2 storage. Fuel 2020, 89, 116930. [Google Scholar] [CrossRef]
- Kervévan, C.; Azaroual, M.; Durst, P. Improvement of the Calculation Accuracy of Acid Gas Solubility in Deep Reservoir Brines: Application to the Geological Storage of CO2. Oil Gas Sci. Technol. 2005, 60, 357–379. [Google Scholar] [CrossRef] [Green Version]
- Duan, Z.; Sun, R. An improved model calculating CO2 solubility in pure water and aqueous NaCl solutions from 273 to 533 K and from 0 to 2000 bar. Chem. Geol. 2003, 193, 257–271. [Google Scholar] [CrossRef]
- Zhu, C. In situ silicate reaction rates in sandy aquifers. Geochim. Et Cosmochim. Acta 2006, 70, A753. [Google Scholar] [CrossRef]
- Loring, J.S.; Thompson, C.J.; Wang, Z.; Joly, A.G.; Sklarew, D.S.; Schaef, H.T.; Ilton, E.S.; Rosso, K.M.; Felmy, A.R. In situ infrared spectroscopic study of forsterite carbonation in wet supercritical CO2. Environ. Sci. Technol. 2011, 45, 6204–6210. [Google Scholar] [CrossRef] [PubMed]
- Miller, Q.R.S.; Thompson, C.J.; Loring, J.S.; Windisch, C.F.; Rosso, K.M.; Schaef, H.T. Insights into silicate carbonation processes in water-bearing supercritical CO2 fluids. Int. J. Greenh. Gas Control 2013, 15, 104–118. [Google Scholar] [CrossRef]
- Schaef, H.T.; Thompson, C.J.; Loring, J.S.; Bowden, M.S.; Arey, B.W.; McGrail, B.P.; Rosso, K.M. Silicate carbonation in supercritical CO2 containing dissolved H2O: An in situ high pressure X-Ray diffraction and infrared spectroscopy study. Energy Procedia 2013, 37, 5892–5896. [Google Scholar] [CrossRef] [Green Version]
- Huang, X.; Zhao, Y.P.; Wang, X.; Pan, L. Adsorption-induced pore blocking and its mechanisms in nanoporous shale due to interactions with supercritical CO2. J. Pet. Sci. Eng. 2019, 178, 74–81. [Google Scholar] [CrossRef]
- Jiang, Y.; Luo, Y.; Lu, Y.; Qin, C.; Liu, H. Effects of supercritical CO2 treatment time, pressure, and temperature on microstructure of shale. Energy 2016, 97, 173–181. [Google Scholar] [CrossRef]
- Hong, L.; Romanov, V. Experimental studies: Molecular interactions at clay interfaces. In Greenhouse Gases and Clay Minerals; Romanov, V., Ed.; Springer: Cham, Switzerland, 2018; pp. 95–123. [Google Scholar] [CrossRef]
- Lasaga, A.C.; Soler, J.M.; Ganor, J.; Burch, T.E.; Nagy, K.L. Chemical weathering rate laws and global geochemical cycles. Geochim. Et Cosmochim. Acta 1994, 58, 2361–2386. [Google Scholar] [CrossRef]
- Pan, Y.; Hui, D.; Luo, P.; Zhang, Y.; Sun, L.; Wang, K. Experimental Investigation of the Geochemical Interactions between Supercritical CO2 and Shale: Implications for CO2 Storage in Gas-Bearing Shale Formations. Energy Fuels 2018, 32, 1963–1978. [Google Scholar] [CrossRef]
- Ilton, E.S.; Schaef, H.T.; Qafoku, O.; Rosso, K.M.; Felmy, A.R. In situ X-ray diffraction study of Na+ saturated montmorillonite exposed to variably wet super critical CO2. Environ. Sci. Technol. 2012, 46, 4241–4248. [Google Scholar] [CrossRef]
- Schaef, H.T.; Ilton, E.S.; Qafoku, O.; Martin, P.F.; Felmy, A.R.; Rosso, K.M. In situ XRD study of Ca2+ saturated montmorillonite (STX-1) exposed to anhydrous and wet supercritical carbon dioxide. Int. J. Greenh. Gas Control 2012, 6, 220–229. [Google Scholar] [CrossRef]
- Schaef, H.T.; Loring, J.S.; Glezakou, V.-A.; Miller, Q.R.S.; Thompson, C.J. Competitive sorption of CO2 and H2O in 2:1 layer phyllosilicates. Geochim. Et Cosmochim. Acta 2015, 161, 248–257. [Google Scholar] [CrossRef] [Green Version]
- Shao, H.; Ray, J.R.; Jun, Y.S. Effects of salinity and the extent of water on supercritical CO2-induced phlogopite dissolution and secondary mineral formation. Environ. Sci. Technol. 2011, 45, 1737–1743. [Google Scholar] [CrossRef] [PubMed]
- Bryan, C.R.; Dewers, T.A.; Heath, J.E.; Wang, Y.; Matteo, E.N.; Meserole, S.P.; Tallant, D. Fundamental Study of CO2-H2O-Mineral Interactions for Carbon Sequestration, with Emphasis on the Nature of the Supercritical Fluid-Mineral Interface. Available online: http://www.ntis.gov/help/ordermethods.asp?loc=7-4-0#online (accessed on 29 April 2020).
- Schembre, J.M.; Kovscek, A.R. Mechanism of formation damage at elevated temperature’, Journal of Energy Resources Technology. Trans. ASME 2005, 127, 171–180. [Google Scholar] [CrossRef]
- Lin, H.; Fujii, T.; Takisawa, R.; Takahashi, T.; Hashida, T. Experimental evaluation of interactions in supercritical CO2/water/rock minerals system under geologic CO2 sequestration conditions. J. Mater. Sci. 2008, 43, 2307–2315. [Google Scholar] [CrossRef]
- Schaef, H.T.; McGrail, B.P.; Owen, A.T. Basalt reactivity variability with reservoir depth in supercritical CO2 and aqueous phases. Energy Procedia 2011, 4, 4977–4984. [Google Scholar] [CrossRef] [Green Version]
- Regnault, O.; Lagneau, V.; Catalette, H.; Schneider, H. Étude expérimentale de la réactivité du CO2 supercritique vis-à-vis de phases minérales pures. Implications pour la séquestration géologique de CO2. Comptes Rendus Geosci. 2005, 337, 1331–1339. [Google Scholar] [CrossRef]
- Adler, H.H.; Kerr, P.F. Infrared spectra, symmetry and structure relations of some carbonate minerals. Am. Mineral. J. Earth Planet. Mater. 1963, 48, 839–853. [Google Scholar]
- Edwards, H.G.M.; Jorge Villar, S.E.; Jehlicka, J.; Munshi, T. FT-Raman spectroscopic study of calcium-rich and magnesium-rich carbonate minerals. Spectrochim. Acta Part A: Mol. Biomol. Spectrosc. 2005, 61, 2273–2280. [Google Scholar] [CrossRef]
- Kaszuba, J.; Yardley, B.; Andreani, M. Experimental perspectives of mineral dissolution and precipitation due to carbon dioxide-water-rock interactions. Rev. Mineral. Geochem. 2013, 77, 153–188. [Google Scholar] [CrossRef]
- Rathnaweera, T.D.; Ranjith, P.G.; Perera, M.S.A. Experimental investigation of geochemical and mineralogical effects of CO2 sequestration on flow characteristics of reservoir rock in deep saline aquifers. Sci. Rep. 2016, 6, 19362. [Google Scholar] [CrossRef] [PubMed] [Green Version]
- Sanguinito, S.; Goodman, S.; Tkach, M.; Kutchko, B.; Culp, J.; Natesakhawata, S.; Fazio, J.; Fukai, I.; Crandall, D. Quantifying dry supercritical CO2-induced changes of the Utica Shale. Fuel 2018, 226, 54–64. [Google Scholar] [CrossRef] [Green Version]
- Ardakani, O.H.; Sanei, H.; Ghanizadeh, A.; Lavoie, D.; Clarkson, C.R. Do all fractions of organic matter contribute equally in shale porosity? A case study from Upper Ordovician Utica Shale, southern Quebec, Canada. Mar. Pet. Geol. 2018, 92, 794–808. [Google Scholar] [CrossRef]
- Loucks, R.G.; Reed, R.M.; Ruppel, S.C.; Hammes, U. Spectrum of pore types and networks in mudrocks and a descriptive classification for matrix-related mudrock pores. AAPG Bull. 2012, 96, 1071–1098. [Google Scholar] [CrossRef] [Green Version]
- Lu, J.; Nicot, J.P.; Mickler, P.J.; Ribeiro, L.H.; Darvari, R. Alteration of Bakken reservoir rock during CO2-based fracturing—An autoclave reaction experiment. J. Unconv. Oil Gas 2016, 14, 72–85. [Google Scholar] [CrossRef]
- Yin, H.; Zhou, J.; Jiang, Y.; Xian, X.; Liu, Q. Physical and structural changes in shale associated with supercritical CO2 exposure. Fuel 2016, 184, 289–303. [Google Scholar] [CrossRef]
- Pan, Y.; Hui, D.; Luo, P.; Zhang, Y.; Zhang, L.; Sun, L. Influences of subcritical and supercritical CO2 treatment on the pore structure characteristics of marine and terrestrial shales. J. CO2 Util. 2018, 28, 152–167. [Google Scholar] [CrossRef]
- Lahann, R.; Masterlerz, M.; Rupp, J.A.; Drobniak, A. Influence of CO2 on New Albany Shale composition and pore structure. Int. J. Coal Geol. 2013, 108, 2–9. [Google Scholar] [CrossRef]
- Hadian, P.; Rezaee, R. The Effect of Supercritical CO2 on Shaly Caprocks. Energies 2019, 13, 149. [Google Scholar] [CrossRef] [Green Version]
- Busch, A.; Alles, S.; Krooss, B.M.; Stanjek, H.; Dewhurst, D. Effects of physical sorption and chemical reactions of CO2 in shaly caprocks. Energy Procedia 2009, 1, 3229–3235. [Google Scholar] [CrossRef] [Green Version]
- Bateman, K.; Rochelle, C.A.; Purser, G.; Kemp, S.J.; Wagner, D. Geochemical Interactions Between CO2 and Minerals within the Utsira Caprock: A 5-year Experimental Study. Energy Procedia 2013, 37, 5307–5314. [Google Scholar] [CrossRef]
- Johnson, J.W.; Nitao, J.J.; Knauss, K.G. Reactive Transport Modelling of CO2 Storage in Saline Aquifers to Elucidate Fundamental Processes, Trapping Mechanisms and Sequestration Partitioning’, Geological Society Special Publication; Geological Society: London, UK, 2004; Volume 233, pp. 107–128. [Google Scholar] [CrossRef] [Green Version]
- Rigby, S.P. Structural Characterisation of Natural and Industrial Porous Materials: A Manual; Springer International Publishing: Cham, Switzerland, 2020. [Google Scholar]
- Walker WC, Zettlemoyer AC A dual-surface BET adsorption theory. Y. Phys. Colloid Chem. 1948, 52, 47–58. [CrossRef] [PubMed]
- Ng, K.C.; Burhan, M.; Shahzad, M.W.; Bin Ismail, A. A universal isotherm model to capture adsorption uptake and energy distribution of porous heterogeneous surface. Sci. Rep. 2017, 7, 10634. [Google Scholar] [CrossRef] [PubMed] [Green Version]
- BS ISO 9277; 2010 Determination of the Specific Surface Area of Solids by Gas Adsorption—BET Method. International Standards Organisation (ISO): Geneva, Switzerland, 2010.
- Rouquerol, F.; Rouquerol, J.; Sing, K. Adsorption by Powders and Porous Solids: Principles, Methodology and Applications; Academic Press: London, UK, 1999. [Google Scholar]
- Avnir, D.; Farin, D. Molecular fractal surfaces. Nature 1984, 308, 261–263. [Google Scholar] [CrossRef]
- Mahnke, M.; Mögel, H.J. Fractal Analysis of Physical Adsorption on Material Surfaces. Colloids Surf. A 2003, 216, 215–228. [Google Scholar] [CrossRef]
- Seely, R.; Liddy, T.J.; Rochelle, C.A.; Fletcher, R.S.; Rigby, S.P. Evolution of the mineralogy, pore structure and transport properties of Nordland Shale following exposure to supercritical carbon dioxide. J. Pet. Sci. Eng. 2022, 213, 110466. [Google Scholar] [CrossRef]
- Pitcher, E.G.; Large, D.J.; Fletcher, R.S.; Rigby, S.P. Multi-scale pore structural change across a paleodepositional transition in Utica shale probed by gas sorption overcondensation and scanning. Mar. Pet. Geol. 2021, 134, 105348. [Google Scholar] [CrossRef]
- Rigby, S.P.; Stevens, L.; Meersmann, T.; Pavloskaya, G.E.; Rees, G.J.; Henderson, J.; Bryant, S.J.; Edler, K.J.; Fletcher, R.S. Structural and chemical heterogeneity in ancient glass probed using gas overcondensation, X-ray tomography, and solid-state NMR. Mater. Charact. 2020, 167, 110467. [Google Scholar] [CrossRef]
- Rigby, S.P.; Jahan, H.; Stevens, L.; Uguna, C.; Snape, C.; Macnaughton, B.; Large, D.J.; Fletcher, R.S. Pore structural evolution of shale following thermochemical treatment. Mar. Pet. Geol. 2020, 112, 104058. [Google Scholar] [CrossRef]
- Gregg, S.J.; Sing, K.S.W. Adsorption, Surface Area and Porosity, 2nd ed.; Academic Press: London, UK, 1982. [Google Scholar]
- Baldwin, C.A.; Sederman, A.J.; Mantle, M.D.; Alexander, P.; Gladden, L.F. Determination and characterization of the structure of a pore space from 3D volume images. J. Colloid Interface Sci. 1996, 181, 79–92. [Google Scholar] [CrossRef]
- Rigby, S.P. Recent Developments in the Structural Characterisation of Disordered, Mesoporous Solids. JMTR 2018, 62, 296–312. [Google Scholar] [CrossRef]
- Pitcher, E.G.; Fletcher, R.S.; Large, D.J.; Rigby, S.P. Pore Structure-Transport Relationships in Bowland Shale. In Processes and Resources in Fine-Grained Sedimentary Rocks; Emmings, J., Ed.; Geological Society of London: London, UK, 2023; in press. [Google Scholar]
- Auroux, A. Calorimetry and Thermal Methods in Catalysis; Springer: Berlin, Germany, 2013. [Google Scholar]
- Woo, H.J.; Monson, P.A. Phase behavior and dynamics of fluids in mesoporous glasses. Phys. Rev. E 2003, 67, 041207. [Google Scholar] [CrossRef] [PubMed]
- Desouza, A.; Monson, P.A. Modeling fluids confined in three-dimensionally ordered mesoporous carbons. Adsorption 2021, 27, 253–264. [Google Scholar] [CrossRef]
- Onoja, M.U.; Williams, J.D.O.; Vosper, H.; Shariatipour, S.M. Effect of sedimentary heterogeneities in the sealing formation on predictive analysis of geological CO2 storage. Int. J. Greenh. Gas Control 2019, 82, 229–243. [Google Scholar] [CrossRef] [Green Version]
- Kvamme, B.; Liu, S. Reactive transport of CO2 in saline aquifers with implicit geomechanical analysis. Energy Procedia 2009, 1, 3267–3274. [Google Scholar] [CrossRef]
- Nguyen, B.N.; Hou, Z.; Bacon, D.H.; Murray, C.J.; White, M.D. Three-dimensional modelling of the reactive transport of CO2 and its impact on geomechanical properties of reservoir rocks and seals. Int. J. Greenh. Gas Control 2016, 46, 100–115. [Google Scholar] [CrossRef] [Green Version]
- Song, J.; Zhang, D. Comprehensive review of caprock-sealing mechanisms for geologic carbon sequestration. Environ. Sci. Technol. 2013, 47, 9. [Google Scholar] [CrossRef]
- Xiao, T.; Xu, H.; Moodie, N.; Esser, R.; Jia, W.; Zheng, L.; Rutqvist, J.; McPherson, B. Chemical-Mechanical Impacts of CO2 Intrusion into Heterogeneous Caprock. Wat. Resour. Res. 2020, 56, e2020WR027193. [Google Scholar] [CrossRef]
- Newell, P.; Ilgen, A.G. Science of Carbon Storage in deep Saline Formations: Process Coupling Across Time and Spatial Scales; Elsevier: Amsterdam, The Netherlands, 2019. [Google Scholar]
- Zweigel, P.; Lothe, A.E.; Arts, R.; Hamborg, M. Reservoir Geology of the Storage Units in the Sleipner CO2-Injection Case. Sintef Petroleum Research Report No., 23.4285.00/02/00. Available online: https://www.sintef.no/globalassets/project/ik23430000-sacs/technical-reports/zweigeletal_2000_reservoirreport_text.pdf (accessed on 25 August 2022).
- Agartan, E.; Cihan, A.; Illangasekare, T.H.; Zhou, Q.; Birkholzer, J.T. Mixing and trapping of dissolved CO2 in deep geologic formations with shale layers. Adv. Water Res. 2017, 105, 67–81. [Google Scholar] [CrossRef] [Green Version]
- Parker, B.L.; Chapman, S.W.; Guilbeault, M.A. Plume persistence caused by back diffusion from thin clay layers in a sand aquifer following TCE source-zone hydraulic isolation. J. Contam. Hydrol. 2008, 102, 86–104. [Google Scholar] [CrossRef] [PubMed]
- Kampman, N.; Busch, A.; Bertier, P.; Snippe, J.; Hangx, S.; Pipich, V.; Di, Z.; Rother, G.; Harrington, J.; Evans, J.; et al. Observational evidence confirms modelling of the long-term integrity of CO2-reservoir caprocks. Nat Commun. 2016, 7, 12268. [Google Scholar] [CrossRef] [PubMed] [Green Version]
- Patil, V.; McPherson, B.; Priewisch, A.; Moore, J.; Moodie, N. Factors affecting self-sealing of geological faults due to CO2-leakage. Greenh. Gases: Sci. Technol. 2017, 7, 273–294. [Google Scholar] [CrossRef]
- Wangen, M. A 3D model for chimney formation in sedimentary basins. Comput. Geosci. 2020, 137, 104429. [Google Scholar] [CrossRef]
- Espinoza, D.N.; Santamarina, J.C. CO2 breakthrough—Caprock sealing efficiency and integrity for carbon geological storage. Int. J. Greenh. Gas Control 2017, 66, 218–229. [Google Scholar] [CrossRef] [Green Version]
- Alkan, H.; Cinar, Y.; Ülker, E. Impact of Capillary Pressure, Salinity and in situ Conditions on CO2 Injection into Saline Aquifers. Transp. Porous Media 2010, 84, 799–819. [Google Scholar] [CrossRef]
- Rohmer, J.; Seyedi, D. Coupled Large Scale Hydromechanical Modelling for Caprock Failure Risk Assessment of CO2 Storage in Deep Saline Aquifers. Oil Gas Sci. Technol. 2010, 65, 503–517. [Google Scholar] [CrossRef] [Green Version]
- Rutqvist, J.; Birkholzer, J.; Cappa, F.; Tsang, C.F. Estimating maximum sustainable injection pressure during geological sequestration of CO2 using coupled fluid flow and geomechanical fault-slip analysis. Energy Convers. Manag. 2007, 48, 1798–1807. [Google Scholar] [CrossRef] [Green Version]
- Vidal-Gilbert, S.; Nauroy, J.-F.; Brosse, E. 3D geomechanical modelling for CO2 geologic storage in the Dogger carbonates of the Paris Basin. Int. J. Greenh. Gas Control 2009, 3, 288–299. [Google Scholar] [CrossRef]
- Vilarrasa, V.; Bolster, D.; Olivella, S.; Carrera, J. Coupled hydromechanical modeling of CO2 sequestration in deep saline aquifers. Int. J. Greenh. Gas Control 2010, 4, 910–919. [Google Scholar] [CrossRef] [Green Version]
- Streit, J.E.; Hillis, R.R. Estimating fault stability and sustainable fluid pressures for underground storage of CO2 in porous rock. Energy 2004, 29, 1445–1456. [Google Scholar] [CrossRef]
- Rutqvist, J.; Birkholzer, J.T.; Tsang, C.-F. Coupled reservoir–geomechanical analysis of the potential for tensile and shear failure associated with CO2 injection in multilayered reservoir–caprock systems. Int. J. Rock Mech. Min. Sci. 2008, 45, 132–143. [Google Scholar] [CrossRef] [Green Version]
- Hows, A.; Zoback, M.; Gupta, N.; Ramakrishnan, T. Geomechanical aspects of CO2 sequestration in a deep saline reservoir in the Ohio River Valley region. Environ. Geosci. 2006, 13, 85–103. [Google Scholar]
- Rutqvist, J.; Vasco, D.W.; Myer, L. Coupled reservoir-geomechanical analysis of CO2 injection and ground deformations at In Salah, Algeria. Int. J. Greenh. Gas Control 2010, 4, 225–230. [Google Scholar] [CrossRef] [Green Version]
- Morris, J.P.; Hao, Y.; Foxall, W.; McNab, W. In Salah CO2 storage JIP: Hydromechanical simulations of surface uplift due to CO2 injection at In Salah. Energy Procedia 2011, 4, 3269–3275. [Google Scholar] [CrossRef] [Green Version]
- Bissell, R.C.; Vasco, D.W.; Atbi, M.; Hamdani, M.; Okwelegbe, M.; Goldwater, M.H. A full field simulation of the In Salah gas production and CO2 storage project using a coupled geo-mechanical and thermal flow simulator. Energy Procedia 2011, 4, 3290–3297. [Google Scholar] [CrossRef] [Green Version]
- Zoback, M.D.; Gorelick, M. Earthquake triggering and large-scale geologic storage of carbon dioxide. Proc. Natl. Acad. Sci. USA 2012, 109, 10164–10168. [Google Scholar] [CrossRef]
- Martinez, M.J.; Newell, P.; Bishop, J.E.; Turner, D.Z. Coupled multiphase flow and geomechanics model for analysis of joint reactivation during CO2 sequestration operations. Int. J. Greenh. Gas Control 2013, 17, 148–160. [Google Scholar] [CrossRef]
- Pan, P.-Z.; Rutqvist, J.; Feng, X.-T.; Yan, F. TOUGH–RDCA modeling of multiple fracture interactions in caprock during CO2 injection into a deep brine aquifer. Comput. Geosci. 2014, 65, 24–36. [Google Scholar] [CrossRef]
- Lee, J.; Min, K.-B.; Rutqvist, J. Probabilistic Analysis of Fracture Reactivation Associated with Deep Underground CO2 Injection. Rock Mech. Rock Eng. 2013, 46, 801–820. [Google Scholar] [CrossRef] [Green Version]
- Siriwardane, H.J.; Gondle, R.K.; Bromhal, G.S. Coupled Flow and Deformation Modeling of Carbon Dioxide Migration in the Presence of a Caprock Fracture during Injection. Energy Fuels 2013, 27, 4232–4243. [Google Scholar] [CrossRef]
- Huang, Z.-Q.; Winterfeld, P.H.; Xiong, Y.; Wu, Y.-S.; Yao, J. Parallel simulation of fully-coupled thermal-hydro-mechanical processes in CO2 leakage through fluid-driven fracture zones. Int. J. Greenh. Gas Control 2015, 34, 39–51. [Google Scholar] [CrossRef]
- Wangen, M.; Gasda, S.; Bjornara, T. Geomechanical consequences of large-scale fluid storage in the Utsira Formation in the North Sea. Energy Procedia 2016, 97, 486–493. [Google Scholar] [CrossRef] [Green Version]
- Busch, A.; Hangx, S.J.T.; Marshall, J.D.; Wentinck, H.M. Swelling clay minerals and containment risk assessment for the storage seal of the Peterhead CCS project. Int. J. Greenh. Gas Control 2020, 94, 102924. [Google Scholar] [CrossRef]
- Dai, Z.; Xu, L.; Xiao, T.; McPherson, B.; Zhang, X.; Zheng, L.; Dong, S.; Yang, Z.; Soltanian, M.; Yang, C.; et al. Reactive chemical transport simulations of geologic carbon sequestration: Methods and applications. Earth-Sci. Rev. 2020, 208, 103265. [Google Scholar] [CrossRef]
- Bakker, E.; Kaszuba, J.; Den Hartog, S.; Hangx, S. Chemo-mechanical behavior of clay-rich fault gouges affected by CO2 -brine-rock interactions: Original Research Article: Chemo-mechanical behavior of clay-rich fault gouges. Greenh. Gases: Sci. Technol. 2018, 9, 19–36. [Google Scholar] [CrossRef] [Green Version]
- Khan, C.; Ge, L.; Rudolph, V. Reservoir Simulation Study for CO2 Sequestration in Saline Aquifers. Int. J. Appl. Sci. Technol. 2015, 4, 30–45. [Google Scholar]
- Yang, G.; Ma, X.; Feng, T.; Ying, Y.; Yin, S.; Huang, M.; Wang, Y. Geochemical modelling of the evolution of caprock sealing capacity at the Shenhua CCS demonstration project. Minerals 2020, 10, 1009. [Google Scholar] [CrossRef]
- Ma, X.; Yang, G.; Li, X.; Yu, Y.; Dong, J. Geochemical modeling of changes in caprock permeability caused by CO2 –brine–rock interactions under the diffusion mechanism. Oil Gas Sci. Technol. 2019, 74, 83. [Google Scholar] [CrossRef] [Green Version]
- Armitage, P.J.; Worden, R.H.; Faulkner, D.R.; Butcher, A.R.; Espie, A.A. Permeability of the Mercia Mudstone: Suitability as caprock to carbon capture and storage sites. Geofluids 2016, 16, 26–42. [Google Scholar] [CrossRef]
- Green, C.; Ennis-King, J. Effect of Vertical Heterogeneity on Long-Term Migration of CO2 in Saline Formations. Transp. Porous Media 2009, 82, 31–47. [Google Scholar] [CrossRef]
- Kumar, A.; Noh, M.; Pope, G.A.; Sepehrnoori, K.; Bryant, S.; Lake, L.W. Reservoir Simulation of CO2 Storage in Deep Saline Aquifers. In Proceedings of the SPE/DOE Symposium on Improved Oil Recovery, Tulsa, OK, USA, 17 April 2004; SPE-89343-MS. [Google Scholar]
- Liu, H.; Hou, Z.; Were, P.; Gou, Y.; Xiong, L.; Sun, X. Modelling CO2-brine-rock interactions in the Upper Paleozoic formations of Ordos Basin used for CO2 sequestration. Environ. Earth Sci. 2014, 73, 2205–2222. [Google Scholar] [CrossRef]
- Wang, S.; Cheng, Z.; Zhang, Y.; Jiang, L.; Liu, Y.; Song, Y. Unstable Density Driven Convection of CO2 in Homogeneous and Heterogeneous Porous Media with Implications for Deep Saline Aquifers. Water Resour. Res. 2021, 57, e28132. [Google Scholar]
- Ghanbari, S.; Al-Zaabi, Y.; Pickup, G.E.; Mackay, E.; Gozalpour, F.; Todd, A.C. Simulation of CO2 Storage in Saline Aquifers. Chem. Eng. Res. Des. 2006, 84, 764–775. [Google Scholar] [CrossRef] [Green Version]
- Yong, W.P.; Azahree, A.I.; Ali, S.S.; Jaafar Azuddin, F.; Amin, S. A New Modelling Approach to Simulate CO2 Movement and Containment Coupled with Geochemical Reactions and Geomechanical Effects for an Offshore CO2 Storage in Malaysia. In Proceedings of the SPE Europec Featured at 81st EAGE Conference and Exhibition, London, UK, 3–6 June 2019; D041S008R010. [Google Scholar]
- Zhang, Y.; Xue, Z.; Park, H.; Shi, J.-Q.; Kiyama, T.; LEei, X.; Sun, Y.; Liang, Y. Tracking CO2 Plumes in Clay-Rich Rock by Distributed Fiber Optic Strain Sensing (DFOSS): A Laboratory Demonstration. Water Resour. Res. 2019, 55, 856–867. [Google Scholar] [CrossRef] [Green Version]
- Spokas, K.; Peters, C.A.; Pyrak-Nolte, L. Influence of Rock Mineralogy on Reactive Fracture Evolution in Carbonate-Rich Caprocks. Environ. Sci. Technol. 2018, 52, 10144–10152. [Google Scholar] [CrossRef]
- Ojala, I.O. The effect of CO2 on the mechanical properties of reservoir and cap rock. Energy Procedia 2011, 4, 5392–5397. [Google Scholar] [CrossRef] [Green Version]
- Fleury, M.; Pironon, J.; Nindre, L.E.; Bildstein, O.; Berne, P.; Lagneau, V.; Broseta, D.; Pichery, T.; Fillacier, S.; Lescanne, M.; et al. Evaluating sealing efficiency of caprocks for CO2 storage: An overviewof the Geocarbone Integrity program and results. Energy Procedia 2011, 4, 5227–5234. [Google Scholar] [CrossRef]
- Alsayah, A.; Rigby, S.P. Coupled multiphase flow, geochemical, and geomechanical modelling of the impact of shale interlayers on CO2 migration. 2022. submitted for publication. [Google Scholar]
Figure 1.
Schematic diagram showing the structure of this review.

Figure 2.
Summary of potential CO2 injection schemes and various CO2–rock interactions. Reprinted from Gaus [19]. Copyright (2010), with permission from Elsevier.
Figure 2.
Summary of potential CO2 injection schemes and various CO2–rock interactions. Reprinted from Gaus [19]. Copyright (2010), with permission from Elsevier.
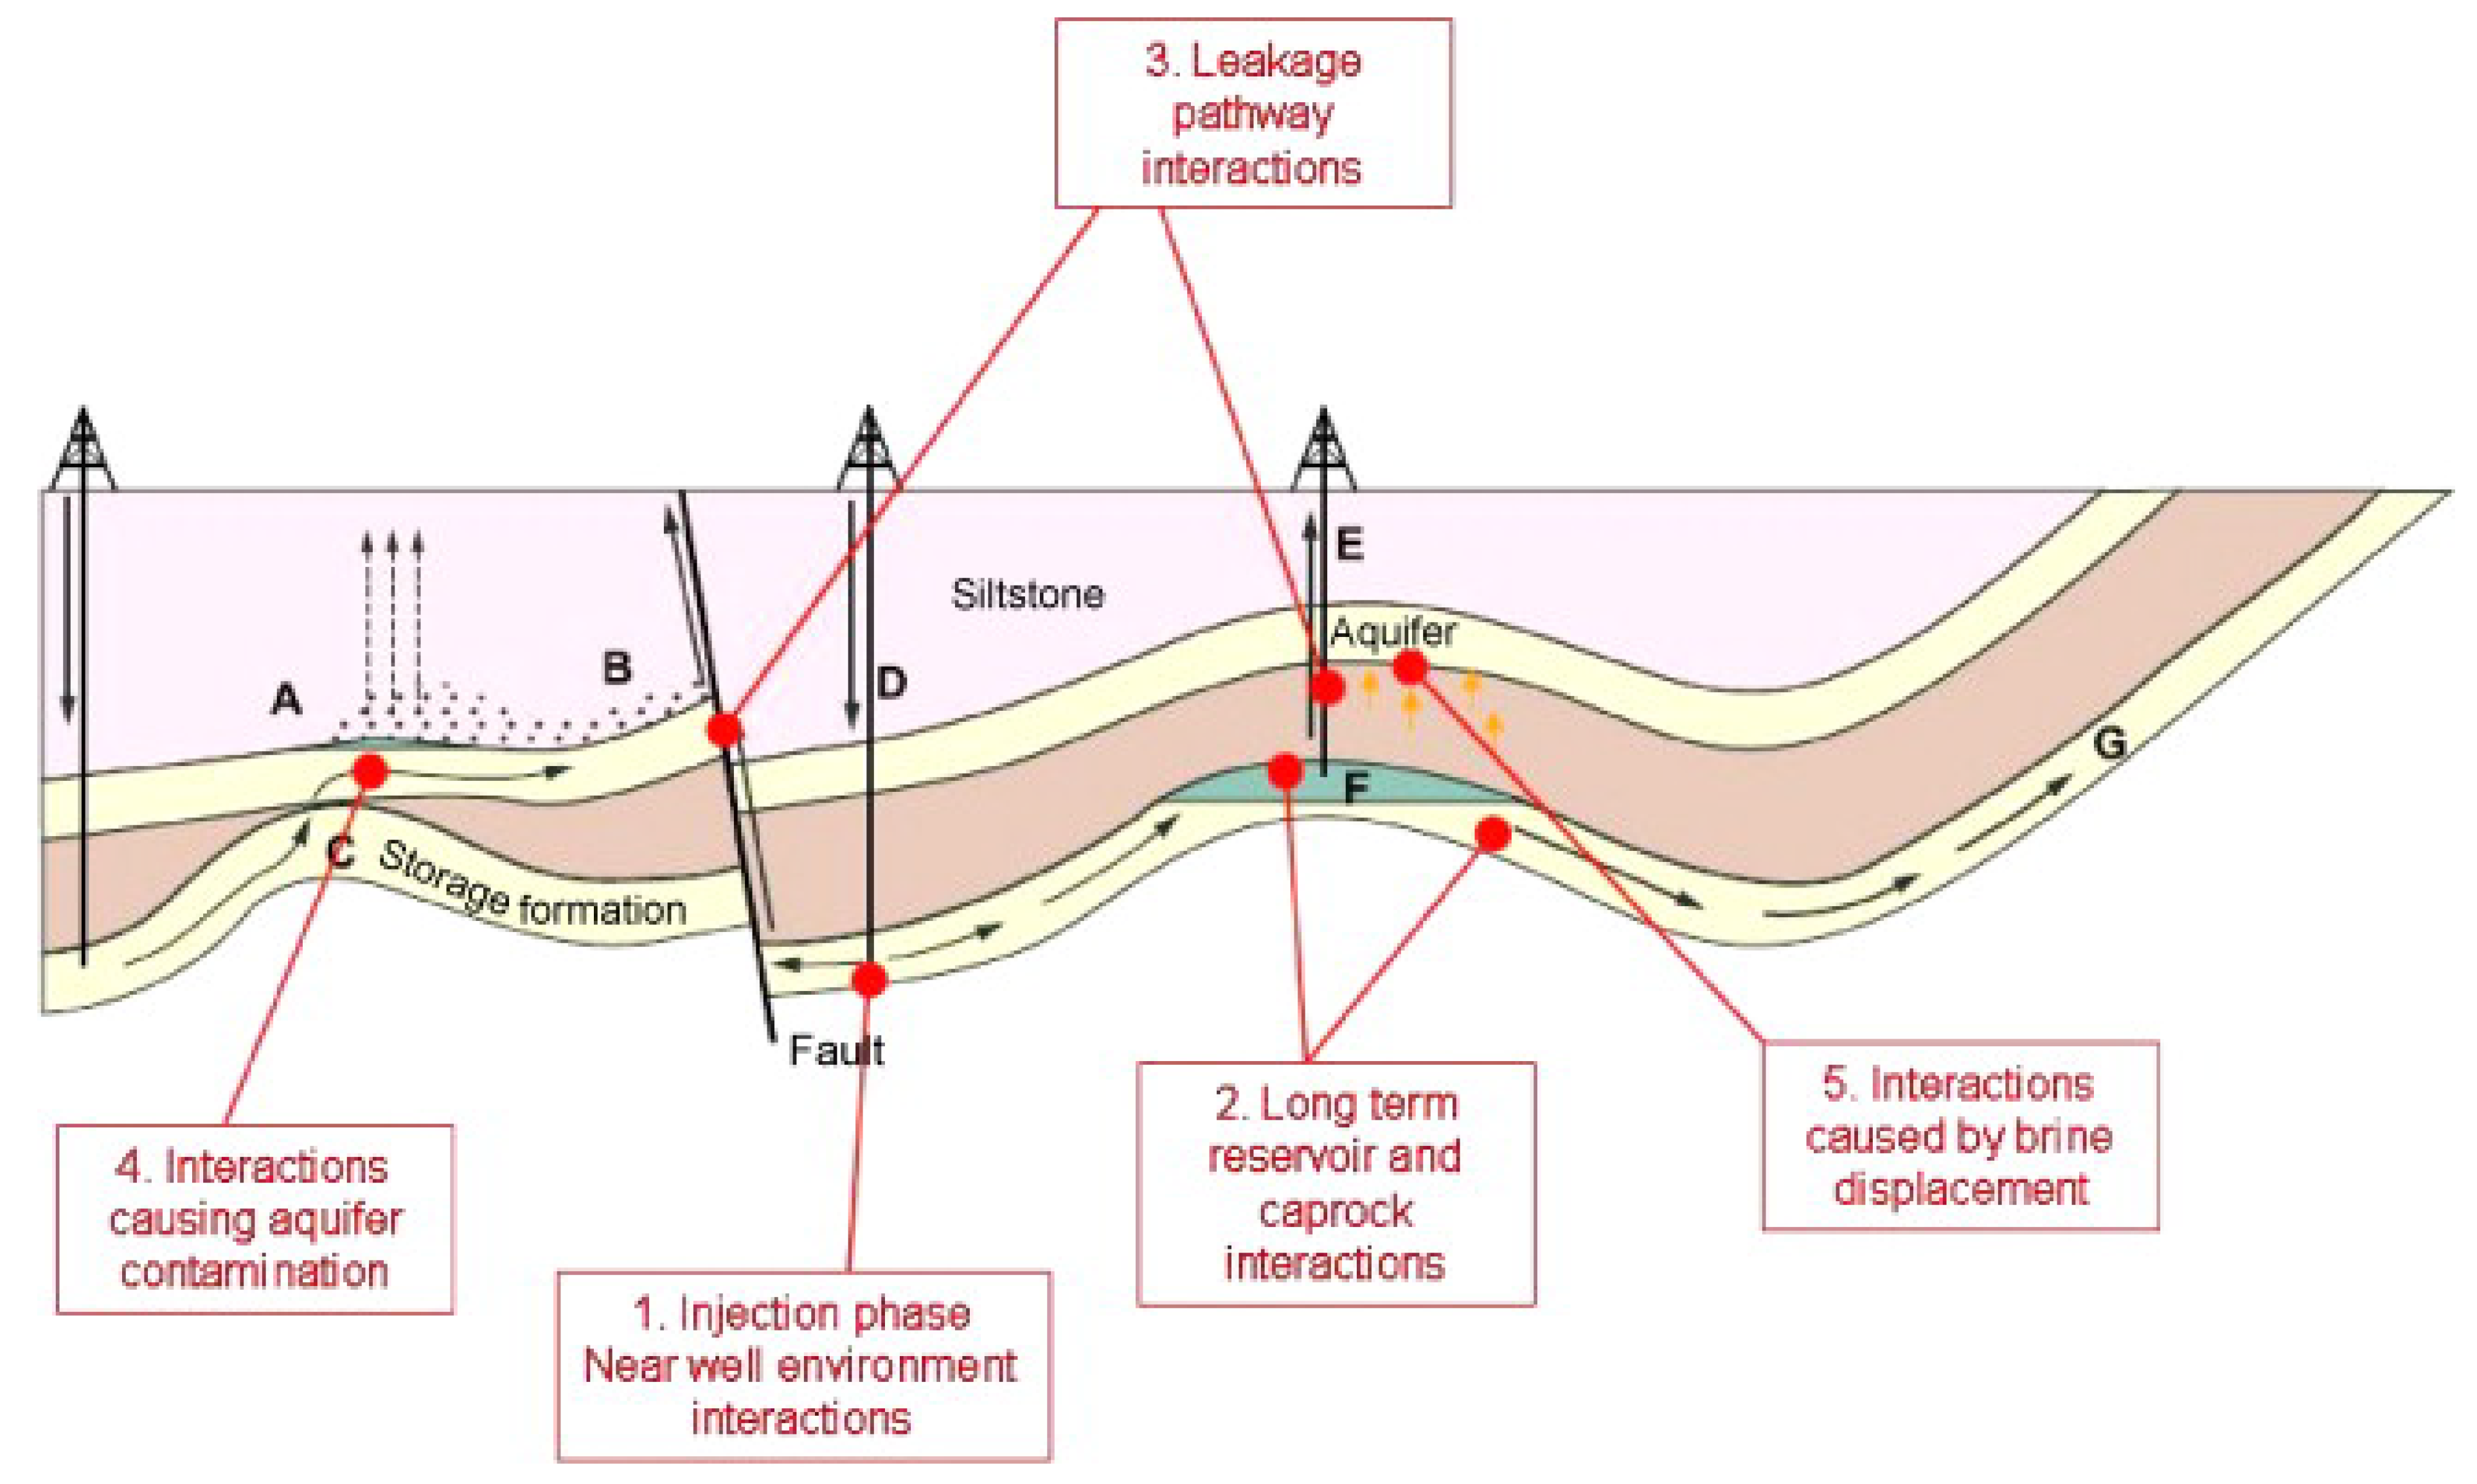
Figure 3.
Comparing CO2 adsorption isotherms for the US-1 shale sample to the various clay (mixed layer illite-smectite (ISCz-1), illite (IMt-2), chlorite (CCa-2), and kaolinite (KGa-1b)) and kerogen (NAk-1) components typically found in shale. Note that data for NAk-1 and CCa-2 were collected gravimetrically using a microbalance at −200 °C. The remaining samples are measured at −25 °C using a volumetric Sievert apparatus. Reprinted from Sanguinito et al. [50]. Copyright (2018), with permission from Elsevier.

Figure 4.
Pore size distribution analyses of the outcrop and production Utica shale samples: (A) 0.7 nm to 10 nm (from N2 sorption isotherms) (B) 0.003 μm to 350 μm (from Hg porosimetry). Insets show corresponding pore volume distributions of the unexposed, CO2-exposed, and CO2 + H2O− exposed samples for the 0.7 nm to 2 nm and 5 μm to 10 μm pore diameter ranges. Uncertainties are within ±5% and traces are offset from each other for clarity. Reprinted from Goodman et al. [25]. Copyright (2020), with permission from Elsevier.

Figure 5.
Schematic linking shale fracture and pore types and size classes with the analytical techniques applied to investigate the reactivity of Utica outcrop and production samples. (A) Fracture and pores present within mudrock: hydraulic fractures, natural fractures, interparticle and intraparticle pores associated with the mineral matrix, and organic-matter pores associated with the organic matrix. (B) Analytical techniques used to examine pore size distributions and porosity characteristics in mudrocks. (C) Pore size classification developed by Loucks et al. [52]. (D) Pore size trends with Utica outcrop and production samples following reaction with CO2 and H2O. Green arrows represent data from scanning electron microscopy, blue arrows represent data from CO2 and N2 low-pressure gas sorption isotherm measurements, purple arrows represent data from mercury intrusion porosimetry measurements, and orange arrows represent data from X-ray scattering methods. Reprinted from Goodman et al. [25]. Copyright (2020), with permission from Elsevier.
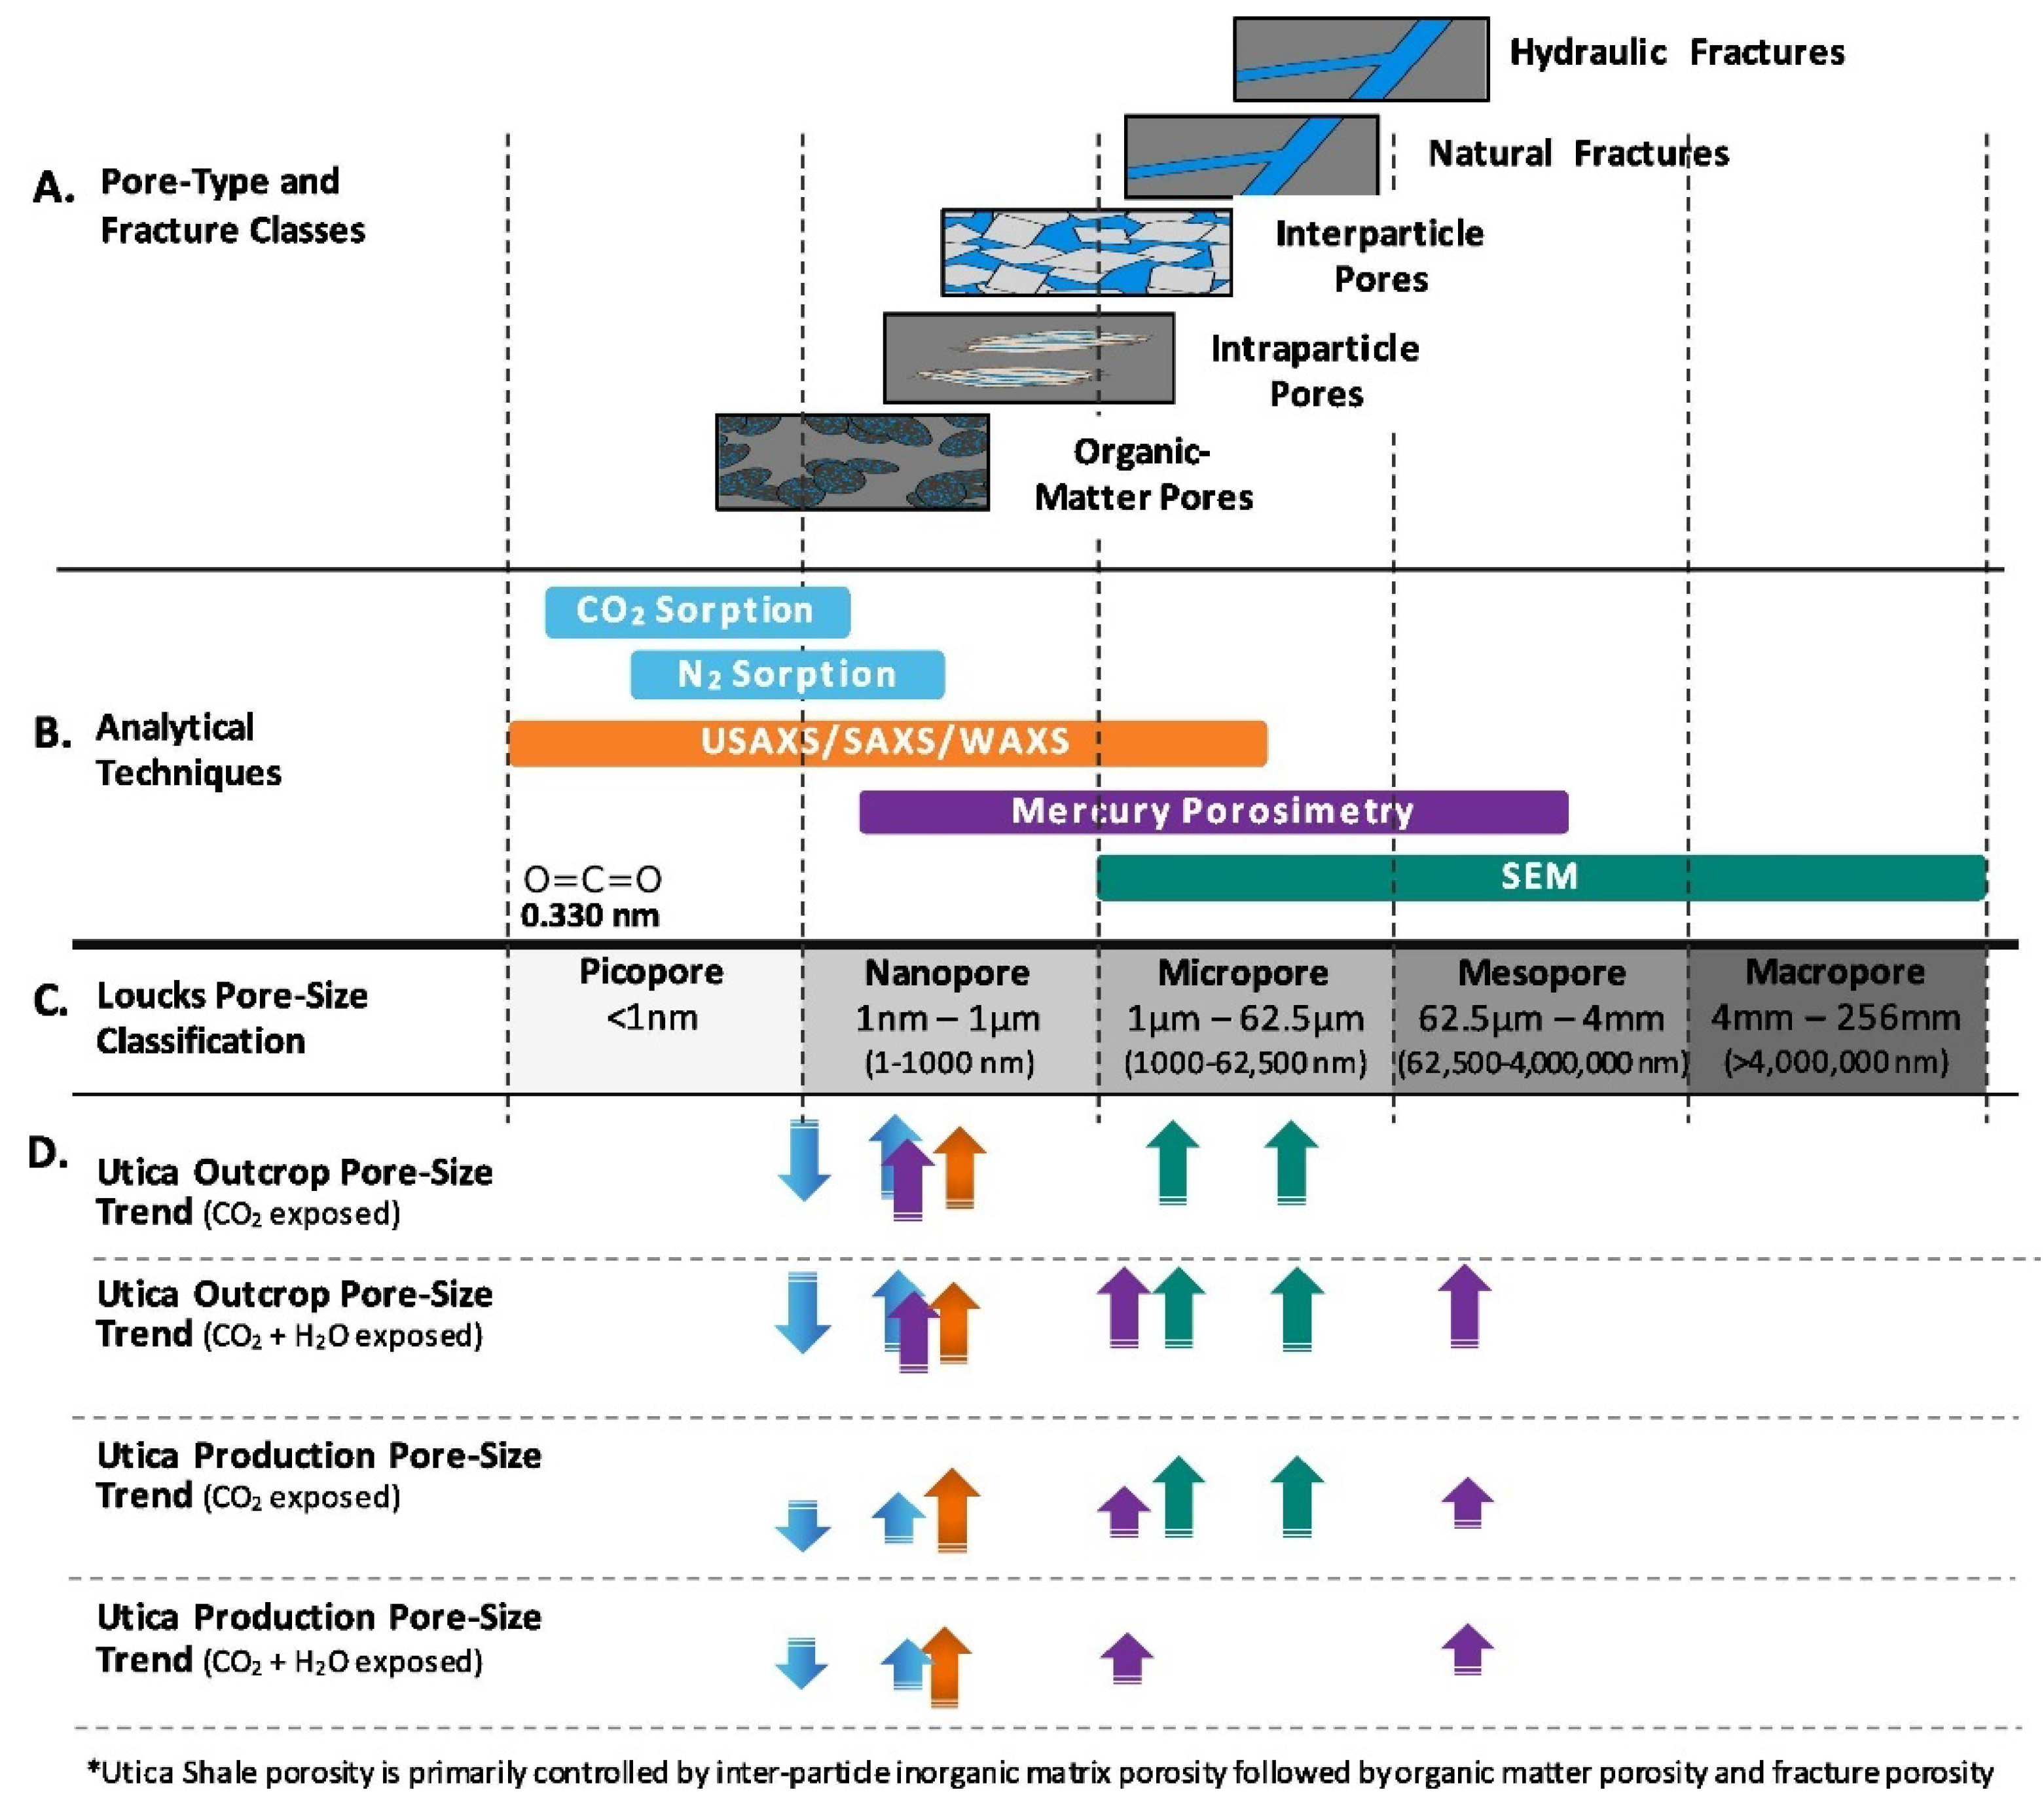
Figure 6.
Mineralogical changes over time for Muderong shale when exposed to wet CO2. Reprinted from [58]. Copyright (2009), with permission from Elsevier.
Figure 6.
Mineralogical changes over time for Muderong shale when exposed to wet CO2. Reprinted from [58]. Copyright (2009), with permission from Elsevier.

Figure 7.
Schematic diagram depicting pore geometry and results anticipated from gas sorption experiments with (a) a nanopore (rectangle)-connected macropore (circle) in a conventional adsorption experiment, (b) a disconnected macropore in an overcondensation experiment, and (c) a nanopore-connected macropore in an overcondensation experiment. The dark (blue) shading indicates the presence of the condensate, whereas the light (blue) shading indicates an empty pore or vapour only. The dotted line in the idealised isotherm line plots indicates bulk condensation pressure. Reprinted from Rigby et al. [70] under Creative Commons CC-BY Licence. (d) Ascending adsorption scanning curves (starting at relative pressures of 0.6 and 0.8) and corresponding descending desorption curves (indicated by a descending arrow) for scanning loops starting on the overcondensation boundary desorption isotherm (solid line), and conventional isotherms for a thermochemically-treated Rempstone shale sample (•). It can be seen that the conventional isotherm misses a lot of porosity and leads to a misleading hystereis loop shape. Reprinted from Rigby et al. [71] under a Creative Commons CC-BY Licence.
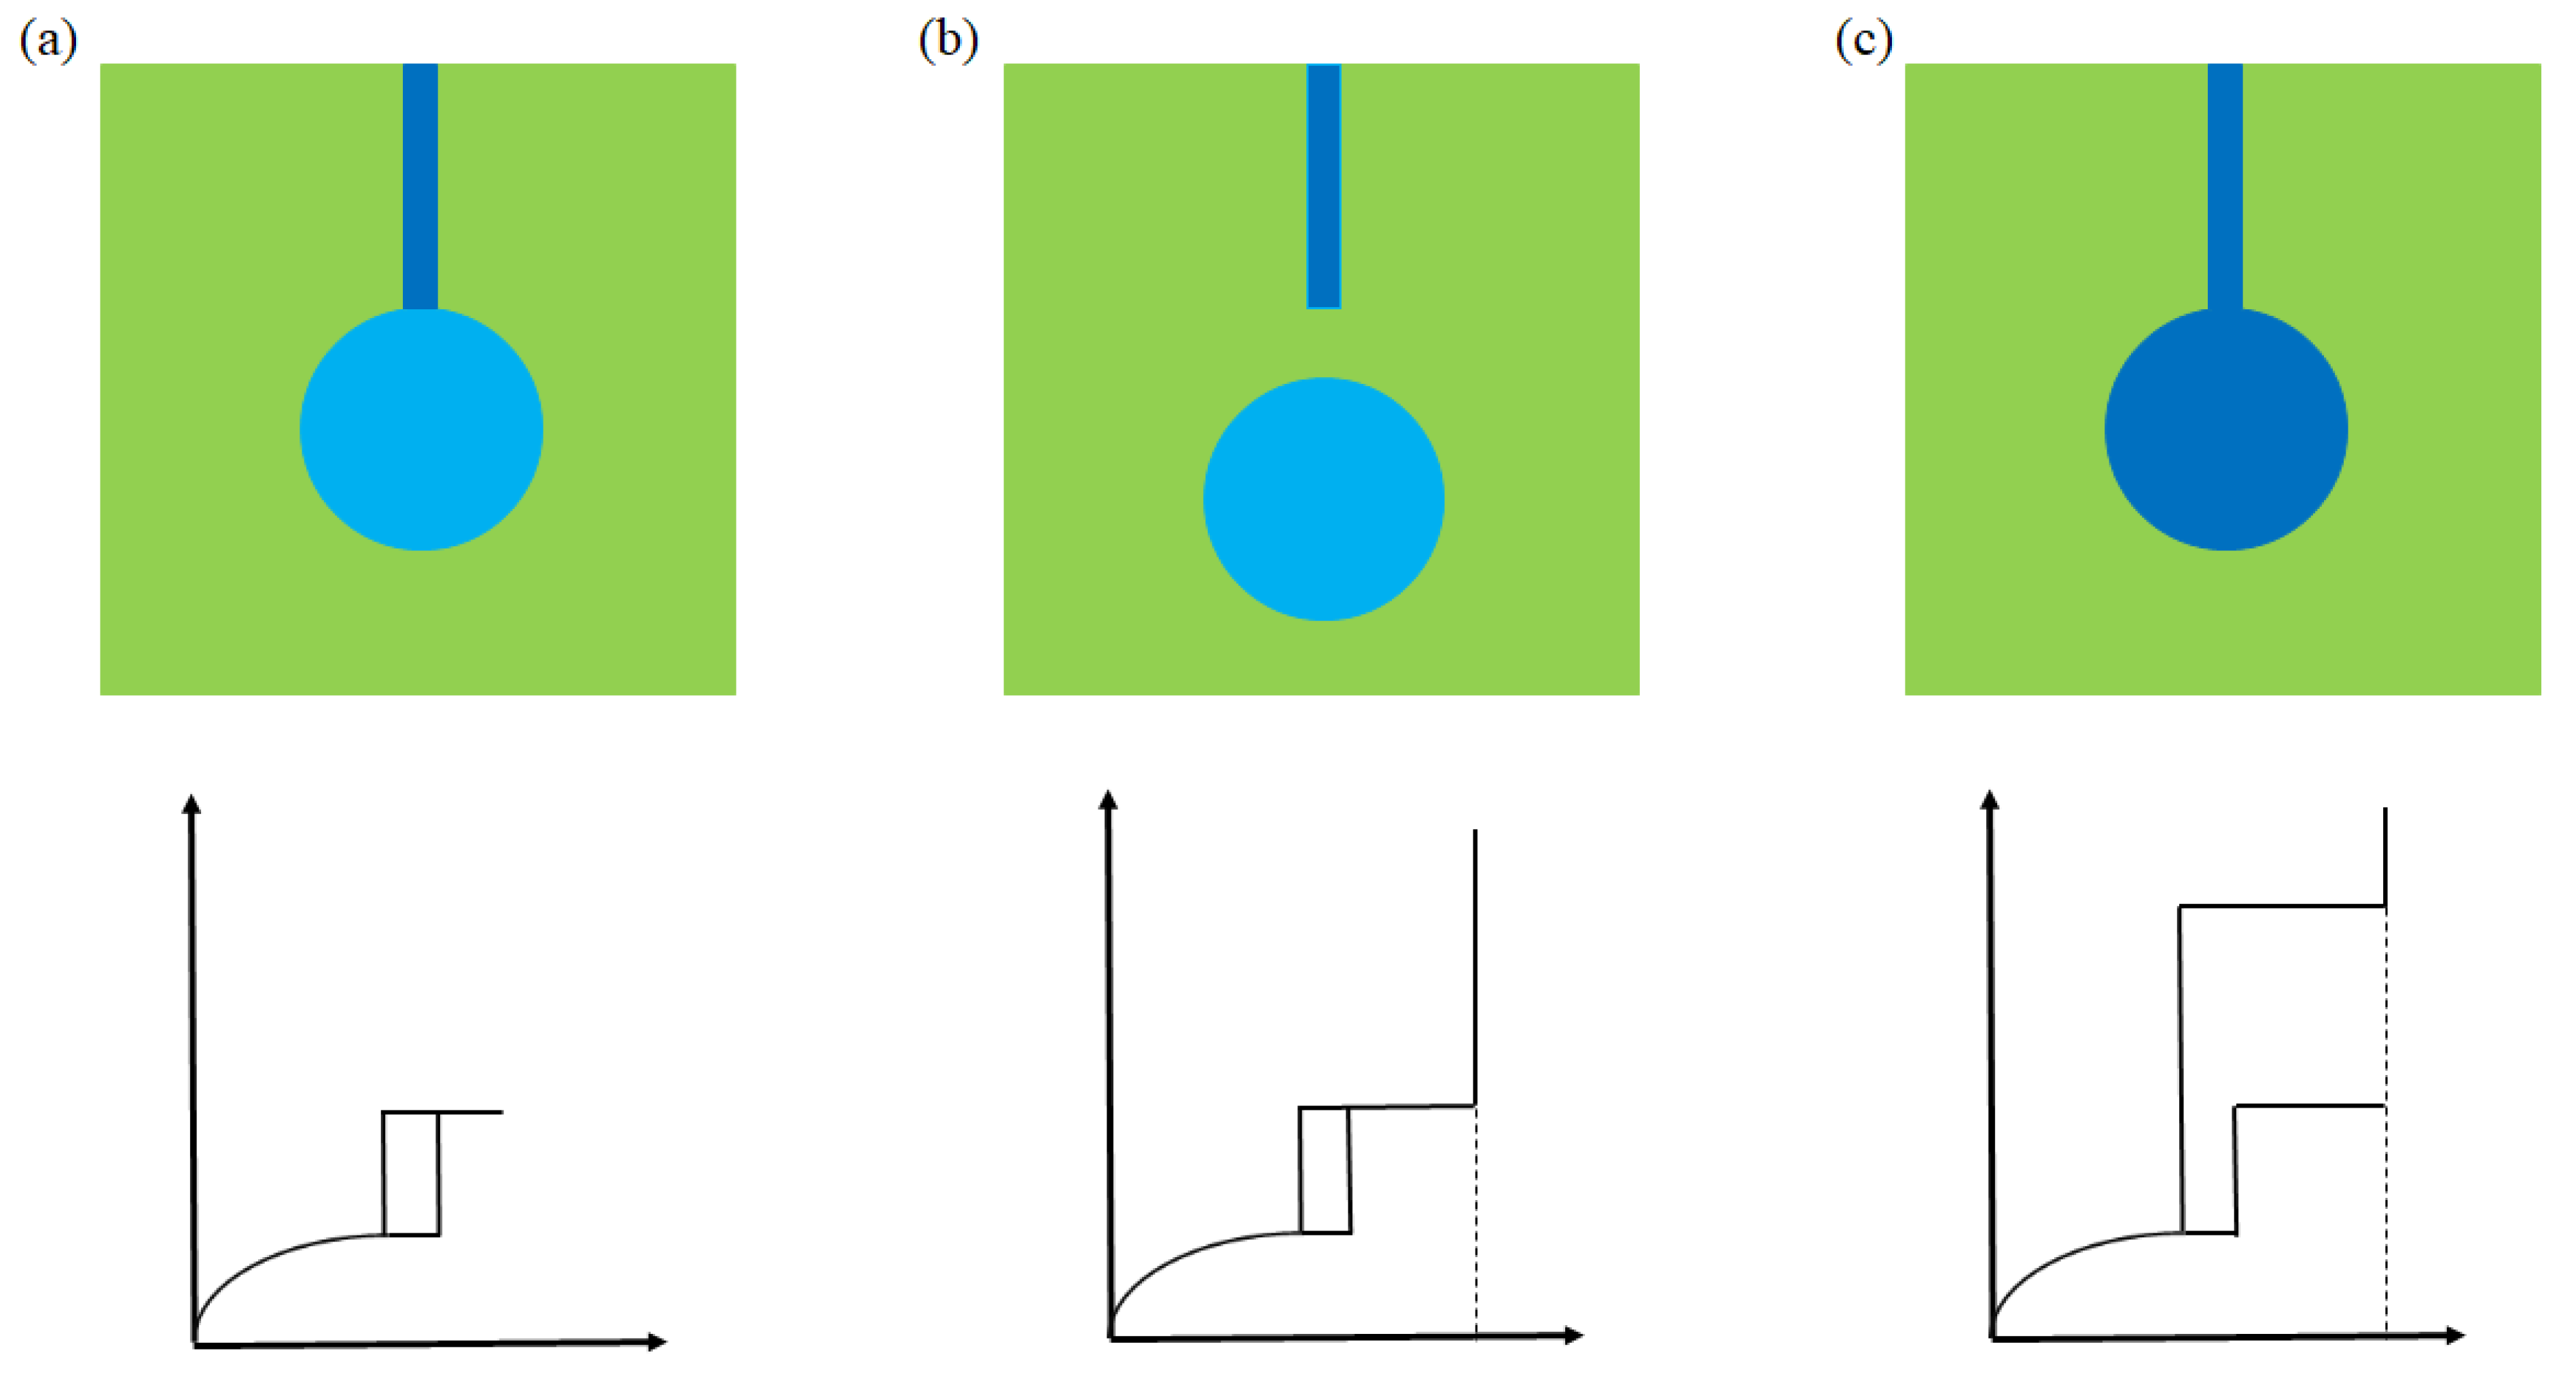
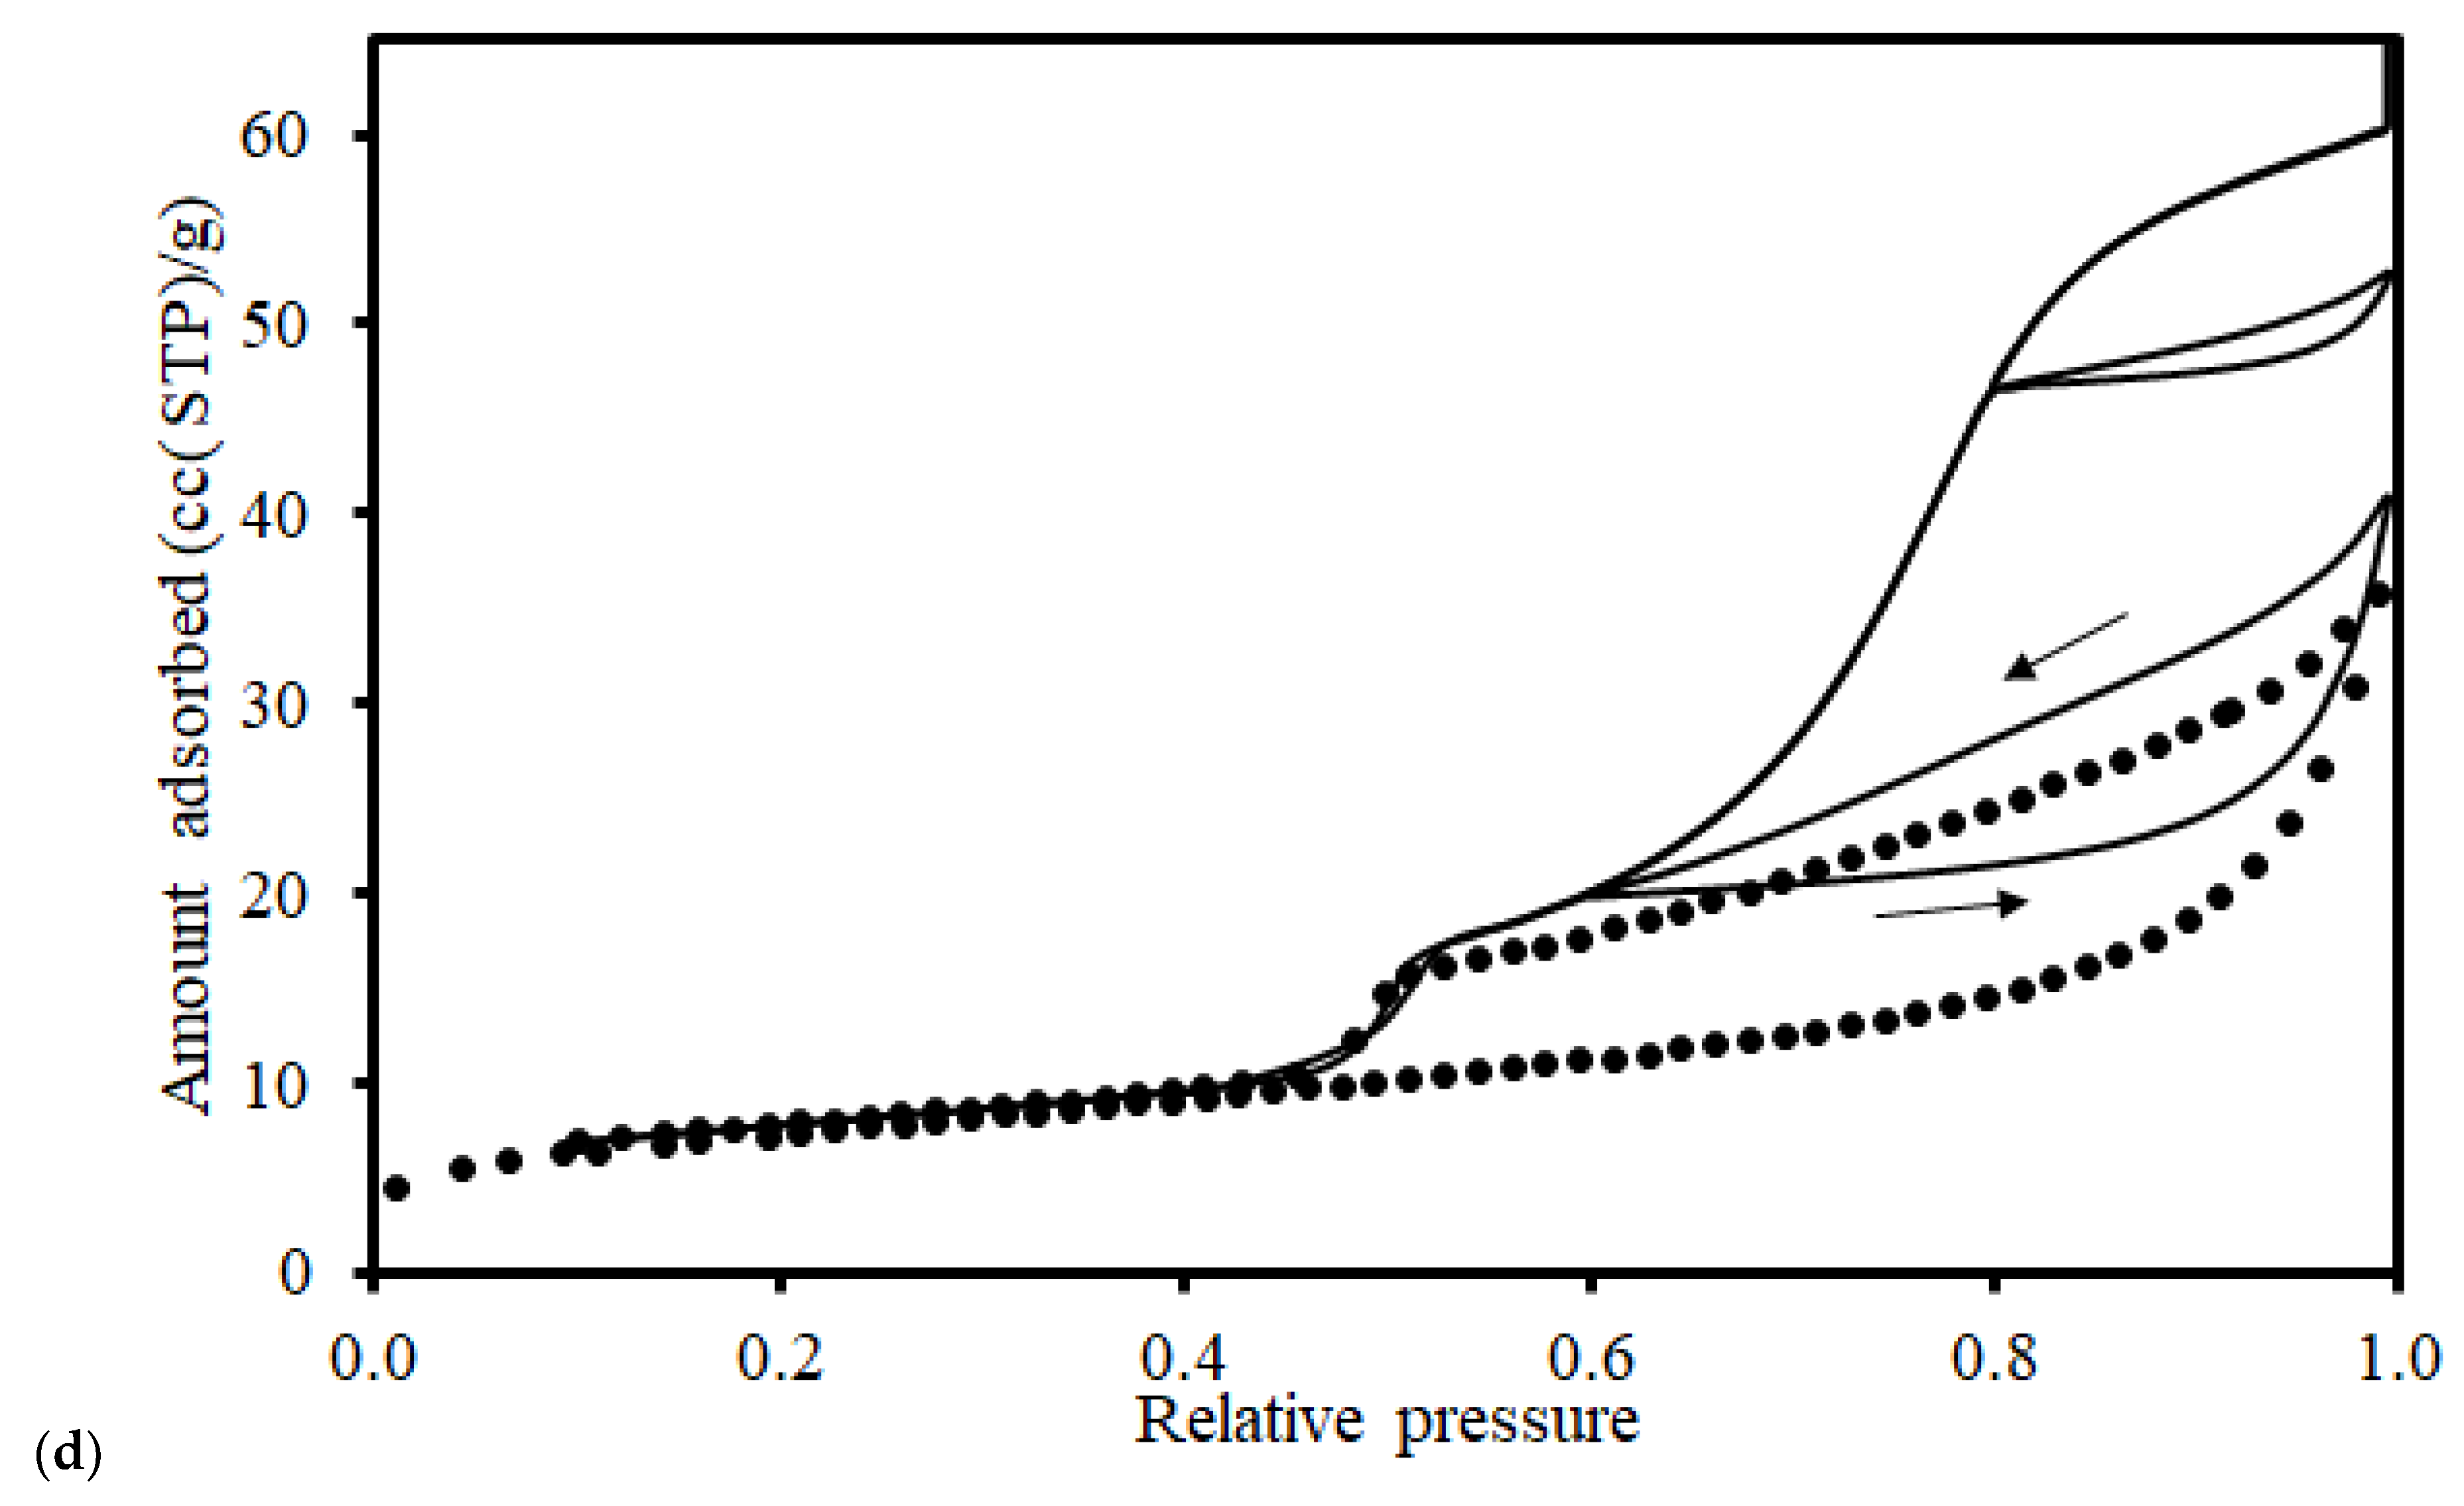
Figure 8.
A series of nitrogen sorption scanning curves for as-received Nordland shale of particle size >150 µm, with (a) desorption starting at ultimate relative pressures of 0.99 (■), 0.95(▲), and 0.93 (●) on the adsorption boundary isotherm; (b) a descending scanning curve starting at an ultimate relative pressure of 0.82 on the adsorption boundary isotherm; and (c) an ascending scanning curve springing from an ultimate relative pressure of 0.8 on the conventional desorption boundary isotherm. Reprinted from Seely et al. [68] under a Creative Commons CC-BY Licence.
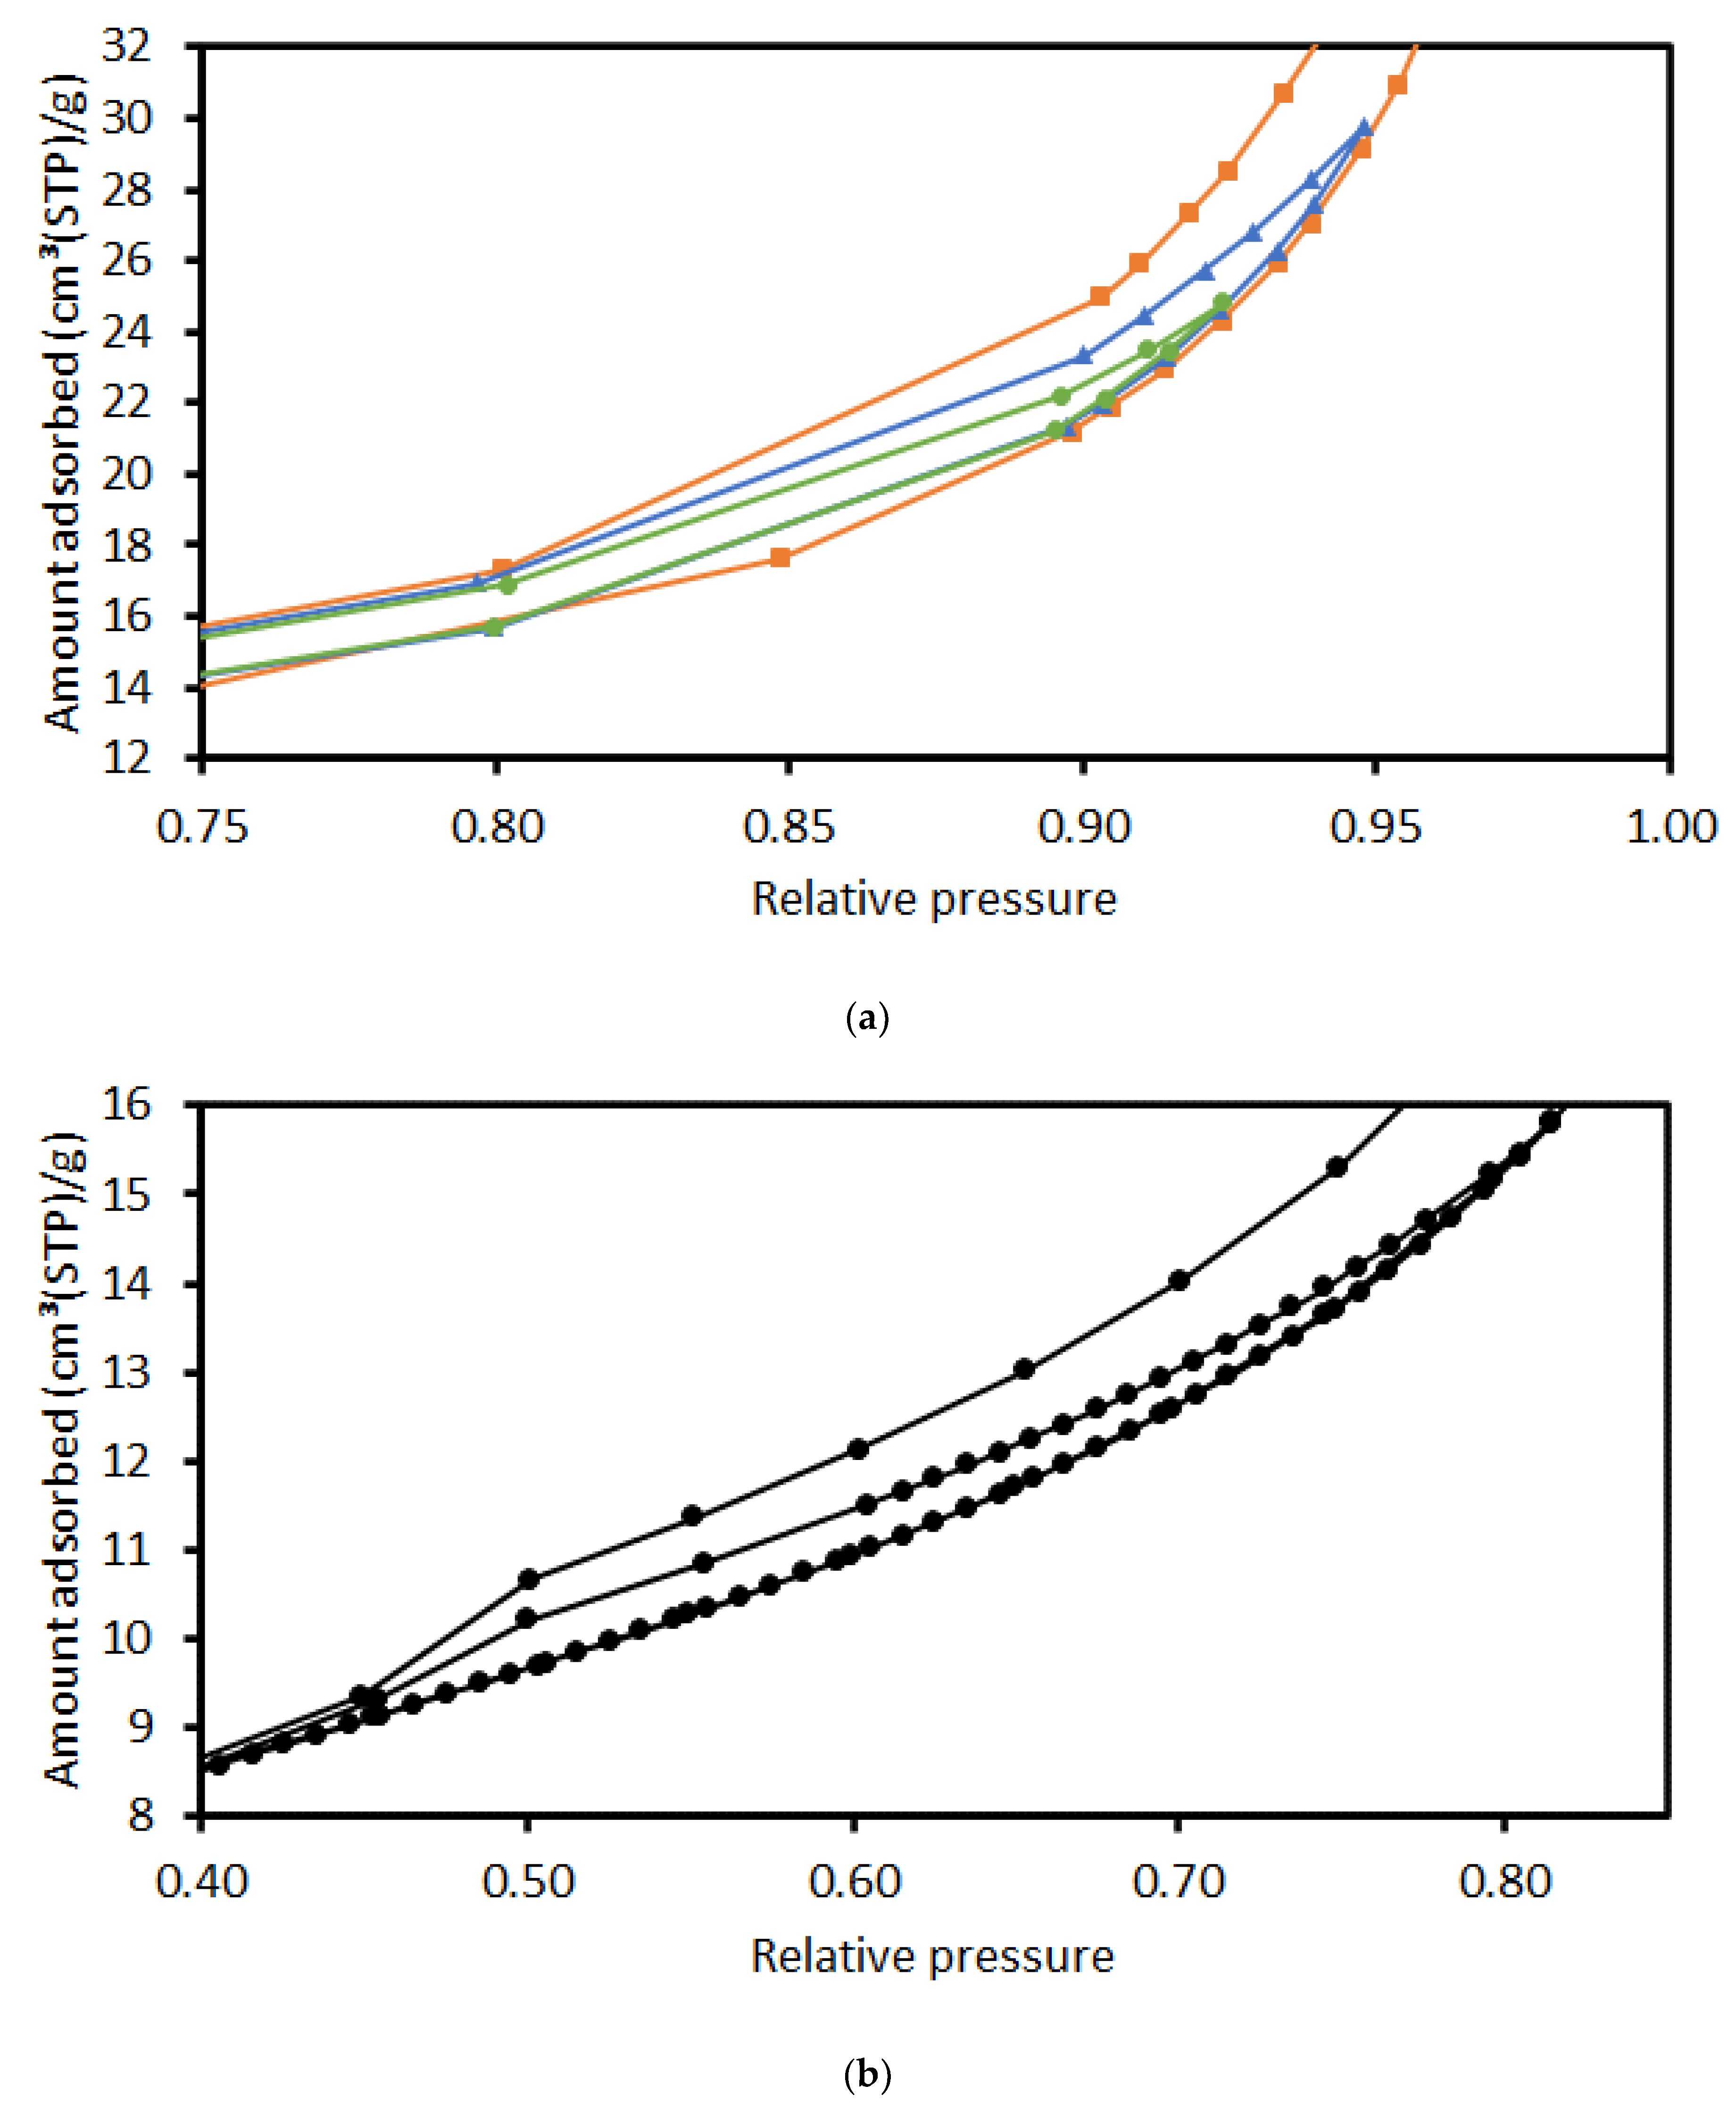

Figure 9.
Typical raw datasets for a particular pressure point of the adsorption isotherm from an adsorption calorimetry experiment on a sample of Above Marine Band Bowland shale, showing heat-flow ((a), blue crosses) and mass uptake ((b), green squares). Also shown (solid red lines) are fits of the experimental data to an exponential decay function (a) and the LDF model (b).
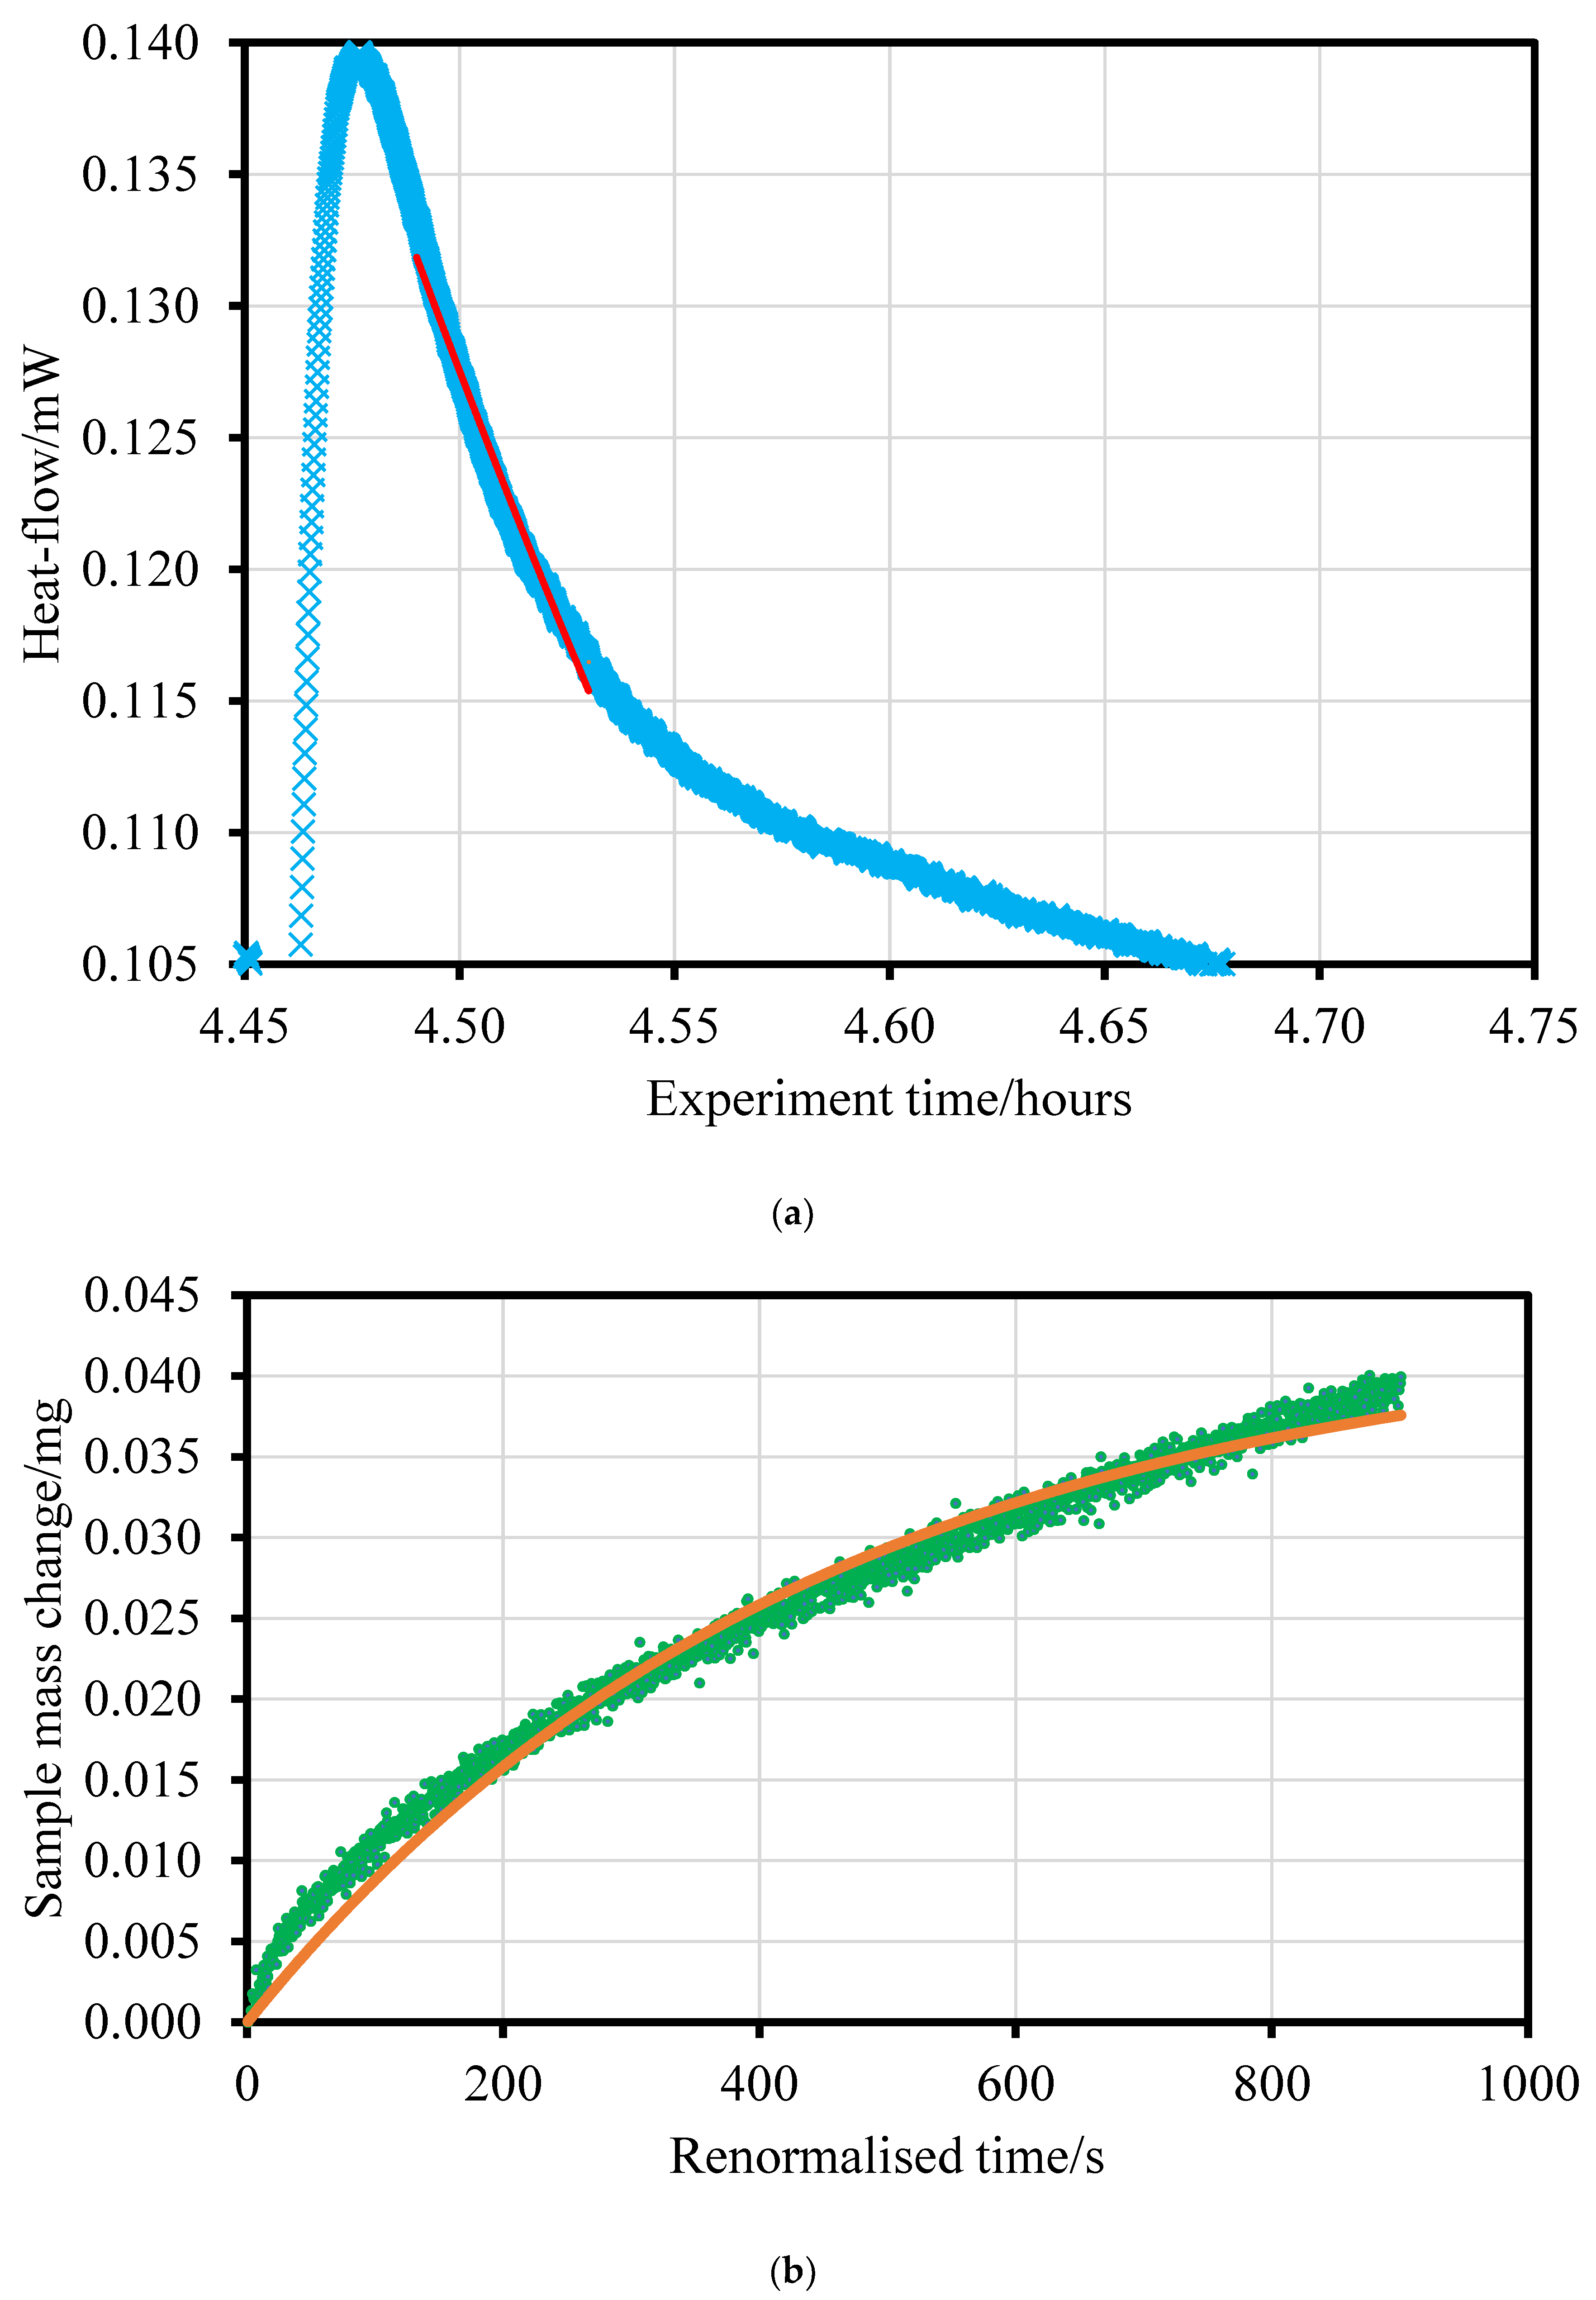
Figure 10.
Plot showing a comparison of the mass transfer parameters obtained from the adsorption calorimetry and adsorption-corrected mass uptake methods at different carbon dioxide saturations for adsorption isotherms on the Above Marine Band Bowland shale. The dashed line shown is a fit of the data to a straight-line function through the origin.

Figure 11.
Vertical plane slice through a reservoir model showing a comparison of the CO2 plume behaviour between models of sandstone aquifers with shale inter-layers (dashed line) with thicknesses of 0.3 m (a) and 3 m (b) for the simulation of 120 years of injection. The colour scale represents increasing concentrations of CO2.

Publisher’s Note: MDPI stays neutral with regard to jurisdictional claims in published maps and institutional affiliations. |
© 2022 by the authors. Licensee MDPI, Basel, Switzerland. This article is an open access article distributed under the terms and conditions of the Creative Commons Attribution (CC BY) license (https://creativecommons.org/licenses/by/4.0/).
Share and Cite
MDPI and ACS Style
Rigby, S.P.; Alsayah, A.; Seely, R. Impact of Exposure to Supercritical Carbon Dioxide on Reservoir Caprocks and Inter-Layers during Sequestration. Energies 2022, 15, 7538. https://doi.org/10.3390/en15207538
AMA Style
Rigby SP, Alsayah A, Seely R. Impact of Exposure to Supercritical Carbon Dioxide on Reservoir Caprocks and Inter-Layers during Sequestration. Energies. 2022; 15(20):7538. https://doi.org/10.3390/en15207538
Chicago/Turabian StyleRigby, Sean P., Ali Alsayah, and Richard Seely. 2022. "Impact of Exposure to Supercritical Carbon Dioxide on Reservoir Caprocks and Inter-Layers during Sequestration" Energies 15, no. 20: 7538. https://doi.org/10.3390/en15207538
Note that from the first issue of 2016, this journal uses article numbers instead of page numbers. See further details here.