
Solar Pyrolysis of Spirulina platensis Assisted by Fresnel Lens Using Hydrocalumite-Type Precursors

Chemical Engineering School, Federal University of Uberlândia, Uberlandia 38400-902, MG, Brazil
*
Author to whom correspondence should be addressed.
Energies 2022, 15(20), 7590; https://doi.org/10.3390/en15207590
Submission received: 25 August 2022
/
Revised: 21 September 2022
/
Accepted: 5 October 2022
/
Published: 14 October 2022
(This article belongs to the Special Issue State-of-the-Art of Sustainable Biofuels from Waste and Biomass in Brazil)
Abstract
:Solar pyrolysis is a promising technology as it combines use of biomass and solar energy to generate transportable and storable fuels, as well as chemicals of interest. The most desired product of rapid pyrolysis of microalgae is bio-oil, a liquid and viscous mixture composed of hundreds of chemicals. Among these compounds are many oxygenates that usually bring some undesirable properties to bio-oil, e.g., instability. This study aimed to investigate the potential of Spirulina platensis to produce bio-oil from catalytic solar pyrolysis assisted by Fresnel lens. The performance of the mixed oxides derived from hydrocalumite was evaluated, aiming to improve the yield and quality of the liquid product. The effects of reaction time and percentage of catalyst on the product distribution and bio-oil composition were quantified. An optimization study was performed using the differential evolution (DE) algorithm in order to maximize the bio-oil yield. The results showed that the highest liquid yield (43.4%) was obtained in 23.4 min using a catalyst percentage of 58.6%. The mixed oxides derived from hydrocalumite contributed to the improvement in the bio-oil quality, which presented in its composition a low quantity of oxygenated compounds and a higher percentage of hydrocarbons.

1. Introduction
The increasing world population and rapid industrialization have contributed to growth in global energy demand over the years. As a side effect, generation of energy from non-renewable matrices has increased the environmental impact due to gas emissions responsible for the greenhouse effect, especially carbon dioxide (CO2) [1,2]. Besides influencing the current environmental problems, fossil fuels are finite resources that may be depleted in the coming decades. For this reason, it is essential to develop new sustainable fuels with low carbon footprints compared to fossil fuel. Biofuels can reduce consumption of fossil fuels and thus reduce carbon dioxide emissions because biofuels are carbon-neutral. The carbon dioxide that is emitted when a biofuel is burned merely returns to the atmospheric carbon dioxide that was taken into plants from the atmosphere by photosynthesis [3]. Thus, use of biomass-derived biofuels has become attractive because biomass is abundant in nature, low-cost, biodegradable, and a source of renewable carbon [2,4].
Biomass can be used as a renewable source of carbon for production of fuels or chemical precursors from thermochemical transformations, such as combustion, gasification, and pyrolysis. Among the thermochemical processes, pyrolysis stands out mainly because of its ability to generate products (solids, liquids, and gases) with greater added value that could be used as fuels or chemicals of interest for other industrial activities [5,6,7]. Even though lignocellulosic biomass is the most used raw material to produce bio-oil [8], new raw materials are being evaluated in the pyrolysis process. In this respect, microalgae have shown great potential as a source of biomass in pyrolysis processes given their great diversity of species and good environmental adaptability, allowing their cultivation in systems that do not compete for arable land. According to some studies, another advantage of using microalgae as a raw material in pyrolysis is the fact that the bio-oil obtained by their thermochemical conversion has a higher heating value and less viscosity than the bio-oil produced from lignocellulosic biomass [5,9].
Bio-oil obtained by pyrolysis can have some undesirable characteristics because of its chemical composition, such as low high heating value and high acidity and viscosity. The presence of oxygenated compounds in the composition of pyrolysis oil is the characteristic that most contributes to these negative factors. For these reasons, this product must undergo deoxygenation processes so that it can be integrated into refineries and meet the specifications of finished fuels [10,11]. One way to improve the quality of the fuel generated is to change the reaction routes through addition of catalysts [7,9,12,13].
In recent decades, layered double hydroxides (LDHs in the following) received increased attention due to their wide-ranging applications and the relative ease of their availability and functional modification [14,15]. LDHs also have considerable potential in health care: they can be applied as antacids, medicine stabilizers, and even used as catalysts of base-catalyzed transformations in their layered forms or, more frequently, after calcination (then, the layered structure is lost) [16,17]. However, few studies have outlined layered double hydroxides (LDHs) as possible catalysts for improvement in biomass pyrolysis oil characteristics [18,19]. Maree and Heydenrych [18] showed that MgAl-LDH significantly reduced the concentrations of ketones and oxygenated aromatics in electrostatic precipitator oils and increased the concentration of aliphatics [18].
Hydrocalumite is a type of double lamellar hydroxide composed of calcium and aluminum neatly distributed within its hexagonal structural layers, interspersed with carbonate, and represented by the general formula [Ca2Al(OH)6]NO3.nH2O [14,15]. When subjected to the calcination process at different temperatures, it generates mixed oxides, favoring their application as basic catalysts [16]. These materials have already been applied as catalytic precursors in the isomerization of 1-butene [15] and transesterification of oils for biodiesel production [17]. However, there are still no records regarding their application in deoxygenation of bio-oil obtained by microalgae pyrolysis.
Among the challenges of a pyrolysis system is the reactor design and its heating system. In conventional pyrolysis, use of an electrical heater or combustion of external fuels generally imply high-energy consumption and costly production [7]. This problem can be softened by incorporating solar heating devices in the pyrolysis system [12]. Thus, solar pyrolysis emerges as an interesting process as it combines concentrated solar energy and biomass to generate fuel and chemicals. Concentration of solar radiation in this process occurs through solar concentrators. These optical devices can operate reflexively, similar to parabolic mirrors or refractive lenses (e.g., Fresnel lenses) [20,21]. Some studies on solar pyrolysis have reported satisfactory results regarding application of this technology in biomass conversion [7,12,22,23].
Zeng et al. [24] studied wood pyrolysis impregnated with Cu and Ni using a solar concentration system composed of a heliostat and a parabolic disk. The studies were carried out at temperatures from 600 °C to 1600 °C at heating rates of 10 and 50 °C/s and a thermochemical decomposition time of 5 min. The results showed that the increase in temperature favored the gas yield but caused a decrease in the solid and liquid yields.
Hijazi et al. [25] performed catalytic and non-catalytic pyrolysis of tire strips using Fresnel lenses at a temperature range from 550 to 570 °C at the focal point. The assays were developed using heterogeneous photocatalysts. The authors evaluated the effects of use of pure titanium dioxide (TiO2) catalysts, as well as Pd/TiO2, Pt/TiO2, and TiO2/Bi2O3/SiO2 on the gas yield. They observed that the amount of gas produced increased by 7% with addition of TiO2 and 21% with use of palladium supported on titanium dioxide at a reaction time of 15 min. However, no records were found on the use of Fresnel lenses in thermochemical processes with a focus on bio-oil production and upgrading.
Cyanobacteria and especially Spirulina platensis are recognized as abundant resources of lipids and poly-unsaturated fatty acids (PUFA). The main valorization of these lipids has been biofuel production [26]. Effective methods to extract lipids from Cyanobacteria have been developed, extending their application potential [27].
Therefore, the general objective of this work was to perform catalytic pyrolysis of the cyanobacteria Spirulina platensis using a renewable source of energy (sunlight) as a heating starting point. A Fresnel-lens-type solar concentrator was employed to promote concentration of sun rays at the focal point where the reactor was positioned. In the present work, for the first time, the effect of using mixed oxides derived from hydrocalumite as catalysts on the yields and quality of the bio-oil generated by ex situ catalytic solar pyrolysis of Spirulina platensis was analyzed. The experiments were conducted based on a central composite design (CCD), and the effects of percentage of catalyst and reaction time on yield and quality of the liquid product obtained were quantified using regression techniques. To identify the process condition capable of maximizing the bio-oil yield, an optimization study was carried out using the differential evolution algorithm.
2. Materials and Methods
2.1. Biomass Characterization
The cyanobacteria Spirulina platensis used in this work was purchased from Brasil-Vital (Anápolis, Brazil; initial moisture of 82.53% ± 0.71%) due to its low cost. The biomass was dried in a non-conventional rotary dryer with inert bed [28] at 60 °C. The rotational speed of the dryer and speed of air supply were equal to 60 rpm and 10 m/s, respectively. After drying and prior to use in the solar pyrolysis experiments, microalgae with final moisture of 7.06% ± 0.01% were classified by sieving and passing through an 80-mesh sieve (d# = 0.177 mm).
The elemental composition of the dry material was analyzed using a Perkin Elmer 2400 Series II CHNS/O elemental analyzer. The volatile and ash contents were determined according to ASTM E872-82 and E1534-93, respectively. The higher heating value (HHV) was measured on a calorimetric pump (IKAC200) following ASTM D240-09. The chemical composition analyses to determine the levels of lipids and proteins were performed by the Soxhlet [29] and Kjeldahl [30] methods, respectively. The carbohydrate content was determined by the mass balance, as described in Jafarian and Tavasoli [31].
2.2. Catalyst Synthesis and Characterization
The hydrocalumite [Ca2Al(OH)6NO3∙2H2O] was prepared via co-precipitation method of metallic calcium and aluminum nitrates with controlled pH [14] and a molar ratio x = [Al3+/(Ca2+ + Al3+)] = 0.25. Prior to use, the catalytic precursor was calcined in a muffle furnace under a synthetic airflow and at a heating rate of 2 °C/min up to 700 °C, remaining at this temperature for 4 h to form the calcium–aluminum mixed oxides.
The non-calcined (HC000) and calcined (HC700) samples were characterized by X-ray diffraction (XRD) using a Huber diffractometer in the D10B-XPD beamline of the Brazilian Synchrotron Light Laboratory (Campinas, Brazil) with CuKa source (1.540 Å). These samples were also characterized by scanning electron microscopy (SEM) on a See 3—Tescan (DES injector) device (Brno, Czech Republic). Furthermore, the specific surface areas of the HC000 and HC700 samples were determined by the Brunauer–Emmett–Teller method (BET) by nitrogen adsorption (77 K). The Barret–Joyner–Halenda method (BJH) was used to determine the pore size (Dp) and pore volume (Vp) distributions.
2.3. Experimental Apparatus and Solar Pyrolysis Conditions
Figure 1 schematizes the experimental unit used to perform the solar pyrolysis studied in this work. The solar radiation was concentrated using a Fresnel-lens-type solar concentrator consisting of polymethylacrylate, with a usable area of 0.5 m2, a thickness of 5 mm, and a focal length of 150 cm. The quartz reactor with a transmittance of 0.94, a useful volume of 31.4 cm3, a wall thickness of 2 mm, and a diameter of 44 mm was arranged at the focal point of the lens. Solar pyrolysis was carried out in an open field (latitude: 18.919216° S; longitude: 48.257466° O; altitude: 938 m) under a solar radiation flow of (810 ± 50) W/m2. The experiments took place at an operating temperature of (600 ± 40) °C, measured by a thermocouple (type K). Figure 2 shows the heating ramp obtained during the solar pyrolysis tests. The final operating temperature was reached in approximately 5 min, and the heating rate was about 1.0 °C/s.
A fixed-bed catalytic reactor (di = 1.7 cm and L = 10.0 cm, and bed height ranging from 0.2 to 0.7 cm, depending on the percentage of catalyst) containing mixed oxides derived from hydrocalumite was positioned at the upper end of the pyrolysis reactor. After the pyrolytic vapors percolated through the catalyst bed, they were directed to a condenser. A vacuum pump operating at 600 mmHg was placed downstream of the condensation system to assist in the percolation of pyrolysis vapors through the catalyst bed since no inert gas was used to provide the entrainment of substances generated in the thermochemical decomposition.
Solid and liquid yields were determined by gravimetry by weighing the bio-coal formed inside the reactor and the bio-oil recovered in the condensers and calculating the percentage obtained based on the initial mass of microalgae (m0 = 2.0 g) in the reactor (Equations (1) and (2)). The yield of the non-condensable gas was calculated by the mass balance (Equation (3)).
2.4. Experimental Design
A central composite design (CDD) was used to define the levels of reaction time (t) and percentage of catalyst (C) and to calculate their effects on the product yields and quality of the liquid obtained by ex situ catalytic solar pyrolysis of Spirulina platensis. The independent variables t and C are represented in coded form by Equations (4) and (5), respectively, and were evaluated at five levels (−α, −1, 0, +1, +α), with α turnover rates of 1.41. The results obtained in the 10 solar tests (Table 1) combined with the regression techniques [32] were used to determine empirical equations capable of predicting solid (SY), liquid (LY), and gas (GY) yields as functions of the independent variables using software Stastistica® 7.0 (StatSoft, Tulsa, OK, USA). Variance analysis allowed us to identify which parameters were significant. The quality of the fit to the regression model was assessed by the coefficient of determination (r²) and residual analysis. These equations were applied in an optimization study using the differential evolution algorithm [22] so as to identify the values of the independent variables X1 and X2 (reaction time and percentage of catalyst, respectively) capable of maximizing the bio-oil yield.
2.5. Bio-Oil Characterization
2.5.1. Gas Chromatography Mass Spectrometry (GC/MS)
Aliquots of the bio-oil obtained by solar pyrolysis were diluted (60% w/w of ethanol) and injected into a chromatograph (GC/MS QSP2010SE*-Shimadzu), followed by separation of the gaseous components using an SH-Rtx-5MS column GC 195 (30 m, 0.25 mm, 0.25 µm). The linear velocity was set at 25.6 cm/s and the purge flow at 3 mL/min. The initial temperature of the oven was 45 °C, and, after 4 min in operation, it was raised to 280 °C at a heating rate of 3 °C/min. In addition, the injection temperatures and the chromatograph–spectrometer interface were adjusted to 250 °C and 275 °C, respectively. The main peaks were identified based on the retention times of each compound and the information from NIST library version 08, considering a similarity index greater than 80%. The compounds were classified as hydrocarbons, oxygenated, and nitrogenous compounds according to the areas of each peak of a given functional group.
2.5.2. Infrared Spectroscopy Analyses
The functional groups present in the bio-oil were identified by attenuated total reflectance infrared spectroscopy (ATR-FTIR). The analyses were performed on a PerkinElmer Spectrum Two infrared spectrometer at wavelengths ranging from 400 to 4000 cm−1, with a resolution of 4 cm−1 and several sets of 32 scans per spectrum.
3. Results
3.1. Biomass Characteristics
Table 2 presents the characterization results of Spirulina platensis after drying. Spirulina platensis had a high content of volatile matter (80.09%) and an ash content equal to 10.43%, in accordance with the results found by Chagas et al. [33] for cyanobacteria of the same species (volatile matter of 79.38% and ash content of 7.94%). Biomass with a high content of volatiles and small amounts of ash, as in the case of Spirulina platensis, has greater reactive capacities that can lead to high ignition power for fuels [34].
The ash content directly affects the higher heating value (HHV) of biomass; that is, the higher the amount of ash, the smaller the HHV. Thus, the low percentage of ash observed for Spirulina platensis favored a high heating value (20.86 MJ/kg). This HHV exceeded the values reported by Carrier et al. [35] for sugarcane bagasse (17.60 MJ/kg) and Norouzi et al. [36] for macroalgae Gracilaria gracilis (12.87 MJ/kg) but is similar to those found for other microalgae, such as Chlamydomonas reinhardtii (20.68 MJ/kg) [13] and Chlorella vulgaris (21.10 MJ/kg) [37].
Elemental analysis showed that the nitrogen percentage of Spirulina platensis (9.84%) is significantly higher than that observed in lignocellulosic biomass, such as sugarcane bagasse (0.5%) and corn cob (0.6%) [38]. This can be attributed to the high protein content present in the microalgae composition (55.86%). The bio-oils obtained from microalgae raw materials have shown good quality since the high protein content of these biomass types leads to an increase in the production of aromatic hydrocarbons in comparison with lignocellulosic biomass [35]. This ensures that Spirulina platensis is an attractive resource to produce clean fuel through the pyrolysis process.
Microalgae biomass has a high carbon content and low oxygen content compared to lignocellulosic biomass [38]. In this study, the percentage of carbon identified in Spirulina platensis was 43.67%, a similar value to those found for other microalgae, e.g., Chlamydomonas reinhardtii (41.23%) [22,39].
While oxygen contents of more than 45% can be found in the biomass of traditional cultures, such as corn cobs [35], for Spirulina platensis, this content was 37.80%. Moreover, other biomass types may also have higher oxygen content than Spirulina platensis, e.g., Chlamydomonas reinhardtii (41.30%) [22,39], Chaetoceros gracilis (53.30%), and Pleurochrysis carterae (60.70%) [40].
Table 2 shows that the carbohydrate content (22.33%) of Spirulina platensis was higher than that of Chlamydomonas reinhardtii (3.28%) [21,39] and Nannochloropsis sp. (9.62%) [41]. This fact indicates that the bio-oil obtained through pyrolysis of Spirulina platensis may have a high content of oxygenated compounds considering that degradation of carbohydrates is associated with formation of these components [5,7,42].
Regarding lipid content, the Spirulina platensis presented a lipid value of 11.38%. This content is a considerable factor in selection of microalgae as a raw material to produce biofuels by pyrolysis. This is because thermal degradation of the lipid fraction can lead to formation of aliphatic hydrocarbons. Additionally, during the conversion process, reactions between lipids and carbohydrates or lipids and proteins (synthesis of biosurfactants) may occur, which can stimulate the diversity of chemical compounds [43].
3.2. Catalyst Characteristics
The diffractograms of the non-calcined sample and the mixed oxides obtained after heat treatment are shown in Figure 3a,b, respectively.
The non-calcined sample (HC000) showed diffraction peaks characteristic of hydrocalumite ([Ca2Al(OH)6]NO3∙2H2O) (JCPDS 31-0245) [14,44]. In addition, there were clear reflections of the crystalline calcite phase (JCPDS 47-1743), which is a polymorph of calcium carbonate (CaCO3). This can be explained by absorption of CO2 during the synthesis or storage process of hydrocalumite [45,46].
Figure 3b illustrates complete destruction of the lamellar structure of hydrocalumite and disappearance of peaks related to the calcite phase between 36.14° and 48.72° (Figure 3a). This phenomenon can be attributed to the carbonation reactions that promote conversion of CaCO3 to CaO at temperatures above 700 °C [47]. Along with the calcium oxide peaks (JCPDS 48-1467), formation of diffraction peaks of the mayenite phase (Ca12Al14O33) (JCPDS 09-0413) was identified in HC700 as well. The high intensity of the diffraction peaks observed in HC700 suggests high crystallinity of the mixed oxides obtained. The highest-intensity peak was observed for the CaO phase (2θ = 37.5°), which led to an average crystallite size of 91 nm, determined by the Scherrer equation [48,49].
Figure 4a shows the typical structure of hydrocalumite obtained by scanning electron microscopy, where it is possible to observe the presence of the lamellae in the sample (HC000). Calcination at 700 °C enabled collapse of the lamellar layers and formation of small pores (Figure 4b), which increased the catalytic activity of the mixed oxides formed [50]. Compared to HC000 (Figure 4a), heat treatment caused a reduction in the interlamellar spaces and contributed to formation of a smaller, more crystalline, and slightly more disordered planar structure in HC700.
The results of the textural analysis of the hydrocalumite precursor and the mixed oxides are shown in Table 3. The highest values of specific surface area (23 m2/g) and pore volume (0.05 cm3/g) were found in the non-calcined sample, in accordance with the results reported by Pérez-Barrado et al. [51]. Calcination was responsible for reducing the specific area of the mixed oxides formed, possibly due to removal of anions present in the interlamellar layers. Zheng et al. [45] also reported similar results and noticed that an increase in the calcination temperature caused a decrease in the BET area due to material sintering and crystal growth.
3.3. Product Yields
The solid (SY), liquid (LY), and gas (GY) yields (Table 4) were obtained in the experiments carried out according to the central composite design (CCD). In some operating conditions, the solid yield was lower than the liquid and gas yields. As a rule, the higher the operating temperature, the lower the biochar yields [52]. Thermochemical decomposition time is another important variable to be considered when evaluating solid yields. In light of this discussion, when comparing the bio-coal yields in tests T5 (2.27 min) and T6 (27.73 min), it is possible to notice that a 25-min increase in reaction time provided a 41% lower solid yield. The minimum bio-oil yield (18.50%) found in this work was only 4% lower than the maximum liquid yield (22.55%) obtained during catalytic pyrolysis of Pavlova microalgae using a fixed-bed reactor [53]. This fact proves that use of different types of biomass and different process configurations have a direct impact on bio-oil yields.
The regression equations obtained to predict the solid, liquid, and gas yields as functions of the independent variables X1 (time) and X2 (percentage of catalyst) are given, in their matrix form, by Equations (6)–(8), respectively. The regressions were performed using software Stastistica® 7.0, and the experimental results (Table 4) and quadratic correlation coefficients (r²) obtained were 0.946, 0.933, and 0.861, respectively. The statistical analysis indicated that the residues were randomly and independently distributed with zero mean and constant variance. Only parameters with a p-value ≤ 5% were considered significant. Non-significant parameters (p-value > 5%) were given null values [54].
Under average operating conditions (X = 0), when assessing the impact of variables X1 and X2 on production of biochar (Equation (6)), it can be observed that the effect of reaction time on the solid yield was greater (about 733%) than that of percentage of catalyst. Both variables had negative effects on formation of the solid product. Likewise, X1 was the variable that most affected formation of gas products (Equation (8)), with an influence approximately 144% greater than the impact caused by variable X2. In this case, an increase in the percentage of catalyst led to a reduction in the gas yield. Furthermore, according to Equation (7), the reaction time and percentage of catalyst generated practically the same impact on the production of liquid products, with a difference of only 9% between them. Additionally, it is interesting to note that there was no interaction between time and percentage of catalyst in the formation of all products, considering B12 = 0 for all yields (Equations (6)–(8)).
3.4. Effect of a Multivariable System on Bio-Oil Yield
Figure 5 shows a response surface for the liquid yield as a function of thermochemical decomposition time (X1) and percentage of catalyst (X2) in coded form (Equations (4) and (5)), which was obtained from Equation (7). Indeed, higher percentages of catalyst favored condensation reactions, thus leading to a higher liquid yield. The increased amount of catalyst in the reactor ensured sufficient residence time to promote recombination reactions of some molecules present in the vapor, including alkylation, aromatization, and isomerization processes, which contributed to formation of condensable compounds [9].
Reaction time also had an impact on bio-oil yield. Intermediate values of X1 guaranteed the best results for liquid formation, with the highest yield (41.56%) being observed under the condition X1 = 0.00 (Test 8, Table 4). In contrast, higher values of reaction time slightly decreased the liquid yield. Times between 15 min and 24 min were effective in thermochemical degradation of biomass. This behavior can be lower deactivation of the catalyst, ensuring an increased liquid yield. The same phenomenon was observed by Rossi et al. [39], who studied the influence of reaction time on ex situ solar pyrolysis of microalgae Chlamydomonas reinhardtii. Although some studies indicate that an increment in reaction time may result in increased liquid yield, very long times contribute to occurrence of secondary reactions of thermal cracking, carbonization, and gasification responsible for increasing the gas yield at expense of the liquid yield [55].
3.5. Liquid Yield Optimization
Table 5 shows the results obtained from the optimization study. The values of the independent variables responsible for maximizing the bio-oil yield are in agreement with the best range observed in Figure 5. The solid, liquid, and gas yields predicted by Equations (6)–(8), respectively, and calculated by the optimal values of X1 and X2 are also listed in Table 5. A new solar pyrolysis experiment using the optimized conditions was conducted, and the results are reported in Table 5 as well. A comparison between the experimental results for SY, LY, and GY and those predicted by the regression equations pointed to errors of less than 10%, with an estimated error for liquid yield of less than 2%. It can then be concluded that the regression equations obtained in this work adequately describe the yields of products from solar pyrolysis (heating with Fresnel lens combined with hydrocalumite-type catalytic precursor).
The maximum liquid yield obtained during catalytic solar pyrolysis of Spirulina platensis (43.39%) was higher than that found by Babich et al. [55] for the microalgae Chlorella (41%) in the presence of the basic catalyst Na2CO3. The bio-oil yield found herein was also higher than that obtained in the conventional pyrolysis process of the microalgae Lyngbya sp. (12.6%) and Cladophora sp. (20.5%) at 600 °C [56].
3.6. Bio-Oil Composition
The composition of bio-oil is directly linked to the biomass composition. Based on the results of chemical composition of Spirulina (Table 2), reaction routes were proposed, based on our previous work [7], for their pyrolysis from the degradation of their main components, as shown in Figure 6.
Degradation of lipids in the microalgae induces formation of fatty acids, which, in turn, are converted into linear aliphatic hydrocarbons by decarboxylation or decarbonization reactions [57]. At high temperatures, hydrocarbon dehydration reactions are favored, leading to aromatization of these compounds via the Diels–Alder reaction [58]. Oxygenated compounds are formed by dehydration of carbohydrate molecules in microalgae [59]. Degradation of amino acids that compose the structure of proteins, which are also present in the composition of Spirulina platensis, results in formation of several nitrogenous compounds [5,60].
FTIR analyses were used to correlate the functional groups and the compounds identified in the chromatographic analyses. As observed, the results agree with those found in the GCMS analysis, which are listed in Table 6. Figure 7 displays the bio-oil IR spectra obtained in the solar pyrolysis experiments of Spirulina platensis. The spectrum of bio-oil produced under the optimized conditions of X1 and X2 is also reported and described as TOT.
The presence of peaks in the same wavenumber, observed in all bio-oil samples, indicates that the liquid product obtained by solar pyrolysis of Spirulina platensis had the same functional groups under different operating conditions. The absorption band between 3055 and 3745 cm−1 characterizes formation of oxygenated compounds (associated with O–H bond vibrations). Furthermore, peaks in the region between 975 and 1215 cm−1 occurred mainly due to C−O vibrations caused by the presence of oxygenated compounds, such as alcohols, phenols, and esters [61].
The presence of methyl (−CH3) and methylene (−CH2−) groups related to aliphatic hydrocarbons (alkanes and alkenes) is evidenced by the intense peak between 2840 and 3005 cm−1 characterized by C−H vibrations and deformation vibrations of the C−H bond in the wavenumbers between 1235 and 1475 cm−1 [62]. Additionally, the small peak with absorption at 1659 cm−1 is attributed to stretching of C=C bonds arising from the presence of olefins that configure formation of alkenes [61,63]. The peaks between 793 and 885 cm−1 are assigned to stretching of aromatic vibrations [61], which indicates the presence of aromatic compounds in the bio-oil obtained by solar pyrolysis of Spirulina platensis.
The GCMS analysis of the bio-oil samples obtained by the tests of the Central Composite Design (Table 2) enabled quantification of compounds according to the area of each chromatographic peak. The percentages related to the contents of hydrocarbons and oxygenated and nitrogenous compounds are shown in Figure 8. The oxygenated compounds represent the sum of alcohols, carboxylic acids, ketones, esters, ethers, phenols, and furans observed in the bio-oil samples.
As shown in Figure 8, tests 1 and 7 (performed with little or no amount of catalyst) were the ones that produced bio-oil with a higher concentration of oxygenated compounds (T1 = 51.20% and T7 = 41.18%). Consequently, these same experiments had the smallest fraction of hydrocarbons (T1 = 24.93% and T7 = 25.84%). These results show that mixed oxides derived from hydrocalumite favored the reaction routes, contributing to production of hydrocarbons in the catalytic solar pyrolysis process of Spirulina platensis. When comparing the results of tests 7 (without catalyst, i.e., X2 = −1.41) and 8 (percentage of catalyst of 58.58% or X2 = 1.41), the fraction of hydrocarbons identified increased from around 26% to 50%, while the content of oxygenated compounds dropped from around 41% to 20%.
Navarro et al. [64] reported that basic catalysts are capable of altering the reaction route, promoting a decrease in oxygenated compounds due to removal of acids. Conversion of acids to hydrocarbons can occur via catalytic thermal cracking [65]. Calcium oxides have also shown good performance in reduction in yields of acids and ketones while promoting an increase in the contents of aromatic hydrocarbons [60]. Therefore, the presence of CaO in the composition of the HC700 catalyst used in the solar pyrolysis reactions was significant for conversion of oxygenated compounds to hydrocarbons. The maximum hydrocarbon yield (55.14%) associated with one of the smallest amounts of oxygenates (15.78%) was found in T9 (Figure 8a,b). These values were greater than the maximum yields found in the in situ solar pyrolysis of Spirulina platensis (27% of hydrocarbons and 45% of oxygenated compounds) [12], reinforcing the favorable performance of mixed oxides derived from hydrocalumite in the removal of oxygenated compounds during ex situ solar pyrolysis.
Although Spirulina platensis has a high concentration of proteins (55.86%) responsible for formation of nitrogenous compounds in the liquid product, these compounds were identified in smaller amounts (15–27%) than oxygenated ones (14–51%). Similar behavior was observed by Barbosa et al. [7]. The polymerization or thermal cracking reactions that normally occur during pyrolysis processes favored reduction in nitrogenous compounds present in the bio-oil due to their capacity to convert such compounds into light gases, such as HCN or NH3 [66].
3.7. Effect of the Studied Variables on Bio-Oil Composition
Figure 9 shows the percentage of hydrocarbons (a) and oxygenated compounds (b) in the bio-oil as a function of reaction time (X1) and percentage of catalyst (X2) in coded form (Equations (4) and (5)). Regarding bio-oil quality, the best condition is the one that yields the smallest amount of oxygenates. According to Figure 9b, the region of domain of the variables in which the minimum production of these compounds was observed coincides with the region close to the central point (X1 = 0 and X2 = 0). Figure 9a indicates that the central region of the experimental domain is also the region capable of maximizing the fraction of hydrocarbons. Therefore, it can be suggested that the mixed oxides derived from hydrocalumite favored deoxygenation of bio-oil and contributed to chemical routes that certainly increased the hydrocarbon content during the ex situ solar pyrolysis process.
As shown in Figure 9a, higher percentages of catalyst (X2) led to formation of hydrocarbons in the bio-oil. In this case, the increase in the catalytic bed enhanced the contact between the pyrolysis vapors and the catalyst and was responsible for favoring reactions of hydrocarbon formation through degradation of fatty acids. However, there is a limit to this increase in formation of hydrocarbons. When studying microalgae catalytic pyrolysis, Thangalazhy-Gopakumar et al. [67] observed that the fraction of hydrocarbons present in bio-oil increased as a function of the mass percentage of the catalyst.
When pyrolysis occurs at very long reaction times, coke formation and poisoning of the catalyst active sites can occur, leading to catalytic deactivation and, consequently, a lower hydrocarbon yield [11]. Nonetheless, a higher hydrocarbon yield was observed when longer reaction times (X1) were applied (Figure 9a). This phenomenon probably occurred due to the restrictive ability of hydrocalumite precursors to coke formation compared to other catalysts [68,69,70,71,72].
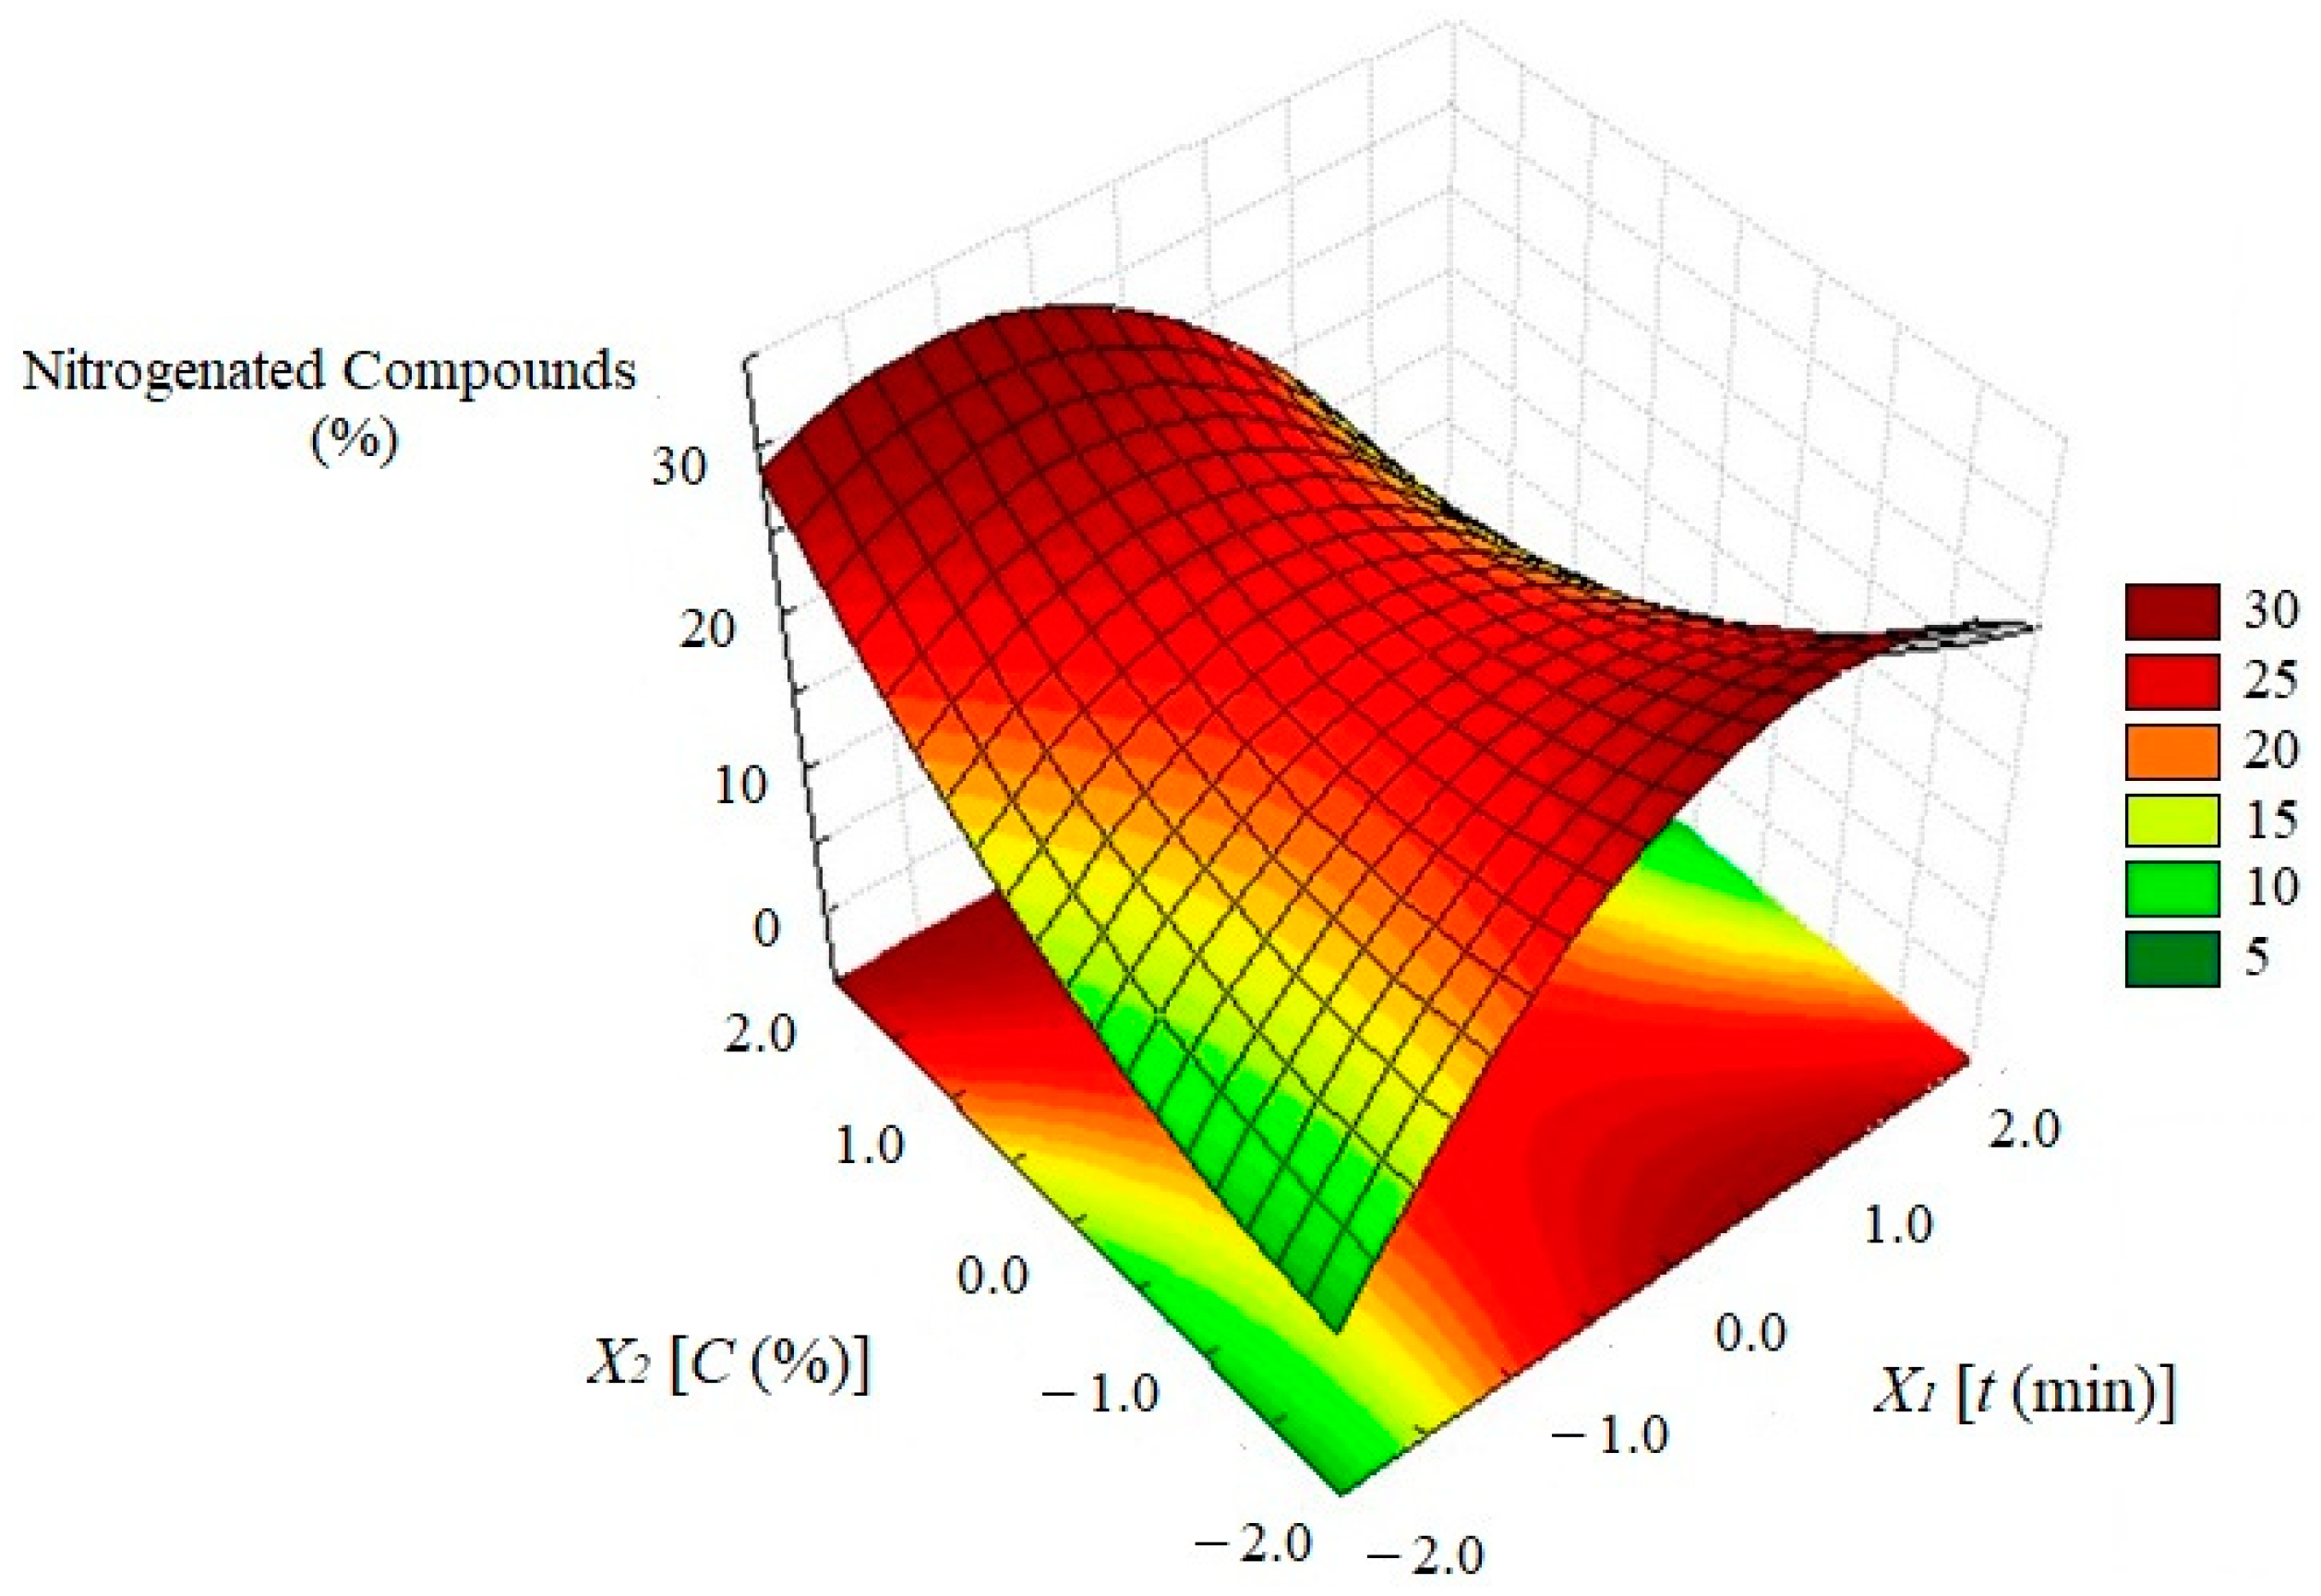
Formation of nitrogenous compounds in the bio-oil as a function of independent variables X1 and X2 (in coded form) is depicted in Figure 10. The conditions that yielded the smallest amounts of nitrogen-containing products were those with low reaction times (X1) and low percentages of catalyst (X2). Conversion of nitrogenous compounds into bio-oil takes place via the Hofmann mechanism through the interaction between acidic and basic sites of the catalyst and the nitrogen present in the molecule [73]. Thus, as a bifunctional catalyst, hydrocalumite can also act in this reaction route.
4. Conclusions
The liquid product obtained by the catalytic solar pyrolysis process of Spirulina platensis showed highly desirable compounds, including long-chain aliphatic hydrocarbons (i.e., octadecane and scalene) and aromatic hydrocarbons (i.e., styrene, ethylbenzene, and toluene) widely used in fuel additives and chemicals. Formation of these compounds was favored when intermediate and longer reaction times (t) were associated with intermediate and greater percentages of catalyst (C), demonstrating a positive performance of hydrocalumite-mixed oxides in the restriction of coke formation. Moreover, the smallest number of oxygenated compounds (14%) was observed in the same experimental range (t = 15 min and C = 29%), which ended up maximizing the fraction of hydrocarbons (55.14%), resulting in a bio-oil yield of 31.37%. However, the optimization study using the differential evolution algorithm indicated that the maximum bio-oil yield (43.39%) was obtained with t = 23.4 min and C = 58.6%.
The results of this work show that mixed oxides derived from hydrocalumite have good application potential for the ex situ catalytic solar pyrolysis process of Spirulina platensis since their application contributed to a reduced reaction time and improved bio-oil quality due to the reduced amount of oxygenates and increased hydrocarbon content. In addition, the Fresnel lens proved to be an important instrument to produce bio-oil from a renewable source of energy (sunlight) without burning other fuels or using electricity, evidencing that solar pyrolysis can be applied as a sustainable process.
Author Contributions
M.P.B.M.: Investigation, Methodology, Formal analysis, Data curation, and Writing—Original Draft. C.E.H.: Validation and Writing—Review & Editing. M.A.S.B.: Supervision, Validation, and Writing—Review & Editing. L.G.M.V.: Conceptualization, Supervision, and Funding acquisition. All authors have read and agreed to the published version of the manuscript.
Funding
This research was funded by FAPEMIG (APQ/01758-17).
Data Availability Statement
The data that support the findings of this study are available from the corresponding author upon reasonable request.
Acknowledgments
The authors would like to thank the Brazilian research funding agencies CAPES, CNPq, and FAPEMIG (APQ/01758-17) and the Brazilian Synchrotron Light Laboratory (LNLS).
Conflicts of Interest
The authors declare no potential conflicts of interest with respect to the research, authorship, and/or publication of this article.
Abbreviations and Symbols
| ASTM | American Society for Testing and Materials |
| C | percentage of catalyst (%) |
| Dpore | pore diameter (Å) |
| d# | sieve diameter (mm) |
| di | internal diameter of the catalytic reactor (cm) |
| GY | gas yield (%) |
| JCPDS | Joint Committee on Powder Diffraction Standards |
| HHV | higher heating value (MJ/kg) |
References
- Assis, T.C.; Calijuri, M.L.; Assemany, P.P.; Pereira, A.S.A.; Martins, M.A. Using atmospheric emissions as CO2 source in the cultivation of microalgae: Productivity and economic viability. J. Clean. Prod. 2019, 215, 1160–1169. [Google Scholar] [CrossRef]
- Lee, X.J.; Ong, H.C.; Gan, Y.Y.; Chen, W.H.; Mahlia, T.M.I. State of art review on conventional and advanced pyrolysis of macroalgae and microalgae for biochar, bio-oil and bio-syngas production. Energy Convers. Manag. 2020, 210, 112707. [Google Scholar] [CrossRef]
- Mahlia, T.M.I.; Syazmi, Z.A.H.S.; Mofijur, M.; Abas, A.E.P.; Bilad, M.R.; Ong, H.C. Patent landscape review on biodiesel production: Technology updates. Renew. Sustain. Energy Rev. 2020, 118, 109526. [Google Scholar] [CrossRef]
- Mumbach, G.D.; Alves, J.L.F.; Silva, J.C.G.; Domenico, M.D.; Arias, S.; Pacheco, J.G.A.; Marangoni, C.; Machado, R.A.F.; Bolzan, A. Prospecting pecan nutshell pyrolysis as a source of bioenergy and bio-based chemicals using multicomponent kinetic modeling, thermodynamic parameters estimation, and Py-GC/MS analysis. Renew. Sustain. Energy Rev. 2022, 153, 111753. [Google Scholar] [CrossRef]
- Santos, M.R.; Sales, R.F.; Silva, A.O.S.; Teixeira, C.M.; Pacheco, J.G.A.; Fréty, R. Flash pyrolysis of myristic acid adsorbed on supported nickel catalysts for biofuel production. J. Therm. Anal. Calorim. 2015, 119, 1875–1885. [Google Scholar] [CrossRef]
- Arias, S.; González, J.F.; Sousa, L.V.; Barbosa, C.B.M.; Silva, A.O.S.; Fréty, R.; Pacheco, J.G.A. Influence of Ni/Al ratio on the fast pyrolysis of myristic acid when adsorbed on unsupported mixed oxides derived from layered double hydroxides. Catal. Today 2021, 381, 181–191. [Google Scholar] [CrossRef]
- Barbosa, J.M.; Andrade, L.A.; Vieira, L.G.M.; Barrozo, M.A.S. Multi-response optimization of bio-oil production from catalytic solar pyrolysis of Spirulina platensis. J. Energy Inst. 2020, 93, 1313–1323. [Google Scholar] [CrossRef]
- Santos, K.G.; Lobato, F.S.; Lira, T.S.; Murata, V.V.; Barrozo, M.A.S. Sensitivity analysis applied to independent parallel reaction model for pyrolysis of bagasse. Chem. Eng. Res. Des. 2012, 90, 1989–1996. [Google Scholar] [CrossRef]
- Mayer, F.M.; Teixeira, C.M.; Pacheco, J.G.A.; Souza, C.T.; Bauer, D.V.; Caramão, E.B.; Espíndola, J.S.; Trierweiler, J.O.; Lopez, O.W.P.; Zini, C.A. Characterization of analytical fast pyrolysis vapors of medium-density fiberboard (MDF) using metal-modified HZSM-5. J. Anal. Appl. Pyrolysis 2018, 136, 87–95. [Google Scholar] [CrossRef]
- Cheng, S.; Wei, L.; Zhao, X.; Julson, J. Application, deactivation, and regeneration of heterogeneous catalysts in bio-oil upgrading. Catalysts 2016, 6, 195. [Google Scholar] [CrossRef]
- Muley, P.D.; Henkel, C.E.; Aguilar, G.; Klasson, K.T.; Boldor, D. Ex situ thermo-catalytic upgrading of biomass pyrolysis vapors using a traveling wave microwave reactor. Appl. Energy 2016, 183, 995–1004. [Google Scholar] [CrossRef] [Green Version]
- Andrade, L.A.; Barbosa, J.M.; Barrozo, M.A.S.; Vieira, L.G.M. A comparative study of the behavior of Chlamydomonas reinhardtii and Spirulina platensis in solar catalytic pyrolysis. Int. J. Energy Res. 2020, 44, 5397–5411. [Google Scholar] [CrossRef]
- Andrade, L.A.; Batista, F.R.X.; Lira, T.S.; Barrozo, M.A.S.; Vieira, L.G.M. Characterization and product formation during the catalytic and non-catalytic pyrolysis of the green microalgae Chlamydomonas reinhardtii. Renew. Energy 2018, 119, 731–740. [Google Scholar] [CrossRef]
- Lopez-Salinas, E.; Serrano, M.E.L.; Jacome, M.A.C. Characterization of Synthetic Hydrocalumite-Type [Ca2AI(OH)6]NO3. mH2O: Effect of the Calcination Temperature. J. Porous Mater. 1996, 2, 291–297. [Google Scholar] [CrossRef]
- Rousselot, I.; Taviot-Guého, C.; Leroux, F.; Léone, P.; Palvadeau, P.; Besse, J.P. Insights on the structural chemistry of hydrocalumite and hydrotalcite-like materials: Investigation of the series Ca2M3+(OH)6Cl·2H2O (M3+: Al3+, Ga3+, Fe3+, and Sc3+) by X-ray powder diffraction. J. Solid State Chem. 2002, 167, 137–144. [Google Scholar] [CrossRef]
- Linares, C.F.; Ocanto, F.; Bretto, P.; Monsalve, M. Study of as-synthesized and calcined hydrocalumites as possible antacid agents. Bull. Mater. Sci. 2014, 37, 941–944. [Google Scholar] [CrossRef] [Green Version]
- Campos-Molina, M.J.; Santamaría-Gonźalez, J.; Ḿerida-Robles, J.; Moreno-Tost, R.; Albuquerque, M.C.G.; Bruque-Ǵamez, S. Base catalysts derived from hydrocalumite for the transesterification of sunflower oil. Energy Fuels 2010, 24, 979–984. [Google Scholar] [CrossRef]
- Maree, D.C.; Heydenrych, M. Development of a Mesoporous Silica-Supported Layered Double Hydroxide Catalyst for the Reduction of Oxygenated Compounds in E. grandis Fast Pyrolysis Oils. Catalysts 2021, 11, 1527. [Google Scholar] [CrossRef]
- Zeng, K.; Gauthier, D.; Lu, J.; Flamant, G. Parametric study and process optimization for solar pyrolysis of beech wood. Energy Convers. Manag. 2015, 106, 987–998. [Google Scholar] [CrossRef]
- Zeaiter, J.; Ahmad, M.N.; Rooney, D.; Samneh, B.; Shammas, E. Design of an automated solar concentrator for the pyrolysis of scrap rubber. Energy Convers. Manag. 2015, 101, 118–125. [Google Scholar] [CrossRef]
- Andrade, L.A.; Barrozo, M.A.S.; Vieira, L.G.M. A study on dynamic heating in solar dish concentrators. Renew. Energy 2016, 87, 501–508. [Google Scholar] [CrossRef]
- Andrade, L.A.; Barrozo, M.A.S.; Vieira, L.G.M. Catalytic solar pyrolysis of microalgae Chlamydomonas. Sol. Energy 2018, 173, 928–938. [Google Scholar] [CrossRef]
- Zeng, K.; Gauthier, D.; Soria, J.; Mazza, G.; Flamant, G. Solar pyrolysis of carbonaceous feedstocks: A review. Sol. Energy 2017, 156, 73–92. [Google Scholar] [CrossRef]
- Zeng, K.; Li, R.; Minh, D.P.; Weiss-Hortala, E.; Nzihou, A.; He, X. Solar pyrolysis of heavy metal contaminated biomass for gas fuel production. Energy 2019, 187, 116016. [Google Scholar] [CrossRef]
- Hijazi, A.; Boyadjian, C.; Ahmad, M.N.; Zeaiter, J. Solar pyrolysis of waste rubber tires using photoactive catalysts. Waste Manag. 2018, 77, 10–21. [Google Scholar] [CrossRef]
- Boutin, R.; Munnier, E.; Renaudeau, N.; Girardot, M.; Pinault, M.; Chevalier, S.; Chourpa, I.; Clément-Larosière, B.; Imbert, C.; Boudesocque-Delaye, L. Spirulina platensis sustainable lipid extracts in alginate-based nanocarriers: An algal approach against biofilms. Algal Res. 2019, 37, 160–168. [Google Scholar] [CrossRef]
- Zhou, J.; Wang, M.; Saraiva, J.A.; Martins, A.P.; Pinto, C.A.; Prieto, M.A.; Simal-Gandara, J.; Cao, H.; Xiao, J.; Barba, F.J. Extraction of lipids from microalgae using classical and innovative approaches. Food Chem. 2022, 384, 132235. [Google Scholar] [CrossRef]
- Silva, N.C.; Duarte, C.R.; Barrozo, M.A.S. Analysis of the use of a non-conventional rotary drum for dehydration of microalga Spirulina platensis. Bioprocess Biosyst. Eng. 2020, 43, 1359–1367. [Google Scholar] [CrossRef]
- D’oca, M.G.M.; Viêgas, C.V.; Lemões, J.S.; Miyasaki, E.K.; Morón-Villarreyes, J.A.; Primel, E.G. Production of FAMEs from several microalgal lipidic extracts and direct transesterification of the Chlorella pyrenoidosa. Biomass Bioenergy 2011, 35, 1533–1538. [Google Scholar] [CrossRef] [Green Version]
- Peng, W.; Wu, Q.; Tu, P. Pyrolytic characteristics of heterotrophic Chlorella protothecoides for renewable bio-fuel production. J. Appl. Phycol. 2001, 13, 5–12. [Google Scholar] [CrossRef]
- Jafarian, S.; Tavasoli, A. A comparative study on the quality of bioproducts derived from catalytic pyrolysis of green microalgae Spirulina (Arthrospira) plantensis over transition metals supported on HMS-ZSM5 composite. Int. J. Hydrogen Energy 2018, 43, 19902–19917. [Google Scholar] [CrossRef]
- Barrozo, M.A.S.; Murata, V.V.; Costa, S.M. The drying of soybean seeds in countercurrent and concurrent moving bed dryers. Dry. Technol. 1998, 16, 2033–2047. [Google Scholar] [CrossRef]
- Chagas, B.M.E.; Dorado, C.; Serapiglia, M.J.; Mullen, C.A.; Boateng, A.A.; Melo, M.A.F. Catalytic pyrolysis-GC/MS of Spirulina: Evaluation of a highly proteinaceous biomass source for production of fuels and chemicals. Fuel 2016, 179, 124–134. [Google Scholar] [CrossRef]
- Mishra, R.K.; Mohanty, K. Pyrolysis kinetics and thermal behavior of waste sawdust biomass using thermogravimetric analysis. Bioresour. Technol. 2018, 251, 63–74. [Google Scholar] [CrossRef] [PubMed]
- Carrier, M.; Joubert, J.E.; Danje, S.; Hugo, T.; Görgens, J.; Knoetze, J.H. Impact of the lignocellulosic material on fast pyrolysis yields and product quality. Bioresour. Technol. 2013, 150, 129–138. [Google Scholar] [CrossRef]
- Norouzi, O.; Tavasoli, A.; Jafarian, S.; Esmailpour, S. Catalytic upgrading of bio-products derived from pyrolysis of red macroalgae Gracilaria gracilis with a promising novel micro/mesoporous catalyst. Bioresour. Technol. 2017, 243, 1–8. [Google Scholar] [CrossRef]
- Ekpo, U.; Ross, A.B.; Camargo-Valero, M.A.; Williams, P.T. A comparison of product yields and inorganic content in process streams following thermal hydrolysis and hydrothermal processing of microalgae, manure and digestate. Bioresour. Technol. 2016, 200, 951–960. [Google Scholar] [CrossRef]
- Bui, H.H.; Tran, K.Q.; Chen, W.H. Pyrolysis of microalgae residues—A Kinetic study. Bioresour. Technol. 2015, 199, 362–366. [Google Scholar] [CrossRef]
- Rossi, R.A.S.; Barbosa, J.M.; Barrozo, M.A.S.; Vieira, L.G.M. Solar assisted catalytic thermochemical processes: Pyrolysis and hydropyrolysis of Chlamydomonas reinhardtii microalgae. Renew. Energy 2021, 170, 669–682. [Google Scholar] [CrossRef]
- Kanda, H.; Hoshino, R.; Murakami, K.; Zheng, Q.; Goto, M. Lipid extraction from microalgae covered with biomineralized cell walls using liquefied dimethyl ether. Fuel 2020, 262, 116590. [Google Scholar] [CrossRef]
- Kent, M.; Welladsen, H.M.; Mangott, A.; Li, Y. Nutritional evaluation of Australian microalgae as potential human health supplements. PLoS ONE 2015, 10, e0118985. [Google Scholar] [CrossRef]
- Niu, Q.; Wang, J.; Cao, C.; Cheng, Z.; Zhu, Y.; Wen, W. Comparative study of different algae pyrolysis using photoionization mass spectrometry and gas chromatography/mass spectrometry. J. Anal. Appl. Pyrolysis 2021, 155, 105068. [Google Scholar] [CrossRef]
- Wang, X.; Tang, X.; Yang, X. Pyrolysis mechanism of microalgae Nannochloropsis sp. based on model compounds and their interaction. Energy Convers. Manag. 2017, 140, 203–210. [Google Scholar] [CrossRef]
- Fahami, A.; Beall, G.W.; Enayatpour, S.; Tavangarian, F.; Fahami, M. Rapid preparation of nano hexagonal-shaped hydrocalumite via one-pot mechanochemistry method. Appl. Clay Sci. 2017, 136, 90–95. [Google Scholar] [CrossRef] [Green Version]
- Zheng, L.; Xia, S.; Lu, X.; Hou, Z. Transesterification of glycerol with dimethyl carbonate over calcined Ca-Al hydrocalumite. Cuihua Xuebao/Chinese. J. Catal. 2015, 36, 1759–1765. [Google Scholar] [CrossRef]
- Pérez-Barrado, E.; Pujol, M.C.; Aguiló, M.; Llorca, J.; Cesteros, Y.; Díaz, F. Influence of acid-base properties of calcined MgAl and CaAl layered double hydroxides on the catalytic glycerol etherification to short-chain polyglycerols. Chem. Eng. J. 2015, 264, 547–556. [Google Scholar] [CrossRef] [Green Version]
- Vieille, L.; Rousselot, I.; Leroux, F.; Besse, J.P.; Taviot-Guého, C. Hydrocalumite and Its Polymer Derivatives. 1. Reversible Thermal Behavior of Friedel’s Salt: A Direct Observation by Means of High-Temperature in Situ Powder X-ray Diffraction. Chem. Mater. 2003, 15, 4361–4368. [Google Scholar] [CrossRef]
- Chithambararaj, A.; Bose, A.C. Hydrothermal synthesis of hexagonal and orthorhombic MoO3 nanoparticles. J. Alloys Compd. 2011, 509, 8105–8110. [Google Scholar] [CrossRef]
- Sen, S.K.; Paul, T.C.; Dutta, S.; Hossain, M.N.; Mia, M.N.H. XRD peak profile and optical properties analysis of Ag-doped h-MoO3 nanorods synthesized via hydrothermal method. J. Mater. Sci. Mater. Electron. 2020, 31, 1768–1786. [Google Scholar] [CrossRef]
- Sipos, P.; Pálinkó, I. As-prepared and intercalated layered double hydroxides of the hydrocalumite type as efficient catalysts in various reactions. Catal. Today 2018, 306, 32–41. [Google Scholar] [CrossRef]
- Pérez-Barrado, E.; Pujol, M.C.; Aguiló, M.; Cesteros, Y.; Díaz, F.; Pallarès, J. Fast aging treatment for the synthesis of hydrocalumites using microwaves. Appl. Clay Sci. 2013, 80, 313–319. [Google Scholar] [CrossRef]
- Salehi, E.; Abedi, J.; Harding, T. Bio-oil from sawdust: Pyrolysis of sawdust in a fixed-bed system. Energy Fuels 2009, 23, 3767–3772. [Google Scholar] [CrossRef]
- Aysu, T.; Ola, O.; Maroto-Valer, M.M.; Sanna, A. Effects of tania based catalysts on in-situ pyrolysis of Pavlova microalgae. Fuel Process Technol. 2017, 166, 291–298. [Google Scholar] [CrossRef]
- Felipe, C.A.S.; Barrozo, M.A.S. Drying of soybean seeds in a concurrent moving bed: Heat and mass transfer and quality analysis. Dry. Technol. 2003, 21, 439–456. [Google Scholar] [CrossRef]
- Babich, I.V.; van der Hulst, M.; Lefferts, L.; Moulijn, J.A.; O’Connor, P.; Seshan, K. Catalytic pyrolysis of microalgae to high-quality liquid bio-fuels. Biomass Bioenergy 2011, 35, 3199–3207. [Google Scholar] [CrossRef]
- Maddi, B.; Viamajala, S.; Varanasi, S. Comparative study of pyrolysis of algal biomass from natural lake blooms with lignocellulosic biomass. Bioresour. Technol. 2011, 102, 11018–11026. [Google Scholar] [CrossRef] [PubMed]
- Na, J.G.; Park, Y.K.; Kim, D.I.; Oh, Y.K.; Jeon, S.G.; Kook, J.W. Rapid pyrolysis behavior of oleaginous microalga, Chlorella sp. KR-1 with different triglyceride contents. Renew. Energy 2015, 81, 779–784. [Google Scholar] [CrossRef]
- Wang, Z.; Liu, X.; Wang, Y.; Liu, L.; Wang, H.; Deng, S. Studies on the co-pyrolysis characteristics of oil shale and spent oil shale. J. Therm. Anal. Calorim. 2016, 123, 1707–1714. [Google Scholar] [CrossRef]
- Wang, S.; Zhang, F.; Cai, Q.; Zhu, L.; Luo, Z. Steam reforming of acetic acid over coal ash supported Fe and Ni catalysts. Int. J. Hydrogen Energy 2015, 40, 11406–11413. [Google Scholar] [CrossRef]
- Dai, M.; Yu, Z.; Fang, S.; Ma, X. Behaviors, product characteristics and kinetics of catalytic co-pyrolysis spirulina and oil shale. Energy Convers. Manag. 2019, 192, 1–10. [Google Scholar] [CrossRef]
- Aboulkas, A.; Hammani, H.; El Achaby, M.; Bilal, E.; Barakat, A.; El Harfi, K. Valorization of algal waste via pyrolysis in a fixed-bed reactor: Production and characterization of bio-oil and bio-char. Bioresour. Technol. 2017, 243, 400–408. [Google Scholar] [CrossRef] [PubMed]
- Francavilla, M.; Manara, P.; Kamaterou, P.; Monteleone, M.; Zabaniotou, A. Cascade approach of red macroalgae Gracilaria gracilis sustainable valorization by extraction of phycobiliproteins and pyrolysis of residue. Bioresour. Technol. 2015, 184, 305–313. [Google Scholar] [CrossRef] [PubMed]
- Li, F.; Srivatsa, S.C.; Batchelor, W.; Bhattacharya, S. A study on growth and pyrolysis characteristics of microalgae using Thermogravimetric Analysis-Infrared Spectroscopy and synchrotron Fourier Transform Infrared Spectroscopy. Bioresour. Technol. 2017, 229, 1–10. [Google Scholar] [CrossRef] [PubMed]
- Navarro, R.M.; Guil-Lopez, R.; Fierro, J.L.G.; Mota, N.; Jiménez, S.; Pizarro, P. Catalytic fast pyrolysis of biomass over Mg-Al mixed oxides derived from hydrotalcite-like precursors: Influence of Mg/Al ratio. J. Anal. Appl. Pyrolysis 2018, 134, 362–370. [Google Scholar] [CrossRef]
- Kumagai, S.; Yamasaki, R.; Kameda, T.; Saito, Y.; Watanabe, A.; Watanabe, C. Aromatic hydrocarbon selectivity as a function of CaO basicity and aging during CaO-catalyzed PET pyrolysis using tandem µ-reactor-GC/MS. Chem. Eng. J. 2018, 332, 169–173. [Google Scholar] [CrossRef]
- Wang, S.; Uzoejinwa, B.B.; Abomohra, A.E.F.; Wang, Q.; He, Z.; Feng, Y. Characterization and pyrolysis behavior of the green microalga Micractinium conductrix grown in lab-scale tubular photobioreactor using Py-GC/MS and TGA/MS. J. Anal. Appl. Pyrolysis 2018, 135, 340–349. [Google Scholar] [CrossRef]
- Thangalazhy-Gopakumar, S.; Adhikari, S.; Chattanathan, S.A.; Gupta, R.B. Catalytic pyrolysis of green algae for hydrocarbon production using H +ZSM-5 catalyst. Bioresour. Technol. 2012, 118, 150–157. [Google Scholar] [CrossRef]
- Aho, A.; Kumar, N.; Eränen, K.; Salmi, T.; Hupa, M.; Murzin, D.Y. Catalytic pyrolysis of woody biomass in a fluidized bed reactor: Influence of the zeolite structure. Fuel 2008, 87, 2493–2501. [Google Scholar] [CrossRef]
- Marcilla, A.; Beltrán, M.I.; Hernández, F.; Navarro, R. HZSM5 and HUSY deactivation during the catalytic pyrolysis of polyethylene. Appl. Catal. A Gen. 2004, 278, 37–43. [Google Scholar] [CrossRef]
- Vichaphund, S.; Aht-ong, D.; Sricharoenchaikul, V.; Atong, D. Catalytic upgrading pyrolysis vapors of Jatropha waste using metal promoted ZSM-5 catalysts: An analytical PY-GC/MS. Renew. Energy 2014, 65, 70–77. [Google Scholar] [CrossRef]
- Jia, L.Y.; Raad, M.; Hamieh, S.; Toufaily, J.; Hamieh, T.; Bettahar, M.M. Catalytic fast pyrolysis of biomass: Superior selectivity of hierarchical zeolites to aromatics. Green Chem. 2017, 19, 5442–5459. [Google Scholar] [CrossRef]
- Persson, H.; Duman, I.; Wang, S.; Pettersson, L.J.; Yang, W. Catalytic pyrolysis over transition metal-modified zeolites: A comparative study between catalyst activity and deactivation. J. Anal. Appl. Pyrolysis 2019, 138, 54–61. [Google Scholar] [CrossRef]
- Prado, G.H.C.; Rao, Y.; De Klerk, A. Nitrogen removal from oil: A review. Energy Fuels 2017, 31, 14–36. [Google Scholar] [CrossRef]
Figure 1.
Schematic representation of the experimental apparatus used in solar pyrolysis.

Figure 2.
Heating ramp during solar pyrolysis tests.

Figure 3.
X-ray diffraction profiles of (a) HC000 and (b) HC700.

Figure 4.
SEM images of hydrocalumite precursors: (a) HC000 and (b) HC700.
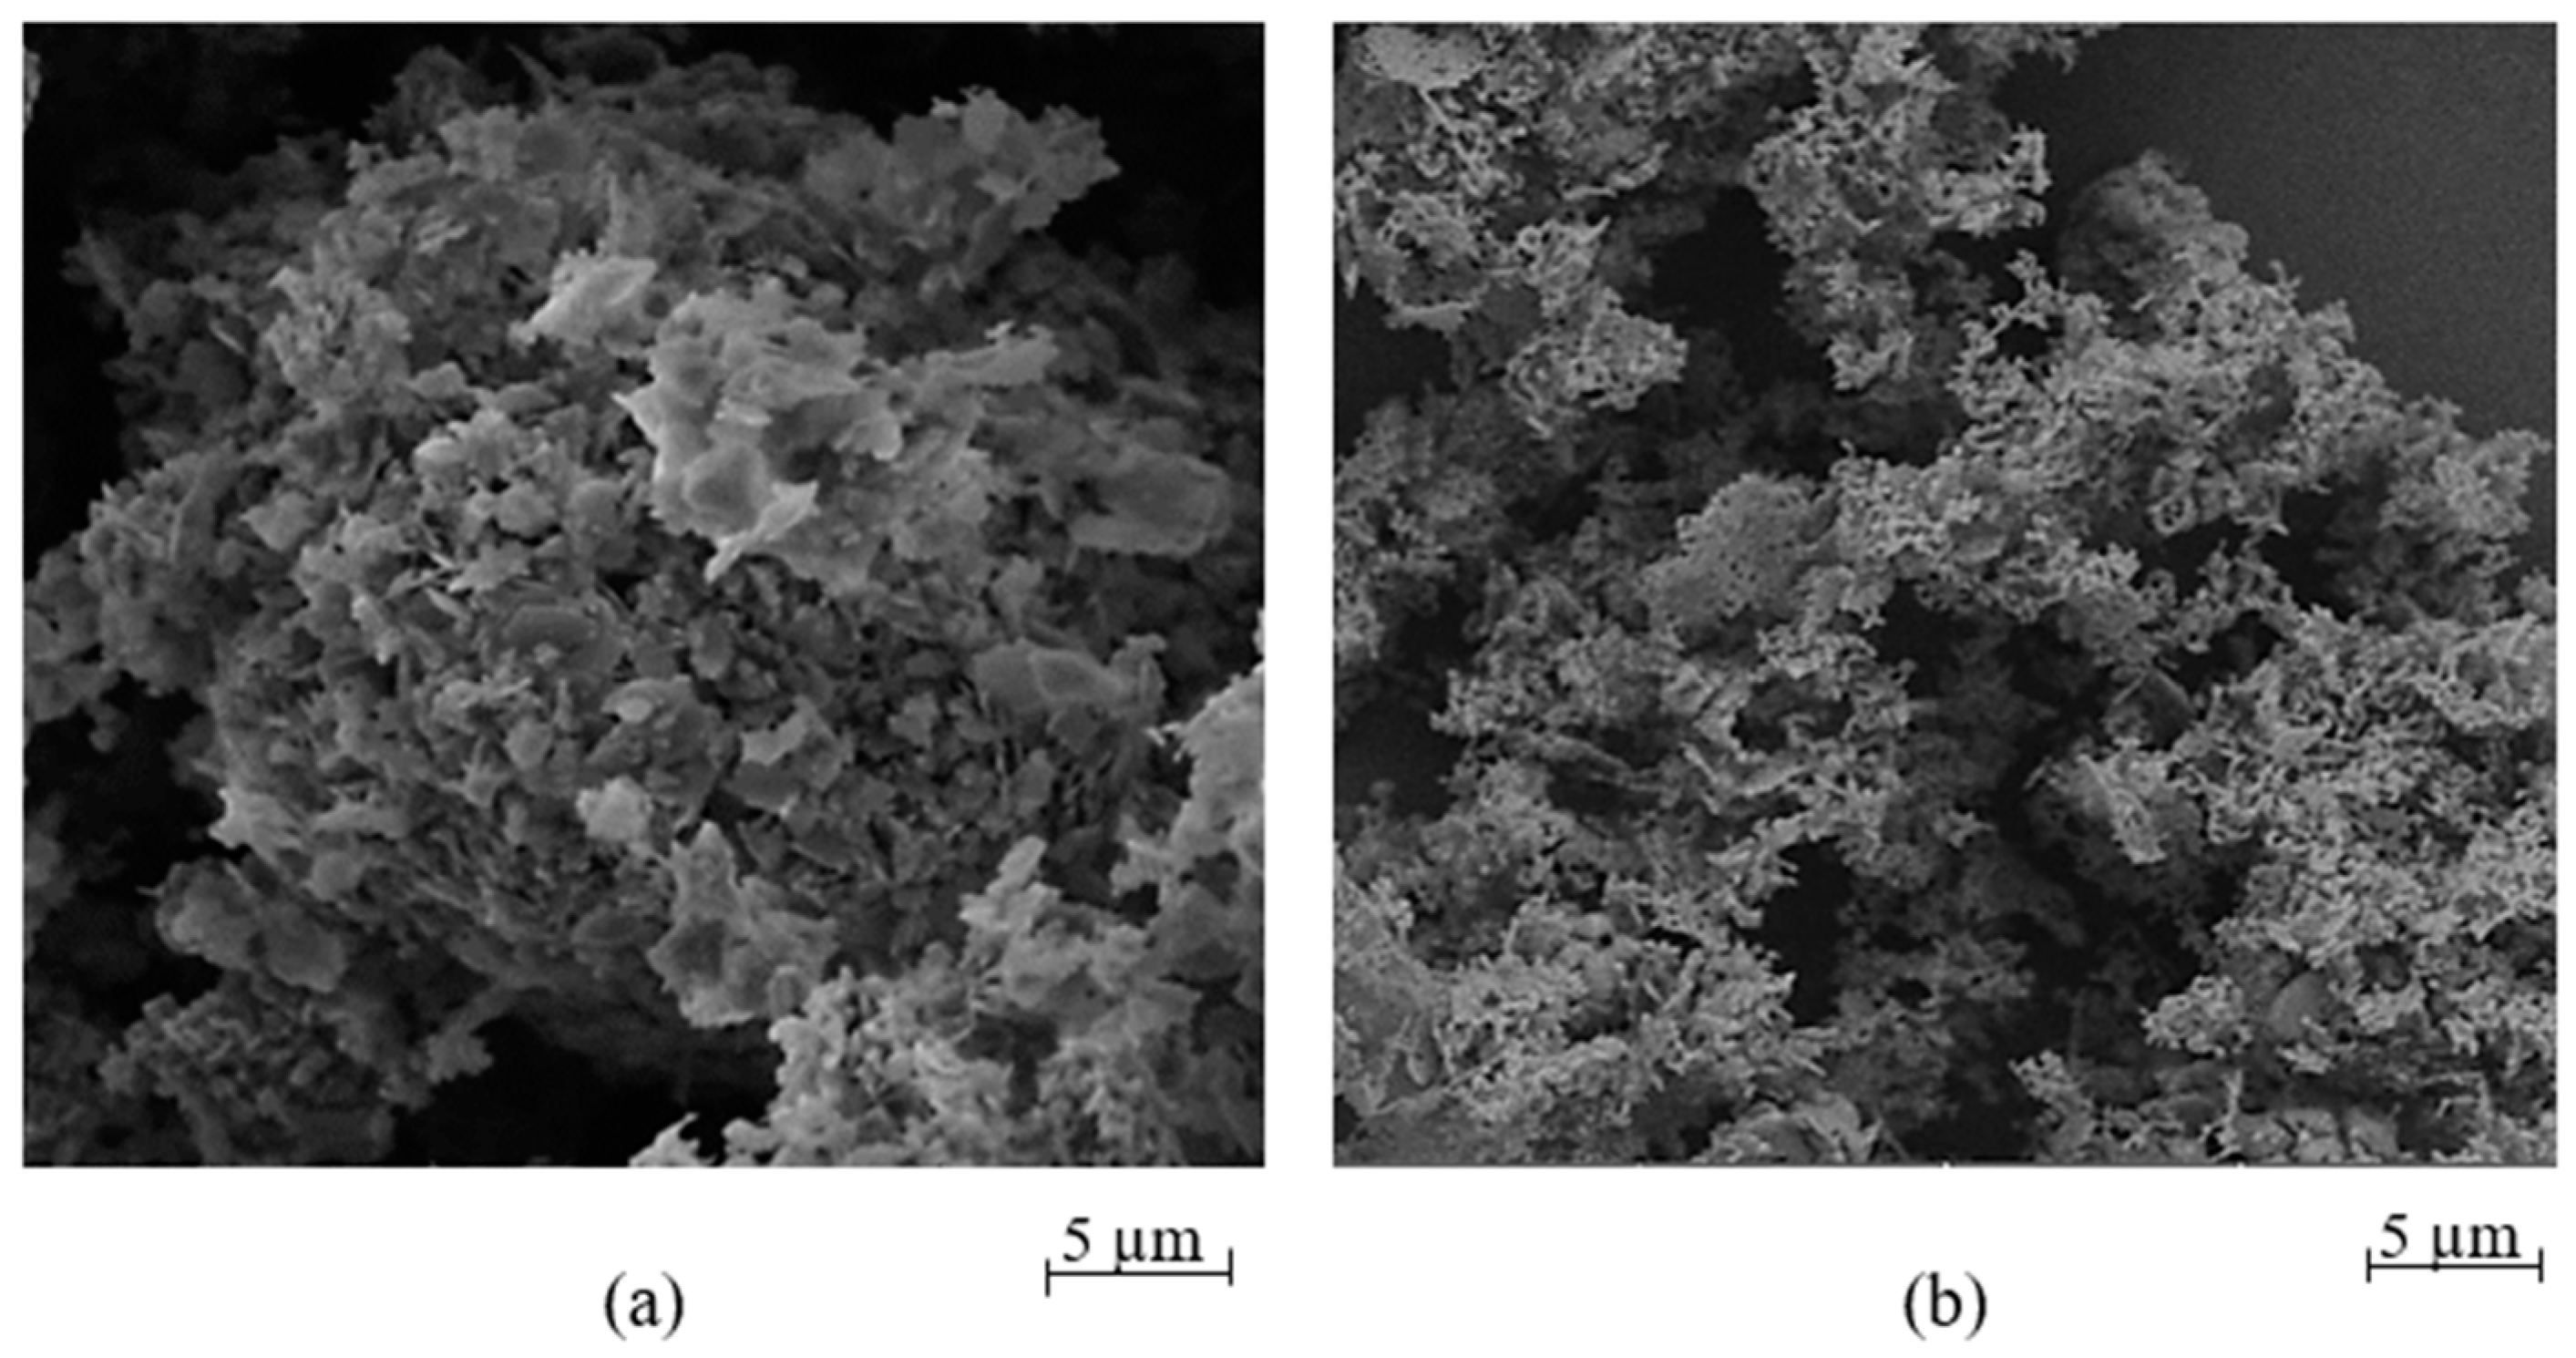
Figure 5.
Liquid yield as a function of reaction time (X1) and percentage of catalyst (X2).
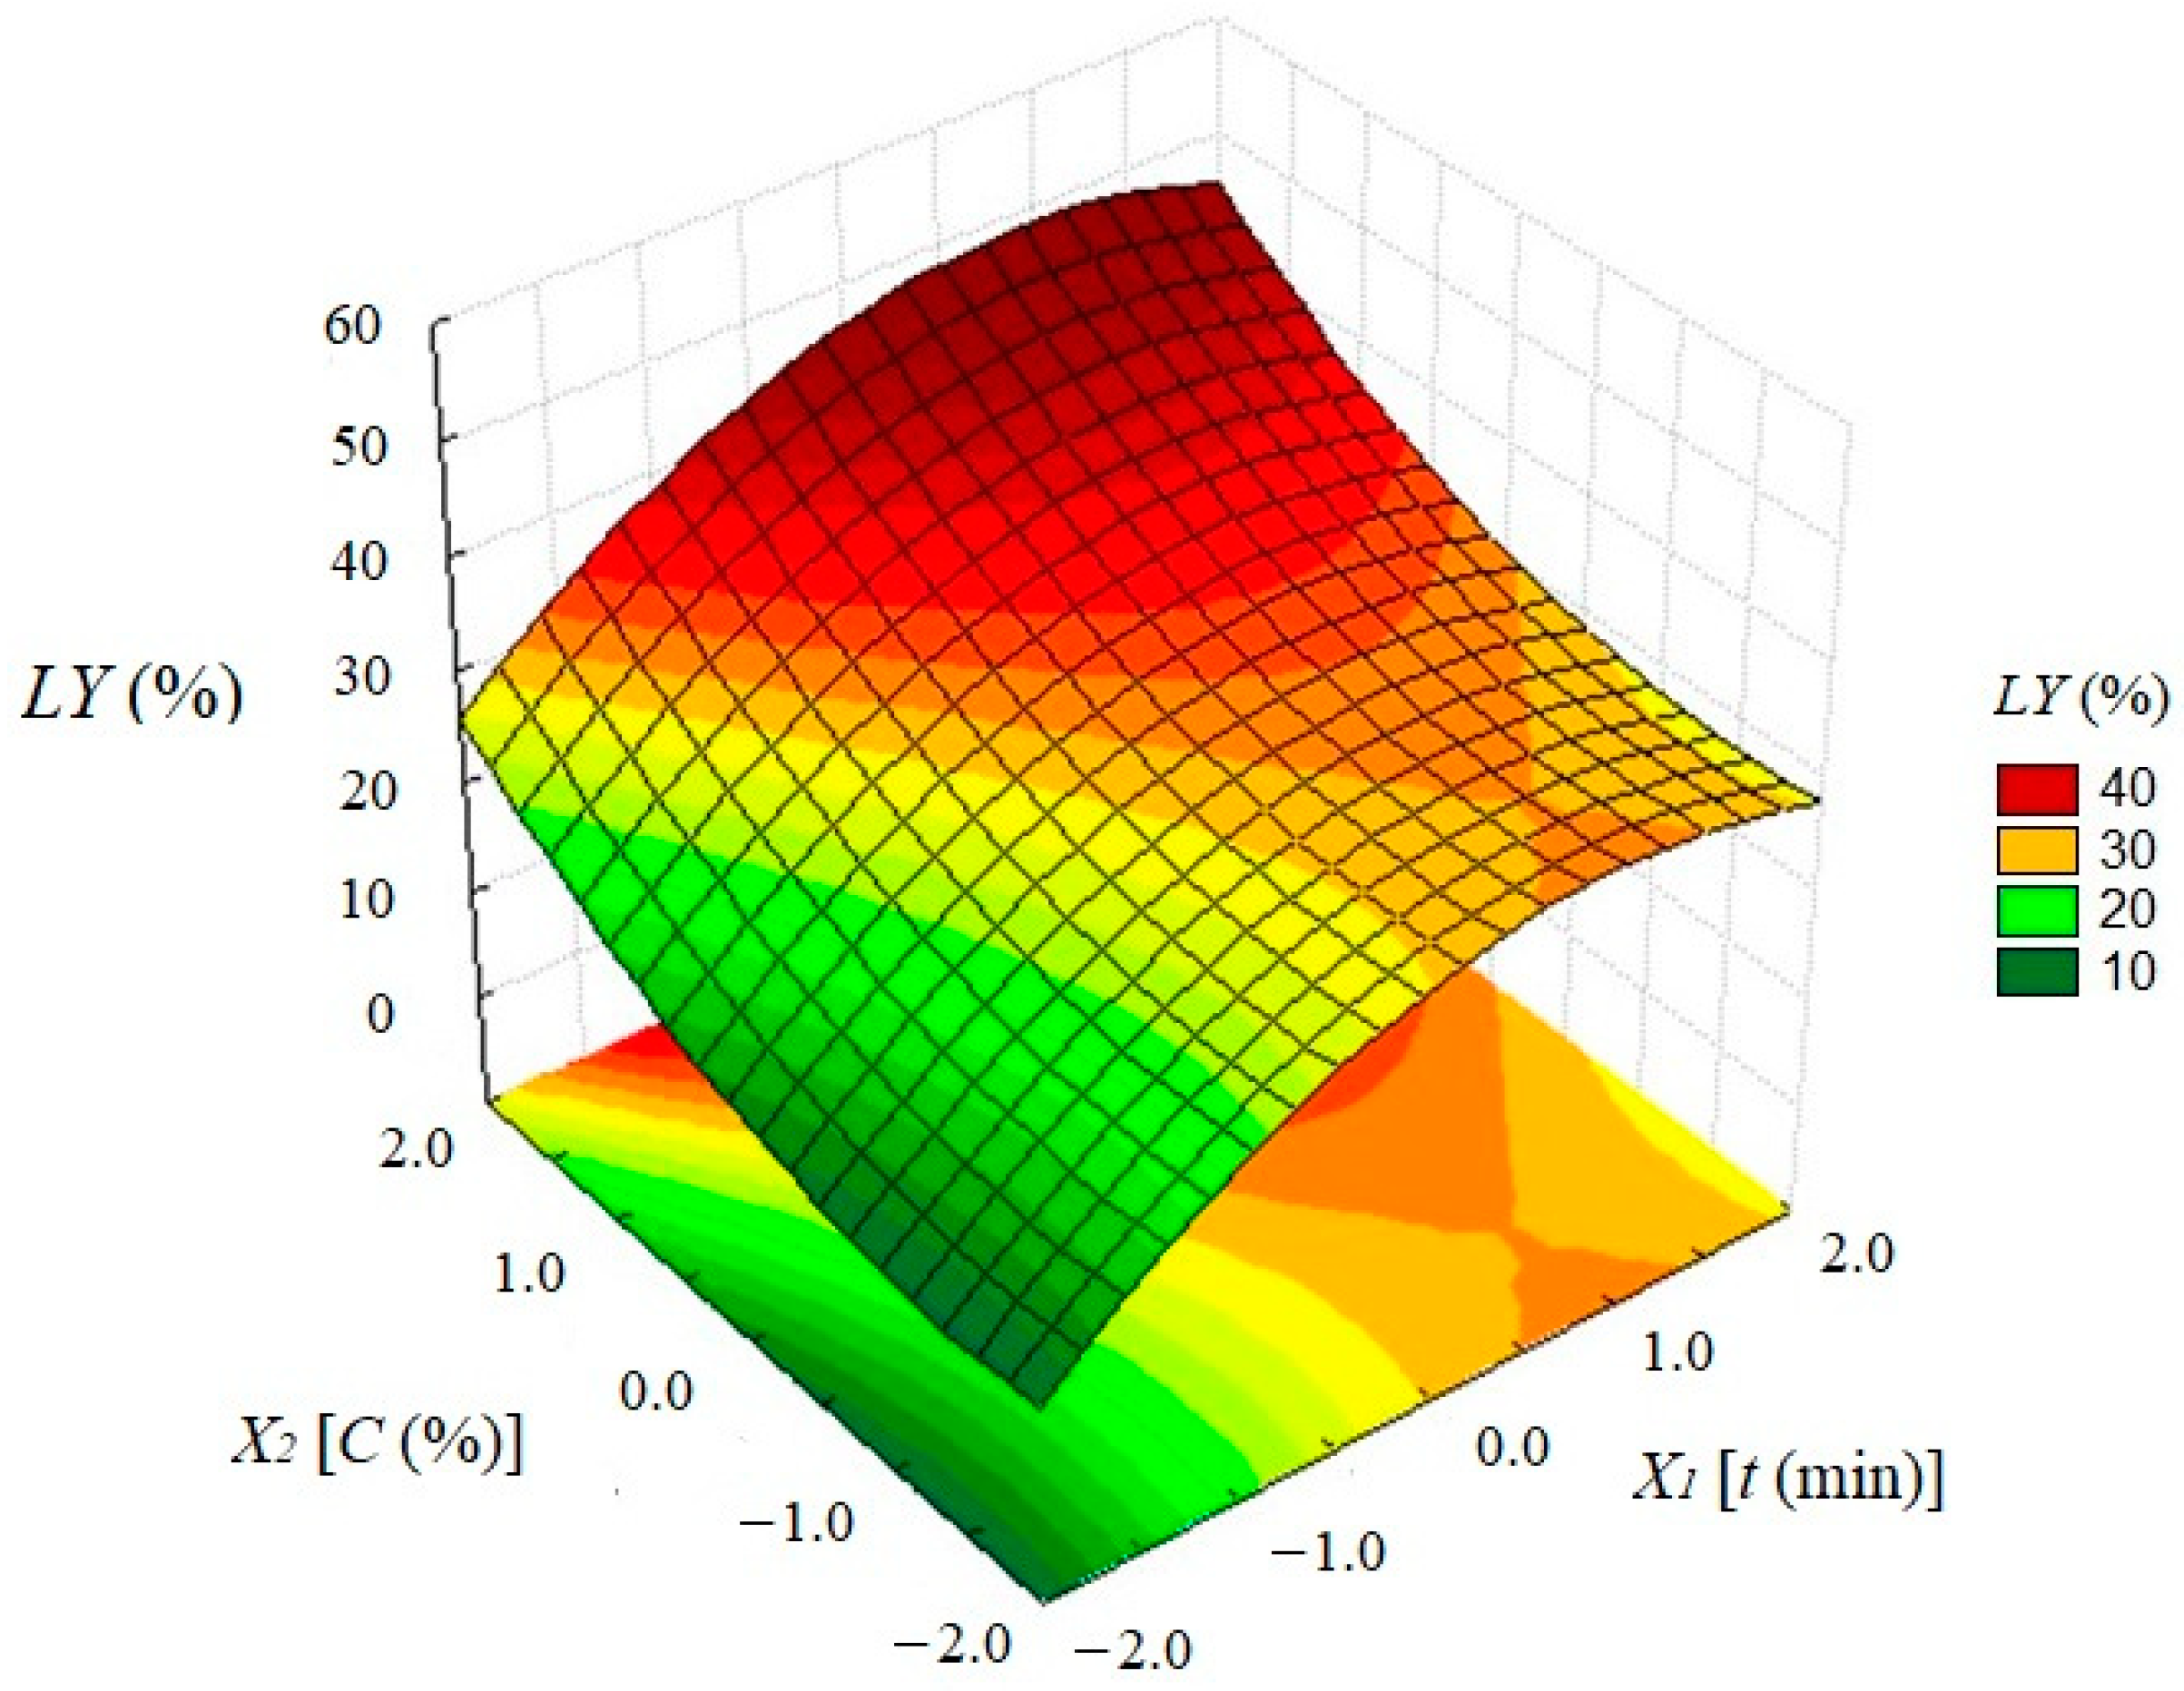
Figure 6.
Proposed reaction pathway for pyrolysis of Spirulina platensis.

Figure 7.
Infrared spectra of the bio-oil obtained by solar pyrolysis of Spirulina platensis.
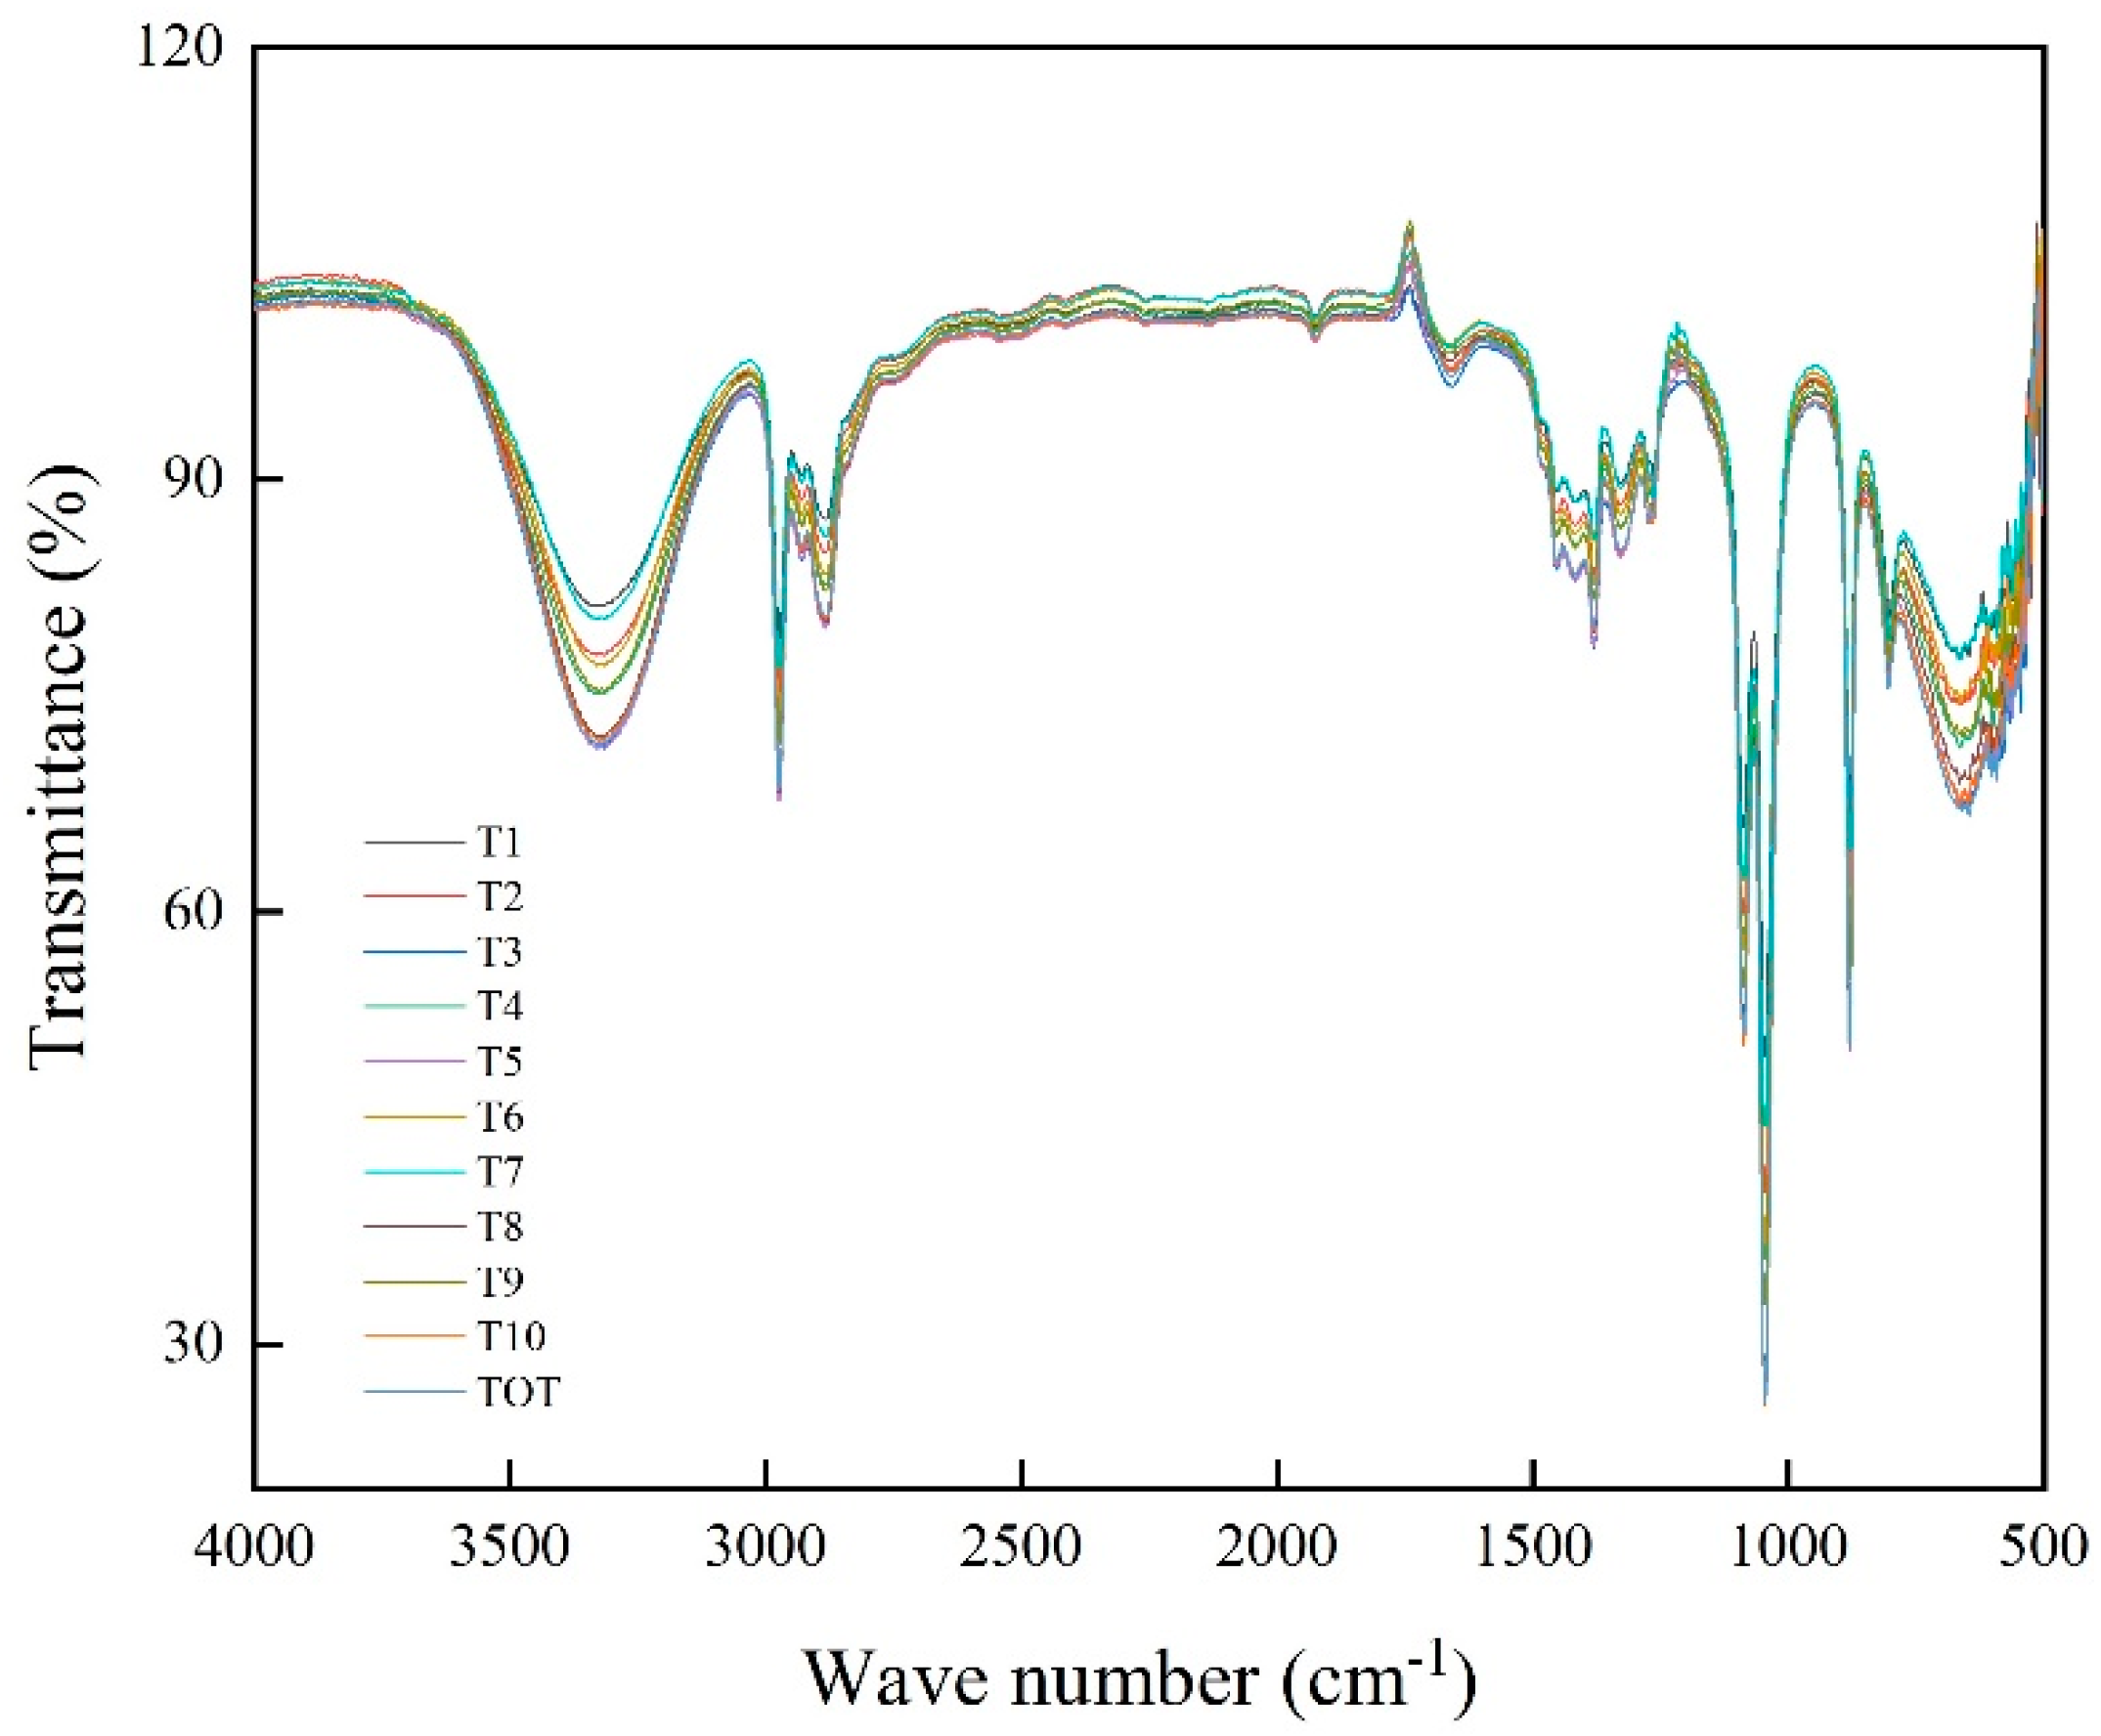
Figure 8.
Semi-quantified percentages (% area) of hydrocarbons (a), and oxygenated (b) and nitrogenous compounds (c) found in bio-oil in each solar pyrolysis test.
Figure 8.
Semi-quantified percentages (% area) of hydrocarbons (a), and oxygenated (b) and nitrogenous compounds (c) found in bio-oil in each solar pyrolysis test.

Figure 9.
Hydrocarbons (a) and oxygenated compounds (b) as functions of reaction time (X1) and percentage of catalyst (X2).
Figure 9.
Hydrocarbons (a) and oxygenated compounds (b) as functions of reaction time (X1) and percentage of catalyst (X2).
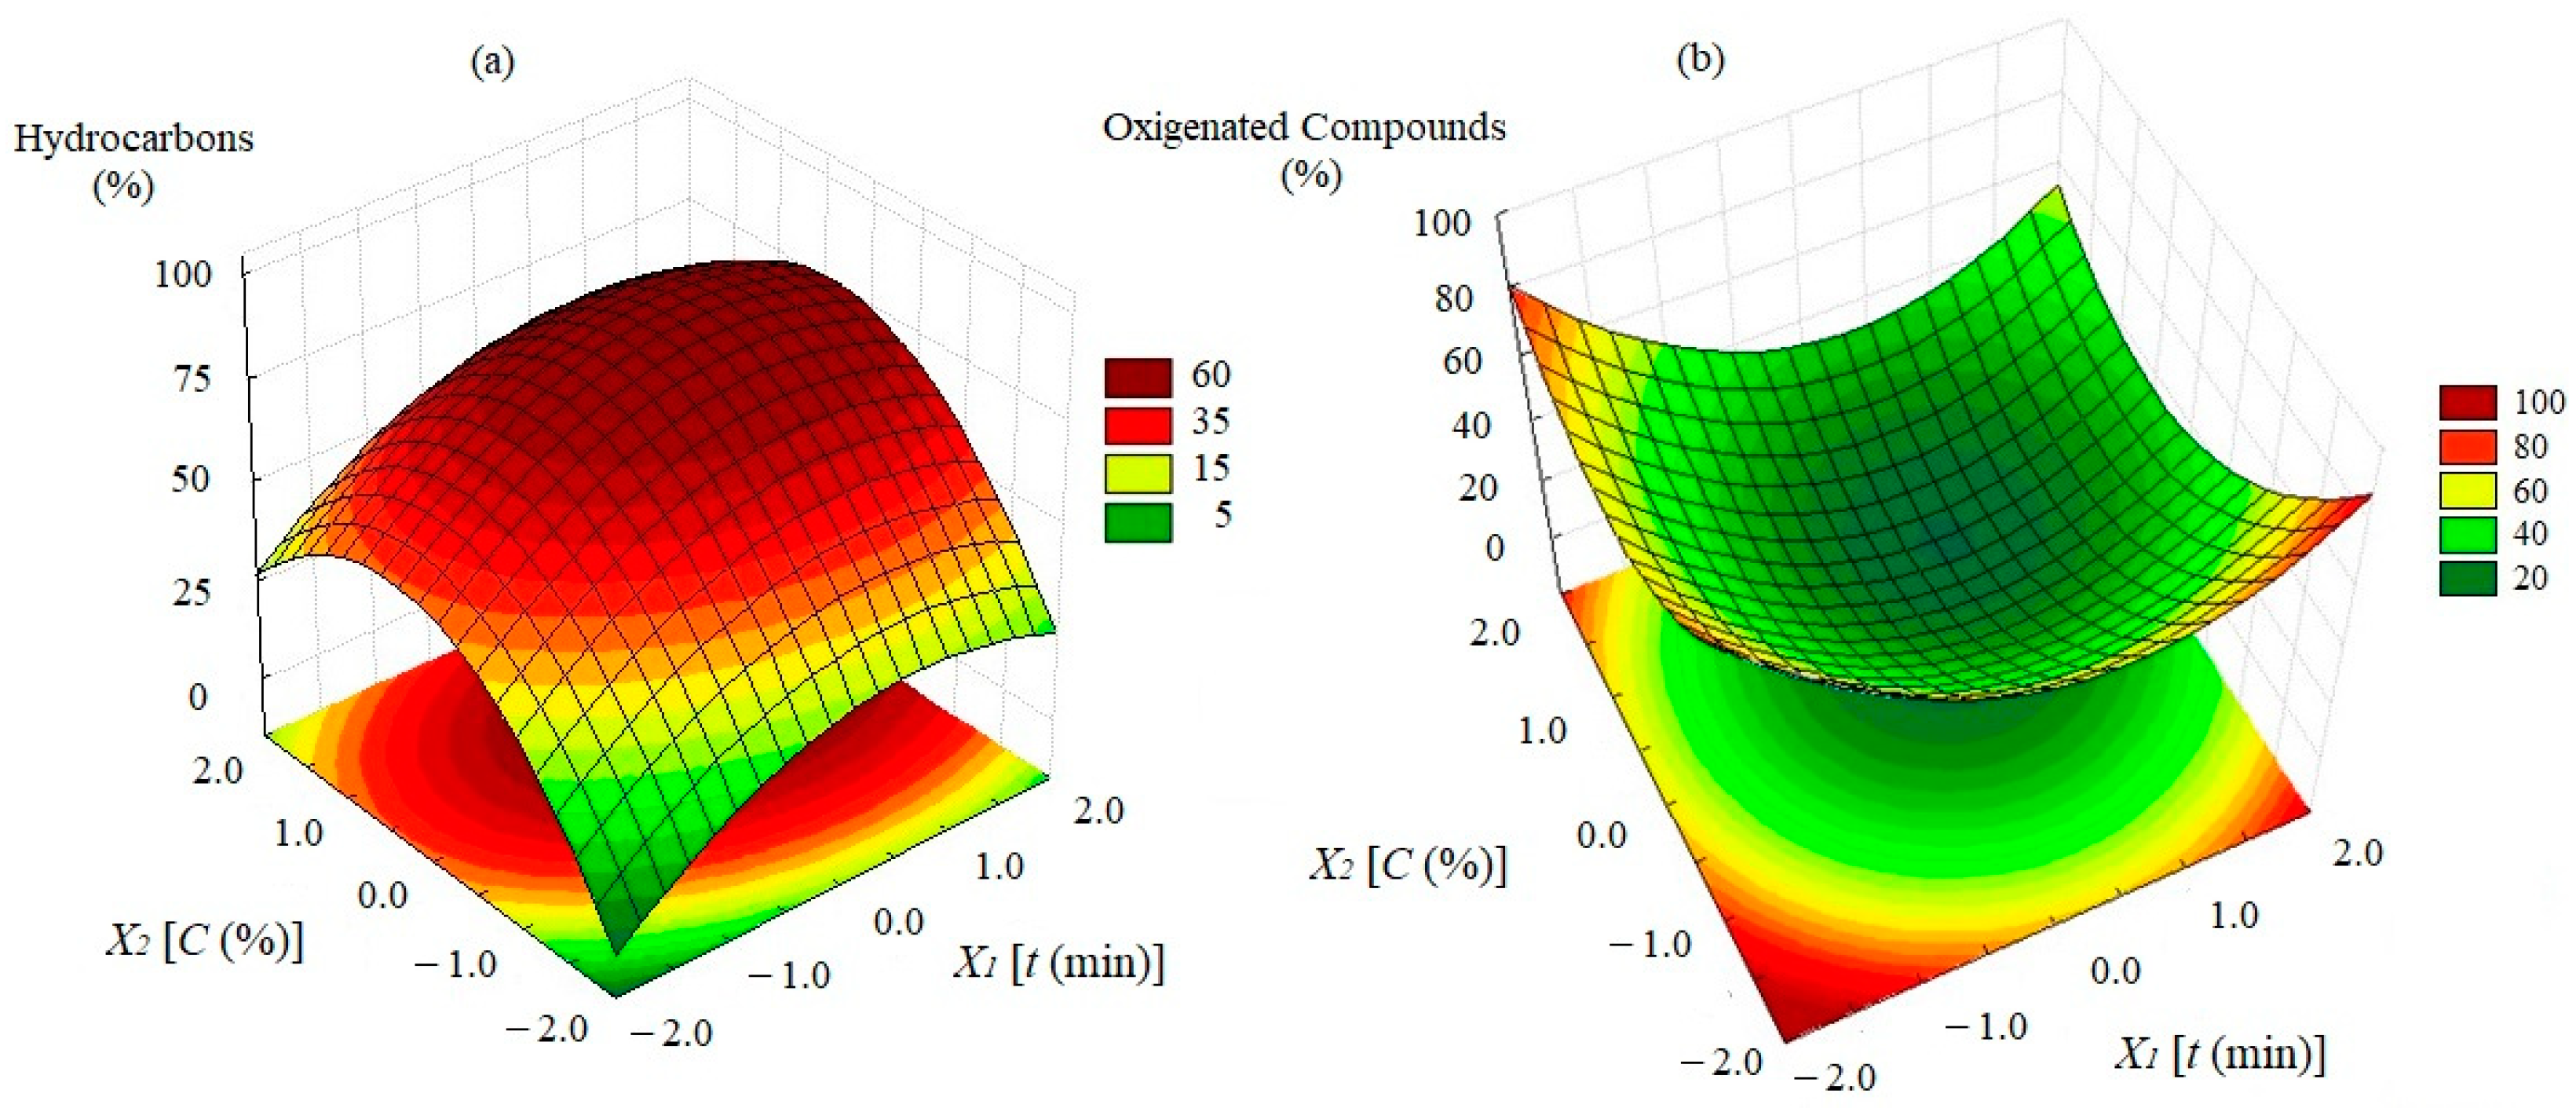
Figure 10.
Nitrogenous compounds as a function of reaction time (X1) and catalyst percentage (X2).

Table 1.
Central composite design for solar pyrolysis experiments.
| Test | X1 | X2 | t (min) | C (%) |
|---|---|---|---|---|
| 1 | −1.00 | −1.00 | 6.00 | 8.58 |
| 2 | −1.00 | +1.00 | 6.00 | 50.00 |
| 3 | +1.00 | −1.00 | 24.00 | 8.58 |
| 4 | +1.00 | +1.00 | 24.00 | 50.00 |
| 5 | −1.41 | 0.00 | 2.27 | 29.29 |
| 6 | +1.41 | 0.00 | 27.73 | 29.29 |
| 7 | 0.00 | −1.41 | 15.00 | 0.00 |
| 8 | 0.00 | +1.41 | 15.00 | 58.58 |
| 9 | 0.00 | 0.00 | 15.00 | 29.29 |
| 10 | 0.00 | 0.00 | 15.00 | 29.29 |
Table 2.
Characterization of dried Spirulina platensis.
| Elemental Analysis a (wt%) | Proximate Analysis a | ||
|---|---|---|---|
| C | 43.67 | Volatile matter | 80.09 ± 0.01 |
| H | 6.80 | Ash | 10.43 ± 0.01 |
| N | 9.84 | Fixed carbon | 9.48 |
| S | 1.89 | HHV | 20.86 ± 0.03 MJ/kg |
| O b | 37.8 | ||
| Compositional analysis | (wt%) | ||
| Protein | 55.86 ± 0.61 | ||
| Carbohydrate | 22.33 | ||
| Lipid | 11.38 ± 0.11 | ||
a Dry basis; b calculated by difference: O = 100 − [C + H + N + S + ash].
Table 3.
BET surface and textural characteristics of catalysts.
| Sample | SBET [m2.g−1] | Vpore [cm3.g−1] | Dpore [Å] |
|---|---|---|---|
| HC000 | 23 | 0.05 | 42 |
| HC700 | 11 | 0.02 | 17 |
Table 4.
Experimental data for product yields from Spirulina platensis solar pyrolysis.
| Test | SY (%) | LY (%) | GY (%) |
|---|---|---|---|
| 1 | 47.62 | 22.48 | 29.90 |
| 2 | 43.45 | 28.49 | 28.06 |
| 3 | 26.14 | 33.48 | 40.38 |
| 4 | 25.22 | 39.17 | 35.60 |
| 5 | 63.90 | 18.50 | 17.60 |
| 6 | 22.75 | 30.90 | 46.35 |
| 7 | 37.45 | 24.48 | 38.07 |
| 8 | 32.75 | 41.56 | 25.69 |
| 9 | 31.20 | 31.37 | 37.43 |
| 10 | 31.88 | 30.55 | 37.57 |
Table 5.
Optimization results for product yields.
| Optimized Conditions | |||
|---|---|---|---|
| Coded values | Original values | ||
| X1 | +0.93 | Time (min) | 23.37 |
| X2 | +1.41 | Catalyst (%) | 58.58 |
| Calculated yield (%) | Experimental yield (%) | ||
| Solid | 23.08 | Solid | 25.17 |
| Liquid | 42.68 | Liquid | 43.39 |
| Gas | 33.21 | Gas | 31.44 |
Table 6.
Main compounds found in the bio-oil obtained by solar pyrolysis.
| Hydrocarbon | Oxygenated Compound | Nitrogenous Compound |
|---|---|---|
| 1-Dodecene | 1,3-Cyclopentenedione | Acetamide |
| 1-Heptene | 1-Hexadecanol | 1-Cyanoacetyl-piperidine |
| 1-Tridecene | 1-Hydroxy-2-propanone | 3-Methylbutanonitrile |
| 1,7-Octadiene | 2-Furamethanol | 4-Methylpentanitrile |
| 3-Hexadecene | 2-Heptadecanone | 5-Hidroxypentamide |
| Eicosane | 2-Methylpropanal | Benzenepropanenitrile |
| Heneicosane | 2,3-Butenodione | Butanamide |
| Heptadecane | 3-Methoxy-2-methylphenol | Hexadecanamide |
| Pentadecane | Acetic Acid | Hexanamide |
| d-Limonene | Oleic acid | Indole |
| Styrene | Phenol | Pyrrole |
| Ethylbenzene | n-hexadecanoic acid | |
| o-Xyleno | n-octadecanoic acid | |
| Toluene | p-Cresol |
Publisher’s Note: MDPI stays neutral with regard to jurisdictional claims in published maps and institutional affiliations. |
© 2022 by the authors. Licensee MDPI, Basel, Switzerland. This article is an open access article distributed under the terms and conditions of the Creative Commons Attribution (CC BY) license (https://creativecommons.org/licenses/by/4.0/).
Share and Cite
MDPI and ACS Style
Martins, M.P.B.; Hori, C.E.; Barrozo, M.A.S.; Vieira, L.G.M. Solar Pyrolysis of Spirulina platensis Assisted by Fresnel Lens Using Hydrocalumite-Type Precursors. Energies 2022, 15, 7590. https://doi.org/10.3390/en15207590
AMA Style
Martins MPB, Hori CE, Barrozo MAS, Vieira LGM. Solar Pyrolysis of Spirulina platensis Assisted by Fresnel Lens Using Hydrocalumite-Type Precursors. Energies. 2022; 15(20):7590. https://doi.org/10.3390/en15207590
Chicago/Turabian StyleMartins, Marcus P. B., Carla E. Hori, Marcos A. S. Barrozo, and Luiz G. M. Vieira. 2022. "Solar Pyrolysis of Spirulina platensis Assisted by Fresnel Lens Using Hydrocalumite-Type Precursors" Energies 15, no. 20: 7590. https://doi.org/10.3390/en15207590
Note that from the first issue of 2016, this journal uses article numbers instead of page numbers. See further details here.