
Renovation Results of Finnish Single-Family Renovation Subsidies: Oil Boiler Replacement with Heat Pumps


1
Department of Civil Engineering, Aalto University, 02150 Espoo, Finland
2
Finnish Environment Institute SYKE, Latokartanonkaari 11, 00790 Helsinki, Finland
3
Nearly Zero Energy Research Group, Tallinn University of Technology, 19086 Tallinn, Estonia
4
FinEst Centre for Smart Cities (Finest Centre), Tallinn University of Technology, 19086 Tallinn, Estonia
*
Author to whom correspondence should be addressed.
Energies 2022, 15(20), 7620; https://doi.org/10.3390/en15207620
Submission received: 2 September 2022
/
Revised: 7 October 2022
/
Accepted: 10 October 2022
/
Published: 15 October 2022
(This article belongs to the Special Issue Novel HVAC, Building Physics and Data-Centric Solutions for Energy-Efficient Smart Buildings and Sustainable Districts)
Abstract
:Finland has approximately 150,000 oil-heated private homes. In 2020, the Finnish government launched subsidies for private homeowner energy renovations. In this study, we examine the impact of two new energy renovation subsidies, the ELY grant and the ARA grant, from an energy efficiency point of view. Data from these subsidies reveal that a typical energy renovation case is a building from the 1970s where the oil boiler is replaced with an air-to-water heat pump. With additional data from the Finnish Energy certificate registry, a reference 1970s house is constructed and modelled in the building simulation programme, IDA ICE 4.8. Combinations of several renovation measures are simulated: air-to-water heat pump, ground-source heat pump, ventilation heat recovery and improved insulation. We found that resorting mainly to air-to-water heat pumps is not the most energy-effective solution. Ground-source heat pumps deliver a more significant reduction in delivered energy, especially with additional measures on insulation and heat recovery. Ground-source heat pumps also demand slightly less power than air-to-water heat pumps. Onsite solar PV generation helps supplement part of the power needed for heat pump solutions. Subsidy policies should emphasize deep renovation, ventilation heat recovery and onsite electricity generation.
1. Introduction
According to the Energy Performance of Buildings Directive (EPBD), European countries in the EU need to reduce energy consumption and produce energy from renewable sources in the building sector. EU also has a specific target of decarbonizing the building stock by 2050. EU member states have provided long-term renovation strategies to facilitate this [1,2]. A transition from fossil fuels to renewable energy is an important issue to be addressed [3]. One potential measure to contribute to EPBD targets is the replacement of fossil fuel-based oil heating in buildings [4,5].
Within the EU climate policy framework, individual oil heating systems fall under the effort-sharing sector, where emissions are not tackled by the current EU Emission Trading System (EU-ETS) [6]. As a part of the European Green Deal and Fit for 55 package, European Commission has proposed a new emission trading system for fuels used in road transport and heating of buildings [7]. Part of the revenue from the new system would be directed to a new Social Climate Fund, providing heating system replacement subsidies for vulnerable households [8]. So far, no such EU-wide emission trading system exists for building heating fuels. Several EU member countries have national or regional subsidies for replacing fossil fuel-based heating in buildings. Conflictingly, they also have subsidies for investing in new fossil fuel heating, often within the same country [9]. Finland is taking action to phase out fossil fuel heating in buildings. Currently, fossil oil heating in buildings accounts for 6% of fossil oil end consumption in Finland. In 2018 it was responsible for 1.6 Mt of CO2 emissions, or 3% of Finland’s net emissions that year [10].
1.1. Finland’s Goal: Ending Fossil Fuel Oil Heating in Buildings
Finland aims to reach net zero emissions in 2035 and negative net emissions soon afterward. As a part of this endeavour, fossil oil-based heating will be phased out by the beginning of 2030. The public sector is set to lead the way by ending all fossil oil heating in public buildings by 2024. To facilitate the phase-out of fossil oil in private buildings, the government committed to financially assist the private homeowners’ renovations of the heating system [11].
The Finnish national building registry records approximately 300,000 oil-heated buildings, out of which 250,000 are detached houses. The number of oil-heated private homes is smaller because alterations in the main heating system are frequently not updated in the registry. According to Statistics Finland, the actual number of fossil oil-heated private homes is approximately 150,000 [10]. Detached buildings are still the largest building group using fossil fuel oil for heating, and the success of the phase-out depends largely on the private homeowners’ actions.
Most dwellers in oil-heated homes are elderly: 65% are over 60 years old. Many are not wealthy: most 65+ years old dwellers in oil-heated buildings belong to the two lowest income quintiles. Almost 70% of the oil-heated buildings are situated in the countryside rather than the city. Existing oil-heated detached homes are estimated to have a selling price of approximately 25% lower than average [10]. All in all, dwellers in oil-heated buildings may face challenges related to age, financial situation and property value. The financial support mechanisms for heating renovations should consider these factors to ensure a just transition.
Transitioning from fossil fuel boilers to heat pumps is the primary strategy to decarbonise heating in many countries [12]. Some studies have shown that replacing existing boilers with heat pumps ensures better urban air quality [13]. At the same time, the increasing installation of heat pumps is associated with increased peak loads of electricity [12,14]. Another efficient strategy for decarbonising residential buildings is using heat pumps and photovoltaic (PV) panels [14,15]. The integrated work of air-source heat pumps and grid-connected PV panels as an optimal solution for residential buildings is also pointed out by Stamatellos et al. [16,17,18]. The potential of geothermal energy in Poland and the Baltic states are analysed by Chomać-Pierzecka et al. [19]. This study points out that using the ground-source heat pump for the heating is approximately 64% less expensive than using the electric boiler and 36% lower than the gas condensing boiler [19]. Ground-source heat pumps can achieve a higher performance coefficient than air-source heat pumps [20]. It is also stated in previous studies that the air source heat pump systems can reduce CO2 emissions by up to 96% in the case of the Swiss electricity mixture [21]. Heat pumps installed in cold climate conditions usually have an auxiliary heating element to cover the peak heating load [21,22]. Abdel-Salam et al. proved that the auxiliary heating element is not needed in the case of the ground-source heat pumps in Canadian cold climate conditions.
1.2. Finnish Energy Renovation Subsidies for Detached Buildings
To end fossil oil heating by the early 2030s, Finland must choose policies that succeed in replacing fossil heating in private homes during the 2020s. To outline the plan for this process, the Finnish Ministry of the Environment has drafted an operational programme sent out to a round of comments in April 2021 [10]. The programme draft proposed several measures: direct financial subsidies, changes in taxation, legislative norms and steering by information. Subsidies for private homeowners’ energy renovations were initiated in 2020, with two new grants available for private building owners. One is managed by Finland’s Centre for Economic Development, Transport and the Environment, and the other by The Housing Finance and Development Centre of Finland. For the sake of brevity, we will refer to these by the Finnish abbreviations: ELY-Centre and ARA, respectively. The two subsidies are referred to as the ELY grant and the ARA grant.
The ELY grant is a streamlined subsidy directed for oil boiler replacements only. ARA grant is a more comprehensive subsidy for extensive energy renovations, which may or may not include a heating system change. These two grants are not the only ones available for a private building owner: income tax payers undertaking renovation can also receive a tax deduction for renovation work. This tax instrument has been in place since 2001, but in 2021, the government decided to raise the maximum deduction when the work is undertaken for replacing an oil boiler. In addition, an existing grant scheme is available for improving the homes of elderly persons, disabled persons and veterans of war, which can sometimes be used towards energy renovations, but its significance is small. These various forms of financial aid are mutually exclusive: they cannot be combined in one renovation. Only the newly established policy instruments—ELY and ARA grants—are discussed from here onwards.
ELY renovation grants are explicitly awarded for replacing the oil heating system with a more sustainable heating option. The grant sum is either EUR 2500 or EUR 4000. A higher sum of EUR 4000 is awarded when the new heating system is based on heat pumps or district heating. Switching to other heating systems (direct electrical heating, wood-based heating, solar or hybrid heating) can be assisted with the lower sum of EUR 2500. No grant is awarded for switching to another fossil fuel-based system (coal, fossil gas or peat) [23]. The initial budget for the ELY grant was EUR 28.5 M for 2020 and EUR 9.4 M for 2021. An additional EUR 65 M was budgeted for the scheme from the Sustainable Growth Programme for Finland, funded by the EU Next Generation recovery package. A total of EUR 25 M out of the additional EUR 65 M was made available in 2021. The scheme is intended to continue as long as the additional funds allow.
The ARA grant awards subsidies for extensive energy renovations, where the building energy efficiency must improve substantially. The grant is available for detached buildings, terraced houses and apartment buildings, and they need not be in private ownership. For detached buildings, the renovation must bring the building E-number (indicating energy efficiency) to 56% or less of the original E-number. Such a renovation can receive a subsidy of up to EUR 4000. For comparison, the existing regulation requires the E-number to be lowered by 20% in the renovation, in case the regulation is followed in terms of the E-number criterion. In the case the energy efficiency is brought to the regulation level of a new building, the subsidy is increased to a maximum of EUR 6000. Several possible renovation actions can be considered, also the cost of planning. ARA grant initially had a budget of EUR 100 M for 2020–2022. In April 2022, the Finnish government continued the scheme until 2023, with an additional EUR 100 M budgeted for the subsidies.
1.3. Problem Setting and Research Questions
ELY and ARA grants have been very popular, creating a high workload for the funding bodies, and a backlog has been created in the process. Despite the popularity, the policies have also faced criticism. Oil boiler replacements are often economically viable, even without a subsidy. When this is the case, the subsidy policies can be seen as over-subsidizing and disturbing the market [24]. It has also been questioned whether the renovations increase the peak power demand during heating periods, straining the grid capacity. More research is needed on these subjects to learn how the subsidies are the most effectively dimensioned and directed and which are the most suitable energy efficiency criteria.
On the other hand, a policy of boosting renovations can create jobs, bring tax revenue, and decrease emissions. In Estonia, where an energy renovation subsidy has been available for apartment buildings, it has been estimated to create 17 jobs per EUR 1 M investment. Approximately 32–33% of the money invested in renovations was returned to the state as tax revenue, making direct support of 25–40% cost-neutral for the state of Estonia [25]. In Finland, the Ministry of the Environment estimates that EUR 1 M awarded through the ELY grant scheme will boost employment by 30 jobs and lower emissions by 1470 t CO2 annually [10]. For the ARA grant, the policy goal is that EUR 1 M grant will boost employment by 15 jobs annually (in addition to normally occurring renovations) and lower emissions by 1430 t CO2 [11]. These estimates by the policymakers should be examined in light of the data gathered from the subsidy schemes.
It is important to assess whether the subsidies boost energy-efficient, low-emission heating solutions and whether they contribute to a just energy transition, yielding aid for those households and regions that are the most vulnerable. Residents with low income, living in neighbourhoods with low housing prices, have less opportunity to install heat pumps. At the same time, they would benefit relatively more from lowered energy costs [24,26]. This issue has gained even more importance with rising electricity prices in Europe during 2022.
Vimpari [24] suggests energy renovation subsidies should be directed preferentially to areas of low housing prices. This approach has been taken in Estonia, where the state has awarded renovation grants for projects fulfilling the required technical criteria [27,28,29,30]. In Tallinn and Tartu, the grant has covered 30% of the investment cost. In regions with lower housing prices, the grant has been raised to 40–50% of the investment cost [26,31].
The implementation and effects of the new energy renovation policies (ELY grant and ARA grant) are investigated in this study. In so far as it is possible, based on the gathered data, we compare the kind of renovations that are likely carried out with the help of the grants. The focus of the study is not on the financial profitability but rather on the technical solutions employed at the individual building level. The main research questions of the current study are:
- What kind of actions has been taken in the renovated buildings?
- What has been the effect of renovation measures on the building’s energy consumption and power demand?
- Are the most popular renovation types likely to bring optimal results, or could the grant criteria be improved to encourage different renovation concepts?
The research is carried out as a part of the DECARBON-home project, funded by the Academy of Finland.
2. Methods
2.1. Reference Building and Model Construction
In Finland, the building code requires all new buildings to have an energy performance certificate. Energy performance certificates have been used since 2006 and pre-2006 privately owned buildings do not necessarily have a certificate. If an existing building is sold or rented in an open market, or its purpose of use is altered, it must acquire such a certificate. It is also recommended that the energy certificate be updated after a renovation, but this is not mandated by law. The certificate system is also administered by the Housing Finance and Development Centre of Finland ARA.
For this study, a database covering energy certificates from detached houses was obtained from ARA. Data were extracted from the energy certificate register on 2 October 2019, reflecting the situation before the current renovation and oil boiler replacement schemes started. A selection of reference houses from the larger certificate data set was made with the following criteria:
- Detached house built from 1970 to 1979;
- Oil boiler as the main heating system;
- A fireplace present (typical for the period);
- Actual fuel consumption has been disclosed for oil, wood and electricity separately;
- The certificate was made according to the current (2018) version of the building code;
- Certificates or entries with obviously erroneous data have been disregarded.
Buildings from the 1970s were the most typical among the grant receivers, which motivated the above choice of the building age (this is more closely discussed in Section 3.1). Altogether, these criteria yielded a data set of 74 detached houses, which is used to construct a reference for a typical house seeking a renovation grant. The approach has some sources of uncertainty: it is likely that in this sub-set, as in all the energy registry data, there is a bias towards houses that are in reasonably good condition. Pre-2000s dwellings in poor condition, not on the market for selling or renting, are not likely to have an energy certificate made voluntarily. However, a similar bias can be expected to affect the selection of houses seeking energy renovation grants. If a house is in a below-average condition, perhaps in a region with low housing prices, and not likely to be on the market for buying or renting, investments in major renovations are less likely, even with the aid of a grant. In light of this, it is appropriate to use the energy certificate data for a reference pre-renovation 1970s house, even with some likely bias towards houses in better condition.
2.2. Simulation Model
With the help of the building data collected from the Energy certificate register, a building simulation model was composed to model the 1970s reference house behaviour. First, a detached 1970s building model with a heated net area of 135.5 m2 was taken from a previous Finnish Cost Optimal project [32]. The existing model was modified and calibrated to match the properties of the reference house and the median energy consumption values shown in Table 1. Energy simulations of this reference building were performed with IDA Indoor Climate and Energy (IDA ICE) version 4.8 [33]. IDA ICE is a dynamic time-step building simulation programme validated in several studies [34,35,36,37,38], and is frequently used for building energy efficiency and optimization research.
Each room of the reference building model is a separate zone. Weather data was taken from Helsinki’s 2012 climatic reference year. The orientation of the building was chosen as 135 degrees to the north, providing a suitable roof area for solar panel installation in the latter part of the investigation. The main parameters of the modified simulation model are shown in Table 2. In addition, the heating setpoint was changed from 21 °C to 20 °C. The indoor air temperature setpoint in the car garage was chosen as 15 °C. The infiltration airflow was calculated according to the principle of wind-driven flow, and the pressure coefficients of the building were taken as typical values of a “semi-exposed” location from the database of IDA ICE. Mechanical exhaust ventilation without heat recovery was used in the calibrated model, and the ventilation air change rate was chosen as 0.3 L/m2s. Heat distribution losses were chosen as 1.32 W/m2, of which 85% are stored in the zone. Power consumption of electrical appliances in the building was chosen as 4.0 W/m2, lightning as 8 W/m2 and 5 W/m2 in the toilet and garage. Altogether, three occupants (1.2 met per person) were considered in simulations.
Firstly, the energy consumption of the reference building was composed according to the measured median energy consumption according to the 74 buildings from the 1970s (Measured). Secondly, the simulation model was composed and calibrated according to the measurement data of the reference building (Calibrated). Altogether eight different renovation measures were then analysed by energy simulations. The following cases of renovation measures were analysed:
- Improved insulation of the roof (U = 0.22 to U = 0.09) and replacing the old windows with new (U = 1.8 to U = 0.8) (Cal + ENV);
- Improved insulation together with mechanical supply-exhaust with heat recovery (temp efficiency 0.8) (Cal + ENV + HRV);
- Air-to-water heat pump for radiator heating and domestic hot water production (AWHP);
- Improved insulation together with an air-to-water heat pump (AWHP + ENV);
- Improved insulation together with mechanical supply-exhaust with heat recovery and air-to-water heat pump (AWHP + ENV + HRV);
- Ground-source heat pump for radiator heating and domestic hot water production (GSHP);
- Improved insulation measure together with ground-source heat pump (GSHP + ENV);
- Improved insulation + mechanical supply exhaust with heat recovery and air-to-water heat pump (GSHP + ENV + HRV).
The nominal heating output of the air-to-water heat pump and ground-source heat pump was 10 kW. The COP value in IDA ICE was defined in nominal conditions of inlet dry bulb temperature of 7 °C, wet bulb temperature of 6 °C, and flow/return temperatures of 35/40 °C. In these conditions, the COP value of the air source heat pump was 3.2. In the case of the ground-source heat pump, the source of energy was boreholes. The single-hole borehole model in IDA ICE was used, and the borehole length was chosen as 190 m. The diameter of the borehole was 0.115 m, and the inner diameter of the pipe was 32 mm. Both types of heat pumps did not use an additional electrical heating element (it was turned off in the simulations). The average domestic hot water use per occupant was chosen as 43 L/day. Altogether, three occupants were considered as the average number of inhabitants in the building. The consumption profile of domestic hot water was taken from the study of domestic hot water use in Finnish residential buildings [39,40]. The calculations did not include the electrical heater of the sauna and other electrical appliances that are not specified in Finnish energy efficiency calculation rules.
In addition, the coefficients of performance (COP) of the different studied renovation measures were simulated. COP values of domestic hot water production and space heating are disclosed separately. As the COP of the heat pump system depends on the heating curve of the heating system, the flow temperature of the heating system was also investigated. In order to observe the minimum possible flow temperature of the heating system, water-based radiators were selected in the simulation model. The radiators in the simulation software were dimensioned according to the old radiator types that were actually installed in the reference building.
The temperature efficiency of the rotary heat exchanger of the air handling unit was chosen as 80%, the exhaust air temperature limitation was −12 °C, and the SFP of the ventilation unit was chosen as 1.5 kW/m3s. In the case of installing the ventilation heat recovery unit as a part of the ventilation renovation measure, the air change rate increased from 0.3 L/m2s to 0.4 L/m2s.
The possibility of onsite renewable electricity generation using PV panels was also analysed, together with the analysis of peak power consumption of electrical appliances and heat pumps. PV panels were dimensioned according to the roof area of the reference building. The area of the PV installation was 90 m2 (approximately 66% of the building floor area), and the corresponding efficiency factor and panel slope were 10% and 45˚, respectively. As electricity production from PV panels is independent, a time series of yearly electricity production data was unique for every case. Hourly electricity demand was estimated in every case. Additional adjustments were made on an hourly basis between electricity demand and electricity production in Microsoft Excel. If electricity production was higher than demand, excess electricity was exported to the grid (exported electricity). Vice versa, for a case of higher electricity demand than electricity production, electricity was delivered on site from the grid (delivered electricity).
2.3. Renovation Grant Data
In addition to modelling a selection of renovation measures, we utilized existing data on the energy renovation grants that had already been awarded at the time of writing. Grant data was obtained from the grant scheme operating bodies ELY and ARA during the summer of 2021. The ELY grant data was extracted from the registry in August 2021 and had information on 7109 buildings. The ELY grant process is streamlined, and grant data yields few details on the renovation itself. The advantage of the ELY data set is that the replacement heating system can be easily discerned.
The ARA grant data was extracted from the ARA information system in July 2021. It had 1681 buildings in total, out of which 1051 (63%) were detached houses. The ARA grant data utilized in this study concerns only the portion of the detached houses. In principle, much more detailed data is gathered on the ARA grant recipients. In practice, there were limitations to using this data set because all compiled data was not easily accessible for systematic analysis.
3. Results and Discussions
3.1. Overview of Granted Subsidies
Figure 2 shows the age distribution of the detached houses that had received the ELY and ARA grants. By age, the most common building type receiving the ELY grant is from the 1970s (31%). Together, the houses from the 1960s and 1970s account for 50% of the ELY grant recipients. In the case of the ARA grant, 1970s houses were again the largest group, but by a very small margin. Both 1960s and 1970s account for 19% of the detached house grants, or 38% in total. This time the distribution is more even throughout all construction periods. This is explained by the nature of the ARA grant, which is not specifically directed at replacing oil boilers, common in the 1970s buildings.
From the data set concerning the ELY grants, it is possible to discern which heating system replaced the old oil boiler. For the ARA grant scheme, this data was not unambiguously available. Figure 3 shows the new heating system replacing the oil boiler in the ELY grant scheme. When all building ages are considered, an air-to-water heat pump is clearly the most preferred replacement system (66%), with the ground-source heat pump as the second most popular choice (22%). Together, AWHP and GSHP cover 88% of the replacement systems, and the share of district heating is 8%. Category “other” includes direct electrical heating, firewood, wood pellet, solar heat and other, perhaps hybrid solutions.
The largest group by age, buildings from the 1970s, was chosen for closer inspection. It was found that for the 1970s buildings, AWHP is still the most popular oil boiler replacement option. In fact, AWHP systems are even slightly more popular in the 1970s house selection: 68% instead of 66% (Figure 3b).
According to the available data, a detached house from the 1970s, with an oil boiler replaced with AWHP or GSHP, represents a typical case of grant recipients. This finding motivated the choice of modelling a 1970s building for the renovation scenarios.
3.2. Simulation Results of the Reference Building
The measured total heating energy consumption of the studied reference building is 150.1 kWh/m2a. This can be divided into 123.2 kWh/m2a oil consumption and 26.9 kWh/m2a wood consumption. At the same time, the measured electricity consumption of the reference building is 38.6 kWh/m2a. In the case of calibrated model, the total heating energy consumption is 156.6 kWh/m2a, and the total electricity consumption is 38.9 kWh/m2a. The total delivered energy of calibrated model was close to the measured value (the difference in delivered energy is smaller than 4%). The lowest total delivered energy level in the case of the GSHP system with added insulation and heat recovery ventilation system is 59.7 kWh/m2a. A detailed overview of the delivered energy of all the studied renovation measures is shown in Figure 4 and Figure 5. In the case of renovation measures that use the air or ground-source heat pump systems, the electricity consumption of the heat pump is disclosed in the cell “HP electricity”. Heat pump electricity includes both delivered space heating energy and the energy required to produce domestic hot water. Both the GSHP and the AWHP system significantly reduce the modelled need for delivered energy.
It is also important to understand that if the goal of the renovation is also to ensure the indoor air quality in the renovated apartment building, then heat recovery ventilation is also necessary to install [27,41]. The delivered energy results in Figure 4 show quite a small difference in delivered energy values in the case of measures with and without heat recovery ventilation. In the case of the AWHP system, the difference in delivered energy is kWh/m2a, and in the case of the GSHP system, 2.3 kWh/m2a. In addition, it should be pointed out that the air change rate was taken at 0.3 L/m2s in calibrated model and 0.4 L/m2s in case the installing the ventilation heat recovery unit was a part of the ventilation renovation measure. It should also be added that in the case of exhaust ventilation, the infiltration airflows are smaller than in the case of balanced ventilation with heat recovery. Therefore, it can be concluded that although indoor air quality is important, the installation of a ventilation unit with heat recovery may not be economically viable, and therefore it would apparently need a separate support grant.
There is a risk that the renovation measures using heat pump systems increase the peak power demand during heating periods, and it is important to analyse the variations in the electrical power demand in the case of different renovation measures. Cumulative yearly electric power for AWHP- and GSHP-based renovation measures are shown in Figure 6. Figure 6 also covers the electric power demand variation in the case of the unrenovated building (Calibrated). The ground-source heat pump ensures a slightly lower electrical power consumption compared to the air-to-water heat pump during the year-long period. In the case of AWHP, the total necessary electric power is approximately 3.8 kW, and in the case of GSHP, the total electrical power is close to 3.0 kW. The electric power at percentile value for different renovation measures is shown in Table 3. The 95th percentile level of necessary electric power is 3.0 in the case of air-to-water heat pump and 2.3 in the case of a ground-source heat pump. If we analyse the 99th percentile level of necessary electric power, it is possible to point out that in the case of an air-to-water heat pump, the power level is 3.5 kW and in the case of a ground-source heat pump, 2.8 kW. The indicated electrical capacities can be taken as a basis for the electrification process. It can be concluded that the AWHP has significantly higher peak power than the GSHP. If a heat pump is not used for heating energy production, then the necessary power level is 1.4 to 1.5 kW.
One more renovation possibility for fossil oil-heated detached buildings is onsite renewable electricity generation using PV panels. The cost-effectiveness of the interaction of heat pumps and PV panels has been shown by D’Agostino et al. [42,43]. In this study, we have analysed a solution where a share of PV generation is used in the building, and the rest of the electricity is exported to the grid. Figure 7 and Figure 8 and Table 4 show the exported and delivered electricity load from PV for general and AWHP cases and GSHP cases during a year-long period. The electricity production of the PV panels is 71 kWh/m2a for all cases. Delivered electricity expresses the purchased electricity from the grid, and exported electricity means the energy that is sold to the grid. If an air-to-water or ground-source heat pump is used, then the electricity consumption is higher, but the self-use share of produced electricity is between 23–24.5% in the case of every studied renovation measure. Figure 8 shows that in all but the AWHP and AWHP + ENV cases, the total value of exported electricity is higher than the yearly value of delivered electricity. It means that the building’s total exports are more than it consumes during a year-long year period, making it a net plus energy building. In all simulated cases, the exported electricity amount is 54 to 55 kWh/m2a. The onsite PV system is rather over-dimensioned for the needs of the building itself, but a high share of exported solar electricity may be very beneficial in light of the rapidly changing European electricity market and steeply rising electricity prices.
In the case of the calibrated model, the simulation methodology for the infiltration airflow used a building leakage rate value q50 = 3.9 m3/m2h and the calculation with wind pressure coefficients (in IDA ICE “wind-driven flow”). At the same time, according to the Finnish guideline [44] for higher building leakage rate of q50 = 5.11 m3/m2h for a 1972 house and fixed infiltration airflow calculation is suggested use. In Figure 9, it is possible to see that the heating energy consumption of 379.6 kWh/m2a, according to the guideline, is highly overestimated. If the unique input with fixed infiltration (q50 = 3.9 m3/m2h) is used, then the delivered energy used for the total heating decreases to the value 169 kWh/m2a in our calibrated model. The comparison with the real energy consumption of the reference building shows that the guideline gives considerably higher energy consumption than the actual measurement results have shown.
The annual COP of the heat pump system depends on the capacity, part load ratio and the mode of control [45]. The COP values for renovating the reference building using air and ground-source heat pump are shown in Figure 10 and Table 5. The average COP of heating and domestic hot water production is 2.5 in the case of the AWHP system and 3.3 in the case of GSHP renovation schemes. An interesting fact is that COP of the space heating system is higher in case the building envelope is not insulated. However, this is justified by the fact that in the case of an insulated building envelope, the proportion of cold weather is higher in the formation of COP.
The performance of GSHP and AWHP in renovated residential buildings has already been studied in many scientific papers. The results of this study confirm the better functioning of the GSHP that is shown by D’Agostino et al. [42], Fadejev et al. [46] and Ahmed et al. [40]. Properly sized heat pump systems with energy piles can have overall system SCOP values higher than 4.5, while some case studies have reported only half of such SCOP values. This illustrates the need for proper design and sizing of such systems [47]. It is also important to add that the defrost cycle of AWHP is not directly analysed in this study. The specific defrost cycle of the heat pump depends on the manufacturer’s solution and can also affect the seasonal COP of the AWHP system [48].
Due to the improvement of the building insulation and adding the ventilation system with heat recovery, it is possible to lower the heating curve of the radiator heating system. In Figure 11, it is possible to see the original calibrated model with the heating curve of 68/40 °C, insulated building with a minimal heating curve of 62/40 °C and insulated building with ventilation heat recovery with a minimal heating curve of 58/40 °C. The indoor temperature setpoint in the critical room was chosen as 20 °C, and the design temperature of the heating system is −26 °C. The minimal temperature of heating curves is shown in a situation where at least 95% of the time, the temperature setpoint (20 °C) is satisfied. The rest of the time, it is possible to use additional stove heating. Based on existing radiators and other components of the heating system, it is not possible to increase the COP of the heat pump system as high as, for example, underfloor heating would allow. It means that every degree decrease in temperature is significant, lowering the supply temperature of the heating system to ensure the highest possible COP of the heat pump.
4. Conclusions
Finland aims to reach net zero emissions in 2035 and negative net emissions soon afterward. Fossil oil-based heating should be phased out by the beginning of 2030. According to statistics, there are approximately 150,000 oil-heated private houses in Finland. Dwellers in oil-heated buildings may face multiple challenges related to age, financial situation and property value. In order to end fossil oil heating by the early 2030s, the subsidies for private homeowners’ energy renovation ELY and ARA support grants were initiated in 2020. It is important that the subsidies encourage energy renovations that are energy-effective, compatible with the ambient energy system and contribute to a just energy transition.
In the case of the ELY grant scheme, the air-to-water heat pump is the favourite replacement system for the oil boilers (66%), and the ground-source heat pump is also used (22%). According to the typical building that has received the renovation grant, the model of the reference building was composed. The measured total heating energy consumption of the studied reference building is 150.1 kWh/m2a, and the measured electricity consumption of the reference building is 38.6 kWh/m2a. Building energy simulations were carried out to find the most energy-effective renovation solutions for such a typical grant-receiving building.
The simulations of the reference building showed that the ground-source heat pump ensures the highest energy efficiency. The lowest total delivered energy, 59.7 kWh/m2a, resulted from a GSHP system with added insulation and heat recovery ventilation. This option demands 25% less delivered energy than a simple replacement of the oil boiler with an air-to-water heat pump (79.6 kWh/m2a). Simply installing a ground-source heat pump, with no improvement in insulation or air ventilation, yields a delivered energy demand of 66.7 kWh/m2a. From an energy efficiency point of view, ground-source heat pump installations should be preferred to air-to-water heat pumps.
Although a cost analysis is out of the scope of this study, it can be readily pointed out that a ground-source heat pump requires boreholes, and it is, therefore, significantly more expensive to install than an air-to-water heat pump. This can be a major obstacle to many single-home dwellers, especially those that live in oil-heated homes. As discussed earlier, they are also likely to have challenges such as old age, low income or living in remote areas with low property values. Realistically, all these households are not likely to install a ground source-based heat pump. However, even in case of an air-to-water heat pump is chosen, additional improvement of heat insulation can lower the delivered energy demand by a further 11% (from 79.6 to 71.2 kWh/m2a), and the combination of insulation and ventilation heat recovery installation can lower the delivered energy demand by 16% (from 79.6 to 66.7 kWh/m2a). Such additional renovation measures also carry additional up-front costs and perhaps would require a higher grant sum to be lucrative.
In case a ventilation system with heat recovery is installed, increased ventilation and infiltration partly outweigh the energy saving. It can be concluded that although indoor air quality is important, the installation of a ventilation unit with heat recovery may not be economically viable, and therefore it would apparently need a separate requirement in the support grant.
The results of the simulations of the supply curve of the heating system proved that it is possible to decrease the heating curve to the minimal level of 58/40 °C. The comparison with the real energy consumption of the reference building shows that the guideline gives considerably higher energy consumption for the 1972 house than the actual measurement results have shown, and there is a high overestimation because of the fixed infiltration calculation method.
In the case of an air-to-water heat pump, the total necessary electric power is about 3.8 kW, and in the case of the ground-source heat pump, the total electrical power is close to 3.0 kW. It can be concluded that the AWHP has 27% higher peak power than the GSHP. Onsite renewable electricity generation using PV panels can help to deliver the electricity needed for heat pump solutions and, in several renovation scenarios, even create a situation where the electricity export is higher than import on an annual basis. In all simulated cases, the electricity production of the PV panels is 71 kWh/m2a, and the exported electricity amount is 54 to 55 kWh/m2a. All the simulated renovation measures using GSHP ensured the plus energy balance on a yearly basis.
The support amount is quite small in the case of ELY and ARA grants, and this has possibly led to a situation where the cheapest renovation solutions with smaller impacts have been used. At the same time, from the point of view of energy efficiency, it would be reasonable to place the emphasis of support on deep renovations of the old dwellings. In the case of deep renovation, including improved ventilation, also an adequate air change rate would be ensured. Additional research would help to understand whether improved ventilation is an important decision point for single home dwellers receiving grants and embarking on renovations. Such research is also carried on in the wider DECARBON-home project.
Main conclusions and recommendations for further policy development:
- More emphasis should be placed on deep renovations instead of encouraging the cheapest renovation options. Subsidy amounts and admission requirements should be considered in this light, carefully recognizing the financial and other challenges many households face.
- The requirement to improve ventilation to an adequate level has been missing from grants and can be recommended to be required in the future to ensure adequate indoor air quality after renovation. In practical terms, this will mean installing heat recovery ventilation which brings additional benefits in terms of comfort and user satisfaction. When installing heat recovery ventilation, building air tightness may need improvement, if not additionally insulating, for the effective operation of the heat recovery.
- Replacement of oil boilers with heat pumps is already the most commonly subsidized renovation option. This yields significant energy savings, even larger in the case of ground-source heat pumps than in the case of air-to-water heat pumps. In light of this, ELY and ARA renovation grants help Finland in decarbonizing its building sector and also in reaching its climate targets, both on a national and EU level.
- Ground-source heat pumps demand less power than air-to-water heat pumps. Installing own solar PV production helps to supply part of the electricity required by the heat pump systems and even to achieve a yearly plus energy balance. This can be especially beneficial when electricity prices are rising steeply.
The results and conclusions presented here cannot be readily generalized to all building types. The reference house modelled here is a typical building from the 1970s, but renovation grants are being awarded for a large variety of building types and age cohorts. In the awarded grant data, the oldest buildings are from 1880 and the newest from 2020, spanning a period of 140 years. However, in the specific context of oil boiler replacements, the chosen reference building from the 1970s is clearly a typical case, making the results here relevant for policy evaluation and development.
Author Contributions
Conceptualization, P.S. and J.K.; methodology, P.S., A.M., K.A. and J.K.; software, K.A.; validation, K.A.; formal analysis, P.S. and A.M.; investigation, P.S.; resources, P.S.; data curation, P.S.; writing—original draft preparation, P.S. and A.M.; writing—review and editing, P.S., A.M. and J.K.; visualization, K.A. and P.S.; supervision, J.K.; project administration, J.K.; funding acquisition, J.K. and P.S. All authors have read and agreed to the published version of the manuscript.
Funding
This research was supported by the Academy of Finland, a grant for DECARBON-HOME 335253, by the European Commission through the H2020 project Finest Twins (grant No. 856602) and by the Estonian Centre of Excellence in Zero Energy and Resource-Efficient Smart Buildings and Districts, ZEBE, grant 2014-2020.4.01.15-0016, funded by the European Regional Development Fund, Fortum and Neste Foundation and the K.V. Lindholms Stiftelse Foundation.
Acknowledgments
Finland’s Centre for Economic Development, Transport and the Environment (ELY) and The Housing Finance and Development Centre of Finland (ARA) are thanked for their data and co-operation.
Conflicts of Interest
The authors declare no conflict of interest.
References
- European Union Directive (EU). 2018/844 of the European Parliament. Off. J. Eur. Union 2018, 156. [Google Scholar]
- Directive 2010/31/EU of the European Parliament and of the Council. Directive 2010/31/EU of the European Parliament and of the Council of 19 May 2010 on the Energy Performance of Buildings; European Parliament and of the Council: London, UK, 2010; pp. 13–35.
- Gojak, M.; Bajc, T. Thermodynamic Sustainability Assessment for Residential Building Heating Comparing Different Energy Sources. Sci. Technol. Built Environ. 2022, 28, 73–83. [Google Scholar] [CrossRef]
- Karner, K.; Dißauer, C.; Enigl, M.; Strasser, C.; Schmid, E. Environmental Trade-Offs between Residential Oil-Fired and Wood Pellet Heating Systems: Forecast Scenarios for Austria until 2030. Renew. Sustain. Energy Rev. 2017, 80, 868–879. [Google Scholar] [CrossRef]
- Thomaßen, G.; Kavvadias, K.; Jiménez Navarro, J.P. The Decarbonisation of the EU Heating Sector through Electrification: A Parametric Analysis. Energy Policy 2021, 148, 111929. [Google Scholar] [CrossRef]
- Meadows, D.; Vis, P.; Zapfel, P. The Eu Emissions Trading System. In Towards a Climate-Neutral Europe: Curbing the Trend; Routledge: London, UK, 2019; pp. 66–94. ISBN 9781000750713. [Google Scholar]
- European Parliament. BRIEFING EU Legislation in Progress—Revising the Energy Efficiency Directive: Fit for 55 Package. Available online: https://epthinktank.eu/2021/09/30/revising-the-energy-efficiency-directive-fit-for-55-package-eu-legislation-in-progress (accessed on 30 September 2021).
- Schlacke, S.; Wentzien, H.; Thierjung, E.-M.; Köster, M. Implementing the EU Climate Law via the “Fit for 55” Package. Oxf. Open Energy 2022, 1. [Google Scholar] [CrossRef]
- Tognetti, F. Analysis of Existing Incentives in Europe for Heating Powered by Fossil Fuels and Renewable Sources. Brussels, BE Eur. Environ. Bur. 2020, 40. [Google Scholar]
- Finnish Ministry of the Environment. Fossiilisesta öljylämmityksestä luopumisen toimenpideohjelma. Luonnos./Operational Program for Ending Fossil Oil Heating. Available online: https://www.lausuntopalvelu.fi/FI/Proposal/DownloadProposalAttachment?attachmentId=15521 (accessed on 30 August 2022).
- Finnish Ministry of the Environment. Valtioneuvoston asetus asuinrakennusten energia-avustuksista vuosille 2020–2022. Muistio 11.12.2019./Governmental Degree on Residential Building Energy Renovation Subsidies for 2020–2022. Memo 11.12.2019. Available online: https://valtioneuvosto.fi/delegate/file/65619 (accessed on 30 August 2022).
- Crawley, J.; Manouseli, D.; Mallaburn, P.; Elwell, C. An Empirical Energy Demand Flexibility Metric for Residential Properties. Energies 2022, 15, 5304. [Google Scholar] [CrossRef]
- Carella, A.; D’Orazio, A. The Heat Pumps for Better Urban Air Quality. Sustain. Cities Soc. 2021, 75, 103314. [Google Scholar] [CrossRef]
- Ancona, M.A.; Baldi, F.; Branchini, L.; De Pascale, A.; Gianaroli, F.; Melino, F.; Ricci, M. Comparative Analysis of Renewable Energy Community Designs for District Heating Networks: Case Study of Corticella (Italy). Energies 2022, 15, 5248. [Google Scholar] [CrossRef]
- Minuto, F.D.; Lazzeroni, P.; Borchiellini, R.; Olivero, S.; Bottaccioli, L.; Lanzini, A. Modeling Technology Retrofit Scenarios for the Conversion of Condominium into an Energy Community: An Italian Case Study. J. Clean. Prod. 2021, 282, 124536. [Google Scholar] [CrossRef]
- Stamatellos, G.; Zogou, O.; Stamatelos, A. Energy Performance Optimization of a House with Grid-Connected Rooftop PV Installation and Air Source Heat Pump. Energies 2021, 14, 740. [Google Scholar] [CrossRef]
- Zator, S.; Skomudek, W. Impact of DSM on Energy Management in a Single-Family House with a Heat Pump and Photovoltaic Installation. Energies 2020, 13, 5476. [Google Scholar] [CrossRef]
- Jadwiszczak, P.; Jurasz, J.; Kaźmierczak, B.; Niemierka, E.; Zheng, W. Factors Shaping A/W Heat Pumps CO₂ Emissions—Evidence from Poland. Energies 2021, 14, 1576. [Google Scholar] [CrossRef]
- Chomać-Pierzecka, E.; Sobczak, A.; Soboń, D. The Potential and Development of the Geothermal Energy Market in Poland and the Baltic States—Selected Aspects. Energies 2022, 15, 4142. [Google Scholar] [CrossRef]
- Ochs, F.; Monteleone, W.; Dermentzis, G.; Siegele, D.; Speer, C. Compact Decentral Façade-Integrated Air-to-Air Heat Pumps for Serial Renovation of Multi-Apartment Buildings. Energies 2022, 15, 4679. [Google Scholar] [CrossRef]
- Montero, O.; Brischoux, P.; Callegari, S.; Fraga, C.; Rüetschi, M.; Vionnet, E.; Calame, N.; Rognon, F.; Patel, M.; Hollmuller, P. Large Air-to-Water Heat Pumps for Fuel-Boiler Substitution in Non-Retrofitted Multi-Family Buildings—Energy Performance, CO2 Savings, and Lessons Learned in Actual Conditions of Use. Energies 2022, 15, 5033. [Google Scholar] [CrossRef]
- Conrad, J.; Greif, S. Modelling Load Profiles of Heat Pumps. Energies 2019, 12, 766. [Google Scholar] [CrossRef] [Green Version]
- Finnish ELY-Centre. Avustus pientalon öljylämmityksestä luopumiseksi./Grant for Replacing Oil Heating in a Detached House. Centre for Economic Development, Transport and the Environment (ELY-Centre). Available online: https://www.ely-keskus.fi/oljylammityksen-vaihtajalle (accessed on 30 August 2022).
- Vimpari, J. Should Energy Efficiency Subsidies Be Tied into Housing Prices? Environ. Res. Lett. 2021, 16, 064027. [Google Scholar] [CrossRef]
- Pikas, E.; Kurnitski, J.; Liias, R.; Thalfeldt, M. Quantification of Economic Benefits of Renovation of Apartment Buildings as a Basis for Cost Optimal 2030 Energy Efficiency Strategies. Energy Build. 2015, 86, 151–160. [Google Scholar] [CrossRef]
- Lihtmaa, L.; Hess, D.B.; Leetmaa, K. Intersection of the Global Climate Agenda with Regional Development: Unequal Distribution of Energy Efficiency-Based Renovation Subsidies for Apartment Buildings. Energy Policy 2018, 119, 327–338. [Google Scholar] [CrossRef]
- Mikola, A.; Hamburg, A.; Kuusk, K.; Kalamees, T.; Voll, H.; Kurnitski, J. The Impact of the Technical Requirements of the Renovation Grant on the Ventilation and Indoor Air Quality in Apartment Buildings. Build. Environ. 2022, 210, 108698. [Google Scholar] [CrossRef]
- Hamburg, A.; Kuusk, K.; Mikola, A.; Kalamees, T. Realisation of Energy Performance Targets of an Old Apartment Building Renovated to nZEB. Energy 2020, 194, 116874. [Google Scholar] [CrossRef]
- Kuusk, K.; Kalamees, T. Estonian Grant Scheme for Renovating Apartment Buildings. Energy Procedia 2016, 96, 628–637. [Google Scholar] [CrossRef] [Green Version]
- Hamburg, A.; Kalamees, T. Improving the indoor climate and energy saving in renovated apartment buildings in Estonia. In Proceedings of the Cold Climate HVAC 2018 Conference, Kiruna, Sweden, 12–15 March 2018; pp. 243–251. [Google Scholar]
- Lihtmaa, L.; Kalamees, T. Preliminary assessment of preconditions to deliver carbon neutrality in apartment buildings by 2050. In Proceedings of the E3S Web of Conferences, 12th Nordic Symposium on Building Physics (NSB 2020), Tallinn, Estonia, 7–9 September 2020; Volume 172. [Google Scholar]
- Finnish Ministry of the Environment. Energiatehokkuutta Koskevien Vähimmäisvaatimusten Kustannusoptimaalisten Tasojen Laskenta, Finnish Cost Optimal Report; Finnish Ministry of the Environment: Finland, 2012.
- Sahlin, P.; Eriksson, L.; Grozman, P.; Johnsson, H.; Shapovalov, A.; Vuolle, M. Whole-Building Simulation with Symbolic DAE Equations and General Purpose Solvers. Build. Environ. 2004, 39, 949–958. [Google Scholar] [CrossRef]
- Achermann, M.; Zweifel, G. RADTEST—Radiant Heating and Cooling Test Cases. Evaluation 2003, 93. [Google Scholar]
- Loutzenhiser, P.G.; Maxwell, G.M.; Manz, H. An Empirical Validation of the Daylighting Algorithms and Associated Interactions in Building Energy Simulation Programs Using Various Shading Devices and Windows. Energy 2007, 32, 1855–1870. [Google Scholar] [CrossRef]
- Salvalai, G. Implementation and Validation of Simplified Heat Pump Model in IDA-ICE Energy Simulation Environment. Energy Build. 2012, 49, 132–141. [Google Scholar] [CrossRef]
- Hilliaho, K.; Lahdensivu, J.; Vinha, J. Glazed Space Thermal Simulation with IDA-ICE 4.61 Software - Suitability Analysis with Case Study. Energy Build. 2015, 89, 132–141. [Google Scholar] [CrossRef]
- Mazzeo, D.; Matera, N.; Cornaro, C.; Oliveti, G.; Romagnoni, P.; De Santoli, L. EnergyPlus, IDA ICE and TRNSYS Predictive Simulation Accuracy for Building Thermal Behaviour Evaluation by Using an Experimental Campaign in Solar Test Boxes with and without a PCM Module. Energy Build. 2020, 212, 109812. [Google Scholar] [CrossRef]
- Ferrantelli, A.; Ahmed, K.; Pylsy, P.; Kurnitski, J. Analytical Modelling and Prediction Formulas for Domestic Hot Water Consumption in Residential Finnish Apartments. Energy Build. 2017, 143, 53–60. [Google Scholar] [CrossRef]
- Ahmed, K.; Fadejev, J.; Kurnitski, J. Modeling an Alternate Operational Ground Source Heat Pump for Combined Space Heating and Domestic Hot Water Power Sizing. Energies 2019, 12, 2120. [Google Scholar] [CrossRef] [Green Version]
- Mikola, A.; Kalamees, T.; Kõiv, T.A. Performance of Ventilation in Estonian Apartment Buildings. Energy Procedia 2017, 132, 963–968. [Google Scholar] [CrossRef]
- D’Agostino, D.; Mele, L.; Minichiello, F.; Renno, C. The Use of Ground Source Heat Pump to Achieve a Net Zero Energy Building. Energies 2020, 13, 3450. [Google Scholar] [CrossRef]
- D’agostino, D.; Esposito, M.; Minichiello, F.; Renno, C. Feasibility Study on the Spread of Nzebs Using Economic Incentives. Energies 2021, 14, 7169. [Google Scholar] [CrossRef]
- Finnish Ministry of the Environment. Rakennusten energiatehokkuuden parantamisen osoittaminen energia-avustushankkeissa. Available online: https://www.ymparisto.fi/download/Laskentaohje_asuinrakennusten_energiaavustus_812020pdf/%7BA961ECE3-3C1C-4C07-B3BB-AC4F5FCB1EEE%7D/154371 (accessed on 30 August 2022).
- Abid, M.; Hewitt, N.; Huang, M.J.; Wilson, C.; Cotter, D. Performance Analysis of the Developed Air Source Heat Pump System at Low-to-Medium and High Supply Temperatures for Irish Housing Stock Heat Load Applications. Sustainability 2021, 13, 11753. [Google Scholar] [CrossRef]
- Fadejev, J.; Simson, R.; Kurnitski, J.; Kesti, J.; Mononen, T.; Lautso, P. Geothermal Heat Pump Plant Performance in a Nearly Zero-Energy Building. Energy Procedia 2016, 96, 489–502. [Google Scholar] [CrossRef]
- Fadejev, J.; Simson, R.; Kurnitski, J.; Haghighat, F. A Review on Energy Piles Design, Sizing and Modelling. Energy 2017, 122, 390–407. [Google Scholar] [CrossRef]
- Di Schio, E.R.; Ballerini, V.; Dongellini, M.; Valdiserri, P. Defrosting of Air-Source Heat Pumps: Effect of Real Temperature Data on Seasonal Energy Performance for Different Locations in Italy. Appl. Sci. 2021, 11, 8003. [Google Scholar] [CrossRef]
Figure 1.
Typical detached house built from 1970 to 1979.

Figure 2.
The grant distribution according to the building age for (a) ELY grant and (b) ARA grant.
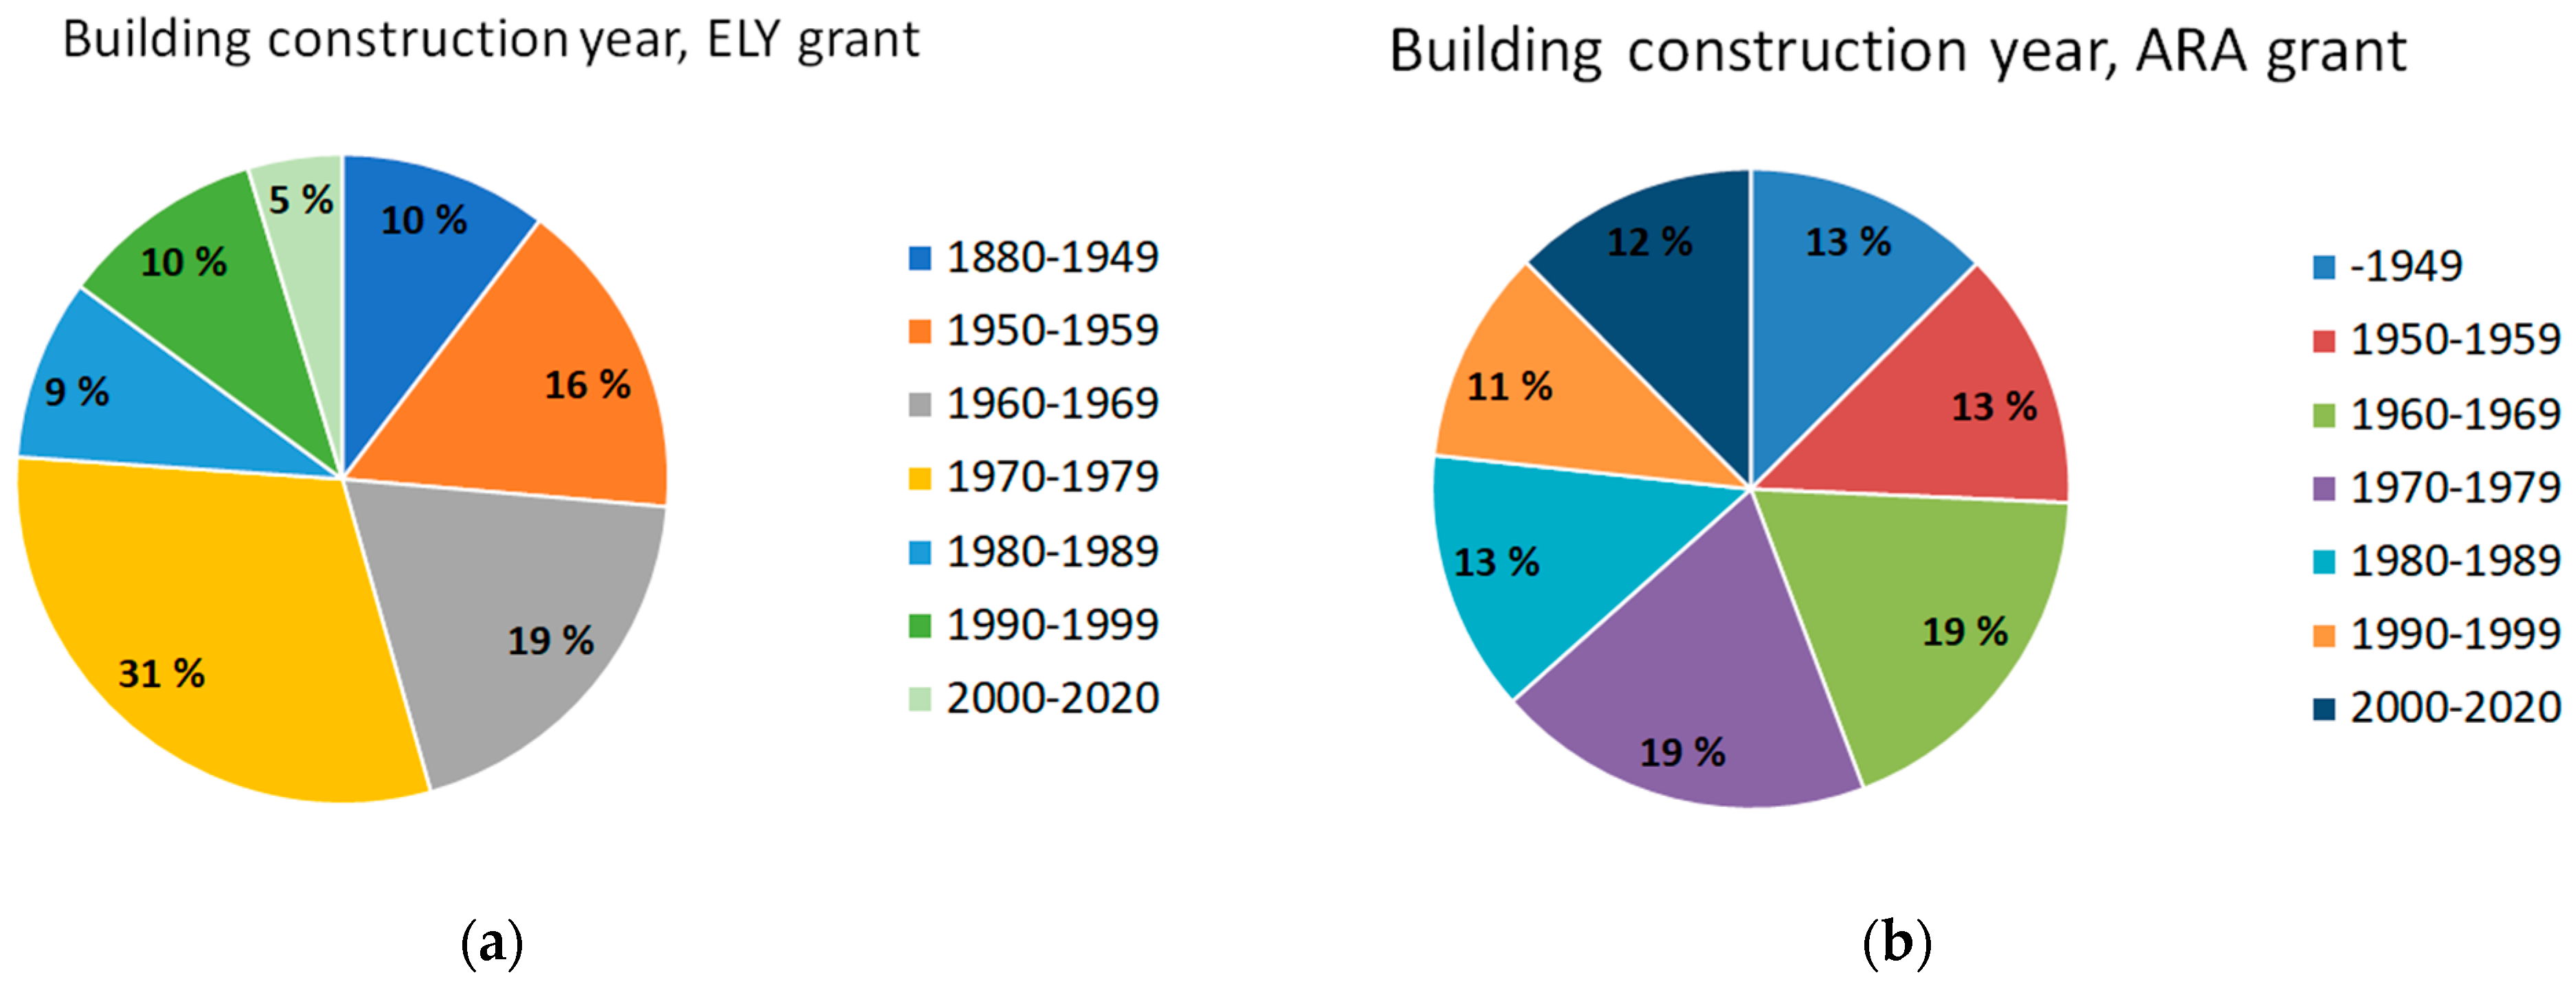
Figure 3.
Type of the new heating system installed with the ELY grant (a) for all building ages, and (b) for buildings built in the 1970s.
Figure 3.
Type of the new heating system installed with the ELY grant (a) for all building ages, and (b) for buildings built in the 1970s.
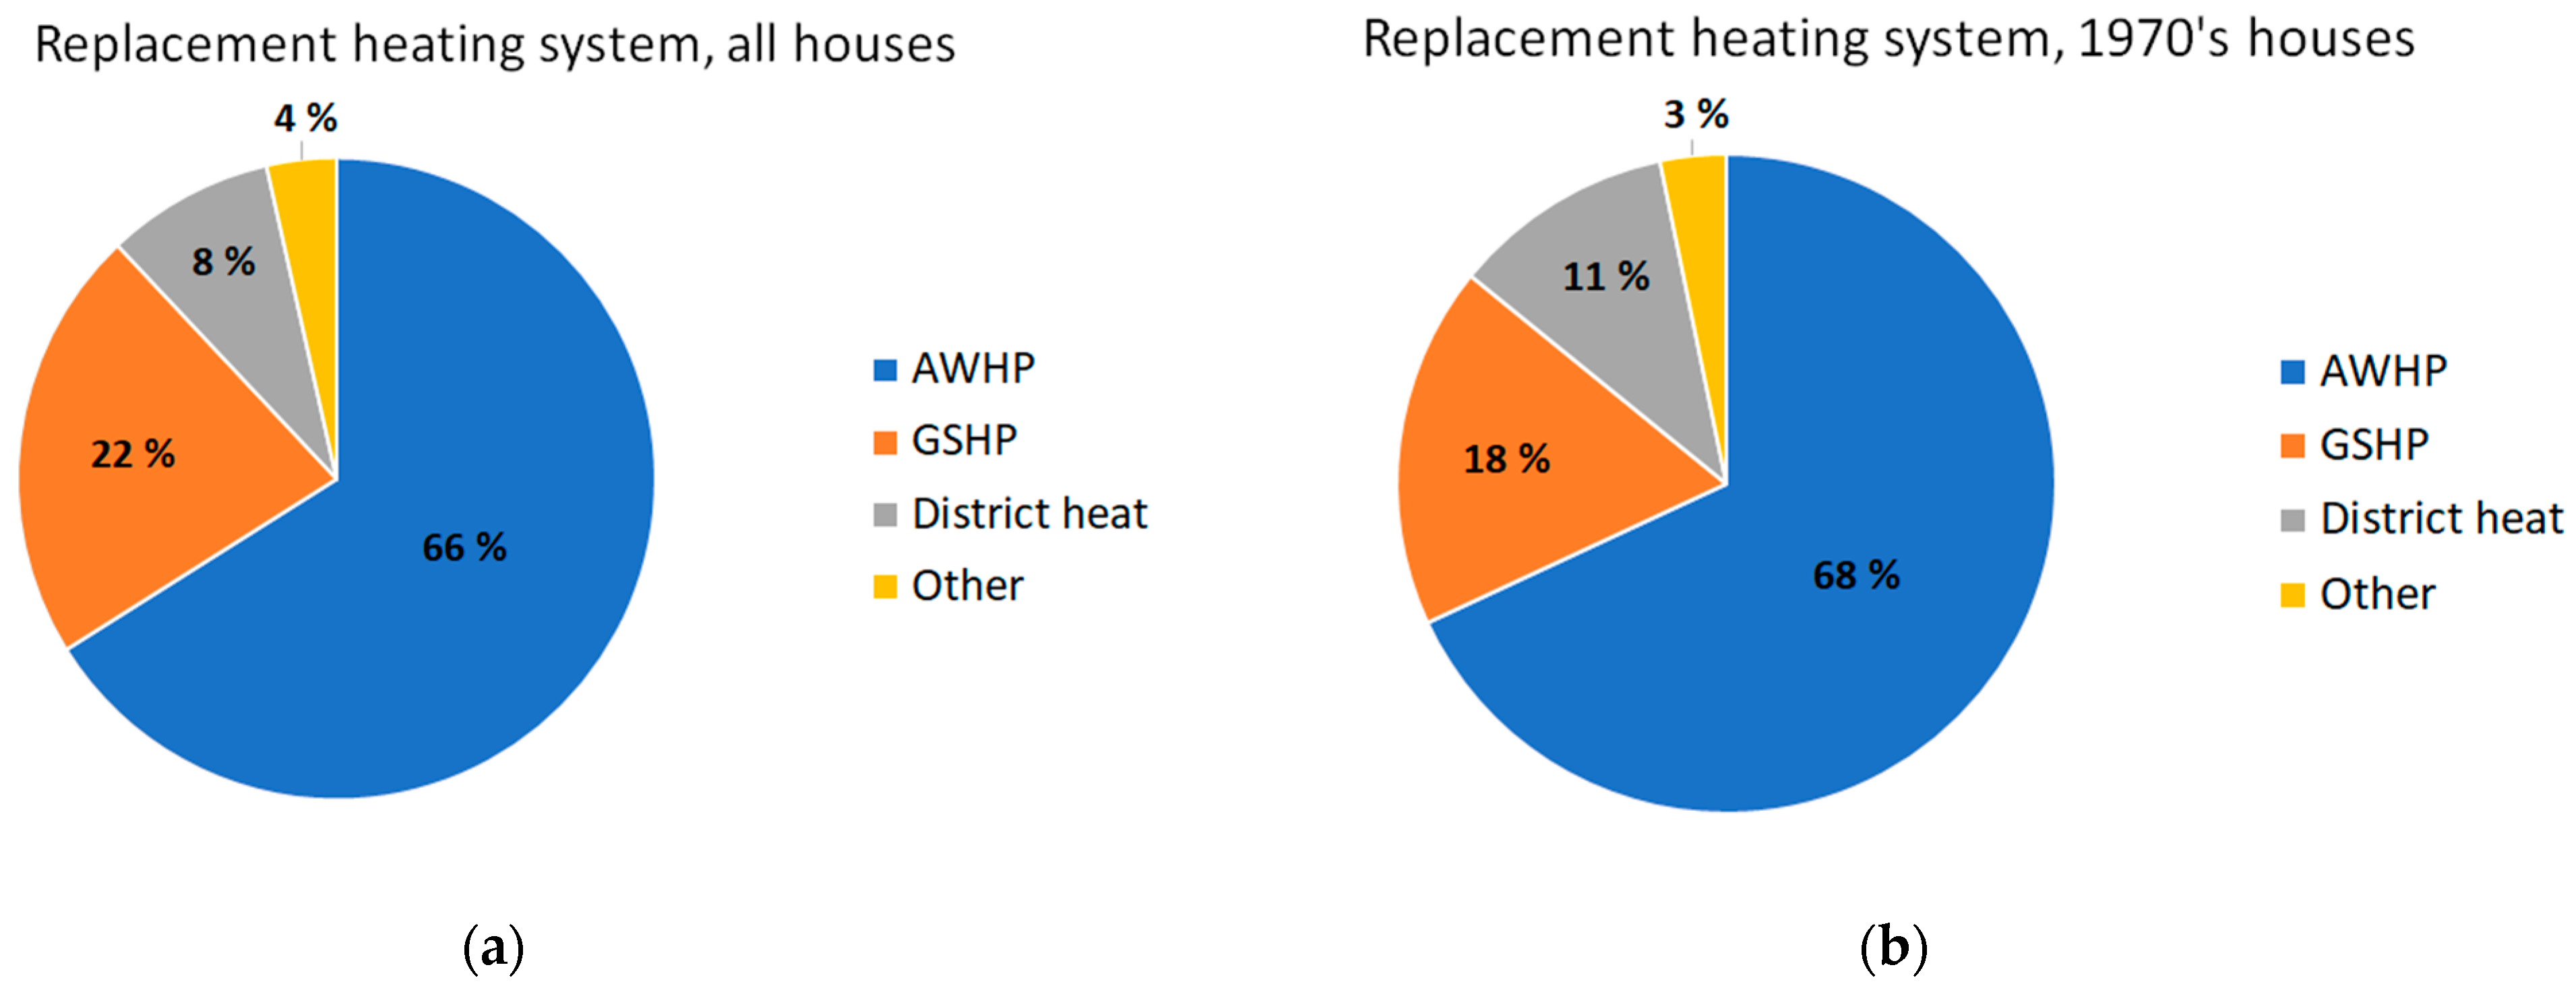
Figure 4.
Delivered heating and electricity use of a reference single-family house in simulated renovation measures.
Figure 4.
Delivered heating and electricity use of a reference single-family house in simulated renovation measures.

Figure 5.
The delivered energy use of a reference single-family house in simulated renovation measures.
Figure 5.
The delivered energy use of a reference single-family house in simulated renovation measures.
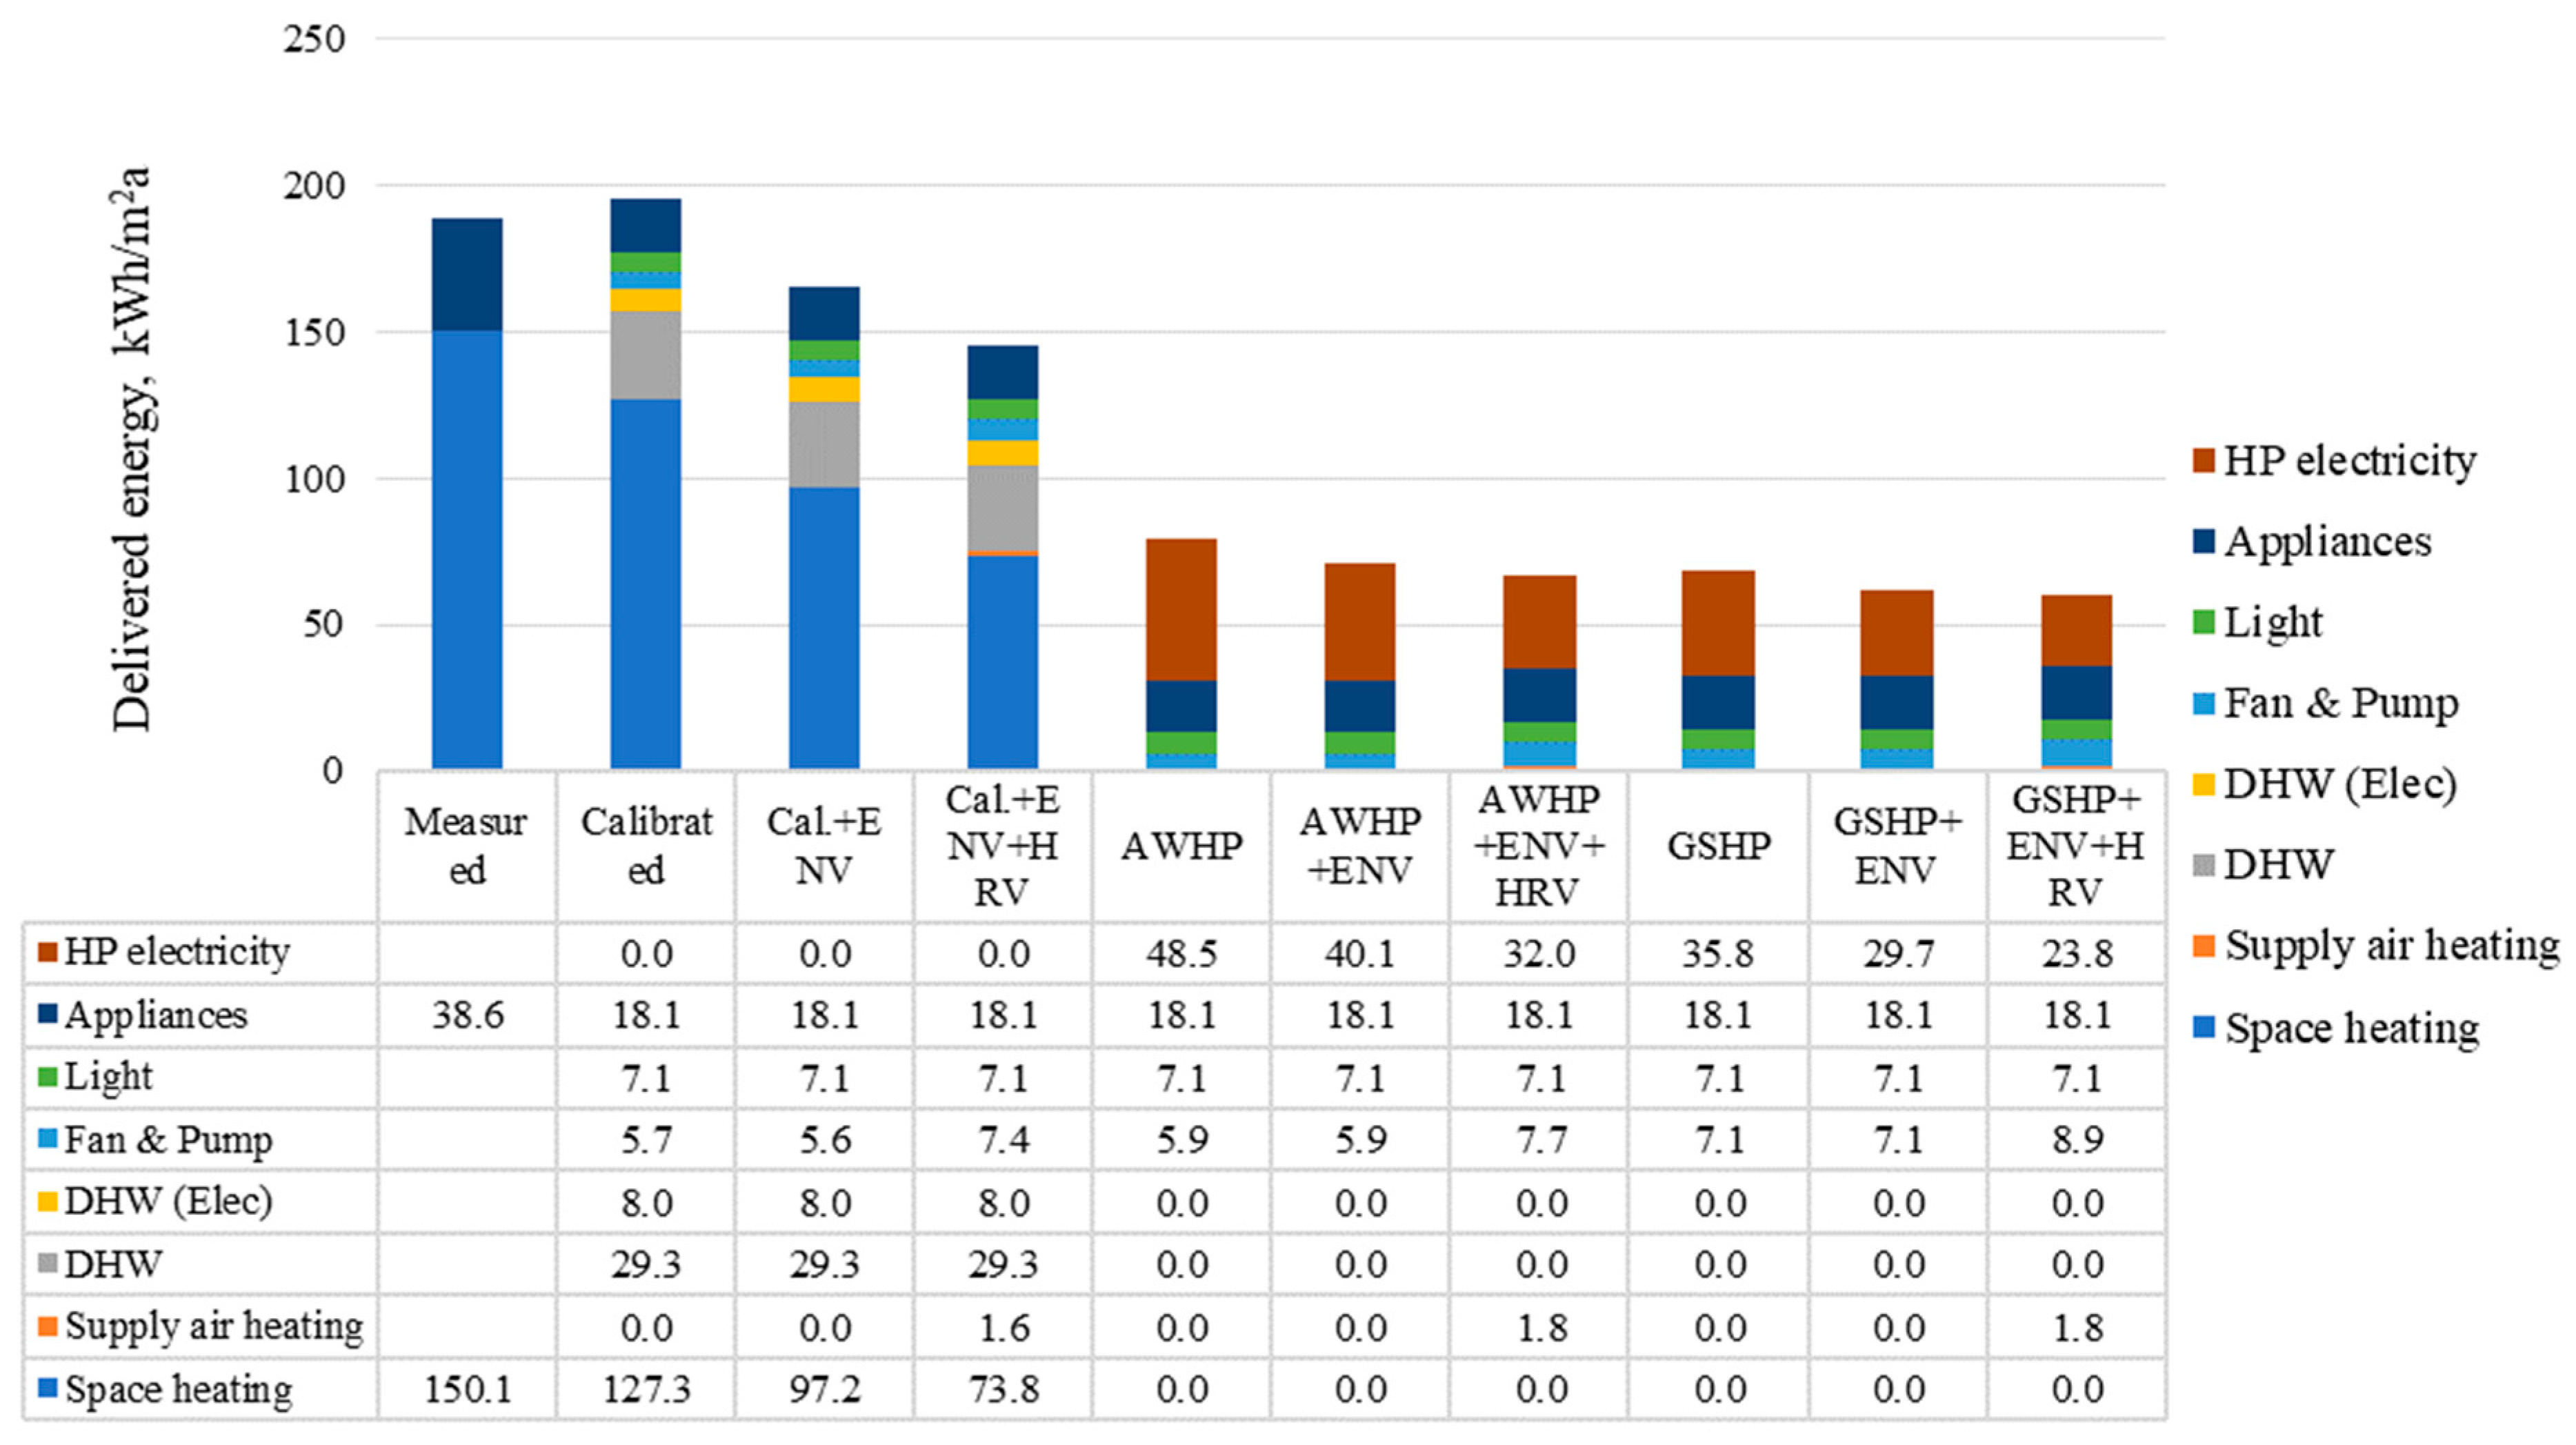
Figure 6.
Cumulative yearly electric power demand for (a) reference and AWHP and (b) GSHP measures.
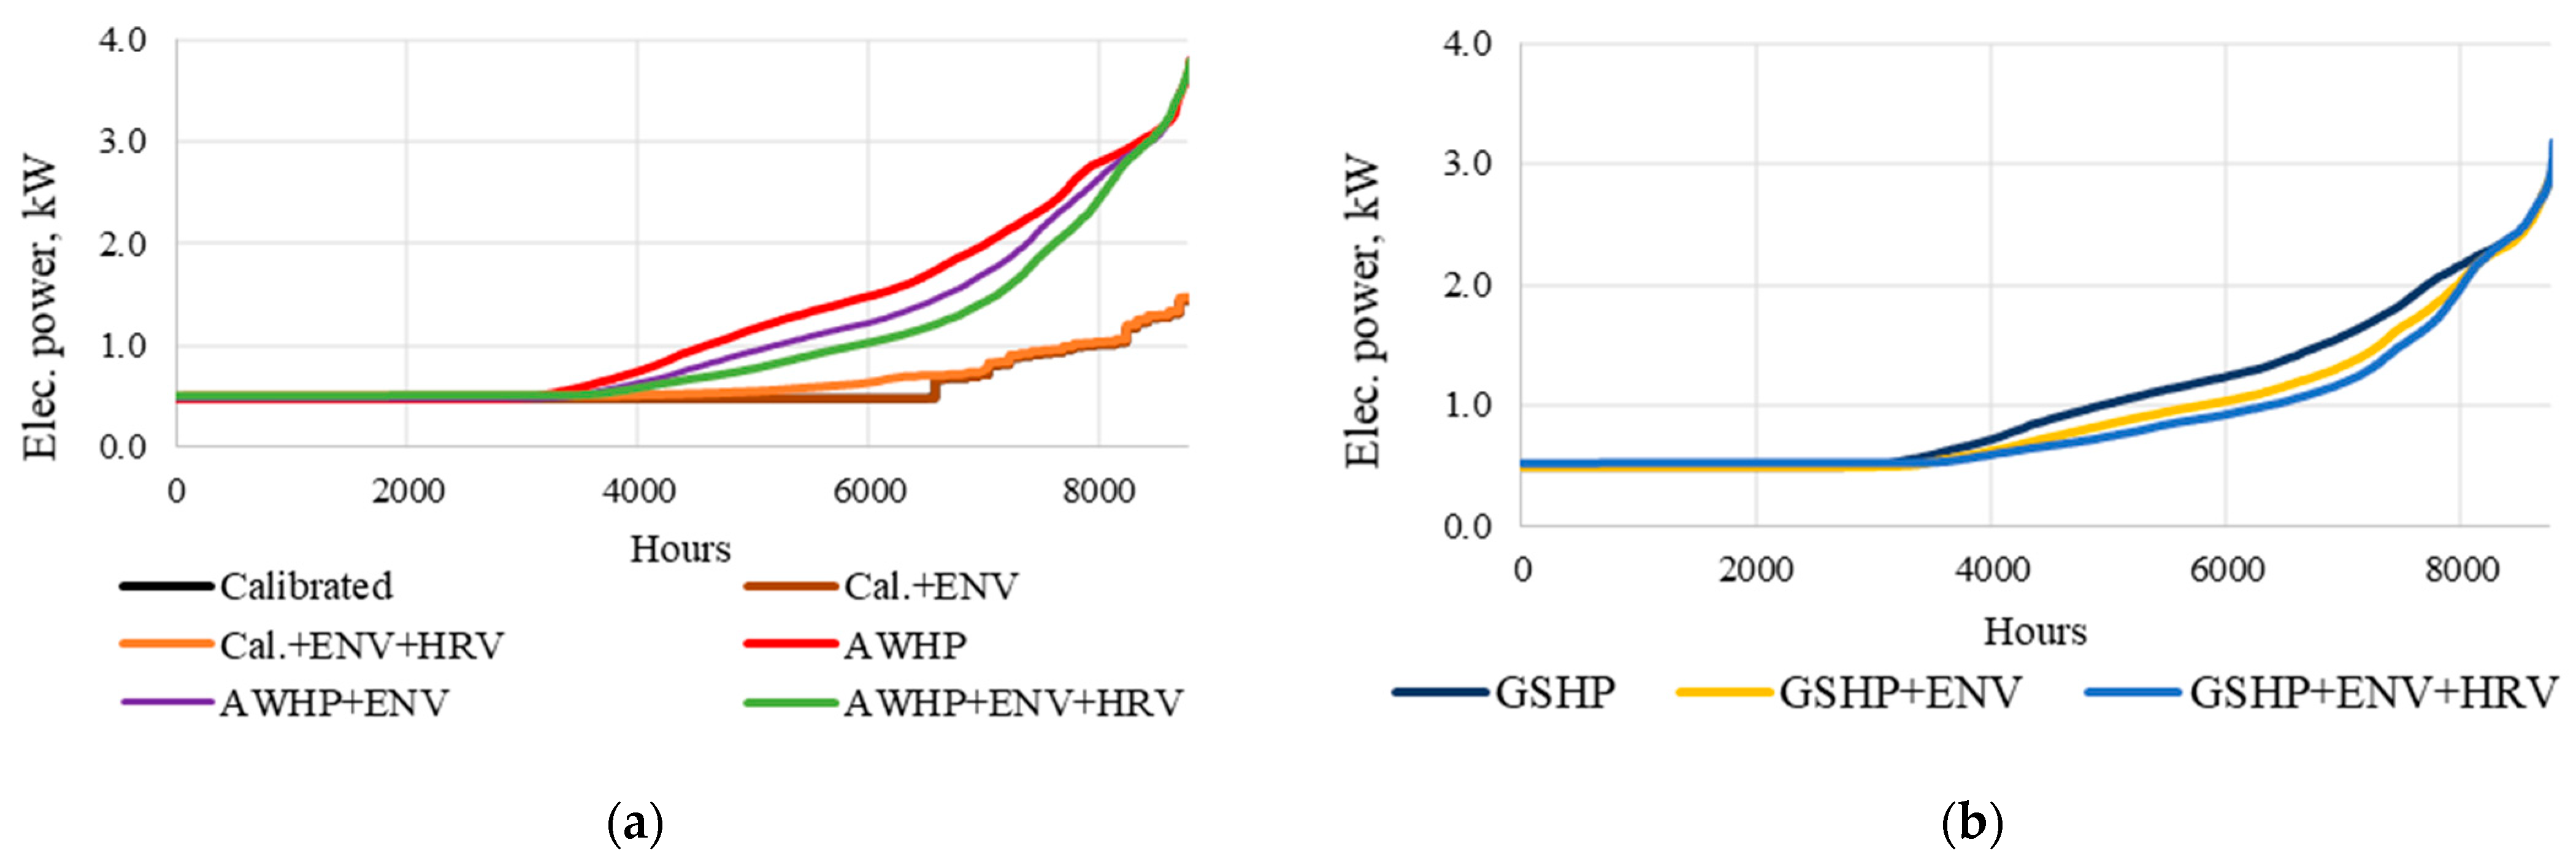
Figure 7.
Exported/delivered electricity unit load from PV for (a) general and AWHP cases and (b) GSHP cases.
Figure 7.
Exported/delivered electricity unit load from PV for (a) general and AWHP cases and (b) GSHP cases.

Figure 8.
Yearly delivered and exported energy for a reference single-family house for different cases.
Figure 8.
Yearly delivered and exported energy for a reference single-family house for different cases.

Figure 9.
Comparison of energy use of a reference single family house with Finnish guideline 1972 house. (a) Heating and electricity from the guideline and calibrated model with fixed infiltration; (b) breakdown of energy use.
Figure 9.
Comparison of energy use of a reference single family house with Finnish guideline 1972 house. (a) Heating and electricity from the guideline and calibrated model with fixed infiltration; (b) breakdown of energy use.
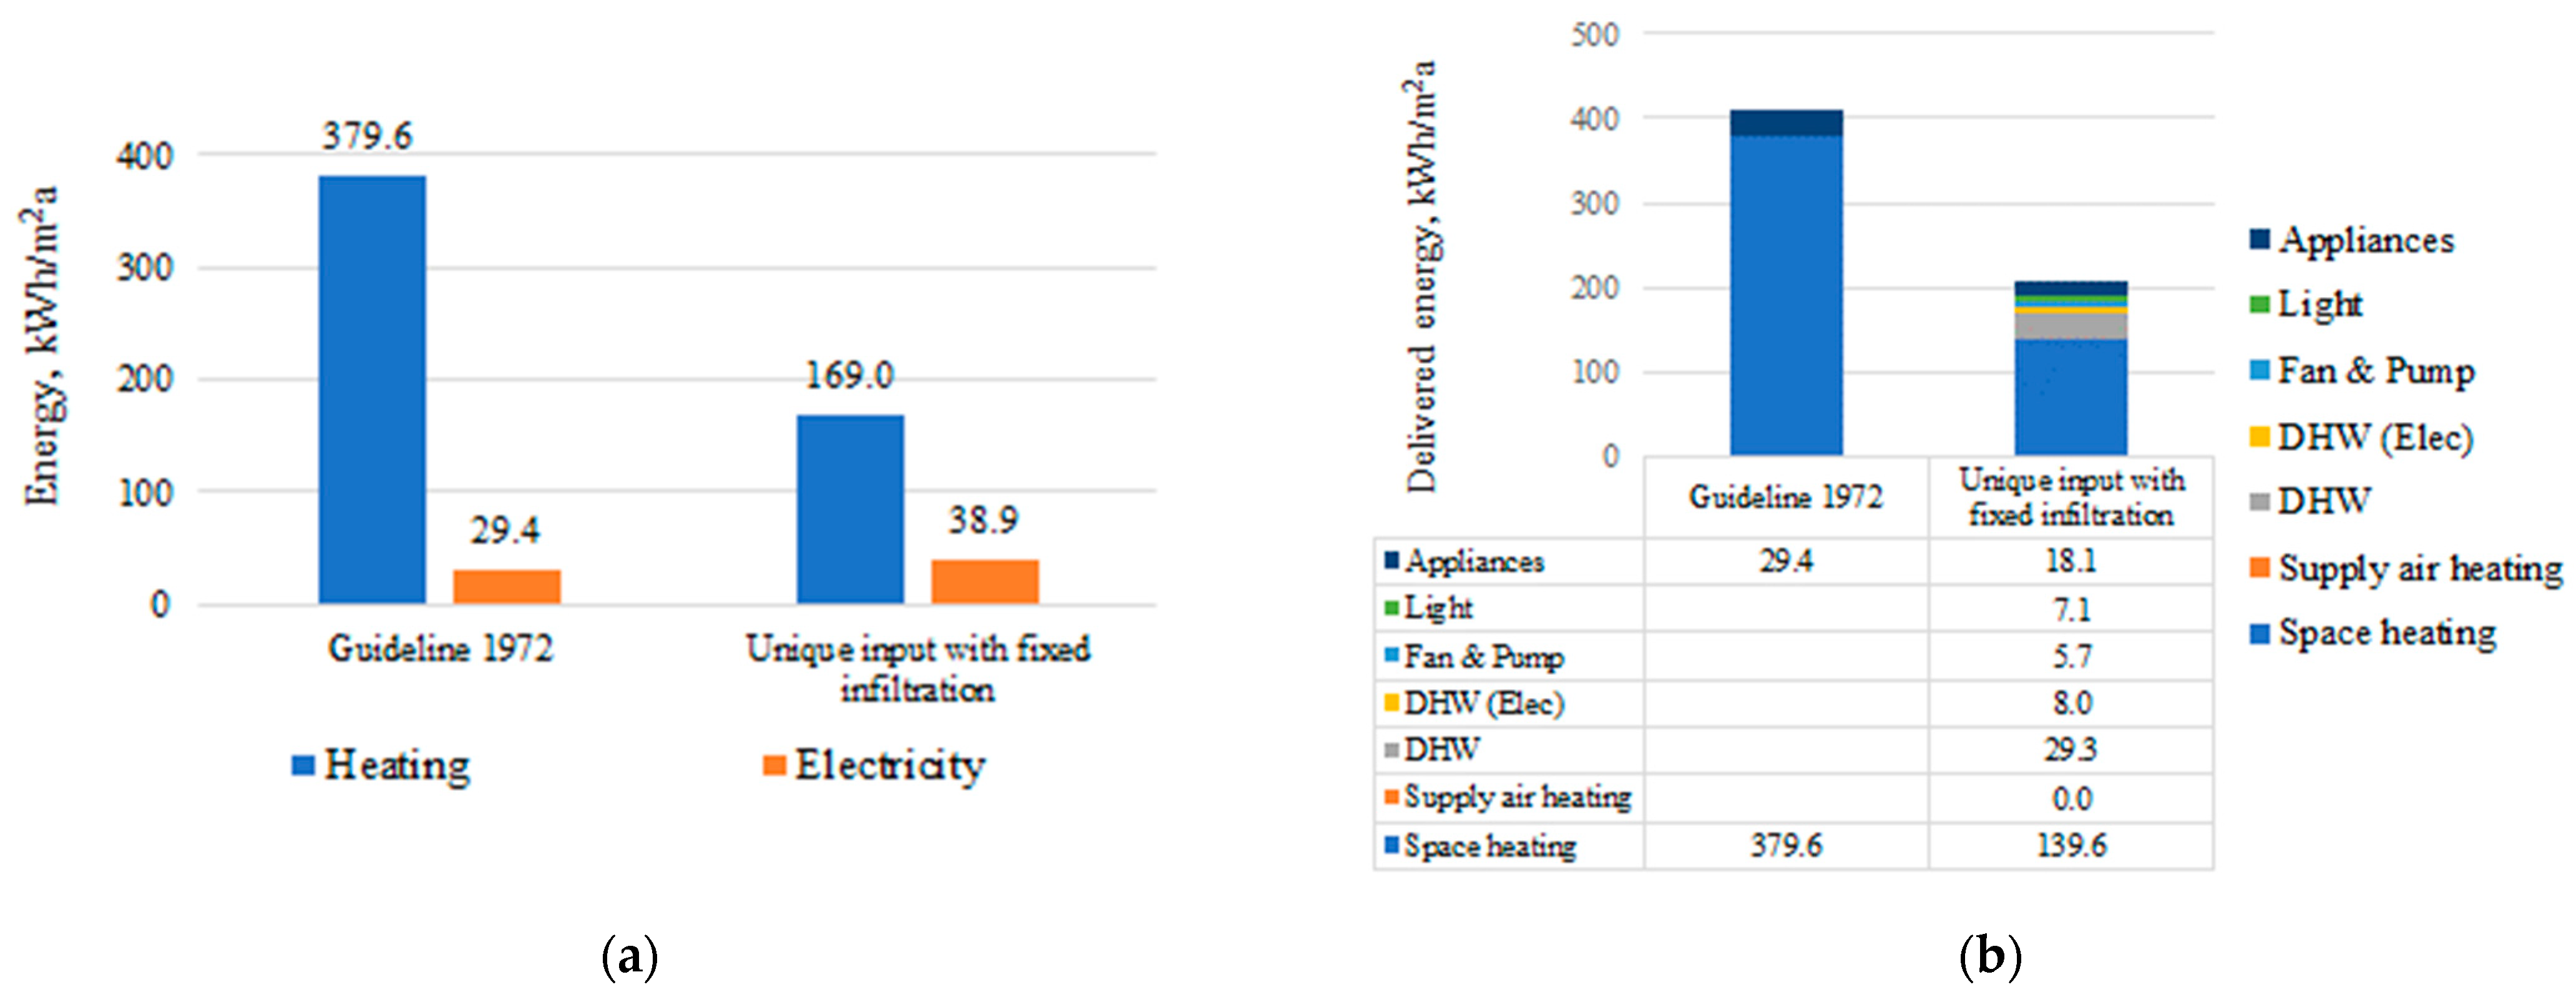
Figure 10.
Coefficient of performance of DHW and space heat (SH) (a) AWHP + ENV case and (b) GSHP + ENV case.
Figure 10.
Coefficient of performance of DHW and space heat (SH) (a) AWHP + ENV case and (b) GSHP + ENV case.

Figure 11.
The heating curve for different renovation measures.


Table 1.
Composed energy consumption of reference houses (selection of 1970s houses (N = 74)).
| Main Properties of the Selected Houses | Value | |
|---|---|---|
| Average | Median | |
| Wood consumption, kWh/a | 4729.6 | 3900.0 |
| Wood consumption, kWh/m2a | 34.9 | 26.9 |
| Fuel oil consumption, kWh/a | 18,750.0 | 20,000.0 |
| Fuel oil consumption, kWh/m2a | 128.4 | 123.2 |
| Fuel oil consumption, L/a | 1875.0 | 2000.0 |
| Fuel oil consumption, L/m2a | 12.8 | 12.3 |
| Actual electricity consumption, kWh/a | 6566.2 | 5550.0 |
| Actual electricity consumption, kWh/m2a | 44.2 | 38.6 |
| Heated net area, m2 | 153.8 | 129.0 |
Table 2.
The main technical details of the modified simulation model.
| Parameter | Value |
|---|---|
| Air tightness q50, m3/(m2h) | 5.11 |
| U-value external walls, W/(m2K) | 0.3 |
| U-value roof, W/(m2K) | 0.18 |
| U-value base floor, W/(m2K) | 0.31 |
| U-value windows, W/(m2K) | 1.80 |
| Area windows, m2 | 19.74 |
| Boiler efficiency, - | 0.81 |
| Heat distribution efficiency, - | 0.85 |
Table 3.
Electric power at percentile value for different renovation measures.
| Calibrated | Cal. + ENV | Cal. + ENV + HRV | AWHP | AWHP + ENV | AWHP + ENV + HRV | GSHP | GSHP + ENV | GSHP + ENV + HRV | |
|---|---|---|---|---|---|---|---|---|---|
| Power (95 percentile), kW | 1.2 | 1.2 | 1.3 | 3.0 | 2.9 | 2.9 | 2.3 | 2.3 | 2.3 |
| Power (95 percentile), W/m2 | 9.0 | 9.0 | 9.2 | 22.0 | 21.5 | 21.4 | 17.2 | 16.9 | 17.2 |
| Power (99 percentile), kW | 1.4 | 1.4 | 1.5 | 3.5 | 3.5 | 3.5 | 2.8 | 2.7 | 2.7 |
| Power (99 percentile), W/m2 | 10.6 | 10.6 | 10.8 | 25.4 | 25.6 | 25.5 | 20.2 | 20.1 | 20.1 |
| Power (100 percentile), kW | 1.4 | 1.4 | 1.5 | 3.8 | 3.8 | 3.8 | 3.0 | 3.0 | 3.2 |
Table 4.
Electricity production in delivered and exported units for different cases.
| Calibrated | Cal. + ENV | Cal. + ENV + HRV | AWHP | AWHP + ENV | AWHP + ENV + HRV | GSHP | GSHP + ENV | GSHP + ENV + HRV | |
|---|---|---|---|---|---|---|---|---|---|
| Elec. use, kWh/m2a | 39 | 39 | 42 | 79 | 72 | 67 | 68 | 62 | 59 |
| Delivered, kWh/m2a | 22 | 22 | 25 | 62 | 56 | 50 | 51 | 45 | 43 |
| Exported, kWh/m2a | 54 | 54 | 54 | 54 | 55 | 54 | 54 | 55 | 54 |
| PV production, kWh/m2a | 71 | 71 | 71 | 71 | 71 | 71 | 71 | 71 | 71 |
| Self-use, % | 23.4 | 23.4 | 24.4 | 24.3 | 23.1 | 23.3 | 23.5 | 23.0 | 23.2 |
Table 5.
Coefficient of performance for different cases using heat pump systems.
| AWHP | AWHP + ENV | AWHP + ENV + HRV | GSHP | GSHP + ENV | GSHP +ENV + HRV | |
|---|---|---|---|---|---|---|
| SH + DHW | 2.49 | 2.49 | 2.48 | 3.32 | 3.33 | 3.31 |
| DHW | 2.48 | 2.45 | 2.41 | 3.13 | 3.12 | 3.11 |
| SH | 2.50 | 2.54 | 2.59 | 3.43 | 3.54 | 3.62 |
Publisher’s Note: MDPI stays neutral with regard to jurisdictional claims in published maps and institutional affiliations. |
© 2022 by the authors. Licensee MDPI, Basel, Switzerland. This article is an open access article distributed under the terms and conditions of the Creative Commons Attribution (CC BY) license (https://creativecommons.org/licenses/by/4.0/).
Share and Cite
MDPI and ACS Style
Sankelo, P.; Ahmed, K.; Mikola, A.; Kurnitski, J. Renovation Results of Finnish Single-Family Renovation Subsidies: Oil Boiler Replacement with Heat Pumps. Energies 2022, 15, 7620. https://doi.org/10.3390/en15207620
AMA Style
Sankelo P, Ahmed K, Mikola A, Kurnitski J. Renovation Results of Finnish Single-Family Renovation Subsidies: Oil Boiler Replacement with Heat Pumps. Energies. 2022; 15(20):7620. https://doi.org/10.3390/en15207620
Chicago/Turabian StyleSankelo, Paula, Kaiser Ahmed, Alo Mikola, and Jarek Kurnitski. 2022. "Renovation Results of Finnish Single-Family Renovation Subsidies: Oil Boiler Replacement with Heat Pumps" Energies 15, no. 20: 7620. https://doi.org/10.3390/en15207620
Note that from the first issue of 2016, this journal uses article numbers instead of page numbers. See further details here.