

The Design and Optimization of Natural Gas Liquefaction Processes: A Review


1
School of Energy and Power Engineering, Northeast Electric Power University, Jilin 132012, China
2
College of Petroleum Engineering, Liaoning Shihua University, Fushun 113001, China
*
Author to whom correspondence should be addressed.
†
These authors contributed equally to this work.
Energies 2022, 15(21), 7895; https://doi.org/10.3390/en15217895
Submission received: 31 August 2022
/
Revised: 3 October 2022
/
Accepted: 13 October 2022
/
Published: 24 October 2022
(This article belongs to the Topic Efficient Manufacturing: Materials, Processes, and Systems)
Abstract
:As the energy crisis intensifies, the global demand for natural gas is growing rapidly. Liquefied natural gas (LNG) technology is among the delivery solutions with flexible and reliable application prospects and is already a significant field of research in energy utilization. The performance of natural gas liquefaction process has a major influence on the production capacity, energy consumption, economics, and safety of the entire supply chain. Many scholars have conducted numerous studies on various LNG processes and designed many classical processes. This paper summarizes and discusses current research status and development level in the design and optimization of natural gas liquefaction processes in recent years, mainly focusing on cascade liquefaction process, expansion liquefaction process, and mixed refrigerant liquefaction process. The advantages and disadvantages of various liquefaction processes are compared and analyzed in terms of liquefaction capacity, energy consumption, economy, safety, and adaptability. In addition, the rapid development of pressurized liquefaction technology in recent years and its application outlooks are also introduced in detail. Finally, the present situation and industrial demand of LNG process are analyzed, and reasonable suggestions and future research prospects are put forward.
1. Introduction
Energy demand is observably increasing due to many factors, including the population growth and the improvement of living standards. Global energy consumption is estimated to increase by about one-third by 2040, with fossil fuels being the main source of energy [1,2]. However, the combustion of such fuels will contribute to a great deal of greenhouse gas (GHG) emissions, especially a large amount of carbon dioxide (CO2) emissions. Compared with oil and coal, natural gas (NG) reduces CO2 emissions per unit of energy by approximately 29%–44% [3], In addition, natural gas is commonly described to be a bridge fuel for future renewable energy, primarily for its lower air pollutant emissions, as shown in Figure 1 [4]. It is considered to be the among the cleanest fossil fuels and has become an attractive energy [3]. Therefore, the contribution of NG to the total demand of the world’s primary energy has increased significantly, providing nearly 24% of the world’s energy [5,6].
Generally, the options for delivering NG from production sites to consumers mainly include pipelines or liquefied natural gas (LNG). Pipelines can be controlled easily and are suitable for continuous operation, with less transportation loss and high security. However, long-distance pipeline transportation often passes through many areas. In the face of various geological environments and obstacles, there exist many disadvantages for pipelines, e.g., the construction complexity, the increasing cost of construction and maintenance with transportation distance, and the lack of flexibility. In some countries and regions, e.g., Korea, Taiwan, and some European countries, the use of pipelines is not allowed [7]. In consideration of enormous difficulties of pipelines construction, LNG has become the general approach to solve all complications associated with the storage and transportation of NG around all the world [8]. On the other hand, to satisfy the growing appetite for natural gas, the abundant resources of NG in the ocean have accelerated the pace of its exploitation and utilization. Considering the harsh offshore conditions and space constraints, as well as the high costs involved in transporting NG from an offshore extraction platform to an onshore liquefaction plant, the LNG-floating production storage and offloading (LNG-FPSO or FLNG for short) may be the best solution, which integrates the NG production, storage, and offloading function units [9]. Due to economic, technical, political, and security reasons, the long-distance transport method that reduces the volume of transported NG by about 600 times through liquefaction is more reliable [10]. According to Shell’s 2021 ‘Liquefied Natural Gas (LNG) Outlook Report’ [11], the global demand for LNG will reach 700 million tons by 2040. At the same time, the number of LNG-fueled shipments is also increasing. It is estimated that the number of global LNG bunkering vessels will reach 45 by 2023 [11]. The global expansion of LNG production and growing environmental concerns are likely to put the industry at an all-time competitive stage. In order to operate efficiently, the LNG industry needs to innovate in all links of the supply chain to reach the energy-saving and profitable purposes.
The LNG supply chain starts from the exploration and production and goes through all links of liquefaction, transportation, regasification and sales [12]. First, natural gas is explored from the reservoir by drilling, pumping and extraction. Such approaches (including water, chemical, and steam injection) permit the extraction of up to 60% of the reservoir’s capacity. After extraction, NG is delivered to a treatment plant to eliminate impurities like water, carbon dioxide, oxygen, nitrogen and hydrogen sulfide from NG to guard against internal corrosion or equipment damage caused by solids formed during the cooling process. After pretreatment, various technologies can be used to liquefy NG. After liquefaction, NG is transported to the receiving station, and finally it is gasified again and transported to the user side [13]. Figure 2 illustrates the LNG supply chain and cost breakdown process [14]. As shown in Figure 1, 42% of the overall cost of the LNG supply chain is related to refrigeration and liquefaction technologies, mainly because this process takes place in cryogenic conditions, involving large and complex refrigeration systems and necessary equipment. In addition, the significant energy consumption associated with the compressed power entry of the refrigeration cycle contributes to the high energy consumption and cost of LNG liquefaction production. Therefore, if the compression power consumption and cost of the liquefaction process can be lowered, the growth in worldwide competitiveness and trade growth rate for LNG will be markedly accelerated.
In addition, operative improvements of different positions in the supply chain can bring substantive advantages. For example, improving energy efficiency to reduce a large amount of fuel required for NG conversion in various processes in the supply chain, thereby obtaining higher LNG production without extra resources and environmental impact [15]. As the main energy-consuming and high-cost link in the supply chain, NG liquefaction is also among the foremost thermodynamic processes in the cryogenic natural gas industry. The cycles involved in the liquefaction process are generally vapor compression cycles and gas expansion cycles. The major distinction between these two cycles relates to the fact that in the vapor compression cycle the refrigerant undergoes a phase change, whereas in the gas expansion cycle the refrigerant maintains its gaseous state. The specific processes of cycles are shown in Figure 3 [16]. In this process, the cycle is basically similar to a closed refrigeration cycle, with the exception that the heat load is distributed in the temperature range from environmental temperature to the low temperature of LNG. In addition, exergy analysis shows that the higher compression load is mainly decided by temperature difference in the LNG main heat exchanger [9], i.e., temperature difference is the primary source of exergy damage to cryogenic heat exchanger. In LNG cryogenic heat exchangers, it is possible to optimize refrigerant composition, flow rate, as well as operating pressure to keep such discrepancies to a minimum. Different liquefaction processes entail different energy consumption equipment, operating characteristics, and investment. Many scholars have reviewed the basic theories of various NG liquefaction technologies and working principles, combined with different refrigeration cycle features, and developed a variety of NG liquefaction processes [2].
In line with available types of refrigeration cycles and devices, these processes are divided into three categories: cascade liquefaction process, expander liquefaction process and mixed refrigerant liquefaction process. Cascade liquefaction process normally includes three refrigeration cycles, where the temperature level of each cycle is different. Pure propane, ethylene, and methane are generally used as refrigerants. There is only a single refrigerant cycle composed of light hydrocarbon mixture in the mixed refrigerant liquefaction process. And pure nitrogen or methane is generally used as the refrigerant in the expander liquefaction process. These refrigerants can reach the low temperature required for single-loop LNG, but their efficiency is lower than that of cascade liquefaction process and mixed refrigerant liquefaction process [16]. The liquefaction processes used in practice are generally an improvement or a combination of these three types. Different NG liquefaction processes are used in different types of NG liquefaction units on the basis of their characteristics.
Natural gas liquefaction units according to the mode of production are classified as onshore and offshore production. Depending on the application, they can also be categorized as base-load type, peak-shaving type, and other small-scale liquefaction units. Different production methods and applications have different requirements for the liquefaction process as a result of the vastly diverse operating environments, production capacities and operating methods. In the early 1960s, the construction of NG liquefaction units mainly used mature cascade liquefaction process. In the 1970s, it switched to a greatly simplified mixed refrigerant liquefaction process. After the 1980s, the newly built and expanded base-load NG liquefaction units mainly adopted the propane pre-cooled mixed refrigerant liquefaction process proposed by APCI. The subsequent emergence of peak-shaving type liquefaction units, small-scale NG liquefaction units, offshore floating liquefied natural gas (FLNG) production storage, and offloading units, etc., have focused on all aspects of the requirements of NG liquefaction, constantly challenging the design and optimization of NG liquefaction processes.
Based on the literatures, it is found that most studies on LNG supply have focused on reducing energy consumption and improving economics, while few studies have also explored the safety of liquefaction process. Specifically, the key issues in the LNG supply chain can be divided into liquefaction process optimization, heavy hydrocarbons recovery, comparative analysis of refrigerant proportioning content, safety analysis of FLNG and LNG leakage, etc. Many review papers have discussed the development of NG liquefaction technologies, and have different review emphases [10,17]. For example, Eldemerdash et al. [18] undertook a large-scale analysis of the operating parameters, while Ríos-Mercado et al. [19] reviewed the transportation system of NG. Chang et al. [20] mainly focused on how to improve the structural efficiency of refrigeration cycles in NG liquefaction technology. Similarly, Lim et al. [2] focused on the commercial refrigeration cycles in the LNG process. Some reviews have summarized only one type of LNG process, such as the mixed refrigerant liquefaction process [7,19] or FLNG technology [10]. Khan et al. [21] reclassified and summarized the LNG process in detail, but they did not appreciate the application difference of liquefaction process between onshore and offshore nor consider their different optimization standards. Mazyan et al. [13] also summarized emerging technologies that improve the efficiency of liquefaction and regasification process, such as solar energy, NG solidification, thermoacoustic. In recent years, Zhang et al. [16] performed an in-depth analysis of the current status of different types of LNG processes in their review, but the significance of LNG technology optimization was not discussed from the source.
This review will systematically introduce the main forms and latest results of NG liquefaction process, summarize research progress, and analyze the challenges faced by its design and optimization and future research directions. As is known, the liquefaction temperature and pressure have a major impact on the liquefaction process structure, so NG liquefaction process is reviewed from two viewpoints: conventional liquefaction process and pressurized liquefaction process. In Section 2, conventional liquefaction process is reviewed according to the types of cascade liquefaction process, expansion liquefaction process and mixed refrigerant liquefaction process. The recent development of the pressurized liquefaction process and its application outlook are shown in Section 3. Section 4 analyzes current status of LNG process and proposes reasonable suggestions and future research prospects. Some important conclusions are summarized for helping designers in the LNG industry make better decisions, so as to facilitate further optimization and research regarding the LNG process.
2. Conventional Liquefied Natural Gas Process
2.1. Cascade Liquefaction Process
Cascade liquefaction process is an earlier type of NG liquefaction process. As early as the 1960s, cascade liquefaction process had reached mature technical standards and was extensively applied in the area of natural gas liquefaction. A typical cascade refrigeration cycle contains three refrigeration cycles with different refrigerants. Three refrigeration cycles are connected in series, in which refrigerants are methane, ethylene, or ethane and propane, respectively [22]. In cascade liquefaction process, the first stage (propane refrigeration cycle) provides the cooling capacity for methane, ethylene (or ethane), and NG. The second stage (ethylene or ethane refrigeration cycle) provides the cooling capacity for methane and NG. The third stage (methane refrigeration cycle) provides cooling capacity for NG. Finally, NG is gradually cooled, liquefied, and stored in an LNG storage tank.
After a long operational time, cascade liquefaction process becomes relatively stable where the interactions among three cycles are relatively small, so it is mature and reliable. However, conventional cascade liquefaction process generally consists of a three-stage refrigeration cycle, which increases the complexity of process structure. It not only requires high-cost equipment investment in the initial stage, but also requires more cumbersome maintenance studies [23]. Therefore, many scholars have opted for its optimization by reducing one stage of the refrigeration cycle, changing the circulating refrigerant, or integrating cascade liquefaction process with other processes to reduce the cost.
2.1.1. Cascade Liquefaction Process with Hydrocarbon-Based Pure Refrigerants
Cascade liquefaction process is mainly used in base-load type NG liquefaction plants [24]. The initial base-load type optimized cascade liquefaction process was developed by Philips Petroleum Company in the 1960s and the early version of this liquefaction process was adopted for the first time at the Kenai plant, Alaska, USA [25]. The refrigerants used were propane, ethylene, and methane. There is never a need for a pure refrigerant component ratio and the independent circulation system guarantees operational stability. Over the years, Phillips had made many improvements to the optimized cascade liquefaction process. The most important aspect is to change the closed cycle of methane into an open cycle, thereby eliminating the need of a separate gas compressor. In addition, the steam generated by the steam-storing tanker was recovered and fed back to the liquefaction unit for reliquefaction, so as to increase the LNG production. Finally, the twin-shaft gas turbine/compressor was replaced with a single-shaft gas turbine/compressor, as shown in Figure 4. The improved process made full use of the cooling capacity of boiled off gas (BOG) and adopted special structure to obtain LNG with higher purity of methane [25]. The successful operation history in the past 40 years has proven that Phillips optimized cascade LNG process is a reliable, flexible, and cost-effective technology. The capacity of liquefaction production line has also expanded from 1.2 million metric tons to 3.5 million metric tons per year. Through the transformation of the lowest temperature area of methane cycle, a part of LNG is mixed with methane at the lowest temperature, giving a mixed refrigerant with methane as main component for liquefaction process. This makes it possible to apply the process to a liquefaction production line with the capacity of about 5 million metric tons [26]. At the same time, the research has shown that the usage of expanders replacing Joule-Thomson (JT) valves for the methane cycle may further enhance the performance of the liquefaction process [27].
In order to improve specific power and coefficient of performance (COP) of cascade LNG process, two-stage compression with an intercooler is adopted to make refrigerant from the condenser evaporate in the intercooler after being expanded [28,29]. Then, through rational optimization, the productivity efficiency of the improved process [30] was 25.93% below that of the fundamental process and the COP was 21.64% higher than that of the fundamental process [31]. Yoon et al. [29] applied a liquid-gas heat exchanger between two cycles, as shown in Figure 5: in the ethylene cycle, the subcooled liquid refrigerant is bypassed through the intercooler while the refrigerant coming off the outlet of the high-pressure compressor in the methane cycle exchanged heat in the liquid-gas heat exchanger to liquefy the methane. The modified process has demonstrated positive performance with an increase in COP of approximately 13.9%, a reduction in electricity consumption of approximately 11.44%, and an increase in production of approximately 1.68% for the LNG.
2.1.2. Cascade Liquefaction Process with Other Pure Refrigerants
Conventional cascade liquefaction process uses hydrocarbons as refrigerants. Hydrocarbons have zero ozone depletion potential and sufficient cooling capacity. However, they are prone to safety problems due to their flammability [32]. On a special note, for instance, FLNG require the considerable minimization of combustibles inventory. With the increasing demand for inhalation safety and small storage tanks, there are more and more studies on the liquefaction process of refrigerants containing non-combustible substances [33]. Nitrogen is the most frequently used refrigerant. The typical approach is to combine nitrogen with hydrocarbon refrigerants [34] or non-combustible oxides [35,36,37], such as N2O and CO2. In the trans-critical cycle, the temperature slip of CO2 above the critical point can better match the temperature slip of heat source. However, if the working range is limited to the subcritical region, N2O is more suitable for being utilized as working fluid in condenser. A cascade process of N2O-N2O-N2 refrigerants is shown in Figure 6 [37]. In this process, both the pre-cooling section and the condensation section use N2O cycles, and the sub-cooling section uses N2 refrigerant. Compared with the conventional cascade liquefaction process with hydrocarbons, N2 refrigerant with the lowest temperature only circulates to the former refrigeration cycle of condensation unit, while the methane refrigerant needs to return to the pre-cooling unit in the conventional process.
2.1.3. Cascade Liquefaction Process with Mixed Refrigerants
Although the refrigerant ratio does not need to be considered in cascade liquefaction process with pure component refrigerant, the process has strict requirements on the refrigerant purity. The purity (volume fraction) of ethylene and propane should be at least 99% [38]. In addition, the process is not suitable for NG liquefaction systems with more nitrogen, so it is less used now. Since the 1990s, cascade liquefaction processes with mixed refrigerants have become more complete and are able to be cascaded more efficiently than pure component refrigerant under the same stage number. In 2006, a mixed fluid cascade (MFC) process developed by Linde and Statoil was successfully implemented at the Snohvit LNG project in Norway [39]. This process used three mixed refrigerants to replace three pure component refrigerants for providing cooling capacity in pre-cooling, liquefaction and sub-cooling cycles. Although the MFC process is complex, compared with other NG liquefaction processes, it has higher thermodynamic efficiency, lower energy consumption, and higher exergy efficiency [40]. A typical MFC process is shown in Figure 7 [39]. Here, two multi-stream heat exchangers were used, one for pre-cooling of the feed gas and the other for liquefaction and sub-cooling of the second and third cycles.
Although MFC process has a higher COP than other processes [40], from a thermodynamic aspect, it is nonetheless well short of the maximum attainable energy efficiency due to the complicated and highly nonlinear thermodynamic interaction among design variables, constraint conditions (close to the temperature in the multi-stream heat exchanger) and energy efficiency [41]. As the first stage of the process, the pre-cooling cycle is not only used for cooling NG, but also for cooling the refrigerants of subsequent cycles. So, increasing the stage number in the pre-cooling cycle has an obvious improvement effect on the efficiency. Studies have shown that the pre-cooling cycle with two or three pressure stages can improve the heat transfer performance and significantly reduce the heat load of the process [42], but the ambient temperature also has a great influence on the pre-cooling cycle [43,44]. As shown in Figure 8, through their research, Castillo et al. found that the three-stage propane pre-cooling cycle had the highest energy efficiency, they discussed the major differences concerning technical behavior between the options of pure component or mixed refrigerant configurations in the pre-cooling cycle of the MFC process. As far as energy efficiency was concerned, the three-stage propane configuration was better than the two-stage mixed refrigerant (C2/C3) configuration in both warm and cold climates. The choice of a three-stage propane cycle represents the most optimal selection of UA values. Even though the MFC has a higher power consumption, it is still the preferred choice in cold climates. In warmer climates, C3-MFC, however, is more recommended. The main reason for this is the smaller power contribution of the pre-cooling cycle in this process (Figure 8b,c) which has a lower capital cost compared to other process equipment [45]. In addition, the MFC process is considered as the highest energy-saving process available for use in LNG plants [45,46], and using it as a reference point, the performance of pure component cascade process improves as stages are added for three different cases T0 = 10.0 °C, T0 = 20.0 °C and T0 = 30.0 °C. Figure 9 shows that for the cascade liquefaction process with pure component refrigerant, approximately 11 compressors stages are required to be equivalent to the energy efficiency of conventional MFC process with three mixed refrigerants [47], but this creates the problems of complex equipment and higher fixed costs.
Cascade liquefaction process with three cycles of mixed refrigerants has great potential for large-scale LNG production, but also consumes a lot of energy. Whereas the cooling cycle number can enhance the thermal efficiency of the process, it increases both the number and cost of components. Therefore, to address this issue, an integrated-design process is proposed to integrate MFC process with the recovery of natural gas condensate [48]. The integration of the process does not need a reboiler and condenser, reducing the power required for the refrigeration system. On this basis, the addition of a nitrogen rejection unit eliminates the negative impact of nitrogen on the heating value of the fuel [44]. As shown in Figure 10, MFC-NGL-NRU uses a de-ethanizer with multiple side streams, and its top outlet is used as a low-temperature stream to pre-cool the system inlet feed. And the mixed refrigerant cycle in it provides the required cooling energy for natural gas liquefaction and nitrogen rejection units [49]. If the pre-cooling compression refrigeration cycle is replaced by an absorption refrigeration cycle (ARC), it can provide the possibility for the system to use the waste heat for cooling, which can further reduce the required energy consumption [50,51,52]. Figure 11 shows the schematic diagram of NH3/H2O ARC [50]. Ammonia, as a refrigerant, is evaporated by the evaporator and then enters the absorber to be absorbed by the liquid. The evaporated refrigerant is condensed in the condenser, and the required cooling load is provided by cooling water or ambient air. The required heat load to separate ammonia and water is provided by the waste heat.
2.2. Expansion Liquefaction Process
Expansion liquefaction process for natural gas is realized by reverse-Brayton cycle refrigeration using an expander for adiabatic expansion. The gas does work in the expander, thus achieving the cooling purpose. The output work of the expander is available for driving the compressor during the liquefaction process for energy-saving purposes. Refrigerants, such as nitrogen or NG, can be used as the expansion working fluid, among which nitrogen or methane is the most widely used as the main refrigerant for the expansion cycle. The expansion liquefaction process has a simple process, easy start-stop, compact structure and other advantages. However, it has higher energy consumption and is used more in small and medium-sized LNG plants. Since the 1980s, with the continuous development of application backgrounds, such as FLNG and skid-mounted liquefaction units, expansion liquefaction process has attracted much more attention. Many researchers have carried out multi-dimensional studies and explorations of the basic process of the expansion liquefaction process, including the optimization, new process configurations, new-type refrigerants, and so on.
2.2.1. Single Nitrogen Expansion Liquefaction Process
Single nitrogen expansion liquefaction process is a basic expansion liquefaction process, with only one refrigerant cycle for feed gas liquefaction, as shown in Figure 12. As a refrigerant, nitrogen goes through compressor, cooler, and first-stage heat exchanger, successively cooling to reach the required pressure and temperature before expansion. Then, it is cooled down by doing work in the expander to provide cooling capacity for each heat exchanger and complete the refrigerant cycle. NG is gradually cooled down using the cooling capacity provided by nitrogen expansion, where the required LNG product is obtained after throttling [53]. Based on the basic process configuration, the single nitrogen expansion liquefaction process can also be used for methane liquefaction [54] and BOG re-liquefaction [55,56], by adding feed gas treatment equipment before the main heat exchanger and adjusting the configuration of refrigerant circulation compressor and cooler, as shown in Figure 13 and Figure 14.
The pressure ratio of refrigerant in single nitrogen expansion cycle is given according to the temperature drop required before and after the expander. Since all refrigerants need to be expanded at the expander at once for a minimum temperature, the refrigerant pressure ratio increases, resulting in a considerable rise in the irreversibility of the heat exchanger and an increased compression energy requirement. This is the reason for a higher than the desired setting of the heat transfer temperature difference and the heat transfer drive. Such irreversibility is expressed in the form of clearance between the hot and cold composite curves [57]. In single nitrogen expansion cycle, irreversible loss increases with the decrease of the overall operating pressure, and a higher nitrogen flow rate will increase the irreversibility and compression work of the process. To reduce power consumption, the optimal design shall shift towards lower refrigerant flow rates and higher pressure ratios in order to find the optimum nitrogen flow rate for the working differential pressure [53,57].
2.2.2. Dual Nitrogen Expansion Liquefaction Process
In order to solve the problem of largely irreversible loss caused by single nitrogen expansion liquefaction process, dual expanders can be set to cool and condense NG under small temperature difference [58]. Dual expanders are set in a series, achieving cryogenic with low power consumption [59]. Dual expanders are set in parallel increasing refrigerant cycles, so as to realize nitrogen expansion at different temperature or different pressure levels [60]. Schematic diagram of dual nitrogen expansion process is shown in Figure 15. It is clearly seen that the first cycle of nitrogen adopts the operation mode of small pressure drop and large flow rate for NG pre-cooling and further cooling part of nitrogen, while the second cycle adopts the operation mode of large pressure drop and small flow rate for NG sub-cooling. Two expansion cycles ensure different pressure ratios through different configurations of compressors and coolers, meeting the cooling capacity demand in different stages of the NG liquefaction process respectively, and obtain a heat transfer temperature difference and heat transfer driving force closing to what is needed, effectively reducing irreversible loss [57]. Similarly, the split fraction of the nitrogen gas (stream 11 and stream 11’) expanded to low and high pressure is an essential design variable due to the additional expander introduced. Nitrogen split ratio has an important impact on compression energy demand and energy consumption distribution, as shown in Figure 16 and Figure 17, and the most favorable nitrogen split ratio makes the process more energy-saving [57].
The same conceptual design of parallel nitrogen expansion liquefaction process is applied for small-scale LNG plant in skid-mount packages, as shown in Figure 18. After two-stage compression and cooling, nitrogen is divided into two parts, which are respectively matched with suitable compressors and water coolers, pressurized to the same pressure at various flow rates before being mixed. After cooling by the first heat exchanger, the mainstream nitrogen expands and cools down directly, and the secondary nitrogen expands to a lower temperature after cooling by the second heat exchanger. This provides cooling capacity for the second heat exchanger and then merges with the mainstream nitrogen to provide cooling capacity for these two heat exchangers. The pressurized water-cooled natural gas enters the first heat exchanger and is cooled to approximately −60 °C, and liquefied petroleum gas (LPG) is separated in the separator. The gas is further cooled and passed through a throttling process to obtain LNG. BOG returns to heat exchanger so as to recover its cold energy. A set of compression system is adopted for nitrogen in the whole process, and two parallel expansion cycles are set. The parallel nitrogen expansion cycle can distribute cold energy to HEX-1 and HEX-2 by adjusting flow rate. The temperature difference from hot end to cold end in each heat exchanger is more uniform, and the temperature gradient between hot and cold composite curves is small, which improves the exergy efficiency [61].
The introduction of new expander makes the design of dual expansion cycle more flexible and diverse. The position changes of separator and mixed gas is a configurational change, and the introduction of new heat flux in heat exchanger is a function change. Different combinations can produce a variety of structural design schemes, as shown in Figure 19. By systematically screening various configuration schemes of dual expansion process and assessing their technical and economic impact in an overall manner, the genetic algorithm (GA) is used to optimize the process variables. The dual expansion process of BOG re-liquefication for an LNG ship optimized by Hyunsoo Son et al. improved energy efficiency by 23% against the single expansion process [55].
2.2.3. Triple Nitrogen Expansion Liquefaction Process
Based on dual nitrogen expansion liquefaction process, triple nitrogen expansion liquefaction process is constructed by introducing an intermediate expansion stage, thus being divided into triple cycles of warm expansion, intermediate expansion, and cold expansion in line with different temperature and pressures of each expansion stage where the introduction of an intermediate expander helps to improve the overall liquefaction efficiency. It is more thermally efficient and has a reduced power requirement compared to the dual expansion cycle. In addition, under the same condition, triple nitrogen expansion liquefaction process can increase productivity by 5%, while the total capital expenditure only increases by 1.4% [62].
2.2.4. Expansion Liquefaction Process with Natural Gas and Nitrogen
In expansion liquefaction process, expander can not only be configured in the refrigerant cycle for refrigerant cooling, but also be directly configured in the NG path as required, as shown in Figure 20. After passing through demethanizer, NG is directly cooled by expander, and then liquefied and sub-cooled in LNG cryogenic heat exchanger, before being depressurized and stored by cryogenic turbine. After four stages of compression and cooling, nitrogen enters the regenerator for further cooling and expands in the nitrogen expander to obtain sufficiently low-temperature energy for NG sub-cooling and self-cooling recovery, thus realizing a complete self-cooling recovery cycle. This process can realize the offshore co-production of LNG, liquefied petroleum gas (LPG) and n-pentane. The nitrogen cycle realizes self-regenerative expansion, where energy consumption is 80% lower than that of the existing single nitrogen expansion process [63].
2.2.5. Nitrogen Expansion Liquefaction Process with Pre-Cooling
Adding a pre-cooling cycle to the expansion cycle is an efficacious way of increasing the energy efficiency of the nitrogen expander liquefaction process [64,65]. Nitrogen expander liquefaction process with pre-cooling adopts two independent refrigerant cycles as shown in Figure 21. Propane is used for pre-cooling after compression and cooling, and the nitrogen expansion cycle is used for NG cooling and sub-cooling. The propane pre-cooling cycle can pre-cool NG at a lower evaporation temperature and relatively low pressure, thus reducing nitrogen liquefaction and sub-cooling load. This results in a reduced flow of nitrogen in the main cooling cycle, thereby reducing the energy consumption of nitrogen compressor and improving the liquefaction capacity throughout the process [66,67,68].
In addition to the widespread use of propane as a pre-cooling refrigerant, ammonia [69], propylene [70] and many other refrigerants are also suitable for the pre-cooling cycle of natural gas liquefaction. Single nitrogen expansion process with ammonia absorption pre-cooling (SNA) is shown in Figure 22. Ammonia absorption refrigeration is a vapor refrigeration process, which uses a pump instead of conventional compressor, thus greatly reducing the compression work [71,72]. The power required for this cycle is provided by low-pressure vapor generated from the exhaust waste heat of the turbine with a coefficient of performance (ratio of required cooling load to waste heat) of 0.485. If the waste heat required to absorb the pre-cooling cycle is less than the power required by the turbine compressor, the process requires no additional heat input and is self-sufficient [50,73]. Although the ammonia absorption pre-cooling cycle requires extra exergy supply, the exergy efficiency of the pre-cooling process is still higher than that of the non-pre-cooling process, which not only reduces energy consumption by 26–35%, but also reduces production cost by 13–17%. This is a promising improvement direction for energy saving and consumption reduction of the small-scale expansion liquefaction process [69].
Generally, the pre-cooling temperature of a single refrigerant is limited. For increased pre-cooling depth, mixed refrigerants can be used for the pre-cooling cycle, as shown in Figure 23. The mixed refrigerant is composed of multi-component hydrocarbons and uses liquid-vapor phase change to provide sufficient pre-cooling capacity. The process can achieve complete pre-cooling or even complete LNG as needed (liquefaction temperature of approx. −85 °C if not depressurized). The significant increase in pre-cooling depth greatly reduces the amount of nitrogen circulation, reduces the energy consumption of nitrogen expansion, improves the liquefaction performance of the whole process, and facilitates the equipment selection [74].
The above pre-cooled refrigerants are flammable or toxic, and their application occasions are limited by safety. More stable refrigerants, such as R410a [75] and CO2 [76], have great safety advantages when used on special occasions such as offshore. R410A is non-toxic, non-flammable and non-explosive, and has a lower dew point than propane, thus providing more cooling capacity for the expansion cycle in the higher temperature range [75]. Under the same liquefaction conditions, the R410a pre-cooling nitrogen expansion liquefaction process shows better performance in terms of energy consumption per unit and thermodynamic efficiency. In addition, the nitrogen expansion liquefaction process with propane pre-cooling also has lower energy consumption per unit compared to processes without pre-cooling cycles [17].
Compared with other refrigerants such as hydrocarbons, CO2 not only has outstanding safety performance due to its non-toxic and non-flammable characteristics, but is also more environmentally friendly, convenient to obtain, and low in price, which is conducive to reducing project costs. The CO2 pre-cooling nitrogen expansion liquefaction process consumes far less energy per unit than the N2-CH4 expansion liquefaction process, which has a comparable critical equipment structure and does not require refrigerant preparation. This greatly simplifies the process operation (the processing unit is compact) and the operation becomes safe [77]. On the basis of single nitrogen expansion liquefaction process with CO2 pre-cooling, a CO2 expander is used to replace Joule-Thomson (JT) valve in the general pre-cooling cycle, leading to an optimized process combining CO2 pre-cooling expansion and single nitrogen expansion. Under similar conditions of feed gas temperature and initial pressure, the cooling and heating load curves in heat exchanger of the optimized process are closer to each other, and the power demand is reduced compared to single nitrogen expander liquefaction process with CO2 pre-cooling [78]. In addition, two refrigerants in nitrogen expander liquefaction process with CO2 pre-cooling are less affected by sloshing, as the refrigeration system does not have hydrocarbon gas storage. The process is not sensitive to the composition, temperature, pressure, and other conditions of feed gas and has high adaptability to the environment and gas source [79,80,81].
2.2.6. Expansion Liquefaction Process with Other Refrigerants
Nitrogen, the main refrigerant in expansion and liquefaction process, has a lower boiling point and is more likely to meet the requirements of cryogenic heat transfer. However, due to the low temperature of nitrogen after expansion, it is easy to cause more irreversible loss in the pre-cooling and cooling heat exchanges. At the same time, the increased nitrogen flow will also increase the compressor power consumption. Using a refrigerant with a higher boiling point and higher specific heat to participate in LNG process enables the heat transfer temperature difference to be effectively decreased and the energy consumption of the liquefaction process to be reduced.
The basic structure of dual expansion liquefaction process with methane and nitrogen refrigerants is similar to that of dual nitrogen expansion liquefaction process. However, in thermal expansion zone, methane has a better heat exchange capacity than nitrogen, which can meet the needs of NG pre-cooling and cooling process with a lower flow rate, and effectively improve the cycle efficiency [82,83]. On this basis, the liquefaction efficiency can be increased by 8–13% by adding a methane expansion cycle [84]. The output of NG also increases proportionally with the improvement of the cycle efficiency [82,84].
At standard conditions, the specific heat (Cp) at a constant pressure of methane is about twice that of nitrogen (2.236 kJ/kg °C for methane and 1.041 kJ/kg °C for nitrogen). Mixing methane with nitrogen will directly change the properties of new refrigerant. Methane with a higher boiling point is beneficial for meeting the demand of liquefaction rate with lower energy consumption, while giving play to the higher specific refrigeration effect of methane and the advantage that nitrogen is easy to cool down due to its lower expansion rate [85]. Figure 24 shows the variation of Cp and Cp/Cv under different methane mole fractions in N2-CH4 mixed refrigerant. With the increase of methane concentration, the Cp of mixed refrigerant increases and the specific heat ratio (k = Cp/Cv) decreases. The use of optimized refrigerant ratios over a certain pressure and temperature scale helps to decrease energy consumption during the expansion liquefaction process [86,87,88]. Cao et al. [89] analyzed two typically liquefaction processes in a small LNG plant and found that the N2-CH4 expander cycle took precedence over the mixed refrigerant liquefaction cycle in the absence of propane pre-cooling. Moein et al. [87] investigated the effect of methane addition on the nitrogen expander cycle and showed that when the concentration of methane in the mixed refrigerant was 26 ± 1%, the network required by the liquefaction process is the minimum, as there is an 8% reduction as compared to the liquefaction process with pure nitrogen. Ding et al. [90] studied the changing trend of specific power consumption under different proportions of refrigerants N2 and CH4. It was shown that with the increase of N2 content, the specific power consumption first decreased and then increased, where the higher the liquefaction rate, the larger the proportion of N2 in the optimal refrigerant ratio. After the composition optimization of expander liquefaction process with propane pre-cooling, compared with conventional nitrogen expander liquefaction process, 22.7% power consumption could be saved. Moreover, it saves 4.06% power consumption compared to nitrogen expander process with propane pre-cooling. He et al. [91] designed N2-CH4 expander liquefaction process with propane pre-cooling that also took ethane recovery into account by adding ethane separation and distillation module, as shown in Figure 25, and compared it with a similar dual nitrogen expander liquefaction process and dual nitrogen expander liquefaction process with propane pre-cooling. The results indicated this process had the highest (fire use) efficiency, the least specific energy consumption, the best suitability for the ethane content of the feed gas, and an ethane recovery rate higher than 99.5%.
Using C3H8-N2 mixed refrigerant instead of nitrogen in expansion liquefaction process can also produce energy-saving effects. Compared with methane, propane has a higher boiling point and is more suitable for the heat exchange demand in the high-temperature section. It can play an important role in overcoming the entropy increase in main cryogenic heat exchanger and reducing the temperature gradient in the main heat exchanger. Since the critical temperature and pressure of propane are higher than that of nitrogen, the mixed refrigerant presents gas-liquid two phase during the whole liquefaction process. In order to deal with two-phase C3N mixed refrigerant, a two-phase expander needs to be used to replace conventional Joule Thomson (JT) valve, as shown in Figure 26. The process delivers 46.4% energy savings compared to the conventional single nitrogen expansion liquefaction process at a mixed refrigerant mass flow rate of 27.7% [92]. On this basis, Qyyum et al. [93] designed the C3N two-phase dual expansion liquefaction process by referring to the characteristics of dual nitrogen expansion liquefaction process, as shown in Figure 27. Considering the relationship between inlet pressure of NG and the performance parameters of LNG process, it was optional to choose whether or not to set the inlet booster. The results showed that compared with conventional dual nitrogen expansion liquefaction process, the C3N two-phase dual expansion liquefaction process without an inlet booster and with an inlet booster can save 29.8% and 39.4% energy, respectively. Meanwhile, the cost analysis showed that the C3N two-phase dual expansion liquefaction process could save 36.6% of the operating costs and 16.5% of the total annual costs.
In expansion liquefaction processes with other refrigerants, nitrogen is partially or completely replaced by adopting higher boiling point refrigerants to obtain a better liquefaction performance. On the one hand, it reduces the energy consumption gap between expansion liquefaction process and mixed refrigerants liquefaction process. On the other hand, it maintains the advantages of expansion liquefaction process, such as a relatively simple structure, short start-up time and easy control, and improves the advantages of expansion liquefaction process [94].
2.3. Mixed Refrigerant Liquefaction Process
Mixed refrigerant liquefaction process is one of the more frequently used liquefaction processes for NG. This type of process adopts a multi-component mixed refrigerant (MR) to replace multiple pure component refrigerants. It has the advantages of less unit equipment, simple process and low corresponding investment, which has used extensively in onshore small-scale liquefied natural gas plants, medium-scale liquefied natural gas plants, peak-shaving type liquefied natural gas plants and large-scale liquefied natural gas plants. During the operation of mixed refrigerant liquefaction process, apart from the design structure of the process itself, key parameters such as the properties of feed gas, the parameters of mixed refrigerant cycle and the compositions of mixed refrigerant also have an influential effect on the process performance. Consequently, many scholars devote themselves to the design and optimization of new mixed refrigerant liquefaction processes in order to improve process performance while reducing energy consumption. According to the mixed refrigerant classification, the mixed refrigerant cycle can be divided into single mixed refrigerant liquefaction process (SMR), dual mixed refrigerant liquefaction process (DMR) and mixed refrigerant liquefaction process with propane pre-cooling (C3MR). In the following, we would like to present the progress of research concerning mixed refrigerant liquefaction processes based on these three processes.
2.3.1. Single Mixed Refrigerant Liquefaction Process (SMR)
Single mixed refrigerant process was used early in three production lines of Skikda, an Algerian liquefaction unit, and was first operational in 1981. Now, the process has been used in more than 20 LNG plants around the world [95]. A representative SMR process can be seen in Figure 28 [96]. In the SMR process, LNG is obtained using mixed refrigerant at the temperature of approximately −160 °C. MR is compressed and cooled by compressors and air coolers, and then enters the heat exchanger to cool down. After that, MR is throttled to cool down by Joule-Thomson valve, and then the vaporization heat of NG is used to evaporate in the heat exchanger to complete the cycle. The single mixed refrigerant liquefaction process has various specific forms, among which the most applied is single-cycle single-pressure mixed refrigerant refrigeration technology (Poly Refrigerant Integrated Cycle Operation referred to as PRICO) developed by Black & Veatch, USA. A flow sheet of the process is shown in Figure 29 [97]. The mixed refrigerant used in the refrigeration cycle consists of nitrogen, methane, ethane, propane, and iso-pentane, with cooling and liquefaction taking place in a cold box [98].
SMR process can effectively reduce the initial investment due to its advantages of compact structure, lightweight and less process equipment. The annual output of LNG is generally within 2 MTPA [99,100], which is applicable to small-scale LNG plant. Since it is modular in nature, easily expandable and conducive to equipment skid-mounting, making SMR highly favored for offshore applications, with over 30% lower power consumption than expansion cycles [101]. Based on the PRICO process, Beijing Black & Veatch company [102] has applied a modular design to the equipment layout of FLNG unit and improved some key equipment for the offshore operating environment to develop the world’s first FLNG unit based on this process, i.e., Exmar FLNG. However, since SMR process must handle all liquefaction tasks in one loop, considering the structure and process, it may bring some other problems to FLNG [103]. Although some scholars believe that SMR is a process suitable for FLNG with low risk, they have not performed a specific evaluation [104,105], or only studied the risk of single process for production [106]. However, as the production rates increase, small-capacity SMR sometimes can no longer meet the requirements of the production process. In order to increase output, multiple sets of process structures with parallel arrangements of small-capacity modules are used [107]. The rise in the number of units will add to the potential risk of leakage, which is not obvious in the conceptual design or basic design stage but will become a potential factor of design change after quantitative risk evaluation. You et al. [108] used the explosion risk analysis method. Through quantitative analysis, it was found that the frequency of accidents increased as the number of SMR units increased. Offshore SMR is more suitable for a single set of production situations and additional safety strategies should be considered when SMR is used for large-capacity FLNG production facilities.
Because the equipment required in the SMR process is simple, the control links in the process are also the lowest. Therefore, changes in the composition, pressure, and flow rate of feed gas will cause changes in the cooling capacity of the system. If the parameters of refrigeration system remain unchanged and there is a mismatch between refrigeration capacity and actual demand, it is uneconomical to operate the system when the refrigeration capacity is excessive, and when the refrigeration capacity is insufficient, the sub-cooling of LNG decreases and vapor is generated after throttling. Although some studies have shown that SMR is fully capable of adapting to changes in external conditions through self-regulation [109], some other investigations have tried to add control strategies into the process. Taking the PRICO process as an example, Jensen and Skogestad [110] found that unrestrained degrees of freedom allowed for self-optimization control through (non) linear analysis of operation modes, self-optimization control, and controlled variables, etc. to minimize the losses of natural gas liquefaction when disturbed, and proposed a control structure (as shown in Figure 30).
Compared with onshore, the dynamic environment in which offshore liquefaction units are located makes it difficult to ensure the economic efficiency of SMR process. Husnil and Yeo et al. [111] based on the work of Lee et al. [112] developed a new liquefaction technology, namely the MSMR process, as shown in Figure 31. While retaining the simple and compact characteristics of SMR unit, the mixed refrigerant is divided into heavy hydrocarbon and light hydrocarbon, which are compressed and remixed respectively in the cycle. LNG production will also be combined with NGL recovery. As shown in Figure 32, by controlling the flow ratio (HK/LK) of mixed heavy and light working fluids to control the cycle, the economic benefits of MSMR process are maintained offshore. This enables the process to maintain the optimality of MSMR process even under off-design operating conditions or in the presence of interference, i.e., the stability of the process parameters is maintained within a certain range.
Most studies optimize mixed refrigerant liquefaction process under the condition of fixed feed gas. However, in addition to the problems caused by environmental disturbances, various uncertainties existing in actual natural gas wells should be also considered, such as the reduction of feed gas due to gas wells’ failure. In response to the uncertainty brought by feed gas, Lee and An et al. [113] proposed an optimization frame diagram, as shown in Figure 33, combing different production rates of LNG. The optimization results showed the proposed design method to be more beneficial in terms of cost when the desired discrepancy of minimum and maximum productivity is high and low productivity persists for a longer period of time.
Liquefying 1 kg of NG requires about 1188 kJ of energy, so LNG plants are a major energy consumer [114]. As a result, many academics have continued proposing process enhancements for enhancing the energy efficiency of LNG plants. Compared to DMR and C3MR, SMR has the greatest power consumption and the least heat transfer efficiency for the same conditions of gas source, liquefaction capacity, storage form, compressor efficiency and heat loss of cold box. In the SMR process, the main energy-demand part is the shaft work of compressor, mainly depending on the temperature difference between cold and hot fluids in the heat exchanger [15], i.e., reducing the heat transfer temperature difference in the low-temperature section is the essential part of the process optimization. A slight improvement in the efficiency of liquefaction line, which typically accounts for about half of the operating costs of an LNG plant [115], would improve the worldwide competitiveness of the process and bring significant cost and energy benefits. Therefore, more studies should focus on how to improve the heat transfer efficiency and optimize SMR process with compressor power consumption as the objective function.
Exergetic analysis of SMR process divided exergy destruction between endogenous/exogenous and avoidable/unavoidable. Exergy loss in compressor and multi-stream heat exchanger is higher than the rest of the parts. And compressor has the greatest potential for improvement [116,117]. The conventional SMR process is generally single-stage compression and single-stage throttling process, which can easily cause compressor to be far away from isothermal compression conditions and the compression heat generation is not utilized, so as to increase exergy loss. The use of multi-stage compression and multi-stage cooling can effectively reduce the outlet temperature of compressor and the heat transfer temperature difference of after-cooler [118,119,120]. Therefore, numerous scholars have transformed the process into three-stage compression and three-stage throttling process, which improves the adiabatic efficiency of compression process, makes the refrigerant distribution more reasonable, and realizes the coordinated control of various parameters at three-stage inlet of refrigerant compressor [121,122]. However, Tak et al. [123] found that adding pumps can reduce specific power consumption more effectively than adding compressors.
In addition to adding compressors in the mixed refrigerant cycle, pressurizing the inlet of feed gas is also an effective optimization method to avoid the problem of low heat transfer efficiency in subsequent heat exchangers [124]. In addition, the Joule-Thompson (JT) expansion valve, which is often used in the process, is also a cause of energy consumption. The expansion process of the JT valve essentially consists of an isoenthalpy process, so it has the inherent limitation of low expansion efficiency. Instead, a more common optimization approach is to replace the JT valve with a hydraulic turbine, which ensures that the process demonstrates better performance with respect to required energy and exergetic efficiency [125]. Moreover, HTs have the potential for integrated energy recovery, which can greatly improve the refrigeration effect and achieve the maximum benefits of optimization [126]. Qyyum et al. [127] comprehensively considered these optimization methods and introduced a separate mixed refrigerant self-recuperator on this basis (as shown in Figure 34), which further reduced the entropy generation and cost of the whole process.
The newly developed single mixed refrigerant liquefaction process (KSMR) in South Korea [128] is similar in principle to the MSMR process developed by Husnil and Yeo et al. [111], both of which are new variations upon the SMR process (as shown in Figure 35). The heavy hydrocarbon (HK) and light hydrocarbon (LK) in single mixed refrigerant are separately cooled in LNG heat exchangers. The HK pre-cools feed gas and heats HK refrigerant, while LK pre-cools warm LK and liquefies feed gas. After that, these two refrigerants are respectively compressed and then mixed together. Finally, they are compressed to a mid-pressured state when heavy components are separated in advance. LK and HK have the same vent pressures, but different expansion pressures. The separation and expansion of refrigerant at different pressures result in considerable savings in compression energy, which can be reduced additionally by optimizing the inlet pressure.
2.3.2. Mixed Refrigerant Liquefaction with Propane Pre-Cooling Process (C3MR)
According to the basic principle of refrigeration, the refrigeration cycle with pre-cooling is more efficient than that without pre-cooling. When the flow rate of feed gas increases, the single cycle with mixed refrigerant needs to provide more cooling capacity, that is, the flow rate of mixed refrigerant will increase significantly, making it difficult to match an appropriate compressor, which requires an additional pre-cooling cycle to share the cooling load. Therefore, the mixed refrigerant liquefaction process with propane pre-cooling emerges.
The mixed refrigerant liquefaction process with propane pre-cooling, referred to as C3MR process, is a mixed refrigerant liquefaction process consisting of two separate refrigerant cycles developed by Air Products & Chemicals, Inc. (APCI) [129]. Since the 1970s, this process has been extensively applied to base-load LNG units. C3MR process consists of a propane pre-cooling cycle and a mixed refrigerant cycle, in which the propane cycle meets the cooling demand of pre-cooler, cold box, and fractional unit, while the mixed refrigerant cycle meets the cooling demand of cryogenic tower. C3MR is among the most mature pre-cooled mixed refrigerant liquefaction processes. Moreover, in the currently built C3MR process unit, APCI occupies an absolutely dominant position. Figure 36 shows its typical process flow-sheet [130]. In this process, feed gas is sent to a gas desulfurizer to remove some of the impurities. Subsequently, feed gas is cooled to about −30 °C through pre-cooler and cold box. Condensate from this process is sent to a fractional unit for fractionation. The remaining gas is fed into cryogenic tower to be liquefied and cooled to below −160 °C, and finally, the LNG pressure is reduced to atmospheric pressure using an expansion valve. The components of mixed refrigerant used in this process vary depending on other conditions, but usually include nitrogen, methane, ethane, and propane.
The mixed refrigerant liquefaction process with propane pre-cooling incorporates the advantages of both the cascade liquefaction process and mixed refrigerant liquefaction process and is the most commonly used in all mixed refrigerant liquefaction processes now. Because the MR heat flow curve of mixed refrigerant liquefaction process with propane pre-cooling matches the condensation curve of feed gas, the refrigeration efficiency of the process is higher. C3MR process is highly adaptable, but the process flow-sheet is complex with many pieces of equipment and difficult for operation and control. Researchers have shown that, in the C3MR process, when the propane pre-cooling cycle adopts level control or serial control, the mixed refrigerant cycle adopts level control, and NG cycle adopts serial control, the system will have better stability and faster response speed [131]. Propane compressor adopts variable frequency speed regulation control method, which has better economic benefits [132]. Due to the high investment in high-power frequency converter, mixed refrigerant compressor usually does not adopt the control method of speed regulation by variable frequency [133,134,135,136]. At this stage, with the continuous development of C3MR operational control, the proportion integration differentiation (PID) controller is now commonly used for controlling the energy efficiency of C3MR process [137].
With increasing interest in the development of offshore natural gas liquefaction projects such as FLNG, it is likely that further optimization of C3MR process will be required [138,139]. If conventional liquefaction processes are used for offshore transportation vehicles such as FLNG, the process constraints are typically more stringent than those for onshore applications. It requires not only higher energy efficiency and a more compact structure and safety [111,112], but also robustness to process interference, which should be more strongly guaranteed in particular compared to onshore applications [111]. Various conditions due to marine meteorological conditions may make conventional controllers no longer applicable and lead to frequent deviations from the steady-state operation of FLNG. Shin et al. found that dynamic matrix control (DMC) is a multivariable controller that achieves more effective interference suppression and satisfies constraints. When operating within a safety margin of compressor surge line, it can improve the process efficiency [140] and solve this problem better.
Although the basic power consumption of C3MR process has been reduced considerably compared to the SMR process, according to literature reports, the specific power consumption of typical cascade liquefaction process is 0.33 kwh/kg (LNG), while C3MR process is 1.15 times higher [136], indicating that the energy consumption is still large. This requires optimizing C3MR process to save energy and reduce the operating cost of liquefaction plants [141]. Many methods can be used to enhance the energy efficiency of LNG plants, such as improving the efficiency of liquefaction cycle [142], improving the efficiency of compressors and drivers [143] and utilizing waste heat [144]. In terms of waste heat utilization, the sub-cooled propane after using the propane cycle condenser is the preferred solution to enhance the performance of propane cycle [144]. For the drive cycle configuration, three-stage turbine combined cycle is recommended, which can improve the energy efficiency of the cycle by 38% [143]. In addition, the use of an end-flash system can also improve a certain amount of exergy efficiency [142]. In terms of improving circulation efficiency, structural measures are common to improve circulation components such as expansion valves and heat exchangers. Reducing expansion loss is an important option for optimizing C3MR process. This can be achieved through the replacement of the J-T expansion valve with a gas expander, a two-phase expander, or a hydraulic turbine [130].
Although the refrigeration efficiency of C3MR process is generally higher, its performance decreases obviously in extremely cold regions. On the other hand, in order to break the bottleneck of single-line capacity (such as the working limit of compressors) and reduce the unit liquefaction cost, APCI developed AP-X™ process suitable for large-scale LNG based on original C3MR process, as shown in Figure 37 [145]. AP-X™ process consists of three refrigeration cycles: a propane pre-cooling cycle, a mixed refrigerant liquefaction cycle, and a nitrogen sub-cooling cycle. As the nitrogen expansion refrigeration cycle shares some of the cooling capacity for C3MR, propane and mixed refrigerant flows are reduced by 80% and 60% respectively. Besides increasing efficiency, using the nitrogen expansion cycle can also significantly increase production, allowing more NG to be liquefied if flow rates of propane and mixed refrigerant are maintained, achieving a single-line capacity breakthrough from 5MTPA to 8MTPA. Split MR process is another improvement on C3MR process, where the high-pressure stage of mixed refrigerant compressor is placed coaxially with pre-cooling compressor, enabling both turbines to have roughly the same load, thus maximizing the capacity of LNG liquefaction unit. Both Split MR and AP-X processes have improved liquefaction efficiency to varying degrees, reaching 41.8% and 42.2% respectively [146].
2.3.3. Dual Mixed Refrigerant Liquefaction Process (DMR)
In natural gas liquefaction industry, although C3MR process has been widely used, the propane pre-cooled cycle can only be cooled to around −35 °C, which is determined by its own physical properties. In the case of very low ambient temperature, it cannot share more load for the mixed refrigerant cycle and lacks adaptability to the environment. In order to overcome this shortcoming, the propane pre-cooled cycle can be changed into the mixed refrigerant precooled cycle, thus giving birth to a dual mixed refrigerant liquefaction process that improves the adaptability of liquefaction process to the environment [147].
Dual mixed refrigerant liquefaction process, or DMR process for short, saw its first design back in 1978 [148]. Since then, the well-known Shell, APCI and Axens IP alliance have obtained the majority of licenses for the DMR process [149]. Today, the process is one of the most popular LNG liquefaction technologies. Similar to C3MR, DMR also includes two closed refrigerant cycles. The major departure from these two cycles is that the previous one uses single component refrigerant (propane) as the cooling source for the pre-cooling stage, while the latter uses a mixture of refrigerants (mainly consisting of ethane and propane) for the system cooling [150]. A typical DMR process is shown in Figure 38: two cycles are WMR (warm MR) and CMR (cold MR), where WMR is used to pre-cool NG and partially or fully condense CMR, whereas CMR is used to liquefy and sub-cool NG [150,151]. Studies have shown that the pre-cooling process efficiency of the mixed refrigerant liquefaction process with ethane and propane pre-cooling is 20% higher than that of one with propane pre-cooling, and the investment and operating costs are relatively low.
Although C3MR process dominates the overall liquefaction process, C3MR process needs large quantities of propane, which may add storage space and cause safety issues, so it is rarely used in offshore liquefaction units. The DMR process is extensively applied in large-scale FLNG plants because of its large capacity, simple process, low energy consumption, high liquefaction rate, and offshore adaptability. Moreover, compared to SMR process, the DMR process has higher liquefaction efficiency, making it more suitable as a preferred choice for offshore liquefaction units with long operating cycles [152]. A modified version of DMR process for FLNG applications is proposed taking into account the simplicity, safety, and efficiency of the process, as shown in Figure 39 [153]. However, due to the significant difference in the composition of two mixed refrigerants in two DMR loops. The evaporation and condensation pressure levels in WMR and CMR loops are different, with CMR as the main variable affecting the sensitivity of the process. Therefore, the DMR process is considered to be more complex and sensitive than other mixed refrigerant processes [154].
However, in practical applications, it is a challenging task to keep DMR process running in optimum condition. An idea similar to the control strategy for SMR process is to use refrigerant flow ratio to study the stability of DMR process [155]. Wang et al. [156] analyzed the dynamic performance of key parameters by establishing a dynamic model of DMR process under specific conditions and found that adjusting key parameters allowed DMR process to reach a steady state after certain fluctuations, achieving anti-disturbance and start-stop operation of DMR process. In addition to the uncertainty caused by parameter variations in the DMR process, the environment in which the offshore liquefaction process is located, such as the swaying of seawater, should be also considered, greatly reducing the adaptability of conventional mixed refrigerant processes. In general, the use of seawater coolers and coil-wound heat exchangers (CWHE) will improve the adaptability of the process to complex sea conditions and overcome this drawback [157].
One of reasons for DMR process with high efficiency is that it maximizes the utilization of driving machine power and keeps compressor operating at a high-efficiency point over a wide temperature range. In addition, the heat transfer temperature difference between NG and mixed refrigerant is relatively uniform during liquefaction process, and the effective energy loss is correspondingly low. However, in early DMR process designs, thermodynamic irreversibility caused by the mixing of non-equilibrium flows made the process inefficient. High-temperature mixed refrigerant is boiled at various pressure levels and undergoes inter-stage compression. With this boiling, a number of Hex zones are required, resulting in many vessels, valves and associated piping, which can be solved by using efficient flow paths. In addition, the process design of the DMR is reinforced through the use of low-level refrigerant for sub-cooling and high-level refrigerant for NG pre-cooling, and low-level refrigerant cooling [158,159,160].
Air Products has also developed several variants of DMR process, as shown in Figure 40, Figure 41 and Figure 42 [161]. In Figure 40, compression is carried out in two stages, with partial condensation in intercooler and pumping liquid in the second stage. The process is highly efficient, and WMR does not contain large amounts of propane, instead maintaining efficiency through butane. Figure 41 shows another single-pressure configuration, which has no liquid pump. Moreover, the interstage liquid is delivered directly through a pre-cooled CWHE in a separate pipe loop, with reduced efficiency compared to the process in Figure 40. Figure 42 shows the dual-pressure pre-cooling process, the efficiency of which is greatly affected by propane. In addition, if there is no butane in WMR, the process may be more efficient than the single-pressure process. In recent years, the most recent designs for the DMR process have used mixed flows, with a greater focus on process safety and efficiency. In terms of safety, DMR process is safer than both SMR and C3MR processes under high productivity conditions [108]. As one of the most energy-saving liquefaction processes, DMR process also has a high heat transfer efficiency. What is more worthy of study is the low economics caused by its complicated process. Studies have shown that in the optimization of profit maximization, there is a trade-off relationship between energy demand and BOG production. When the liquefaction rate of DMR process is reduced to 71.4%, it can not only save equipment costs but also reduce the demand for compression capacity [162]. In addition, few heat exchangers, three-stage throttling in pre-cooling and the straightforward use of the cooled capacity usable by the BOG are the main directions of DMR process design in recent years, and the concept of the extension degree of the DMR process boundary has been proposed [150].
2.3.4. Integrated Process for Co-Production of LNG and NGL Recovery
Generally speaking, when NG is extracted, gas and liquid will appear at the same time. The gas is NG, and the liquid is condensate oil. Condensate oil, main components being mainly light hydrocarbons, is also called natural gas liquids (NGL). NGL has a high value in the petrochemical industry, and the recovery of NGL can not only control the dew point of hydrocarbons in NG to reach the quality index of commercial NG, but also use recovered light hydrocarbon as fuel and chemical raw materials, bringing greater economic and social benefits. The conventional NGL recovery process is to separate it as a preposition to the liquefaction process and a postposition to the purification process, with the required cooling capacity provided by different refrigeration cycles and independent heat exchangers [163]. Such a separate design will result in the inability to share resources, leading to fragmentation and repetition of production processes, resulting in large loss of target products, high energy consumption and other disadvantages, especially in large-scale LNG units [164]. Improving integration degrees are a radical way of improving the efficiency of LNG units, and reducing the operating costs and capital costs [165]. Studies have shown that the integration of LNG process with NGL recovery can often result in higher overall facility efficiency than a single independent facility [166], and because both processes integrated are cryogenic processes, the refrigeration system can be shared between the two. This eliminates the need for much process equipment and significantly reduces capital and operating costs [152,166,167]. Through integration, recovery rates and process performance can be improved, and the amount of energy required can also be reduced [168,169]. Since the heat integration process shows a lower total energy consumption [170], high product purity can be obtained by using the integrated tower system. Furthermore, the integration not only improves efficiency but also makes liquefaction unit more compact, which is more suitable for FLNG applications, paving the way for successful offshore NG exploitation.
ConocoPhillips, APCI, and Ortloff have designed and integrated LNG and NGL units. The ConocoPhillips integrated process can increase LNG production by approximately 7% at the same energy consumption [171]. Fluor Technologies has saved approximately 10% in energy consumption by integrating LNG and NGL processes [169]. Although experience with the integration of this technology is currently immature, the advantages of coupling NGL and LNG processes are gaining increasing attention, and many scholars continue to optimize simulation and analysis on it. Among these integration processes, DMR and C3MR processes are widely used for the integration of NGL recovery [48], as shown in Figure 43. Most of current integration schemes will be equipped with a demethanizer column, eliminate the reboiler [48], or use a dividing wall column (DWC) to achieve the integration of depropane and debutane, which is more suitable for limited offshore spaces [112,128]. Studies have shown that the use of an absorption refrigeration system instead of a conventional compression refrigeration system can further reduce the power consumption and cost of the process based on the basic integration scheme, and the introduction of this system also offers the possibility of waste heat utilization [172].
Compared with DMR process and C3MR process, the integration scheme of SMR process is poorly studied. Despite the SMR-NGL process suggested by Lee et al. [112] for FLNG units, there is still much room for enhancement in terms of ethane recovery and process simplicity, given the greater demands placed on offshore LNG units in terms of process safety, compactness, flexibility, and operational simplicity [166]. In recent years, ethane recovery has received increasing attention with the exploitation of NG with high ethane content, such as shale gas [173]. In this context, two new integrated SMR processes were proposed by He et al. [174], as shown in Figure 44. Both processes use cryogenic distillation to separate high-purity ethane while producing LNG. However, Process 1 has the disadvantage of a large heat transfer temperature difference in the low-temperature section. Therefore, the researchers improved process 1 by adding compressors behind the distillation column to obtain process 2. However, Process 1 equipment is relatively simple and more convenient to debug, so it is more suitable for offshore applications. However, considering the potential safety hazards of propane, the researchers further optimized process 1 and studied the process without propane in the mixed working fluid to fulfill the security requirements of FLNG and simplify the process, as shown in Figure 45, while process 2 is more appropriate for larger-scale units.
2.3.5. Research Progress in Mixed Refrigerants
Compared with other processes that use pure refrigerants, the mixed refrigerant liquefaction process has higher energy efficiency, compact design, and energy-saving heat transfer. One of main reasons is that hot and cold composite temperature curves of the process are closely matched. This feature is highly dependent on the optimal ratio of refrigerants. Figure 46 shows the different temperature composite curves of pure refrigerants (left) and mixed refrigerants (right) [175]. In natural gas liquefaction processes, the higher the matching degree between mixed refrigerant evaporation curve and NG cooling curve, the less the generated entropy, thereby improving thermodynamic efficiency and reducing power consumption [176]. Therefore, the optimization of mixed refrigerants has always been the focus of many scholars’ research. Mixed refrigerants are usually composed of nitrogen and hydrocarbons. In theory, the more components in mixed refrigerants, the more homogeneous will be the temperature difference between cold and hot flows inside the heat exchanger. Nevertheless, too many types of mixed refrigerant composition will inevitably cause the storage and distribution system of mixed refrigerant to be too complex. Regarding the problem of refrigerant composition, it is widely accepted by many researchers that different monomer refrigerants have different refrigeration temperature ranges [96,177]. In addition, the Cp-T property of feed gas is a critical element in determining the power consumption of the entire process. Mixed refrigerant components should be reasonably configured according to the Cp-T property of feed gas to meet the cooling capacity requirements of liquefied feed gas for different temperature ranges [178].
For the optimization of mixed refrigerants, most scholars have taken the mixed refrigerant liquefaction process with propane pre-cooling as the object of study, and more than 80% of base-load type natural gas liquefaction units in the world have adopted C3MR liquefaction process [179]. A small number of scholars have improved SMR process by taking into account the efficiency of mixed refrigerants when optimizing it. Conventional mixed refrigerants are mostly composed of nitrogen, methane, ethane, and propane. However, the impact of different component contents on the system varies. Numerous scholars have developed and verified different refrigerant ratios to make the process achieve a globally optimal solution by using genetic algorithms [176], GARO algorithms [180] and KBO algorithms [96] among others. In terms of energy consumption, Alabdulkarem et al. [175] proposed that when the mass fraction of each component of mixed refrigerants in C3MR process is: xN2 = 0.0731, xC1 = 0.2506, xC2 = 0.5291, xC3 = 0.1472, the energy consumption can be saved by 17.16%. Compared to the optimized refrigerant mixture for the MCR cycle of APCI LNG plant published by Venkatarathnam et al. [181] and Paradowski et al. [129], the power consumption of Alabdulkarem et al. [175] is still the lowest under similar conditions. In terms of robustness, Mortazavi et al. [180] proposed that mixed refrigerant is relatively insensitive to changes in natural gas mixture when the refrigerant composition is: xN2 = 0.0731, xC1 = 0.2506, xC2 = 0.5291, xC3 = 0.1472, satisfying all composition constraints tested. At this point, the refrigerant’s performance is superior to that of Alabdulkarem et al. [175], Venkatarathnam et al. [181] and Paradowski et al. [129]. However, the refrigerant’s robustness and energy consumption for the system cannot be balanced. The refrigerant’s power consumption optimized by Alabdulkarem et al. [175] and Venkatarathnam et al. [181] is significantly lower than that proposed by Mortazavi et al. [180].
The addition of heavy hydrocarbons to conventional refrigerant mixture has a significant impact on the performance. Heavy hydrocarbons have a high boiling point, large latent heat, and high molar mass, which can enable better temperature matching at the beginning of liquefaction process, reduce irreversible heat transfer loss, and improve refrigeration efficiency, so that the energy consumption of the optimized mixed fluid cycle can be reduced to the level of mixed refrigerant process with propane pre-cooling [182].
Iso-pentane is a heavy hydrocarbon widely used in mixed refrigerants. Xu et al. [97] found that the annual cost and energy consumption of the process were significantly reduced when the molar ratio of mixed refrigerant components was N2 = 14.59%, CH4 = 20.21%, C2H4 = 32.94%, C3H8 = 18.7%, and i-C5H12 = 14.25%. However, since then, several scholars [183,184] have found that the performance improvement effect is better when the molar ratio of mixed refrigerant components is N2 = 7.0%, CH4 = 25.0%, C2H4 = 32.4%, C3H = 18.7% and i-C5H12 = 16.9%, but the specific comparison of two kinds of mixed refrigerants needs further study. In addition to iso-pentane, iso-butane can also improve the phenomenon of low outlet temperature of intercoolers [124], while n-butane [185,186] and n-pentane [185] also play a role in promoting the performance of liquefaction process. Figure 47a shows a representative composite curve plot for a conventional mixed refrigerant (nitrogen, methane, ethane and propane) from Khan and Lee [187] based on their optimization study. The ABC region of the graph means that a relatively great difference between the natural gas temperature and the boiling point of propane can cause entropy to be generated in the cooling zone. This could be reduced by adding n-butane to the refrigerant, the effectiveness of which is shown in Figure 47b in the DEF region [188]. In addition, to further increase the effect, refrigerants with boiling points between propane and butane can be added, but these are not environmentally friendly. Taking into account the demand for energy saving and emission reduction, Qyyum et al. [188] proposed to use HFO-1234yf mixed with nitrogen, methane, ethane, propane, and n-butane as a refrigerant, which is environmentally friendly and has significant energy-saving effects, providing an innovative solution for improving the efficiency and ecology of LNG processes.
Although various studies have shown the positive effect of heavy hydrocarbons on the liquefaction process with mixed refrigerants, if too many heavy hydrocarbons are added, mixed refrigerants will present a gas-liquid two-phase state before entering compressor, leading to a liquid strike in compressor, which is technically not allowed [183]. When some skid-mounted LNG units use oil-injected screw compressors, heavy hydrocarbons iso-butane and iso-pentane are more soluble in lubricating oil. In order to combat this issue, the use of heavy hydrocarbon-free refrigerant blends is suggested [189].
3. Pressurized Liquefied Natural Gas Process
Pressurized liquefied natural gas (PLNG) technology is a concept proposed relative to conventional liquefaction technology. It refers to the cooling of NG to an intermediate temperature for liquefaction, using higher pressures than normal liquefaction, to increase the storage temperature of LNG, and maintain higher pressures throughout the whole transport chain for LNG transportation. PLNG technology shows technical and economic advantages in purification and liquefaction of NG, but it increases the economic burden in storage and transportation. By designing and optimizing production costs and transportation costs through a reasonable PLNG process, the overall project cost can be reduced, the advantages of PLNG technology can be fully exploited, and the application scope can be expanded.
3.1. Comparison between PLNG Process and Conventional LNG Process
Conventional LNG process converts NG cooled to about 111 K into LNG products for storage at a pressure of about 0.1 Mpa. PLNG process can obtain LNG products with a corresponding temperature of about 150–211 K under a pressure of 1.0–7.6 Mpa, which is about 39–100 K higher than that of conventional LNG products [190]. Taking into account the technical requirements of liquefaction and storage, as well as comprehensive costs, it is more appropriate to use a pressure of 1–2 Mpa for pressurized liquefaction, where the corresponding natural gas liquefaction temperature is about 153–173 K [191]. The purpose of liquefaction storage can be achieved when pressurized NG is cooled to an intermediate temperature of conventional liquefaction, so energy consumption and liquefaction operation costs of the PLNG process can be significantly reduced.
Compared with conventional liquefaction process, PLNG process reduces the pretreatment requirements for feed gas, and provides a new possibility to reduce CO2 emissions in LNG process. In the conventional liquefaction process, in case CO2 forms a solid at low temperatures and causes blockages, CO2 must be strictly removed from feed gas, so that the CO2 concentration in LNG products should be kept below 50 ppm [192]. Temperature has an important effect on CO2 solubility in methane. As shown in Figure 48, the increase in temperature dramatically increases the solubility of CO2 in LNG products [193,194]. Similarly, the increased temperature increases the solubility of aromatics and other heavy hydrocarbons in LNG products, increasing the tolerance of the PLNG process to these components in feed gas [195].
The PLNG process helps to reduce the requirement for CO2 concentration in the feed gas thereby eliminating the necessary supporting equipment for conventional liquefaction process such as CO2 removal equipment and heavy hydrocarbon scrubbing towers, which simplifies production process and reduces energy consumption. The increase in liquefaction and storage temperature makes it possible to simplify the process structure. And the reductions in the number of equipment make the corresponding costs approximately 50% of those of a conventional LNG plant [190]. At the same time, the PLNG process plays an essential part in saving occupied areas of the LNG production system, and this provides the possibility for LNG production in a narrow area.
Compared with conventional liquefaction process, the increase in product storage pressure in PLNG process places higher demands on the storage and transportation links. In order to ensure adequate pressure-bearing capacity, the storage tanks for PLNG storage mostly use small thick-walled storage tanks, which are transported in clusters, increasing the weight and manufacturing costs of tanks [196,197,198]. At the same time, the density of LNG decreases after pressurization and heating, and more storage space is required to transport products with the same quality, which further increases transportation costs [196]. When comparing and evaluating the pros and cons of different pressure liquefaction processes, the economic advantages of PLNG process in purification and liquefaction and their influence on transportation costs should be comprehensively considered.
3.2. Research Progress in PLNG Process
3.2.1. PLNG Process without CO2 Pretreatment
The probability of CO2 solids being precipitated during natural gas liquefaction is related to CO2 content in feed gas and its solubility in LNG. Only when CO2 content does not exceed its solubility, all CO2 will dissolve in the liquefied product [192]. In order to ensure that the entire liquefaction process does not cause blockage due to CO2 precipitation, the purification index of CO2 in natural gas liquefaction process should be lower than the solubility of CO2 in LNG. The increased liquefaction temperature in PLNG process dramatically enhances the solubility of CO2 in its liquefied products. The liquefaction temperature increases from 111 K under normal pressure to 153–173 K, and the corresponding molar solubility of CO2 also increases from 0.02% to 1–3%. Even if a certain safety margin is considered, for pressurized liquefaction process of feed gas with a CO2 content of below 0.5%, the liquefaction process can be carried out without a CO2 pre-treatment unit, thereby saving a lot of space [199].
The increase in liquefaction temperature has a significant effect on process design. Figure 49, Figure 50 and Figure 51 show typical cascade PLNG process, single mixed refrigerant PLNG process and single expansion PLNG process respectively. The working pressure of these processes is increased to 2 Mpa and the corresponding liquefaction temperature rises to 165.7 K. Compared with conventional LNG processes, liquefaction temperature in PLNG process has increased by 54.7 K, which is approximately equal to the average temperature drop of each cycle in conventional three-stage cascade liquefaction process [191]. Therefore, a two-stage heat exchange process with high and low temperatures could satisfy the demands of LNG, and refrigerant selection could break through the limitation of lower temperature (about −111 K) of conventional LNG processes. Therefore, in addition to CH4, N2 and their mixtures, options such as C2H4 have been added [22], and the ratio of mixed refrigerants and the collocation of high-temperature and low-temperature refrigerants are also more flexible and diverse. In this way, the PLNG process broadens the selection range of refrigerants, eliminates some equipment, and makes the process design more flexible, simple and compact. At the same time, on the one hand, the increased liquefaction temperature in PLNG process effectively reduces energy consumption requirements, and on the other hand, it is beneficial to the refrigeration cycle to reach higher efficiency. Compared to the corresponding types of conventional LNG processes, the specific power consumption of three PLNG processes is reduced by 46%, 50%, and 63%, respectively, and the heat transfer area is reduced by 42%, 25%, and 4% respectively, which contributes to space and cost savings [191].
3.2.2. PLNG Process with CO2 Cryogenic Remove
As mentioned above, the PLNG process can liquefy feed gas with CO2 content below 0.5% directly in the absence of CO2 pretreatment facilities. When CO2 content in feed gas obviously exceeds the upper limit, CO2 solidification problems still occur in PLNG progress. In order to extend the application range of PLNG process, while eliminating pretreatment equipment and maintaining its small floor space, CO2 cryogenic removal in PLNG process can be considered. CO2 cryogenic removal can be carried out based on the principles of gas-liquid phase change [200,201], solid-liquid phase change [202], gas-solid phase change [203,204], and multiple phase change [205,206]. The gas-solid phase change-based CO2 cryogenic removal can be carried out without additional pretreatment equipment, which is more conducive to maintaining the advantages of PLNG process. In Figure 52, the phase transition curves of the binary system with CO2 content of 0.5% and 30% respectively show similar morphology. The illustration shows that point A is the highest triple-phase point of the binary system with 0.5% CO2 content. The thermodynamic path, as shown in the dashed line (1-2-3), is adopted to ensure that CO2 cryogenic separation always operates at a pressure below the triple-phase point, so that CO2 can be removed by sublimation, and the permitted CO2 content in the feed gas could reach 30% [203].
On the basis of PLNG process combined with CO2 cryogenic removal technology, it is to build PLNG process with CO2 cryogenic removal function. Figure 53, Figure 54 and Figure 55 show cascade PLNG process with CO2 cryogenic removal function. It takes advantage of the increased temperature of PLNG and uses a two-stage cascade liquefaction process instead of conventional three-stage cascade liquefaction process, effectively simplifying the process structure. Due to the use of different refrigerant combinations of CH4-C2H6, CH4-C2H4, and C2H4-C3H8, compressor and cooler configurations in low-temperature and high-temperature cycles are slightly different. The cooling of NG in each liquefaction process follows the thermodynamic path of gas-solid phase change described above. CO2 content in NG exceeding the upper limit allowed by pressurized liquefaction process is further cooled in the heat exchanger (HEX-102) to form dry ice and removed from the lower part. Because of the optimum temperature match of the hot and cold sides, the C2H4-C3H8 process has the minimum thermodynamic irreversibility of the three refrigerant combinations. The unit energy consumption of this process is 0.2559 kWh/Nm3, which is 2.5% more energy efficient than conventional CH4-C2H4-C3H8 three-stage cascade liquefaction process, and it is the lowest among the three processes. Its COP is 0.75 and the exergy efficiency is 0.47, which are 17% and 38% higher than those in conventional liquefaction process respectively [207].
Figure 56 and Figure 57 show the expansion pressurized liquefaction process with CO2 cryogenic removal. The process in Figure 57 adds a pre-cooling cycle on the basis of the process in Figure 56, which is similar to the above two-stage cascade pressurized liquefaction process with CO2 cryogenic removal. By controlling the thermodynamic cooling path of NG, CO2 beyond the solubility range at the liquefaction temperature is by gas-solid separation in the heat exchanger (HEX-102), thus improving the adaptation range of the whole pressurized liquefaction process to CO2 content in feed gas. As shown in Figure 58, the type of refrigerant in the same process has a different effect on the specific power consumption of the CO2 content in the feed gas. The higher the concentration of CO2 in the feed gas, the higher the amount of cooling required for CO2 cryogenic removal and natural gas liquefaction, in addition to reducing the LNG products capacity. Therefore, specific power consumption of liquefaction process increases with the increase of CO2 content [208]. Overall, comparing energy consumption between conventional LNG processes and various PLNG processes with CO2 cryogenic removal, energy consumption of CO2 removal and natural gas liquefaction under normal operating conditions should be sufficiently considered.
4. Current Status and Outlook
4.1. Status and Demand Analysis
The analysis of natural gas liquefaction units is based on use, with base-load natural gas liquefaction units producing natural gas for local use or export transportation. The units are the main production facilities for ocean-going natural gas transportation and international LNG trading. Base-load type natural gas liquefaction units are mostly built near gas sources, and the production scale is huge, which needs to provide large-scale gas supplies to many remote users. Therefore, the liquefaction process is required to have the advantages of strong liquefaction capacity, low energy consumption, high cycle efficiency, mature technology, safe and stable operation, low costs, and environmental friendliness [209]. Under these premises, the requirement for floor space can be relaxed appropriately. The growth in global large-scale liquefaction capacity over a decade and the liquefaction processes used show that Air Products’ C3MR is the predominant technology used, closely followed with ConocoPhillips’ pure refrigerant cascade technology and Shell’s dual mixed refrigerant (DMR) technology. This is precise because the characteristics of these natural gas liquefaction processes meet the main requirements of base-load natural gas liquefaction units [21]. Currently, the natural gas liquefaction process in large-scale base-load natural gas liquefaction plants is relatively mature, with most studies devoted to specific research, such as process optimization and economic analysis, and there are few breakthrough innovations.
The peak-shaving type natural gas liquefaction units are set for peak-load or seasonal fuel supply. They are usually far away from gas source and located near big cities. And the production scale of the units is relatively small, with the general liquefaction stage cycle varying from 50–300 days depending on the remaining upstream natural gas. The peaking liquefaction process, therefore, focuses on the requirements for: ① simple and efficient cycles, ② fewer equipment, ③ low investment, ④ simple operation, ⑤ flexible operation, fast start and stop speed, ⑥ easy access to the refrigerant. According to these requirements, among the peak-shaving type natural gas liquefaction units built by countries throughout the world, the liquefaction process with an expander is used the most, followed by mixed refrigerant liquefaction process, while cascade liquefaction process is the least employed [209].
In recent years, the small skid-mounted scale natural gas liquefaction units are mainly designed for small reserves, remote and dispersive natural gas fields, and oil and gas associated fields. The units are flexible and can be quickly removed to other gas fields for liquefaction production when the existing gas fields are exhausted. In order to achieve the design goals, it needs the liquefaction process to have the following remarkable advantages: simple process, compact equipment, skid-mounted, low energy consumption, and strong adaptability to gas source. In line with these requirements, many scholars [210,211,212] believe that the mixed refrigerant liquefaction process and nitrogen expansion liquefaction process are more suitable for small skid-mounted natural gas liquefaction units. At present, there are still few liquefaction processes developed for small skid-mounted scale natural gas liquefaction units due to many technical difficulties, so most of liquefaction processes are scaled down according to the processes of large-scale liquefaction units [213,214].
After years of development, a large onshore production system for LNG supplemented by peak-shaving type and other small liquefaction units has been established on the basis of base-load liquefaction units. The exploitation of offshore NG mainly depends on conventional offshore platforms suitable for the exploitation of large offshore gas fields. The rapid development of FLNG provides more possibilities for the exploitation of marginal fields and deepwater gas fields [215]. Compared with onshore liquefied natural gas production, offshore liquefied natural gas production needs to face more severe environments, especially FLNG has to solve the problems of extremely limited space, more complex operating environments, composition differences in gas sources, and so on. The special environment of offshore operations places special requirements for liquefaction process: ① simple processes, compact equipment, and small footprint to meet offshore installation needs, ② highly adaptable to different gas sources and high thermal efficiency, ③ safety and reliability, i.e., no influence on performance due to ship movement, ④ ability to quickly stop in the face of bad weather, and quickly start after moving to another production location, ⑤ relatively low power consumption [216,217]. These characteristics give FLNG different criteria for process selection from onshore units. When selecting onshore units, cycle efficiency is an important determinant factor, but in offshore floating units, this has been reduced to a secondary factor [218]. Offshore liquefaction processes require extremely high safety and reliability, with greater emphasis on factors such as compactness and lightweight equipment [218]. At present, most scholars believe that the mixed refrigerant liquefaction process or nitrogen expansion liquefaction process is the most advantageous process choice for FLNG. However, the PLNG process also has prominent advantages in energy consumption, process structure, floor space, the amount of equipment, and supporting facilities.
4.2. Research Prospects
Considering the development trend of LNG industry and the development level of liquefaction process, potential directions of future liquefaction process development may include:
- LNG production is an industrial process with high energy consumption, especially for base-load type LNG production, and a small increase in the cycle efficiency of liquefaction process will have an extremely significant effect on energy saving. Reducing energy consumption and increasing liquefaction capacity and efficiency are still the goals of liquefaction process in medium and large-scale production. Through a detailed analysis of energy loss within various equipment in the whole liquefaction process, and also by improving the liquefaction process and adjusting operational parameters, there is still room and possibility for progress in optimizing the liquefaction process design.
- The liquefaction process that is scaled-down and designed according to the mature process of large-scale liquefaction plant cannot fully meet all the process requirements of small skid-mounted natural gas liquefaction unit. On the one hand, under the premise of ensuring high cycle efficiency, it is still the focus of future research to simplify the process and reduce the size of equipment so as to achieve the skid-mounted process setup. On the other hand, improving the adaptability of the liquefaction process to different gas sources and the flexibility of start and stop operations are also of great practical significance to the application advantages of small skid-mounted natural gas liquefaction units.
- The exploitation of offshore natural gas resources is bound to put forward a great demand for the research of offshore natural gas liquefaction processes. The particularities of offshore operating environment and space provide some new directions for the research of offshore liquefaction processes. For example, the influence of sloshing produced by wind waves and ocean currents on the liquefaction process of FLNG and the influence of different liquefaction processes and refrigerant compositions on safety still needs further research.
- Most of the studies on offshore applications of pressurized liquefaction process are still focused on the liquefaction process. In this respect, a number of important research directions are still open for future research endeavors, e.g., ① further combining dehydration, CO2 removal, and other pretreatment processes to carry out full process simulation, ② to coordinate and optimize the pressurized liquefaction process with pretreatment, storage, and transportation, ③ to deepen the adaptability, safety, and modularity of pressurized liquefaction process at sea conditions and gas source components,④ to overall consider investment costs and operation costs.
- Although PLNG process is proposed for offshore natural gas liquefaction units, its higher requirements for adaptability to different gas sources and the idea of reducing the footprint by eliminating CO2 pre-treatment units coincide with the requirements of small skid-mounted liquefaction units onshore. So, PLNG process may be a strategic possibility as a potential solution for offshore gas.
- Studying natural gas liquefaction process, the specific power consumption or total energy consumption is always used as the optimization objective function and evaluation index. Moreover, some aspects are chosen, such as the relationship between investment and operating costs, analyzing and evaluating the liquefaction process from an economic aspect. Although both energy consumption and economy are among the most important evaluation indicators for liquefaction processes, as mentioned above, different production methods and applications have different requirements for liquefaction processes. Scientific evaluation should comprehensively consider energy consumption, economic and operational adaptability, operability, and safety. In the same respect, an evaluation system should be established in line with the priority of various performance requirements of LNG units for liquefaction process. Conversely, the optimization and comparison of liquefaction process should be also carried out in this evaluation system. At present, research on this aspect is still relatively rare, and further research is needed.
- Various new equipment, such as supersonic cyclone separator and printed circuit heat exchanger, have emerged. The effects and influences caused by their use in natural gas liquefaction processes have become new issues.
- There are still few studies on dynamic simulation of LNG processes. Studying the stability of liquefaction process in disturbance plays an important role in evaluating its adaptability, especially for dynamic simulation under extreme working conditions, so as to better understand dynamic characteristics of the process and provide guidance for actual operation.
- The LNG process is a multi-component feed gas liquefaction production process. Enhancing the energy efficiency of the liquefaction process requires a focus not only on energy consumption at all stages of the natural gas cooling process, but also on the overall improvement in conjunction with the NGL recovery process and BOG cycle re-liquefaction process.
- The deterministic method, stochastic method, and KBO method are suitable for controlling natural gas liquefaction processes and each has strengths and weaknesses with regard to calculation time, multi-objective processing, and convergence. Exploring customized optimization algorithms suitable for different liquefaction processes will be of great help in the design and optimization of natural gas liquefaction processes.
5. Conclusions
The strong demand in the global natural gas consumption market has promoted the vigorous development of LNG production. The business profitability from natural gas suppliers and the utilization cost from users are closely related to the level of liquefaction technology. Associated advances, such as increasing onshore LNG production capacity, strengthening the exploitation of scattered small gas fields, and the exploration of new strategies to move from shallow seas to deep seas, have opened up a broader prospect for the application of LNG processes. This review has introduced and analyzed in detail the progress made in the process design and optimization of LNG processes from the aspects of process types, pressure ranges, and production methods. Thus, it provides multiple perspectives for relevant researchers, engineers, and other practitioners to deepen their understanding of the structure, performance, optimization methods, and technical requirements of LNG processes, which can be used as an important reference for subsequent research on LNG processes. Based on current development of liquefaction processes, this review analyzes the gap between liquefaction process research and real-life operational requirements and clarifies main problems faced as well as future development directions. This enables future researchers to take into account, in addition to energy efficiency, different parameters, such as operating environments, gas source compositions, safety, equipment quantity, floor space, and operational characteristics, in order to arrive at more beneficial design and optimization results for practical projects and promote LNG applications.
Author Contributions
Conceptualization, L.G., J.W., Q.L. and W.C.; Methodology, L.G. and J.W.; Investigation, L.G.; Resources, Q.L. and W.C.; writing—original draft preparation, L.G. and J.W. writing—review and editing, L.G., J.W., M.B. and W.C.; Supervision, W.C.; Funding acquisition, W.C. All authors have read and agreed to the published version of the manuscript.
Funding
This research was funded by National Natural Science Foundation of China (Grant No. U21B2087).
Conflicts of Interest
The authors declare no conflict of interest.
Nomenclature
| LNG | Liquefied natural gas |
| FLNG | Floating LNG |
| GHG | Greenhouse gas |
| CO2 | Carbon dioxide |
| NG | Natural gas |
| FLNG-FPSO | LNG-floating production, storage and offloading |
| APCI | Air Products & Chemical Inc. |
| BOG | Boiled off gas |
| JT | Joule-Thomson |
| COP | Coefficient of performance |
| N2O | Nitrous oxide |
| N2 | Nitrogen |
| MFC | Mixed fluid cascade liquefaction process |
| C2H4/C2 | Ethane |
| C3H8/C3 | Propane |
| T0 | Ambient temperature |
| NGL | Natural gas liquid |
| NRU | Nitrogen rejection unit |
| ARC | Absorption refrigeration cycle |
| NH3 | Ammonia |
| H2O | Water |
| LPG | Liquefied petroleum gas |
| HEX | Heat exchanger |
| PNEC | Parallel nitrogen expansion liquefaction process |
| GA | genetic algorithm |
| NEC | Nitrogen expansion liquefaction process |
| SNA | Single nitrogen expansion process with ammonia absorption pre-cooling |
| CH4/C1 | Methane |
| CP | Constant-pressure specific heat capacity |
| Cv | Constant-volume specific heat capacity |
| C3N | Propane-nitrogen |
| MR | Mixed refrigerant |
| SMR | Single mixed refrigerant liquefaction process |
| DMR | Dual mixed refrigerant liquefaction process |
| C3MR | Mixed refrigerant liquefaction process with propane pre-cooling |
| PRICO | Single mixed refrigerant liquefaction process designed by Black–Veatch |
| MTPA | Metric ton per annum |
| MSMR | Modified single mixed refrigerant |
| HK | Heavy key |
| LK | Light key |
| HT | Hydraulic turbine |
| KSMR | Korea single mixed refrigerant |
| PID | Proportion integration differentiation |
| DMC | Dynamic matrix control |
| AP-X™ | mixed refrigerant plus nitrogen expansion liquefaction process |
| WMR | Warm MR |
| CMR | Cold MR |
| CWHE | Coil-wound heat exchangers |
| DWC | Dividing wall column |
| GARO | Gradient assisted robust optimization |
| KBO | Knowledge-based optimization |
| X | Mass fraction |
| MCR | Multi-component refrigerant |
| i-C5H12 | Isopentane |
| HFO-1234yf | 2, 3, 3, 3-Tetrafluoropropylene |
| PLNG | Pressurized LNG |
References
- BP Energy Outlook 2019|News and Insights|Home. Bp Global. Available online: https://www.bp.com/en/global/corporate/news-and-insights/press-releases/bp-energy-outlook-2019.html (accessed on 26 October 2021).
- Lim, W.; Choi, K.; Moon, I. Current Status and Perspectives of Liquefied Natural Gas (LNG) Plant Design. Ind. Eng. Chem. Res. 2013, 52, 3065–3088. [Google Scholar] [CrossRef]
- Liang, F.-Y.; Ryvak, M.; Sayeed, S.; Zhao, N. The role of natural gas as a primary fuel in the near future, including comparisons of acquisition, transmission and waste handling costs of as with competitive alternatives. Chem. Central J. 2012, 6, S4. [Google Scholar] [CrossRef] [Green Version]
- Nawaz, A.; Qyyum, M.A.; Qadeer, K.; Khan, M.S.; Ahmad, A.; Lee, S.; Lee, M. Optimization of mixed fluid cascade LNG process using a multivariate Coggins step-up approach: Overall compression power reduction and exergy loss analysis. Int. J. Refrig. 2019, 104, 189–200. [Google Scholar] [CrossRef]
- Arrhenius, K.; Karlsson, A.; Hakonen, A.; Ohlson, L.; Yaghooby, H.; Büker, O. Variations of fuel composition during storage at Liquefied Natural Gas refuelling stations. J. Nat. Gas Sci. Eng. 2018, 49, 317–323. [Google Scholar] [CrossRef]
- Najibullah Khan, N.B.; Barifcani, A.; Tade, M.; Pareek, V. A case study: Application of energy and exergy analysis for enhancing the process efficiency of a three stage propane pre-cooling cycle of the cascade LNG process. J. Nat. Gas Sci. Eng. 2016, 29, 125–133. [Google Scholar] [CrossRef] [Green Version]
- Song, Q.; Zhang, J.; Zhao, Z.; Luo, J.; Wang, Q.; Chen, G. Development of natural gas liquefaction processes using mixed refrigerants: A review of featured process configurations and performance. J. Zhejiang Univ. Sci. A 2019, 20, 727–780. [Google Scholar] [CrossRef]
- Won, W.; Lee, S.K.; Choi, K.; Kwon, Y. Current trends for the floating liquefied natural gas (FLNG) technologies. Korean J. Chem. Eng. 2014, 31, 732–743. [Google Scholar] [CrossRef]
- Wang, M.; Khalilpour, R.; Abbas, A. Thermodynamic and economic optimization of LNG mixed refrigerant processes. Energy Convers. Manag. 2014, 88, 947–961. [Google Scholar] [CrossRef]
- Qyyum, M.A.; Qadeer, K.; Lee, M. Comprehensive Review of the Design Optimization of Natural Gas Liquefaction Processes: Current Status and Perspectives. Ind. Eng. Chem. Res. 2017, 57, 5819–5844. [Google Scholar] [CrossRef]
- Shell LNG Outlook 2021. Available online: https://www.shell.com/energy-and-innovation/natural-gas/liquefied-natural-gas-lng/lng-outlook-2021.html (accessed on 21 October 2021).
- Kumar, S.; Kwon, H.-T.; Choi, K.-H.; Lim, W.; Cho, J.H.; Tak, K.; Moon, I. LNG: An eco-friendly cryogenic fuel for sustainable development. Appl. Energy 2011, 88, 4264–4273. [Google Scholar] [CrossRef]
- Mazyan, W.; Ahmadi, A.; Ahmed, H.; Hoorfar, M. Market and technology assessment of natural gas processing: A review. J. Nat. Gas Sci. Eng. 2016, 30, 487–514. [Google Scholar] [CrossRef]
- Lee, I.; Park, J.; Moon, I. Key Issues and Challenges on the Liquefied Natural Gas Value Chain: A Review from the Process Systems Engineering Point of View. Ind. Eng. Chem. Res. 2018, 57, 5805–5818. [Google Scholar] [CrossRef]
- Katebah, M.A.; Hussein, M.M.; Shazed, A.; Bouabidi, Z.; Al-musleh, E.I. Rigorous simulation, energy and environmental analysis of an actual baseload LNG supply chain. Comput. Chem. Eng. 2020, 141, 106993. [Google Scholar] [CrossRef]
- Zhang, J.; Meerman, H.; Benders, R.; Faaij, A. Comprehensive review of current natural gas liquefaction processes on technical and economic performance. Appl. Therm. Eng. 2020, 166, 114736. [Google Scholar] [CrossRef]
- He, T.; Karimi, I.A.; Ju, Y. Review on the design and optimization of natural gas liquefaction processes for onshore and offshore applications. Chem. Eng. Res. Des. 2018, 132, 89–114. [Google Scholar] [CrossRef]
- Eldemerdash, U. Technology review of natural gas liquefaction processes. J. Appl. Sci. 2011, 11, 3541–3546. [Google Scholar] [CrossRef]
- Ríos-Mercado, R.Z.; Borraz-Sánchez, C. Optimization problems in natural gas transportation systems: A state-of-the-art review. Appl. Energy 2015, 147, 536–555. [Google Scholar] [CrossRef]
- Chang, H.-M. A thermodynamic review of cryogenic refrigeration cycles for liquefaction of natural gas. Cryogenics 2015, 72, 127–147. [Google Scholar] [CrossRef]
- Khan, M.S.; Karimi, I.A.; Wood, D.A. Retrospective and future perspective of natural gas liquefaction and optimization technologies contributing to efficient LNG supply: A review. J. Nat. Gas Sci. Eng. 2017, 45, 165–188. [Google Scholar] [CrossRef]
- Lin, W.; Xiong, X.; Spitoni, M.; Gu, A. Design and Optimization of Pressurized Liquefaction Processes for Offshore Natural Gas Using Two-Stage Cascade Refrigeration Cycles. Ind. Eng. Chem. Res. 2018, 57, 5858–5867. [Google Scholar] [CrossRef]
- Wu, D. A Preliminary Study on Liquefaction Technology and Storage and Transportation Safety of Natural Gas. Mod. Chem. Res. 2018, 75–76. [Google Scholar]
- Niu, Y.; Feng, L. Application of Petrochemical Industry Process Simulation Software in LNG Engineering. Shanghai Gas 2007, 5–8. [Google Scholar]
- Andress, D. The Phillips Optimized Cascade LNG Process: A Quarter-of-a-Century of Improvements; American Institute of Chemical Engineers: New York, NY, USA, 1996. [Google Scholar]
- Ransbarger, W. A fresh look at LNG process efficiency. In LNG Industry; Palladian Publications: Farnharm, UK, 2007. [Google Scholar]
- Fahmy, M.F.M.; Nabih, H.I.; El-Nigeily, M. Enhancement of the efficiency of the Open Cycle Phillips Optimized Cascade LNG process. Energy Convers. Manag. 2016, 112, 308–318. [Google Scholar] [CrossRef]
- Lee, H.S.; Oh, S.T.; Kim, H.W.; Choi, W.J.; Yoon, J.I.; Lee, S.G. Comparison of Performance of Cryogenic Liquefaction Process with Expander. In Proceedings of the KSPSE Spring Conference; The Society of Air-Conditioning and Refrigerating Engineers of Korea: Jeju, Korea, 2009; pp. 250–254. [Google Scholar]
- Yoon, J.; Lee, H.; Oh, S.; Lee, S.; Choi, K. Characteristics of Cascade and C3MR Cycle on Natural Gas Liquefaction Process. Int. J. Chem. Mol. Eng. 2009, 59, 185–189. [Google Scholar]
- Lee, H.S.; Oh, S.T.; Yoon, J.I.; Lee, S.G.; Choi, K.H. Analysis of Cryogenic Refrigeration Cycle Using Two Stage Intercooler. In Defect and Diffusion Foru; Trans Tech Publications Ltd.: Wollerau, Switzerland; Volume 297, pp. 1146–1151. [CrossRef]
- Oh, S.; Lee, H.; Yi, G.-B.; Yoon, J.; Lee, S. Characteristics of cryogenic liquefaction cycle using two stage compression type. In Proceedings of the SAREK Conference; The Society of Air-Conditioning and Refrigerating Engineers of Korea: Jeju, Korea, 2009; pp. 556–560. [Google Scholar]
- Gang, B.Y. Analysis of the Research on the Application of hydrocarbon in Refrigeration and air conditioning. Refrig. J. 2003, 41–46. [Google Scholar]
- The Economic Impact of Small Scale LNG. PwC. May 2013. Available online: https://xueshu.baidu.com/usercenter/paper/show?paperid=133625d91249ac344bb778d7a54818dd&site=xueshu_se (accessed on 30 August 2022).
- Chang, H.-M.; Chung, M.J.; Lee, S.; Choe, K.H. An efficient multi-stage Brayton–JT cycle for liquefaction of natural gas. Cryogenics 2011, 51, 278–286. [Google Scholar] [CrossRef]
- Yoon, J.-I.; Choi, W.-J.; Lee, S.; Choe, K.; Shim, G.-J. Efficiency of Cascade Refrigeration Cycle Using C3H8, N2O, and N2. Heat Transf. Eng. 2013, 34, 959–965. [Google Scholar] [CrossRef]
- Yoon, J.-I.; Choi, K.-H.; Lee, H.-S.; Kim, H.-J.; Son, C.-H. Assessment of the performance of a natural gas liquefaction cycle using natural refrigerants. Heat Mass Transf. 2015, 51, 95–105. [Google Scholar] [CrossRef]
- Lee, C.-J.; Song, K.; Shin, S.; Lim, Y.; Han, C. Process design for the offshore production of liquefied natural gas with nonflammable refrigerants. Ind. Eng. Chem. Res. 2015, 54, 11106–11112. [Google Scholar] [CrossRef]
- Qingping, L.I.; Meng, W.; Zhang, J.; Han, L.U. Comparison and Selection of Natural Gas Liquefaction Refrigeration Processes. Gas Heat 2012, 32, 4–10. [Google Scholar]
- Vatani, A.; Mehrpooya, M.; Palizdar, A. Energy and exergy analyses of five conventional liquefied natural gas processes: Liquefied natural gas. Int. J. Energy Res. 2014, 38, 1843–1863. [Google Scholar] [CrossRef]
- Ramezani, T.; Nargessi, Z.; Palizdar, A.; Vatani, A. Control Structure Design and Dynamic Simulation of Mixed Fluid Cascade Natural Gas Liquefaction Process. J. Gas Technol. 2019, 5, 19. [Google Scholar]
- Majeed, K.; Qyyum, M.A.; Nawaz, A.; Ahmad, A.; Naqvi, M.; He, T.; Lee, M. Shuffled Complex Evolution-Based Performance Enhancement and Analysis of Cascade Liquefaction Process for Large-Scale LNG Production. Energies 2020, 13, 2511. [Google Scholar] [CrossRef]
- Ding, H.; Sun, H.; Sun, S.; Chen, C. Analysis and optimisation of a mixed fluid cascade (MFC) process. Cryogenics 2017, 83, 35–49. [Google Scholar] [CrossRef]
- Castillo, L.; Majzoub Dahouk, M.; Di Scipio, S.; Dorao, C.A. Conceptual analysis of the precooling stage for LNG processes. Energy Convers. Manag. 2013, 66, 41–47. [Google Scholar] [CrossRef]
- Brodal, E.; Jackson, S.; Eiksund, O. Performance and design study of optimized LNG Mixed Fluid Cascade processes. Energy 2019, 189, 116207. [Google Scholar] [CrossRef]
- Bauer, H.C. Mixed fluid cascade, experience and outlook. In Proceedings of the 12th Topical Conference on Gas Utilization, AIChE 2012 Spring Meeting, Houston, TX, USA, 2–5 April 2012; p. 25a. [Google Scholar]
- Pettersen, J.; Nilsen, Ø.; Vist, S.; Noreng Giljarhus, L.; Fredheim, A.; Aasekjaer, K.; Neeraas, B. Technical and operational innovation for onshore and floating LNG. In Proceedings of the 17th International Conference & Exhibition on Liquefied Natural Gas (LNG 17), Houston, TX, USA, 16–19 April 2013; pp. 1–12. [Google Scholar]
- Eiksund, O.; Brodal, E.; Jackson, S. Optimization of Pure-Component LNG Cascade Processes with Heat Integration. Energies 2018, 11, 202. [Google Scholar] [CrossRef] [Green Version]
- Mehrpooya, M.; Hossieni, M.; Vatani, A. Novel LNG-Based Integrated Process Configuration Alternatives for Coproduction of LNG and NGL. Ind. Eng. Chem. Res. 2014, 53, 17705–17721. [Google Scholar] [CrossRef]
- Ghorbani, B.; Hamedi, M.-H.; Amidpour, M.; Mehrpooya, M. Cascade refrigeration systems in integrated cryogenic natural gas process (natural gas liquids (NGL), liquefied natural gas (LNG) and nitrogen rejection unit (NRU)). Energy 2016, 115, 88–106. [Google Scholar] [CrossRef]
- Mehrpooya, M.; Omidi, M.; Vatani, A. Novel mixed fluid cascade natural gas liquefaction process configuration using absorption refrigeration system. Appl. Therm. Eng. 2016, 98, 591–604. [Google Scholar] [CrossRef]
- Ghorbani, B.; Shirmohammadi, R.; Mehrpooya, M. A novel energy efficient LNG/NGL recovery process using absorption and mixed refrigerant refrigeration cycles—Economic and exergy analyses. Appl. Therm. Eng. 2018, 132, 283–295. [Google Scholar] [CrossRef]
- Ghorbani, B.; Hamedi, M.-H.; Amidpour, M. Exergoeconomic evaluation of an integrated nitrogen rejection unit with LNG and NGL Co-Production processes based on the MFC and absorbtion refrigeration systems. Gas Process. J. 2016, 4, 1–28. [Google Scholar] [CrossRef]
- Austbø, B.; Gundersen, T. Optimization of a Single Expander LNG Process. Energy Procedia 2015, 64, 63–72. [Google Scholar] [CrossRef] [Green Version]
- Chang, H.-M.; Chung, M.J.; Kim, M.J.; Park, S.B. Thermodynamic design of methane liquefaction system based on reversed-Brayton cycle. Cryogenics 2009, 49, 226–234. [Google Scholar] [CrossRef]
- Son, H.; Kim, J.-K. Energy-efficient process design and optimization of dual-expansion systems for BOG (Boil-off gas) Re-liquefaction process in LNG-fueled ship. Energy 2020, 203, 117823. [Google Scholar] [CrossRef]
- Chang, X.; Zhang, Y.; Zhu, J.; Yuxing, L.I.; Zhang, M.; Yang, X. Optimization of the process of nitrogen expansion refrigeration of BOG and the analysis of the adaptability of the sea. Chem. Ind. Eng. Prog. 2017, 36, 1619–1627. [Google Scholar] [CrossRef]
- Khan, M.S.; Lee, S.; Getu, M.; Lee, M. Knowledge inspired investigation of selected parameters on energy consumption in nitrogen single and dual expander processes of natural gas liquefaction. J. Nat. Gas Sci. Eng. 2015, 23, 324–337. [Google Scholar] [CrossRef]
- Finn, A. Are floating LNG facilities viable options? Hydrocarb. Process. 2009, 88, 31. [Google Scholar]
- Yumrutaş, R.; Kunduz, M.; Kanoğlu, M. Exergy analysis of vapor compression refrigeration systems. Exergy Int. J. 2002, 2, 266–272. [Google Scholar] [CrossRef]
- Pang, W.; Qingping, L.I.; Xie, B.; Xichong, Y.U.; Wang, Q. Parameter determination of dual nitrogen expansion technology for gas liquefaction in FLNG unit. Oil Gas Storage Transp. 2017, 36, 108–114. [Google Scholar]
- He, T.; Ju, Y. A novel conceptual design of parallel nitrogen expansion liquefaction process for small-scale LNG (liquefied natural gas) plant in skid-mount packages. Energy 2014, 75, 349–359. [Google Scholar] [CrossRef]
- Kim, M.; Mihaeye, K.; Min, J.; Lee, D.; Park, H.; Nguyen, X.C.; de Regt, C.; Kim, J.; Jang, J. Optimization of Nitrogen Liquefaction Cycle for Small/Medium Scale FLNG. In Proceedings of the Offshore Technology Conference, Houston, TX, USA, 1–4 May 2017. [Google Scholar] [CrossRef]
- Qyyum, M.A.; Qadeer, K.; Minh, L.Q.; Haider, J.; Lee, M. Nitrogen self-recuperation expansion-based process for offshore coproduction of liquefied natural gas, liquefied petroleum gas, and pentane plus. Appl. Energy 2019, 235, 247–257. [Google Scholar] [CrossRef]
- Gao, T.; Lin, W.; Gu, A.; Gu, M. Coalbed methane liquefaction adopting a nitrogen expansion process with propane pre-cooling. Appl. Energy 2010, 87, 2142–2147. [Google Scholar] [CrossRef]
- Shen, Y.Y.; Li, J.; Lin, R.Y.; Xi-Chong, Y.U.; Yu, X.C. Simulation of Liquefaction Process and Exergy Efficiency Analysis for FLNG System. J. Qufu Norm. Univ. (Nat. Sci.) 2016, 42, 84–91. [Google Scholar]
- Wang, W.; Wei, D.; Yuxing, L.I.; Zhu, J.; Gas, T.N. Scaling effect analysis on FLNG laboratory and pilot liquefaction tests. Oil Gas Storage Transp. 2018, 37, 462–468. [Google Scholar]
- Wang, W.C.; Wei, D.; Xing, L.Y.; Zhu, J.L. Scaling effect analysis and application study of FLNG liquefaction process system. Nat. Gas Chem. Ind. 2017, 42, 93–99+110. [Google Scholar]
- He, T.B.; Ju, Y.L. Performance improvement of nitrogen expansion liquefaction process for small-scale LNG plant. Cryogenics 2014, 61, 111–119. [Google Scholar] [CrossRef]
- Zhang, J.; Meerman, H.; Benders, R.; Faaij, A. Technical and economic optimization of expander-based small-scale natural gas liquefaction processes with absorption precooling cycle. Energy 2020, 191, 116592. [Google Scholar] [CrossRef]
- Mahabadipour, H.; Ghaebi, H. Development and comparison of two expander cycles used in refrigeration system of olefin plant based on exergy analysis. Appl. Therm. Eng. 2013, 50, 771–780. [Google Scholar] [CrossRef]
- Balmer, R.T. Chapter 14—Vapor and Gas Refrigeration Cycles. In Modern Engineering Thermodynamics; Balmer, R.T., Ed.; Academic Press: Boston, MA, USA, 2011; pp. 535–590. [Google Scholar] [CrossRef]
- Tugcu, A.; Arslan, O. Optimization of geothermal energy aided absorption refrigeration system—GAARS: A novel ANN-based approach. Geothermics 2017, 65, 210–221. [Google Scholar] [CrossRef]
- Mortazavi, A.; Somers, C.; Alabdulkarem, A.; Hwang, Y.; Radermacher, R. Enhancement of APCI cycle efficiency with absorption chillers. Energy 2010, 35, 3877–3882. [Google Scholar] [CrossRef]
- Zhu, J.; Zhang, W.; Li, Y.; Wang, W.; Liu, Y. Offshore adaptability of the nitrogen expander liquefaction process with pre-cooling. Appl. Therm. Eng. 2019, 155, 373–385. [Google Scholar] [CrossRef]
- He, T.; Ju, Y. Optimal synthesis of expansion liquefaction cycle for distributed-scale LNG (liquefied natural gas) plant. Energy 2015, 88, 268–280. [Google Scholar] [CrossRef]
- Khan, M.S.; Lee, S.; Hasan, M.; Lee, M. Process knowledge based opportunistic optimization of the N2–CO2 expander cycle for the economic development of stranded offshore fields. J. Nat. Gas Sci. Eng. 2014, 18, 263–273. [Google Scholar] [CrossRef]
- Yuan, Z.; Cui, M.; Xie, Y.; Li, C. Design and analysis of a small-scale natural gas liquefaction process adopting single nitrogen expansion with carbon dioxide pre-cooling. Appl. Therm. Eng. 2014, 64, 139–146. [Google Scholar] [CrossRef]
- Okafor, E.; Ojo, S. Comparative Analyses of an Optimized Dual Expansion, Natural Gas Liquefaction Process. In Proceedings of the SPE Nigeria Annual International Conference and Exhibition, Society of Petroleum Engineers, Lagos, Nigeria, 2–4 August 2016. [Google Scholar] [CrossRef]
- Zhu, J.; Li, Y.; Wang, W.; Liu, Y.; Yu, X. Offshore adaptability of the dual nitrogen expander process with CO2 pre-cooling. Nat. Gas Ind. 2012, 32, 89–95+127–128. [Google Scholar] [CrossRef]
- Xichong, Y.U.; Xie, B.; Yaling, W.U.; Yuxing, L.I.; Wang, W.; Zhu, J. Liquefaction technology of CO2-precooled dinitrogen expansion for large FLNG/FLPG device top module. Oil Gas Storage Transp. 2014, 33, 89–94. [Google Scholar]
- Chen, Z.; Ju, Y. Design and analysis of FLNG liquefaction and NGL recovery process adopting nitrogen expansion cycle with CO2 trans-critical pre-cooling. J. Chem. Eng. Jpn. 2016, 44, 5–11+69. [Google Scholar] [CrossRef]
- Kim, M.; Kim, Y.; Kim, M.; Kim, M.; Min, J. Advanced Liquefaction Cycle for Natural Gas. In Proceedings of the ASME 2018 37th International Conference on Ocean, Offshore and Arctic Engineering, Madrid, Spain, 17–22 June 2018. [Google Scholar]
- Kim, M.; Kim, M.; Lee, K.; Kim, H.; Lee, D.; Min, J.; Kim, J. Advanced Dual Refrigerant Expansion Cycle for LNG Liquefaction. Plant J. 2019, 15, 46–55. [Google Scholar]
- Park, H.; Kim, M.; Kim, C.; Kim, H.; Lee, K.; Kim, M.; Lee, D. Dual Refrigerant LNG Liquefaction Cycle for Offshore FLNG and Its Pilot Plant. In Proceedings of the Offshore Technology Conference, Houston, TX, USA, 4–7 May 2020. [Google Scholar] [CrossRef]
- Ding, H.; Sun, H.; He, M. Optimisation of expansion liquefaction processes using mixed refrigerant N2–CH4. Appl. Therm. Eng. 2016, 93, 1053–1060. [Google Scholar] [CrossRef]
- Zheng, Y.P.; Zhang, W.C.; Hao, Z.P.; Jin, J.Q.; Li, S.S. Influence factors analysis of N2-CH4 expansion and refrigeration process. Mod. Chem. Ind. 2015, 35, 165–168. [Google Scholar] [CrossRef]
- Moein, P.; Sarmad, M.; Khakpour, M.; Delaram, H. Methane addition effect on a dual nitrogen expander refrigeration cycle for LNG production. J. Nat. Gas Sci. Eng. 2016, 33, 1–7. [Google Scholar] [CrossRef]
- Liang, P.; Sun, S.; Li, Y.; Hanfei, T.; Zhao, M. Calculation and Thermodynamic Analysis on Liquefaction Processes of Natural Gas with Expanders. J. Xi’an Jiaotong Univ. 2007, 41, 1115–1118+1126. [Google Scholar]
- Cao, W.; Lu, X.; Lin, W.; Gu, A. Parameter comparison of two small-scale natural gas liquefaction processes in skid-mounted packages. Appl. Therm. Eng. 2006, 26, 898–904. [Google Scholar] [CrossRef]
- Ding, H.; Sun, H.; Ming, Z.; Li, Y.; Lian, Y. Seletction of refrigerant composition for energy efficient expansion liquefaction process. Cryog. Supercond. 2014, 42, 81–85. [Google Scholar] [CrossRef]
- He, T.; Lin, W. Design and optimization of nitrogen expansion liquefaction processes integrated with ethane separation for high ethane-content natural gas. Appl. Therm. Eng. 2020, 173, 115272. [Google Scholar] [CrossRef]
- Qyyum, M.A.; Qadeer, K.; Lee, S.; Lee, M. Innovative propane-nitrogen two-phase expander refrigeration cycle for energy-efficient and low-global warming potential LNG production. Appl. Therm. Eng. 2018, 139, 157–165. [Google Scholar] [CrossRef]
- Qyyum, M.A.; Qadeer, K.; Ahmad, A.; Lee, M. Gas–liquid dual-expander natural gas liquefaction process with confirmation of biogeography-based energy and cost savings. Appl. Therm. Eng. 2020, 166, 114643. [Google Scholar] [CrossRef]
- Gao, Y.M.; Wang, X. Simulation and Analysis of N2-CH4 Expansion Liquefaction Process. Build. Energy Environ. 2017, 36, 73–75+83. [Google Scholar]
- Geist, J.M. The role of LNG in energy supply. Int. J. Refrig. 1983, 6, 283–297. [Google Scholar] [CrossRef]
- Khan, M.S.; Lee, S.; Rangaiah, G.P.; Lee, M. Knowledge based decision making method for the selection of mixed refrigerant systems for energy efficient LNG processes. Appl. Energy 2013, 111, 1018–1031. [Google Scholar] [CrossRef]
- Xu, X.; Liu, J.; Jiang, C.; Cao, L. The correlation between mixed refrigerant composition and ambient conditions in the PRICO LNG process. Appl. Energy 2013, 102, 1127–1136. [Google Scholar] [CrossRef]
- Price, B.C.; Hoffart, S.D. LNG Supply Developments Using Distributed LNG Concepts. In Proceedings of the Sixteenth International Conference and Exhibition on Liquefied Natural Gas: LNG 16–GNL 16, Oran, Algeria, 18–21 April 2010. [Google Scholar]
- Barclay, M.; Denton, N. Selecting offshore LNG processes. LNG J. 2005, 10, 34–36. [Google Scholar]
- Meek, H.J.; Cariou, H.; Schier, M. SS: Offshore Floating LNG-LNG FPSO Development-bringing two industries together. In Proceedings of the Offshore Technology Conference, Houston, TX, USA, 4–7 May 2009. [Google Scholar]
- Terry, L. Comparison of liquefaction process. LNG J. 1998, 21, 28–33. [Google Scholar]
- Zhang, Y.; Gai, J.; Jiang, H.; Liu, X.; Amp, B. Application of PRICO® liquefaction technology in offshore floating devices. Nat. Gas Ind. 2018, 38, 115–120. [Google Scholar]
- Bukowski, J.; Liu, Y.N.; Boccella, S.; Kowalski, L. Innovations in natural gas liquefaction technology for future LNG plants and floating LNG facilities. In Proceedings of the International Gas Union Research Conference, Seoul, Korea, 19 October 2011. [Google Scholar]
- Talib, J.H.; Price, B. Development of Floating LNG Production Units with Modular/Scalable SMR Processes. In Proceedings of the Offshore Technology Conference, Houston, TX, USA, 2–5 May 2011. [Google Scholar]
- Talib, J.H.; Germinder, B. Game-Changing Floating LNG Solutions. In Proceedings of the Offshore Technology Conference, Houston, TX, USA, 2–5 May 2016. [Google Scholar]
- Kim, I.H.; Dan, S.; Cho, S.; Lee, G.; Yoon, E.S. Optimization of Single-stage Mixed Refrigerant LNG Process Considering Inherent Explosion Risks. Korean Chem. Eng. Res. 2014, 52, 467–474. [Google Scholar] [CrossRef] [Green Version]
- Corneliussen, M.; Samnøy, E. Near Shore FLNG Concept Evaluations (Master thesis, NTNU). Available online: http://hdl.handle.net/11250/2350048 (accessed on 6 April 2018).
- You, W.; Chae, M.; Park, J.; Lim, Y. Potential Explosion Risk Comparison between SMR and DMR Liquefaction Processes at Conceptual Design Stage of FLNG. J. Ocean. Eng. 2018, 32, 95–105. [Google Scholar] [CrossRef] [Green Version]
- Yin, Q. Adaptability and regulating performance of the single mixed refrigerant process. Cryogenics 2010, 173, 1–4. [Google Scholar] [CrossRef]
- Jensen, J.B.; Skogestad, S. Optimal Operation of a Simple LNG Process. IFAC Proc. 2006, 39, 241–246. [Google Scholar] [CrossRef] [Green Version]
- Husnil, Y.A.; Yeo, G.; Lee, M. Plant-wide control for the economic operation of modified single mixed refrigerant process for an offshore natural gas liquefaction plant. Chem. Eng. Res. Des. 2014, 92, 679–691. [Google Scholar] [CrossRef]
- Lee, S.; Long, N.V.D.; Lee, M. Design and Optimization of Natural Gas Liquefaction and Recovery Processes for Offshore Floating Liquefied Natural Gas Plants. Ind. Eng. Chem. Res. 2012, 51, 10021–10030. [Google Scholar] [CrossRef]
- Lee, W.; An, J.; Lee, J.M.; Lim, Y. Design of single mixed refrigerant natural gas liquefaction process considering load variation. Chem. Eng. Res. Des. 2018, 139, 89–103. [Google Scholar] [CrossRef]
- Finn, A.; Johnson, G.; Tomlinson, T. Developments in natural gas liquefaction. Hydrocarb. Process. 1999, 78, 47–59. [Google Scholar]
- Sieminski, A.; Energy Information Administration. International Energy Outlook; U.S. Energy Information Administration: Washington, DC, USA, 2016. [Google Scholar]
- Vatani, A.; Mehrpooya, M.; Palizdar, A. Advanced exergetic analysis of five natural gas liquefaction processes. Energy Convers. Manag. 2014, 78, 720–737. [Google Scholar] [CrossRef]
- Mehrpooya, M.; Ansarinasab, H. Exergoeconomic evaluation of single mixed refrigerant natural gas liquefaction processes. Energy Convers. Manag. 2015, 99, 400–413. [Google Scholar] [CrossRef]
- Niu, G.; Huang, Y.H.; Wang, J. Thermodynamic analysis of liquefied natural gas process. Chem. Eng. 2005, 33, 71–74. [Google Scholar] [CrossRef]
- He, T.; Ju, Y. Design and Optimization of a Novel Mixed Refrigerant Cycle Integrated with NGL Recovery Process for Small-Scale LNG Plant. Ind. Eng. Chem. Res. 2014, 53, 5545–5553. [Google Scholar] [CrossRef]
- Liang, Z.; Li, S.; Tian, J.; Zhu, X.; Mei, Q.; Zhang, L. An experimental study of technical measures for energy saving of CNG compressors. Nat. Gas Ind. 2013, 33, 95–98. [Google Scholar] [CrossRef]
- Zhu, Y.; Huang, F.L.; Si, Y.H.; Li, D.; Fan, Z. Exergy analysis of liquefied natural gas process with mixed refrigerant cycle. Mod. Chem. Ind. 2015, 35, 172–175. [Google Scholar] [CrossRef]
- Chen, Z. Study on Mixed Refrigerant Cycle Liquefied Natural Gas Technology. Low Temp. Spec. Gases 2019, 37, 17–23. [Google Scholar]
- Tak, K.; Lee, I.; Kwon, H.; Kim, J.; Ko, D.; Moon, I. Comparison of Multistage Compression Configurations for Single Mixed Refrigerant Processes. Ind. Eng. Chem. Res. 2015, 54, 9992–10000. [Google Scholar] [CrossRef]
- Pham, T.N.; Long, N.V.D.; Lee, S.; Lee, M. Enhancement of single mixed refrigerant natural gas liquefaction process through process knowledge inspired optimization and modification. Appl. Therm. Eng. 2017, 110, 1230–1239. [Google Scholar] [CrossRef]
- Qyyum, M.A.; Long, N.V.D.; Minh, L.Q.; Lee, M. Design optimization of single mixed refrigerant LNG process using a hybrid modified coordinate descent algorithm. Cryogenics 2018, 89, 131–140. [Google Scholar] [CrossRef]
- Qyyum, M.A.; Ali, W.; Long, N.V.D.; Khan, M.S.; Lee, M. Energy efficiency enhancement of a single mixed refrigerant LNG process using a novel hydraulic turbine. Energy 2018, 144, 968–976. [Google Scholar] [CrossRef]
- Qyyum, M.A.; Haider, J.; Qadeer, K.; Lee, M. Performance enhancement of offshore LNG processes by introducing optimal mixed refrigerant self-cooling recuperator. In Proceedings of the 11th International Conference on Applied Energy 2019, Västerås, Sweden, 12–15 August 2019. [Google Scholar]
- Khan, M.S.; Chaniago, Y.D.; Getu, M.; Lee, M. Energy saving opportunities in integrated NGL/LNG schemes exploiting: Thermal-coupling common-utilities and process knowledge. Chem. Eng. Process. Process Intensif. 2014, 82, 54–64. [Google Scholar] [CrossRef]
- Paradowski, H.; Bamba, M.; Bladanet, C. Propane precooling cycles for increased LNG train capacity. In Proceedings of the 14th International Conference and Exhibition on Liquefied Natural Gas, 92973 Paris La Défense, Cedex, France, 21–24 March 2004; pp. 107–124. [Google Scholar]
- Mortazavi, A.; Somers, C.; Hwang, Y.; Radermacher, R.; Rodgers, P.; Al-Hashimi, S. Performance enhancement of propane pre-cooled mixed refrigerant LNG plant. Appl. Energy 2012, 93, 125–131. [Google Scholar] [CrossRef]
- Pan, H.; Li, S.; Li, Y.; Zhu, J. Optimization in the Control Modes of Propane Pre-cooling and Mixed-refrigerant Process. J. Refrig. 2016, 37, 53–58. [Google Scholar]
- Wang, H.; Long, Z.; Liu, J.; Li, L.; Zhang, Y. Research on the Process of Natural Gas Liquefaction C3/MRC. Nat. Gas Oil 2016, 34, 32–35+7–8. [Google Scholar]
- Wang, H. The Industrialized Application of the Three-cascade Mixed-refrigeration Liquefaction Technology about Natural Gas. Refrig. Air Cond. 2014, 28, 191–198. [Google Scholar]
- Wang, B.Q. LNG processing technologies and comparison analysis. Nat. Gas Ind. 2009, 29, 111–113. [Google Scholar] [CrossRef]
- Yiming, M.; Dongjun, W.; Bo, C. Study on mixed refrigerant formulation optimization for natural gas liquefaction. Chem. Eng. Oil Gas 2015, 44, 65–69. [Google Scholar] [CrossRef]
- Chen, G. Development of Natural Gas Liquefaction Process and its Available Energy Analysis. Nat. Gas Oil 2013, 31, 27–32+5. [Google Scholar]
- Biyanto, T.R.; Cordova, H.; Matradji; Priambodo, K.; Sarah, A.Z.; Hermantara, R.C.; Sitorus, C.D. Optimization of energy efficiency in natural gas liquefaction process using plantwide control method. IOP Conf. Ser. Earth Environ. Sci. 2021, 672, 012105. [Google Scholar] [CrossRef]
- Faber, F.; Bliault, A.; Resweber, L.; Jones, P. Floating LNG solutions from the drawing board to reality. In Proceedings of the Offshore Technology Conference, Houston, TX, USA, 6–9 May 2002. [Google Scholar]
- Wood, D.; Mokhatab, S.; Economides, M.J. Offshore Natural Gas Liquefaction Process and Development Issues. SPE Proj. Facil. Constr. 2007, 2, 1–7. [Google Scholar] [CrossRef]
- Shin, H.; Lim, Y.K.; Oh, S.-K.; Lee, S.G.; Lee, J.M. Dynamic matrix control applied on propane-mixed refrigerant liquefaction process. Korean J. Chem. Eng. 2017, 34, 287–297. [Google Scholar] [CrossRef]
- Zheng, Y.; Dan, X.; Liu, X.; Li, J. Influence factors analysis of propane-mixed refrigerant natural gas liquefaction process based on HYSYS software model. Chem. Eng. Oil Gas 2013, 42, 473–477. [Google Scholar]
- Akinsipe, O.; Anozie, A.; Babatunde, D. A study of LNG processes to determine the effect of end flash systems on efficiency. Arch. Thermodyn. 2020, 41, 35–63. [Google Scholar] [CrossRef]
- Mortazavi, A.; Alabdulkarem, A.; Hwang, Y.; Radermacher, R. Novel combined cycle configurations for propane pre-cooled mixed refrigerant (APCI) natural gas liquefaction cycle. Appl. Energy 2014, 117, 76–86. [Google Scholar] [CrossRef]
- Rodgers, P.; Mortazavi, A.; Eveloy, V.; Al-Hashimi, S.; Hwang, Y.; Radermacher, R. Enhancement of LNG plant propane cycle through waste heat powered absorption cooling. Appl. Therm. Eng. 2012, 48, 41–53. [Google Scholar] [CrossRef]
- Sun, H.; He Ding, D.; He, M.; Shoujun Sun, S. Simulation and optimization of AP-X process in a large-scale LNG plant. J. Nat. Gas. Sci. Eng. 2016, 32, 380–389. [Google Scholar] [CrossRef]
- Liu, J.; Bai, G.L.; Ming-Lei, J.I. Method for advancement evaluation of natural gas liquefaction process. Chem. Eng. 2016, 44, 69–73+78. [Google Scholar] [CrossRef]
- Šesták, J.; Berggren, G. Study of the kinetics of the mechanism of solid-state reactions at increasing temperatures. Thermochim. Acta 1971, 3, 1–12. [Google Scholar] [CrossRef]
- Forg, W. Liquefaction of Natural Gas. US4112700 A, 12 September 1978. [Google Scholar]
- Castillo, L.; Nadales, R.; González, C.; Dorao, C.; Viloria, A. Technology selection for liquefied natural gas (LNG) on baseload plants. In Proceedings of the XIX International Gas Convention, Caracas, Venezuela, 2010. [Google Scholar]
- Khan, M.S.; Karimi, I.A.; Lee, M. Evolution and optimization of the dual mixed refrigerant process of natural gas liquefaction. Appl. Therm. Eng. 2016, 96, 320–329. [Google Scholar] [CrossRef]
- Xing, D.X.; Wei, L.; Hua, T.J.; Zhang, Y.T. LNG Liquefaction Process and Field Application Overview. Guangzhou Chem. Ind. 2015, 43, 35–38. [Google Scholar]
- Jin, C.; Son, H.; Lim, Y. Optimization and economic analysis of liquefaction processes for offshore units. Appl. Therm. Eng. 2019, 163, 114334. [Google Scholar] [CrossRef]
- Hwang, J.; Lee, K.-Y. Optimal liquefaction process cycle considering simplicity and efficiency for LNG FPSO at FEED stage. Comput. Chem. Eng. 2014, 63, 1–33. [Google Scholar] [CrossRef]
- Qyyum, M.A.; Duong, P.L.T.; Minh, L.Q.; Lee, S.; Lee, M. Dual mixed refrigerant LNG process: Uncertainty quantification and dimensional reduction sensitivity analysis. Appl. Energy 2019, 250, 1446–1456. [Google Scholar] [CrossRef]
- Husnil, Y.A.; Lee, M. Synthesis of an Optimizing Control Structure for Dual Mixed Refrigerant Process. J. Chem. Eng. Jpn. 2014, 47, 678–686. [Google Scholar] [CrossRef] [Green Version]
- Wang, Q.; Yu, X.; Xiao, K.; Li, Y.; Cheng, B. The Dynamic Performance Analysis of Double Mixed Refrigerant Liquefaction Process for Floating Liquid Natural Gas (FLNG). In Proceedings of the 27th International Ocean and Polar Engineering Conference, San Francisco, CA, USA, 25–30 June 2017; p. ISOPE-I-17-322. [Google Scholar]
- Chang, X.; Zhu, J.; Li, Y.; Jie, C.; Zeng, W. Floating DMR LNG-FPSO process with high efficiency and good offshore adaptability. Nat. Gas Ind. 2017, 37, 88–96. [Google Scholar] [CrossRef]
- Newton, C.L. Dual Mixed Refrigerant Natural Gas Liquefaction with Staged Compression. US. Patent 4525185 A, 24 October 1984. [Google Scholar]
- Liu, Y.N.; Pervier, J.W. Dual Mixed Refrigerant Process. CA1230047 A1, 1984. [Google Scholar]
- Roberts, M.J.; Agrawal, R. Dual Mixed Refrigerant Cycle for Gas Liquefaction. US. Patent 6,119,479, 7 December 1999. [Google Scholar]
- Bukowski, J.D.; Liu, Y.N.; Pillarella, M.R.; Boccella, S.J.; Kennington, W.A. Natural Gas Liquefaction Technology for Floating LNG Facilities; IGRC: Seoul, Korea, 2013. [Google Scholar]
- Lee, I.; Moon, I. Economic Optimization of Dual Mixed Refrigerant Liquefied Natural Gas Plant Considering Natural Gas Extraction Rate. Ind. Eng. Chem. Res. 2017, 56, 2804–2814. [Google Scholar] [CrossRef]
- Ait-Ali, M.A. Optimal Mixed Refrigerant Liquefaction of Natural Gas; Stanford University: Stanford, CA, USA, 1979. [Google Scholar]
- Wang, S.; Liu, L.; Zhang, L.; Du, J.; Wu, K. Conceptual design, simulation and analysis of novel AP-X™ system integrated with NGL recovery process for large-scale LNG plant. J. Chem. Ind. Eng. Soc. China 2019, 70, 508–515. [Google Scholar] [CrossRef]
- Qualls, W.R.; Huang, S.; Elliot, D.; Chen, J.J.; Yao, J.; Zhang, Y. Benefits of integrating NGL extraction and LNG liquefaction technology. In Proceedings of the AIChE Spring National Meeting, 5th Topical Conference on Natural Gas, Atlanta, Georgia, 10–14 April 2005. [Google Scholar]
- Khan, M.S.; Park, J.H.; Chaniago, Y.D.; Lee, M. Energy Efficient Process Structure Design of LNG/NGL Recovery for Offshore FLNG Plant. Energy Procedia 2014, 61, 599–602. [Google Scholar] [CrossRef] [Green Version]
- Cuellar, K.T.; Wilkinson, J.D.; Hudson, P.H.M.; Pierce, P.M.C. CO-producing LNG from cryogenic NGL recovery plants. In Proceedings of the 81th Annual Convention of the Gas Processors Association, Dallas, TX, USA, 12 March 2002. [Google Scholar]
- Hudson, H.M.; Wilkinson, J.D.; Cuellar, K.T.; Pierce, M.C. Integrated liquids recovery technology improves LNG production efficiency. In Proceedings of the 82nd Annual Convention of the Gas Processors Association, San Antonio, TX, USA, 13 March 2003. [Google Scholar]
- Brostow, A.A.; Roberts, M.J. Integrated NGL Recovery in the Production of Liquefied Natural Gas. U.S. Patent Application 13/669,539, 14 March 2013. [Google Scholar]
- Uwitonze, H.; Lee, I.; Hwang, K.S. Alternatives of integrated processes for coproduction of LNG and NGLs recovery. Chem. Eng. Process. Process Intensif. 2016, 107, 157–167. [Google Scholar] [CrossRef]
- Getu, M.; Mahadzir, S.; Long, N.V.D.; Lee, M. Techno-economic analysis of potential natural gas liquid (NGL) recovery processes under variations of feed compositions. Chem. Eng. Res. Des. 2013, 91, 1272–1283. [Google Scholar] [CrossRef]
- Ghorbani, B.; Hamedi, M.-H.; Amidpour, M.; Shirmohammadi, R. Implementing absorption refrigeration cycle in lieu of DMR and C3MR cycles in the integrated NGL, LNG and NRU unit. Int. J. Refrig. 2017, 77, 20–38. [Google Scholar] [CrossRef]
- Wang, M.; Xu, Q. Optimal design and operation for simultaneous shale gas NGL recovery and LNG re-gasification under uncertainties. Chem. Eng. Sci. 2014, 112, 130–142. [Google Scholar] [CrossRef]
- He, T.; Lin, W. Design and optimization of integrated single mixed refrigerant processes for coproduction of LNG and high-purity ethane. Int. J. Refrig. 2020, 119, 216–226. [Google Scholar] [CrossRef]
- Alabdulkarem, A.; Mortazavi, A.; Hwang, Y.; Radermacher, R.; Rogers, P. Optimization of propane pre-cooled mixed refrigerant LNG plant. Appl. Therm. Eng. 2011, 31, 1091–1098. [Google Scholar] [CrossRef]
- Townsend, D.W.; Linnhoff, B. Heat and power networks in process design. Part I: Criteria for placement of heat engines and heat pumps in process networks. AICHE J. 1983, 29, 742–748. [Google Scholar] [CrossRef]
- Song, Y.X.; Qing-Fang, L.I.; Zi-Li, L.I.; Zhu, H.B. A study on selecting composition of mixed refrigerant based on KBO method. Nat. Gas Chem. Ind. 2014, 39, 56–60. [Google Scholar]
- Zhao, M.; Li, Y. Analysis for selecting mixed refrigerant composition based on raw natural gas in propane pre-cooled mixed refrigerant liquefaction process. J. Xi’an Jiaotong Univ. 2010, 44, 108–112. [Google Scholar]
- Zhao, M.; Li, Y. Analysis for interrelations between mixed refrigerant composition and raw natural gas in C3/MRC liquefaction cycle. J. Chem. Ind. Eng. Soc. China 2009, 60, 50–57. [Google Scholar]
- Mortazavi, A.; Alabdulkarem, A.; Hwang, Y.; Radermacher, R. Development of a robust refrigerant mixture for liquefaction of highly uncertain natural gas compositions. Energy 2016, 113, 1042–1050. [Google Scholar] [CrossRef]
- Venkatarathnam, G.; Timmerhaus, K.D. Cryogenic Mixed Refrigerant Processes; Springer: Berlin/Heidelberg, Germany, 2008. [Google Scholar] [CrossRef]
- Yin, Q.S.; Li, H.Y.; Fan, Q.H.; Jia, L.X. Economic Analysis of Mixed-Refrigerant Cycle and Nitrogen Expander Cycle in Small Scale Natural Gas Liquefier. Am. Inst. Phys. 2008, 985, 1159–1165. [Google Scholar] [CrossRef]
- Guo, Q.; Zhao, X.P.; He, B.C.; Dou, L.L.; Gao, M.M. Study on energy consumption optimization of mixed refrigerant circulating liquefaction process. Energy Chem. Ind. 2019, 40, 63–69. [Google Scholar]
- Yang, X.L.; Fan, D.D.; Yuan, R.N.; Zhang, X.; Li, W.H. Optimization of operation parameters and the ratio of mixed refrigerant in process of mixed refrigerant cycle. Chem. Eng. 2018, 46, 1–6+20. [Google Scholar] [CrossRef]
- Fan, M.; Zhe, J.; Ji, J.; Liu, S.; Zhang, S.; Petroleum, S.; Branch, Q.; Fuel, C.A. Study on optimization of mixed refrigerant composition based on SVM. Cryog. Supercond. 2017, 45, 32–36+65. [Google Scholar] [CrossRef]
- Xiao, R.G.; Gao, X.; Jin, W.B.; Yao, P.F.; Chen, Y.C. Optimization simulation of natural gas liquefaction process with double mixed refrigerant cycle. Chem. Eng. 2019, 47, 62–67+73. [Google Scholar]
- Khan, M.S.; Lee, M. Design optimization of single mixed refrigerant natural gas liquefaction process using the particle swarm paradigm with nonlinear constraints. Energy 2013, 49, 146–155. [Google Scholar] [CrossRef]
- Qyyum, M.A.; Lee, M. Hydrofluoroolefin-based novel mixed refrigerant for energy efficient and ecological LNG production. Energy 2018, 157, 483–492. [Google Scholar] [CrossRef]
- Jia, R.; Lin, W. Influence of heavy hydrocarbons in mixed refrigerant on natural gas liquefaction processes. J. Chem. Ind. Eng. Soc. China 2015, 66, 379–386. [Google Scholar] [CrossRef]
- Bowen, R.R.; Gentry, M.C.; Nelson, E.D.; Papka, S.D.; Leger, A.T. Pressurized liquefied natural gas (PLNG): A new gas transportation technology. Proc. GasTech. 2005. Available online: http://www.ivt.ntnu.no/ept/fag/tep4215/innhold/LNG%20Conferences/2005/SDS_TIF/050189PR.pdf (accessed on 30 August 2022).
- Xiong, X.; Lin, W.; Gu, A. Design and optimization of offshore natural gas liquefaction processes adopting PLNG (pressurized liquefied natural gas) technology. J. Nat. Gas Sci. Eng. 2016, 30, 379–387. [Google Scholar] [CrossRef]
- Lee, S.H.; Seo, Y.K.; Chang, D.J. Techno-economic Analysis of Acid Gas Removal and Liquefaction for Pressurized LNG. IOP Conf. Ser. Mater. Sci. Eng. 2018, 358, 012066. [Google Scholar] [CrossRef]
- Shen, T.; Gao, T.; Lin, W.; Gu, A. Determination of CO2 Solubility in Saturated Liquid CH4 + N2 and CH4 + C2H6 Mixtures above Atmospheric Pressure. J. Chem. Eng. Data 2012, 57, 2296–2303. [Google Scholar] [CrossRef]
- Xiaochen, H.; Ting, G.; Wensheng, L. Preliminary research on CO2 freeze-out in PLNG process. Cryog. Supercond. 2009, 37, 15–18. [Google Scholar] [CrossRef]
- Nelson, E.D.; Papka, S.D.; Bowen, R.R.; Gentry, M.C.; Leger, A.T. Pressurized LNG: A Paradigm Shift in Gas Transportation. In Proceedings of the SPE Middle East Oil and Gas Show and Conference, Bahrain, 12–15 March 2005. [Google Scholar]
- Papka, S.D.; Gentry, M.C.; Leger, A.T.; Bowen, R.R.; Nelson, E.D. Pressurized LNG: A new technology for gas commercialization. In Proceedings of the Fifteenth International Offshore and Polar Engineering Conference, Seoul, Korea, 19–24 June 2005. [Google Scholar]
- Fairchild, D.P.; Smith, P.P.; Biery, N.E.; Farah, A.M.; Lillig, D.B.; Jackson, T.S.; Sisak, W.J. Pressurized LNG: Prototype container fabrication. In Proceedings of the Fifteenth International Offshore and Polar Engineering Conference, Seoul, Korea, 19–24 June 2005. [Google Scholar]
- Lee, J.H.; Yeol, L.J.; Yoo, S. Development of Innovative LNG Production, Transportation, and Regasification System. In Proceedings of the Offshore Technology Conference, Offshore Technology Conference, Houston, TX, USA, 2–5 May 2011. [Google Scholar] [CrossRef]
- Xiaojun, X.; Wensheng, L.; Anzhong, G. Simulation and optimal design of a natural gas pressurized liquefaction process with gas expansion refrigeration. Nat. Gas Ind. 2013, 33, 97–101. [Google Scholar] [CrossRef]
- Ryan, J.M.; Schaffert, F.W. CO2 recovery by the Ryan/Holmes process. Chem. Eng. Progress 1984, 80, 53–56. [Google Scholar]
- Berstad, D.; Nekså, P.; Anantharaman, R. Low-temperature CO2 Removal from Natural Gas. Energy Procedia 2012, 26, 41–48. [Google Scholar] [CrossRef] [Green Version]
- Lee, J.; Jung, J.; Kim, K. Development of CO2 tolerant LNG production system. In Proceedings of the Offshore Technology Conference, Houston, TX, USA, 30 April–3 May 2012. [Google Scholar]
- Zhang, L.; Burgass, R.; Chapoy, A.; Tohidi, B.; Solbraa, E. Measurement and Modeling of CO2 Frost Points in the CO2–Methane Systems. J. Chem. Eng. Data 2011, 56, 2971–2975. [Google Scholar] [CrossRef]
- Xiaojun, X.; Wensheng, L.; Anzhong, G. Feasibility study on cryogenic separation of CH_4-CO_2 binary system. Cryog. Supercond. 2012, 40, 1–4. [Google Scholar] [CrossRef]
- Hart, A.; Gnanendran, N. Cryogenic CO2 capture in natural gas. Energy Procedia 2009, 1, 697–706. [Google Scholar] [CrossRef] [Green Version]
- Maqsood, K.; Pal, J.; Turunawarasu, D.; Pal, A.J.; Ganguly, S. Performance enhancement and energy reduction using hybrid cryogenic distillation networks for purification of natural gas with high CO2 content. Korean J. Chem. Eng. 2014, 31, 1120–1135. [Google Scholar] [CrossRef]
- Lin, W.; Xiong, X.; Gu, A. Optimization and thermodynamic analysis of a cascade PLNG (pressurized liquefied natural gas) process with CO2 cryogenic removal. Energy 2018, 161, 870–877. [Google Scholar] [CrossRef]
- Xiong, X.; Lin, W.; Gu, A. Integration of CO2 cryogenic removal with a natural gas pressurized liquefaction process using gas expansion refrigeration. Energy 2015, 93, 1–9. [Google Scholar] [CrossRef]
- Anzhong, G.; Yumei, S.; Rongshun, W.; Gang, Z. Natural gas liquefaction processes and systems. Cryog. Technol. 2003, 1, 1–6. [Google Scholar]
- Zhengwei, L.S.M.C.L.; Xiaobo, C. Optimal design and analysis on small-scale natural gas liquefaction in nitrogen expander cycle. Cryogenics 2009, 24, 47–51. [Google Scholar] [CrossRef]
- Lü, P.-F.; Lu, Y.W.; Liu, G.L.; Ma, C.F. Parameters Optimization of Small-Scale Natutal Gas Expander Liquefaction Process. K. Cheng Je Wu Li Hsueh Pao/J. Eng. Thermophys. 2011, 32, 1396–1398. [Google Scholar] [CrossRef] [Green Version]
- Cao, W.; Wu, J.; Lu, X.; Lin, W.; Gu, A. Thermodynamic analysis on mixed refrigerant cycle of small scale natural gas liquefaction process in skid-mounted package. J. Chem. Ind. Eng. 2008, 59, 53–59. [Google Scholar]
- He, T.; Ju, Y. Simulation and analysis of liquefaction process for small-scale liquefied natural gas plants in skid-mounted packages. Cryog. Supercond. 2013, 41, 5–9. [Google Scholar] [CrossRef]
- Yang, W.; Cao, X.W.; Sun, L.; Wang, D. Natural gas liquefaction technology research status and progress. Nat. Gas Chem. Ind. 2015, 40, 88–93. [Google Scholar]
- Shan, T.W. Research Framework on FLNG for Operation in China. China Offshore Platf. 2017, 32, 6–10+19. [Google Scholar]
- Lin, W.S.; An-Zhong, G.U.; Zhu, G. Selection for the process for liquefaction plants of natural gas. Vac. Cryog. 2001, 7, 105–109. [Google Scholar]
- Xichong, Y.U.; Xie, B.; Yuxing, L.I.; Liu, M.; Yan, L.I.; Wang, Q.; Zhu, X.; Zhu, J. Optimization of FLNG liquefaction process used for the development of deepwater gas field in the South China Sea. Subsea Pipeline Shipp. 2018, 37, 228–235. [Google Scholar] [CrossRef]
- Hui, P.U.; Chen, J. Study on Comparative Selection of LNG-FPSO Liquefaction Process Schemes. Refrig. Technol. 2011, 31, 31–34. [Google Scholar]
Figure 1.
Air pollutant emissions analysis for natural gas compared with coal and oil [3]. Reproduced with permission from Energy Proceedings.
Figure 1.
Air pollutant emissions analysis for natural gas compared with coal and oil [3]. Reproduced with permission from Energy Proceedings.
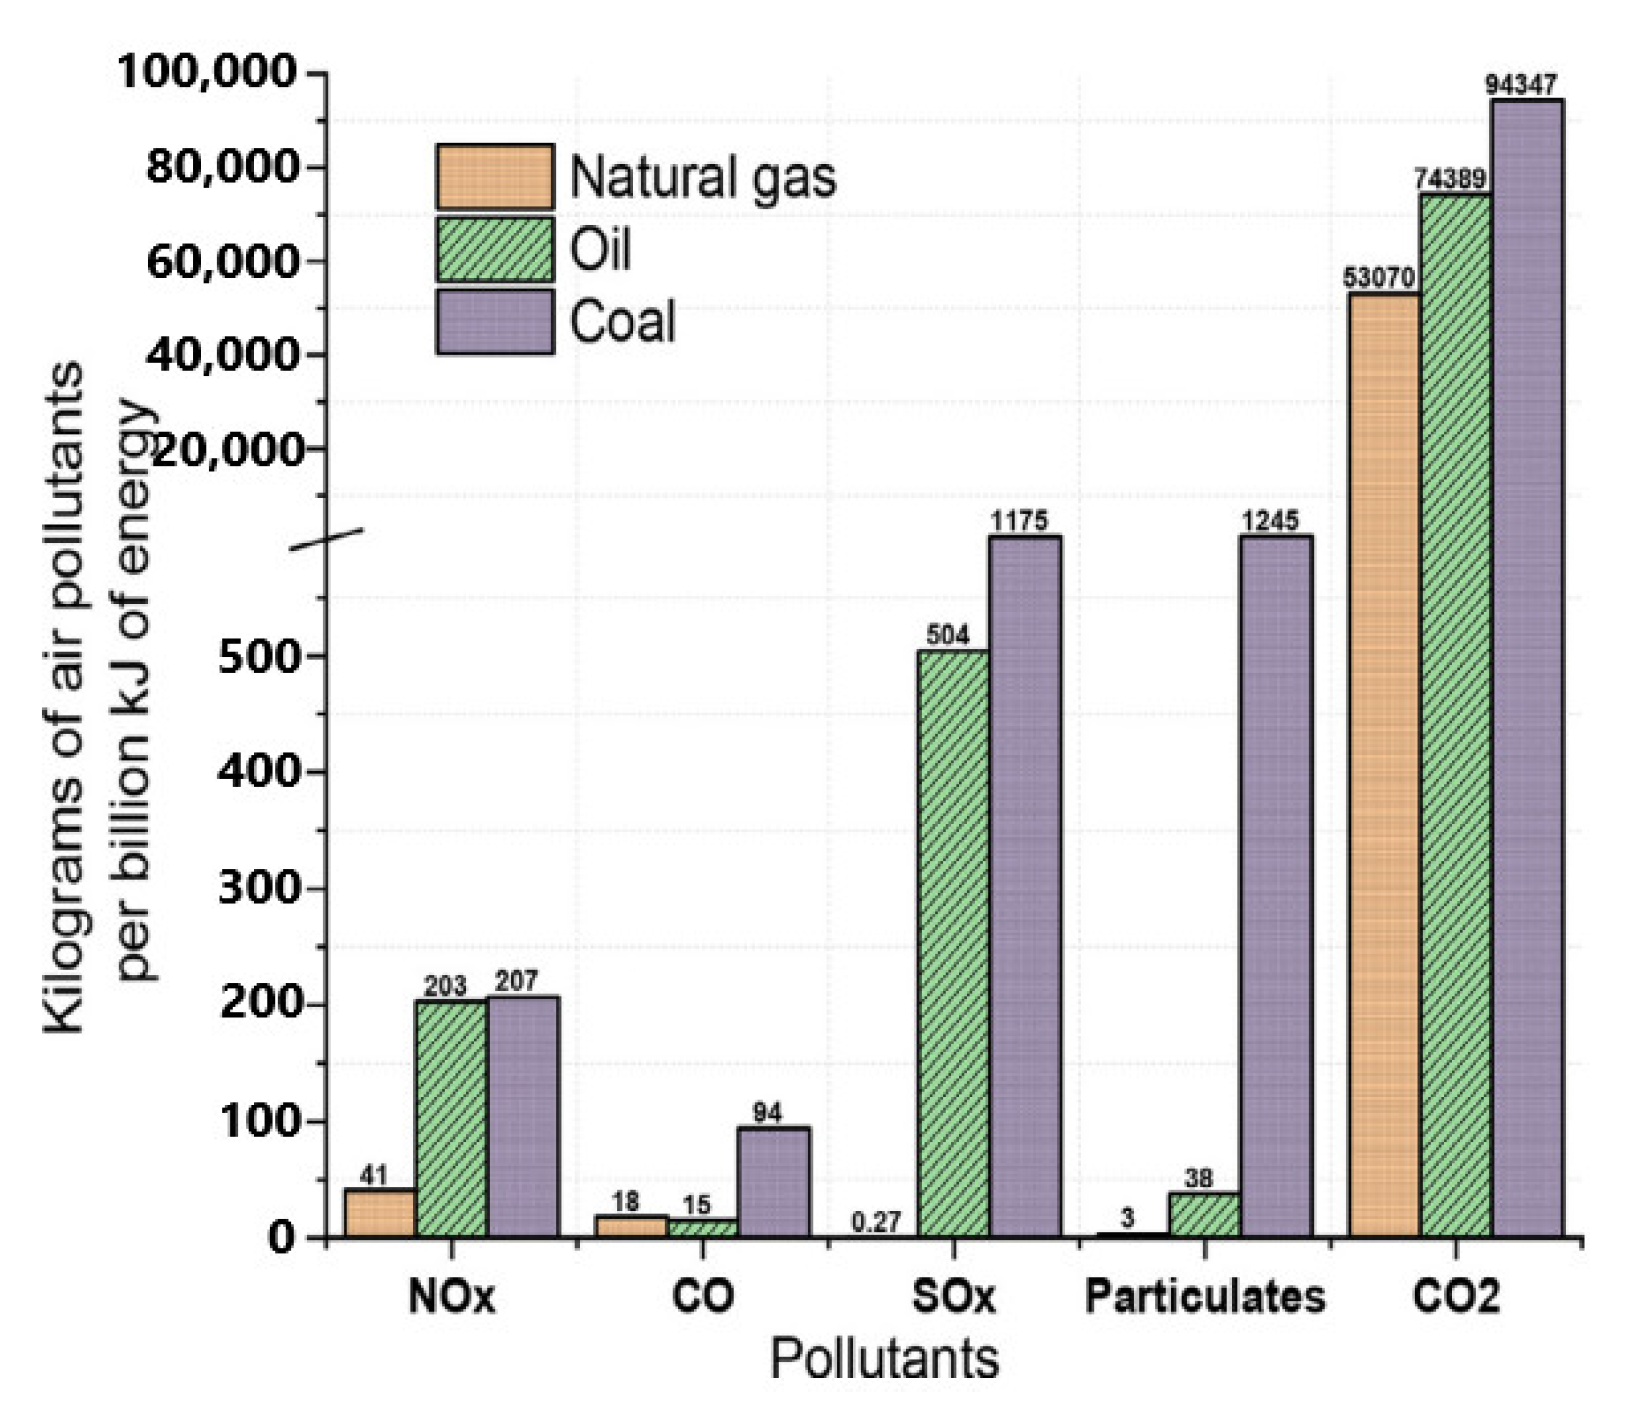
Figure 2.
LNG value chain and the cost breakdown [14]. Reprinted (adapted) with permission from {Lee, I.; Park, J.; Moon, I. Key Issues and Challenges on the Liquefied Natural Gas Value Chain: A Review from the Process Systems Engineering Point of View. Ind. Eng. Chem. Res. 2018, 57, 5805–5818. https://doi.org/10.1021/acs.iecr.7b03899.}. Copyright {2018} American Chemical Society.

Figure 3.
Schematic of vapor compression and gas expansion cycle: (a) Schematic of vapor compression cycle; (b) Schematic of gas expansion cycle [16]. Reproduced with permission from Applied Thermal Engineering.
Figure 3.
Schematic of vapor compression and gas expansion cycle: (a) Schematic of vapor compression cycle; (b) Schematic of gas expansion cycle [16]. Reproduced with permission from Applied Thermal Engineering.

Figure 4.
Phillips Optimized Cascade LNG Process Schematic [25]. Reproduced with permission from Elsevier (license number 5413520454256).
Figure 4.
Phillips Optimized Cascade LNG Process Schematic [25]. Reproduced with permission from Elsevier (license number 5413520454256).

Figure 5.
Schematic diagram of cascade process using liquid-gas heat exchanger [29,30]. Reproduced with permission from The World Academy of Science, Engineering and Technology.

Figure 6.
The proposed N2O-N2O-N2 cycle for natural gas liquefaction [37]. Reprinted (adapted) with permission from {Lee, C.-J.; Song, K.; Shin, S.; Lim, Y.; Han, C. Process design for the offshore production of liquefied natural gas with non-flammable refrigerants. Ind. Eng. Chem. Res. 2015, 54, 11106–11112. https://doi.org/10.1021/acs.iecr.5b01620.}. Copyright {2015} American Chemical Society.

Figure 7.
Process flow diagram of mixed fluid cascade [39]. Reproduced with permission from Wiley Online Library (license number 5413130491829).
Figure 7.
Process flow diagram of mixed fluid cascade [39]. Reproduced with permission from Wiley Online Library (license number 5413130491829).

Figure 8.
Specific work and power share of studied cases: (a) Design variable for the MFC and C3-MFC processes in warm climate. (b) Design variable for the MFC and C3-MFC processes in cold climate. (c) Power share for the MFC and C3-MFC cases in warm and cold climates [45]. Reproduced with permission from Elsevier (license number 5413340359652).
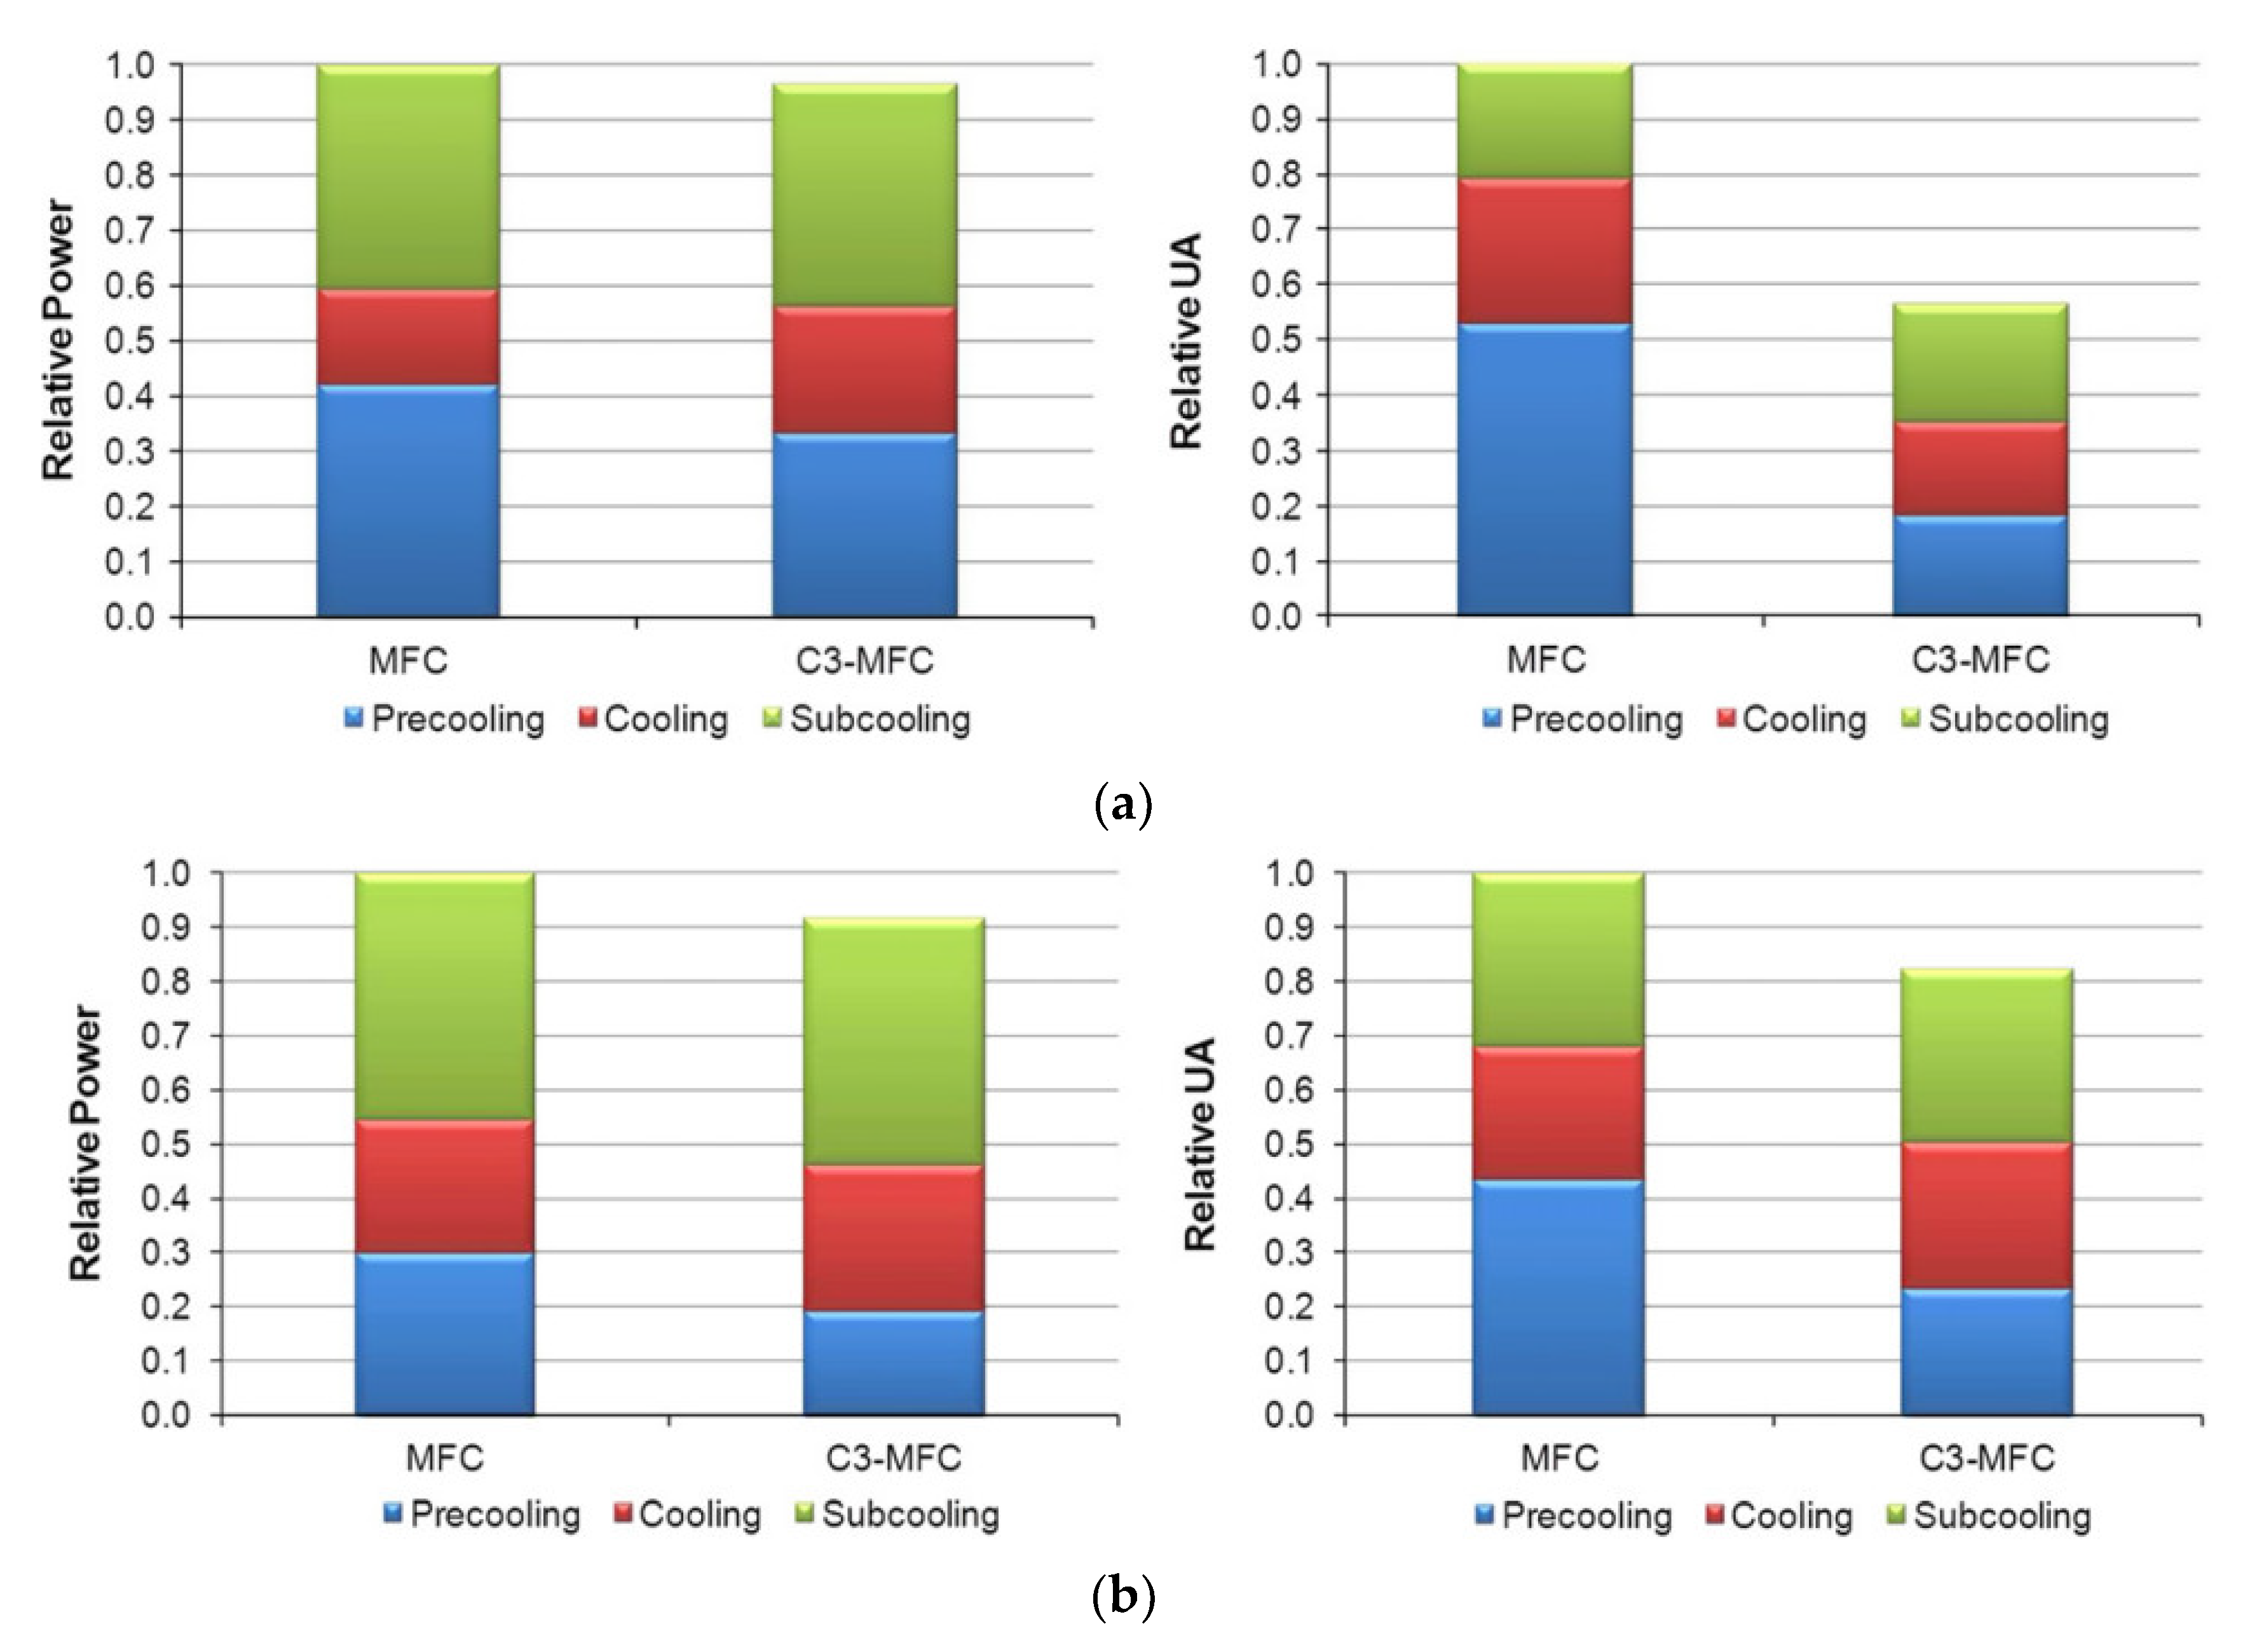
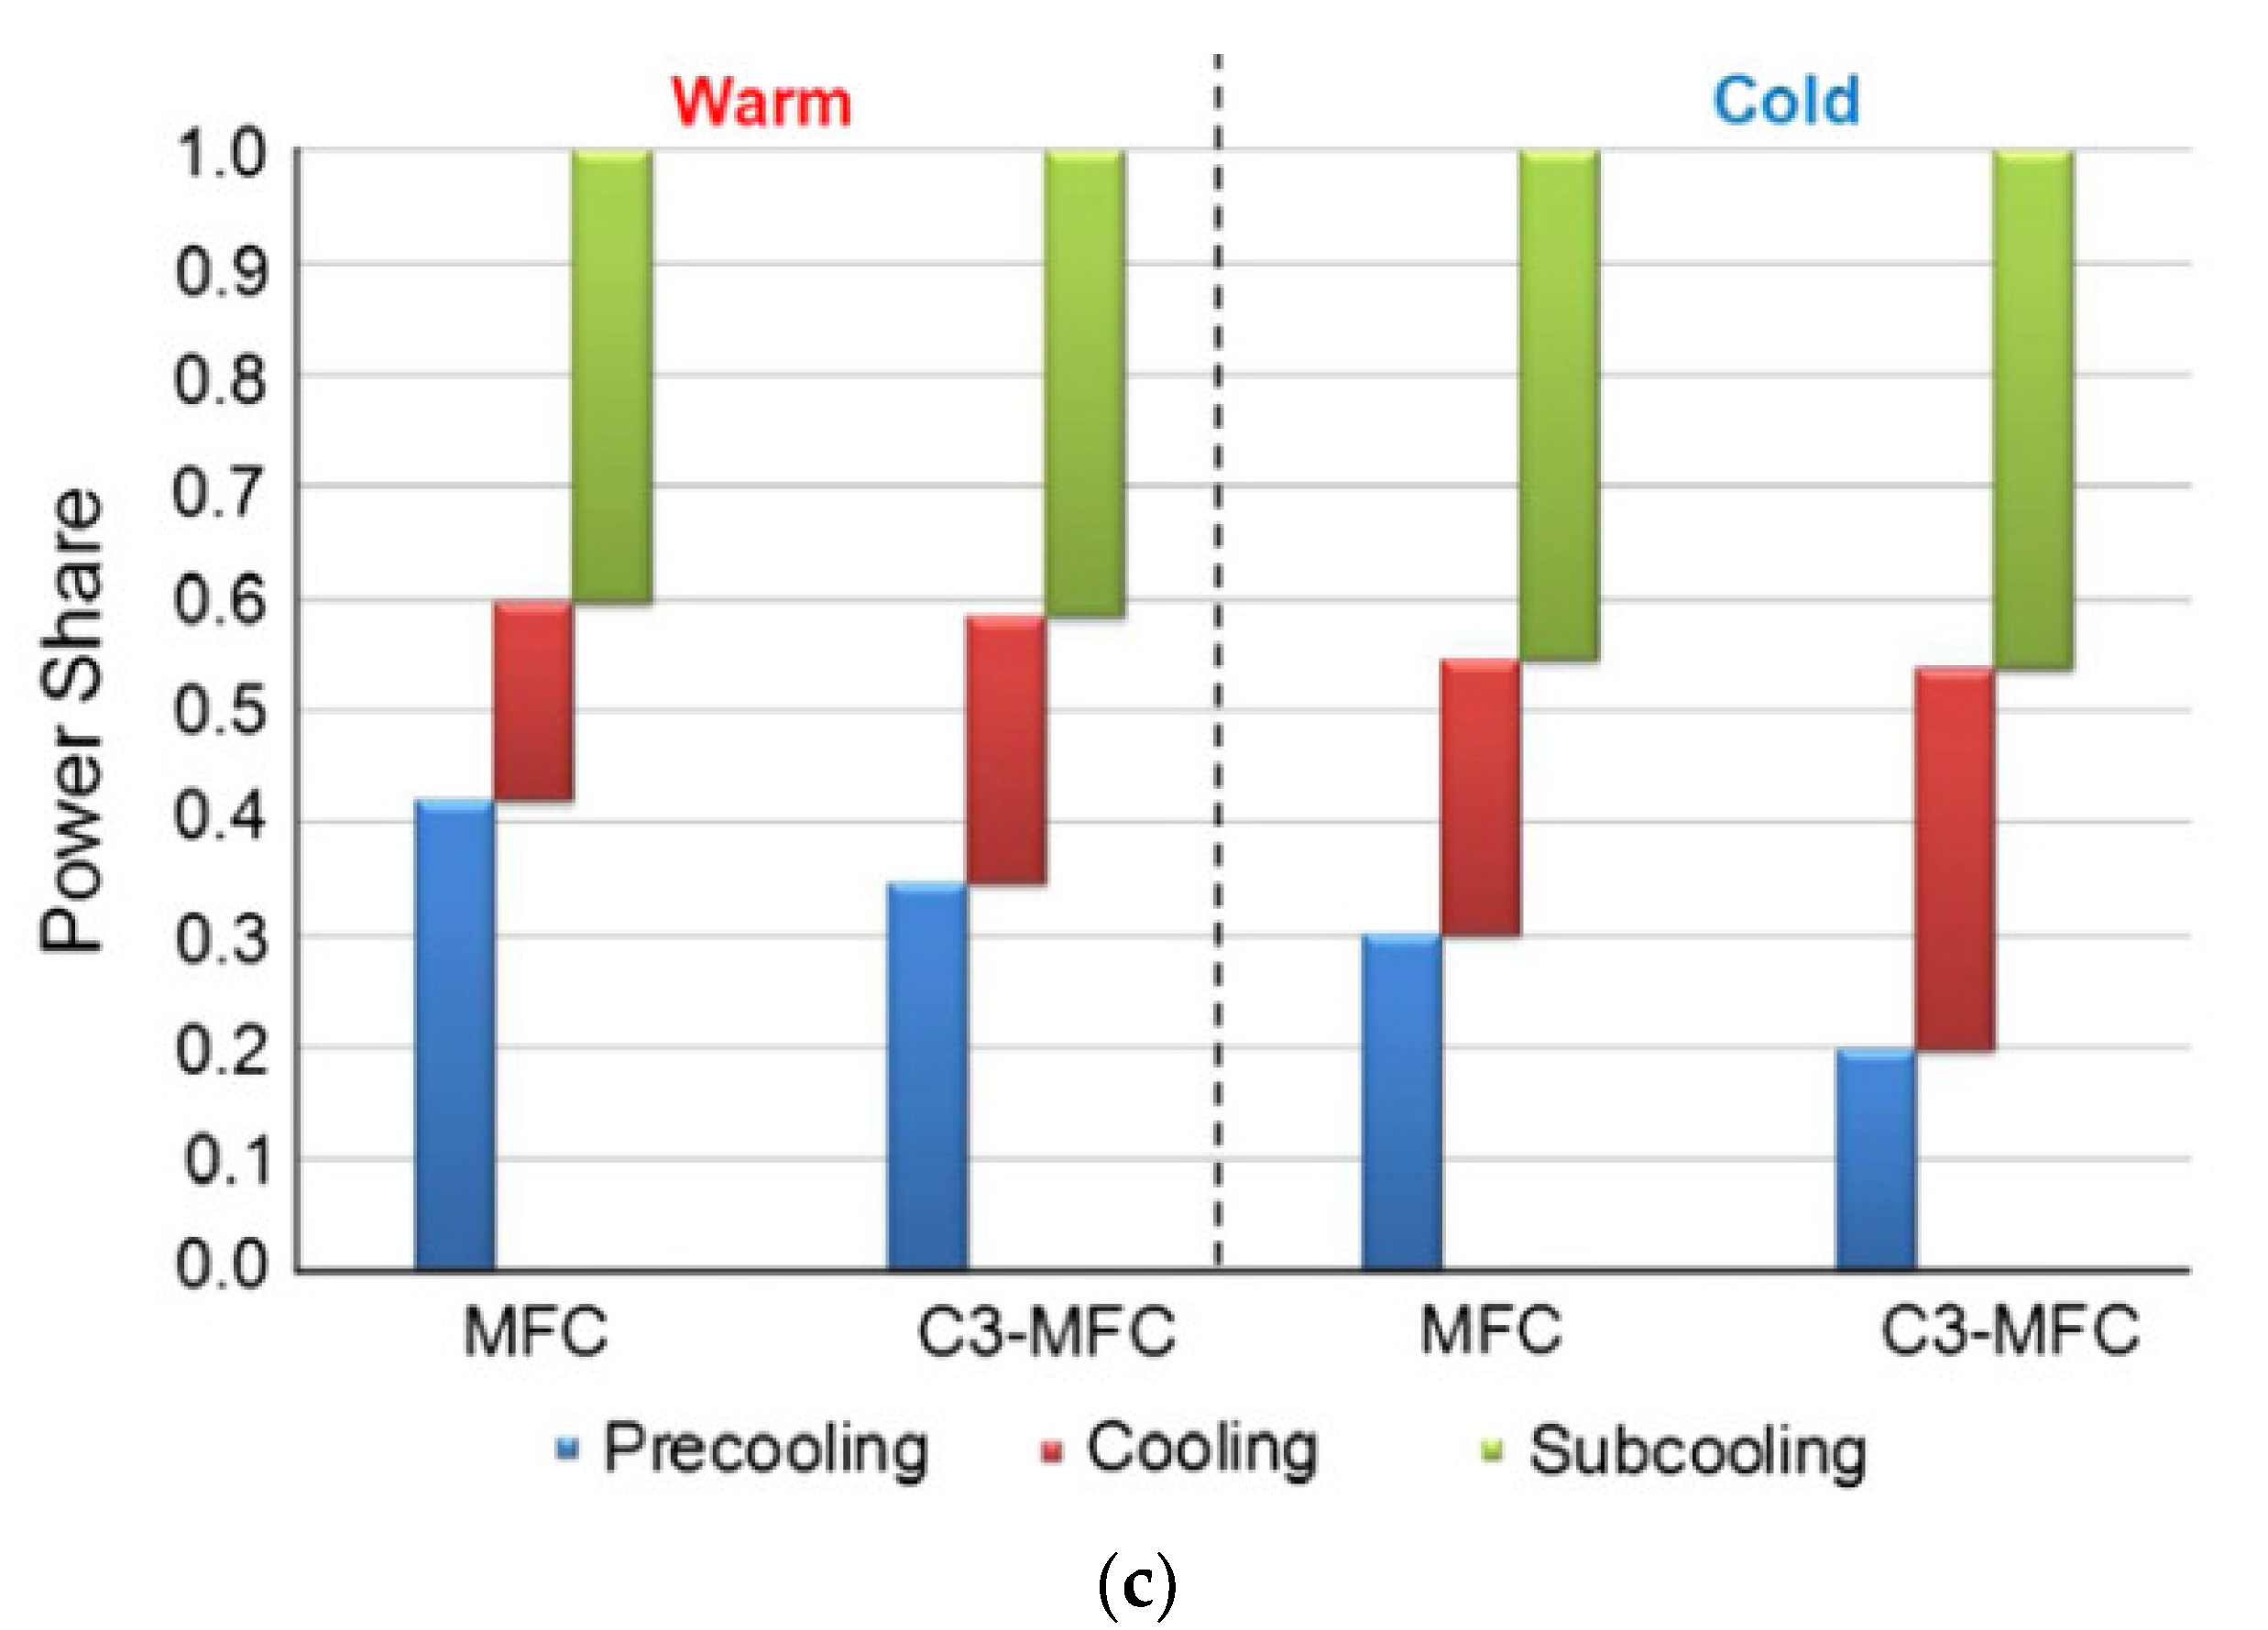
Figure 9.
Variation of the specific energy consumption of optimized process with N compressor stages and ambient seawater temperature T0. Dashed lines are mixed fluid cascade (MFC) processes [47]. Reproduced with permission from MDPI.
Figure 9.
Variation of the specific energy consumption of optimized process with N compressor stages and ambient seawater temperature T0. Dashed lines are mixed fluid cascade (MFC) processes [47]. Reproduced with permission from MDPI.
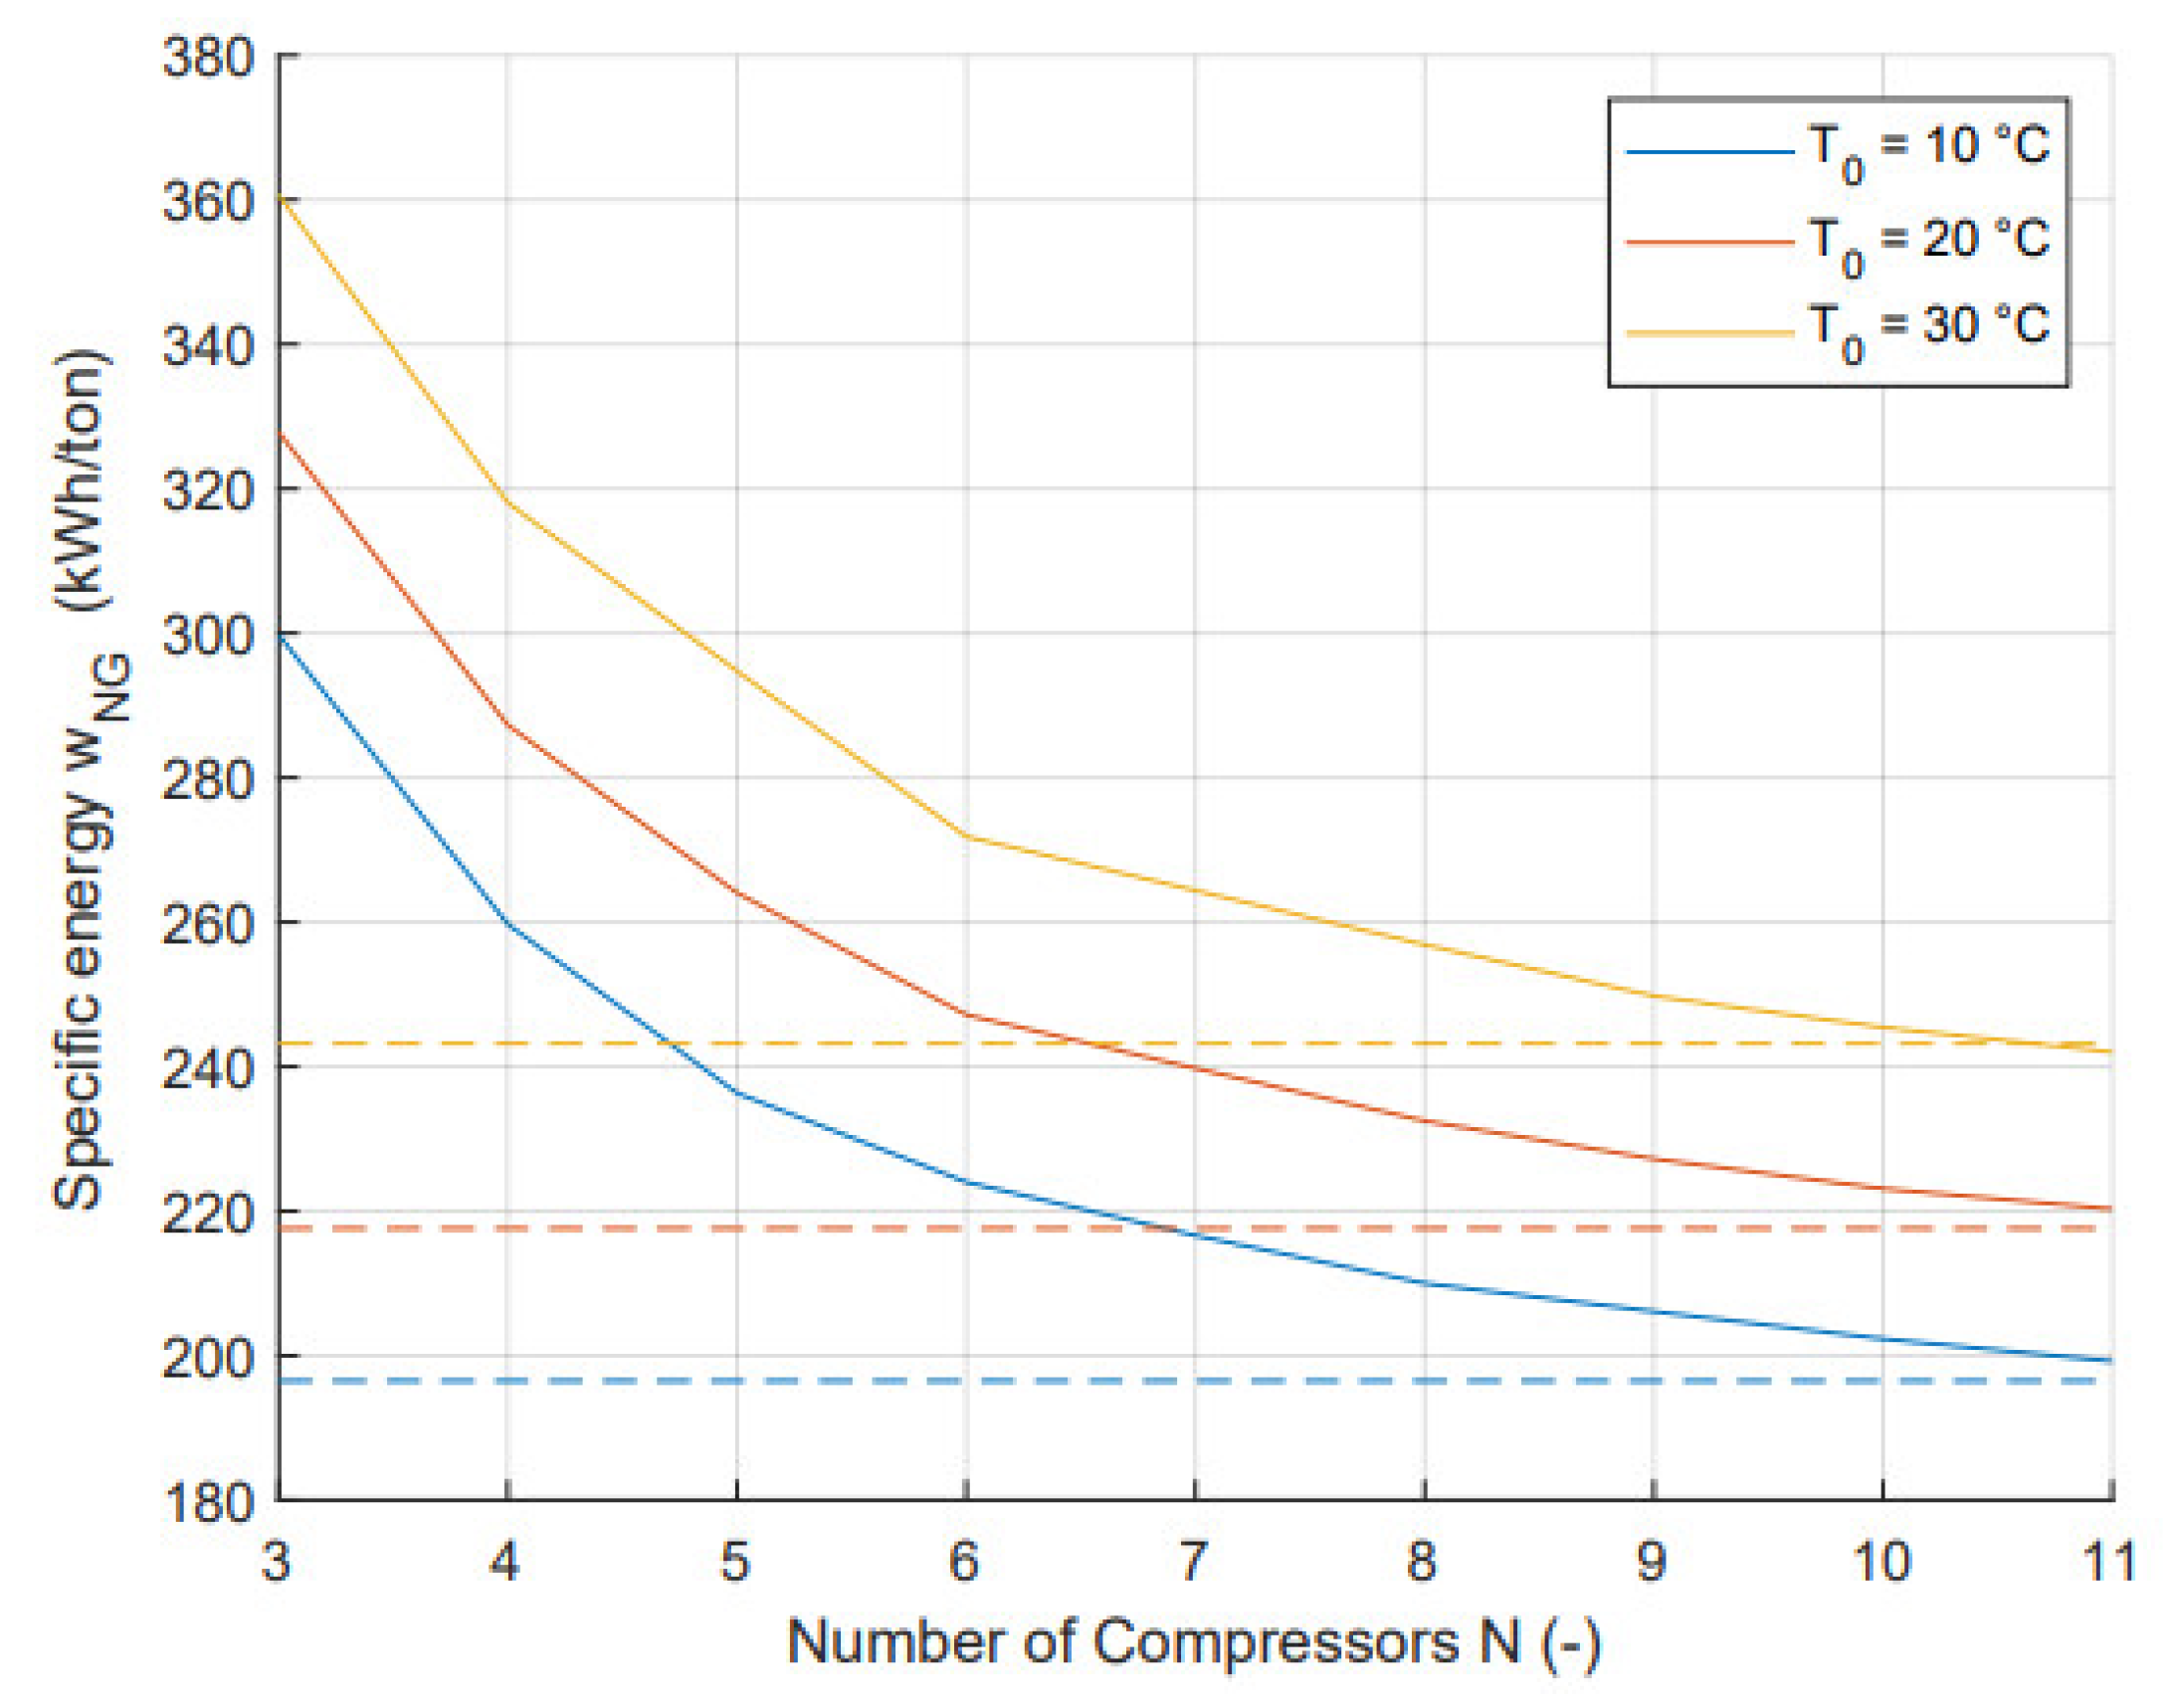
Figure 10.
Process flow diagram of MFC-NGL-NRU [49]. Reproduced with permission from Elsevier (license number 5413341375464).
Figure 10.
Process flow diagram of MFC-NGL-NRU [49]. Reproduced with permission from Elsevier (license number 5413341375464).
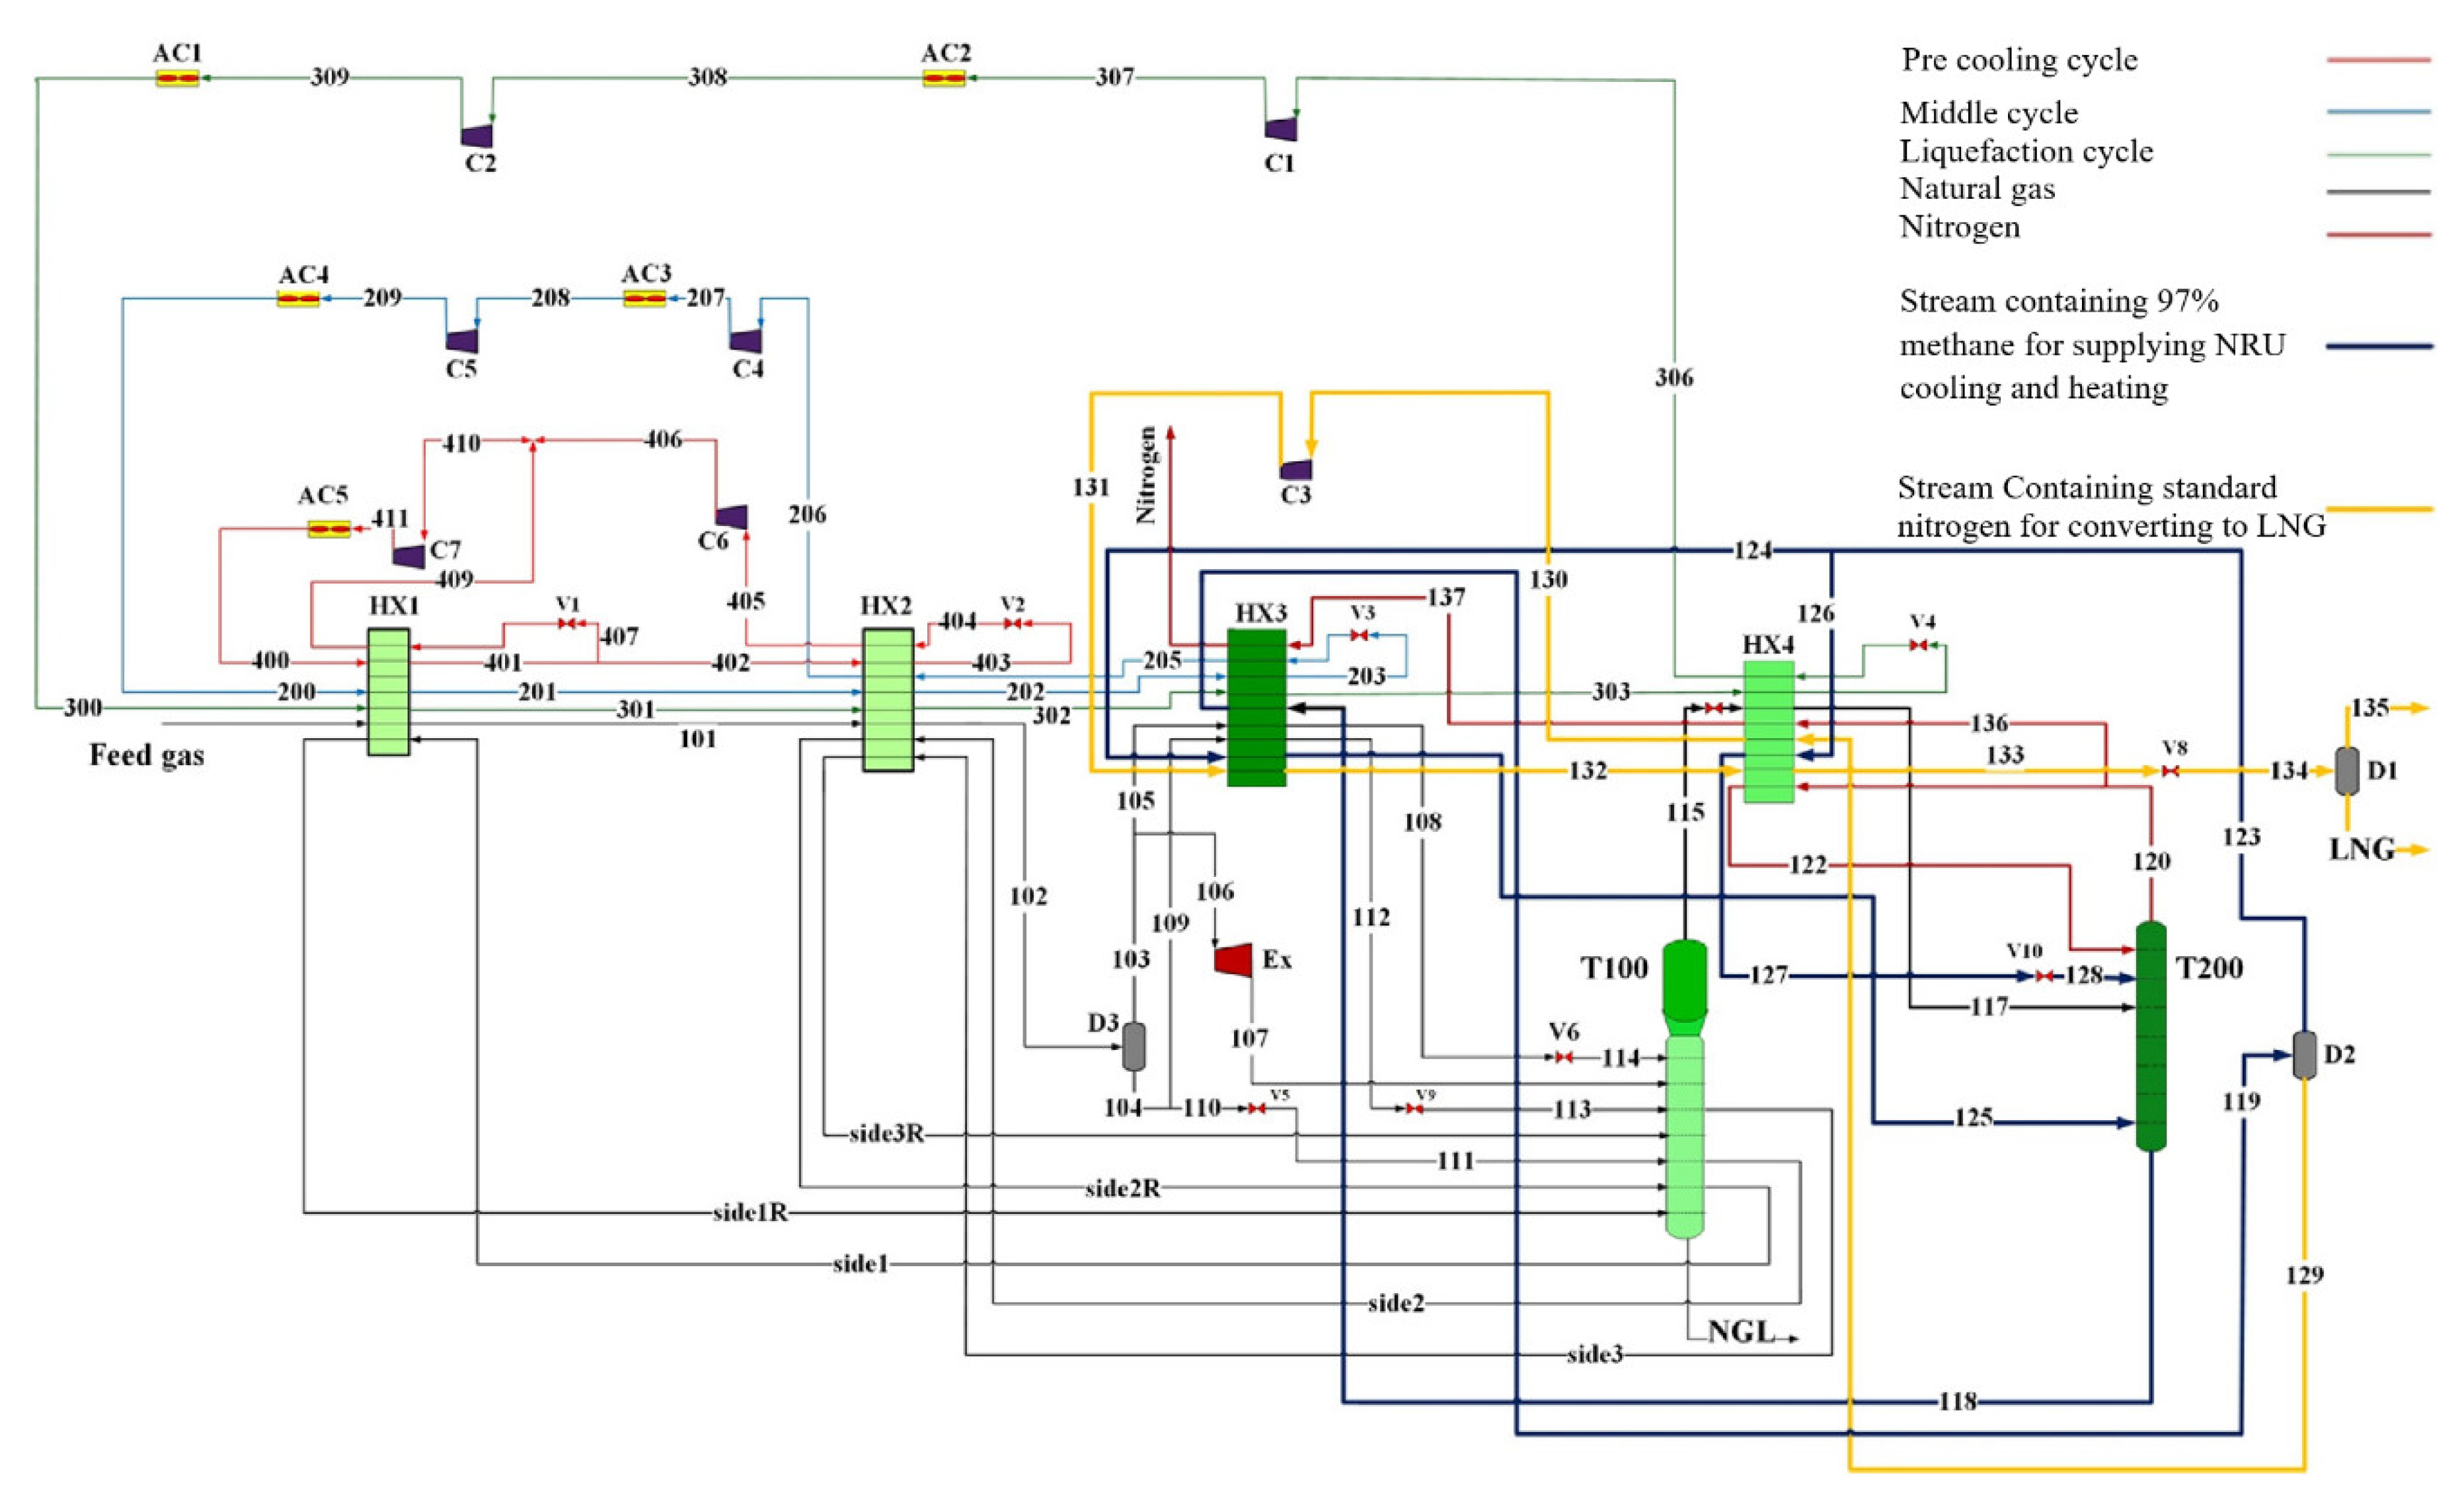
Figure 11.
Schematic of NH3/H2O ARC simulated in Aspen HYSYS [50]. Reproduced with permission from Elsevier (license number 5413350375716).
Figure 11.
Schematic of NH3/H2O ARC simulated in Aspen HYSYS [50]. Reproduced with permission from Elsevier (license number 5413350375716).
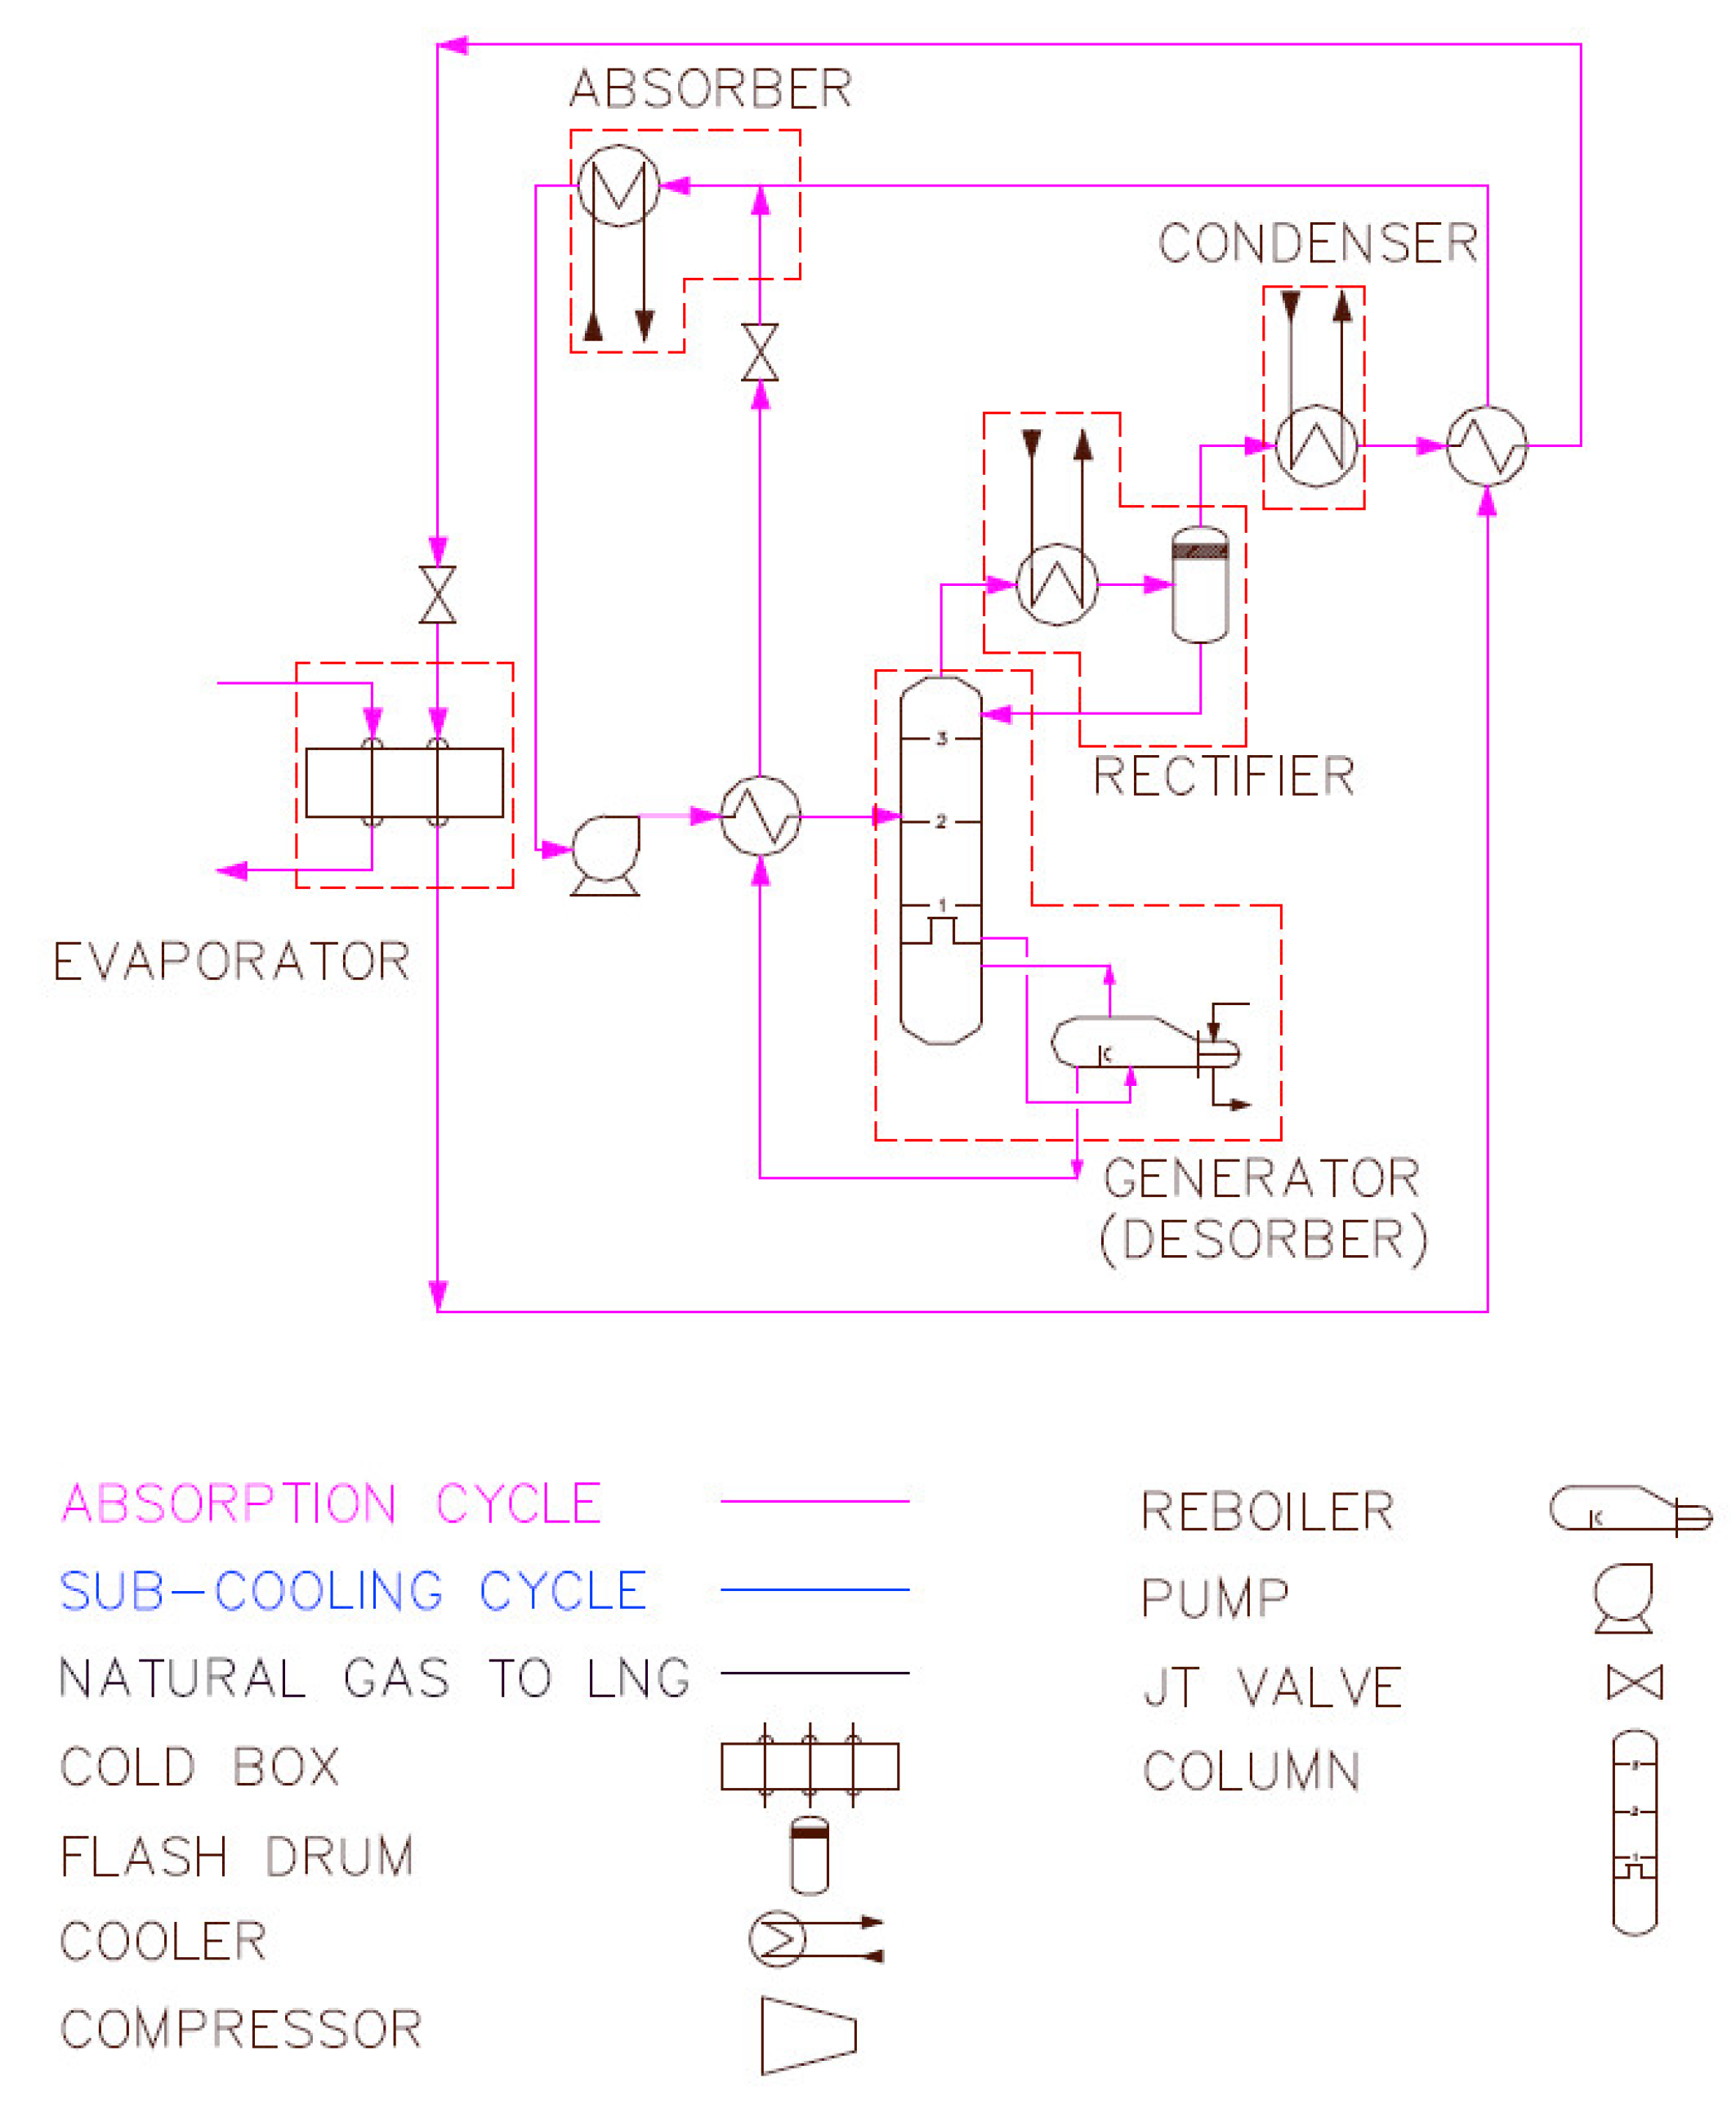
Figure 12.
Process flowsheet for a single expander LNG process [53].
Figure 12.
Process flowsheet for a single expander LNG process [53].
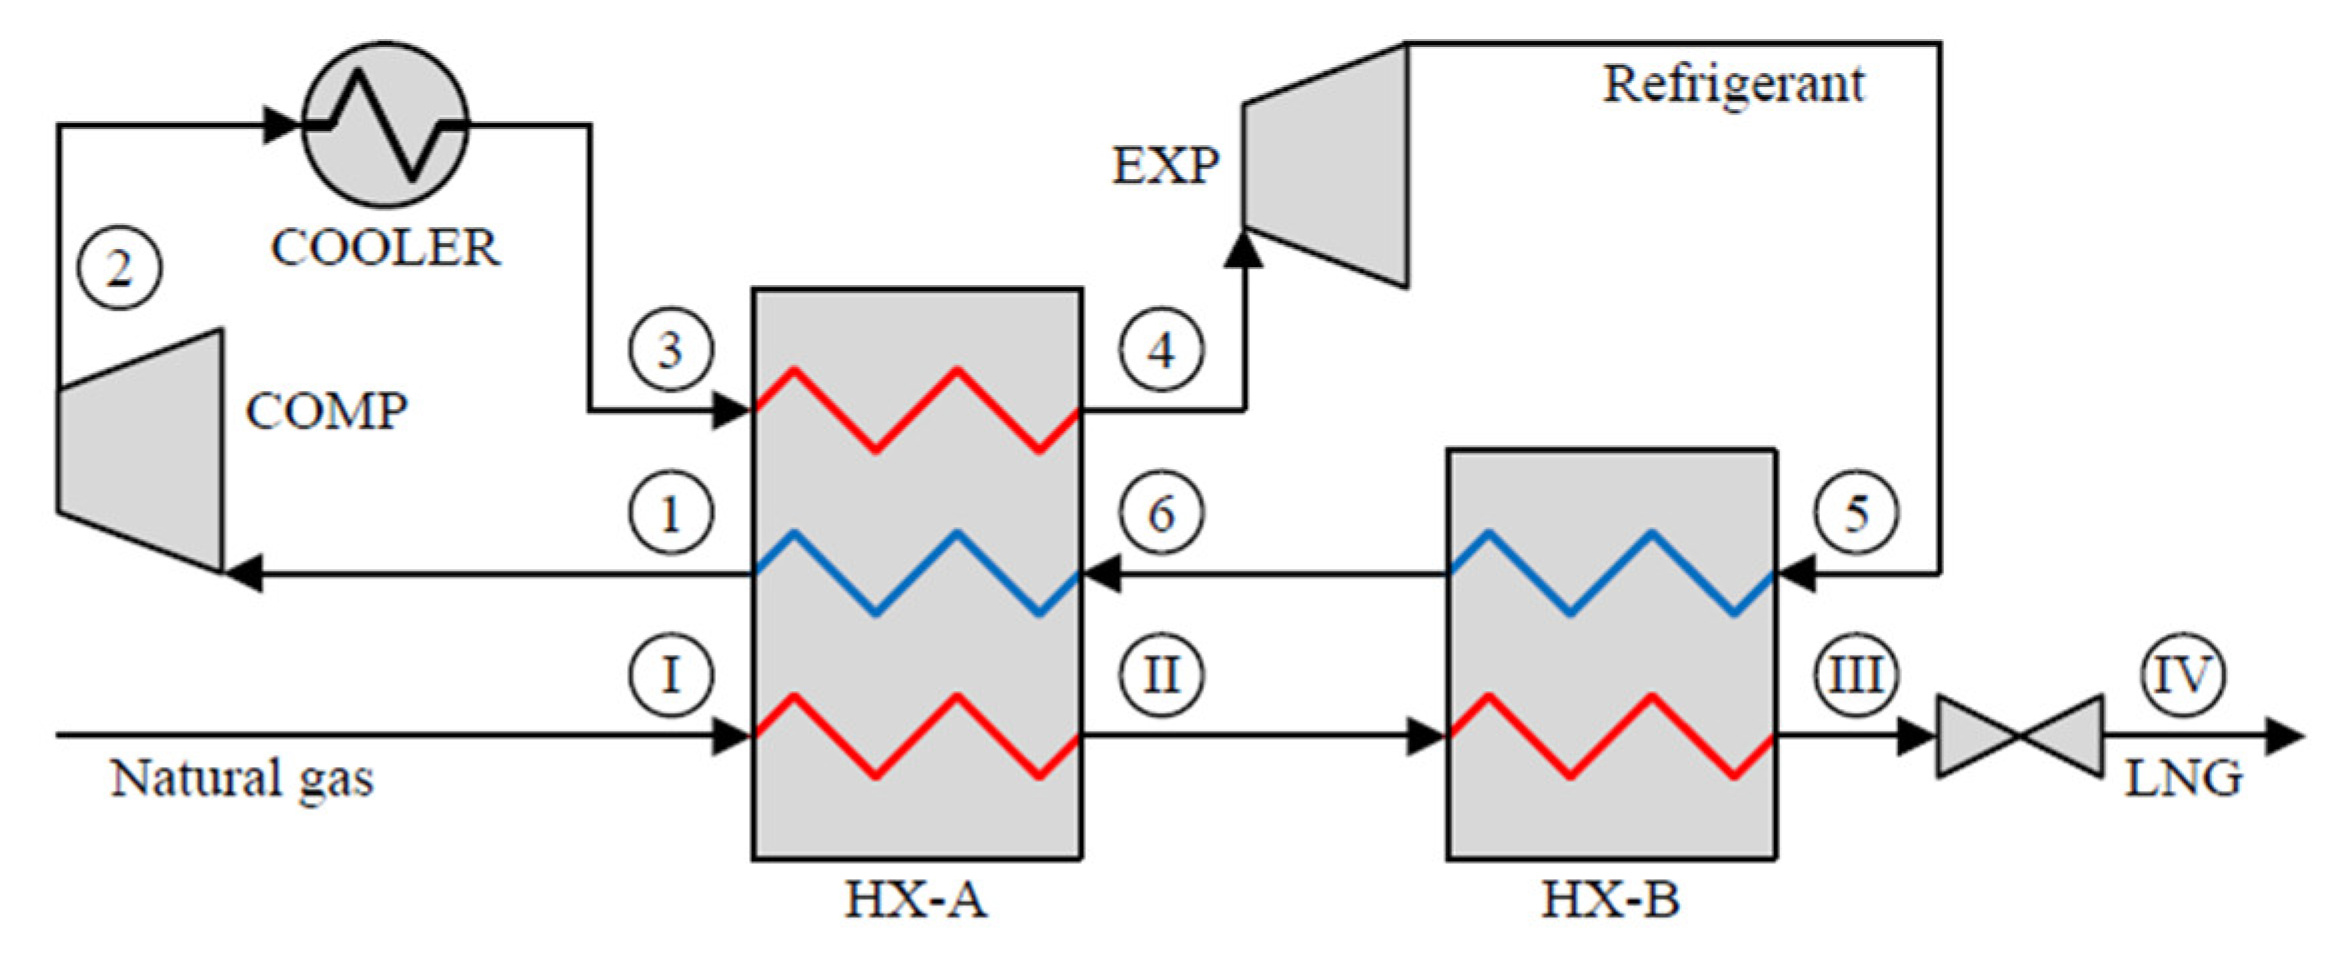
Figure 13.
Process flow diagram for the base case with operating conditions [54]. Reproduced with permission from Elsevier (license number 5413351311993).
Figure 13.
Process flow diagram for the base case with operating conditions [54]. Reproduced with permission from Elsevier (license number 5413351311993).
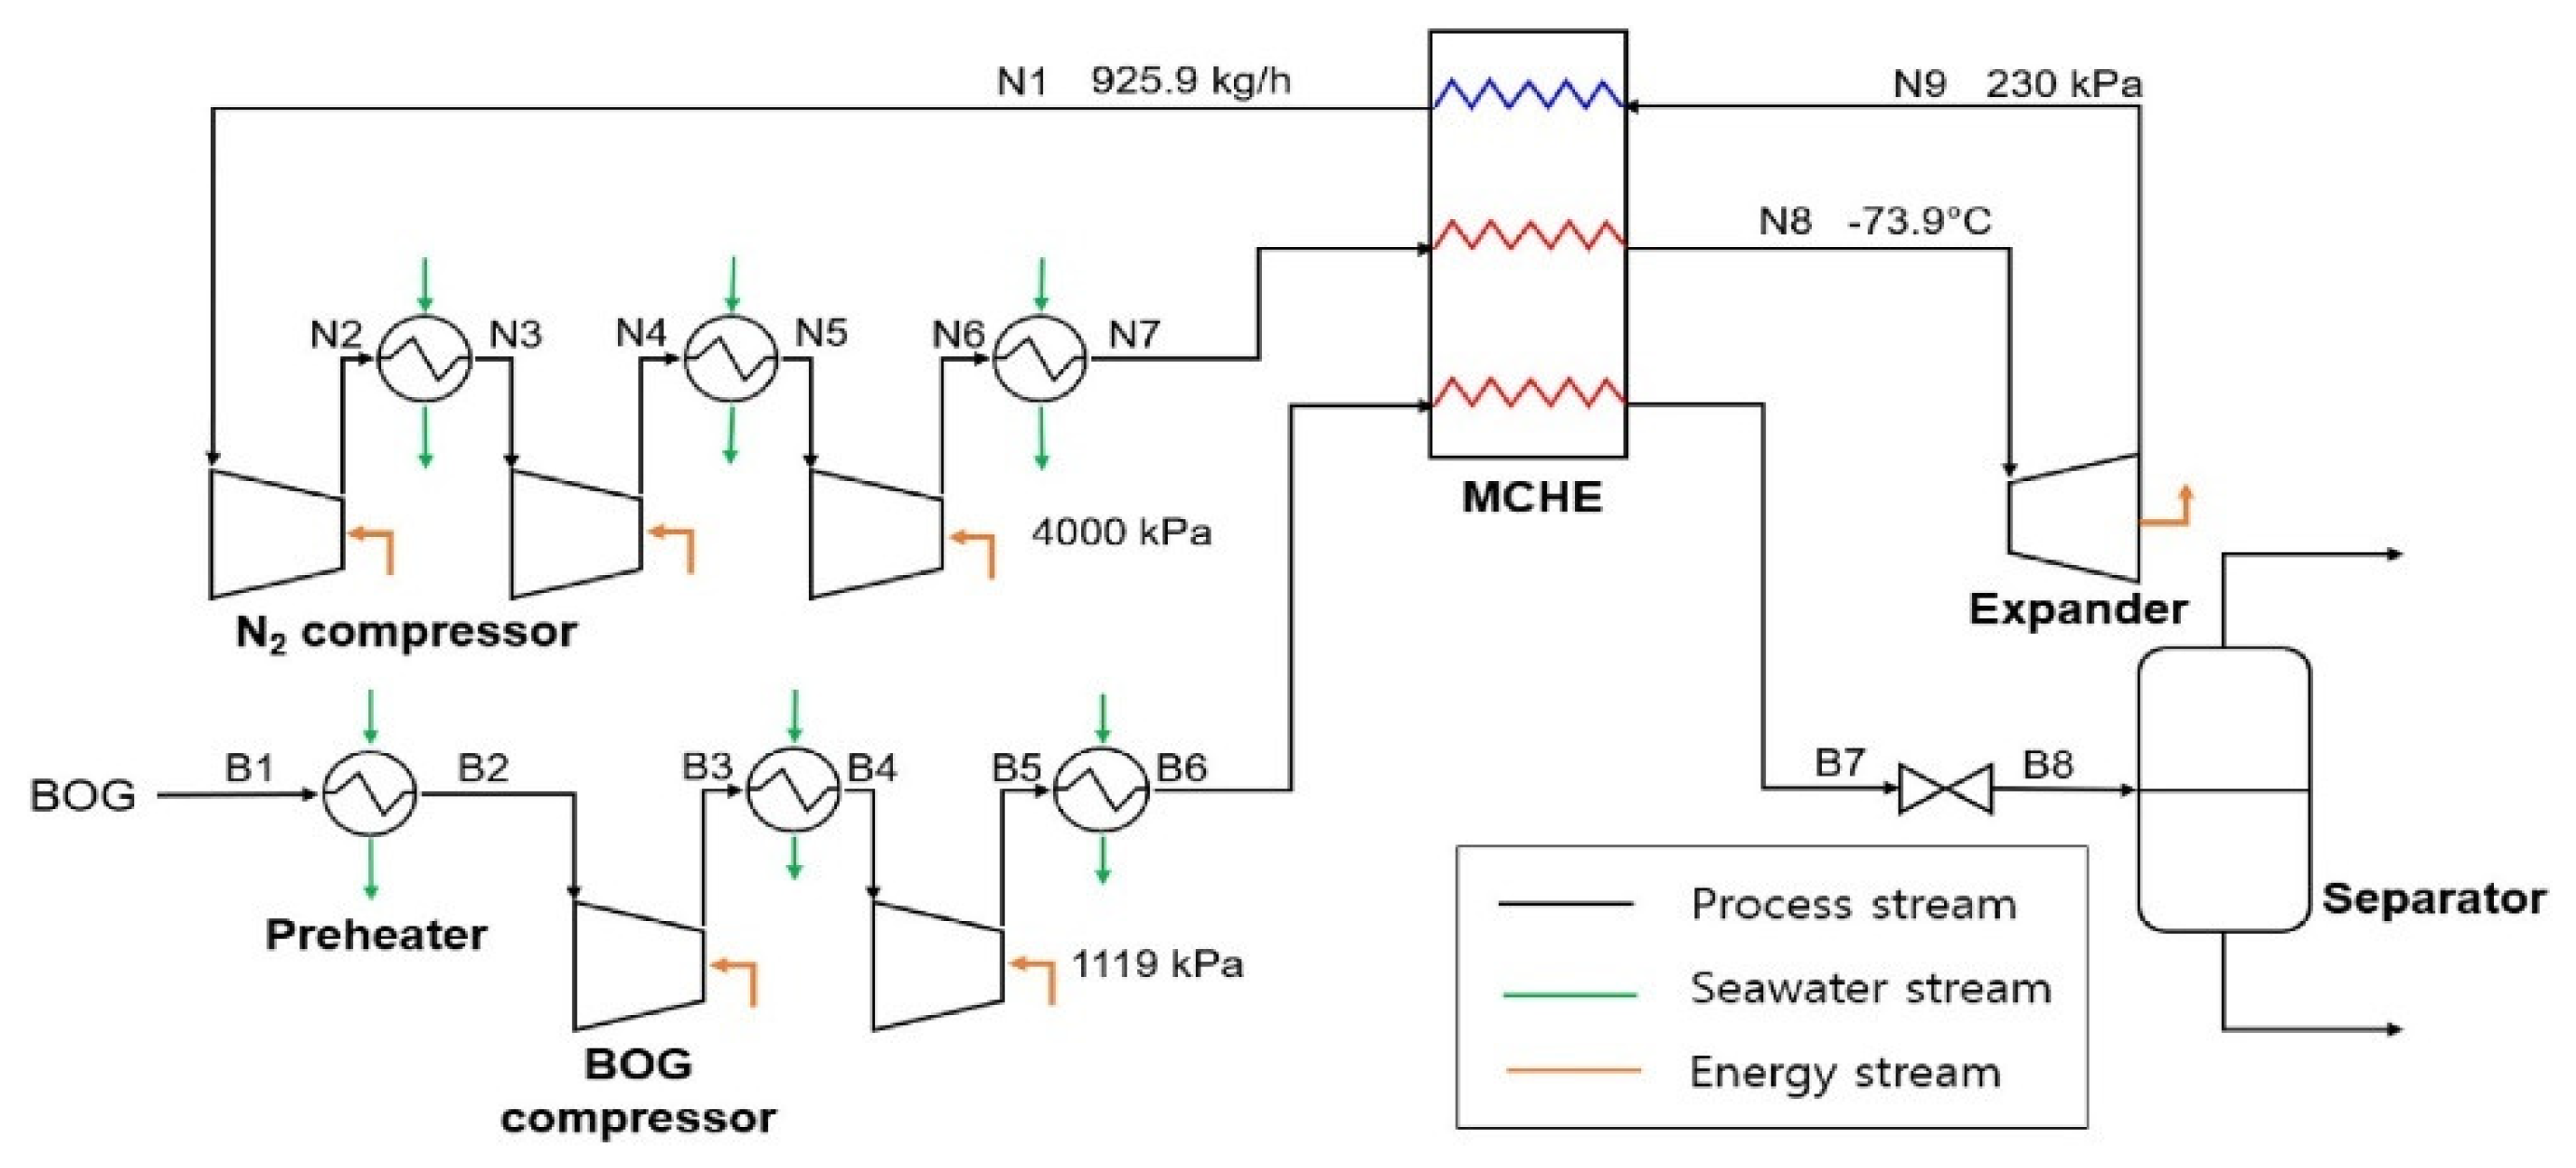
Figure 14.
Process flow for boil-off gas (BOG) re-liquefaction nitrogen expansion liquefaction process [55]. Reproduced with permission from Elsevier (license number 5413360219443).
Figure 14.
Process flow for boil-off gas (BOG) re-liquefaction nitrogen expansion liquefaction process [55]. Reproduced with permission from Elsevier (license number 5413360219443).

Figure 15.
Process flow for boil-off gas (BOG) re-liquefaction nitrogen expansion liquefaction process [57]. Reproduced with permission from Elsevier (license number 5413360697553).
Figure 15.
Process flow for boil-off gas (BOG) re-liquefaction nitrogen expansion liquefaction process [57]. Reproduced with permission from Elsevier (license number 5413360697553).
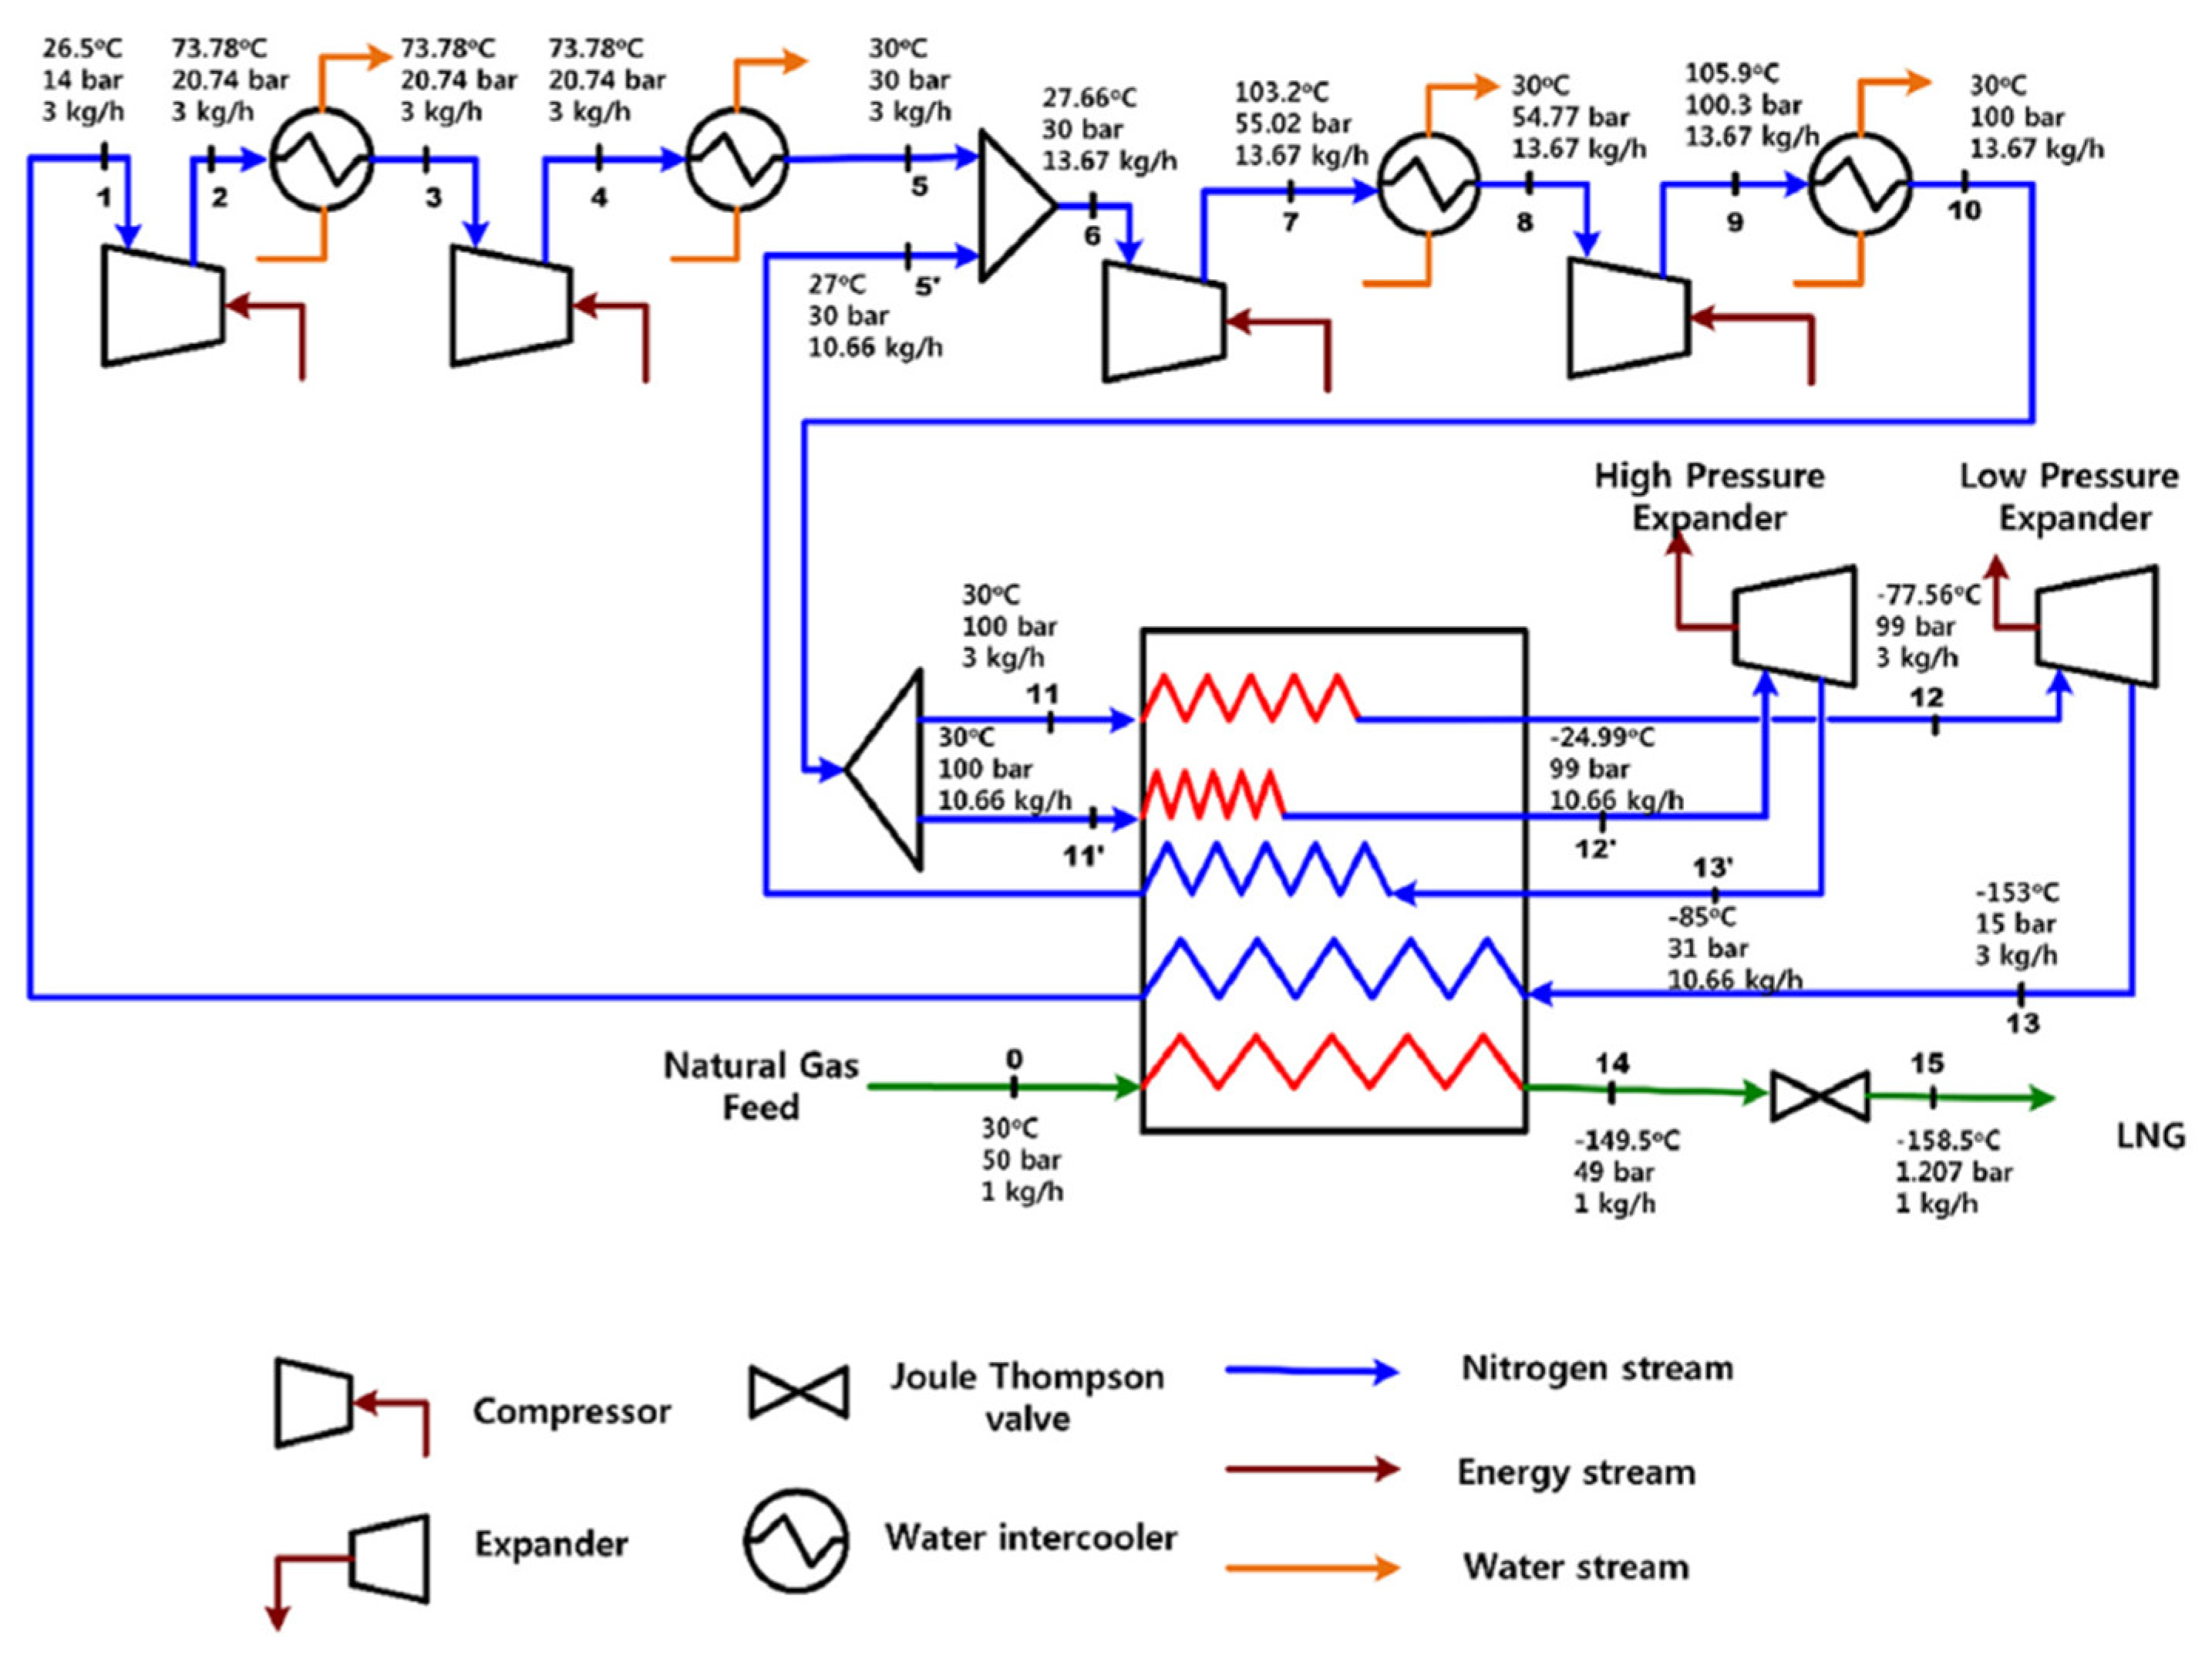
Figure 16.
Low-pressure optimization in the dual nitrogen expander process [57]. Reproduced with permission from Elsevier (license number 5413360697553).
Figure 16.
Low-pressure optimization in the dual nitrogen expander process [57]. Reproduced with permission from Elsevier (license number 5413360697553).
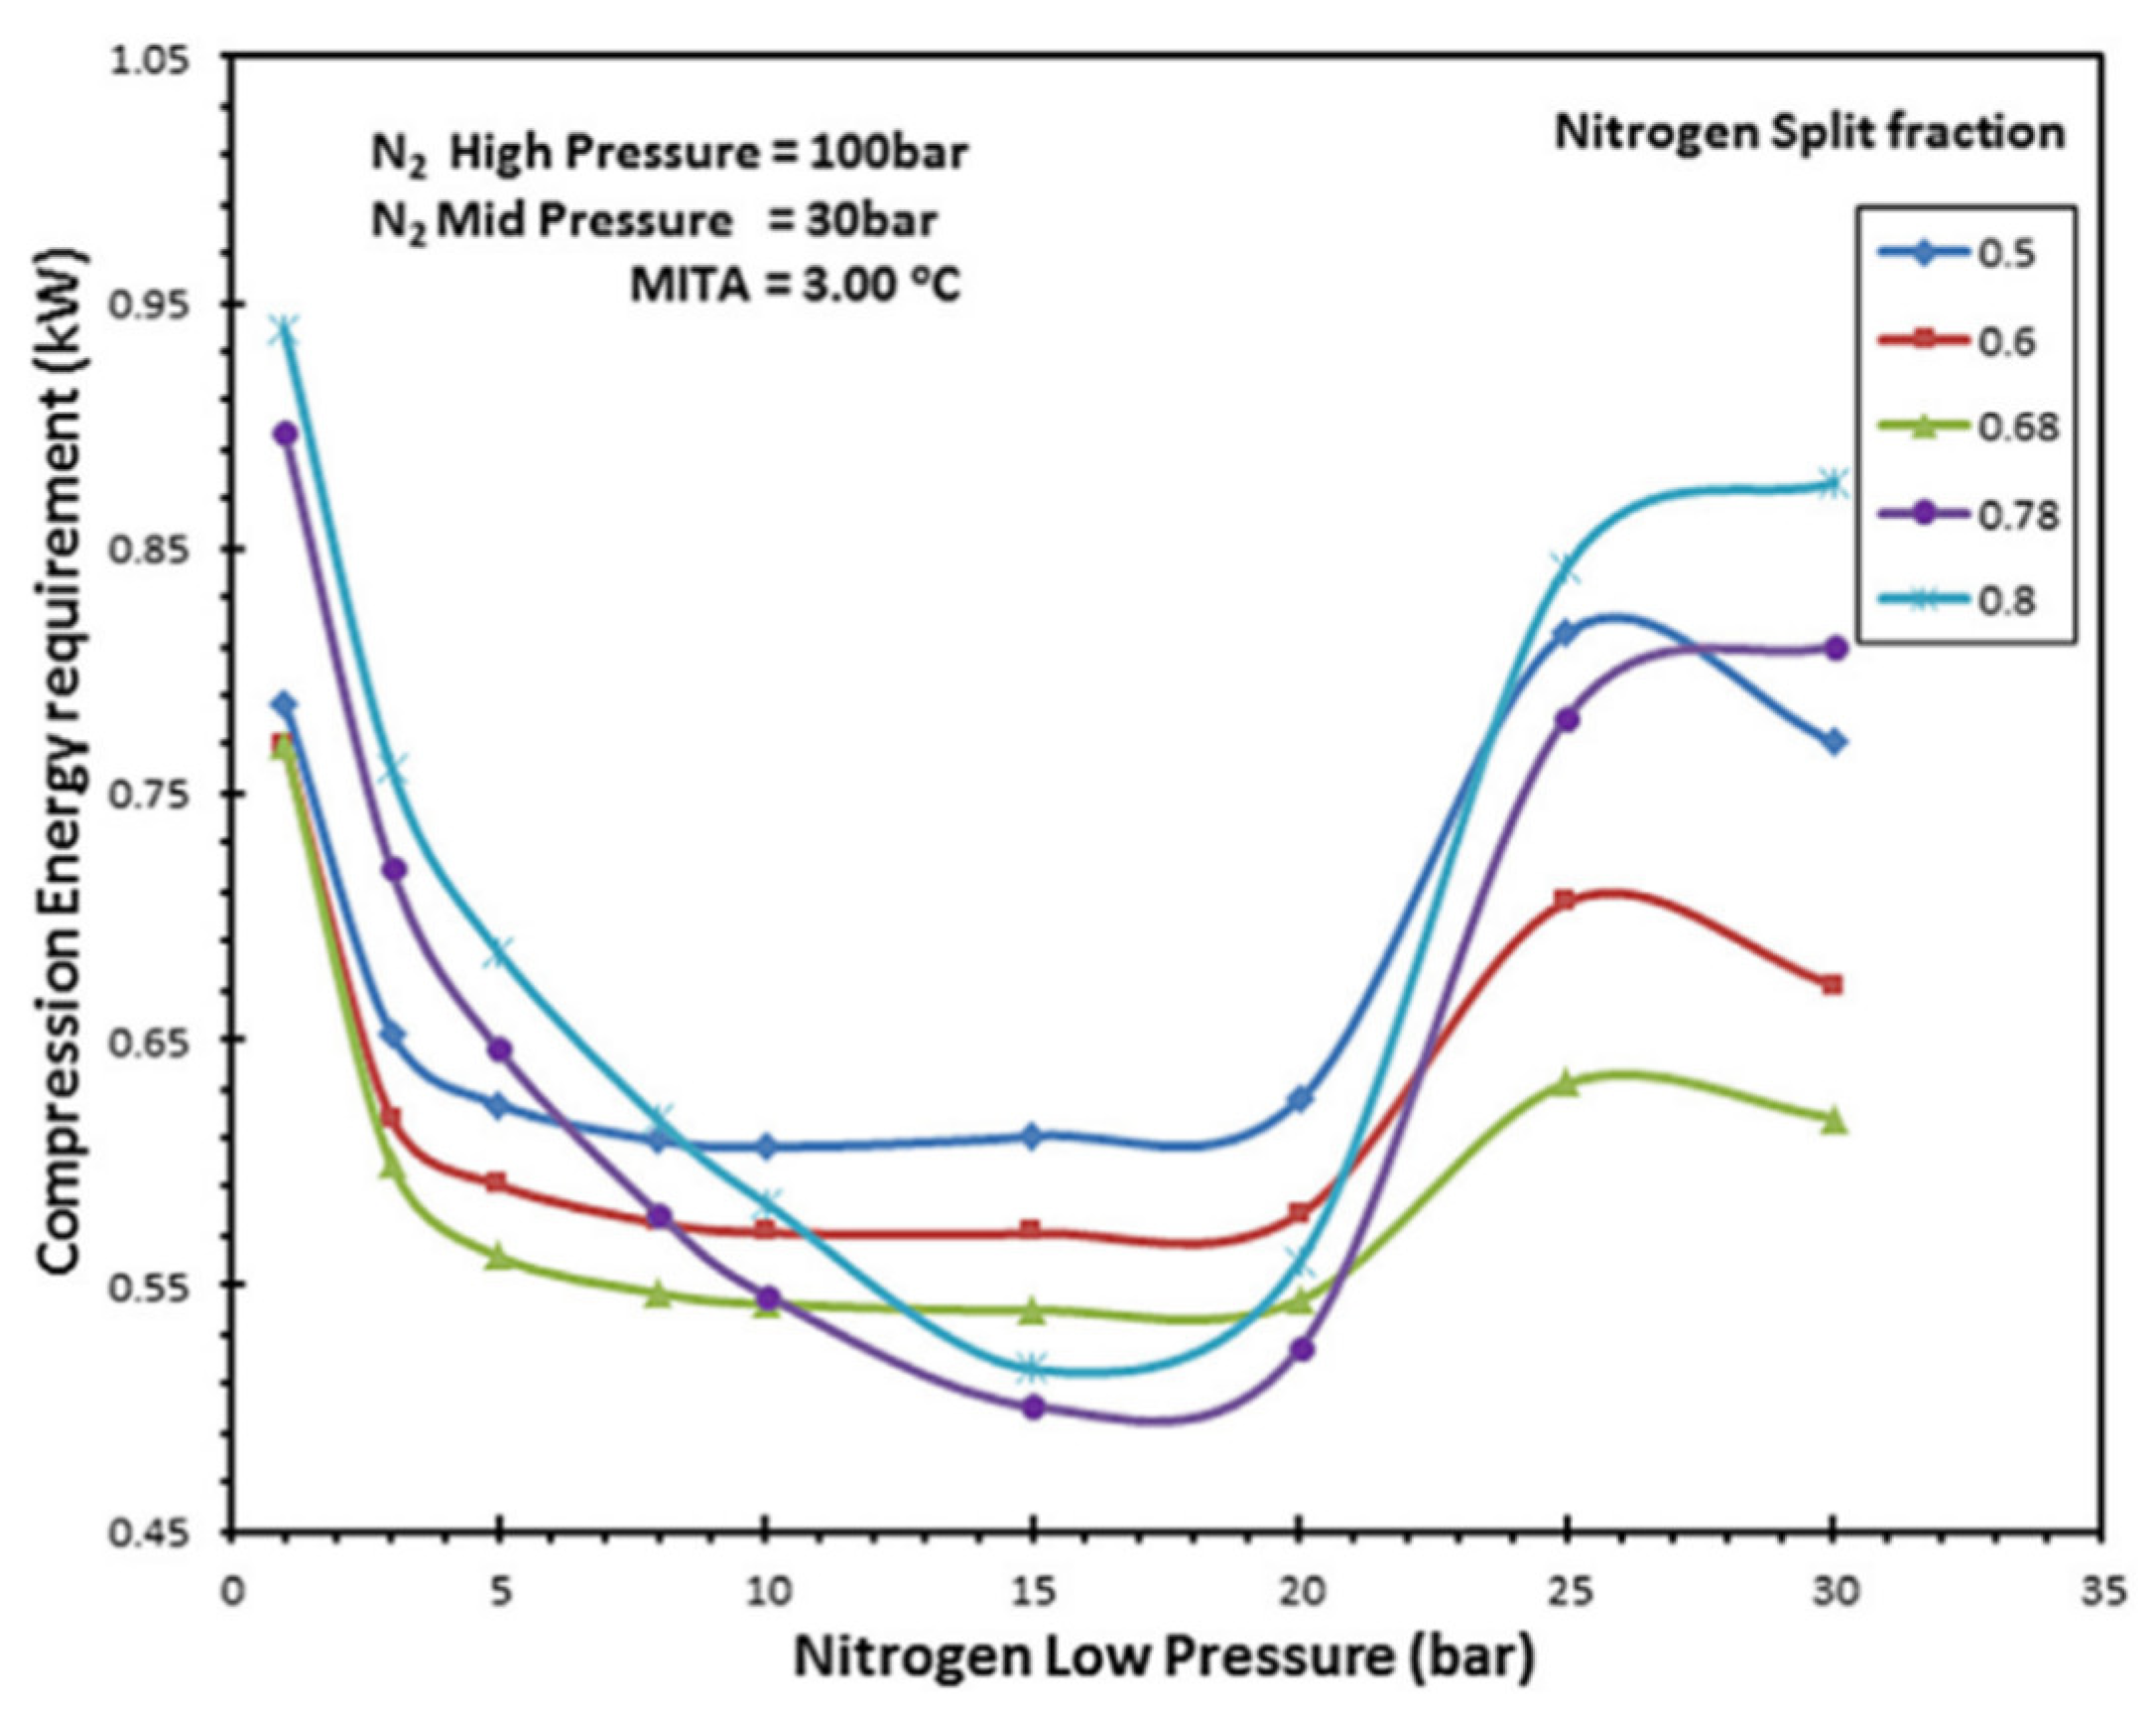
Figure 17.
Middle-pressure optimization in the dual nitrogen expander process [57]. Reproduced with permission from Elsevier (license number 5413360697553).
Figure 17.
Middle-pressure optimization in the dual nitrogen expander process [57]. Reproduced with permission from Elsevier (license number 5413360697553).
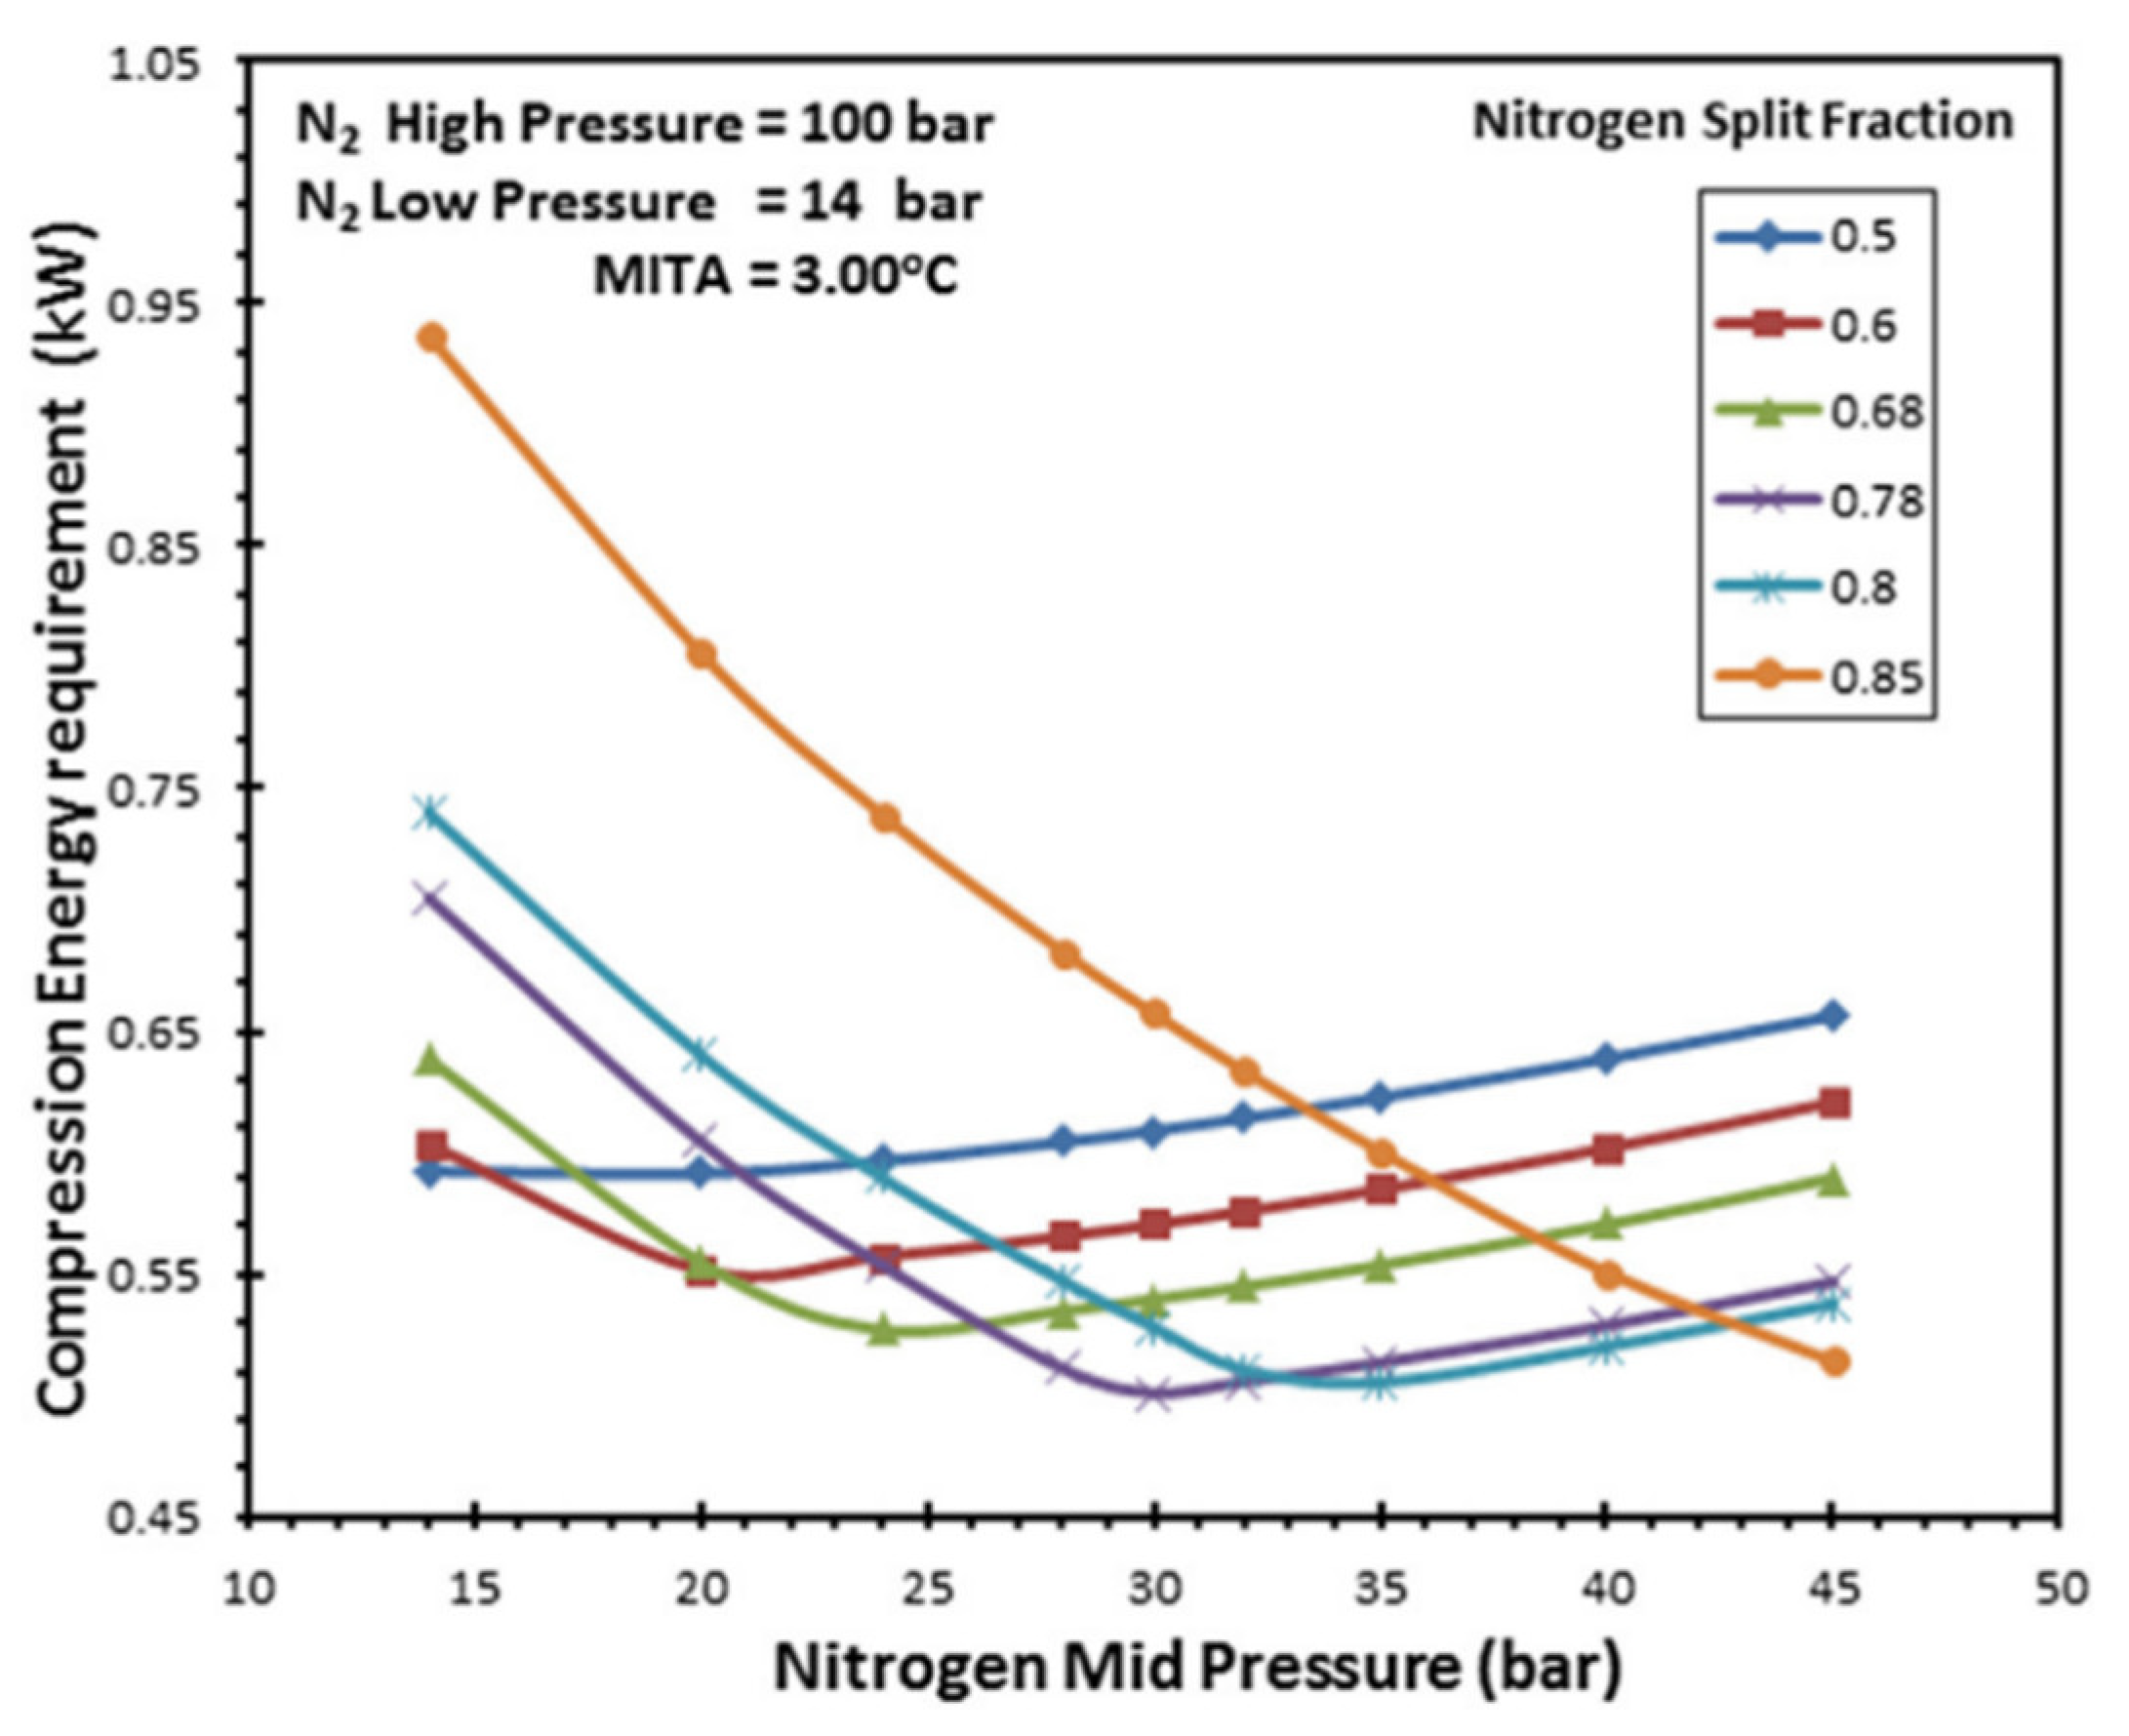
Figure 18.
(a) The diagram of the parallel nitrogen expansion liquefaction process (PNEC); (b) Temperature-Entropy diagram of parallel nitrogen expansion liquefaction process; (c) Temperature-Entropy diagram of natural gas [61]. Reproduced with permission from Elsevier (license number 5413370329012).
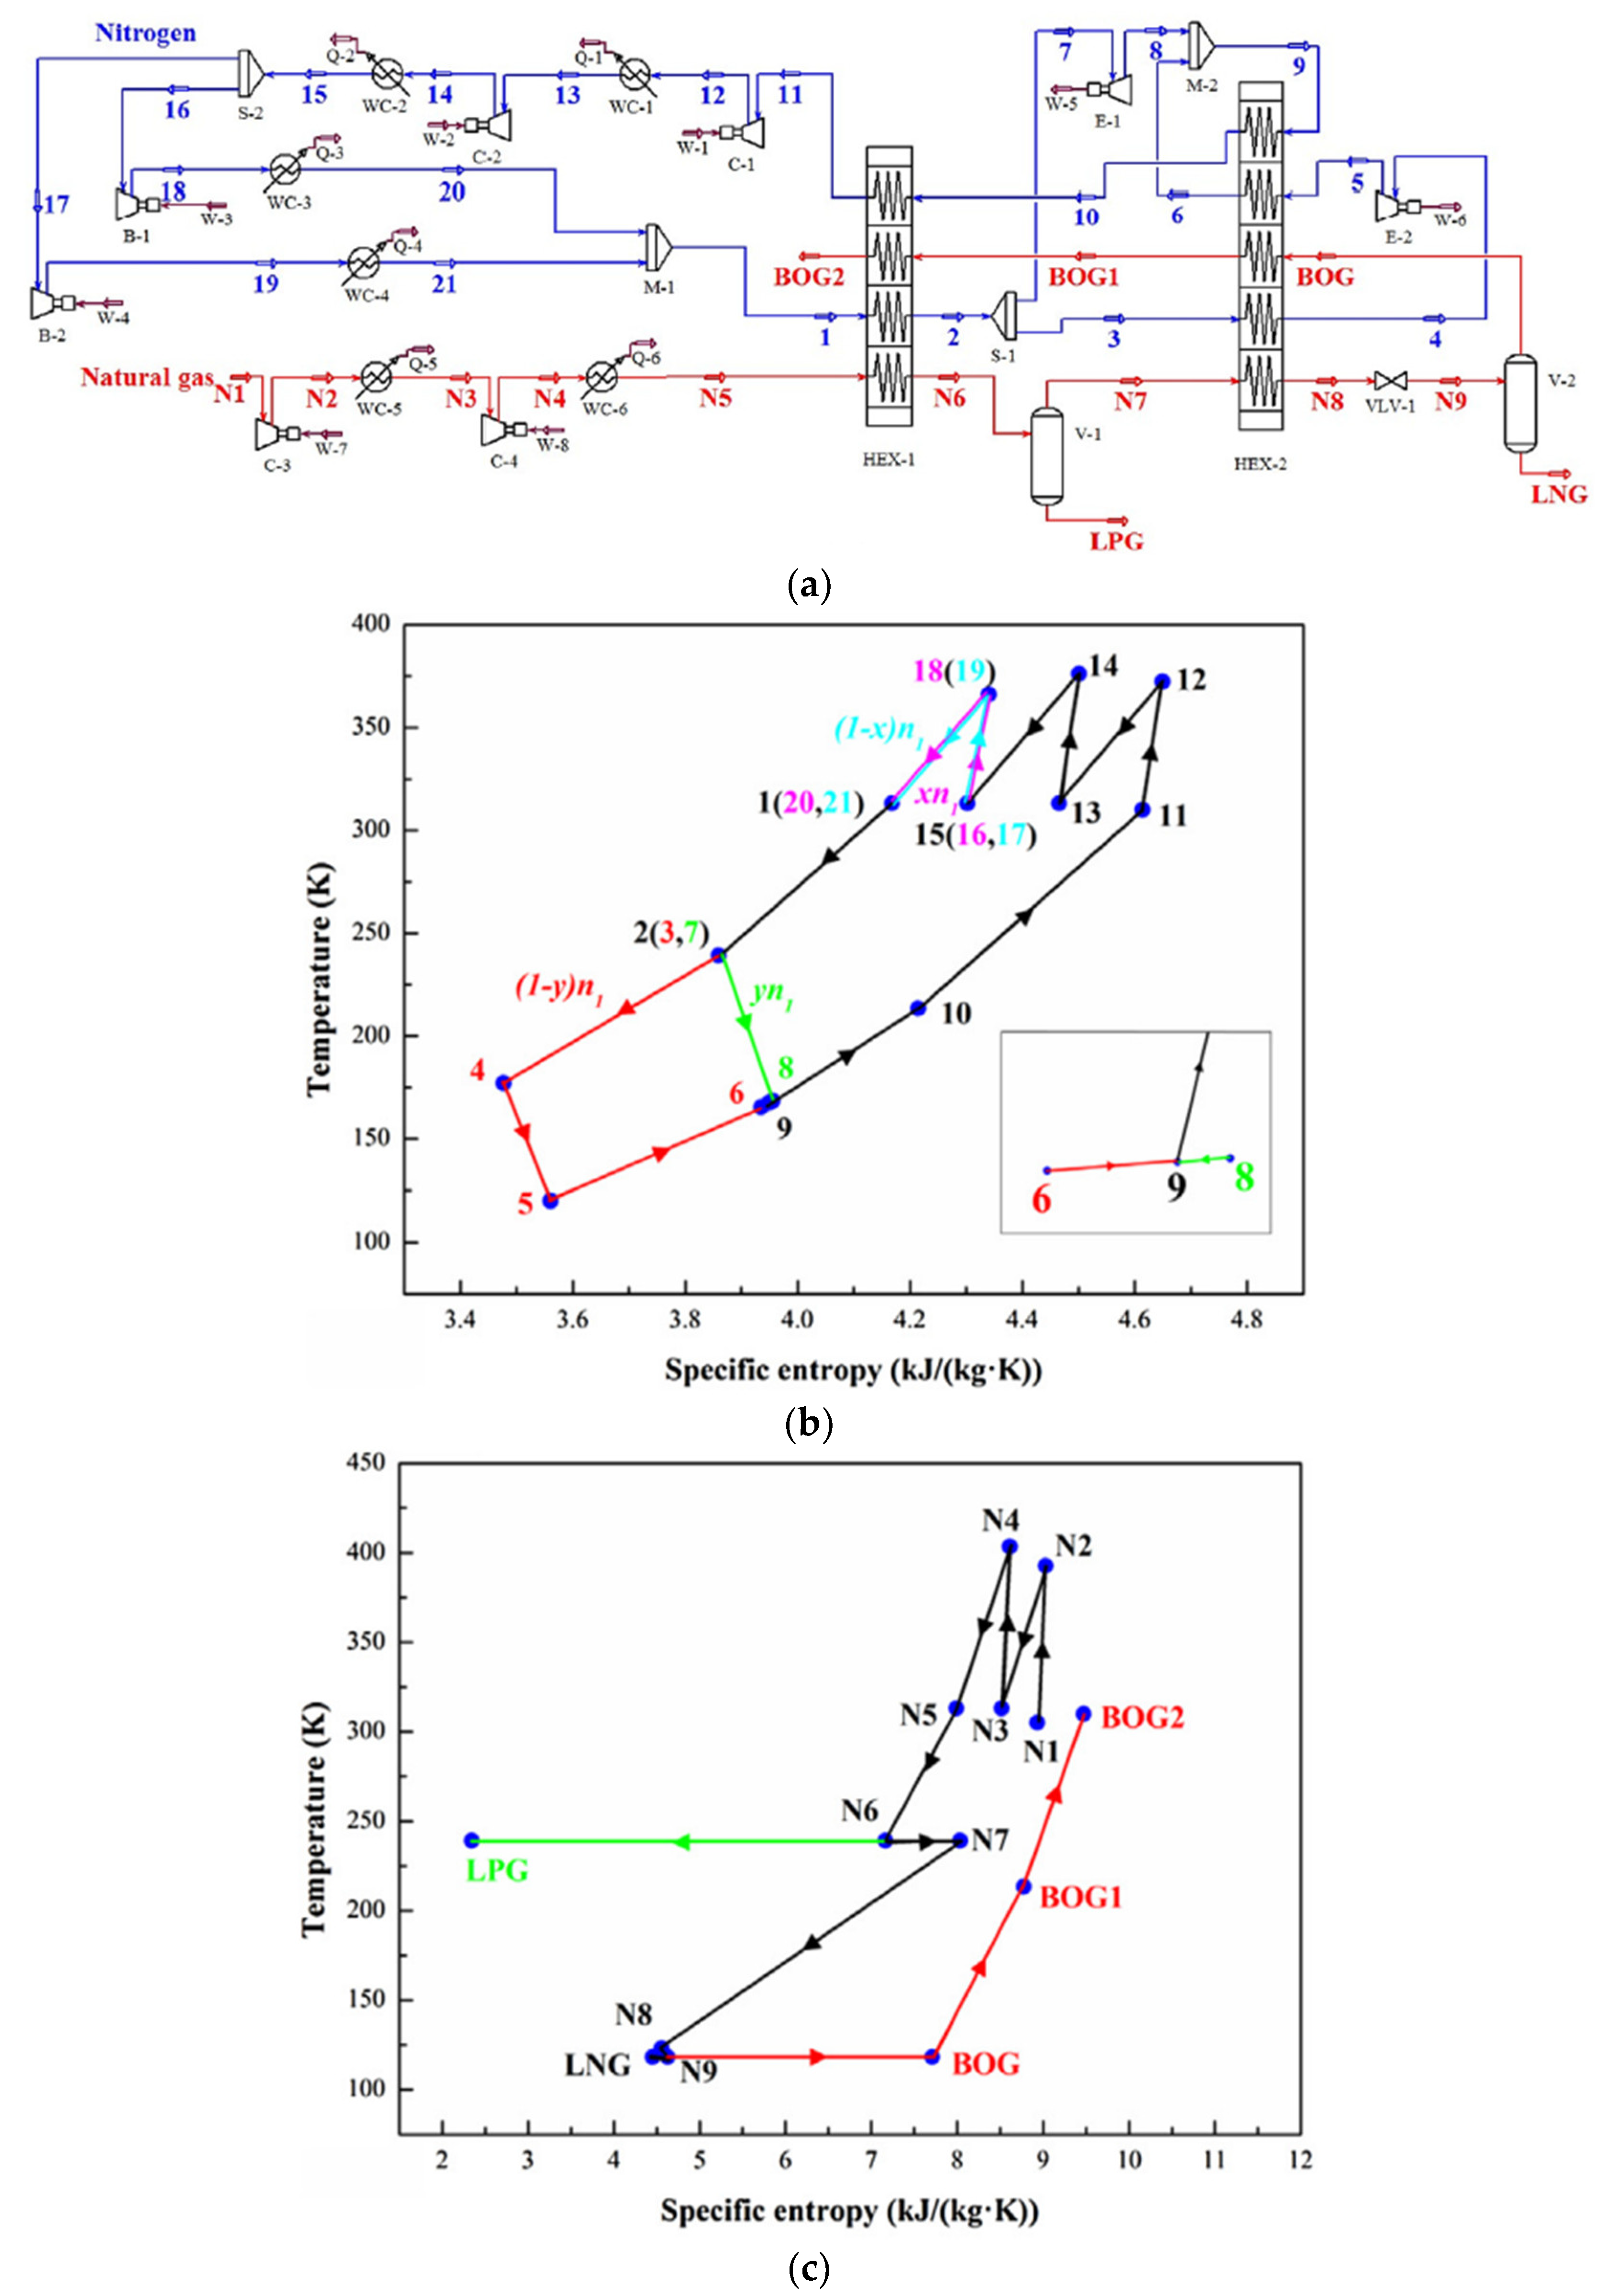
Figure 19.
Design options considered for the structural optimization of dual expander systems: (a) Option 1; (b) Option 2; (c) Heat exchange of BOG preheater [55]. Reproduced with permission from Elsevier (license number 5413360219443).
Figure 19.
Design options considered for the structural optimization of dual expander systems: (a) Option 1; (b) Option 2; (c) Heat exchange of BOG preheater [55]. Reproduced with permission from Elsevier (license number 5413360219443).

Figure 20.
Process flow diagram of the proposed optimized process for LNG-LPG-pentane plus production [63]. Reproduced with permission from Elsevier (license number 5413380649895).
Figure 20.
Process flow diagram of the proposed optimized process for LNG-LPG-pentane plus production [63]. Reproduced with permission from Elsevier (license number 5413380649895).
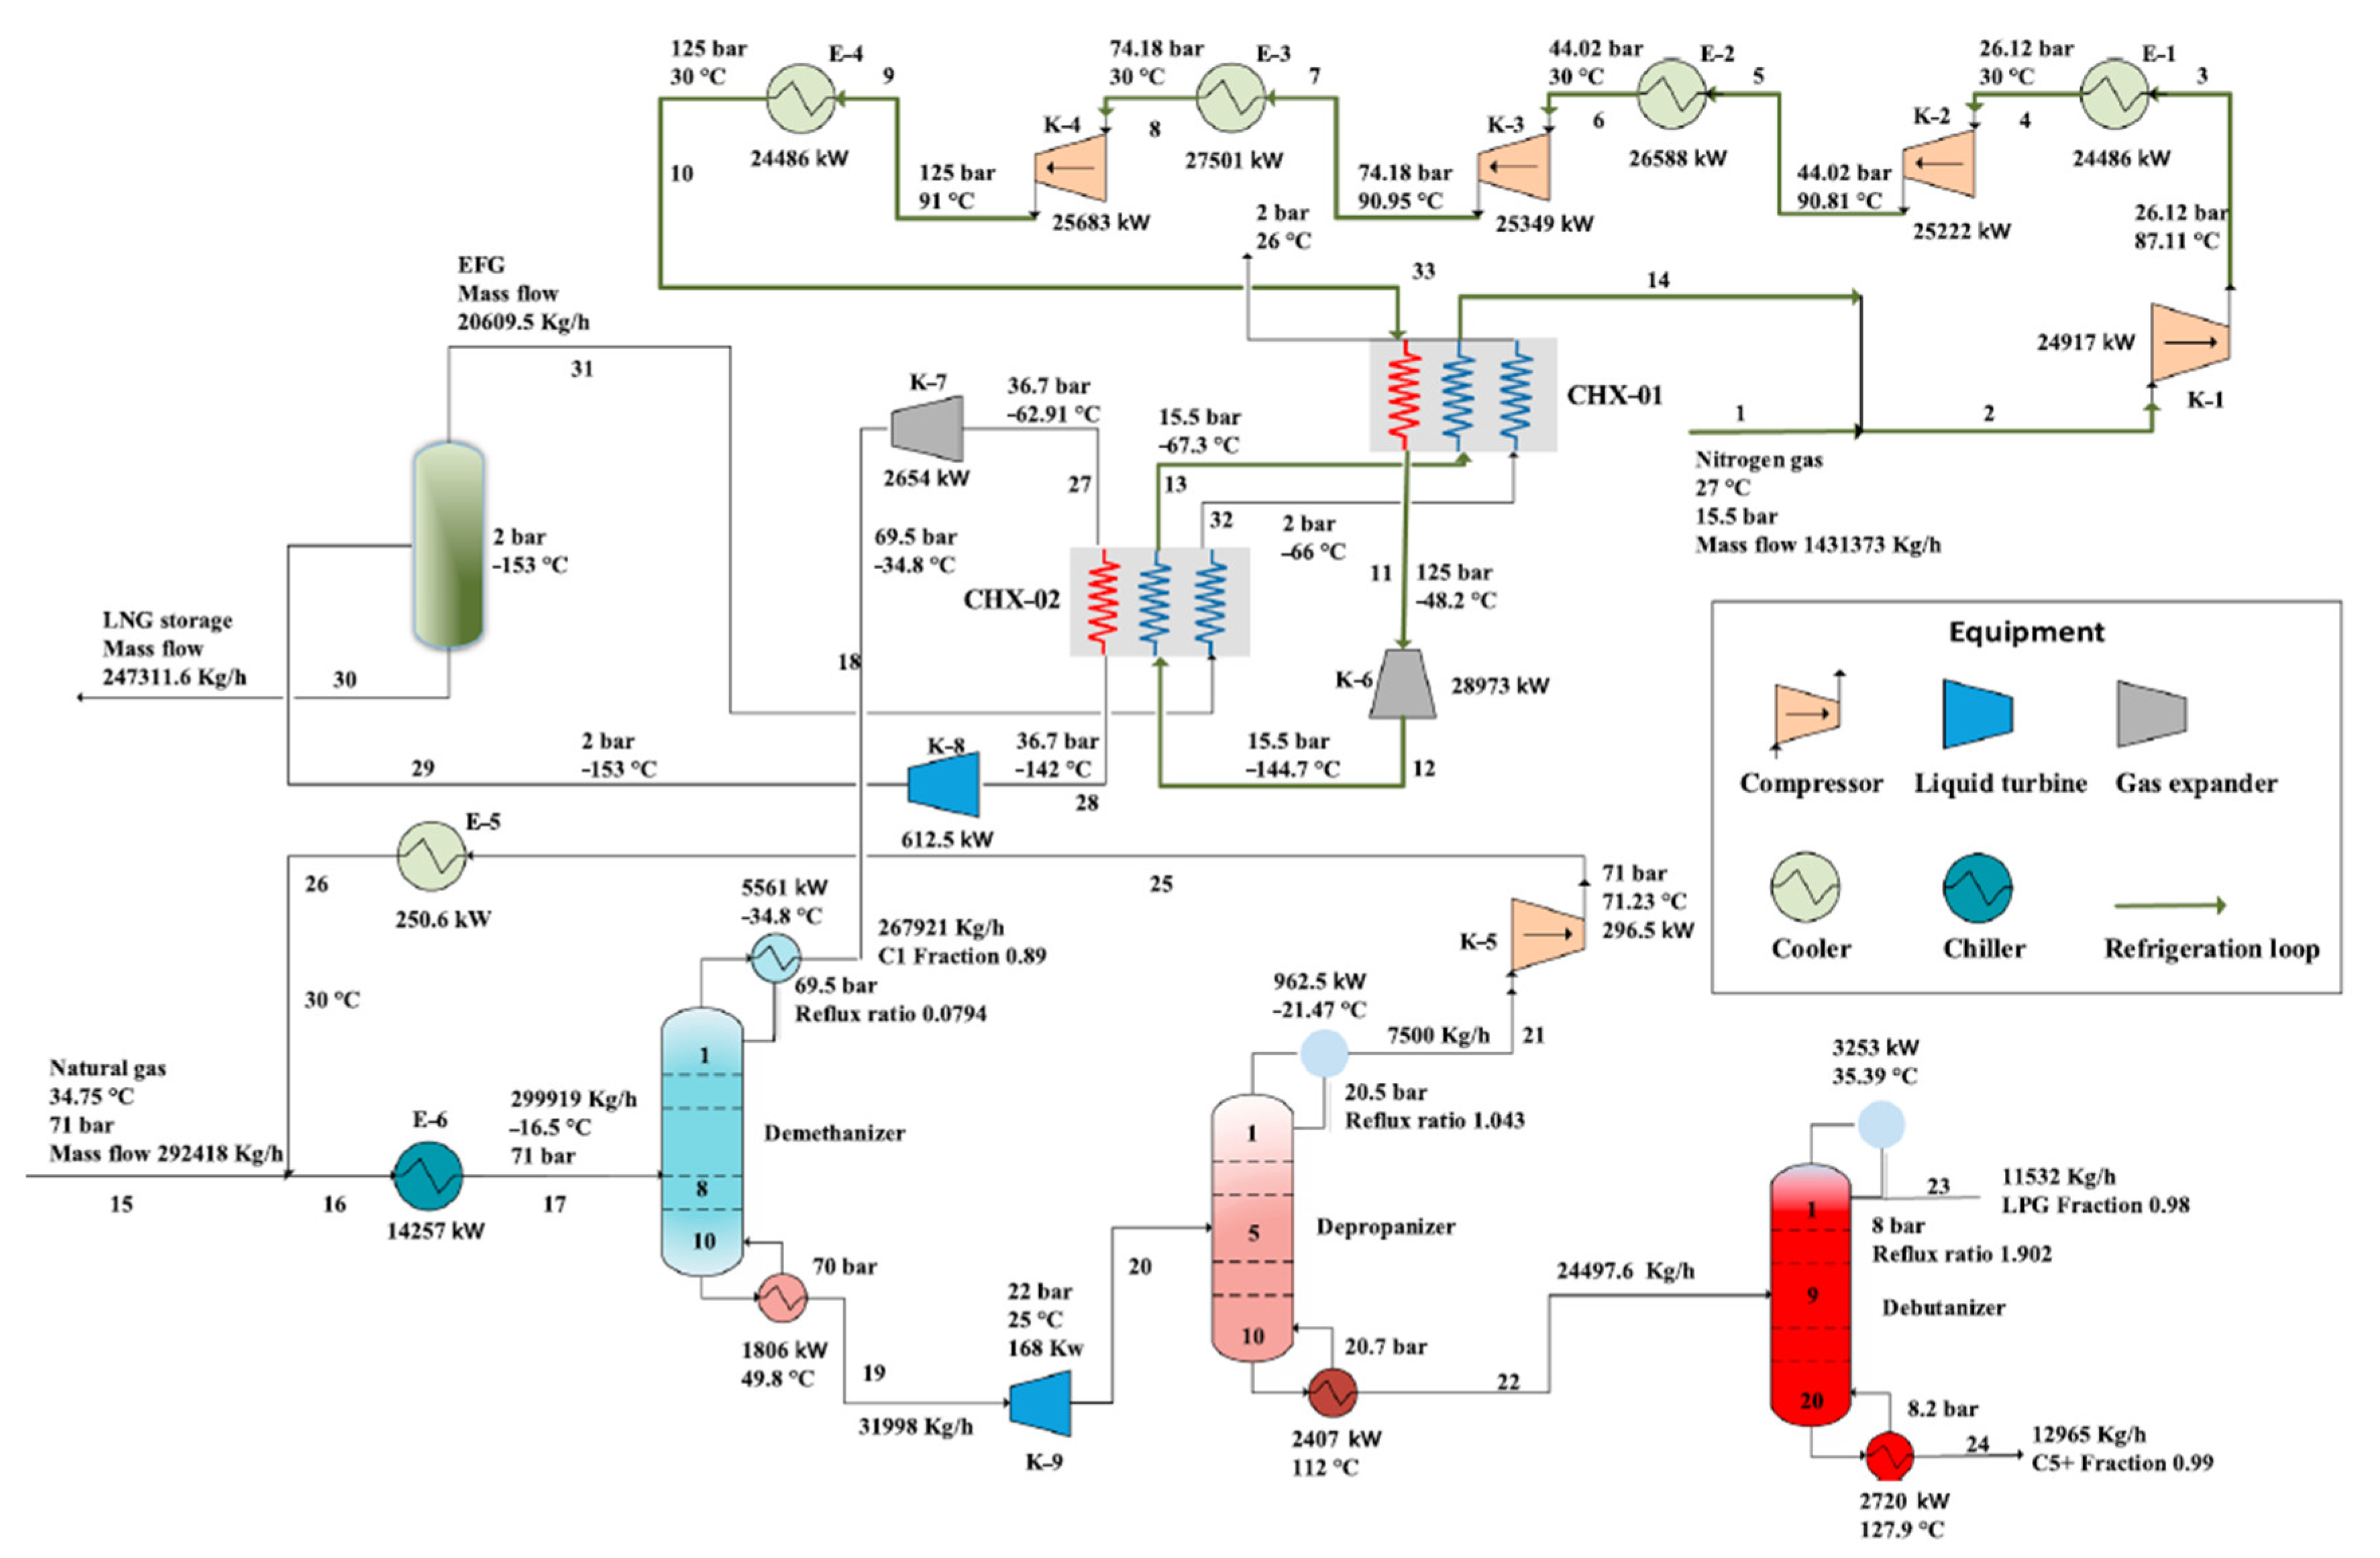
Figure 21.
The nitrogen expansion liquefaction process with propane pre-cooling (NEC-Propane) [68]. Reproduced with permission from Elsevier (license number 5413401151821).
Figure 21.
The nitrogen expansion liquefaction process with propane pre-cooling (NEC-Propane) [68]. Reproduced with permission from Elsevier (license number 5413401151821).
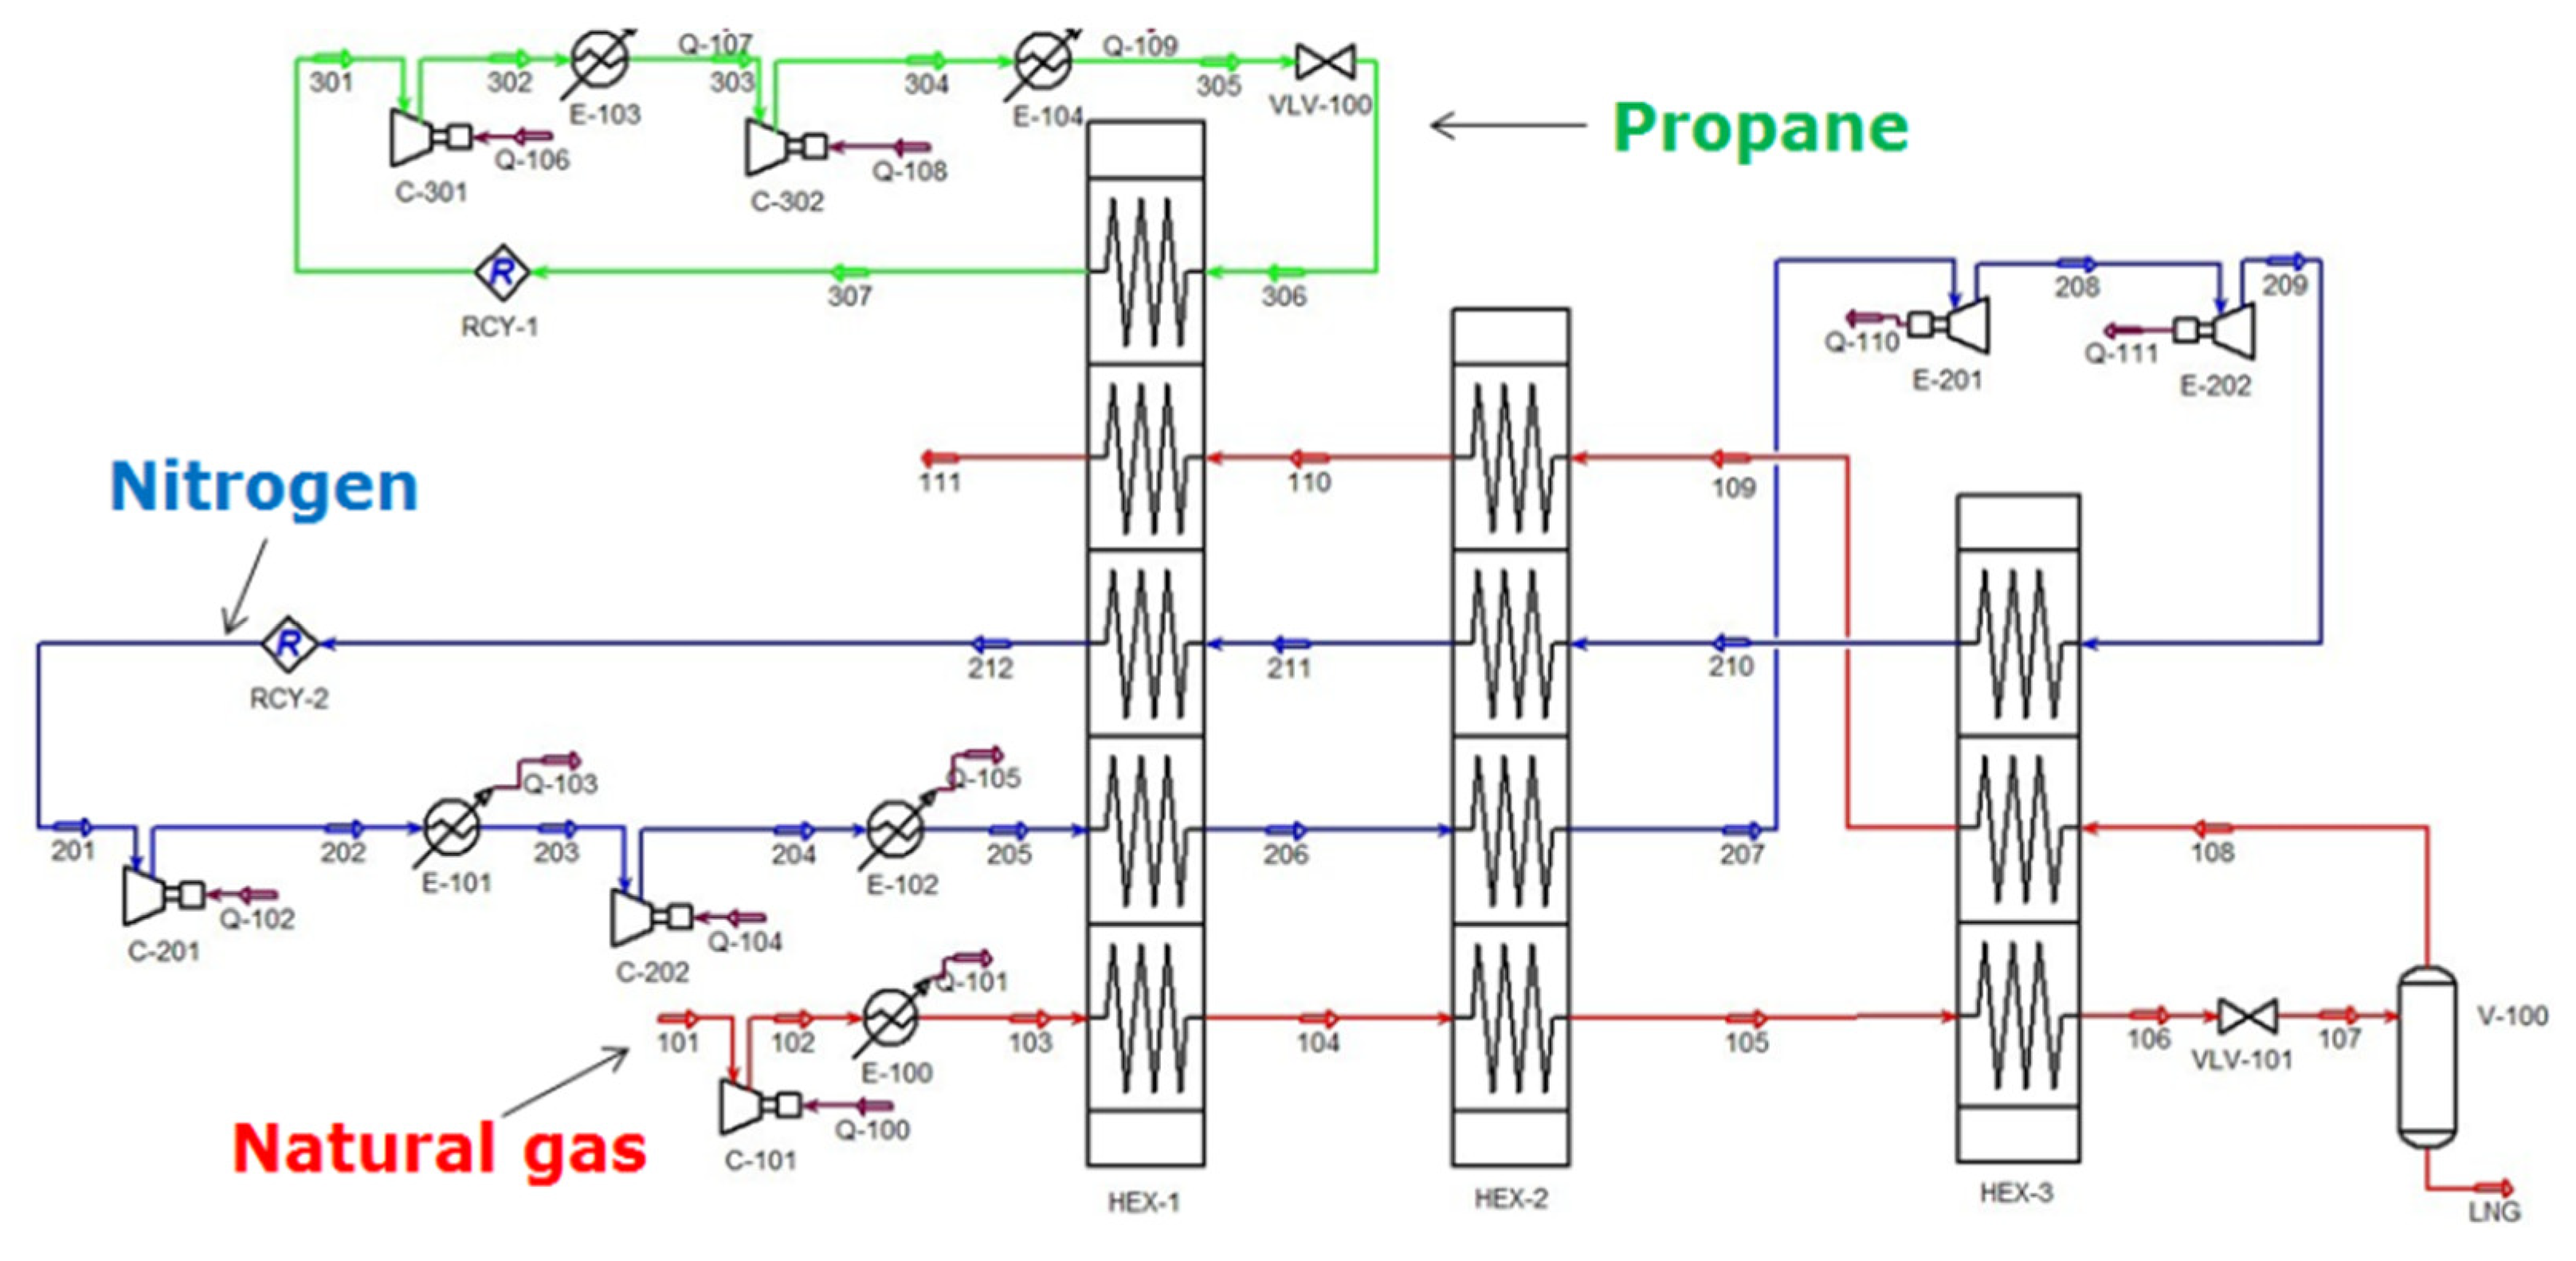
Figure 22.
Single nitrogen expansion process with ammonia absorption pre-cooling [69]. Reproduced with permission from Energy.
Figure 22.
Single nitrogen expansion process with ammonia absorption pre-cooling [69]. Reproduced with permission from Energy.
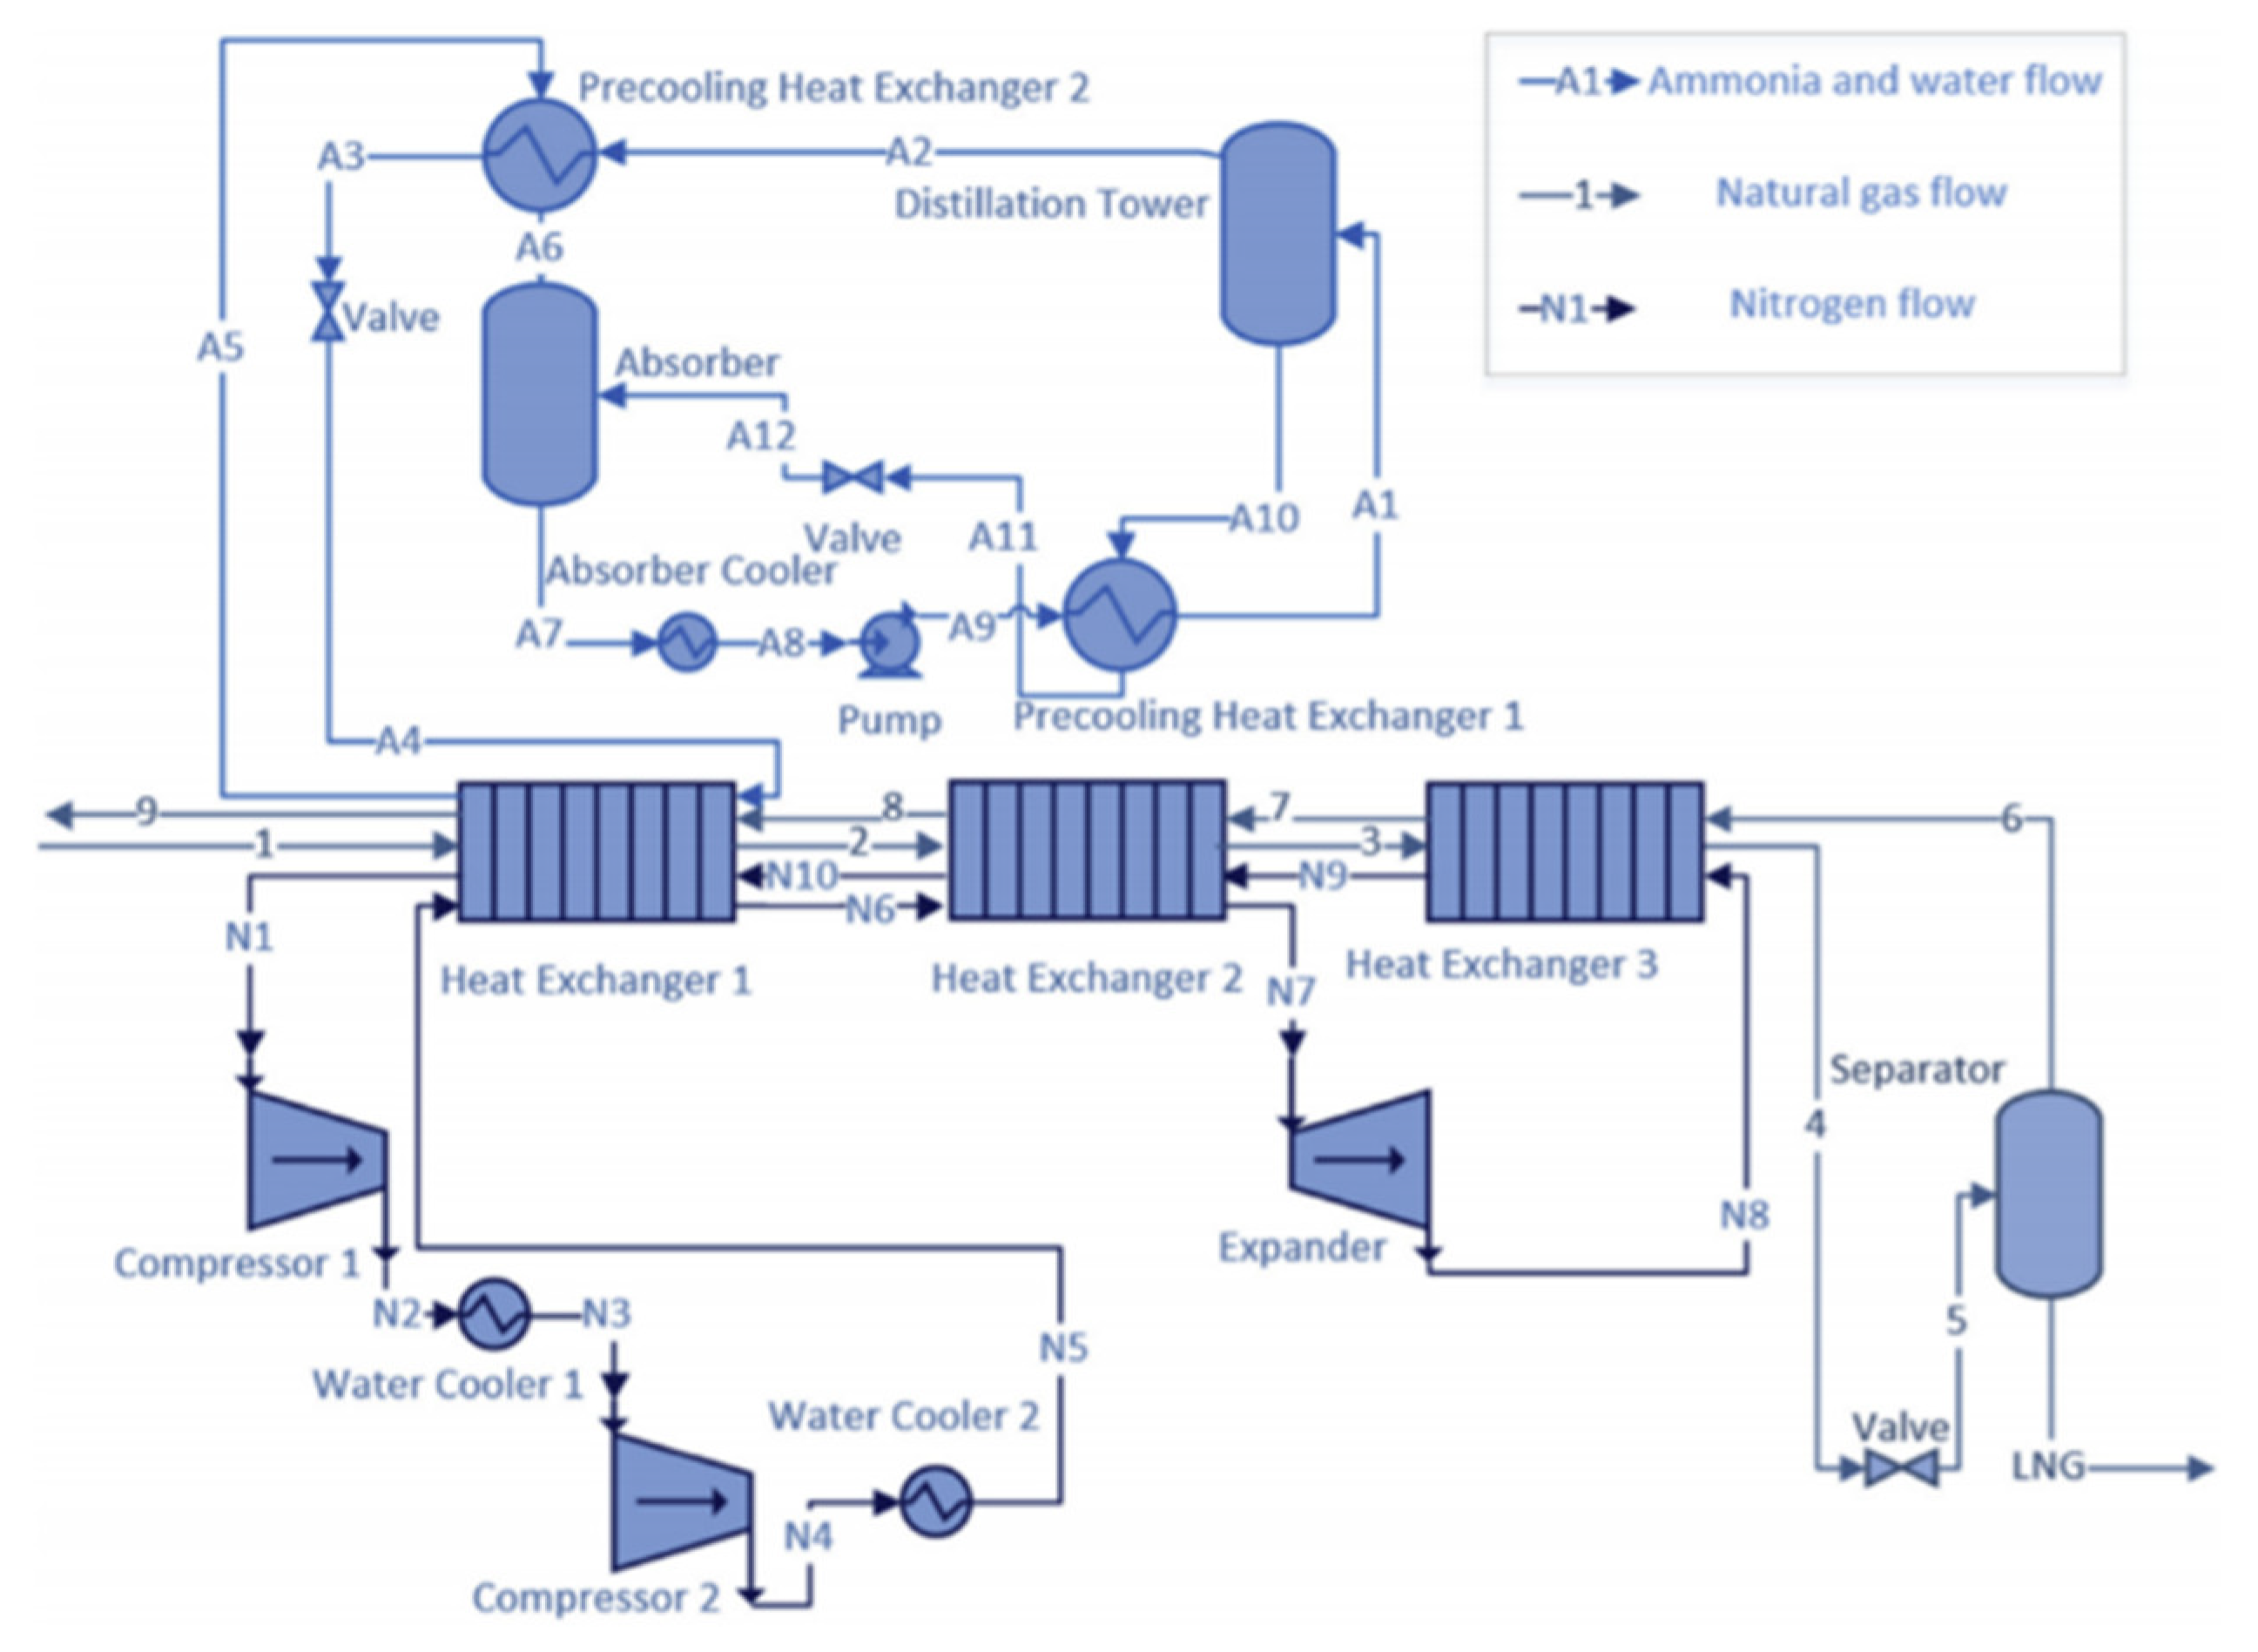
Figure 23.
Mixed refrigerant pre-cooling nitrogen expander process [74]. Reproduced with permission from Elsevier (license number 5413430448616).
Figure 23.
Mixed refrigerant pre-cooling nitrogen expander process [74]. Reproduced with permission from Elsevier (license number 5413430448616).

Figure 24.
The variation of Cp and Cp/Cv in different mole fractions of methane in the mixed refrigerant at standard conditions [87]. Reproduced with permission from Elsevier (license number 5413441330596).
Figure 24.
The variation of Cp and Cp/Cv in different mole fractions of methane in the mixed refrigerant at standard conditions [87]. Reproduced with permission from Elsevier (license number 5413441330596).

Figure 25.
Mixed refrigerant N2-CH4 expansion liquefaction process integrated with ethane separation for high ethane-content natural gas [91]. Reproduced with permission from Elsevier (license number 5413450518102).
Figure 25.
Mixed refrigerant N2-CH4 expansion liquefaction process integrated with ethane separation for high ethane-content natural gas [91]. Reproduced with permission from Elsevier (license number 5413450518102).

Figure 26.
The variation of Cp and Cp/Cv in different mole fractions of methane in the mixed refrigerant at standard conditions [92]. Reproduced with permission from Elsevier (license number 5413460001026).
Figure 26.
The variation of Cp and Cp/Cv in different mole fractions of methane in the mixed refrigerant at standard conditions [92]. Reproduced with permission from Elsevier (license number 5413460001026).

Figure 27.
The variation of Cp and Cp/Cv in different mole fractions of methane in the mixed refrigerant at standard conditions [93]. Reproduced with permission from Elsevier (license number 5413451303362).
Figure 27.
The variation of Cp and Cp/Cv in different mole fractions of methane in the mixed refrigerant at standard conditions [93]. Reproduced with permission from Elsevier (license number 5413451303362).

Figure 28.
SMR natural gas liquefaction process [96]. Reproduced with permission from Elsevier (license number 5413460250916).
Figure 28.
SMR natural gas liquefaction process [96]. Reproduced with permission from Elsevier (license number 5413460250916).
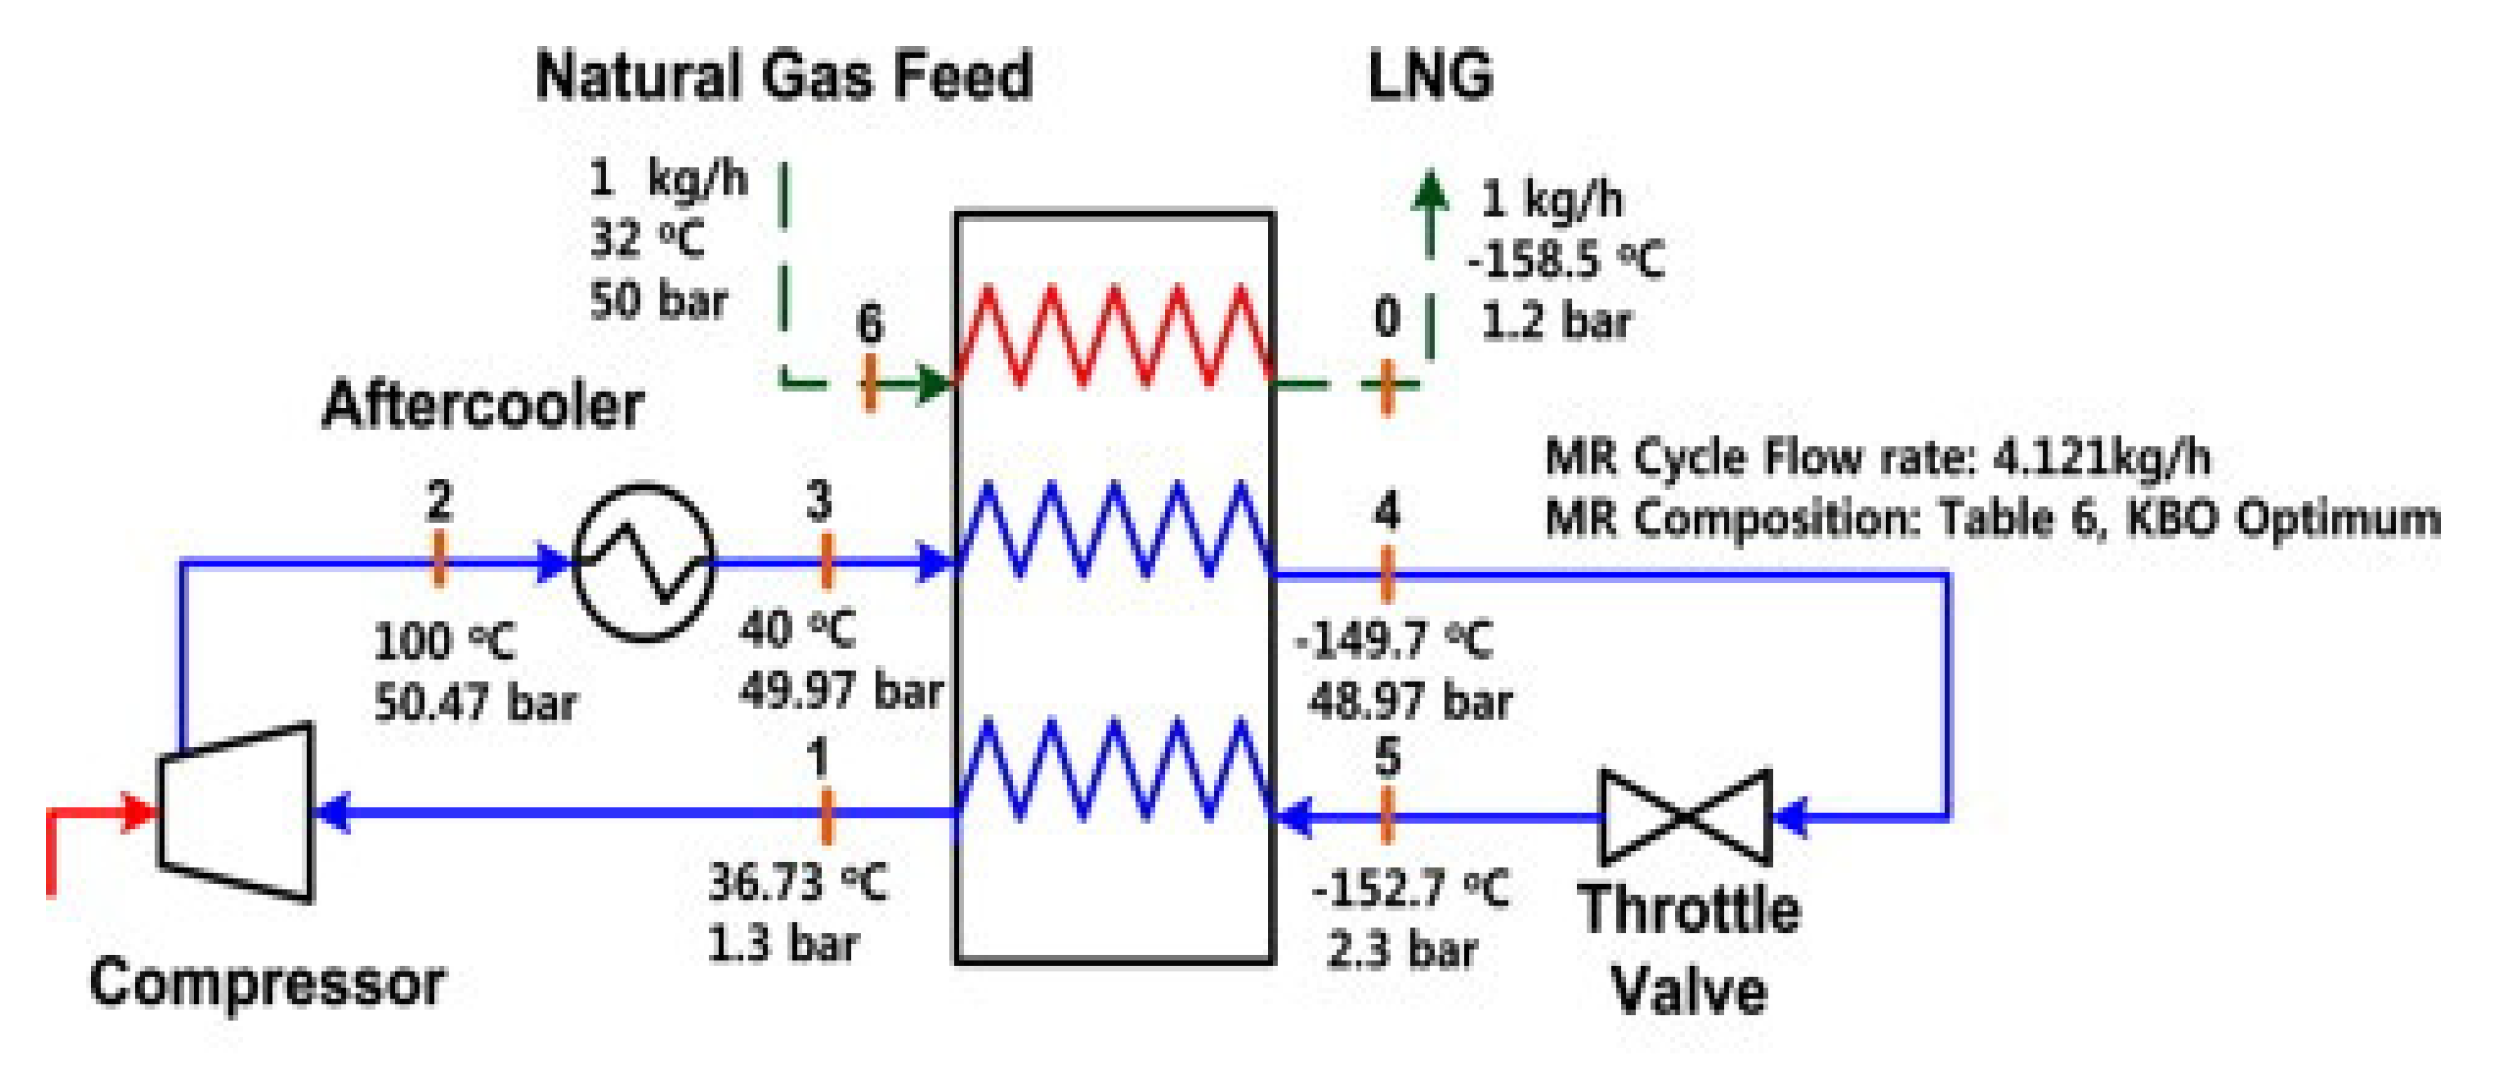
Figure 29.
Flow sheet of the PRICO process [97]. Reproduced with permission from Elsevier (license number 5413460329927).
Figure 29.
Flow sheet of the PRICO process [97]. Reproduced with permission from Elsevier (license number 5413460329927).
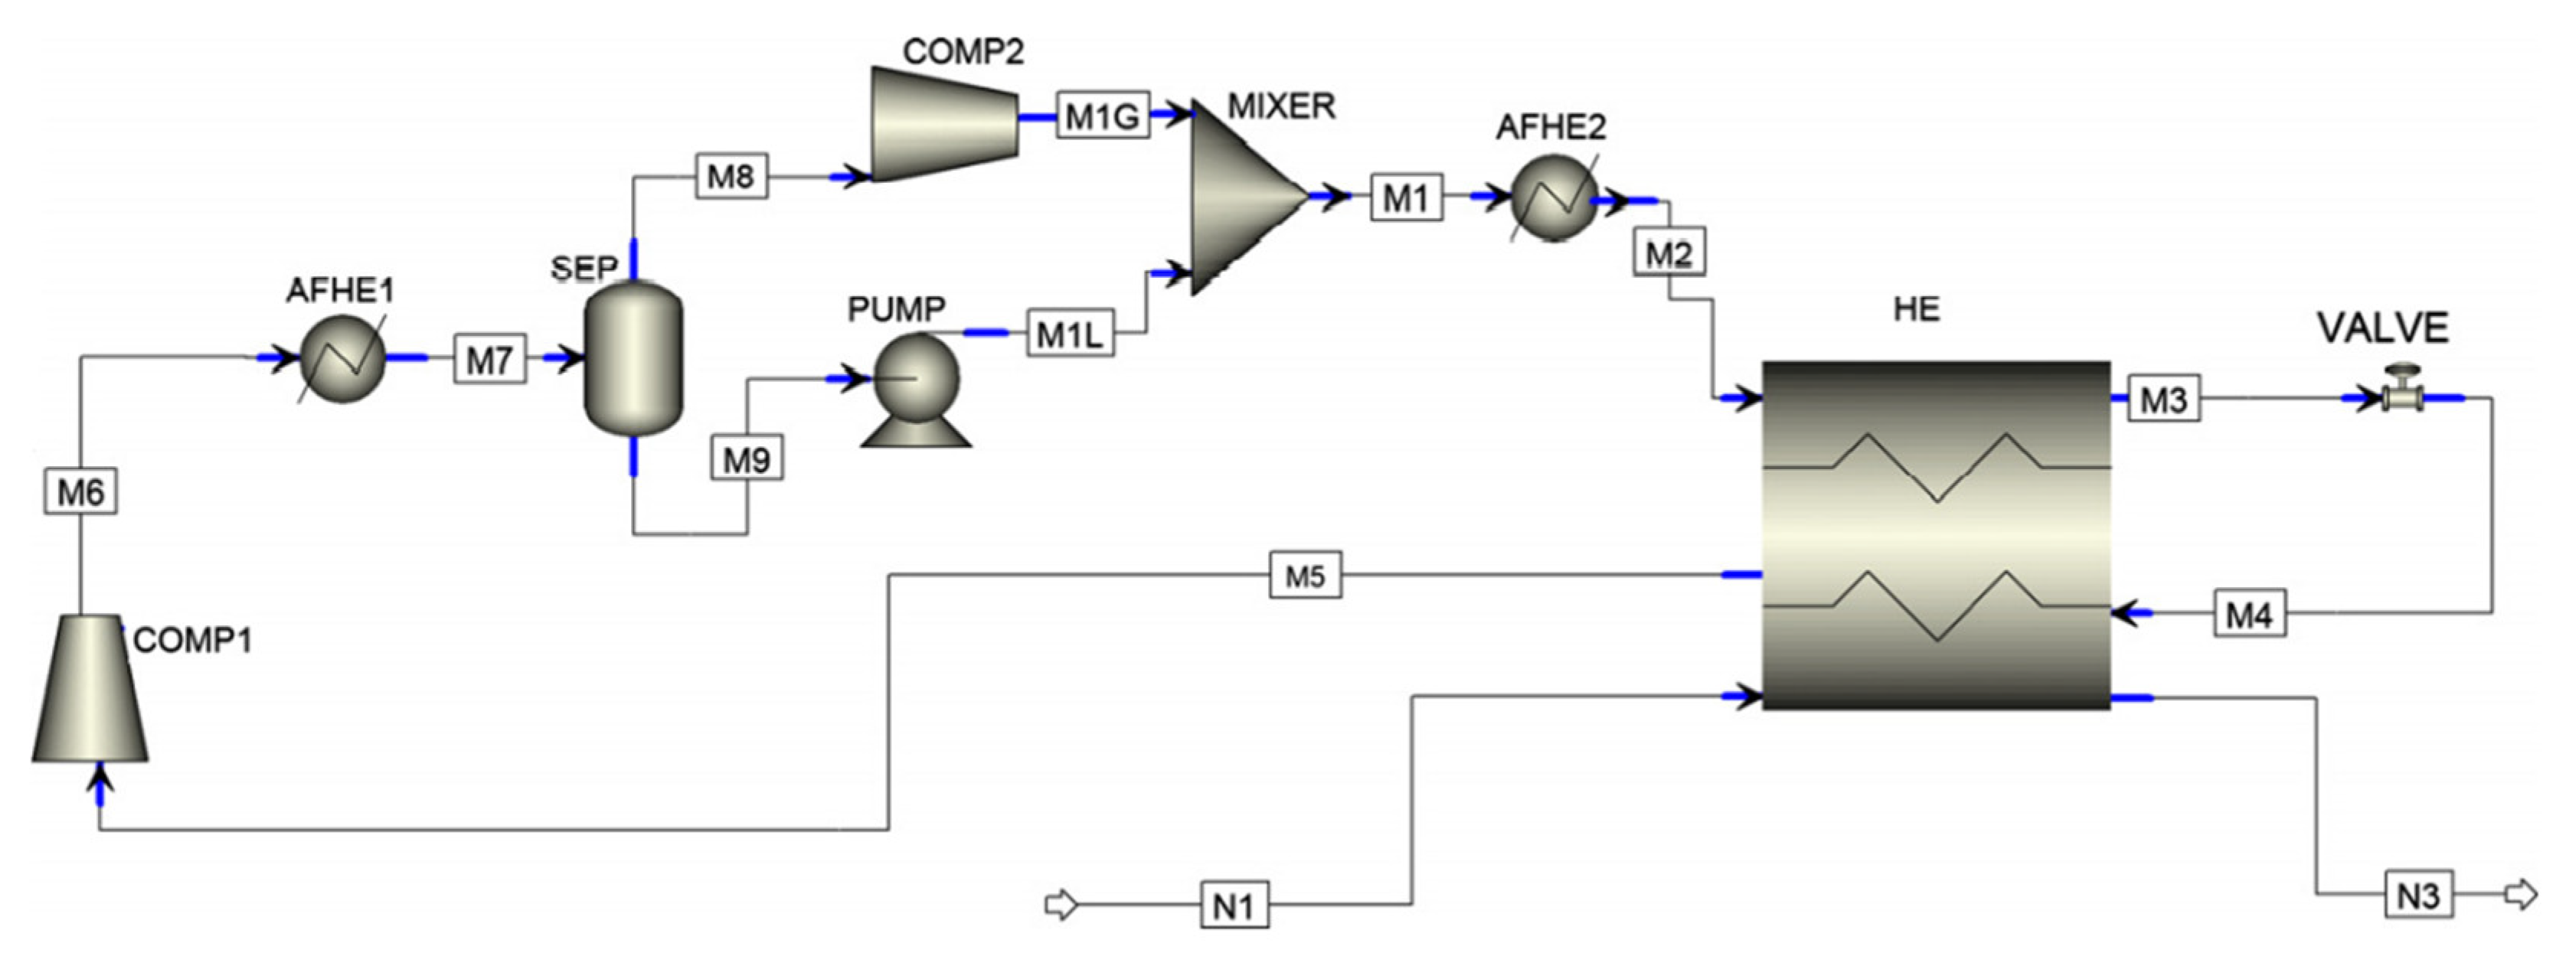
Figure 30.
Simplified flowsheet of the PRICO process [110]. Reproduced with permission from IFAC meetings.
Figure 30.
Simplified flowsheet of the PRICO process [110]. Reproduced with permission from IFAC meetings.

Figure 31.
Conceptual structure of MSMR process [111]. Reproduced with permission from Elsevier (license number 5413460811174).
Figure 31.
Conceptual structure of MSMR process [111]. Reproduced with permission from Elsevier (license number 5413460811174).

Figure 32.
Arrangement of HK/LK control structure [111]. Reproduced with permission from Elsevier (license number 5413460811174).
Figure 32.
Arrangement of HK/LK control structure [111]. Reproduced with permission from Elsevier (license number 5413460811174).

Figure 33.
An optimization framework for the proposed design approach [113]. Reproduced with permission from Elsevier (license number 5413461241209).
Figure 33.
An optimization framework for the proposed design approach [113]. Reproduced with permission from Elsevier (license number 5413461241209).

Figure 34.
SMR process optimized by Qyyum et al. [127]. Reproduced with permission from Energy Proceedings.
Figure 34.
SMR process optimized by Qyyum et al. [127]. Reproduced with permission from Energy Proceedings.
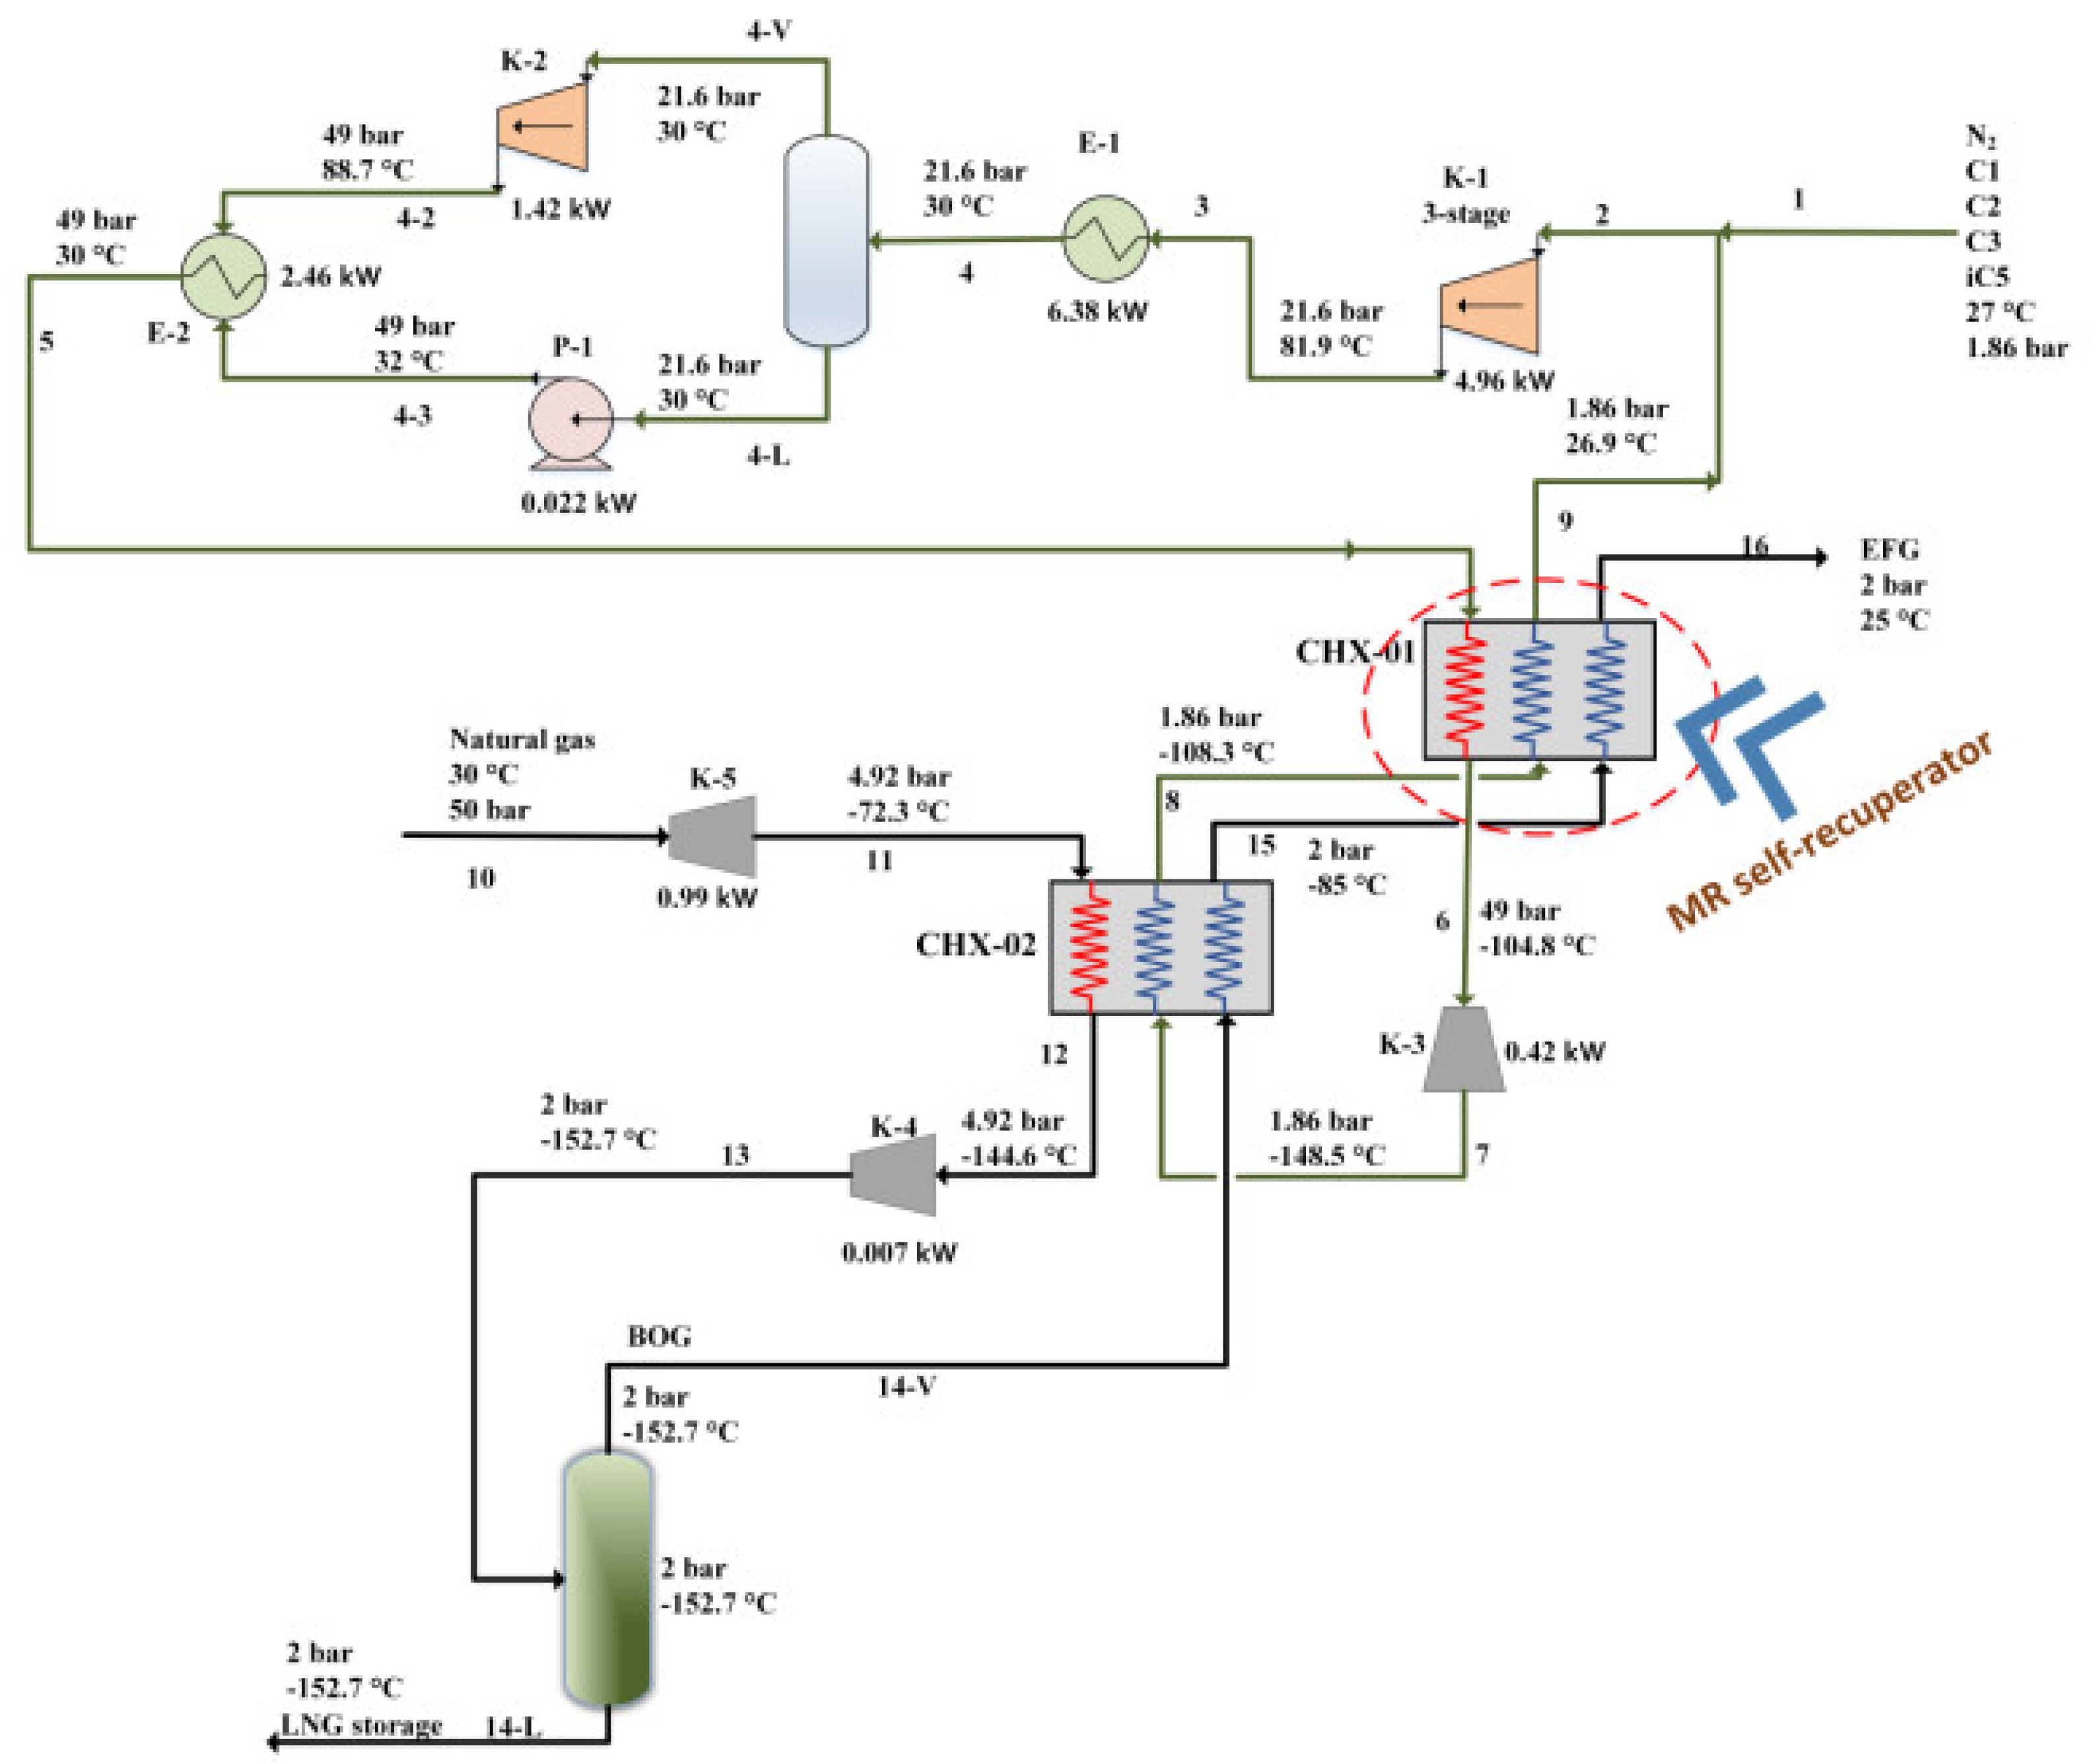
Figure 35.
Process flow diagram KSMR cycle [128]. Reproduced with permission from Elsevier (license number 5413480436053).
Figure 35.
Process flow diagram KSMR cycle [128]. Reproduced with permission from Elsevier (license number 5413480436053).

Figure 36.
C3MR natural gas liquefaction process [130]. Reproduced with permission from Elsevier (license number 5413480463759).
Figure 36.
C3MR natural gas liquefaction process [130]. Reproduced with permission from Elsevier (license number 5413480463759).
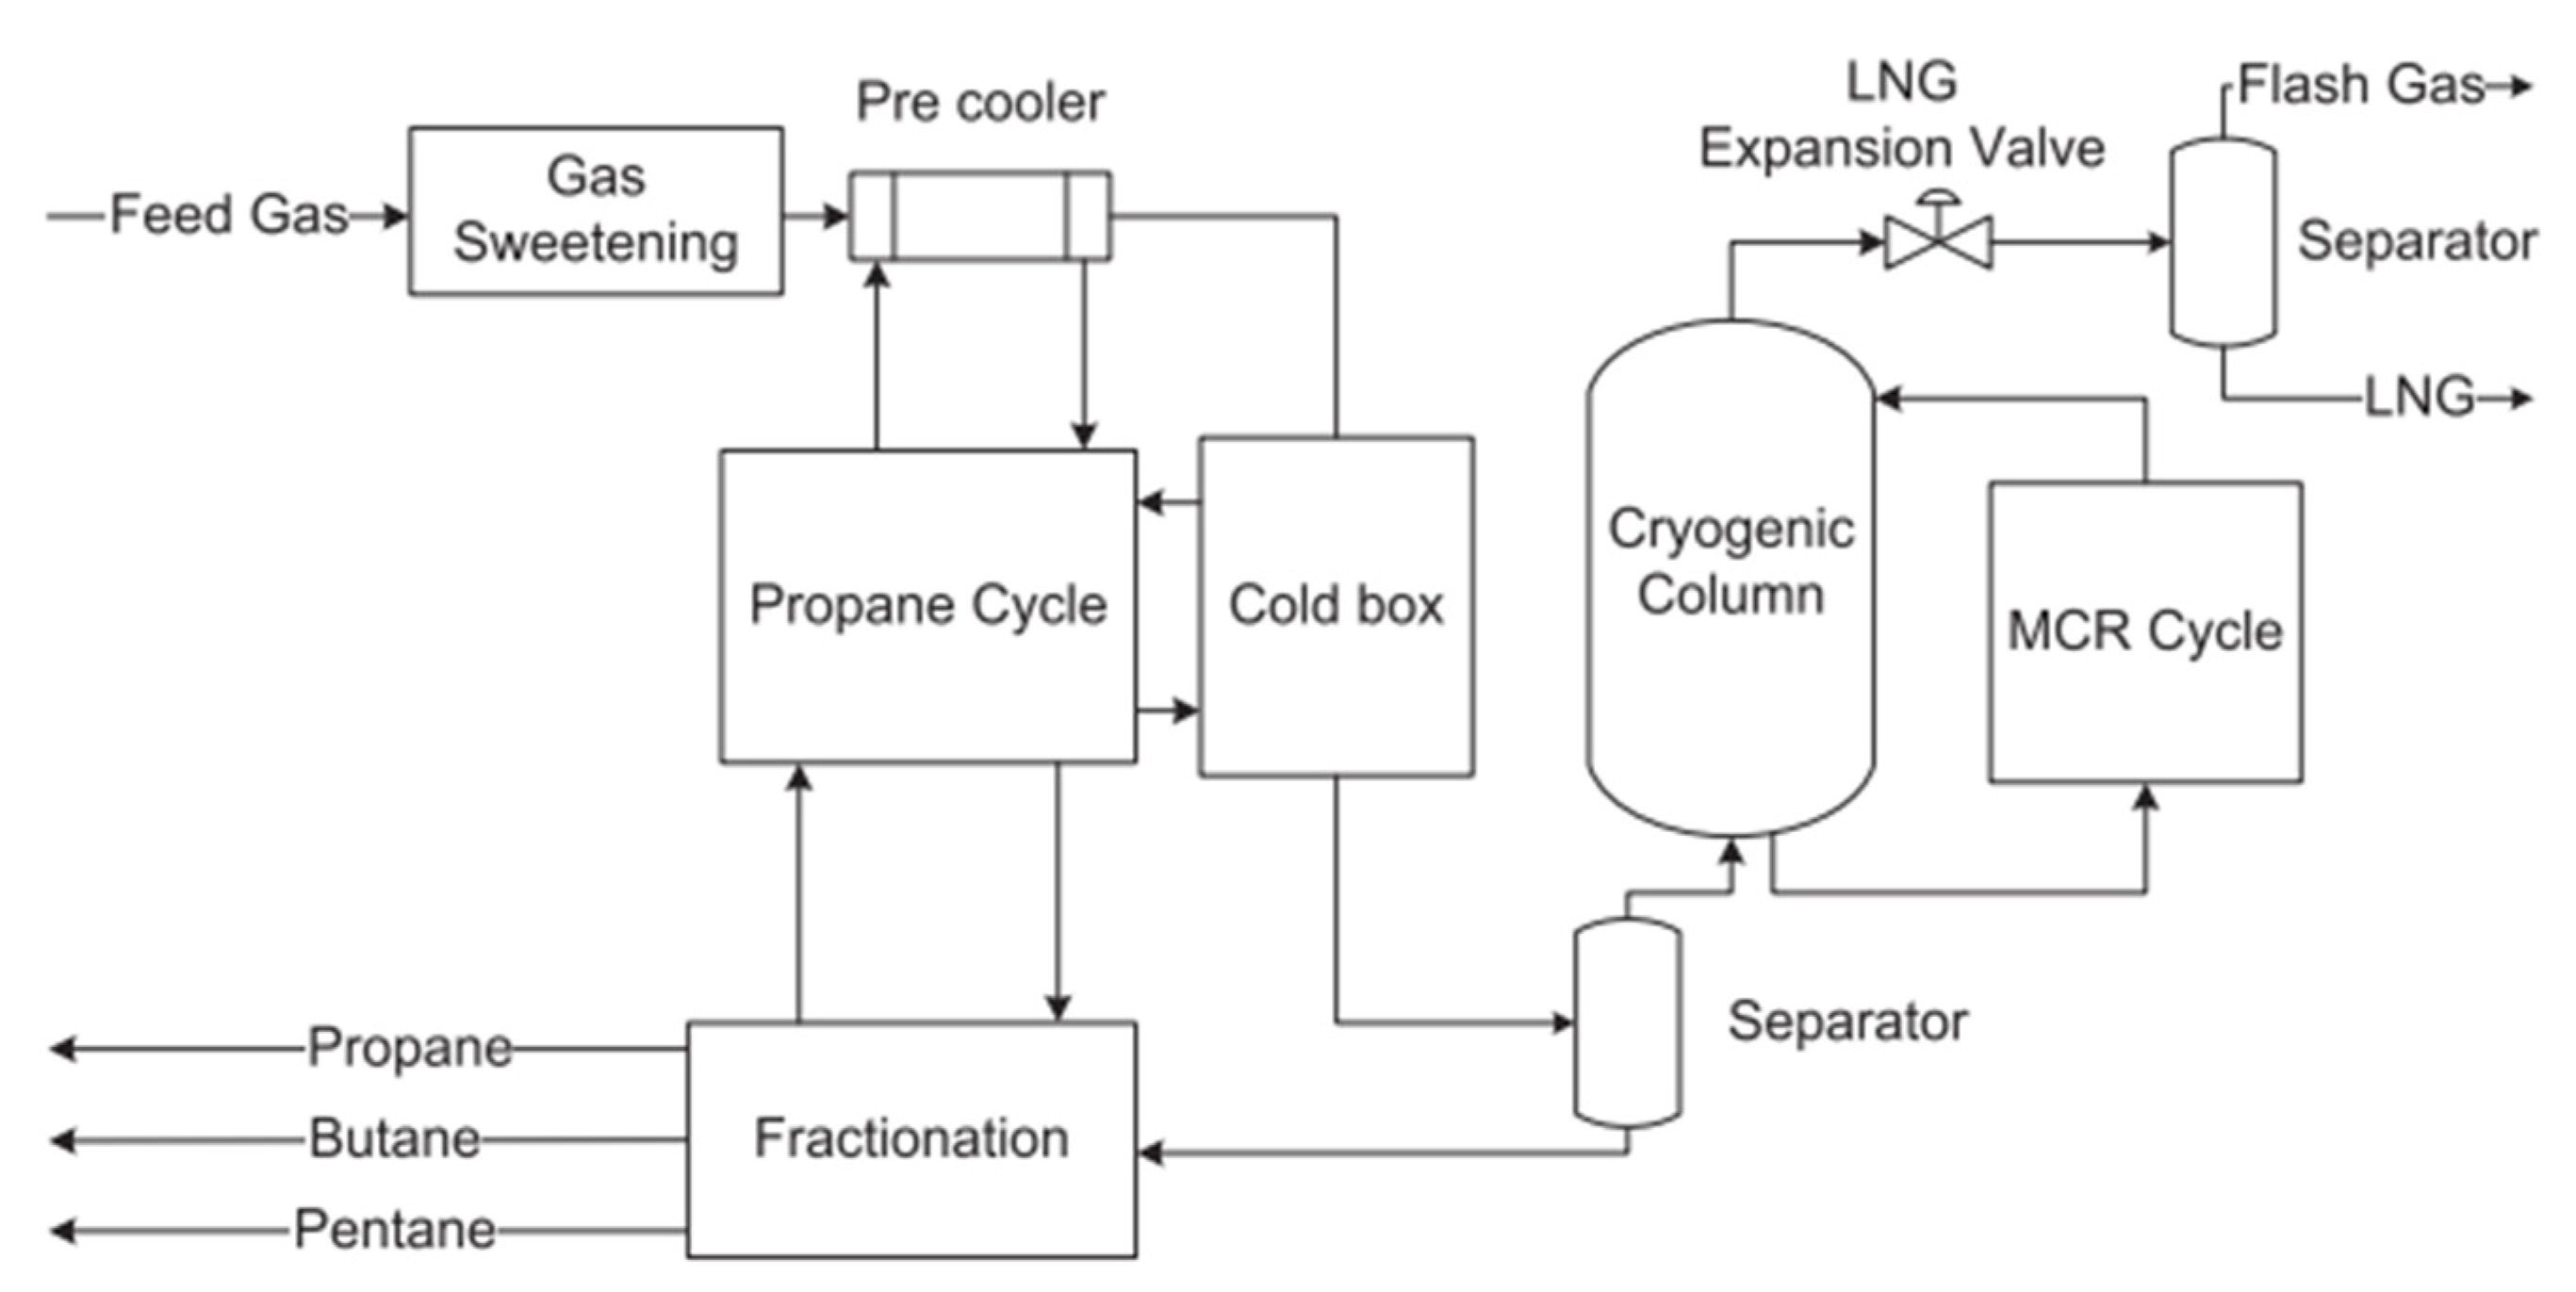
Figure 37.
Process flow diagram of AP-X™ configuration [145]. Reproduced with permission from Elsevier (license number 5413641392013).
Figure 37.
Process flow diagram of AP-X™ configuration [145]. Reproduced with permission from Elsevier (license number 5413641392013).
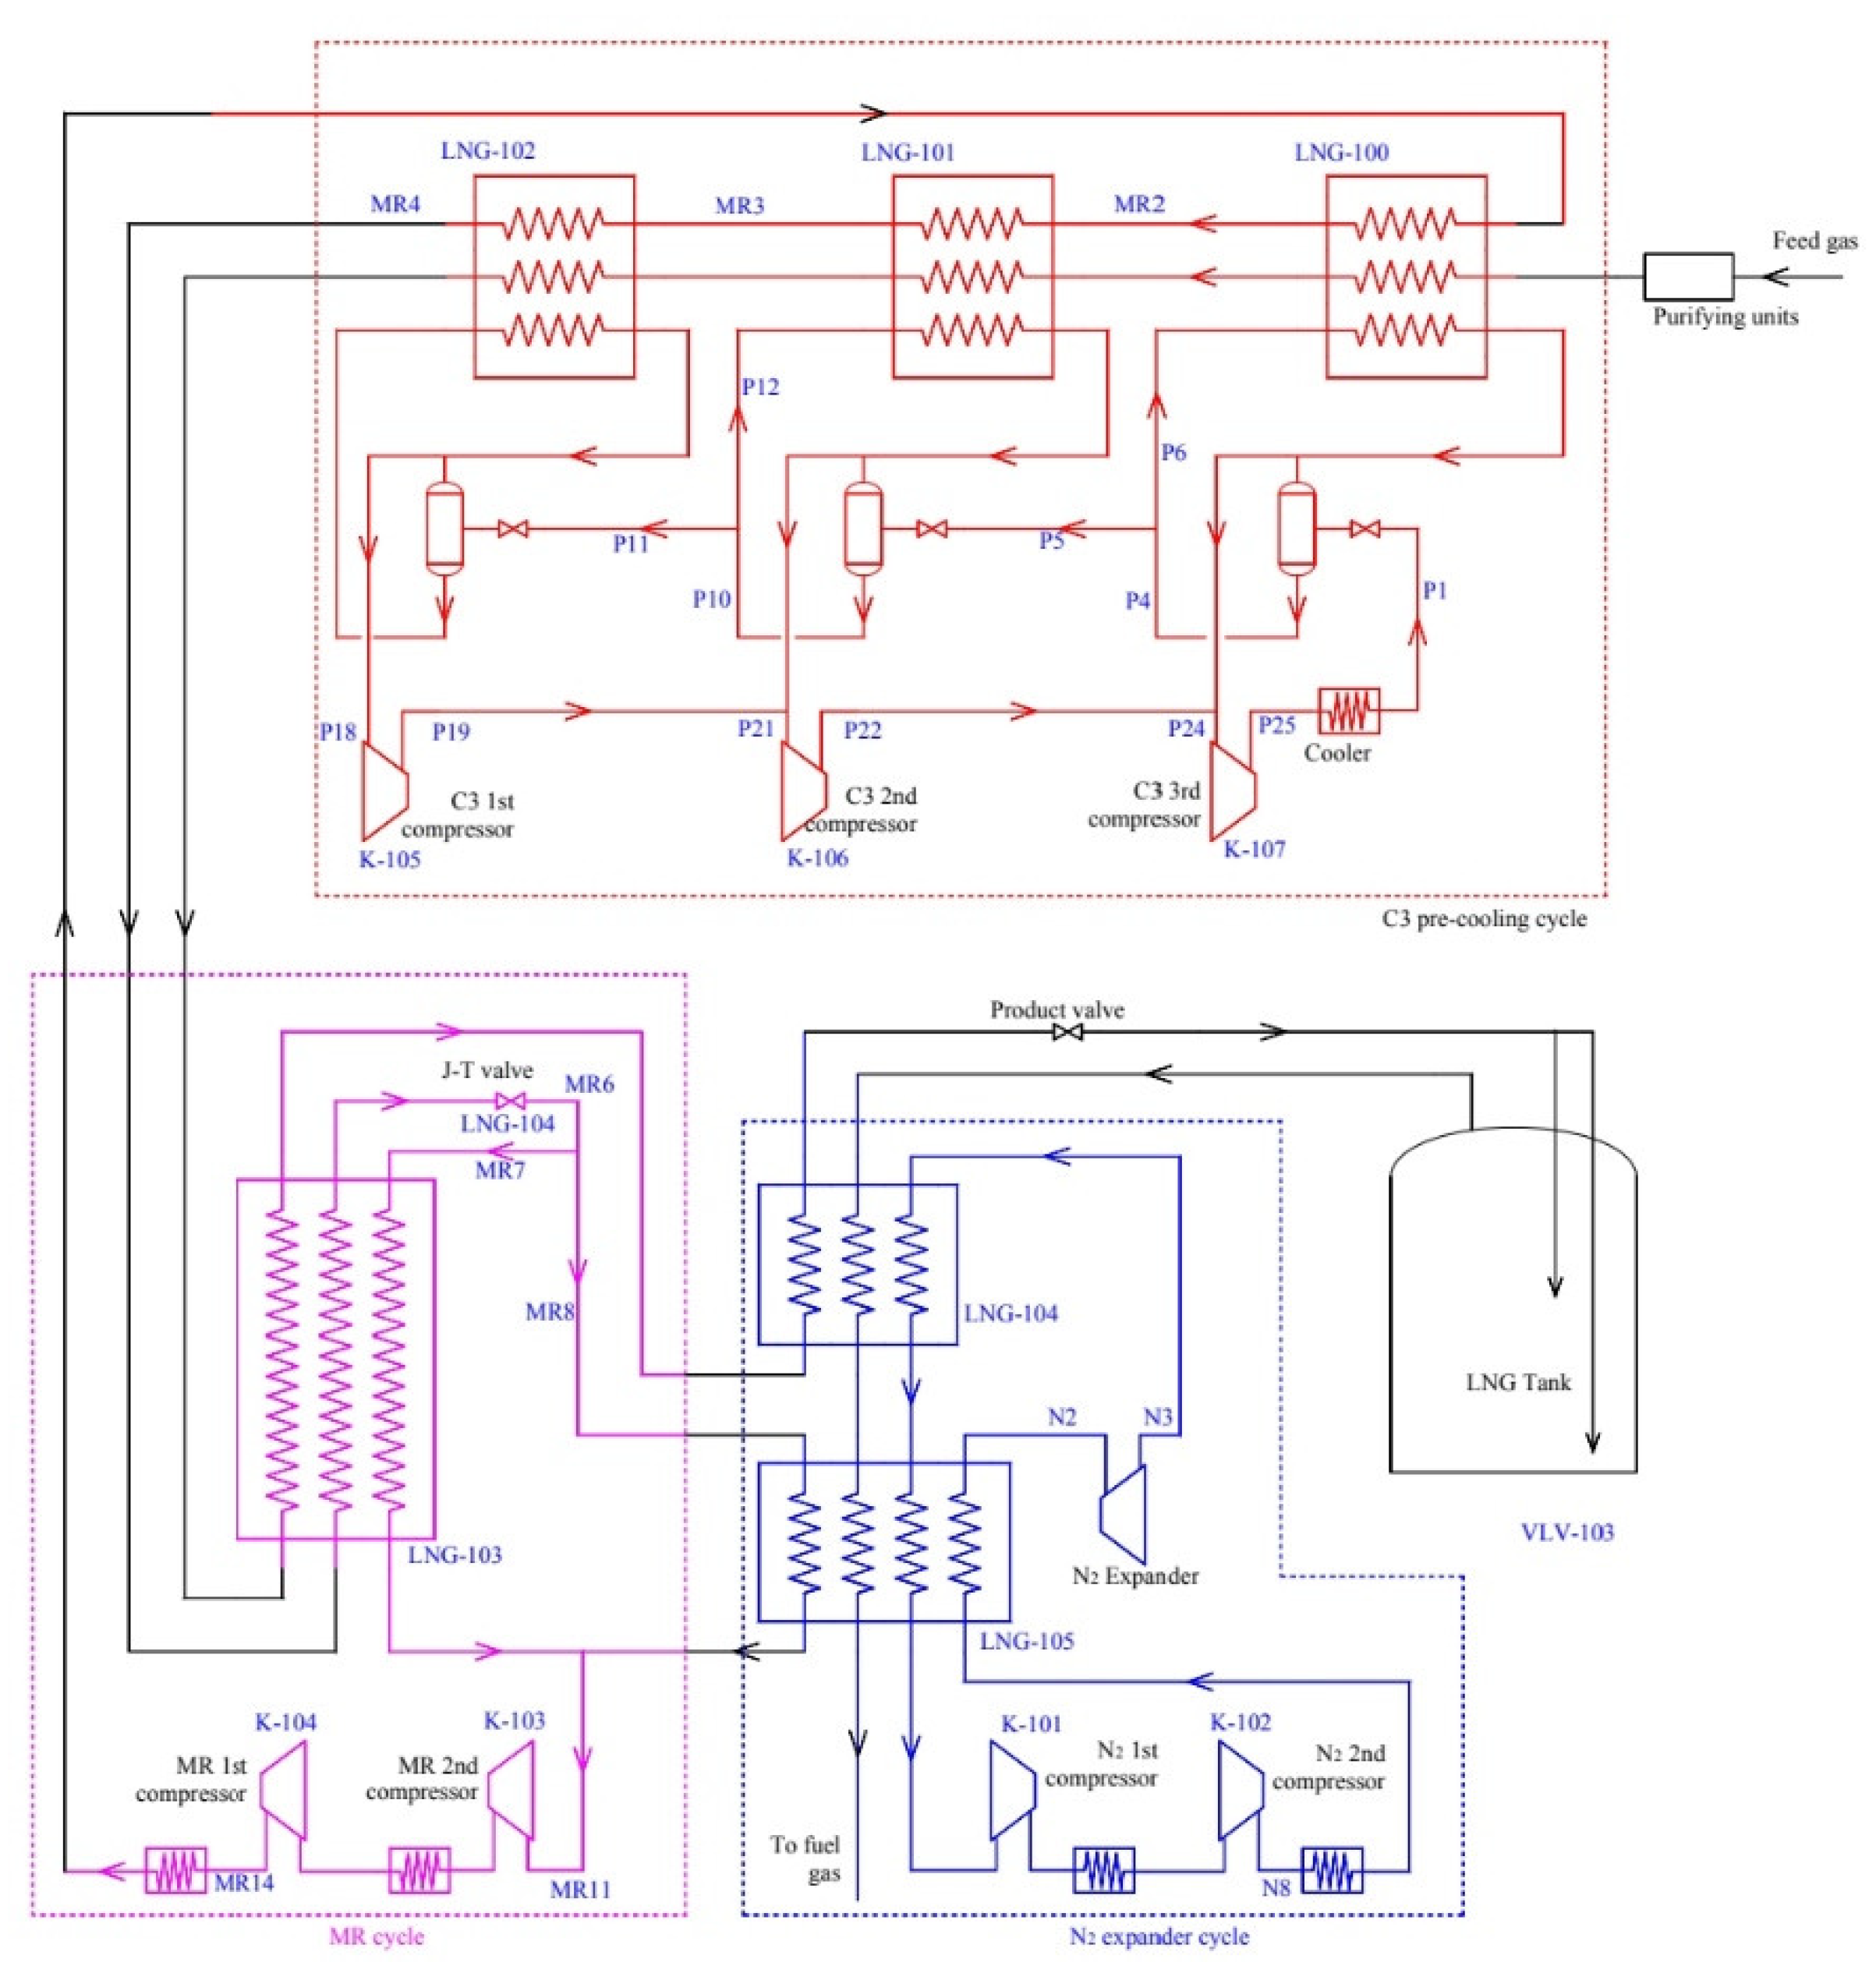
Figure 38.
DMR natural gas liquefaction process [150]. Reproduced with permission from Elsevier (license number 5413510891287).
Figure 38.
DMR natural gas liquefaction process [150]. Reproduced with permission from Elsevier (license number 5413510891287).

Figure 39.
DMR-FLNG natural gas liquefaction process [153]. Reproduced with permission from Elsevier (license number 5413540110613).
Figure 39.
DMR-FLNG natural gas liquefaction process [153]. Reproduced with permission from Elsevier (license number 5413540110613).
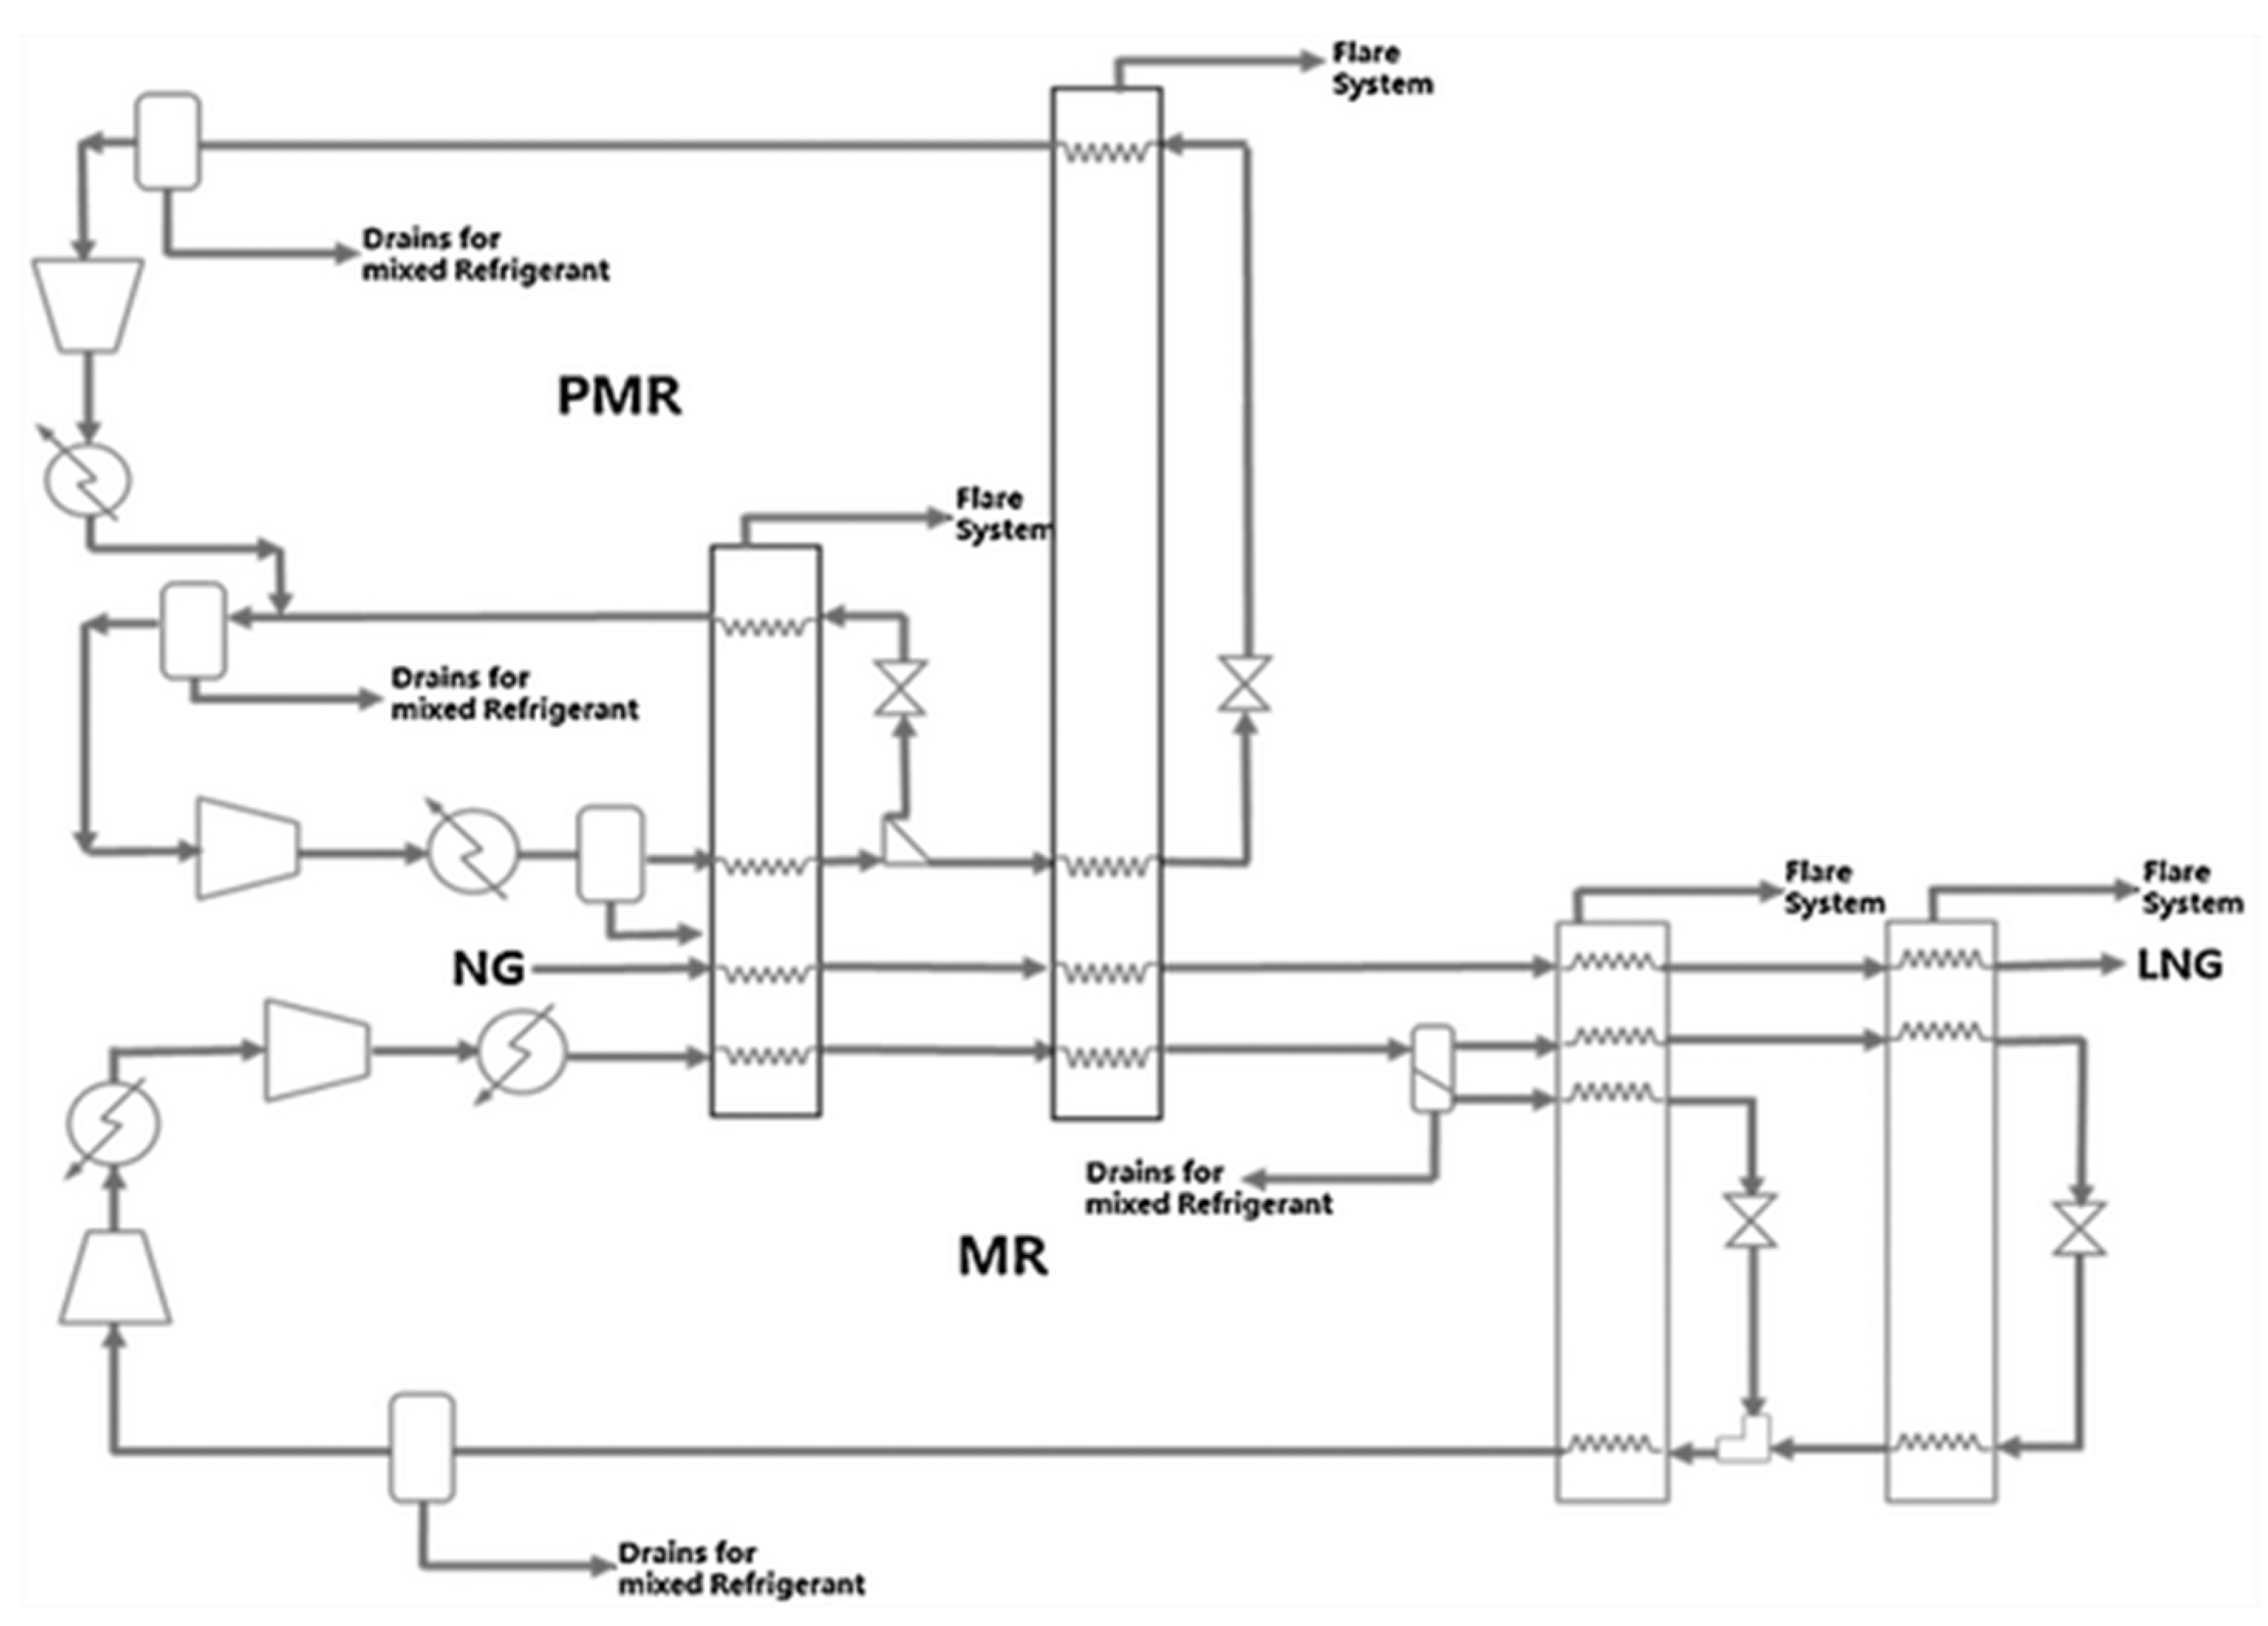
Figure 40.
Single Pressure DMR Precooler with Liquid Pump-around [161]. Reproduced with permission from Elsevier (license number 5413520454256).
Figure 40.
Single Pressure DMR Precooler with Liquid Pump-around [161]. Reproduced with permission from Elsevier (license number 5413520454256).

Figure 41.
Single Pressure DMR Precooler, no Liquid Pump-around [161]. Reproduced with permission from Elsevier (license number 5413520454256).
Figure 41.
Single Pressure DMR Precooler, no Liquid Pump-around [161]. Reproduced with permission from Elsevier (license number 5413520454256).

Figure 42.
Two Pressure DMR Precooler [161]. Reproduced with permission from Elsevier (license number 5413520454256).
Figure 42.
Two Pressure DMR Precooler [161]. Reproduced with permission from Elsevier (license number 5413520454256).
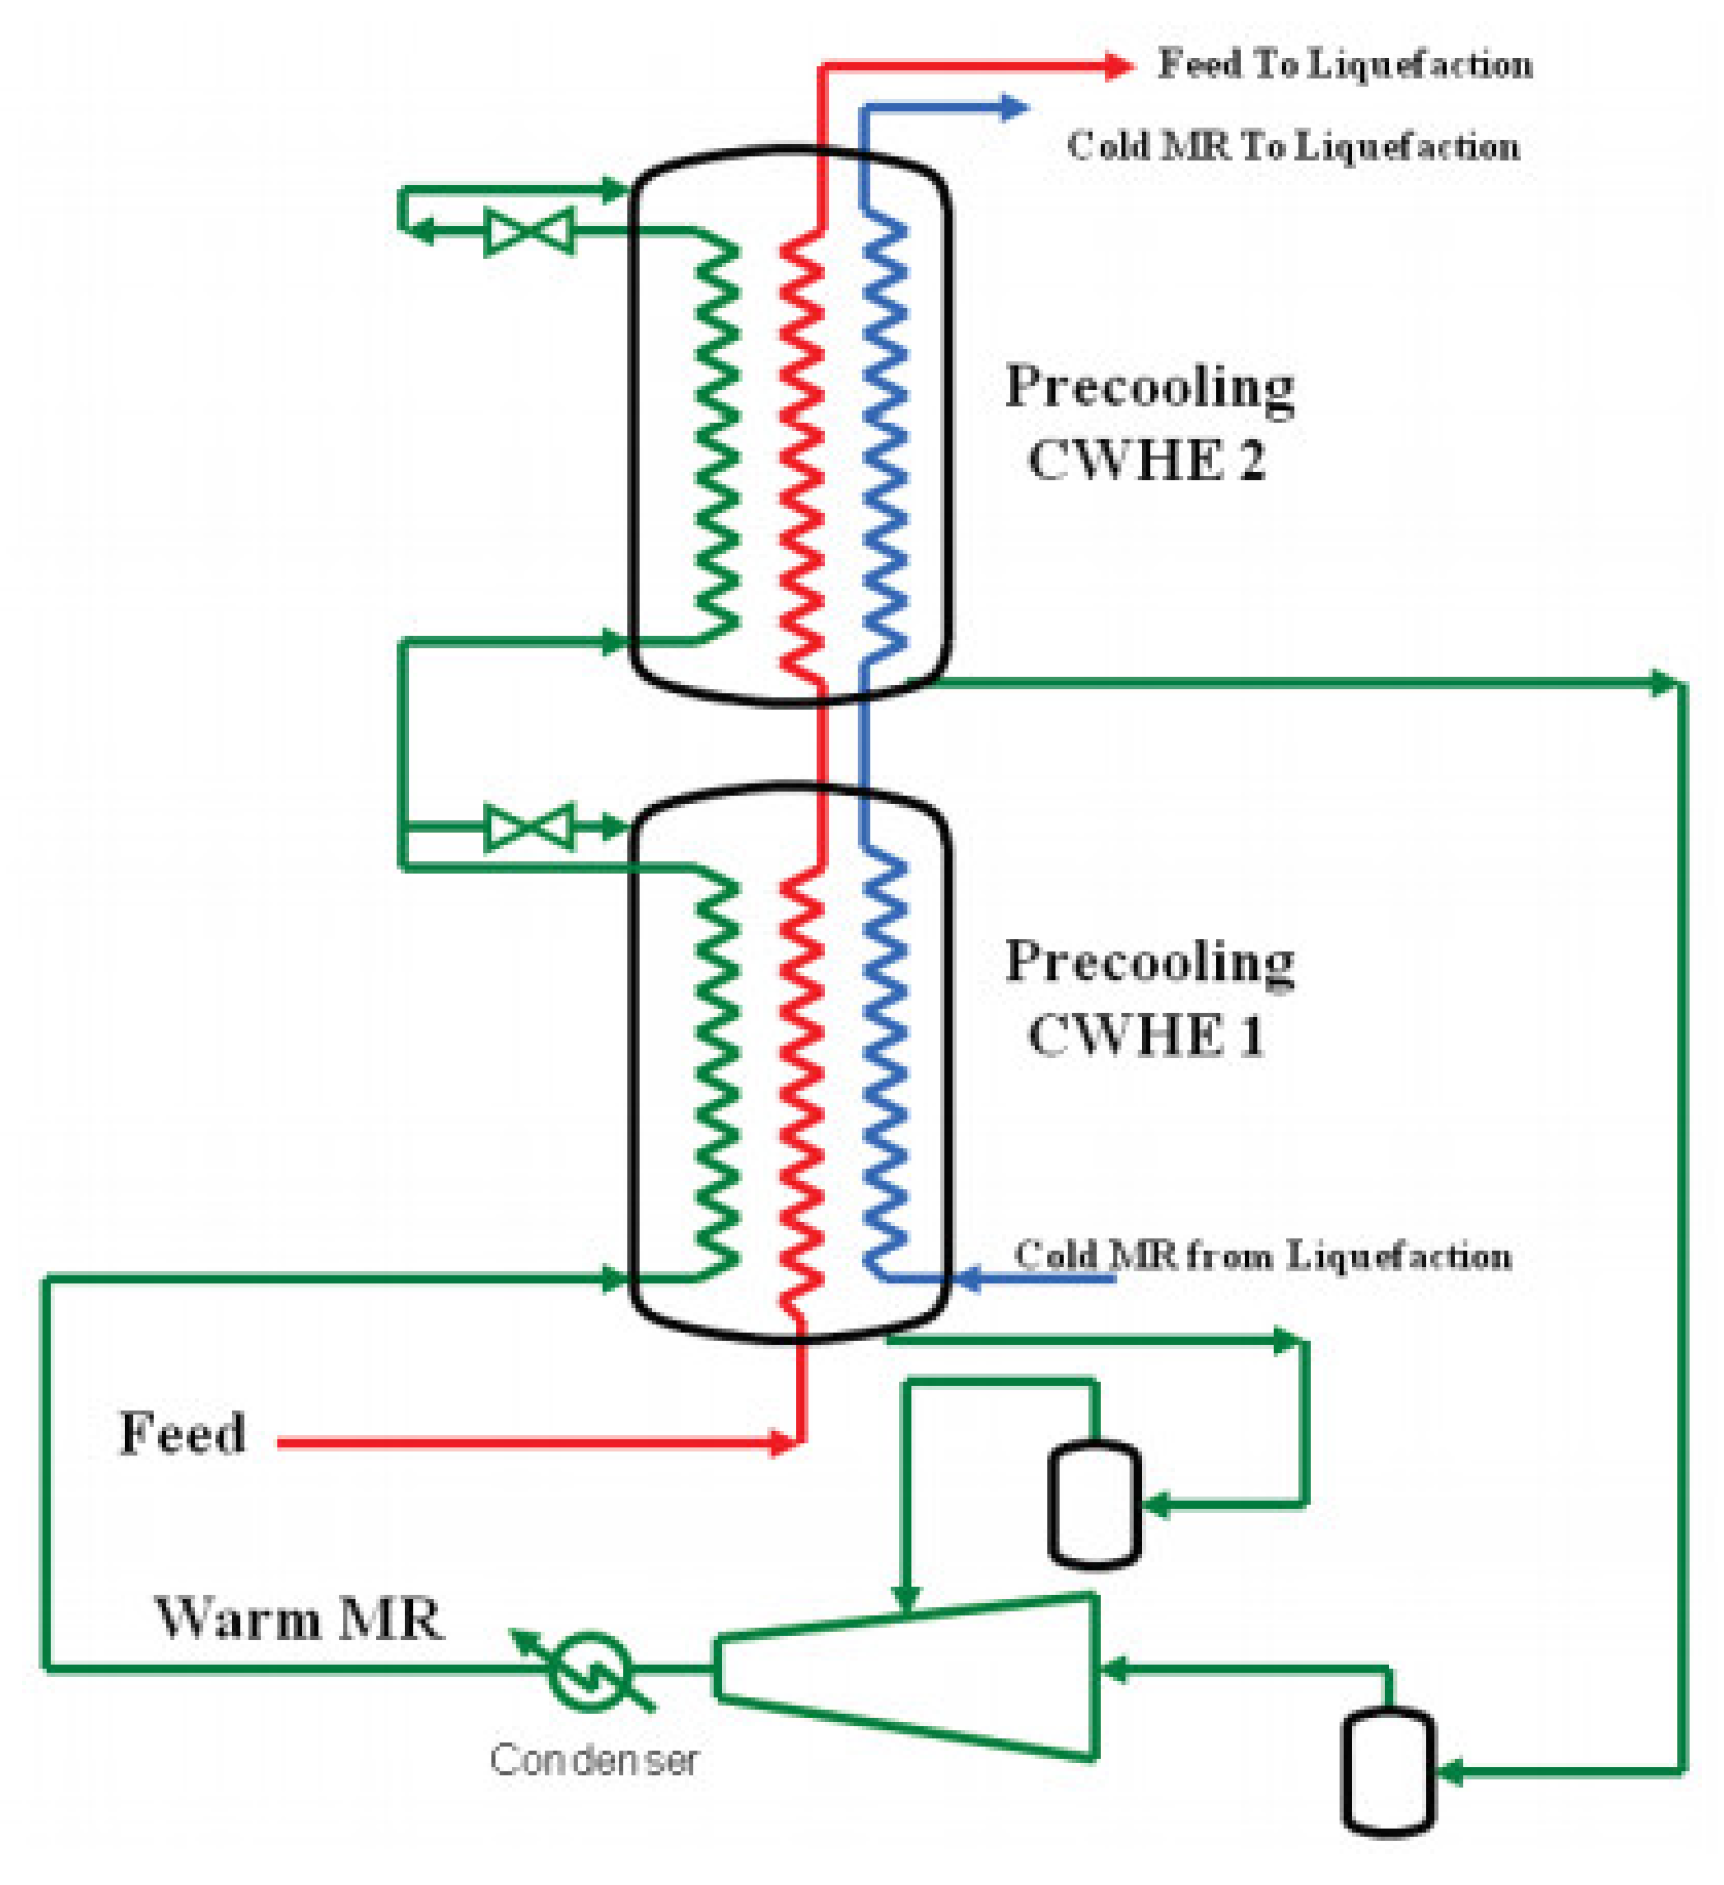
Figure 43.
Process flow diagram for co-production of LNG and NGL: (a) Process flow diagram of the DMR configuration; (b) Process flow diagram of the C3-MR process [48]. Reprinted (adapted) with permission from {Mehrpooya, M.; Hossieni, M.; Vatani, A. Novel LNG-Based Integrated Process Configuration Alternatives for Coproduction of LNG and NGL. Ind. Eng. Chem. Res. 2014, 53, 17705–17721. https://doi.org/10.1021/ie502370p.}. Copyright {2014} American Chemical Society.
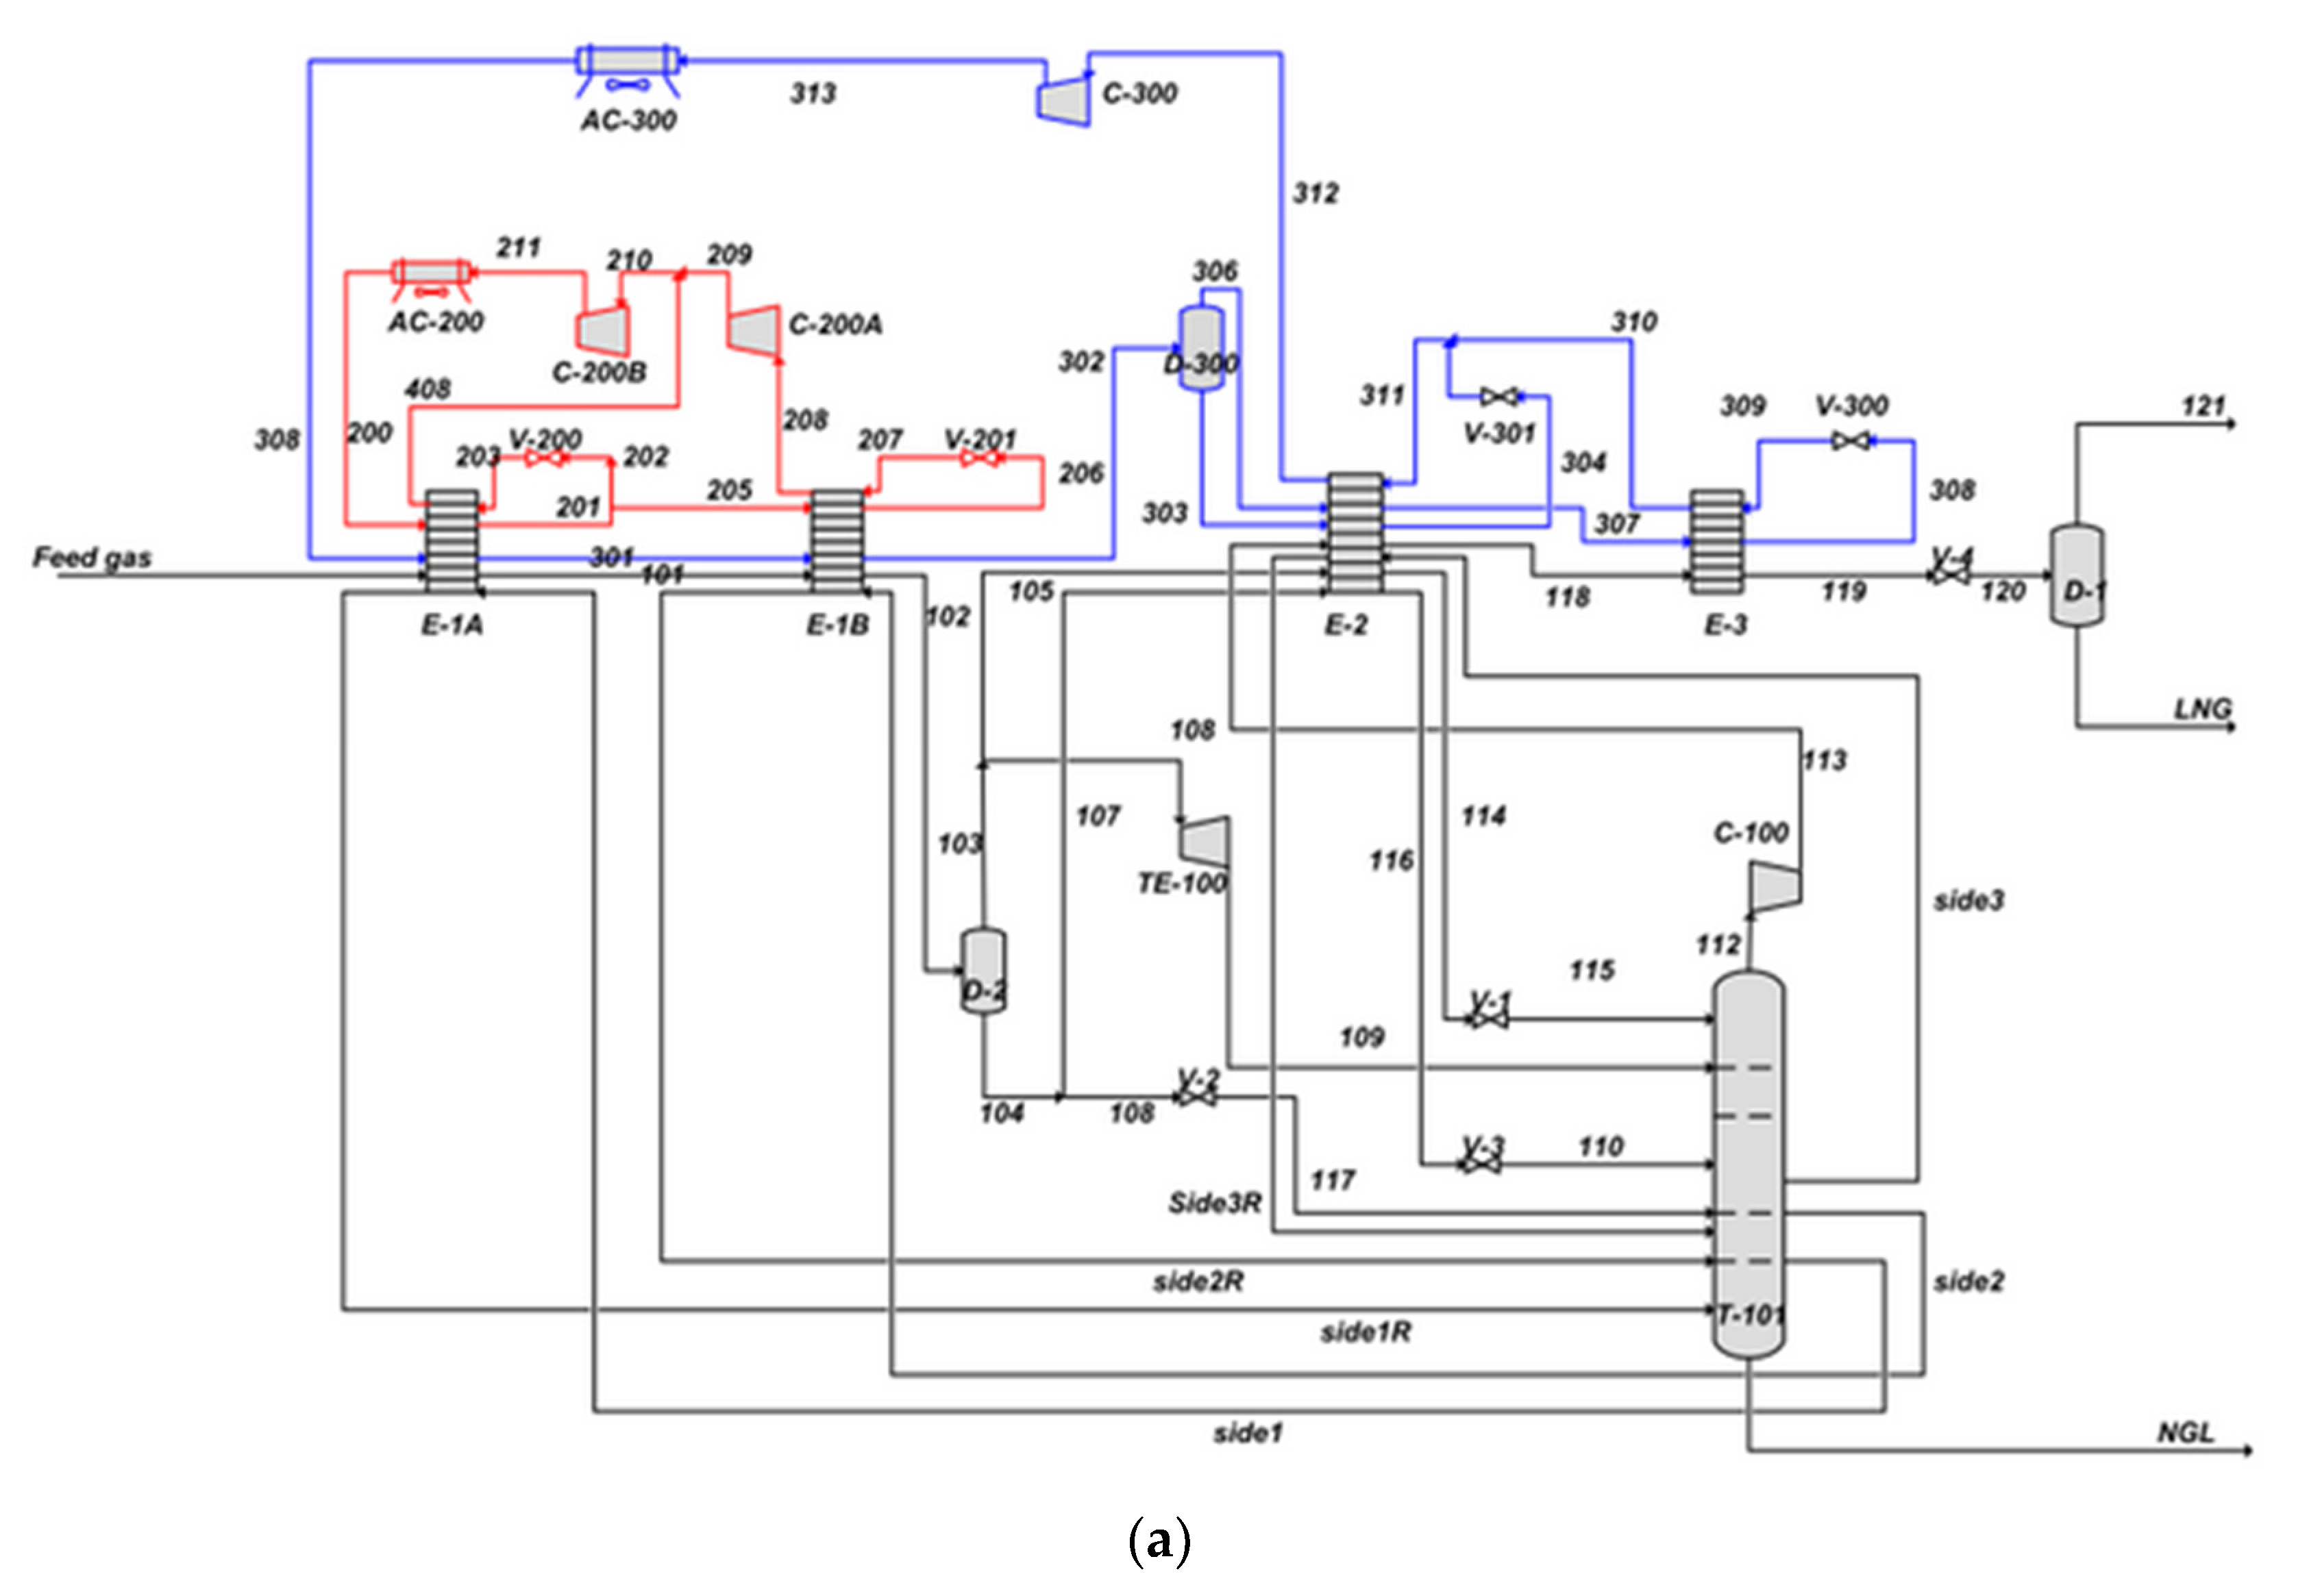

Figure 44.
Flow diagram of SMR natural gas liquefaction process integrated with ethane separation: (a) process 1; (b) process 2 [174]. Reproduced with permission from International Journal of Refrigeration.
Figure 44.
Flow diagram of SMR natural gas liquefaction process integrated with ethane separation: (a) process 1; (b) process 2 [174]. Reproduced with permission from International Journal of Refrigeration.
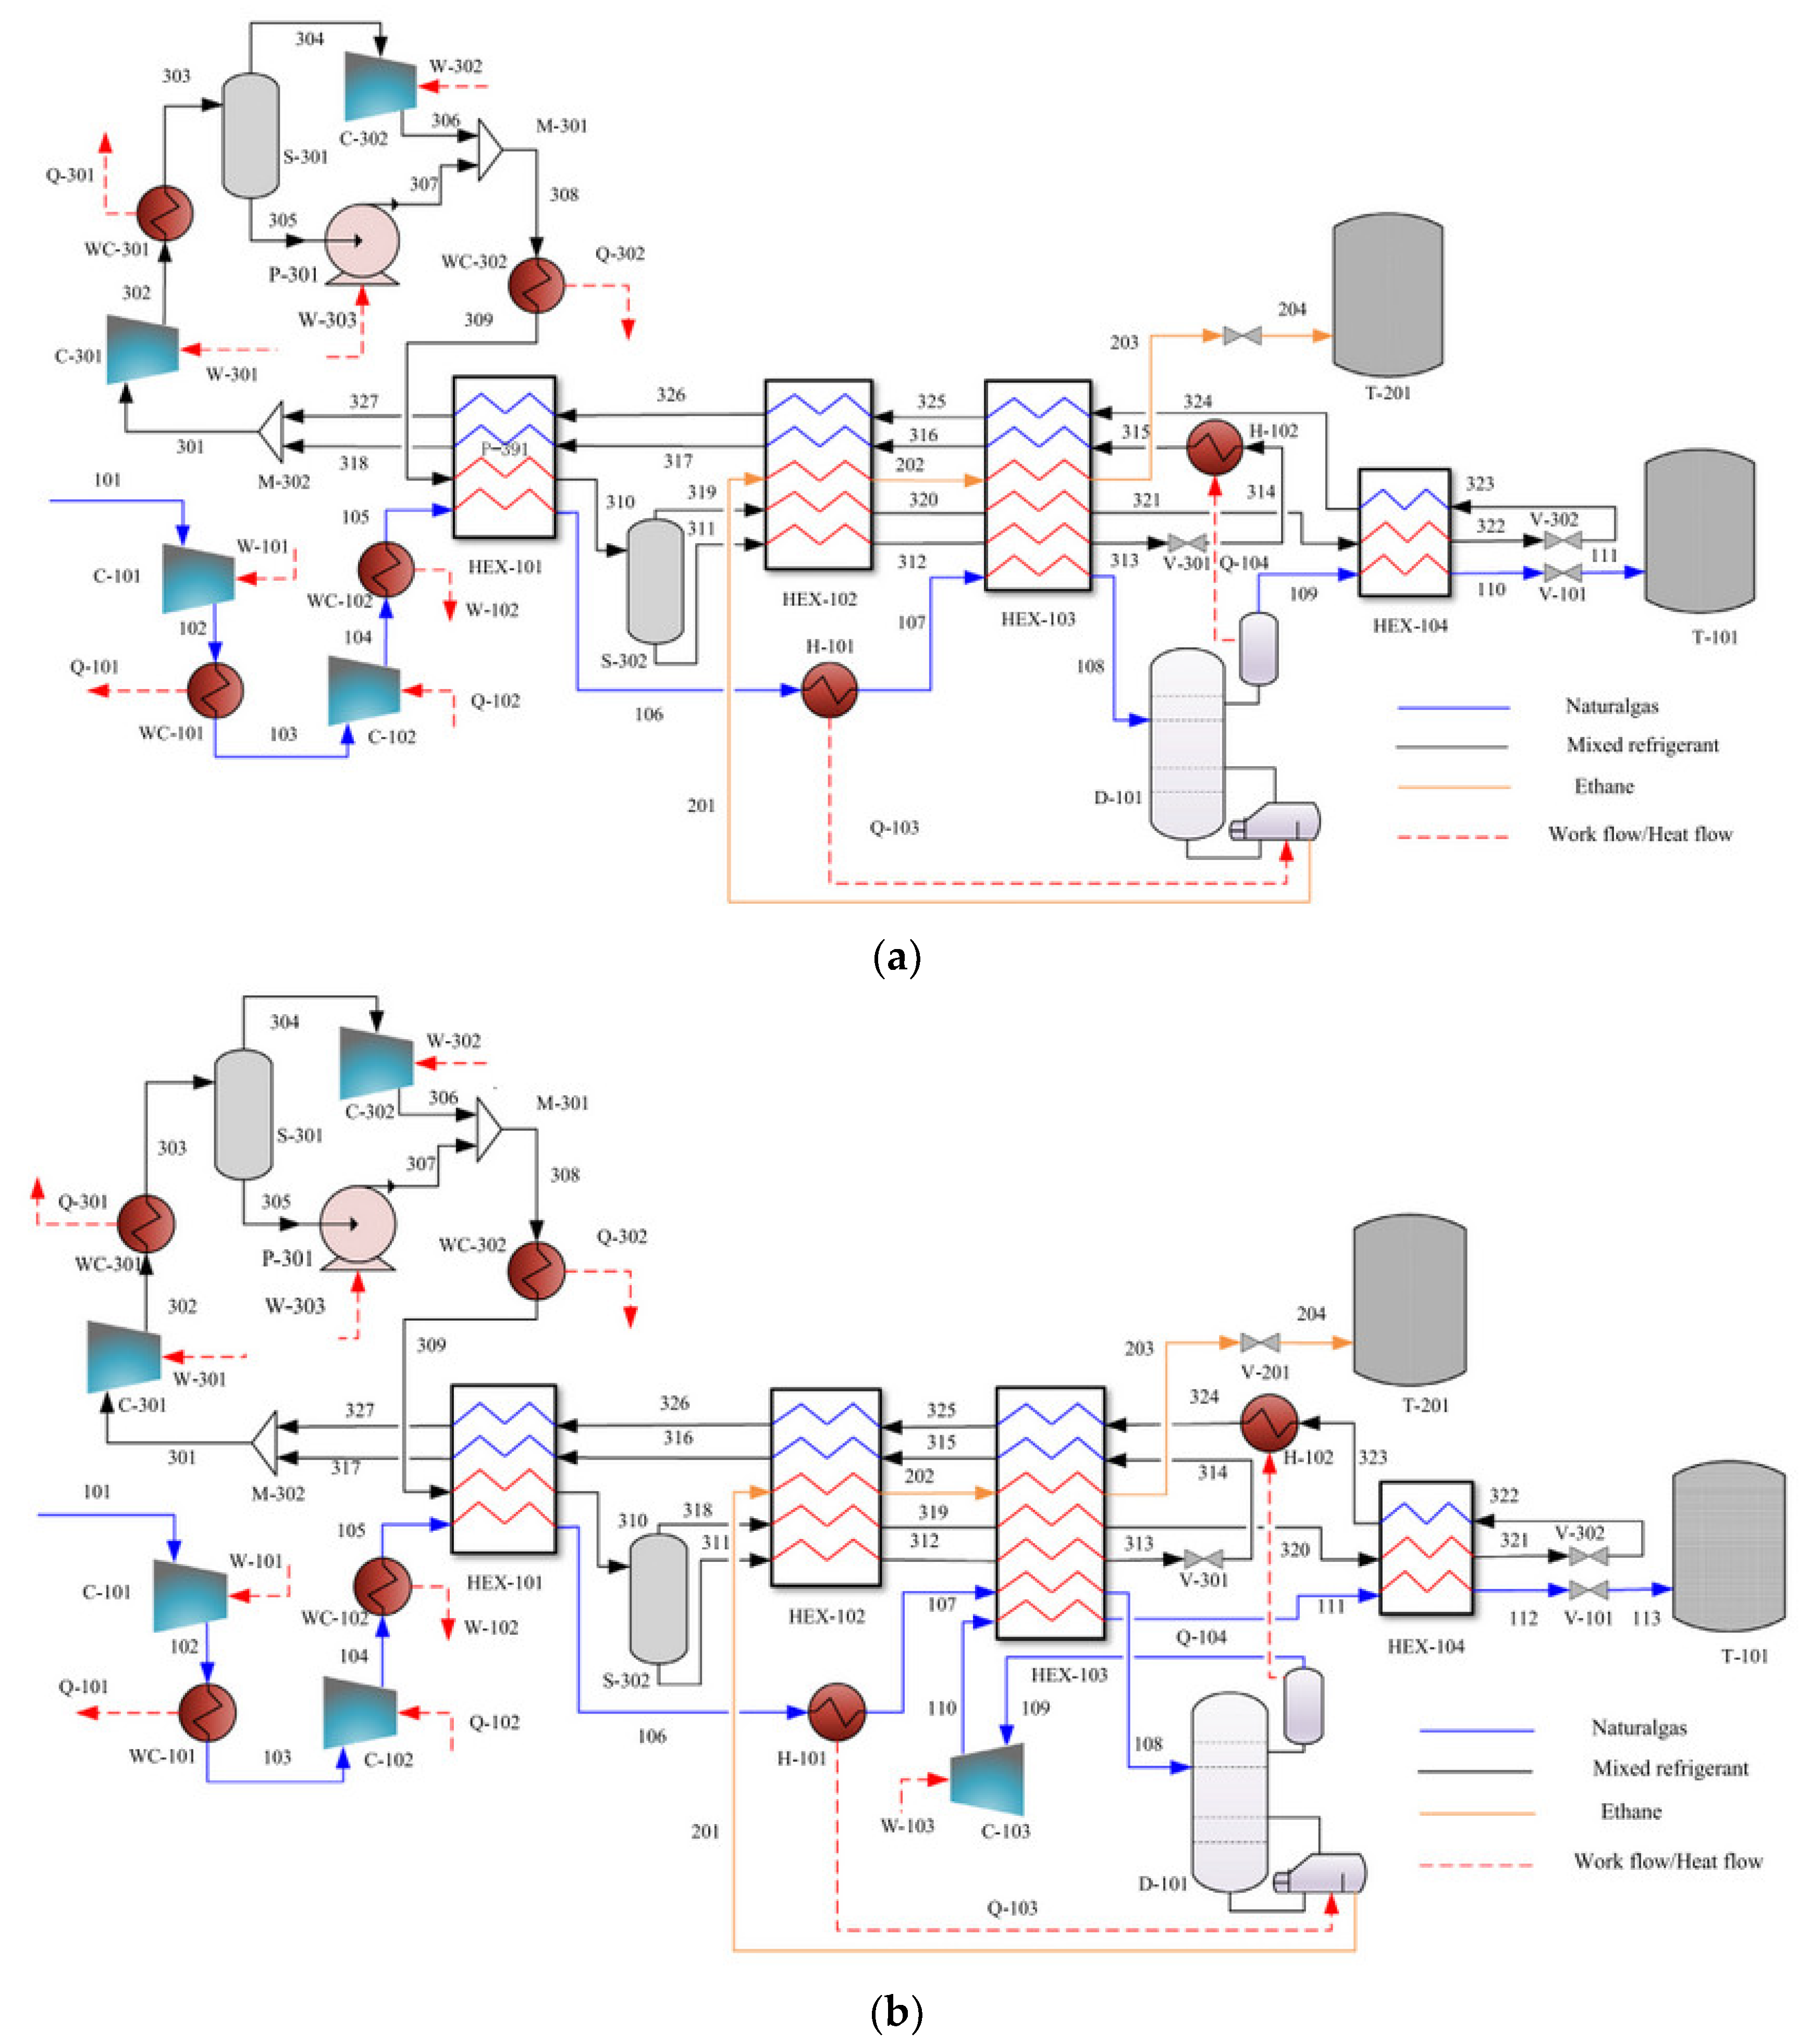
Figure 45.
Simplified Process 1 for FLNG [174]. Reproduced with permission from International Journal of Refrigeration.
Figure 45.
Simplified Process 1 for FLNG [174]. Reproduced with permission from International Journal of Refrigeration.
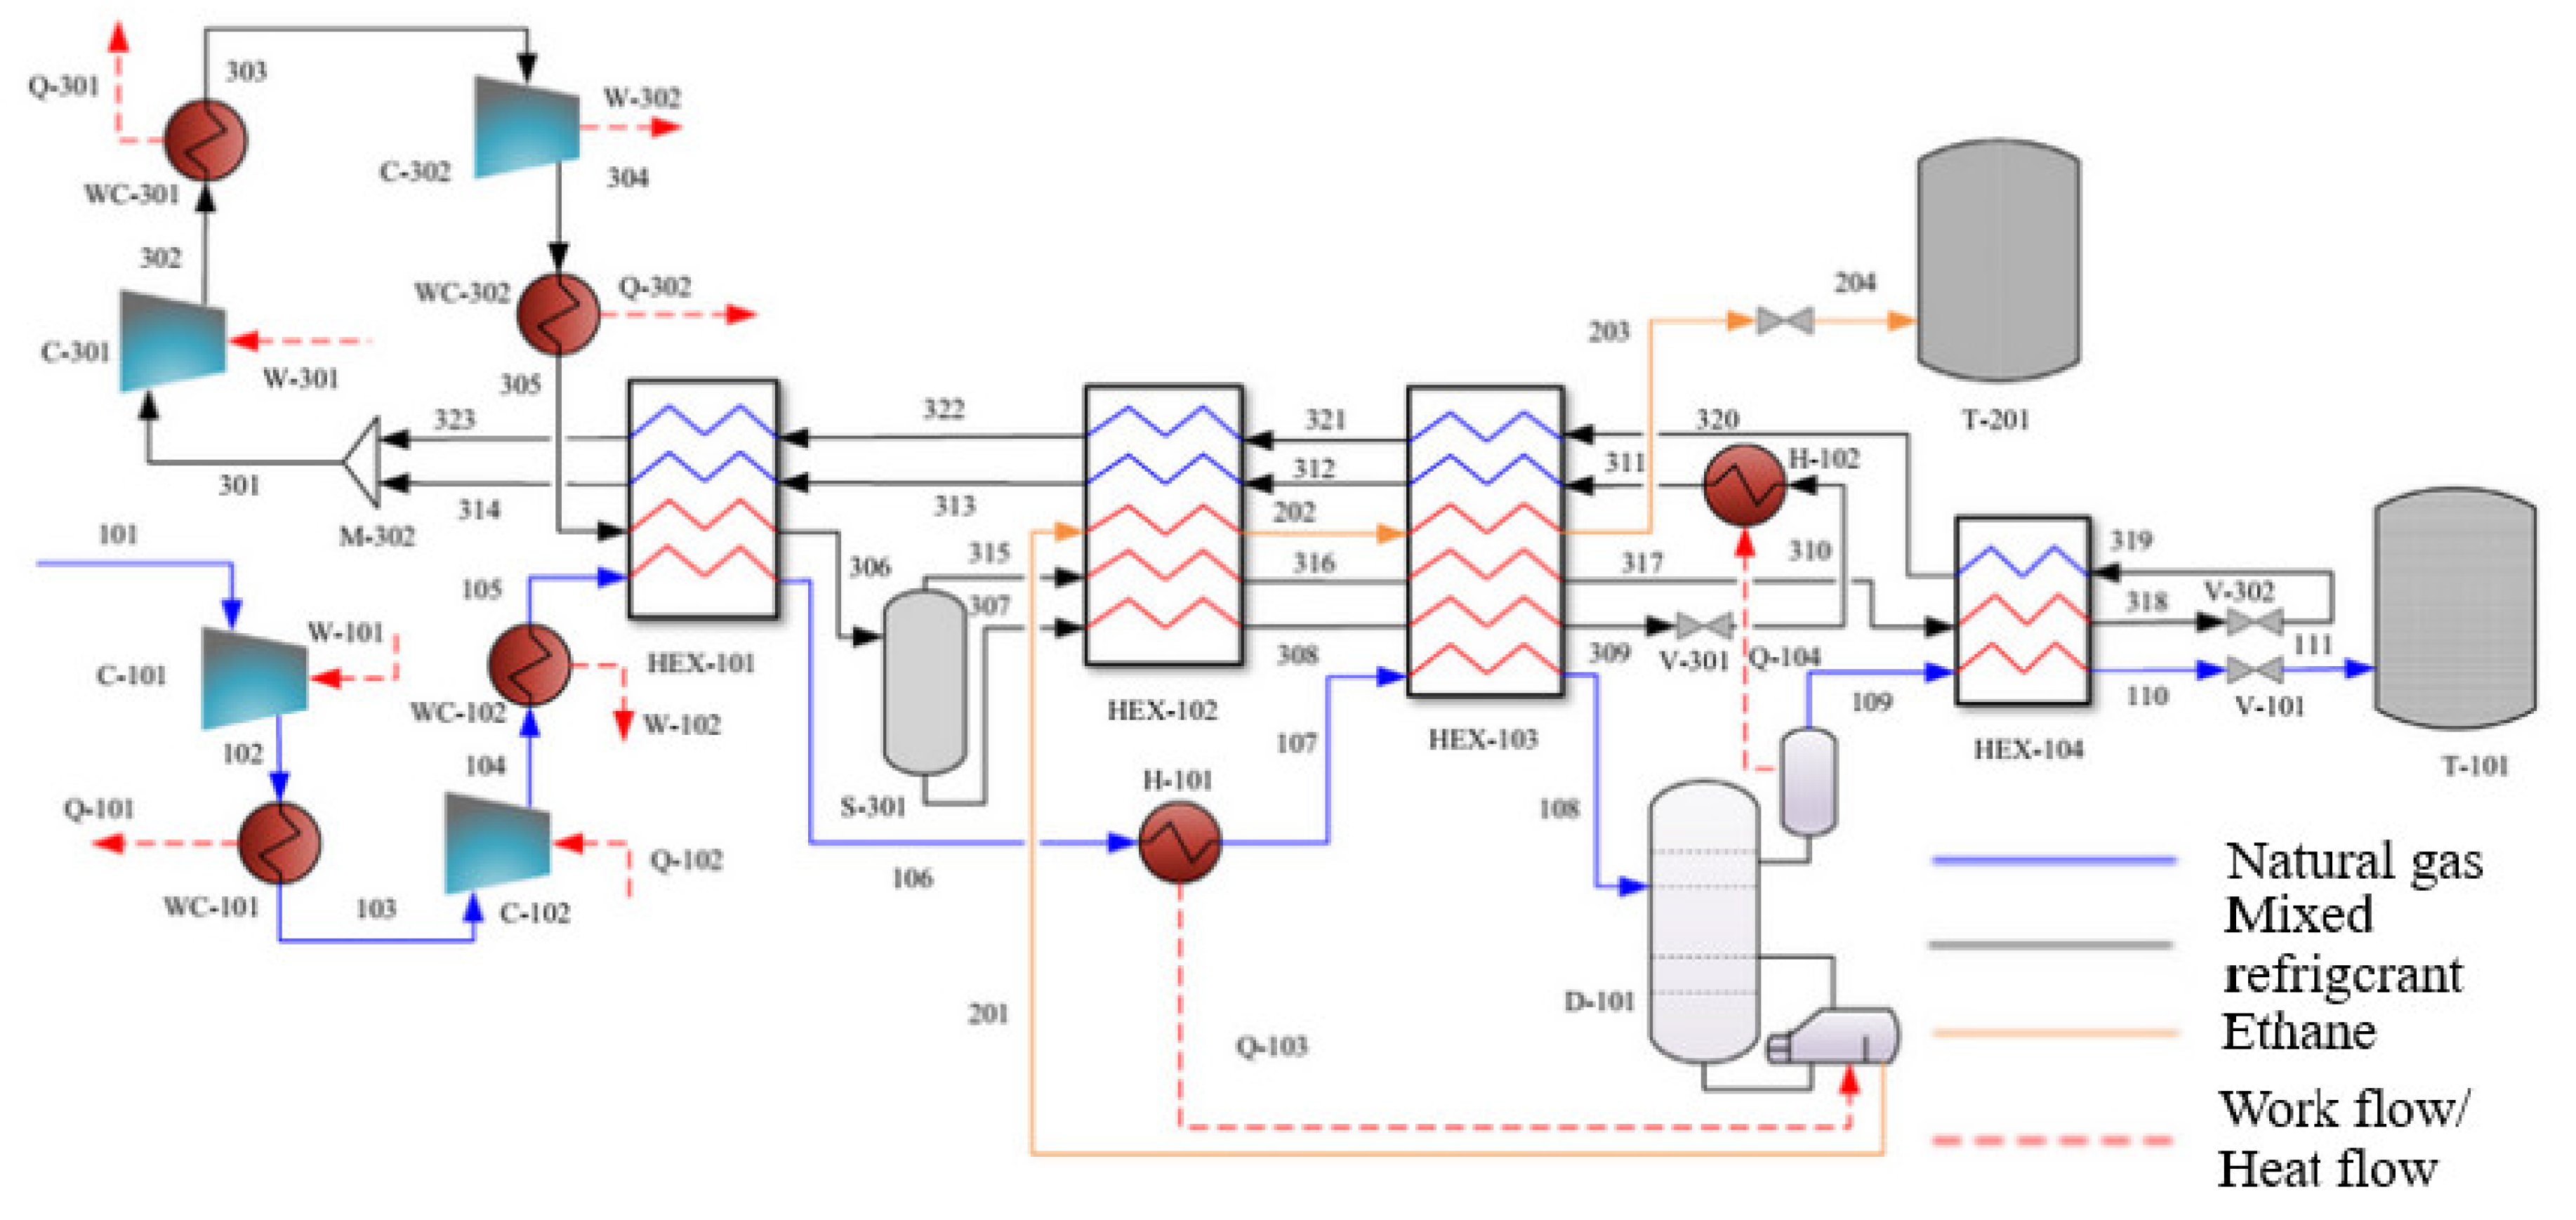
Figure 46.
Temperature profile in single refrigerant heat exchangers (left) and in a mixed refrigerant heat exchanger with 1 K pinch temperature (right) [175]. Reproduced with permission from Elsevier (license number 5413491323174).
Figure 46.
Temperature profile in single refrigerant heat exchangers (left) and in a mixed refrigerant heat exchanger with 1 K pinch temperature (right) [175]. Reproduced with permission from Elsevier (license number 5413491323174).

Figure 47.
Composite curves of (a) conventional mixed refrigerant; (b) with the addition of n-butane [188]. Reproduced with permission from Elsevier (license number 5413490829701).
Figure 47.
Composite curves of (a) conventional mixed refrigerant; (b) with the addition of n-butane [188]. Reproduced with permission from Elsevier (license number 5413490829701).

Figure 48.
CO2 solubility in liquid methane [193]. Reprinted (adapted) with permission from {Shen, T.; Gao, T.; Lin, W.; Gu, A. Determination of CO2 Solubility in Saturated Liquid CH4 + N2 and CH4 + C2H6 Mixtures above Atmospheric Pressure. J. Chem. Eng. Data 2012, 57, 2296–2303. https://doi.org/10.1021/je3002859.}. Copyright {2012} American Chemical Society.
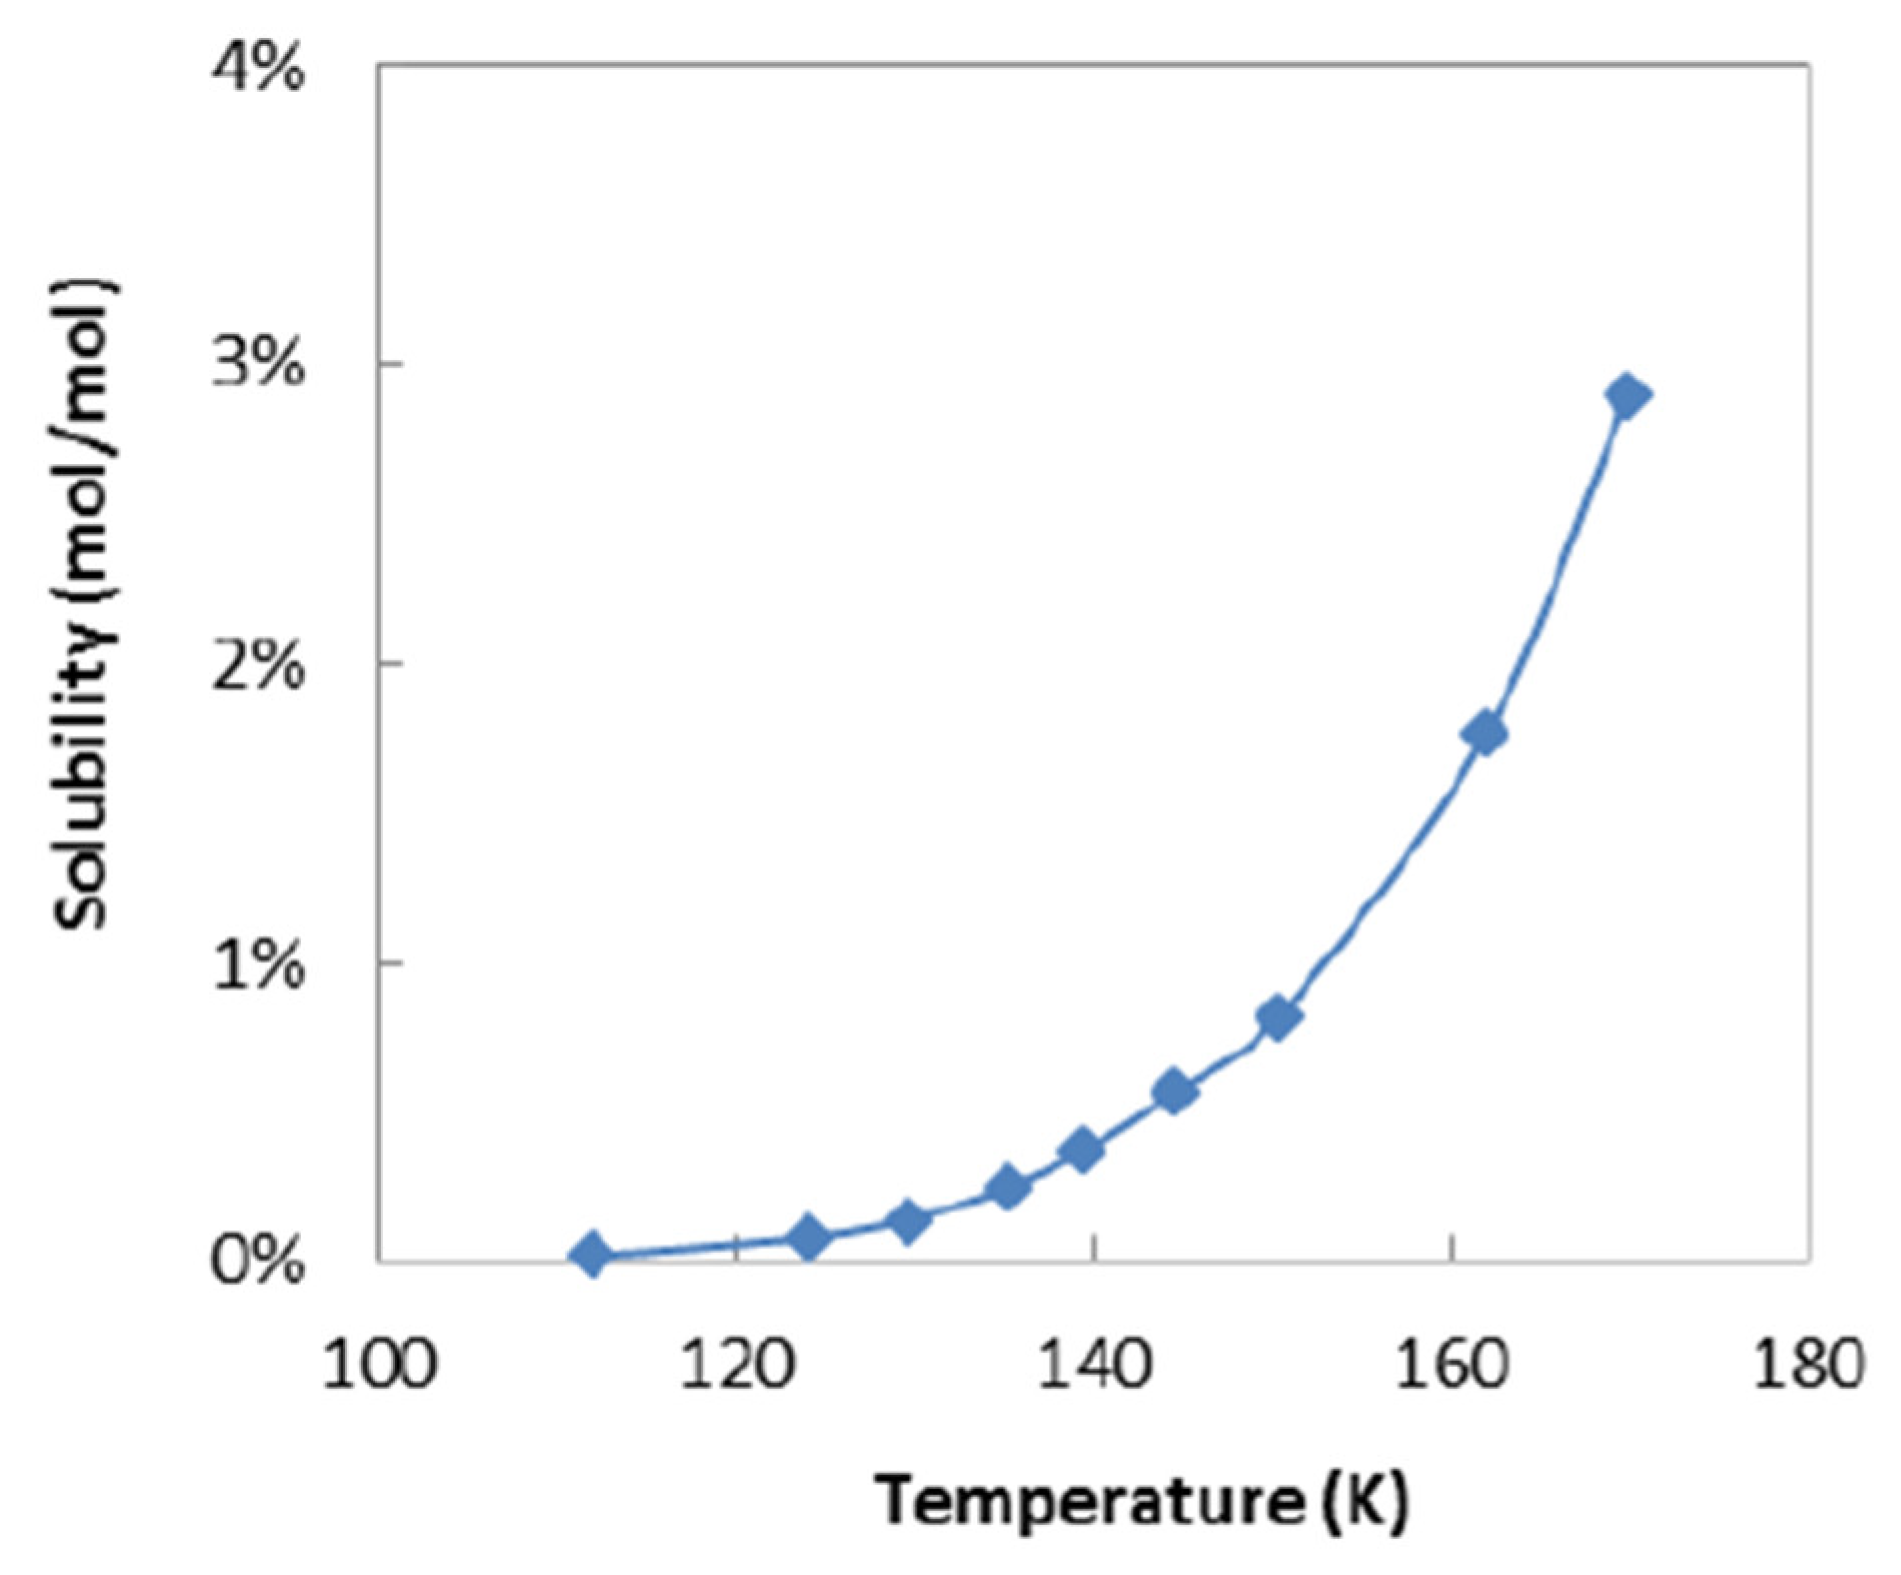
Figure 49.
Cascade PLNG process [191]. Reproduced with permission from Elsevier (license number 5413490278538).
Figure 49.
Cascade PLNG process [191]. Reproduced with permission from Elsevier (license number 5413490278538).
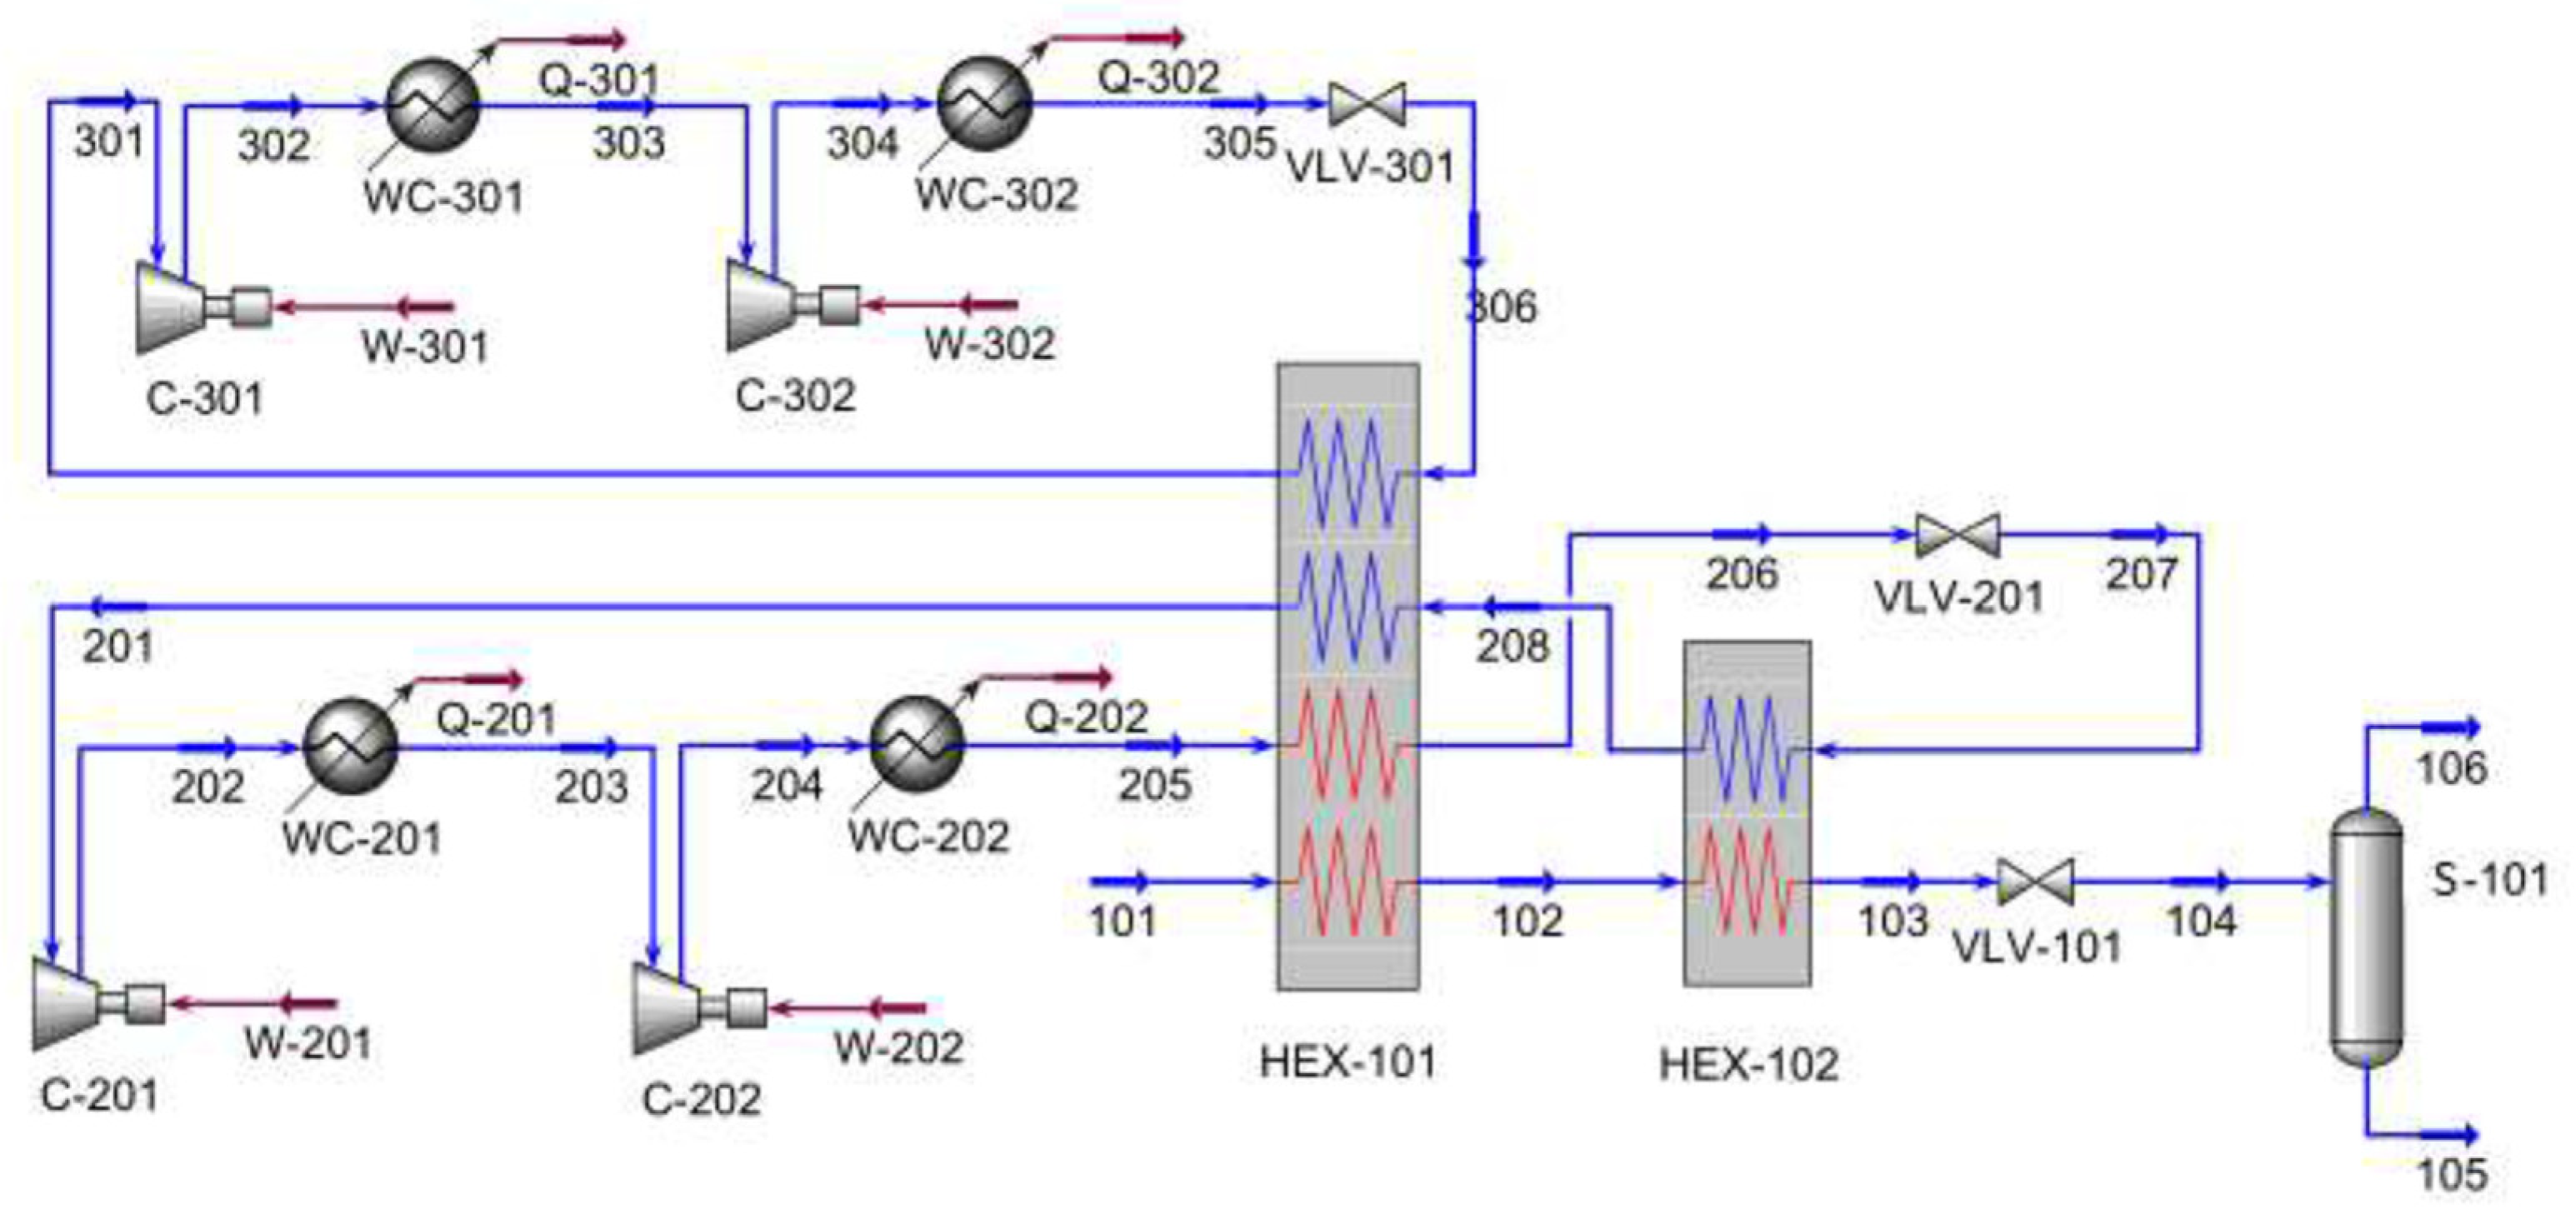
Figure 50.
SMR PLNG process [191]. Reproduced with permission from Elsevier (license number 5413490278538).
Figure 50.
SMR PLNG process [191]. Reproduced with permission from Elsevier (license number 5413490278538).
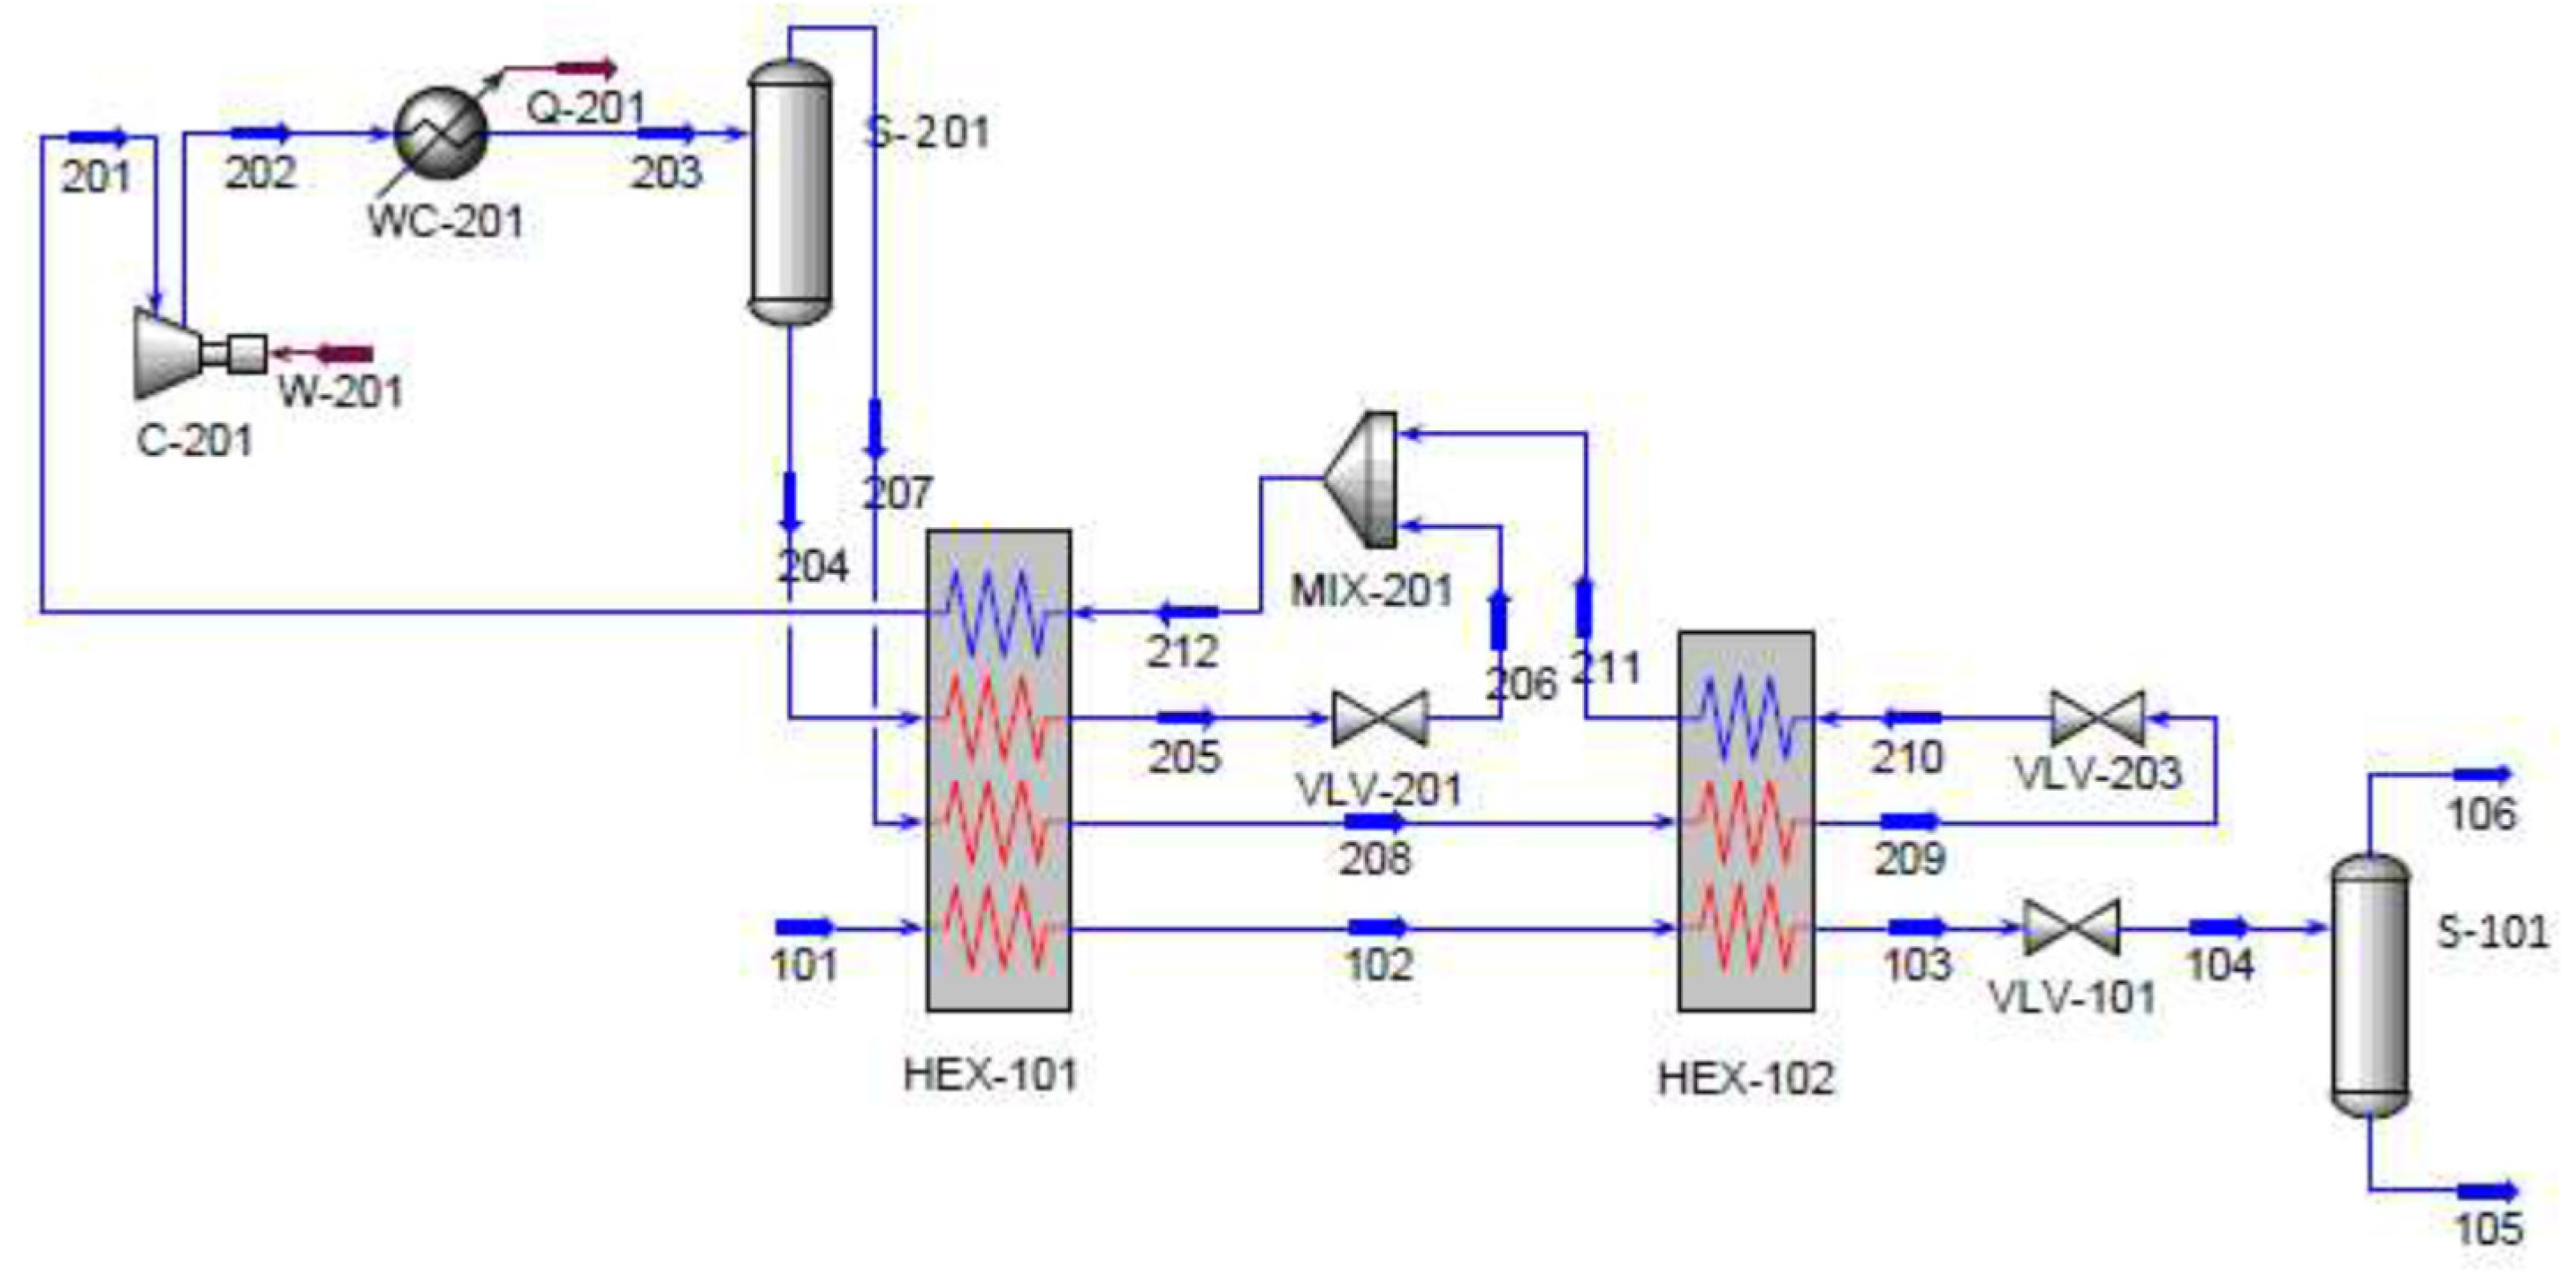
Figure 51.
Single expander PLNG process [191]. Reproduced with permission from Elsevier (license number 5413490278538).
Figure 51.
Single expander PLNG process [191]. Reproduced with permission from Elsevier (license number 5413490278538).

Figure 52.
Phase diagram of CH4-CO2 binary system at different CO2 contents [203]. Reprinted (adapted) with permission from {Zhang, L.; Burgass, R.; Chapoy, A.; Tohidi, B.; Solbraa, E. Measurement and Modeling of CO2 Frost Points in the CO2–Methane Systems. J. Chem. Eng. Data 2011, 56, 2971–2975. https://doi.org/10.1021/je200261a.}. Copyright {2011} American Chemical Society.
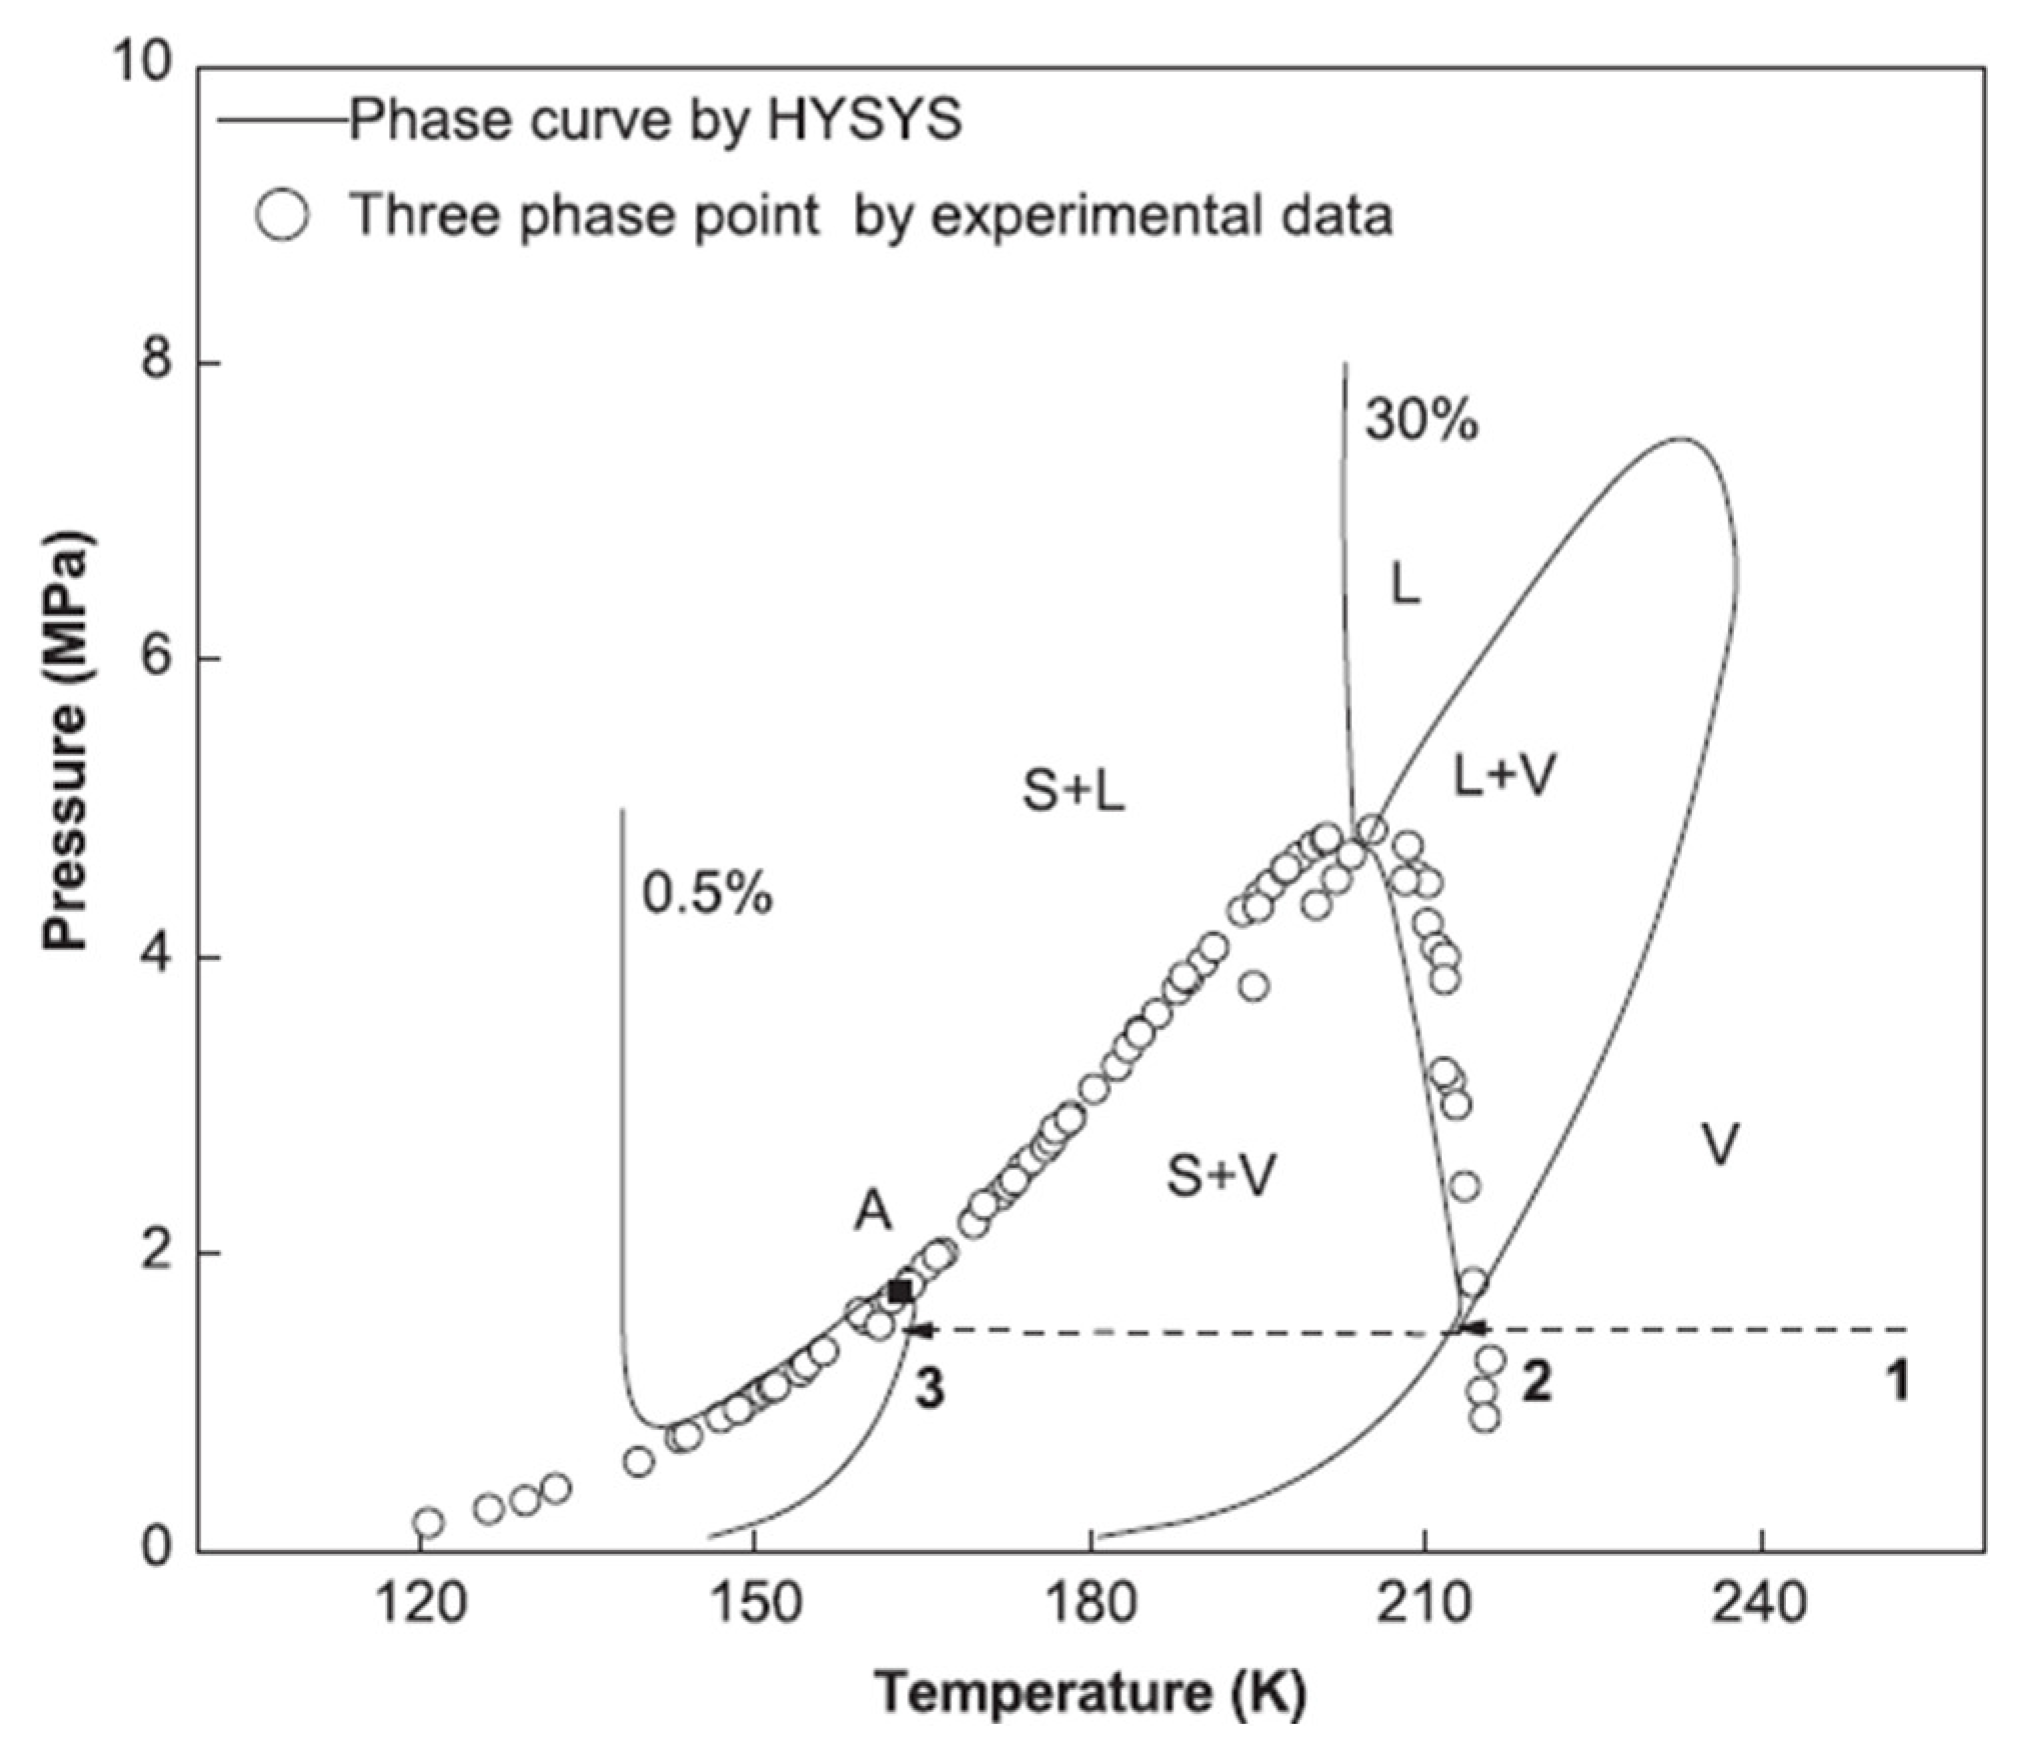
Figure 53.
CH4-C2H6 PLNG process with CO2 cryogenic removal [207]. Reproduced with permission from Elsevier (license number 5413471341623).
Figure 53.
CH4-C2H6 PLNG process with CO2 cryogenic removal [207]. Reproduced with permission from Elsevier (license number 5413471341623).
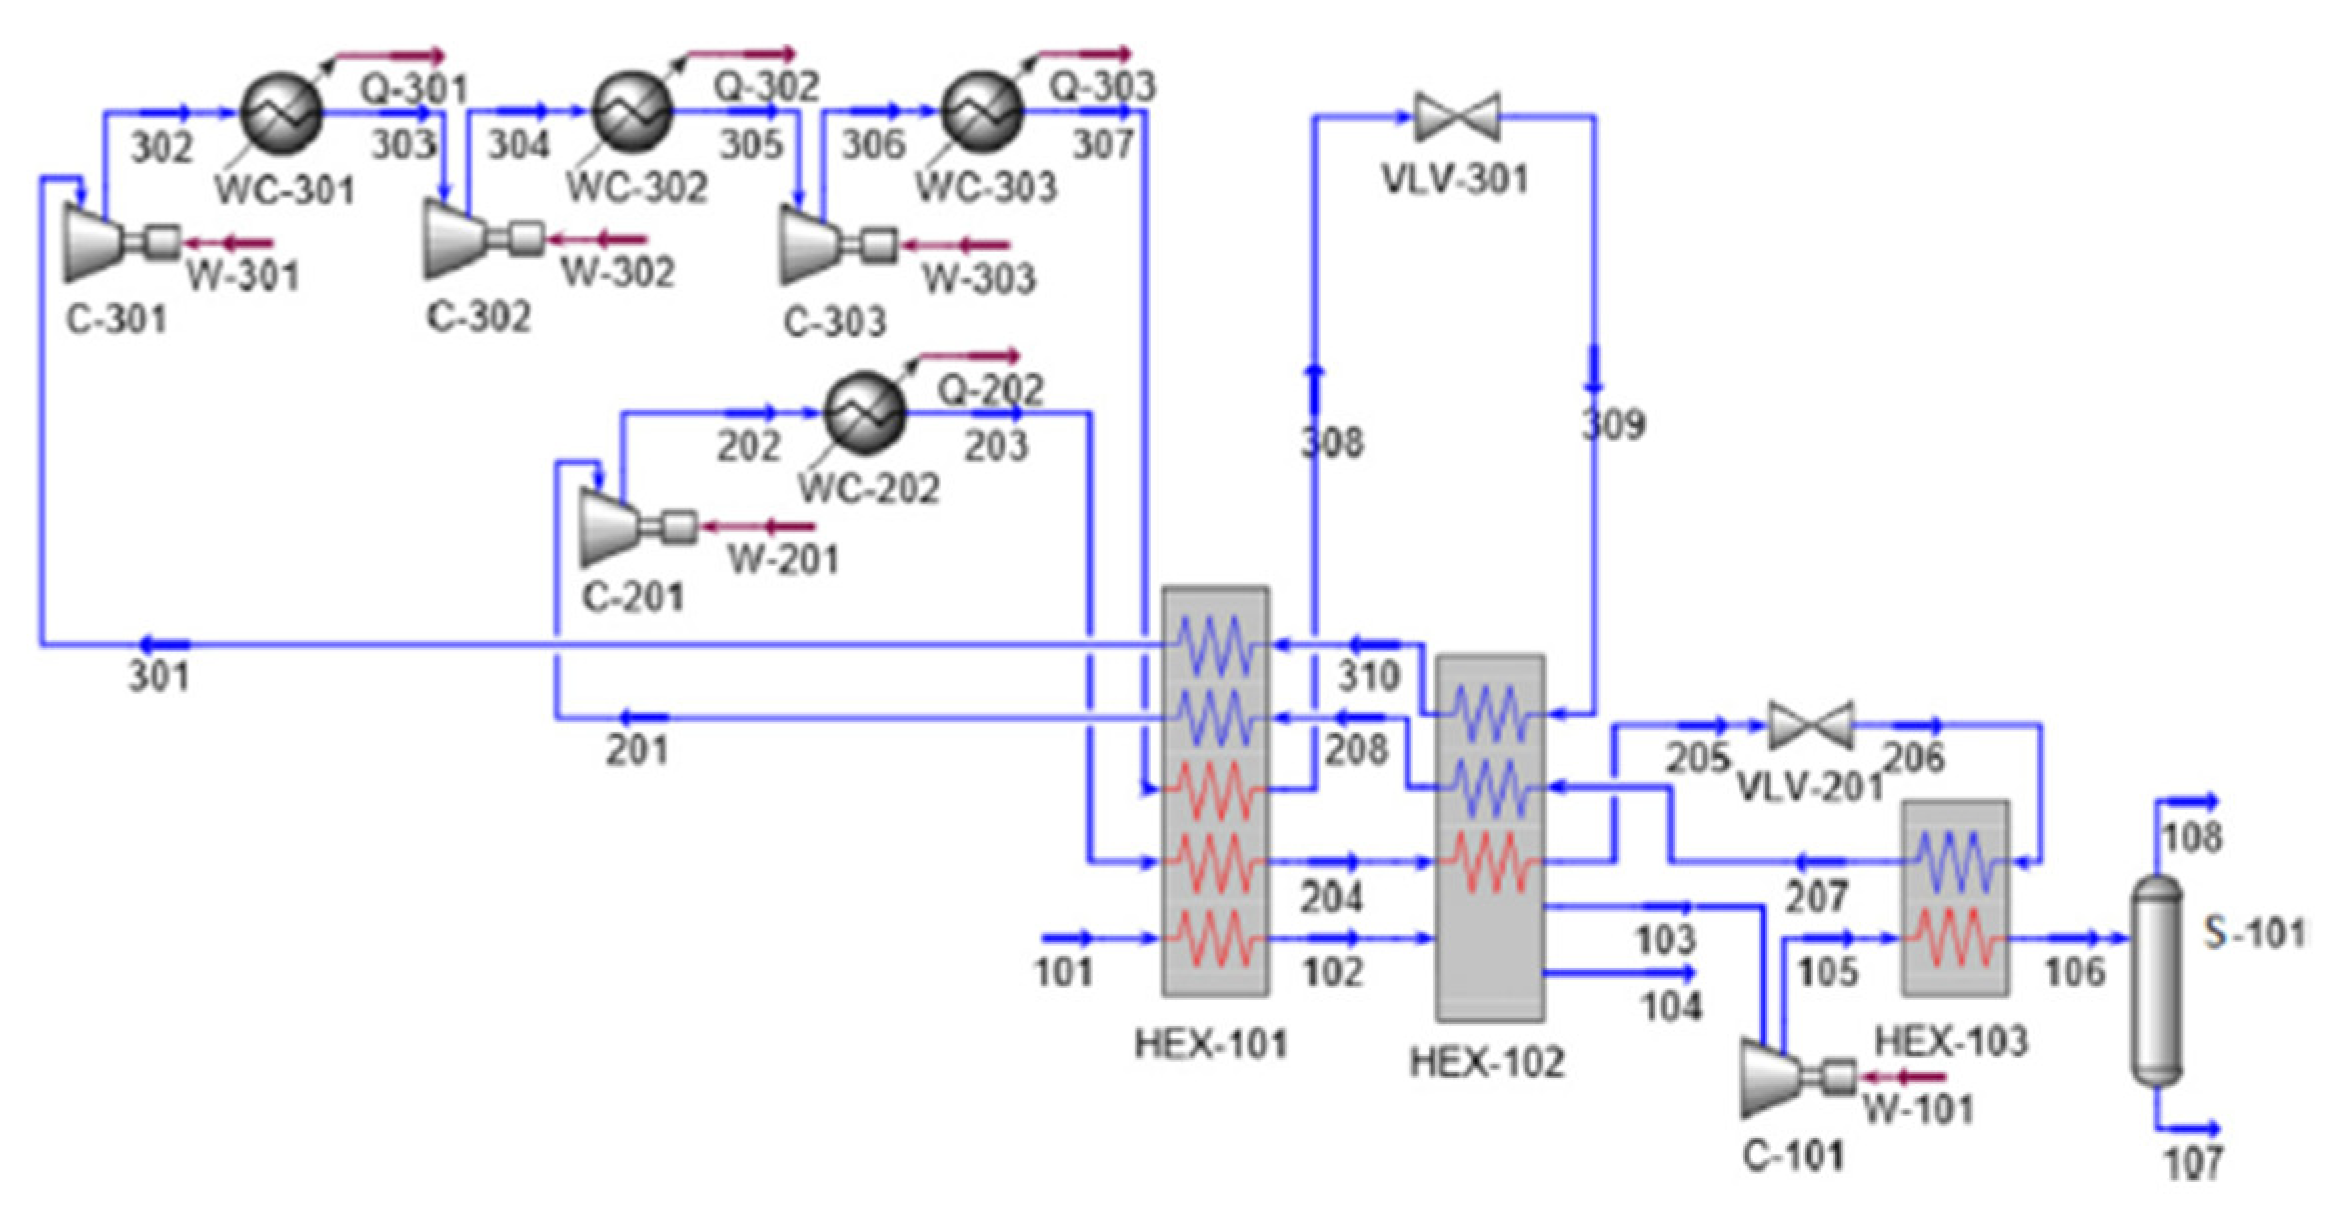
Figure 54.
CH4-C2H4 PLNG process with CO2 cryogenic removal [207]. Reproduced with permission from Elsevier (license number 5413471341623).
Figure 54.
CH4-C2H4 PLNG process with CO2 cryogenic removal [207]. Reproduced with permission from Elsevier (license number 5413471341623).

Figure 55.
C2H4-C3H8 PLNG process with CO2 cryogenic removal [207]. Reproduced with permission from Elsevier (license number 5413471341623).
Figure 55.
C2H4-C3H8 PLNG process with CO2 cryogenic removal [207]. Reproduced with permission from Elsevier (license number 5413471341623).

Figure 56.
The proposed process without precooling [208]. Reproduced with permission from Elsevier (license number 5413470366827).
Figure 56.
The proposed process without precooling [208]. Reproduced with permission from Elsevier (license number 5413470366827).

Figure 57.
The proposed process with precooling [208]. Reproduced with permission from Elsevier (license number 5413470366827).
Figure 57.
The proposed process with precooling [208]. Reproduced with permission from Elsevier (license number 5413470366827).
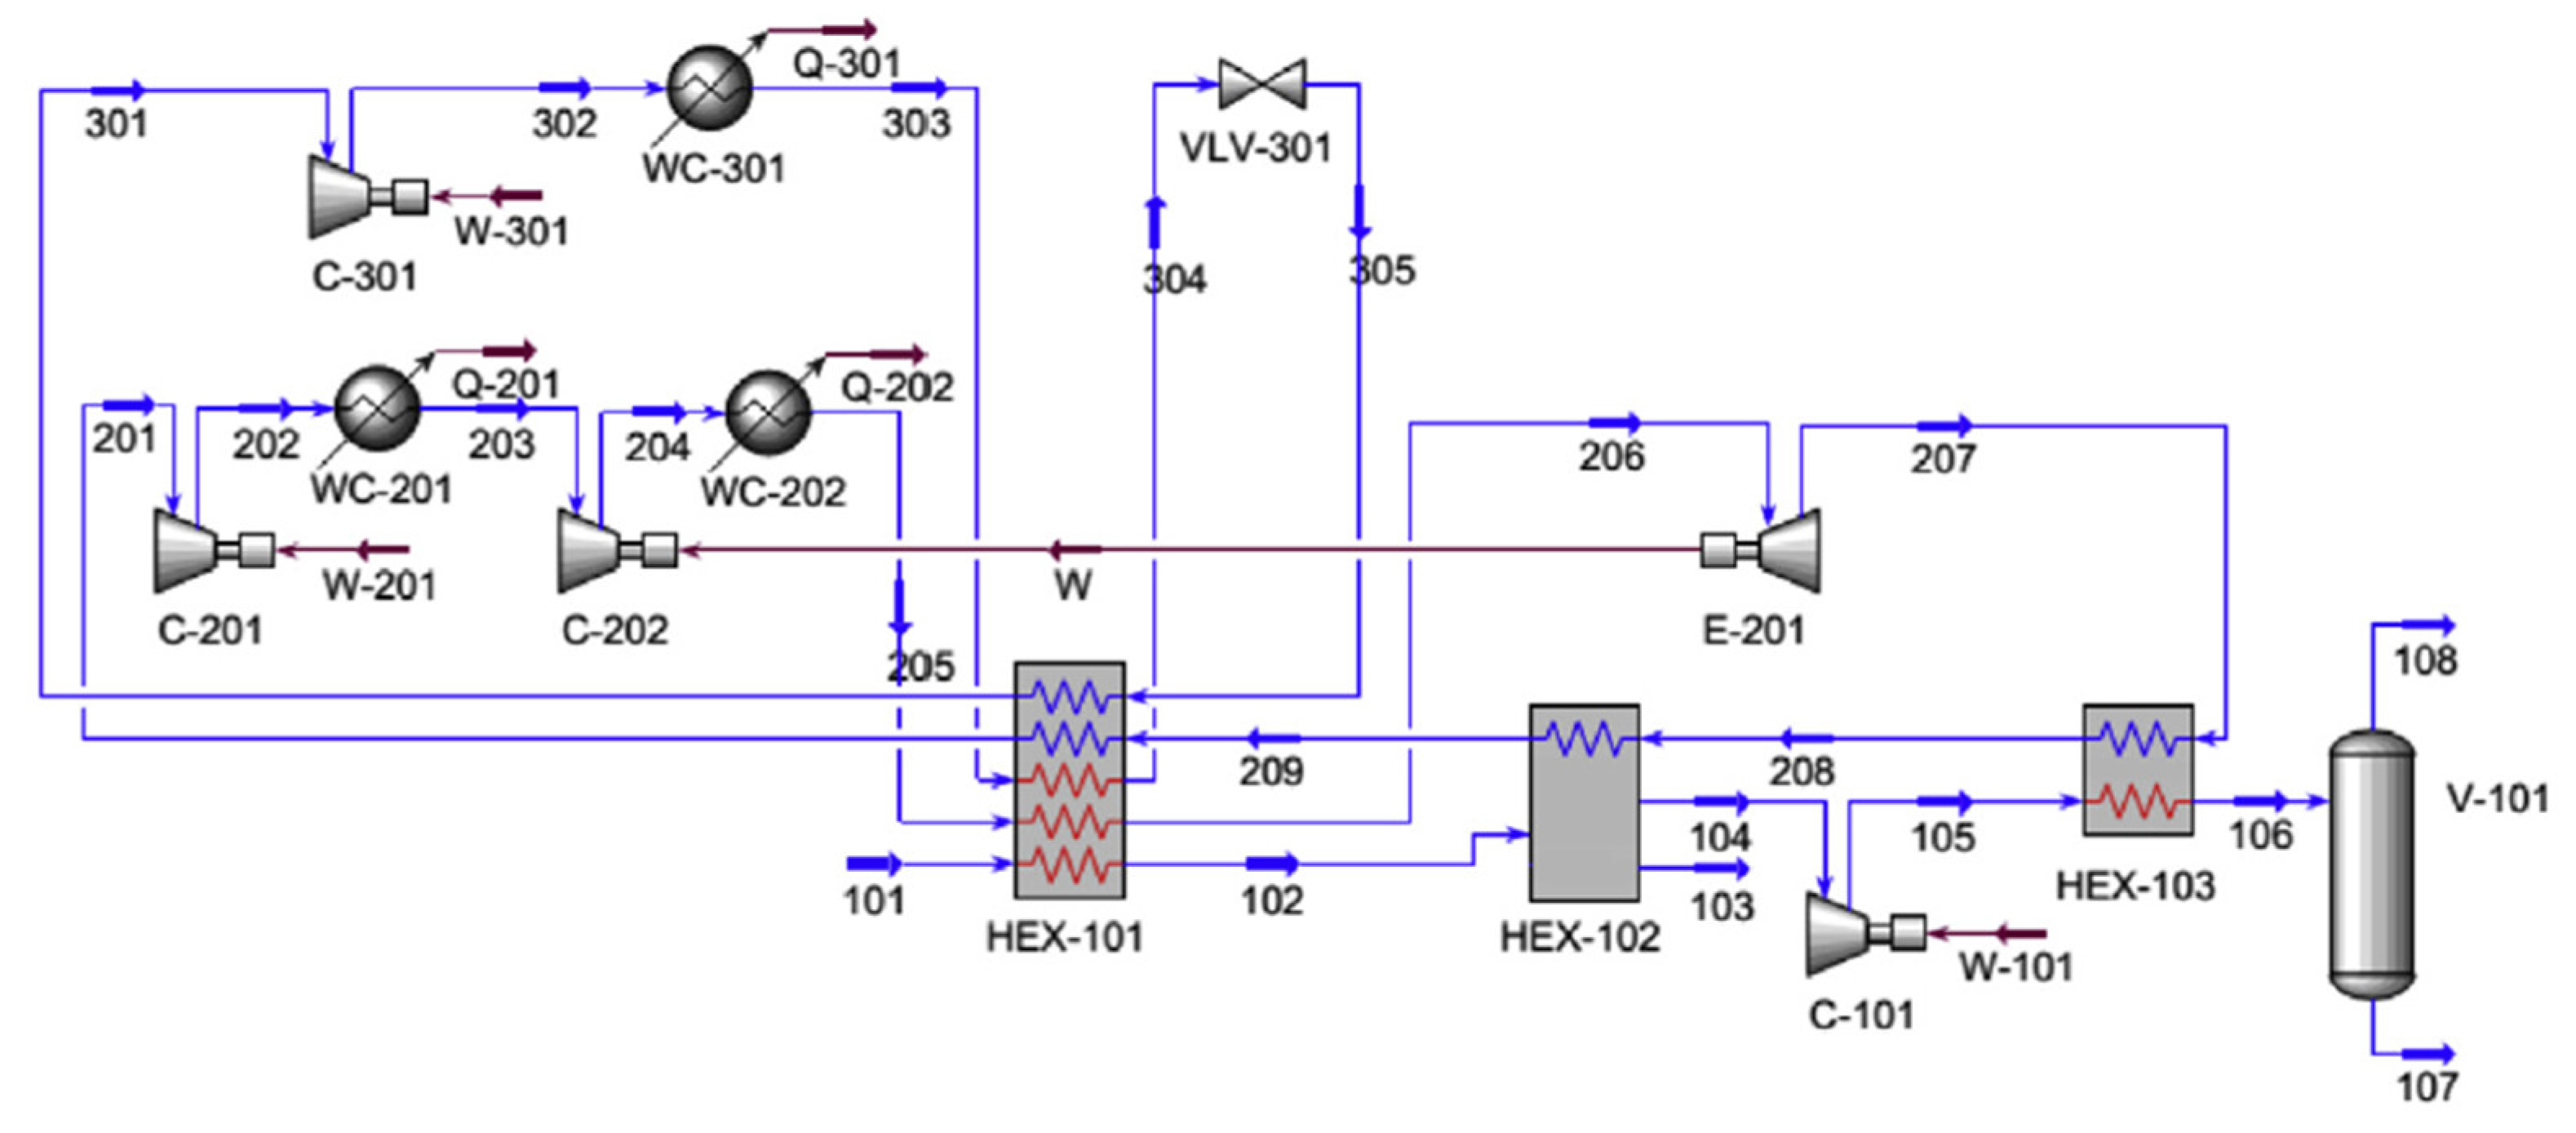
Figure 58.
The proposed process without precooling [208]. Reproduced with permission from Elsevier (license number 5413470366827).
Figure 58.
The proposed process without precooling [208]. Reproduced with permission from Elsevier (license number 5413470366827).
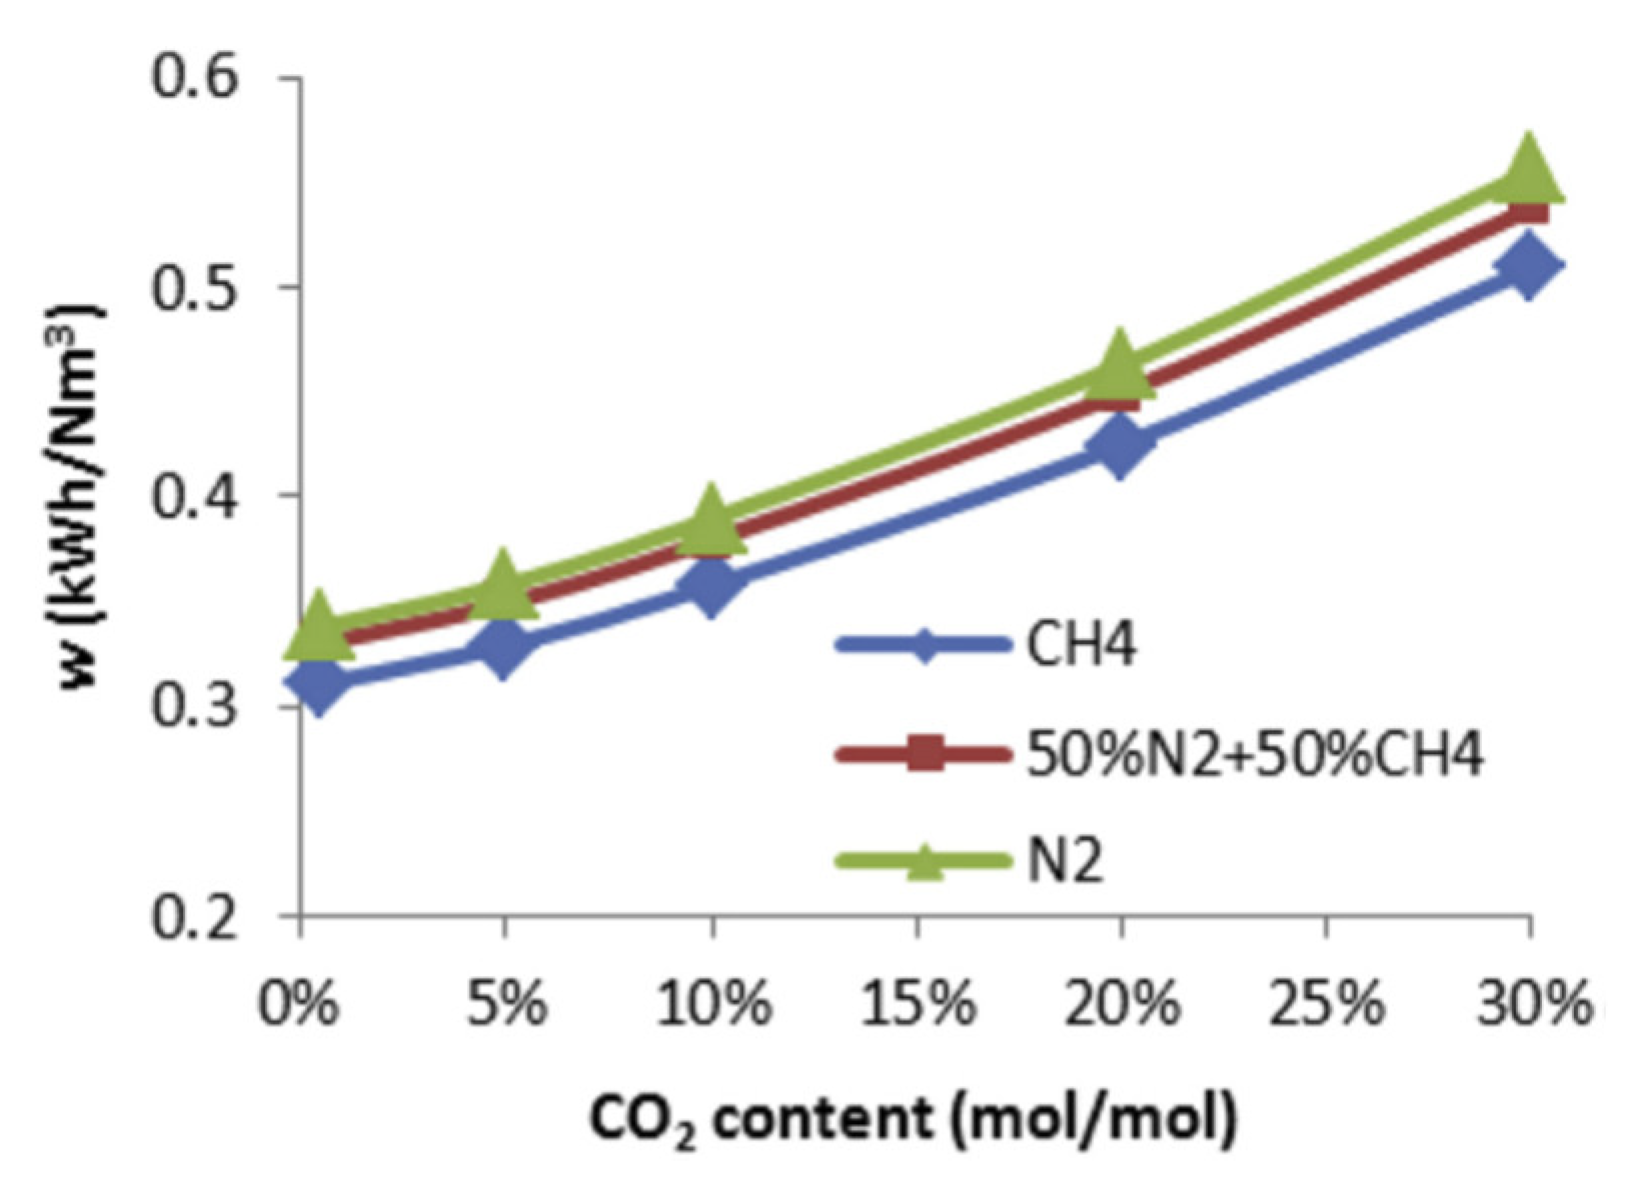
Publisher’s Note: MDPI stays neutral with regard to jurisdictional claims in published maps and institutional affiliations. |
© 2022 by the authors. Licensee MDPI, Basel, Switzerland. This article is an open access article distributed under the terms and conditions of the Creative Commons Attribution (CC BY) license (https://creativecommons.org/licenses/by/4.0/).
Share and Cite
MDPI and ACS Style
Gao, L.; Wang, J.; Binama, M.; Li, Q.; Cai, W. The Design and Optimization of Natural Gas Liquefaction Processes: A Review. Energies 2022, 15, 7895. https://doi.org/10.3390/en15217895
AMA Style
Gao L, Wang J, Binama M, Li Q, Cai W. The Design and Optimization of Natural Gas Liquefaction Processes: A Review. Energies. 2022; 15(21):7895. https://doi.org/10.3390/en15217895
Chicago/Turabian StyleGao, Lei, Jiaxin Wang, Maxime Binama, Qian Li, and Weihua Cai. 2022. "The Design and Optimization of Natural Gas Liquefaction Processes: A Review" Energies 15, no. 21: 7895. https://doi.org/10.3390/en15217895
Note that from the first issue of 2016, this journal uses article numbers instead of page numbers. See further details here.