
Water Availability Assessment from Power Generation Reservoirs in the Rio Grande Operated by Furnas, Brazil

 ,
,  ,
,
Abstract
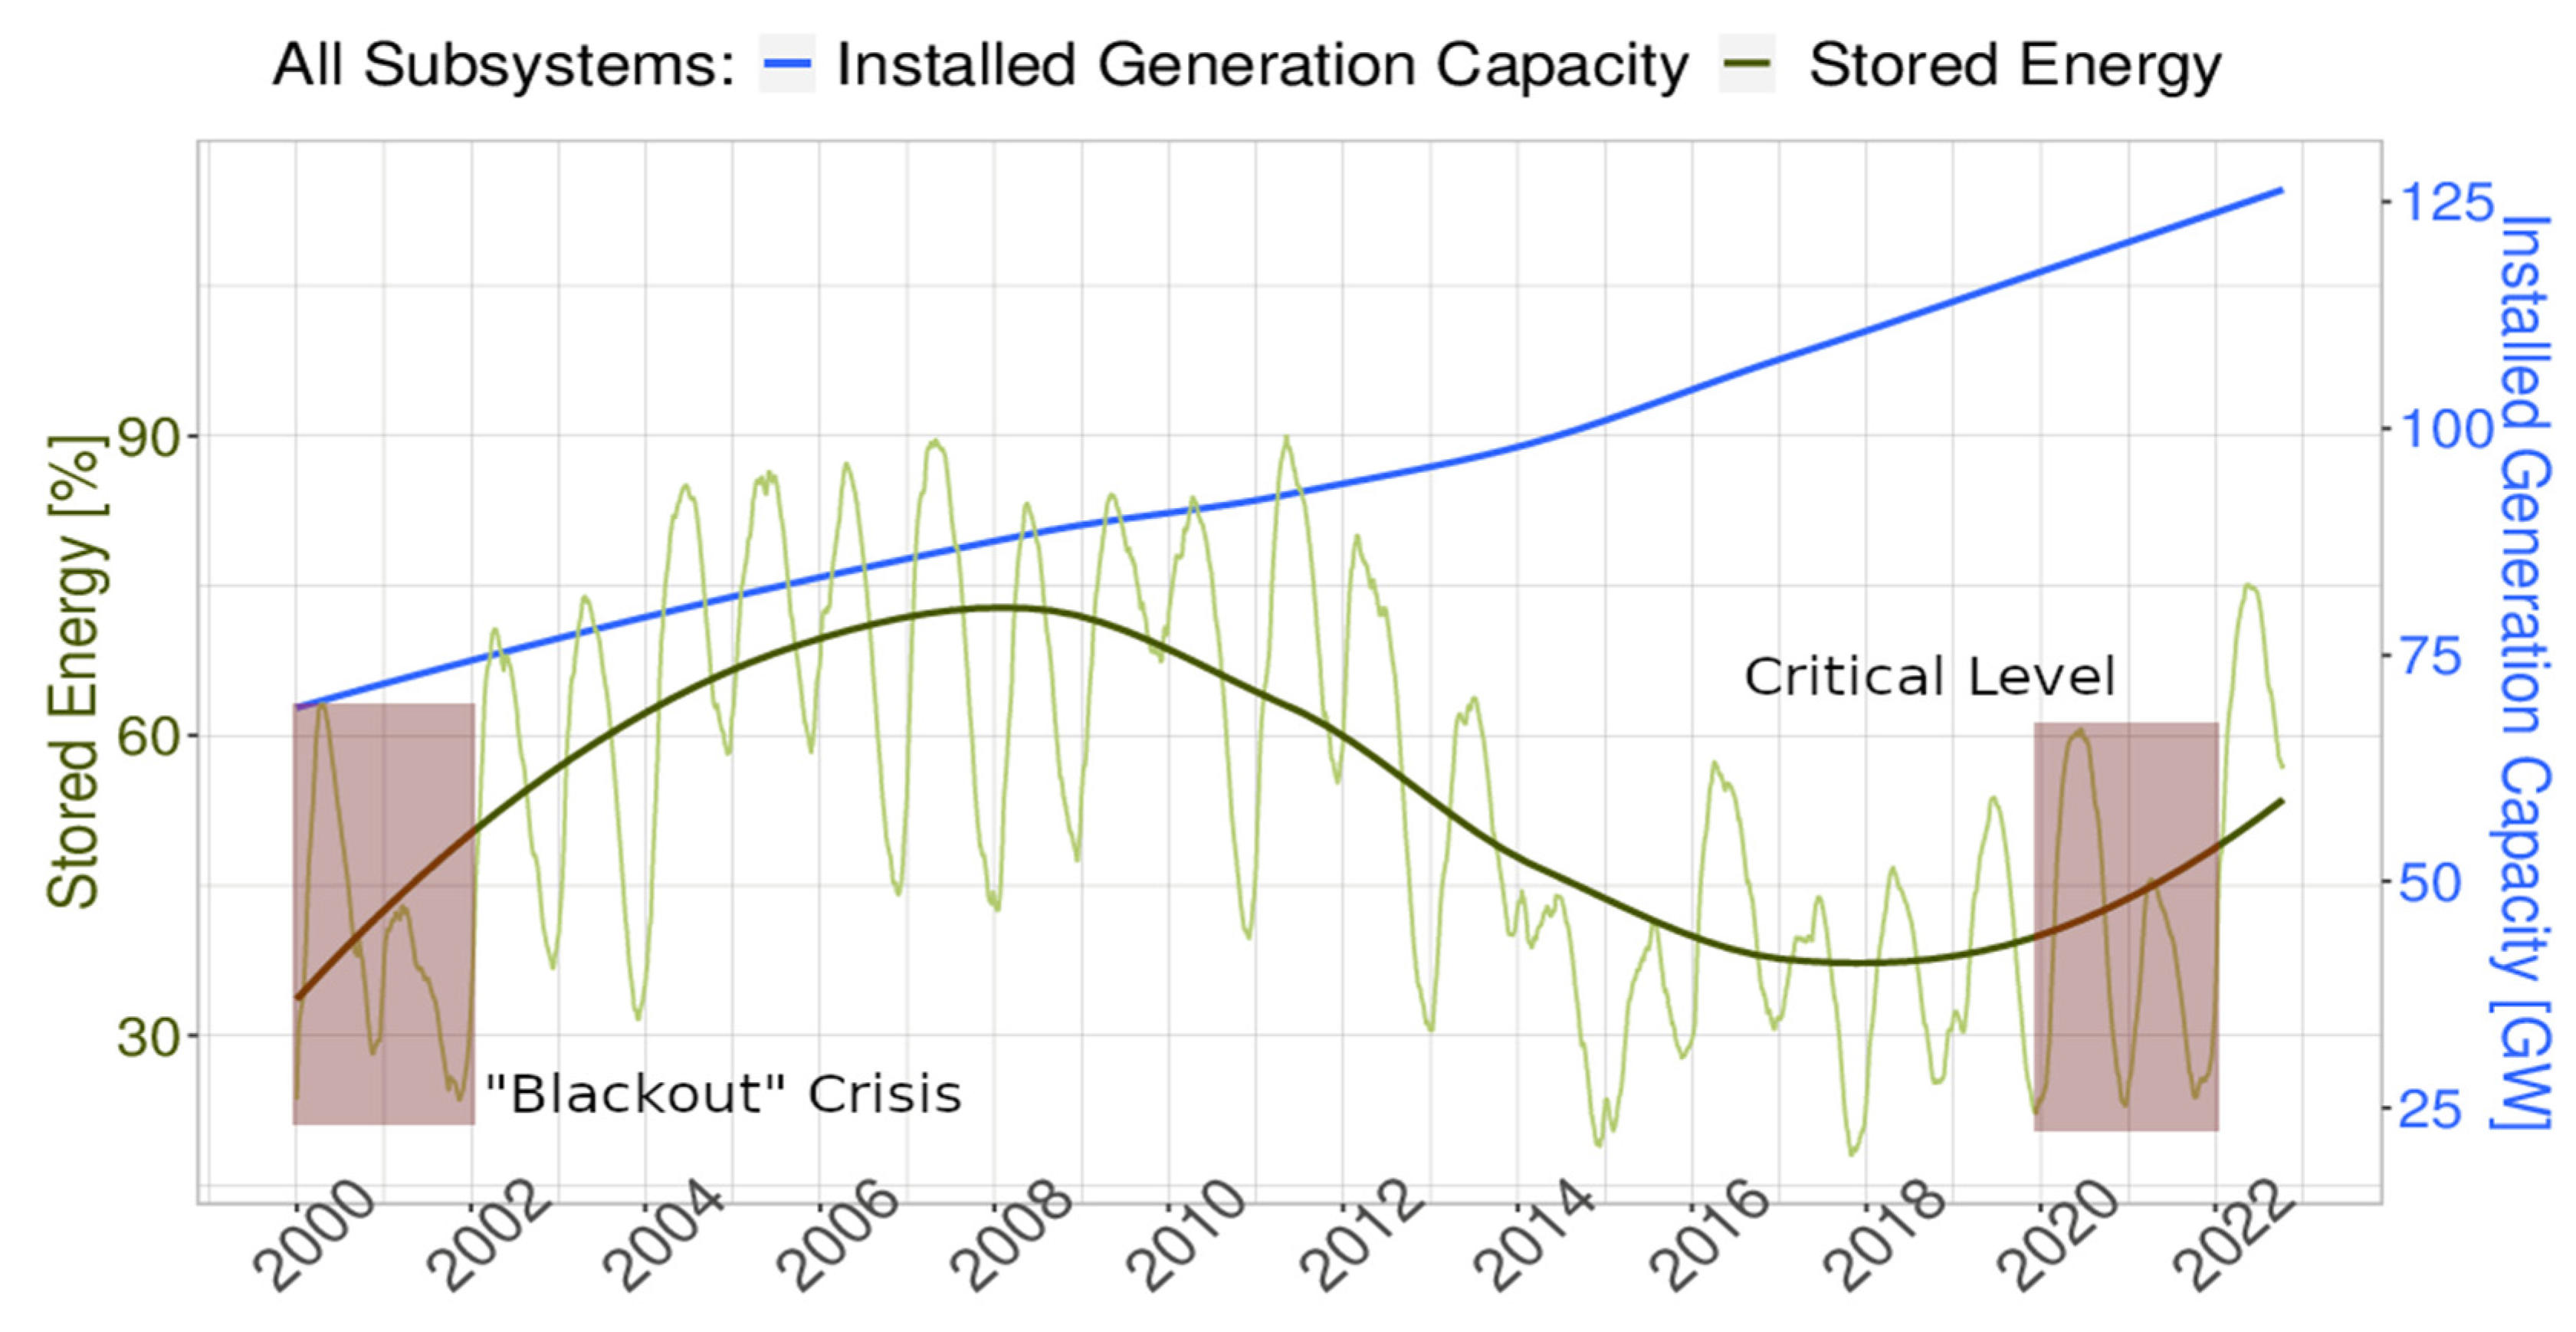
:1. Introduction
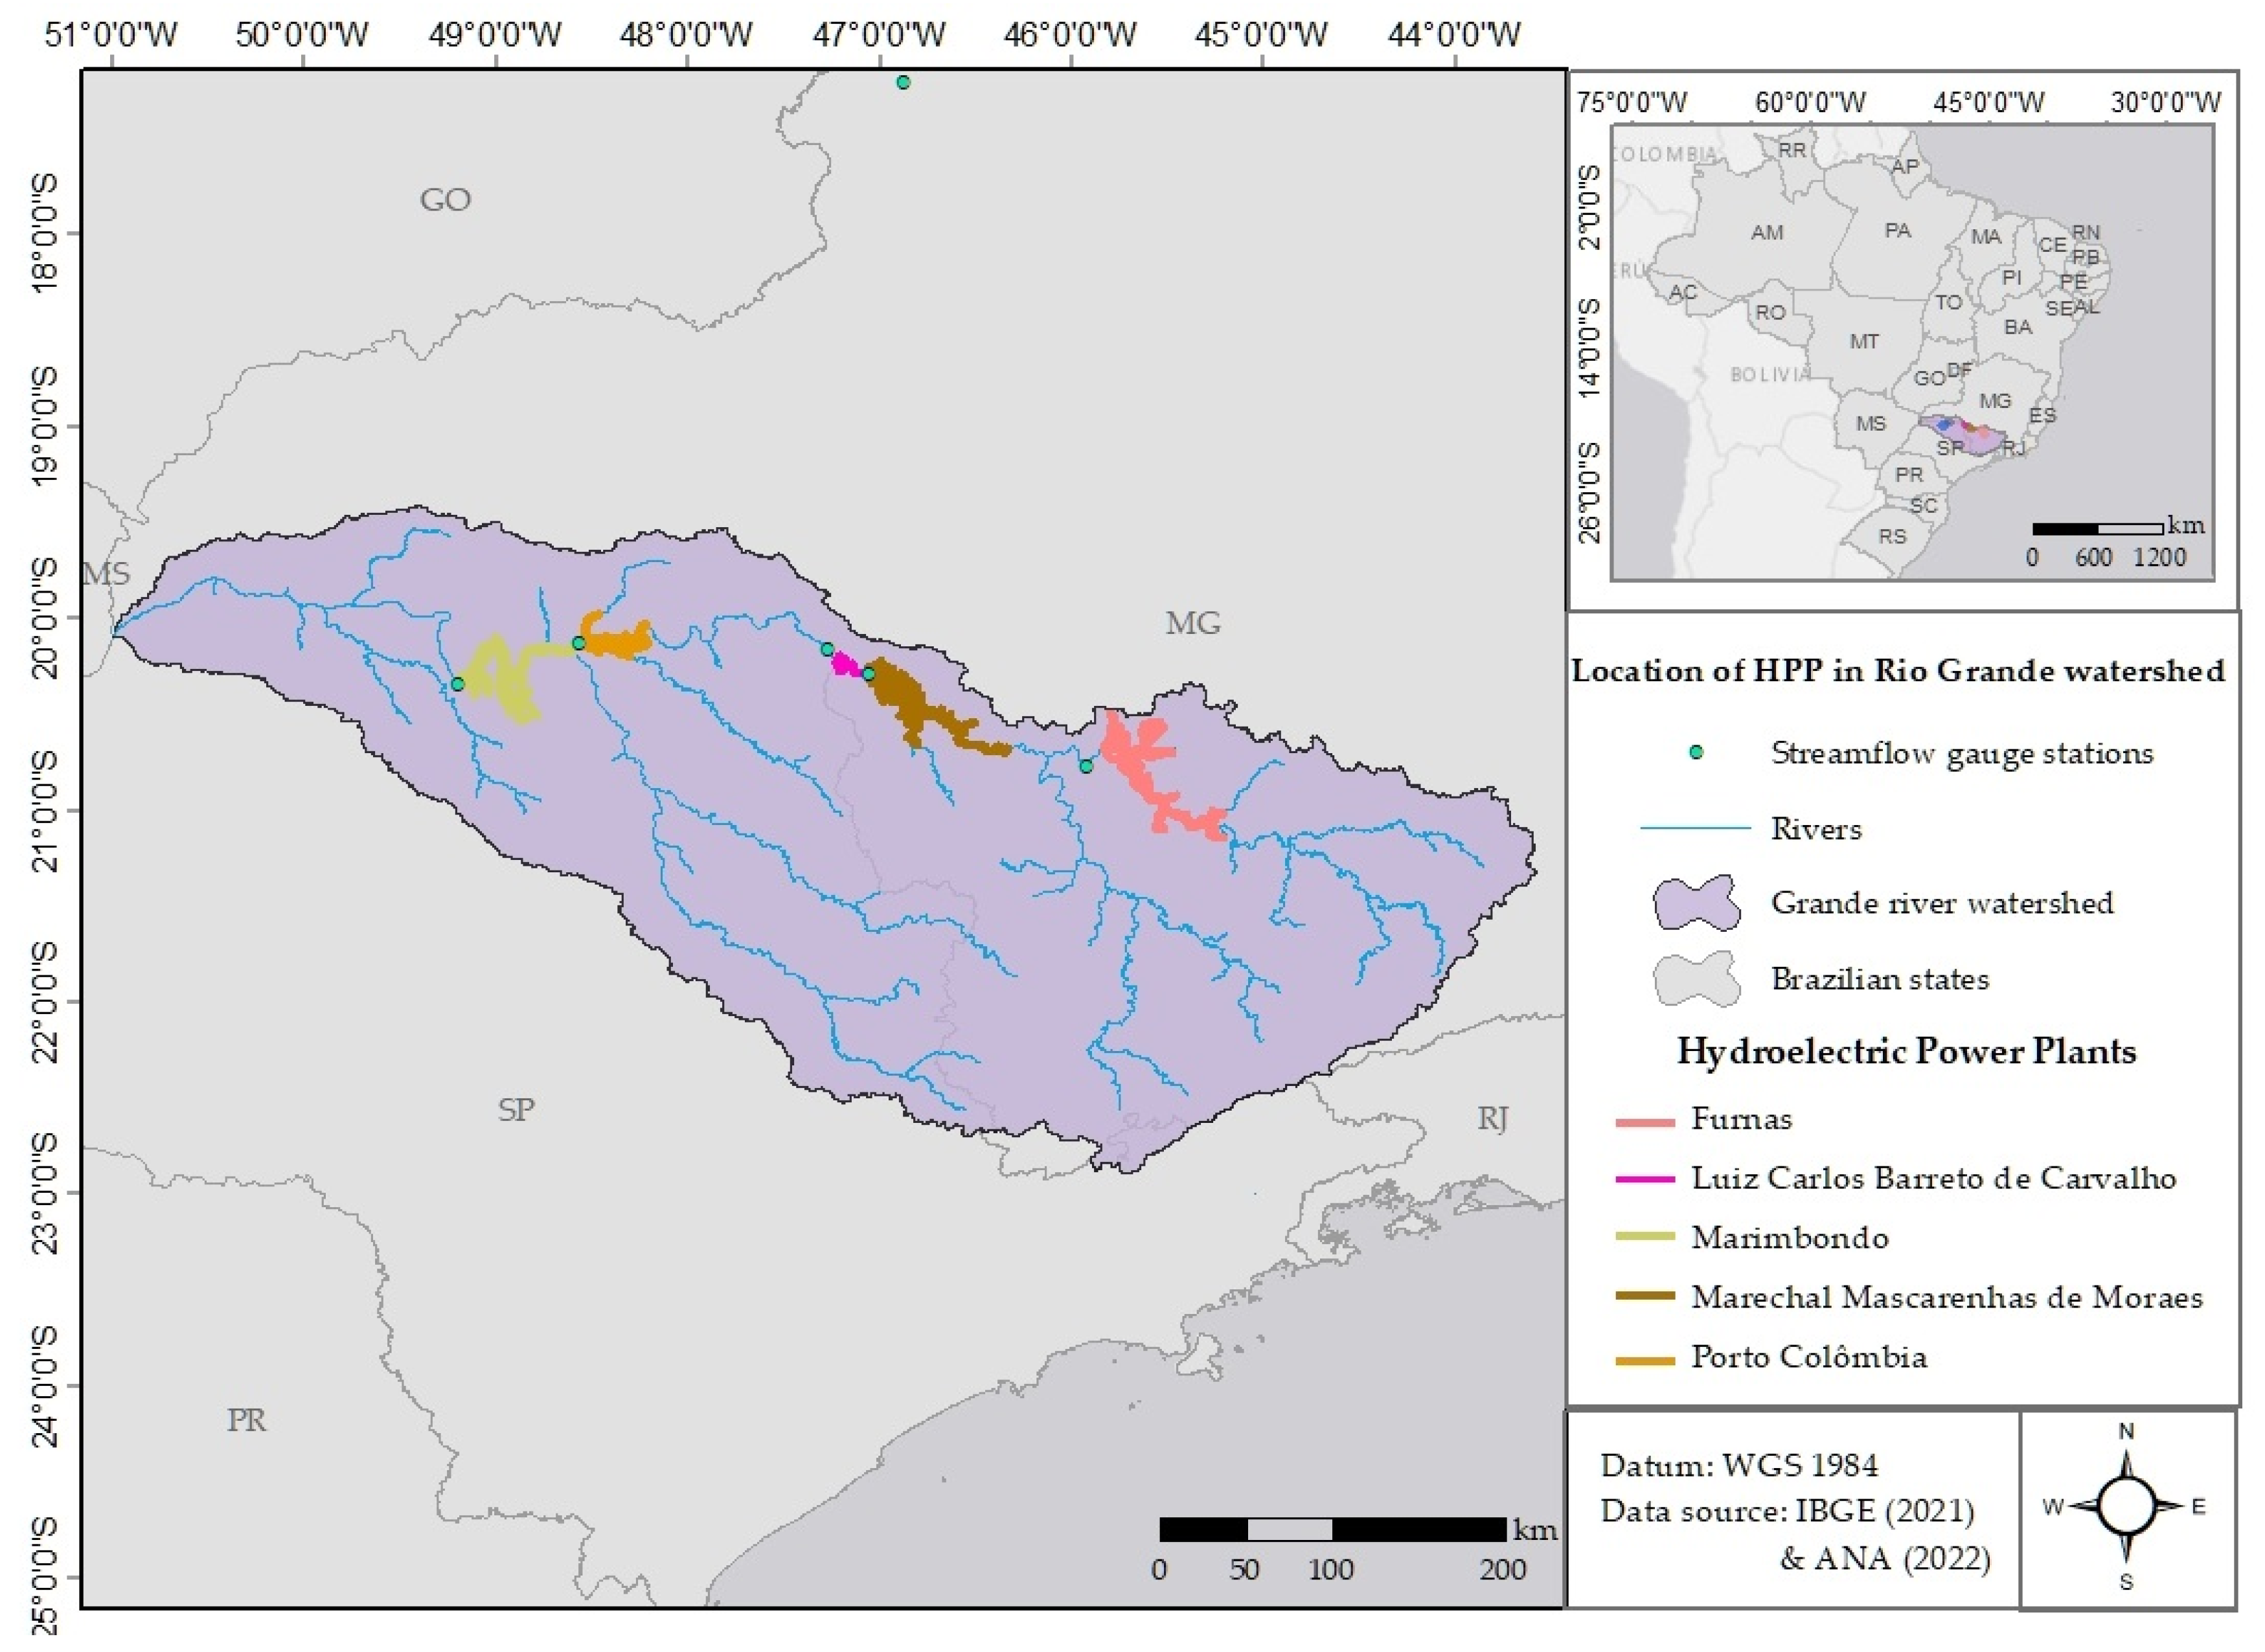
2. Materials and Methods
2.1. Water Consumptive Uses
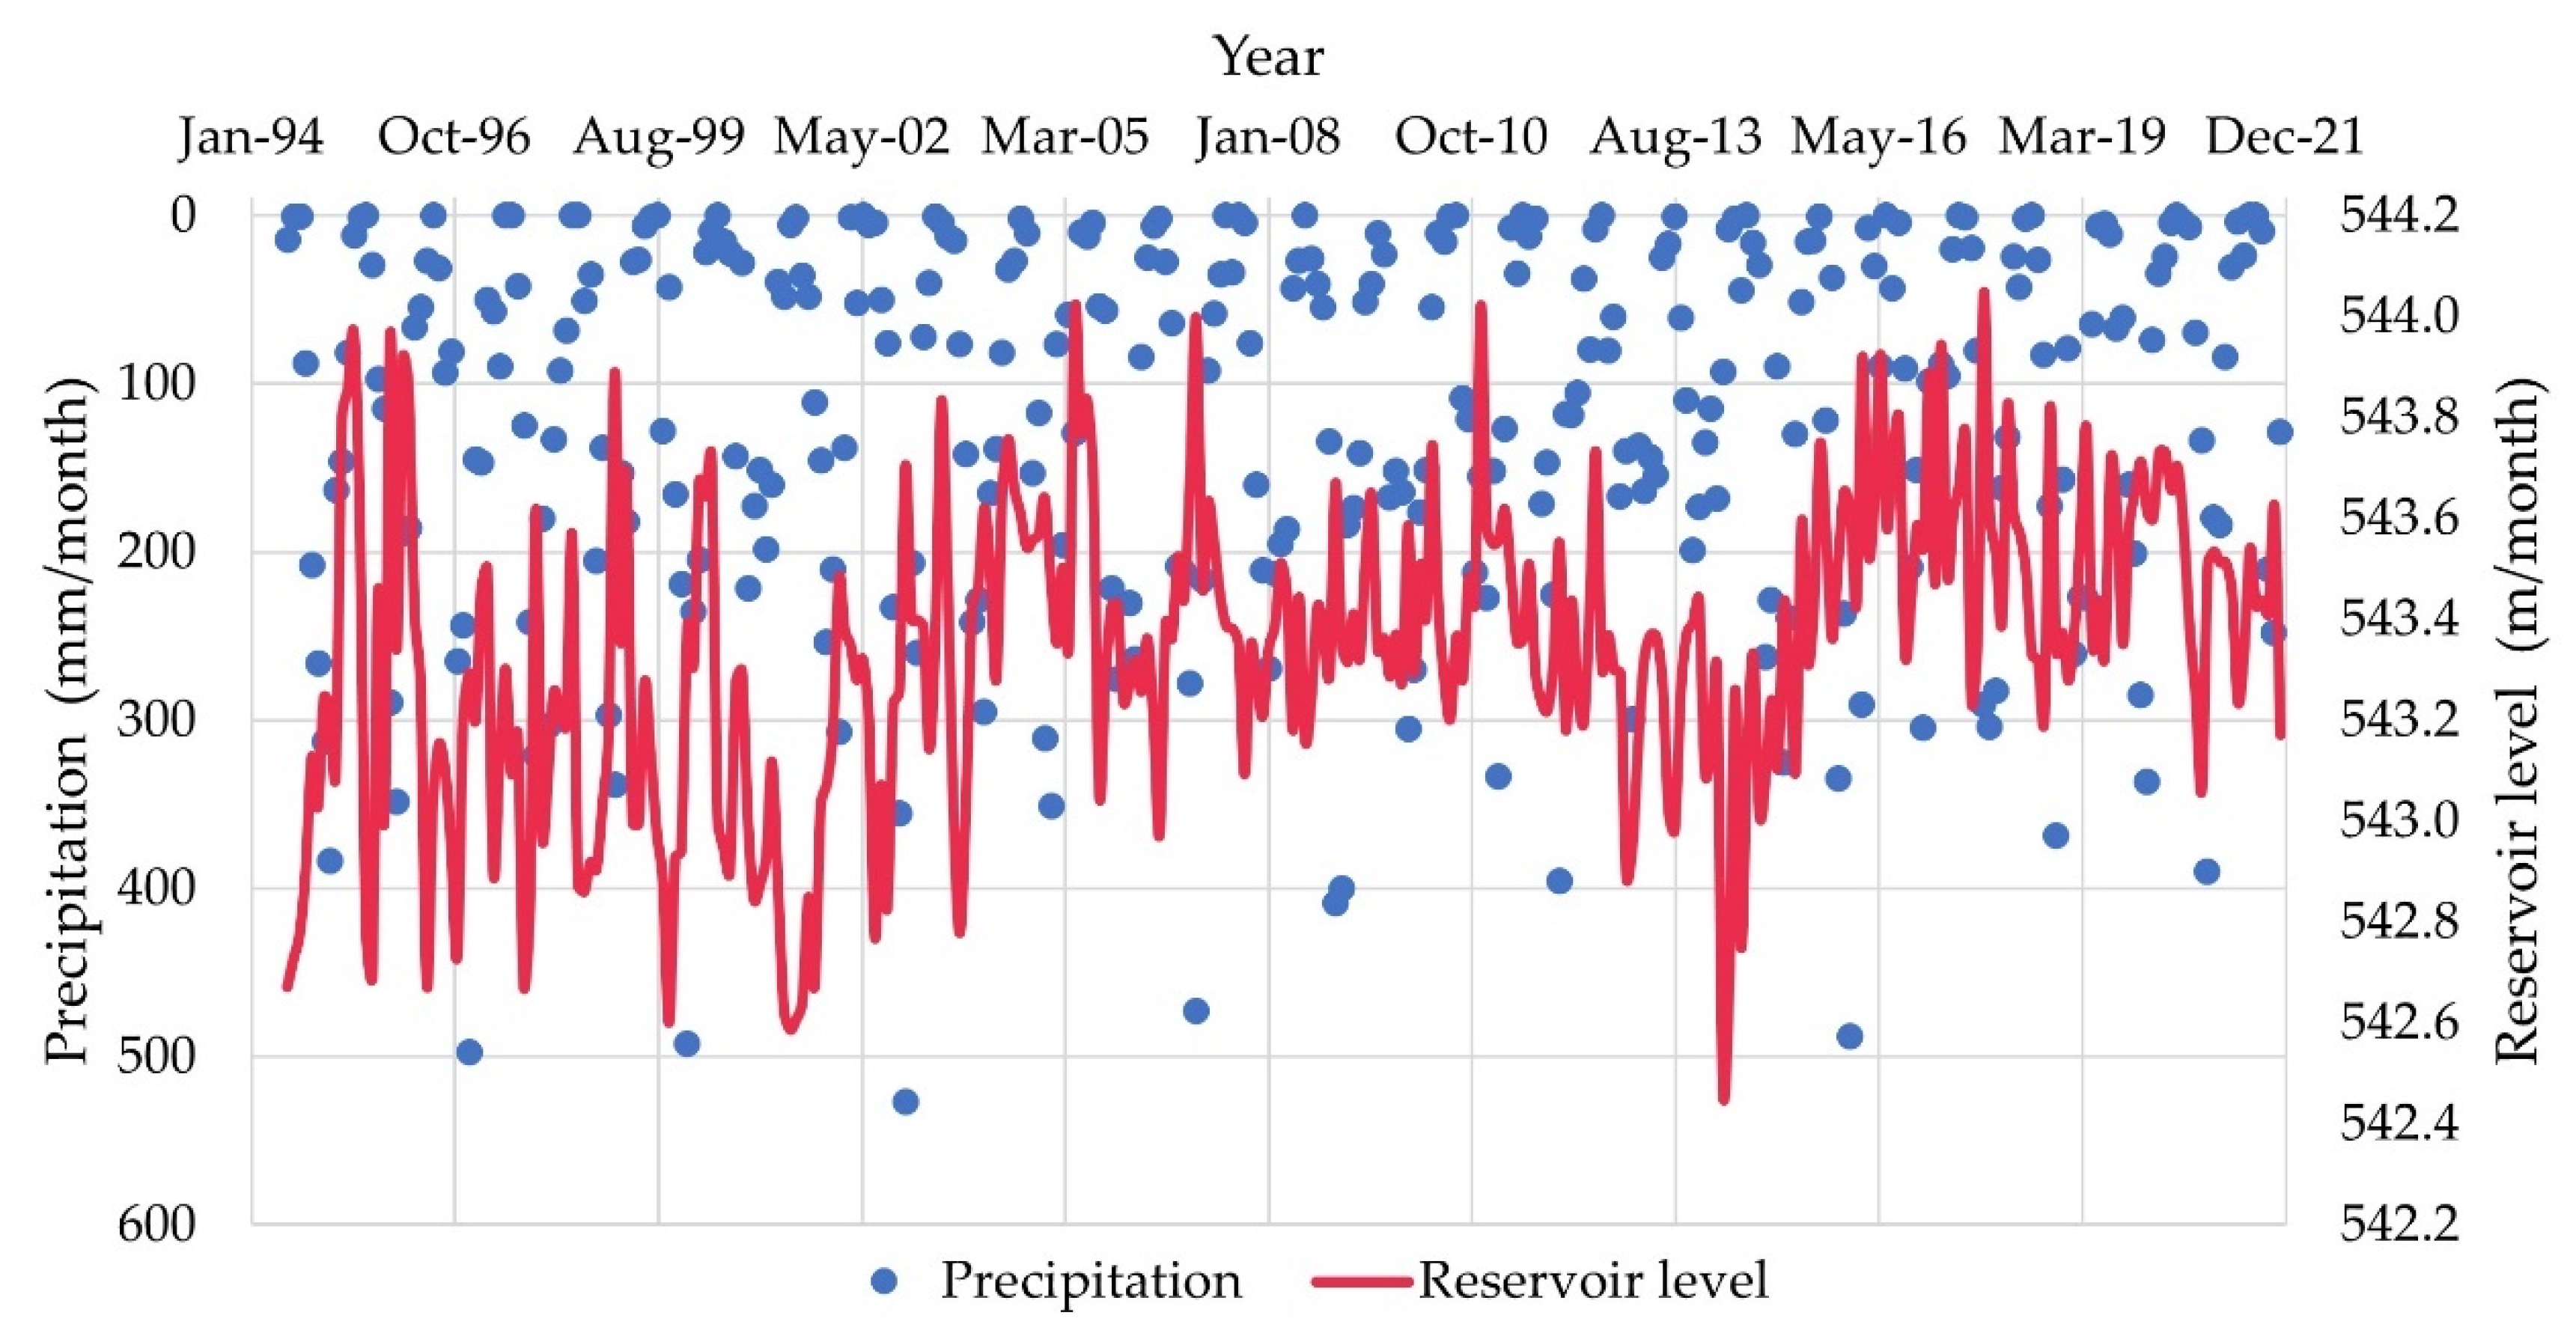
2.2. Precipitation vs. Reservoir Level Analysis
2.3. Statistical Analyses
- -
- Null hypothesis (Ho): The time series of water consumptive use, precipitation and reservoir levels do not show an increasing or decreasing trend over time.
- -
- Alternative hypothesis (Ha): The time series of water consumptive use, precipitation and reservoir levels show an increasing or decreasing trend over time.
3. Results and Discussion
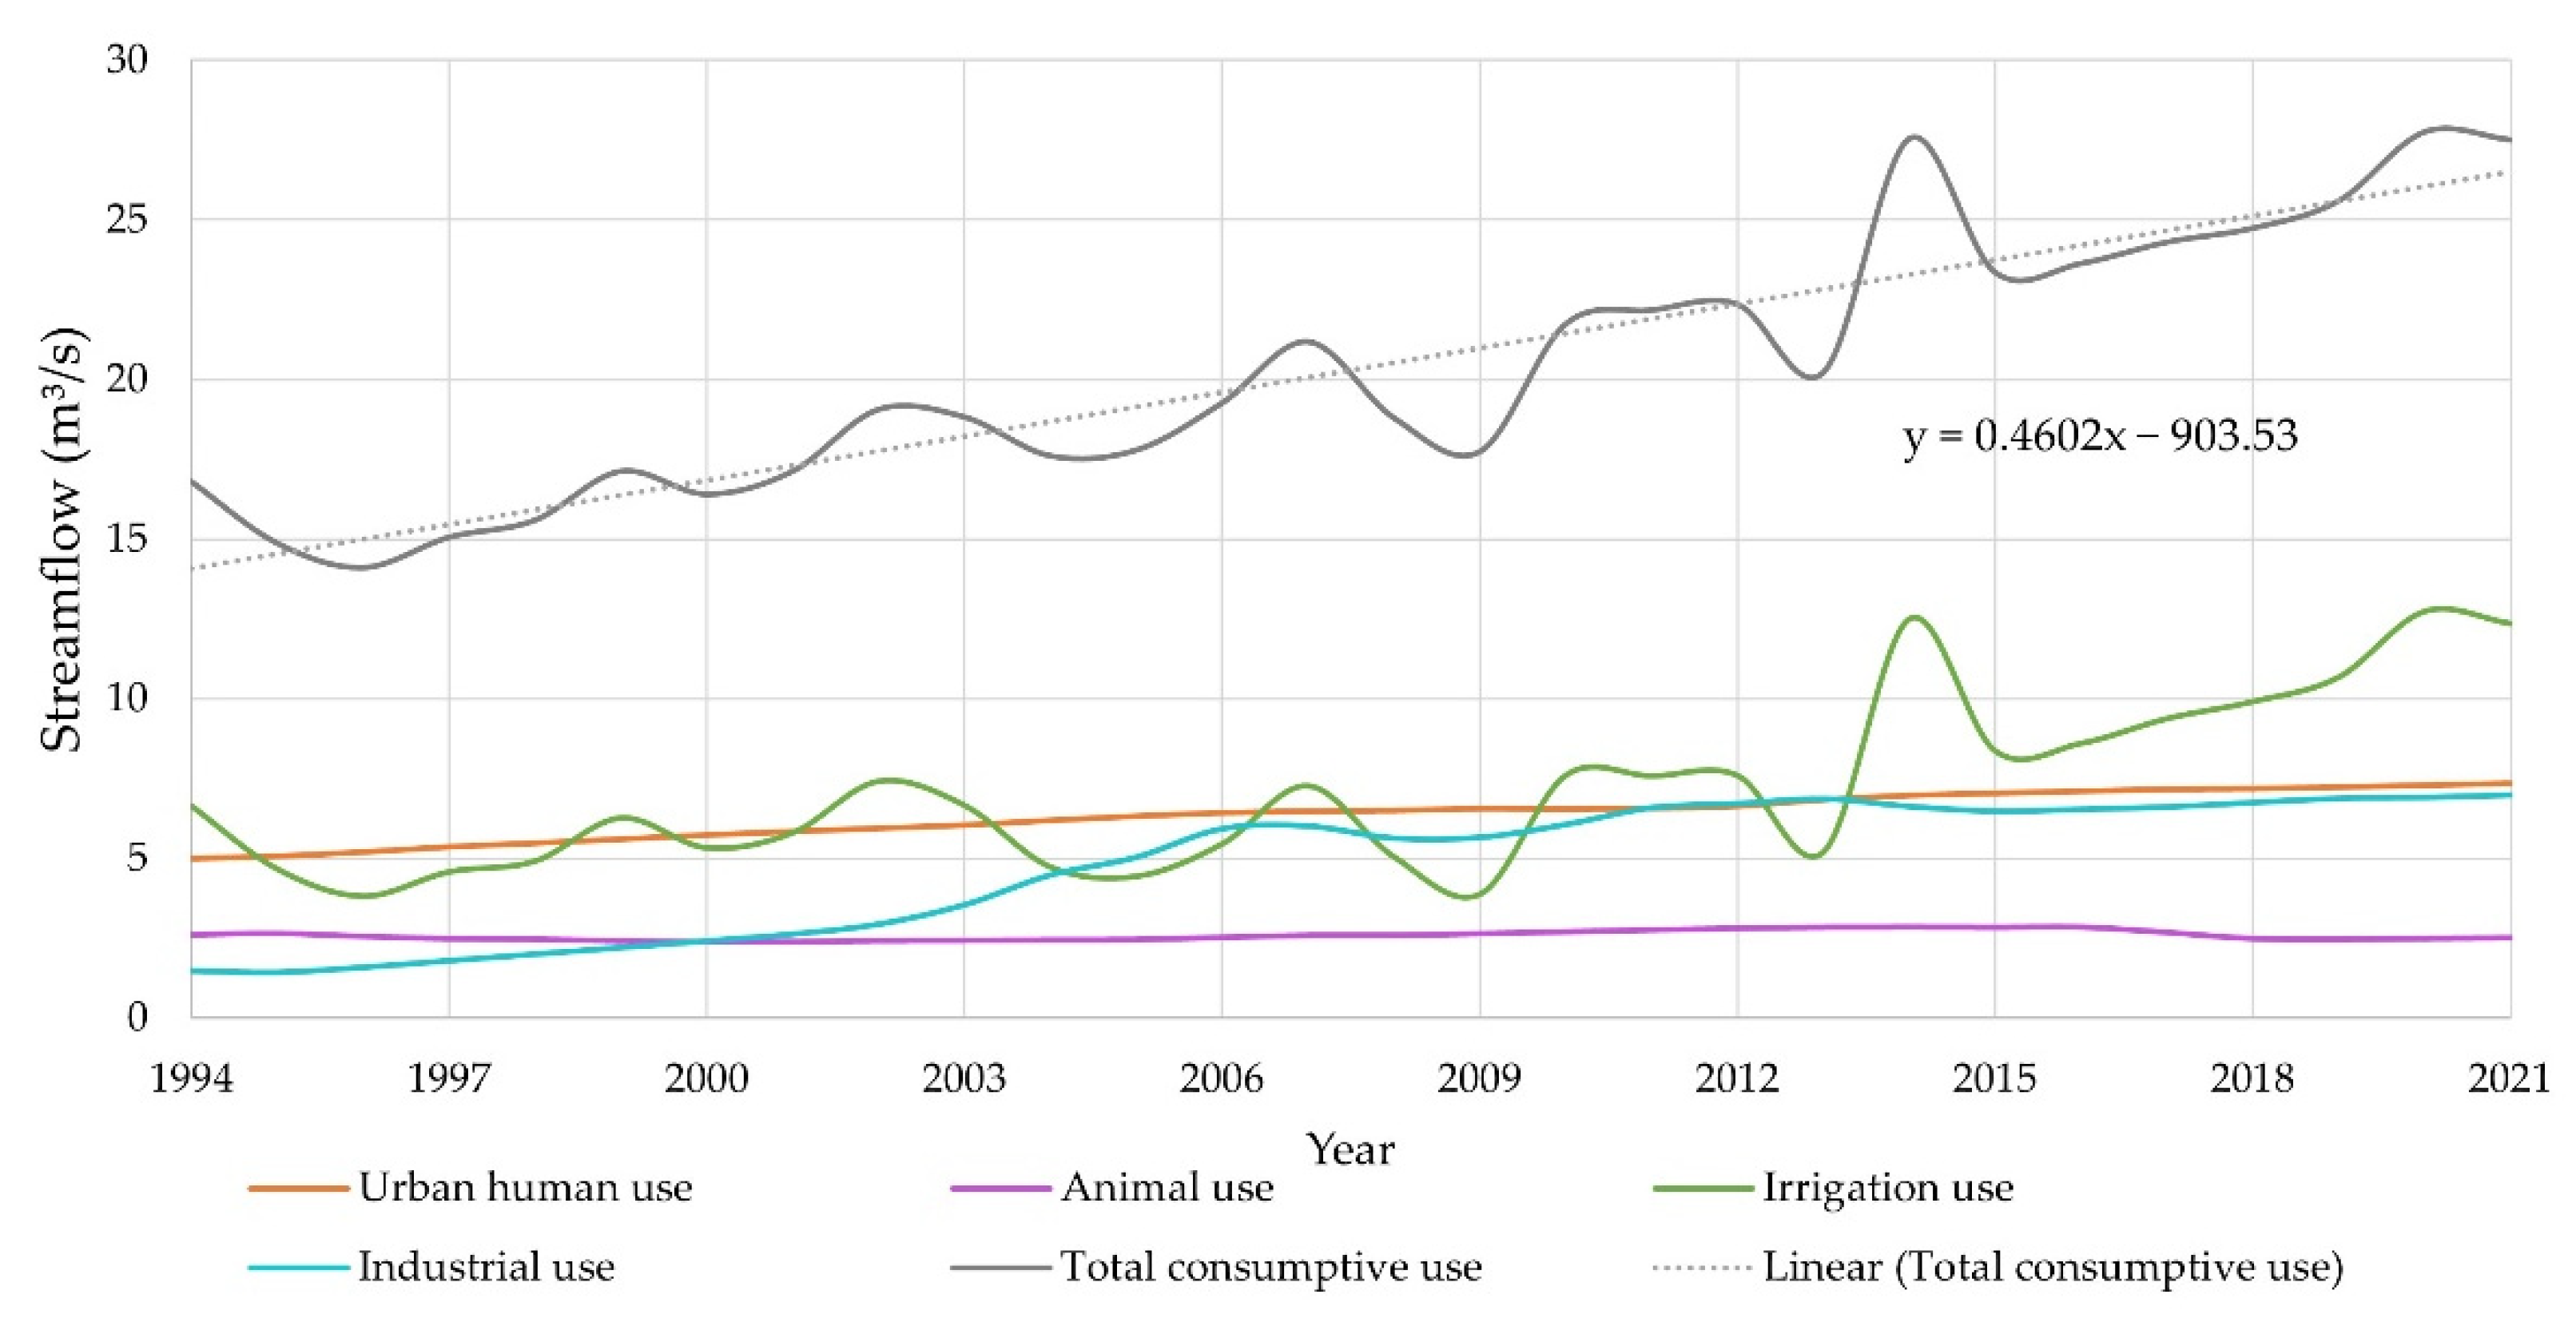
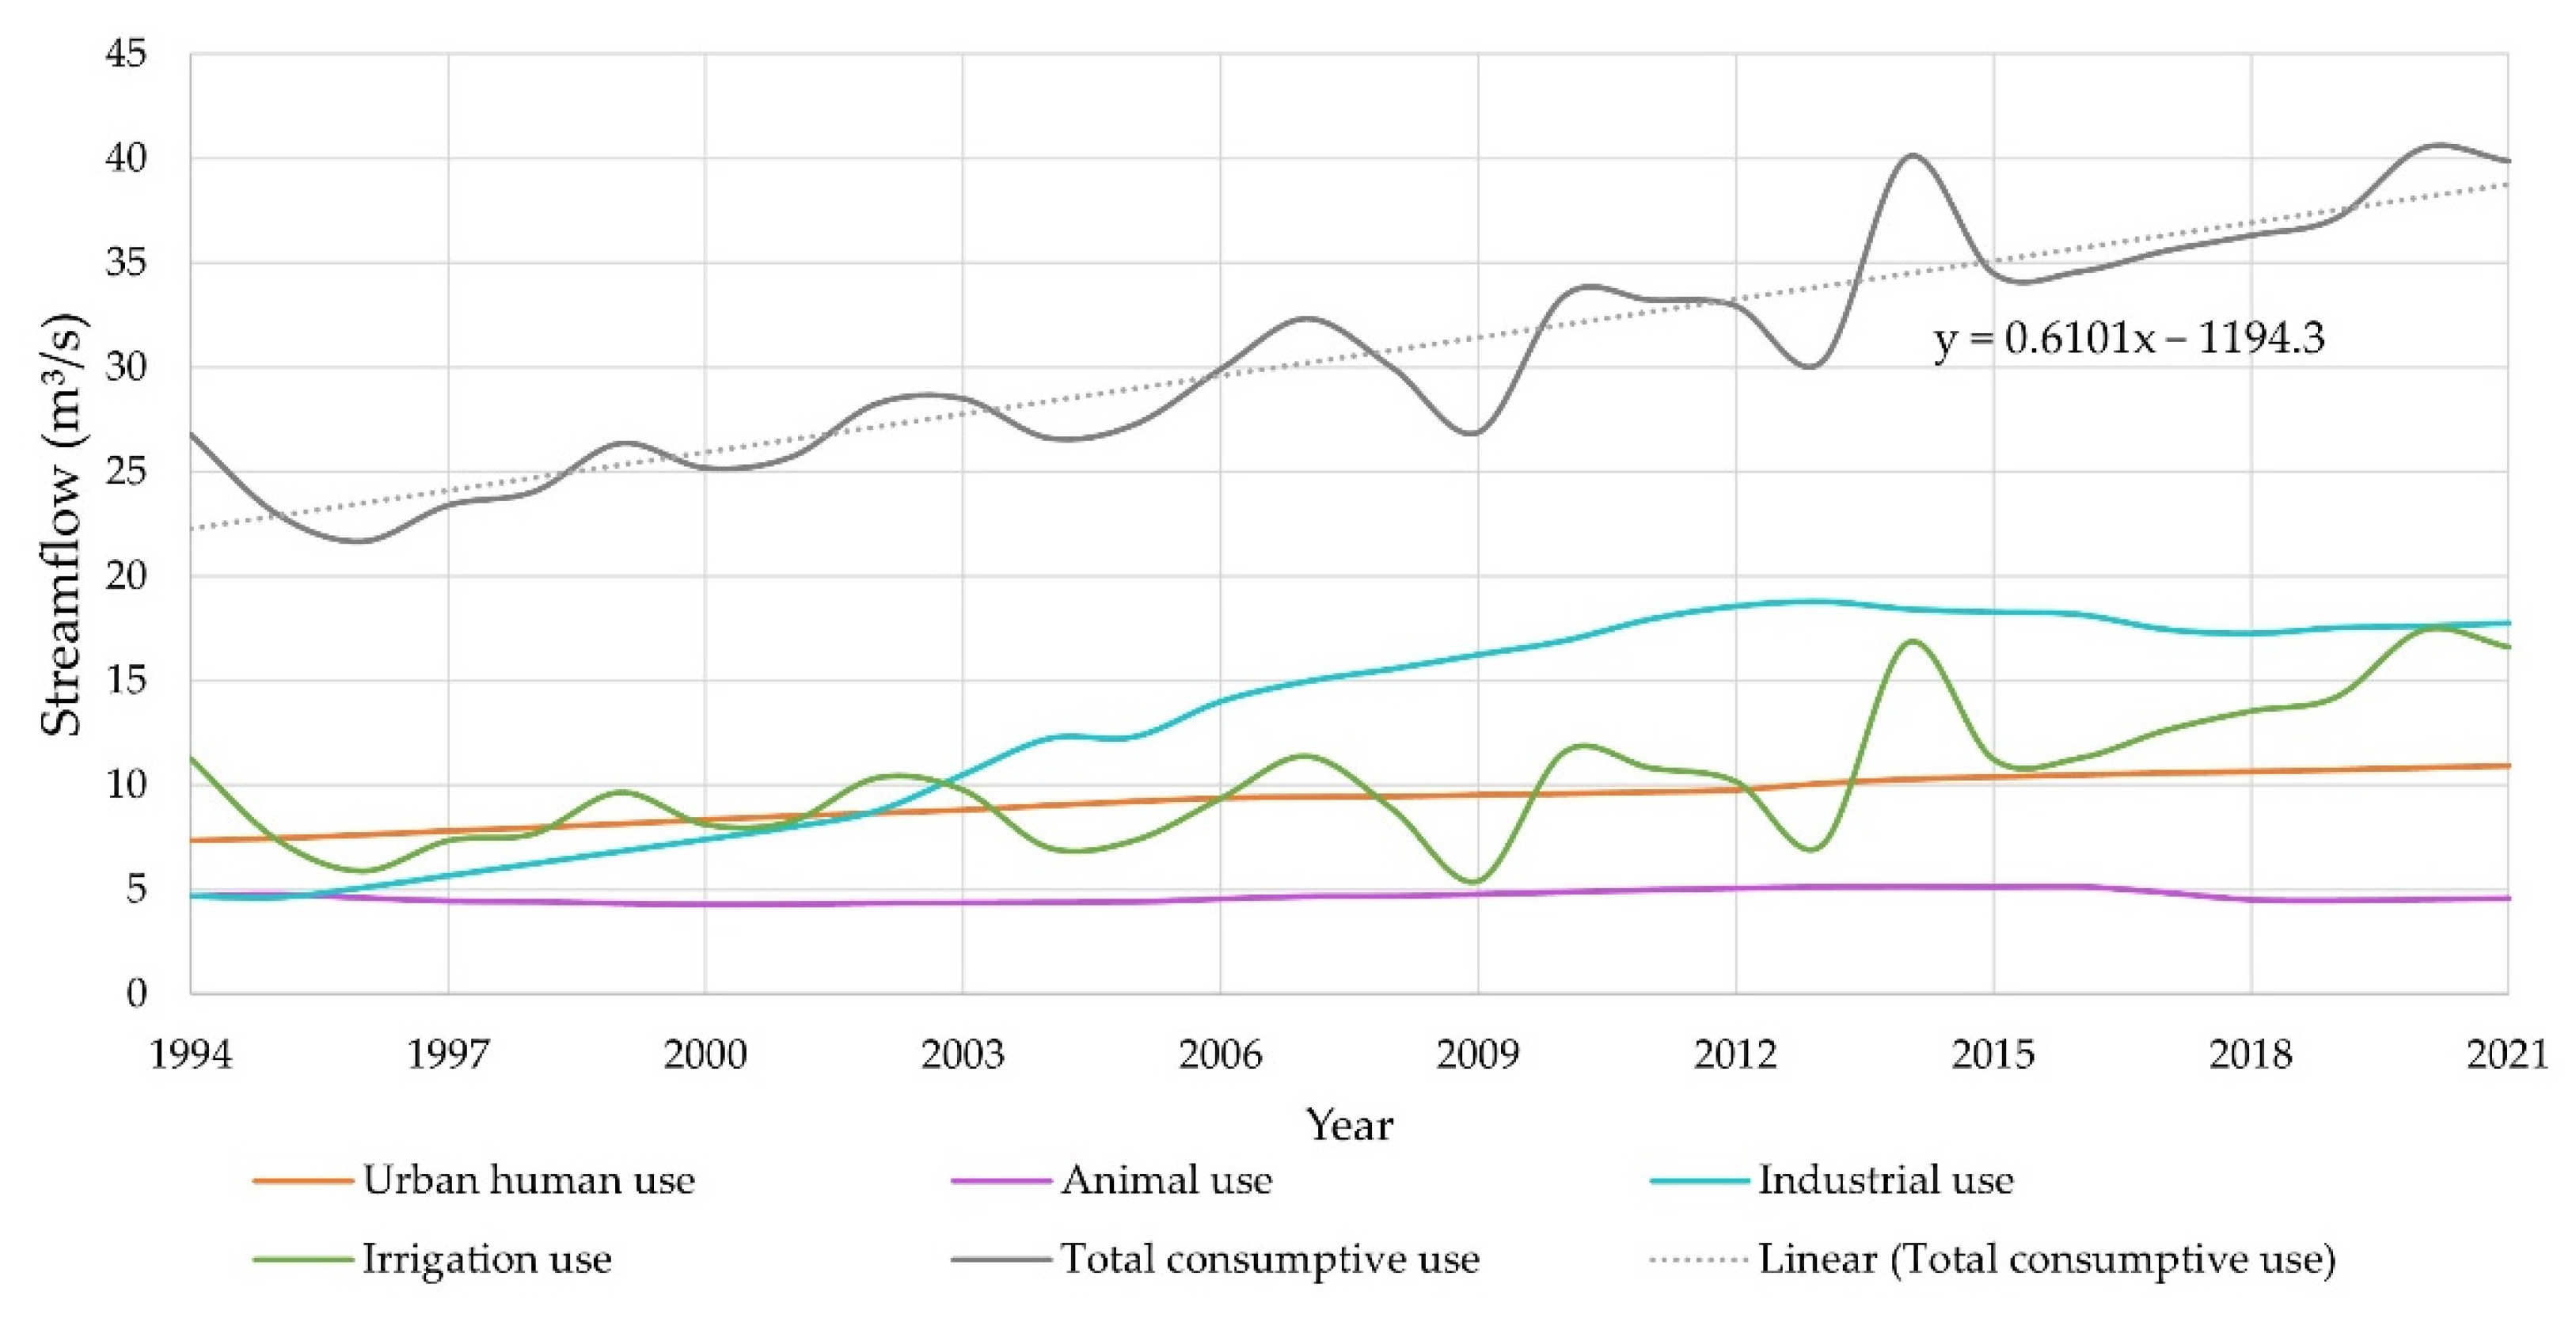
3.1. Consumptive Use
3.2. Precipitation and Reservoir Levels
3.3. Trend Test
4. Conclusions
Author Contributions
Funding
Data Availability Statement
Conflicts of Interest
References
- Kim, D.H.; Lee, T.; Shin, H.J.; Lee, S.O. Generating More Hydroelecticity While Ensuring the Safety: Resilience Assessment Study for Bukhangang Watershed in South Korea. Appl. Sci. 2022, 12, 4583. [Google Scholar] [CrossRef]
- Mekonnen, T.W.; Teferi, S.T.; Kebede, F.S.; Anandarajah, G. Assessment of Impacts of Climate Change on Hydropower-Dominated Power System—The Case of Ethiopia. Appl. Sci. 2022, 12, 1954. [Google Scholar] [CrossRef]
- Pieron, Ł.; Absalon, D.; Habel, M.; Matysik, M. Inventory of Reservoirs of Key Significance for Water Management in Poland—Evaluation of Changes in Their Capacity. Energies 2021, 14, 7951. [Google Scholar] [CrossRef]
- ANEEL—Sistema de Informações de Geração da ANEEL, o SIGA. Available online: https://antigo.aneel.gov.br/siga (accessed on 5 July 2022).
- ONS—Dados Abertos—EAR Diário Por Subsistema—2022. Available online: https://dados.ons.org.br/dataset/ear-diario-por-subsistema (accessed on 17 August 2022).
- ONS—Dados Abertos—Capacidade Instalada de Geração—2022. Available online: https://dados.ons.org.br/dataset/capacidade-geracao (accessed on 17 August 2022).
- ONS—Energia Agora—Reservatórios—2022. Available online: http://www.ons.org.br/paginas/energia-agora/reservatorios (accessed on 17 August 2022).
- Guidolini, J.F.; Ometto, J.P.; Giarolla, A.; Toledo, P.M.; Valera, C.A. Legal Basis for Water Resources Management in Brazil: Case Study of the Rio Grande Basin. Int. J. Environ. Ecol. Eng. 2018, 12, 268–274. [Google Scholar]
- IBGE—Instituto Brasileiro de Geografia e Estatística. Brasil—Minas Gerais/MG População no Último Censo. Available online: https://cidades.ibge.gov.br/brasil/mg/panorama (accessed on 6 July 2022).
- NAW—Agência Nacional das Águas. PIRH—Plano Integrado de Recursos Hídricos da Bacia Hidrográfica do Rio Grande: Resumo Executivo. Available online: http://biblioteca.ana.gov.br/index.asp?codigo_sophia=74232 (accessed on 6 July 2022).
- Furnas—Usina de Marimbondo. Available online: https://www.furnas.com.br/subsecao/125/usina-de-marimbondo?culture=pt (accessed on 26 July 2022).
- AES Brasil—Água Vermelha—Portfólio hidráulico da Companhia AESBrasil. Available online: https://ri.aesbrasil.com.br/ (accessed on 26 July 2022).
- Furnas—Usina de Furnas. Available online: https://www.furnas.com.br/subsecao/120/usina-de-furnas?culture=pt (accessed on 26 July 2022).
- Furnas—Usina de Luiz Carlos Barreto de Carvalho. Available online: https://www.furnas.com.br/subsecao/123/usina-luiz-carlos-barreto-de-carvalho?culture=pt (accessed on 26 July 2022).
- Furnas—Usina de Mascarenhas de Moraes. Available online: https://www.furnas.com.br/subsecao/126/usina-marechal-mascarenhas-de-moraes—476-mw?culture=pt (accessed on 26 July 2022).
- Engie—Usina Hidrelétrica Jaguara. Available online: https://www.engie.com.br/usinas/usina-hidreletrica-jaguara/ (accessed on 26 July 2022).
- Braga, F.M.S.; Gomiero, L.M. Análise da pesca experimental realizada no reservatório de Volta Grande, rio Grande (MG/SP). Bol. Do Inst. De Pesca São Paulo 1997, 24, 131–138. [Google Scholar]
- Furnas—Usina de Porto Colômbia. Available online: https://www.furnas.com.br/subsecao/128/usina-de-porto-colombia?culture=pt (accessed on 26 July 2022).
- UHE Igarapava. Available online: https://uhe-igarapava.com.br/ (accessed on 26 July 2022).
- UHE Funil. Available online: https://aliancaenergia.com.br/br/uhe-de-funil/ (accessed on 26 July 2022).
- CEMIG—UHE Itutinga. Available online: https://www.cemig.com.br/usina/uhe-itutinga/ (accessed on 26 July 2022).
- CEMIG—UHE Camargos. Available online: https://www.cemig.com.br/usina/uhe-camargos/ (accessed on 26 July 2022).
- Furnas—Parque Gerador. Available online: https://www.furnas.com.br/geracao/?culture=pt (accessed on 24 October 2022).
- NAW. Manual de usos consuntivos da água no Brasil. Brasília, DF, Brasil: Agência Nacional de Águas, 2019 a. Available online: https://biblioteca.ana.gov.br/sophia_web/Busca/Download?codigoArquivo=134951 (accessed on 24 October 2022).
- NAW. Séries Históricas de Usos Consuntivos a Montante de Aproveitamentos Hidrelétricos—Resolução ANA no 92/2021 (Planilha) Versão 1. [S. l.]: ANA, 2019 b. Available online: https://metadados.snirh.gov.br/geonetwork/srv/por/catalog.search#/metadata/c239a66f-6b41-4b7e-9790-86dbf817cd41 (accessed on 24 October 2022).
- Kendall, M.G. Rank Correlation Methods; Charles Griffin: London, UK, 1948. [Google Scholar]
- Mann, H.B. Nonparametric Tests Against Trend. Econometrica 1945, 13, 245–259. [Google Scholar] [CrossRef]
- Tabari, H.; Marofi, S.; Aeini, A.; Talaee, P.H.; Mohammadi, K. Trend analysis of reference evapotranspiration in the western half of Iran. Agric. For. Meteorol. 2011, 151, 128–136. [Google Scholar] [CrossRef]
- Zhang, X.; Harvey, D.K.; Hogg, W.D.; Yuzyk, T.R. Trends in Canadian streamflow. Water Resour. Res. 2001, 37, 987–998. [Google Scholar] [CrossRef]
- Ashraf, M.S.; Ahmad, I.; Khan, N.M.; Zhang, F.; Bilal, A.; Guo, J. Streamflow Variations in Monthly, Seasonal, Annual and Extreme Values Using Mann-Kendall, Spearmen’s Rho and Innovative Trend Analysis. Water Resour. Manag. 2021, 35, 243–261. [Google Scholar] [CrossRef]
- Globo—Economia—Crise da Água. Available online: https://g1.globo.com/economia/crise-da-agua/noticia/2021/09/01/crise-energetica-pode-ser-que-tenha-que-ocorrer-algum-racionamento-diz-mourao.ghtml (accessed on 24 October 2022).
- Folha de São Paulo—Economia—Crise Energética. Available online: https://www1.folha.uol.com.br/mercado/2021/11/medidas-contra-crise-energetica-ja-custam-r-140-bilhoes-diz-instituto.shtml (accessed on 24 October 2022).
- UOL—Economia. Available online: https://economia.uol.com.br/noticias/afp/2021/09/01/pior-seca-em-quase-um-seculo-aprofunda-crise-energetica-no-brasil.htm (accessed on 24 October 2022).


| HPP | Owner | Power (MW) | Lake (km2) | Volume (hm3) | Type |
|---|---|---|---|---|---|
| Marimbondo [11] | Furnas | 1440 | 438 | 5260 | Accumulation |
| Água Vermelha [12] | AES Brasil | 1396 | 647 | 11,000 | Accumulation |
| Furnas [13] | Furnas | 1216 | 1440 | 17,217 | Accumulation |
| Luiz Carlos Barreto de Carvalho [14] | Furnas | 1050 | 46 | 178 | Run-of-river |
| Mascarenhas de Moraes [15] | Furnas | 476 | 250 | 2500 | Accumulation |
| Jaguara [16] | Engie | 424 | 34 | 90 | Run-of-river |
| Volta Grande [17] | Enel | 380 | 222 | 2268 | Run-of-river |
| Porto Colômbia [18] | Furnas | 320 | 143 | 2335 | Run-of-river |
| Igarapava [19] | Consórcio UHE Igarapava | 210 | 36 | 234 | Run-of-river |
| Funil [20] | Aliança Energia | 180 | 40 | 258 | Accumulation |
| Ututinga [21] | CEMIG | 52 | 2 | 11 | Run-of-river |
| Camargos [22] | CEMIG | 45 | 73 | 792 | Accumulation |
| HPP | Code on NAW’s Hydroweb | Station Name | Latitude | Longitude |
|---|---|---|---|---|
| Marimbondo | 2049070 | HPP Marimbondo | 20°17′34.8″ S | 49°11′50.2″ W |
| Marechal Mascarenhas de Moraes | 2047045 | HPP Mascarenhas de Moraes | 20°17′13.9″ S | 47°03′50.2″ W |
| Porto Colômbia | 2048096 | HPP Porto Colômbia | 20°07′10.2″ S | 48°34′24.9″ W |
| Furnas | 2046027 | HPP Furnas | 20°40′33.6″ S | 46°19′24.5″ W |
| Luiz Carlos Barreto de Carvalho | 2047115 | HPP Luiz Carlos Barreto de Carvalho | 20°09′31.6″ S | 47°16′42.2″ W |
| HPP | The Number of Failures in the Precipitation Series | The Number of Failures in the Reservoir Level Series |
|---|---|---|
| Marimbondo | 530 | 2 |
| Marechal Mascarenhas de Moraes | 8 | 0 |
| Porto Colômbia | 13 | 3 |
| Furnas | 21 | 2 |
| Luiz Carlos Barreto de Carvalho | 30 | 3 |
| HHP | Use | Mean (m3 s−1) | Coefficient of Variation (%) | Minimum (m3 s−1) | Maximum (m3 s−1) |
|---|---|---|---|---|---|
| Furnas | Urban human | 4.39 | 10.82 | 3.44 | 5.08 |
| Animal | 2.14 | 5.75 | 1.97 | 2.36 | |
| Irrigation | 4.75 | 82.87 | 0.00 | 18.73 | |
| Total consumptive | 13.15 | 31.48 | 7.28 | 27.92 | |
| Luiz Carlos Barreto de Carvalho | Urban human | 5.10 | 10.73 | 4.00 | 5.88 |
| Animal | 2.58 | 5.97 | 2.38 | 2.86 | |
| Irrigation | 5.39 | 84.23 | 0.00 | 21.89 | |
| Total consumptive | 15.37 | 31.30 | 8.53 | 32.72 | |
| Marechal Mascarenhas de Moraes | Urban human | 4.95 | 10.71 | 3.88 | 5.71 |
| Animal | 2.52 | 6.11 | 2.32 | 2.80 | |
| Irrigation | 5.29 | 84.18 | 0.00 | 21.47 | |
| Total consumptive | 14.96 | 31.50 | 8.32 | 31.97 | |
| Marimbondo | Urban human | 18.73 | 11.59 | 14.65 | 22.12 |
| Industry | 13.30 | 37.90 | 4.55 | 18.88 | |
| Irrigation | 20.87 | 83.93 | 0.00 | 61.94 | |
| Total consumptive | 63.62 | 31.84 | 30.95 | 109.00 | |
| Porto Colômbia | Urban human | 7.63 | 10.96 | 5.93 | 8.86 |
| Industry | 4.87 | 41.71 | 1.39 | 7.02 | |
| Irrigation | 8.86 | 83.42 | 0.00 | 30.60 | |
| Total consumptive | 25.34 | 34.17 | 11.81 | 50.01 |
| HHP | Mean (m/Month) | Coefficient of Variation (%) | Minimum (m/Month) | Maximum (m/Month) |
|---|---|---|---|---|
| Furnas | 762.07 | 0.60 | 752.37 | 767.90 |
| Luiz Carlos Barreto de Carvalho | 620.32 | 0.08 | 618.81 | 621.45 |
| Marechal Mascarenhas de Moraes | 663.25 | 0.43 | 655.21 | 665.99 |
| Marimbondo | 439.07 | 1.14 | 428.09 | 445.45 |
| Porto Colômbia | 466.36 | 0.05 | 465.80 | 467.00 |
| HHP | Mean (mm/Month) | Coefficient of Variation (%) | Minimum (mm/Month) | Maximum (mm/Month) |
|---|---|---|---|---|
| Furnas | 110.06 | 95.35 | 0.00 | 545.30 |
| Luiz Carlos Barreto de Carvalho | 123.35 | 96.03 | 0.00 | 588.20 |
| Marechal Mascarenhas de Moraes | 131.68 | 93.14 | 0.00 | 654.10 |
| Marimbondo | 113.45 | 96.83 | 0.00 | 512.50 |
| Porto Colômbia | 119.26 | 99.71 | 0.00 | 643.90 |
| HHP | Data | S | Z | p (No Trend) | Trend |
|---|---|---|---|---|---|
| Furnas (accumulation) | Precipitation | −1381 | 0.69 | 0.49 | No trend |
| Reservoir level | −12,547 | 6.26 | 3.74 × 10⁻¹⁰ | Decreasing | |
| Urban human use | 53,674 | 26.80 | 0.00 | Increasing | |
| Animal watering use | 20,865 | 10.42 | 0.00 | Increasing | |
| Irrigation use | 8166 | 4.08 | 4.56 × 10⁻⁵ | Increasing | |
| Total consumptive use | 14,965 | 7.47 | 0.00 | Increasing | |
| Luiz Carlos Barreto de Carvalho (run-of-river) | Precipitation | −1302 | 0.65 | 0.52 | No trend |
| Reservoir level | 13,252 | 6.62 | 0.00 | Increasing | |
| Urban human use | 53,662 | 26.79 | 0.00 | Increasing | |
| Animal use | 17,981 | 8.98 | 0.00 | Increasing | |
| Irrigation use | 9504 | 4.75 | 2.09 × 10⁻⁶ | Increasing | |
| Total consumptive use | 16,461 | 8.22 | 0.00 | Increasing | |
| Marimbondo (accumulation) | Precipitation | 221 | 0.11 | 0.91 | No trend |
| Reservoir level | −6902 | 3.45 | 5.69 × 10⁻⁴ | Decreasing | |
| Urban human use | 54,285 | 27.11 | 0.00 | Increasing | |
| Industry use | 41,685 | 20.81 | 0.00 | Increasing | |
| Irrigation use | 9375 | 4.68 | 2.86 × 10⁻⁶ | Increasing | |
| Total consumptive use | 21,317 | 10.64 | 0.00 | Increasing | |
| Marechal Mascarenhas de Moraes (accumulation) | Precipitation | −867 | 0.43 | 0.67 | No trend |
| Reservoir level | −24,343 | 12.16 | 0.00 | Decreasing | |
| Urban human use | 53,700 | 26.80 | 0.00 | Increasing | |
| Industry use | 19,047 | 9.51 | 0.00 | Increasing | |
| Irrigation use | 9416 | 4.70 | 2.59 × 10⁻⁶ | Increasing | |
| Total consumptive use | 16,231 | 8.10 | 0.00 | Increasing | |
| Porto Colômbia (run-of-river) | Precipitation | −1305 | 0.65 | 0.51 | No trend |
| Reservoir level | 9559 | 4.77 | 1.81 × 10⁻⁶ | Increasing | |
| Urban human use | 53,799 | 26.86 | 0.00 | Increasing | |
| Industry use | 47,644 | 23.79 | 0.00 | Increasing | |
| Irrigation use | 12,225 | 6.10 | 1.04 × 10⁻⁹ | Increasing | |
| Total consumptive use | 23,766 | 11.87 | 0.00 | Increasing |
Publisher’s Note: MDPI stays neutral with regard to jurisdictional claims in published maps and institutional affiliations. |
© 2022 by the authors. Licensee MDPI, Basel, Switzerland. This article is an open access article distributed under the terms and conditions of the Creative Commons Attribution (CC BY) license (https://creativecommons.org/licenses/by/4.0/).
Share and Cite
da Luz, M.P.; Lins da Silva, J.; Higuera-Castro, E.L.; Ribeiro, L.F. Water Availability Assessment from Power Generation Reservoirs in the Rio Grande Operated by Furnas, Brazil. Energies 2022, 15, 8950. https://doi.org/10.3390/en15238950
da Luz MP, Lins da Silva J, Higuera-Castro EL, Ribeiro LF. Water Availability Assessment from Power Generation Reservoirs in the Rio Grande Operated by Furnas, Brazil. Energies. 2022; 15(23):8950. https://doi.org/10.3390/en15238950
Chicago/Turabian Styleda Luz, Marta Pereira, Jefferson Lins da Silva, Edna Lizeth Higuera-Castro, and Luciano Ferreira Ribeiro. 2022. "Water Availability Assessment from Power Generation Reservoirs in the Rio Grande Operated by Furnas, Brazil" Energies 15, no. 23: 8950. https://doi.org/10.3390/en15238950