
Optimization of Steam Distribution Mode for Turbine Units Based on Governing Valve Characteristic Modeling
1
School of Intelligent Manufacturing, Nanjing Polytechnic Institute, Nanjing 210048, China
2
Key Laboratory of Energy Thermal Conversion and Control of Ministry of Education, Southeast University, Nanjing 210096, China
*
Author to whom correspondence should be addressed.
Energies 2022, 15(23), 9139; https://doi.org/10.3390/en15239139
Submission received: 11 November 2022
/
Revised: 28 November 2022
/
Accepted: 29 November 2022
/
Published: 2 December 2022
(This article belongs to the Special Issue Advances in Low Carbon and Artificial Intelligence in Power Energy System)
Abstract
:With the extensive application of renewable energy generation, thermal power units are required to participate in peak-regulating operations. The mode of steam distribution significantly influences the economy when the steam turbine operates at a low load. The turbine unit’s governing valve characteristics and steam distribution modes are studied in this paper, and the optimal sliding pressure operation curve is derived. Firstly, the theoretical model of the governing stage and the governing valve is derived, and the reliability is verified with field data. Secondly, the overall simulation model of the turbine unit is established, and the turbine off-design performance is analyzed with variable main steam pressure. Finally, the advantages and disadvantages of the three steam distribution modes are discussed thoroughly. The steam distribution modes and optimal main steam pressures are analyzed. The results show that a precise composite sliding pressure operation scheme is recommended, and a sliding pressure operation mode is adopted under 470 MW and constant pressure operation for others.
1. Introduction
With the development of wind, hydropower and nuclear power, coal-fired units are beginning to be assigned more peaking to meet the scheduling requirements of the grid [1,2,3,4,5]. It has become routine for turbine units to operate under off-design conditions, which significantly affects the economics of the units [6,7]. To improve the economy and make the industry sufficiently competitive, it is necessary to study the characteristics of the units and steam distribution modes and propose optimization solutions [8].
The thermal operation parameters and sliding pressure curves given by steam turbine manufacturers come from the measured data at manufacturing completion. They are often quite different from the actual operating conditions after many years of operation [9,10]. Therefore, using the data obtained from the field tests, optimizing the steam distribution mode of the unit and minimizing the unit’s heat rate is an important direction to improve the economy of the unit. Wang et al. [11] proposed a new scheme to control the steam temperature of a dual-cycle coal-fired generator set, which used the preheater signal correction of the low-temperature reheater to adjust the damper in the pipeline. The results show that the new control scheme improves flexibility and efficiency. Xu et al. [12] analyzed the N2 leakage between HP–IP steam and established an error-analysis mathematical model for the influence of measurement parameter errors on the N2 leakage rate. The main parameters affecting the accuracy of the N2 leakage rate are confirmed as heat reheating temperature and IP turbine exhaust temperature, and N2 leakage is the main factor affecting IP efficiency. Tanuma and Tominaga [13] used three-dimensional and unsteady computational fluid dynamics and measurements to study the leakage, and gave technical explanations for steam-turbine-sealing designs that reduce leakages and minimize the negative impact of leakages on the performance and operation of steam turbines. Liu et al. [14] analyzed the operation domains and energy consumption characteristics of three typical heating modes and provided theoretical guidance and a basis for the operation of the CHP unit.
As an essential tool to understand the working relationship between equipment and management, mechanism modeling has been increasingly applied to turbine regulation stages. Xu et al. [15] also proposed an operation mode that comprehensively considered valve point and operation load and proposed an optimization scheme for steam intake. The optimal sliding pressure curve and operation mode were obtained, and the problem of steam vibration was successfully solved. Yu et al. [16] proposed a hybrid modeling approach based on operational data and first-principle mechanisms for the performance monitoring of control-level systems. The results show that the average relative errors between the simulated and measured values of outlet pressure and outlet temperature of the governing stage are in the range of 1%. Zhang et al. [17] calculated the combined characteristic curves of the regulating valve and regulating stage for the nozzle steam distribution turbine and established the theoretical calculation model. The results show that the combined characteristic model of the governing valve and the governing stage can accurately reflect the characteristics of the field governing valve. Based on the dimensional analysis, Xu et al. [18] established the mathematical model of the condition variation of the three-stage heater, and then, combined with the derivation of the heat transfer coefficient of the cooling section, put forward the operation characteristic model of the heater at low liquid level. The results show that this study can provide suggestions for adjusting liquid levels in real operations. Thermal power plants have had to make many improvements to satisfy the challenges of peak regulation demand and renewable power. Wang et al. [19] proposed a new method of the gas-turbine interstage extraction to improve the peak regulation performance of the gas turbine, where the cycle-based heating and the power system were combined. Tani [20] presented several points of improvement with regard to the upcoming expansion of renewable energy use, including dealing with load fluctuations.
Advanced Process Simulation (APROS) [21] software can accurately simulate the behavior of real power plants and has all the features required for the dynamic simulation of thermal power generation. Xu et al. [22] calculated the thermodynamics of the nozzle governance stage and verified it by comparing with the experimental table data. A thermodynamic calculation method for the nozzle governing stage is presented. Compared with the results calculated by APROS, the changes in pressure ratio and reactivity are discussed further to improve the accuracy of the existing thermodynamic calculations. Zhang et al. [23] developed a full-condition simulation model of a steam turbine system for a 600 MW generator set. The results show that the model successfully predicts the operating parameters under different loads and the thermal performance of typical equipment failures. Silde et al. [24] discussed the containment model library of the Apros process simulation software. The results show that Apros can be used to analyze containment thermal-hydraulic behavior, including related aspects of engineering safety systems in various containment geometries. Li et al. [25] used Apros to simulate the working performance of the high-temperature thermal energy storage, and used solid graphite for high-temperature flue gas recovery in a gas turbine to study the optimal thermal performance of a high-temperature thermal energy storage system.
By establishing the model of the thermal system of the steam turbine unit, the theoretical calculation model and the valve characteristic curve of the steam-turbine governing valve and governing stage are obtained. The influence of different factors on the economy of the steam turbine unit is analyzed to find the best steam distribution mode. Optimizing the main steam pressure curve is the most effective method to elevate the unit’s economy, improve the unit’s working conditions during peak shaving, and protect the ecological environment.
2. Model and Analysis
2.1. Flow Characteristics of Governing Valve
The flow characteristics of the governing valve play an important role in the flow calculation and the optimization analysis of the steam turbine under variable working conditions. Establishing a simple and reliable mechanical model of the governing valve (GV) is necessary to obtain the corresponding valve opening-steam flow law.
APROS software is used to model the governing valve and governing stage. In the modeling process, the governing valve (CONTROL_VALVE) is used to connect with the basic module of the steam turbine (TURBINE_SECTION), as shown in Figure 1. To match the valve flow characteristics in the APROS model with reality, it is necessary to set the governing valve (CONTROL_VALVE) parameter manually. After setting the parameter VA12_SPECIFIC_CURVE according to the field data, the flow characteristic curve of GV1 is shown in Figure 2. The valve flow characteristic curve agrees with the field data well, which lays a foundation for establishing the theoretical model.
2.2. Theoretical Model of Governing Valve
The primary approach to adjust the steam turbine flow with nozzle steam distribution is to use the digital electro-hydraulic (DEH) control system to adjust the valve flow area. Thus, it can adjust the power generation. The governing valve model is shown in Figure 3.
The governing valve flow G1 is
where β1 is the Pentaiman coefficient of the governing valve, Av is the flow area, ε1 is the pressure ratio between the front and back of the governing valve, X is the valve opening, p0 and are the front and rear pressures of the main valve, is the pressure before the nozzle, v0 is the specific volume and χ is the relative flow coefficient of the governing valve related to its pressure ratio and the opening.
To facilitate the following derivation, β1 and χ are combined as the comprehensive coefficient of the governing valve, and as the ratio of the actual flow to the maximum flow.
After passing through the governing valve, the flow rate G2 of the corresponding nozzle group is
where β2 is the Pentaiman coefficient of the nozzle, An is the nominal flow area of the nozzle, μ is the nozzle flow coefficient, ε2 is the pressure ratio between the front and back of nozzle, p1 is the pressure after the nozzle, p2 is the pressure after the nozzle group and ε3 is the pressure ratio between the front and back of nozzle group. According to the conservation of mass, G1 = G2, substituting Equations (1) and (6), one can get
where the governing valve and the nozzle area are both constant, and the nozzle flow coefficient μ is also constant. The variables in the formula are β1, β2 and χ. Among them, β1 and β2 are the functions of ε1 and ε2, respectively, and χ is the function of governing valve opening X.
Defining , one can obtain . There is a one-to-one correspondence between ε1 and , then the function can be obtained.
The above equation is the integrated flow characteristic of the governing valve.
This study takes a 600 MW power plant unit as the research object, and the structural parameters of the governing valve and governing stage are shown in Table 1. The steam parameters of the unit are subcritical and the design main steam pressure is set to 16.7 MPa.
Using the steam-turbine design data and APROS software, the established governing valve and governing stage model are analyzed under variable working conditions. By changing the parameters, such as the front and rear pressures, the integrated flow coefficient diagram of the governing stage corresponding to Equation (5) is obtained, as shown in Figure 4. The flow characteristic curves of the governing valve corresponding to Equation (11) are shown in Figure 5.
After the theoretical derivation and use of APROS software to obtain the required data for the governing valve, an iterative model can be built. The iterative steps to determine the flow rate through the governing valve and the governing stage, based on any given governing valve opening, are shown below.
Step 1: Given the opening degree X of the governing valve, assuming the pressure after the governing stage is p20, since the pressure p′0 before the governing valve is known, εg can be obtained;
Step 2: After εg is determined, ε1 can be obtained in combination with the opening degree X of the governing valve;
Step 3: After ε1 is determined, according to Figure 6, β1χ is obtained in combination with the opening degree of the governing valve X. The flow through the governing stage can be calculated according to Equation (5) in combination with the maximum theoretical flow of the governing valve;
Step 4: According to Flugel’s formula, the pressure after the adjustment stage is proportional to the flow through the adjustment stage. Then, after the adjustment stage, the pressure p21 can be calculated and compared with the assumed value p20. If the error exceeds the accuracy requirement, go back to Step 1 to restart the iteration. If it is less than the precision requirement, the calculation ends.
After obtaining the theoretical calculation model of the governing valve and governing stage, the theoretical model is calculated and verified with the modeling of the governing valve and governing stage in APROS software. The theoretically calculated flow rate of GV1 at different opening degrees is compared with the actual experimental flow rate on site. The comparison results are shown in Figure 6.
The valve opening and flow characteristic data obtained from the theoretical model are compared with the field test data. It is found that the flow rate is consistent under different governing valve openings. The small error indicates that the obtained theoretical model is reliable. This theoretical model not only verifies the reliability of the governing valve model established based on APROS software, but also provides a more convenient way to calculate the flow rate of the governing valve. It lays the foundation for the following work, such as steam distribution optimization.
2.3. Overall Model of Turbine Unit
Based on the previous model of the governing valve, the whole turbine unit is built with APROS software, as shown in Figure 7, including the governing valve and governing stage, high pressure cylinder, medium pressure cylinder, low pressure cylinder, condenser, high pressure heater, low pressure heater, deaerator, feed pump, and turbine main shaft.
Both pressure and regulation stages are built using the basic turbine module (TURBINE_SECTION). In the governing stage, each turbine module is connected to a valve (CONTROL_VALVE) representing the corresponding governing stage through-flow area controlled by the governing valve. In the pressure stage, the heat recovery extraction divides the high-, medium- and low-pressure cylinders into different stage groups, each represented using a basic turbine module. The simulation of the governing stage and the turbine body is achieved by setting the rated inlet and outlet parameters of the basic turbine module and the valve.
2.4. Steady-State Verification of the Turbine Model
Using APROS software, the turbine model is built and the thermal and structural parameters are set. The model’s reliability is checked by comparing the key thermal parameters of the model using the data obtained from the field tests for different steady-state operating conditions. The main comparisons are VWO for full valve opening, TMCR for maximum continuous operation, THA for heat rate acceptance and 75% vapor extraction, as shown in Table 2. It is found that under different steady-state conditions, the model’s main thermal parameters are in good agreement with the field test data, and the relative error of each parameter is controlled within 2%. According to the American National Standard ISA-S77.20-1993 and ISA77.20, the relative error of each main thermal parameter under different operating conditions should not exceed 2%, and the unit’s reliability under steady-state operating conditions is verified.
2.5. Operation Mode Analysis
The typical steam distribution modes for turbine units include nozzle steam distribution, throttling steam distribution and sliding pressure steam distribution. As deep peak regulation of thermal power units has become routine, the steam distribution modes significantly impact the economics of turbine units. This section first compares and analyzes the advantages and disadvantages of different steam distribution modes, and then quantitatively calculates the heat rate at different main steam pressures using a turbine unit built by APROS software at different loads, and finally determines the optimal steam distribution mode. After the optimized steam distribution mode is obtained, its economic efficiency and environmental advantages are analyzed.
2.5.1. Comparison of Steam Distribution Modes
(1) Nozzle steam distribution. Nozzle steam distribution is one of the standard modes used in turbine units nowadays. The main steam pressure and main steam temperature are kept constant, and the governing valve opening is adjusted sequentially to regulate the flow rate, and thus, the power generation. In the nozzle adjustment, only one governing valve is partially open, and the others are fully open, resulting in minor throttling losses. Therefore, compared to throttling steam distribution, nozzle steam distribution is more economical.
The disadvantage of nozzle steam distribution is that the specific enthalpy drop of the governing stage varies greatly, which makes the temperature change after the governing stage larger. Since the governing gate is opened in turn, the temperature difference between the whole circumference of the turbine is significant, resulting in large thermal stress, which causes a series of problems, such as unit vibration. In addition, at low flow rates, especially when only one governing valve is open, the flow rate through a single governing valve reaches a maximum, and the enthalpy drop at the governing stage also reaches a maximum. The governing stage is operated in dangerous working conditions and is prone to some problems, such as blade damage.
(2) Throttling steam distribution. Throttling steam distribution means the main steam is passed through a set of valves that open and close simultaneously. The flow rate is adjusted by altering the valve’s through-flow area, thereby adjusting the power. When the target power is changed, the flow rate through the governing stage is changed by altering the valve through-flow area, thereby adjusting the power generated.
The advantage of throttling steam distribution is that there is no complex governing valve structure used, as in nozzle steam distribution. It is also cheaper, and the specific enthalpy drop of each stage change is less during the regulation process. The temperature is more stable after the adjustment stage, and the temperature is uniform across the whole circumference of the turbine, which results in less thermal stress, higher safety, and improved adaptability to the load.
The disadvantage of throttling steam distribution is that, as long as the valve is not fully open below the rated load, throttle losses will occur, lowering the economy of throttling steam distribution compared with nozzle steam distribution. Therefore, throttling steam distribution is often used in small auxiliary turbines.
(3) Sliding pressure steam distribution. Sliding pressure steam distribution means the governing valve is fully open, and the power control command is mainly sent down to the boiler side. It changes the main steam pressure by adjusting the combustion, thus altering the main steam flow and adjusting the power generation. Generally, sliding pressure operation has no throttling loss, which is more economical. Sliding pressure operation has less effect on steam-specific enthalpy drop, the temperature change after the governing stage, thermal stress and thermal deformation. Sliding pressure operation mainly includes pure sliding pressure operation, throttling sliding pressure and compound sliding pressure operation in three ways.
The pure sliding pressure operation mode means that the governing valve through-flow area remains constant throughout the load range and the boiler side entirely bears the power adjustment. This turbine and boiler regulation mode makes the main steam pressure and the temperature after the regulation stage not fluctuate drastically, and the safety is higher. However, the overall regulation process relies entirely on the boiler side, and the response time is long, which cannot meet the requirements of the power grid for rapid peak regulation.
The throttling and sliding pressure modes signify that when there is a demand for peak regulation, the turbine side can adjust the governing valve opening quickly to regulate the flow rapidly. Meanwhile, the boiler side adjusts the combustion power, and when the main steam pressure meets the requirements, the governing valve is restored to its original position. The response time of this mode is short, which can meet the requirements of the power grid for rapid peak regulation and is widely used in actual production.
Compound sliding pressure mode refers to the fixed pressure operation under low and high loads and sliding pressure operation under medium loads. This mode of operation combines the advantages of both sliding and constant pressure operation and can respond quickly to peak regulation requirements with good economy and safety in the full load range. This mode of steam distribution is widely used in power plants and is one of the most dominant modes of steam distribution.
Compound sliding pressure steam distribution is widely used, but the main challenge is selecting the range of constant pressure operation and sliding pressure operation, as well as the pressure of constant pressure and sliding pressure. The most common method is to use field tests or theoretical calculations of the heat rate under different loads and sliding pressures to select the most economical way of steam distribution.
2.5.2. Impact of Main Steam Pressure on Unit Economics
Improving the main steam initial parameters and reducing the final parameters can increase the intra-cycle efficiency of the turbine unit. Meanwhile, improving the steam distribution mode can increase the throttling efficiency. APROS software is used to analyze the effect of the initial and final main steam parameters on the thermal economy of the turbine unit and to obtain the corresponding correction curves for heat consumption and power.
Increasing the main steam pressure is one common mode to improve the unit’s efficiency. In addition, in sliding pressure operation, changing the main steam pressure is an effective method to adjust the flow rate and power generation of the unit with constant back pressure. When the main steam pressure increases, the ideal specific enthalpy drop in the unit increases, the circulating thermal efficiency increases, the unit power increases, and the heat consumption is relatively lower.
According to the actual operating conditions, the main steam pressure of the turbine should not be too large. Otherwise, the flow rate and enthalpy drop will be too large, and the final stage will operate in dangerous working conditions, so the maximum value of main steam pressure in the experiment is 17 MPa. Three working conditions of VWO, THA and 75% THA are selected for calculation, and the calculation results are shown in Table 3.
The variation curves of the effect of main steam pressure change on heat rate and power were obtained, as shown in Figure 8. It was found that the heat rate and power of the unit are linearly related to the average main steam pressure. Under the condition that the regulator flow area remains unchanged, the main steam pressure increased, the specific enthalpy drop increased, the unit power increased, and the heat rate decreased. It was also found that the slope of the heat dissipation rate and power versus main steam pressure curve increased with the increase of main steam pressure. The increase indicates that the sensitivity of the heat dissipation rate and power to the main steam pressure increases when the main steam pressure increases, which should be considered in the actual operation of the plant.
3. Optimization Results and Discussion
3.1. Optimization Calculation of Steam Distribution Mode
The optimization analysis of turbine unit steam distribution means that the unit can be operated under variable operating conditions to meet the load requirements of the power grid while achieving optimal economy and reducing the cost of power generation. The optimal steam distribution mode and the optimal initial pressure are determined with the help of the APROS software based on the turbine set model.
In the actual experiments, different load points were selected according to the actual situation, and the main steam pressure and regulator combination were changed to operate at a specific load with sliding pressure. The heat rates at different operating points were compared to determine the most economical way of operating the unit at a particular load.
Under the same load, the main steam pressure corresponds to the opening of the governing valves one by one, so that the heat rate under different governing-valve openings and main steam pressure at the same load of the turbine unit can be obtained, the most economical combination of main steam pressure and governing valve under the same load can be determined, and the overall economic operation curve of the turbine unit can be obtained.
According to the unit design data, it can be seen that, when the unit is running at low load, the economy is poor. When reaching full load or even exceeds the rated load, the unit is mainly operated with nozzle regulation under constant pressure. The operating conditions are close to the rated conditions, so the economy is better. In the high load section below the rated load, if nozzle or throttle steam distribution is used, throttle losses will always be generated, affecting the thermal economy. The thermal economy can be improved if the main steam pressure is operated under a suitable pressure drop and the governing valve is kept fully open or with minimum throttling losses.
The turbine unit model established by APROS software was used to obtain the required thermal parameters and quantitatively calculate the heat rate at each operating point. The heat rate variation curve is shown in Figure 9.
It can be seen that at the same load, the unit’s heat rate varies with the opening of the governing valve and the main steam pressure. At each load, the heat rate at the valve point is significantly lower than at the non-valve point because the governing valve is fully open, and the throttling loss is smaller than that at the non-valve point. The unit is economically optimal at this load.
The heat rate of different main steam pressures at each load in the above graph is integrated. The lowest heat rate at each load is selected to determine the optimal operating conditions of the unit at different loads to determine the steam distribution mode at different operating conditions. When the unit load is 300~480 MW, the heat rate at the second valve point is the lowest, and the optimal working condition point is the second valve point. When the load is 550 MW, the heat rate under different combinations of main steam pressure and valves is shown in Table 4.
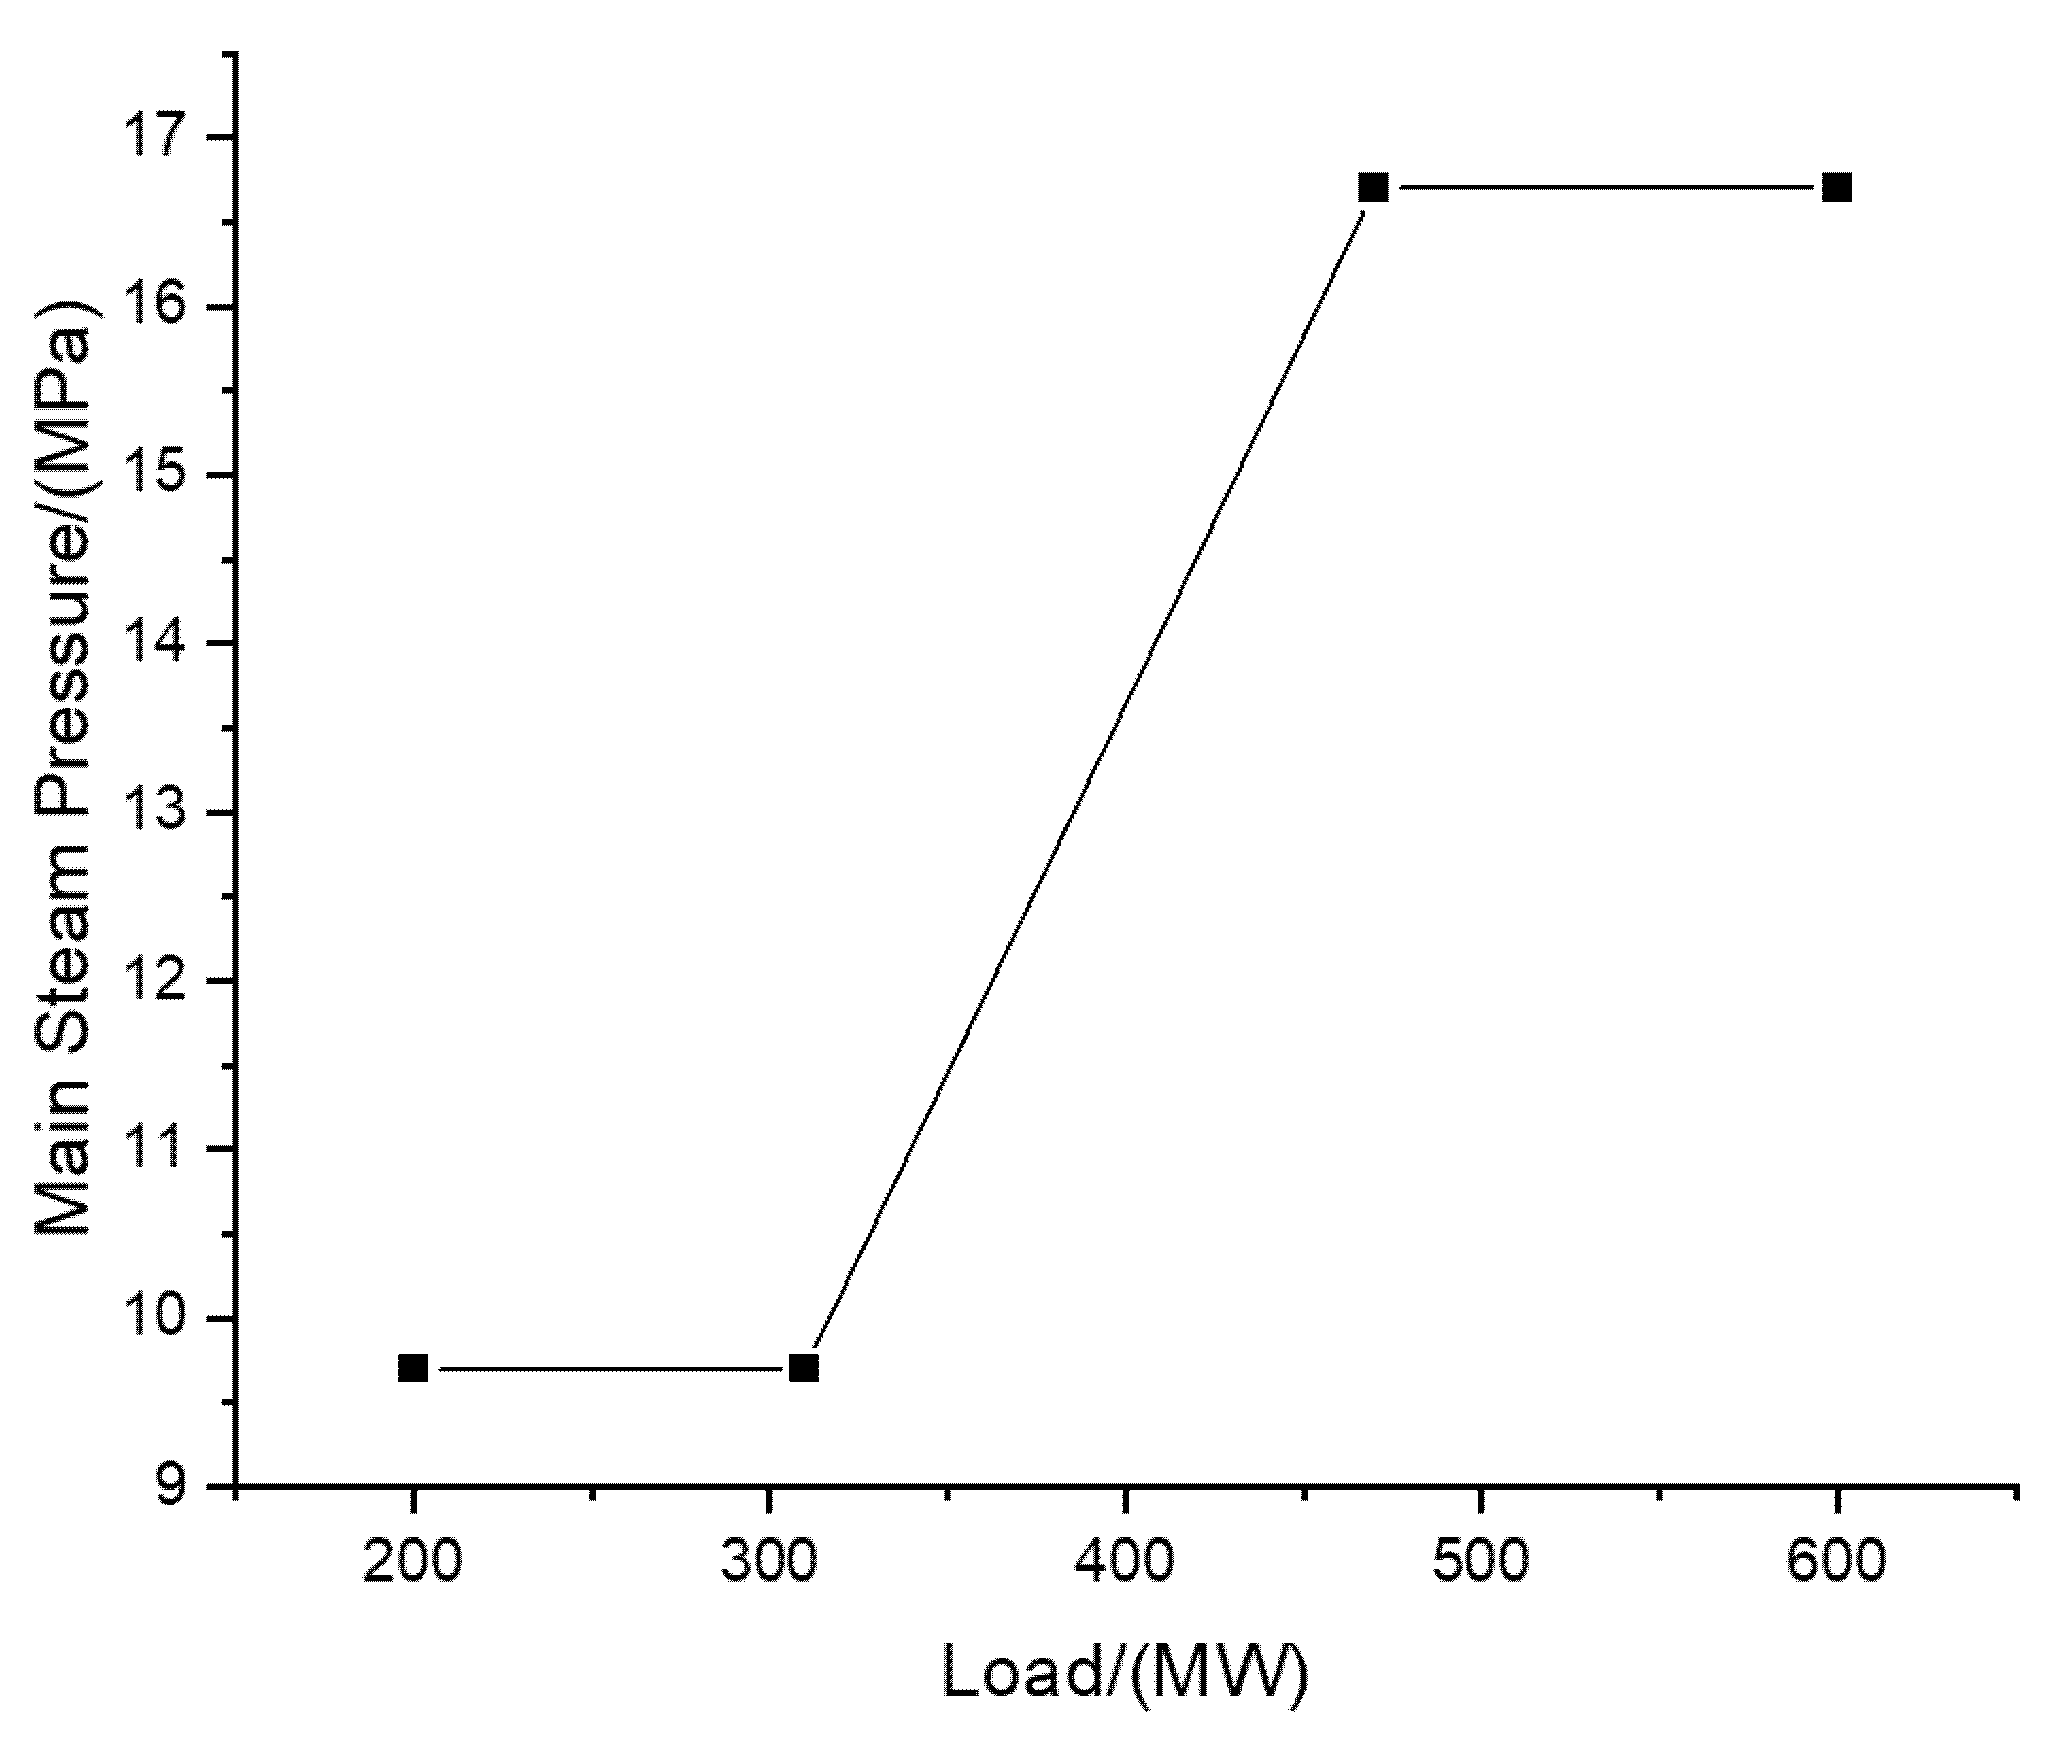
It can be seen that although the heat rate at the second valve point is the lowest, the main steam pressure at this time is far beyond the normal operating range of the unit. Therefore, for the safe operation of the turbine unit, the constant pressure operation mode of two valves fully open and one valve throttling is selected. Therefore, when the main steam pressure reaches 16.7 MPa, the unit maintains constant pressure operation nozzle regulation. The main steam flow is adjusted by adjusting the flow area of the turbine governing valve. At this time, the valve opening condition is two fully open valves and one half open to three fully open, and the load range is 470~600 MW. The operation mode is shown in Table 5. The operating mode is organized into a curve, as shown in Figure 10.
In this experiment, quantitative calculations were performed using the turbine unit model built using APROS software, and the optimized turbine unit operation was obtained. A more accurate compound sliding pressure operation scheme was determined, which provides a reference for the economical operation of the actual production process of the turbine unit.
In the actual operation process on site, the turbine governing valve opening and the main steam pressure at this time can be obtained directly from the load assigned by the power grid, combined with the obtained operation mode curve. The requirements can be met quickly and with high economic efficiency using operation modes such as turbine and boiler coordinated control.
3.2. Economic and Environmental Benefits Analysis
The average annual load of the unit is assumed to be 400 MW. The difference between the heat consumption rate of 16.7 MPa fixed pressure operation and the heat consumption rate of two-valve point sliding pressure operation is calculated as 37.757 kJ/(kWh). The difference in coal consumption rate is calculated as 1.134 g/(kWh). It can be assumed that a year’s actual power generation time is 6000 h. The annual saving of standard coal consumption is 2721.61 t, calculated at 700 yuan/t of standard coal. The economic benefit that can be generated in a year is 1.91 million yuan.
Regarding environmental protection, and concerning the national standard, according to the standard coal carbon emission factor of 0.68, the annual carbon emission is reduced by 1850.69 t, and the carbon dioxide emission is reduced by 6785.85 t. According to the standard coal sulfur content of 1%, the sulfur dioxide emission is reduced by 54.43 t.
4. Conclusions
In this paper, the valve characteristics and overall simulation model of a 600 MW unit are studied, and the optimal steam distribution pattern under variable operating conditions is calculated. The turbine valve characteristics model is established through theoretical derivation, and then modeled through the APROS platform to obtain the simulation model of the target turbine unit. Calculations and analysis of variable working conditions are carried out, and sliding pressures are applied at different load points to quantify the heat rates under different working conditions. The main findings are summarized as follows.
(1) The modeling results of the thermal parameters are compared with the field experiments data, showing good consistency, which verifies the model reliability.
(2) The optimal operating point of the unit under different loads is determined, so as to obtain the steam distribution method of the unit under different operating conditions. When the load of the unit is 300 MW~470 MW, the optimal working condition point is the two-valve point, and the unit is in sliding pressure operation with a main steam pressure range of 9.7 MPa~16.7 MPa.
(3) When the annual average load of the unit is 400 MW, then the annual saving of standard coal consumption is 2721.61 t, and the economic benefit that can be generated in a year is 1.91 million yuan. The carbon dioxide emission is reduced by 6789.85 t, and the sulfur dioxide emission is reduced by 54.43 t.
Author Contributions
Conceptualization, L.Z. and Z.Q.; funding acquisition, L.Z.; investigation and visualization, B.H. and Z.Q.; methodology, S.L.; writing—original draft, Z.Q. and Y.T.; writing—review and editing, L.Z. All authors have read and agreed to the published version of the manuscript.
Funding
This research was funded by 2022 Beidou Scientific Research Program of Nanjing Polytechnic Institute, grant number NJPI-2022-05 and 2022 Qing Lan Project of Jiangsu Province, China.
Data Availability Statement
The data presented in this study are available on request from the corresponding author.
Conflicts of Interest
The authors declare no conflict of interest.
References
- Yang, L.; Zhang, L.; Wang, Y.; Huo, W.; Wang, D. Integrated energy scheduling using wind-storage cascade control strategy in dynamic peak regulation right. Electr. Power Syst. Res. 2022, 212, 108644. [Google Scholar] [CrossRef]
- Du, M.; Niu, Y.; Hu, B.; Zhou, G.; Luo, M.; Qi, X. Frequency regulation analysis of modern power systems using start-stop peak shaving and deep peak shaving under different wind power penetrations. Int. J. Electr. Power Energy Syst. 2021, 125, 106501. [Google Scholar] [CrossRef]
- Huang, K.; Luo, P.; Liu, P.; KIM, J.S.; Wang, Y.; Xu, W.; Li, H.; Gong, Y. Improving complementarity of a hybrid renewable energy system to meet load demand by using hydropower regulation ability. Energy 2022, 248, 123535. [Google Scholar] [CrossRef]
- Wang, P.; Yuan, W.; Su, C.; Wu, Y.; Lu, L.; Yan, D.; Wu, Z. Short-term optimal scheduling of cascade hydropower plants shaving peak load for multiple power grids. Renew. Energy 2022, 184, 68–79. [Google Scholar] [CrossRef]
- Ma, H.; Wang, H.; Yan, Z.; Yu, Q. Evaluating peak-regulation capability for power grid with various energy resources in Chinese urban regions via a pragmatic visualization method. Sustain. Cities Soc. 2022, 80, 103749. [Google Scholar] [CrossRef]
- Zhang, Y.; Liu, P.; Li, Z. Gas turbine off-design behavior modelling and operation windows analysis under different ambient conditions. Energy 2023, 262, 125348. [Google Scholar] [CrossRef]
- Wang, Z.; Duan, L.; Zhang, Z. Thermoeconomic cost analysis on operation strategies of gas turbine combined cycle under off-design conditions. Case Stud. Therm. Eng. 2021, 28, 101617. [Google Scholar] [CrossRef]
- Yazawa, K.; Koh, Y.R.; Shakouri, A. Optimization of thermoelectric topping combined steam turbine cycles for energy economy. Appl. Energy 2013, 109, 1–9. [Google Scholar] [CrossRef]
- Jastrzebska, A.; Hernández, A.M.; Nápoles, G.; Salgueiro, Y.; Vanhoof, K. Measuring wind turbine health using fuzzy-concept-based drifting models. Renew. Energy 2022, 190, 730–740. [Google Scholar] [CrossRef]
- Kiaee, M.; Tousi, A.M. Vector-based deterioration index for gas turbine gas-path prognostics modeling framework. Energy 2022, 216, 119198. [Google Scholar] [CrossRef]
- Wang, C.; Liu, Z.; Fan, M.; Zhao, Y.; Liu, M.; Yan, J. Enhancing the flexibility and efficiency of a double-reheat coal-fired power unit by optimizing the steam temperature control: From simulation to application. Appl. Therm. Eng. 2022, 217, 119240. [Google Scholar] [CrossRef]
- Xu, J.; Li, G.; Li, L.; Zhou, K.; Shi, Y. Thermodynamic model of HP–IP leakage and IP turbine efficiency. Appl. Therm. Eng. 2011, 31, 311–318. [Google Scholar] [CrossRef]
- Tanuma, T.; Tominaga, J. 15–Sealing designs and analyses for steam turbines. In Advances in Steam Turbines for Modern Power Plants, 2nd ed.; Tanuma, T., Ed.; Woodhead Publishing: Sawston, UK, 2022; pp. 359–382. [Google Scholar] [CrossRef]
- Liu, M.; Liu, M.; Chen, W.; Yan, J. Operational flexibility and operation optimization of CHP units supplying electricity and two-pressure steam. Energy 2023, 263, 125988. [Google Scholar] [CrossRef]
- Xu, J.; Ma, L.; Sun, Y.; Cao, Z. Operation optimization mode for nozzle governing steam turbine unit. J. Southeast Univ. Nat. Sci. Ed. 2014, 30, 57–59. [Google Scholar]
- Yu, J.; Liu, P.; Li, Z. Hybrid modelling and digital twin development of a steam turbine governing stage for online performance monitoring. Renew. Sustain. Energy Rev. 2020, 133, 110077. [Google Scholar] [CrossRef]
- Zhang, H.; Xu, J.; Sun, Y.; Huang, X.; Chen, X.; Huangfu, Z.; Zhou, L. Characteristic model of combined governing valve and governing stage and optimization of steam distribution of steam turbine. J. Mech. Eng. 2019, 55, 165–172. (In Chinese) [Google Scholar] [CrossRef] [Green Version]
- Xu, J.; Yang, T.; Sun, Y.; Zhou, K.; Shi, Y. Research on varying condition characteristic of feedwater heater considering liquid level. Appl. Therm. Eng. 2014, 67, 179–189. [Google Scholar] [CrossRef]
- Wang, X.; Duan, L. Peak regulation performance study of the gas turbine combined cycle based combined heating and power system with gas turbine interstage extraction gas method. Energy Convers. Manag. 2022, 269, 116103. [Google Scholar] [CrossRef]
- Tani, A. 9—Steam turbine design for load-following capability and highly efficient partial operation. In Advances in Steam Turbines for Modern Power Plants, 2nd ed.; Tanuma, T., Ed.; Woodhead Publishing: Sawston, UK, 2022; pp. 195–207. [Google Scholar] [CrossRef]
- Sindhya, K.; Ojalehto, V.; Savolainen, J.; Niemistö, H.; Hakanen, J.; Miettinen, K. Coupling dynamic simulation and interactive multiobjective optimization for complex problems: An APROS-NIMBUS case study. Expert Syst. Appl. 2014, 41, 2546–2558. [Google Scholar] [CrossRef]
- Xu, J.; Ma, L.; Sun, Y.; Cao, Z. Research on characteristics of varying conditions for nozzle governing stage based on dimensional analysis. Energy 2014, 65, 590–595. [Google Scholar] [CrossRef]
- Zhang, Y.; Wang, J.; Yang, S.; Gao, W. An all-condition simulation model of the steam turbine system for a 600 MW generation unit. J. Energy Inst. 2018, 91, 279–288. [Google Scholar] [CrossRef]
- Silde, A.; Ylijoki, J.; Ahtinen, E. Containment model library of the Apros process simulation software: An overview of development and validation work. Prog. Nucl. Energ. 2019, 116, 28–45. [Google Scholar] [CrossRef]
- Li, Y.; Zhang, L.; Feng, B. Optimization of thermal performance of high temperature sensible heat thermal energy storage system for direct steam generation: A simulation work. Appl. Therm. Eng. 2022, 217, 119225. [Google Scholar] [CrossRef]
Figure 1.
Governing stage of steam turbine unit.

Figure 2.
Flow percentage variation of the governing valve with its opening. The percentage increases with the increase in the opening. When the opening reaches 60%, the flow percentage maintains a stable state.
Figure 2.
Flow percentage variation of the governing valve with its opening. The percentage increases with the increase in the opening. When the opening reaches 60%, the flow percentage maintains a stable state.
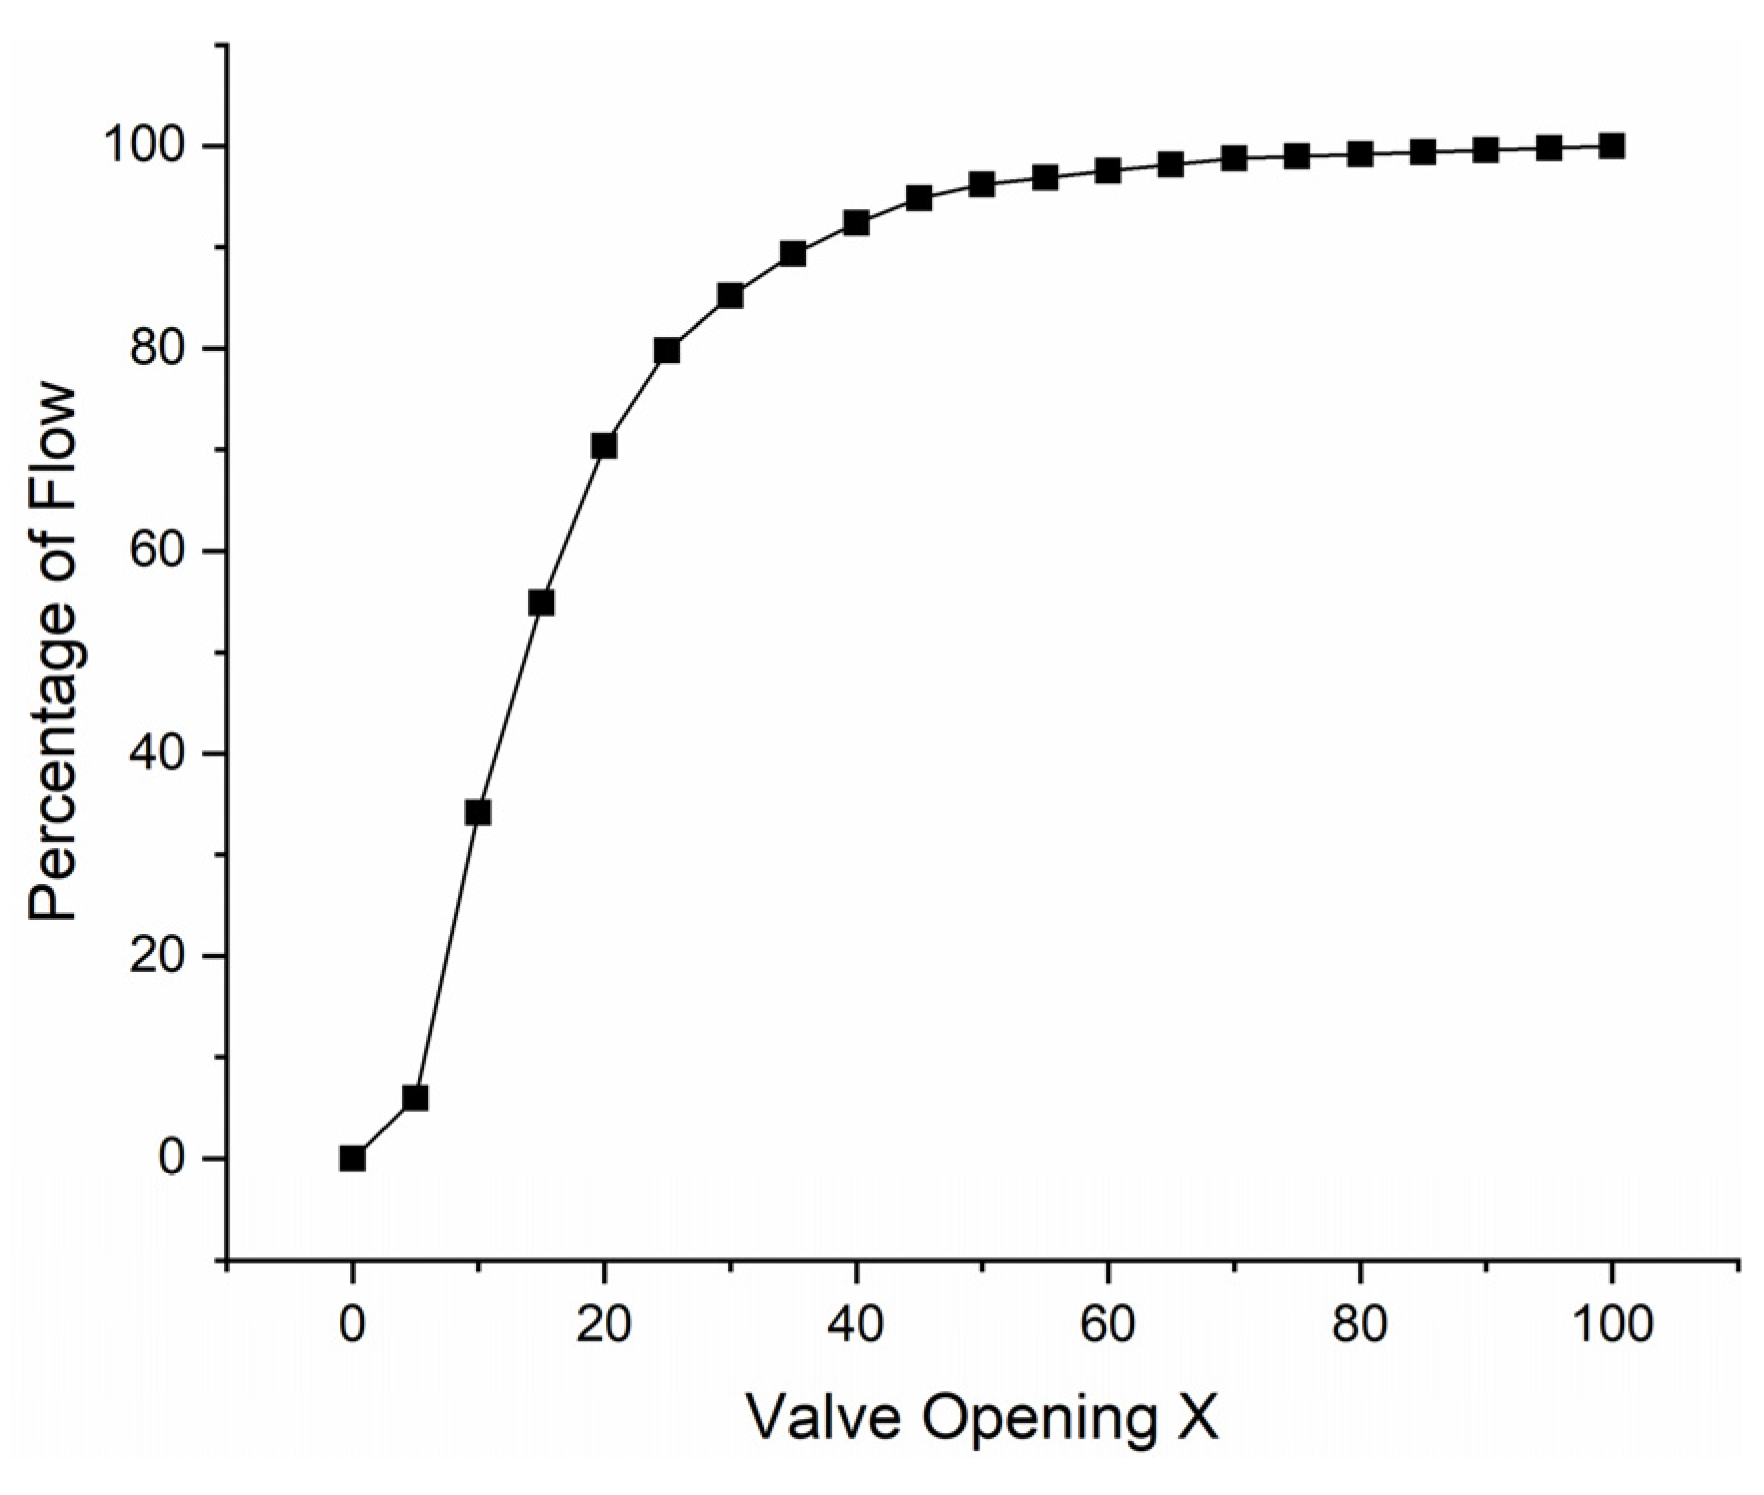
Figure 3.
Schematic diagram of the governing valve.

Figure 4.
Comprehensive flow coefficient curve of governing valve.

Figure 5.
Combined flow characteristic curve of governing valve.
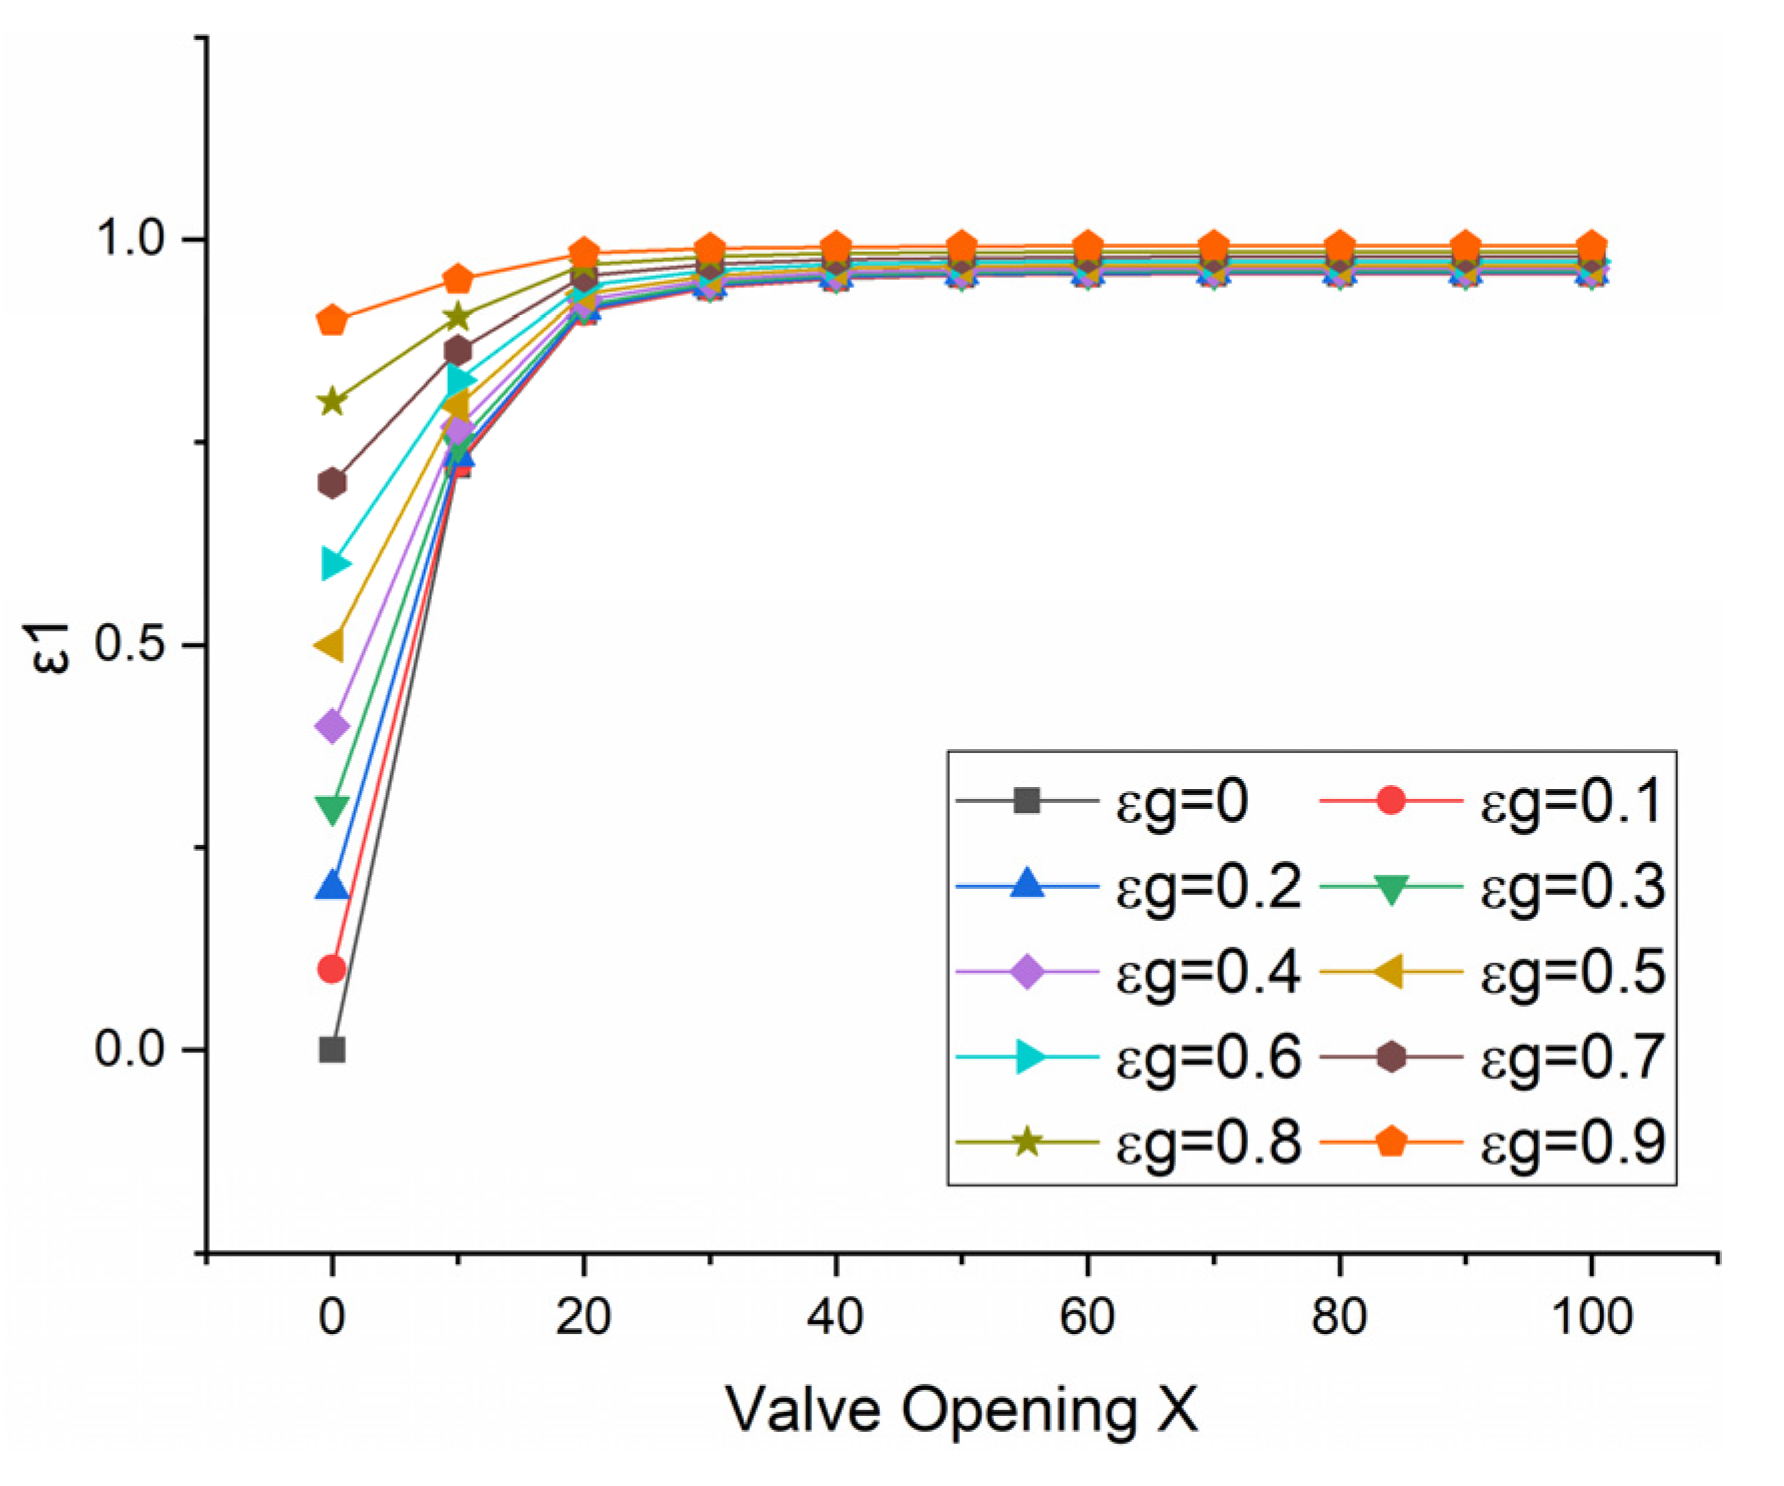
Figure 6.
Comparison between theoretical model and field data.
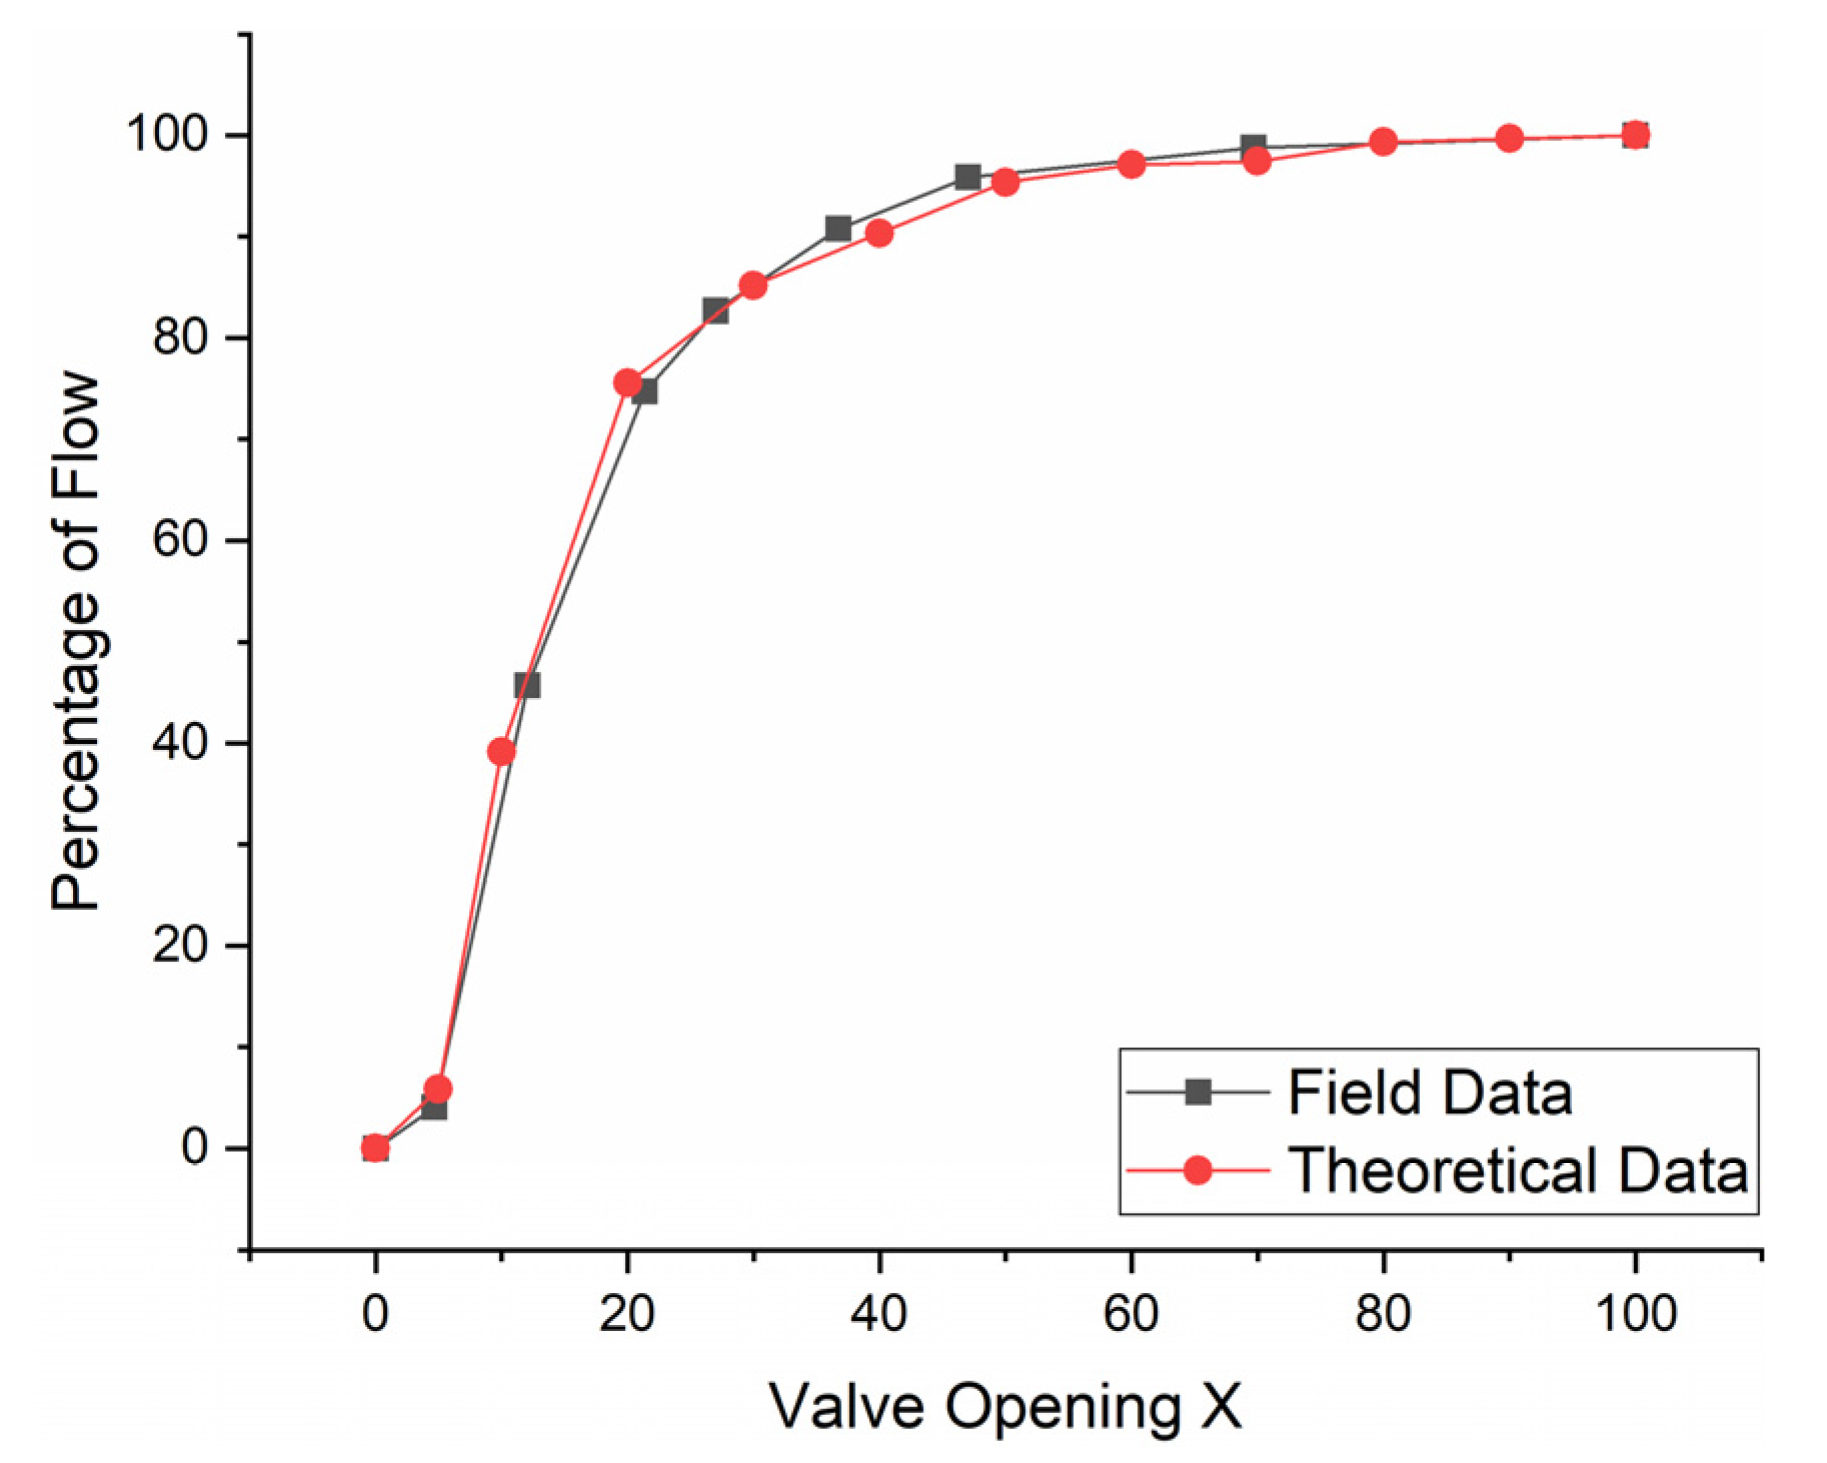
Figure 7.
Schematic diagram of the steam turbine.
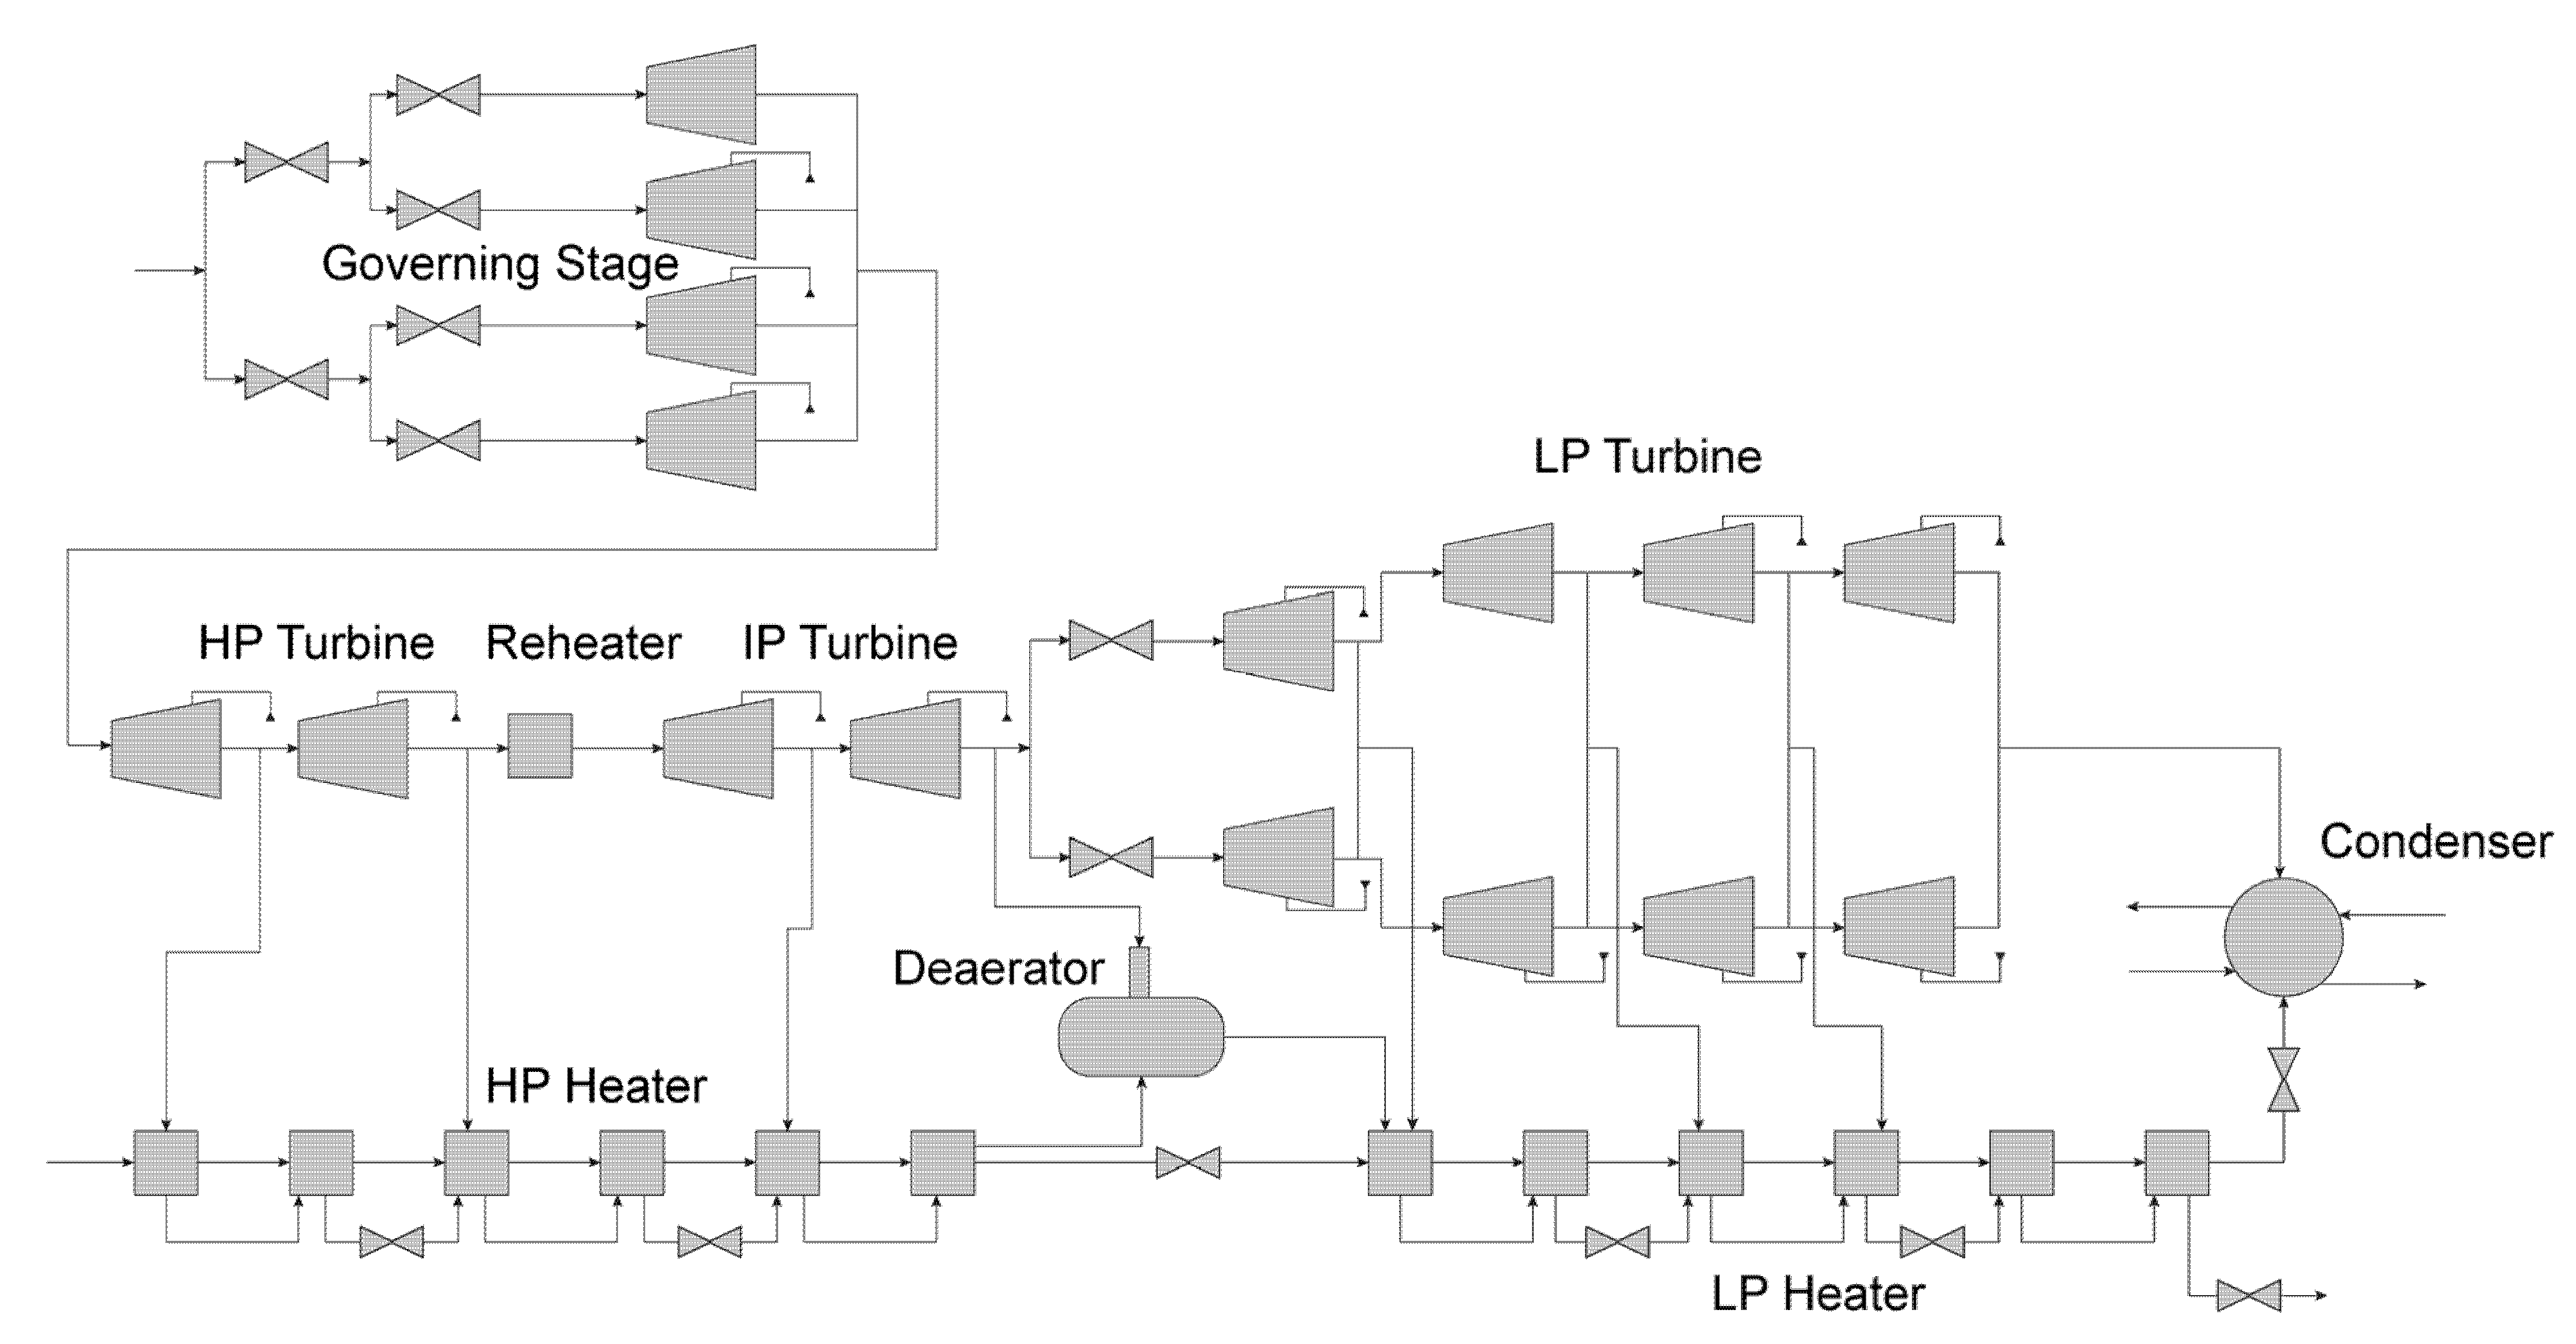
Figure 8.
Main steam pressure vs. heat rate; main steam pressure vs. power.

Figure 9.
Heat rate vs. main steam pressure under different loads.

Figure 10.
Operation mode of steam turbine unit. When the load is between 200 and 310 MW, constant pressure is used. As the load increases from 310 to 470 MW, sliding pressure should be adopted. After reaching 470 MW, constant pressure mode is suitable.
Figure 10.
Operation mode of steam turbine unit. When the load is between 200 and 310 MW, constant pressure is used. As the load increases from 310 to 470 MW, sliding pressure should be adopted. After reaching 470 MW, constant pressure mode is suitable.

Table 1.
Main structural parameters of governing valve and governing stage.
| No. | Nominal Diameter (mm) | Nominal Area (mm2) | Nozzle Number | Nozzle Area (mm2) | Ratio | Cumulative Nozzle Number | Cumulative Nozzle Area (mm2) |
|---|---|---|---|---|---|---|---|
| 1 | 196.85 | 30,434 | 28 | 13,024.2 | 2.337 | 28 | 13,024.2 |
| 2 | 196.85 | 30,434 | 28 | 13,024.2 | 2.337 | 56 | 26,048.4 |
| 3 | 196.85 | 30,434 | 28 | 13,024.2 | 2.337 | 84 | 30,972.6 |
| 4 | 196.85 | 30,434 | 28 | 13,024.2 | 2.337 | 112 | 52,096.8 |
Table 2.
Comparison of main thermal parameters for steady-state working conditions.
| Coefficients | VWO | TMCR | THA | 75% Vapor Extraction | ||||
|---|---|---|---|---|---|---|---|---|
| Field Test Data | Model Date | Field Test Data | Model Date | Field Test Data | Model Date | Field Test Data | Model Date | |
| Power load (MW) | 648.95 | 646.23 | 628.98 | 631.33 | 613.53 | 610.32 | 452.6 | 450.12 |
| Flow rate (kg/s) | 160.16 | 158.90 | 154.01 | 153.94 | 148.39 | 147.96 | 139.36 | 139.091 |
| Cold reheat steam pressure (MPa) | 4.11 | 4.24 | 3.94 | 4.11 | 3.808 | 3.96 | 3.27 | 3.49 |
| Heat reheat steam pressure (MPa) | 3.62 | 3.82 | 3.48 | 3.70 | 3.359 | 3.56 | 3.11 | 3.14 |
| Heat reheat steam temperature (K) | 809 | 811 | 815 | 811 | 818 | 811 | 827 | 811 |
| High pressure heater outlet temperature (K) | 556 | 556 | 554 | 554 | 551 | 552 | 545 | 546 |
| Heat rate (kJ/kWh) | 8212 | 8144.4 | 8230 | 8147 | 8200 | 8157 | 6829 | 6788 |
Table 3.
Effect of different main steam pressure on heat rate and power.
| Main Steam Pressure (MPa) | 15.5 | 15.8 | 16.1 | 16.67 | 17 | |
|---|---|---|---|---|---|---|
| VWO | Heat rate (×106 J/kWh) | 8.39 | 8.32 | 8.32 | 8.19 | 8.08 |
| Power (MW) | 601 | 614 | 623 | 650 | 668 | |
| THA | Heat rate (×106 J/kWh) | 8.51 | 8.44 | 8.39 | 8.27 | 8.22 |
| Power (MW) | 558 | 570 | 582.4 | 607 | 620 | |
| 75%THA | Heat rate (×106 J/kWh) | 9.09 | 9.04 | 8.99 | 8.87 | 8.84 |
| Power (MW) | 416 | 425 | 434 | 453 | 462 |
Table 4.
Heat rate of unit under sliding pressure operation at 550 MW.
| Main Steam Pressure (MPa) | Heat Rate kJ/(kWh) | Valve Status |
|---|---|---|
| 14.55 | 8573 | |
| 15.3 | 8540 | |
| 15.6 | 8518 | Third valve point |
| 15.85 | 8519 | |
| 16.25 | 8517 | |
| 16.86 | 8503 | |
| 18.5 | 8419 | |
| 18.85 | 8395 | Second valve point |
| 19.45 | 8394 | |
| 20.45 | 8391 |
Table 5.
Optimized operation mode of steam turbine unit.
| Load Range (MW) | Main Steam Pressure (MPa) | Valve Status | Operation Mode |
|---|---|---|---|
| 200–310 | 9.7 | two valves fully open | Constant pressure |
| 310–470 | 9.7~16.7 | two valves fully open | Sliding pressure |
| 470–600 | 16.7 | two valves fully open and one valve half open to three valves fully open | Constant pressure |
Publisher’s Note: MDPI stays neutral with regard to jurisdictional claims in published maps and institutional affiliations. |
© 2022 by the authors. Licensee MDPI, Basel, Switzerland. This article is an open access article distributed under the terms and conditions of the Creative Commons Attribution (CC BY) license (https://creativecommons.org/licenses/by/4.0/).
Share and Cite
MDPI and ACS Style
Zhang, L.; Qiao, Z.; Hei, B.; Tang, Y.; Liu, S. Optimization of Steam Distribution Mode for Turbine Units Based on Governing Valve Characteristic Modeling. Energies 2022, 15, 9139. https://doi.org/10.3390/en15239139
AMA Style
Zhang L, Qiao Z, Hei B, Tang Y, Liu S. Optimization of Steam Distribution Mode for Turbine Units Based on Governing Valve Characteristic Modeling. Energies. 2022; 15(23):9139. https://doi.org/10.3390/en15239139
Chicago/Turabian StyleZhang, Lei, Zongliang Qiao, Bingsen Hei, Youfei Tang, and Shasha Liu. 2022. "Optimization of Steam Distribution Mode for Turbine Units Based on Governing Valve Characteristic Modeling" Energies 15, no. 23: 9139. https://doi.org/10.3390/en15239139
Note that from the first issue of 2016, this journal uses article numbers instead of page numbers. See further details here.