

Review on the Experimental Characterization of Fracture in Active Material for Lithium-Ion Batteries


Department of Mechanical and Aerospace Engineering, Politecnico di Torino, Corso Duca degli Abruzzi 24, 10129 Torino, Italy
*
Author to whom correspondence should be addressed.
†
These authors contributed equally to this work.
Energies 2022, 15(23), 9168; https://doi.org/10.3390/en15239168
Submission received: 14 October 2022
/
Revised: 25 November 2022
/
Accepted: 27 November 2022
/
Published: 2 December 2022
(This article belongs to the Special Issue Advanced and Multifunctional Materials for Energy Storage Systems)
Abstract
:Nowadays, lithium-ion batteries are one of the most widespread energy storage systems, being extensively employed in a large variety of applications. A significant effort has been made to develop advanced materials and manufacturing processes with the aim of increasing batteries performance and preserving nominal properties with cycling. Nevertheless, mechanical degradation is still a significant damaging mechanism and the main cause of capacity fade and power loss. Lithium ions are inserted and extracted into the lattice structure of active materials during battery operation, causing the deformation of the crystalline lattice itself. Strain mismatches within the different areas of the active material caused by the inhomogeneous lithium-ions concentration induce mechanical stresses, leading ultimately to fracture, fatigue issues, and performance decay. Therefore, a deep understanding of the fracture mechanics in active materials is needed to meet the rapidly growing demand for next-generation batteries with long-term stability, high safety, excellent performance, and long life cycle. This review aims to analyze the fracture mechanics in the active material microstructure of electrodes due to battery operations from an experimental point of view. The main fracture mechanisms occurring in the common cathode and anode active materials are described, as well as the factors triggering and enhancing fracture. At first, the results obtained by performing microscopy and diffraction analysis in different materials are discussed to provides visual evidence of cracks and their relation with lattice structure. Then, fatigue phenomena due to crack growth as a function of the number of cycles are evaluated to assess the evolution of damage during the life cycle, and the effects of fracture on the battery performance are described. Finally, the literature gaps in the characterization of the fracture behavior of electrode active materials are highlighted to enhance the development of next-generation lithium-ion batteries.
1. Introduction
Lithium-ion batteries (LIBs) are crucial energy storage systems in view of the energy conversion toward renewable energies. Indeed, high energy and reliable storage systems need to be developed as the amount of energy produced with renewables, such as solar, hydropower, wind, and marine is intermittent and cannot be synchronized with request. Furthermore, high-power applications such as electric vehicles ranging from cars to buses and non-road vehicles are quickly gaining a significant portion of the market. LIBs look to be a promising and cross-field solution, as they can achieve high power and energy density, depending on their design and material, being safe, rechargeable, and ultimately recyclable [1,2].
An important drawback of LIBs is the fade of their performance during the life cycle, which ultimately leads to end of life [3,4,5]. The research community is committed to studying solutions to increase the life cycle of the batteries, because a short life cycle means increasing the production rate of LIB. The production of LIBs should be kept as low as possible, as LIBs are made of rare and expensive raw materials, and recycling is still not well established and energy demanding.
The mechanisms behind LIBs degradation are various and dependent on the type of active material of the electrode. However, mechanical stress and the subsequent cracking of the electrode micro-structure is one of the most severe damaging mechanism, and affects almost the entirety of the intercalation and alloy materials used for LIB electrodes.
LIBs consist of a large number of electrode foils stacked or wrapped in series, deposited on a copper (anode) or aluminum (cathode) foil and separated by a polymeric membrane which prevents short circuits and allows lithium-ion movement. Electrode layers are prepared by mixing active material powder, composed of micrometric particles, conductive agents (carbon black, especially for cathodes), and binders, such as polyvinylidene fluoride (PVDF). This slurry is then coated on the respective current collector, dried, and pressed to obtain the desired porosity, later filled by the electrolyte. The electrolyte is a mixture of lithium salt () and solvent polymers, such as ethylene carbonate (EC) and dimethyl carbonate (DMC) [6].
During battery operation, the current flows into the external circuit due to electrochemical reactions involving the insertion and extraction of lithium ions in the active material particles of the respective electrodes. These processes cause the deformation of the active material micro-structure, leading to stress [7,8,9,10,11,12,13]. Furthermore, some materials shows a significant phase change behavior, meaning that the lithium concentration shows a sharp change between the two phases, leading to high mechanical stress.
The mechanical stress has a detrimental effect on the electrode micro-structure, causing the propagation of cracks [14,15], which enhances chemical processes consuming lithium ions, and the detachment of some portions of the active material, making them inactive and leading to progressive capacity fade.
The effect of electrode deformation is observed during cycling by measuring the thickness change of the LIB [16,17]; swelling is detected during charge, and recovered with an equal shrinkage during discharge.
Very few works review the topic of fracture mechanics in the active materials of electrodes [14,18]. Although these works may be useful, this review proposes a different approach based on the analysis of different active materials. According to the authors, the individual analysis of each material is crucial to obtain a clear comprehension of the subject, since each material has different crack-propagation features. The present work aims to provide a comprehensive review of the experimental fracture mechanics in insertion and alloying materials used for electrodes at the microscale. Indeed, observations are the first step to understand the phenomenon, and the basis to build suitable models which can generalize the single observation [19,20]. The review of fracture mechanics in LIBs according to the modelling approach will be the subject of a subsequent paper. Furthermore, the gaps in literature are highlighted to suggest new research developments.
Scanning electron (SEM) and transmission X-ray (TXM) microscopy are used in several works to observe fractures in electrode microstructures of the most popular active materials, as well as their element composition. Furthermore, transmission electron microscopy (TEM) analyses are carried out to study cracks at the atomic level, especially in phase change materials, where the phase boundary is the preferred spot for the nucleation and propagation of cracks. Focused ion beam (FIB) is used as well in some works to mill active material particles and to observe the propagation of cracks within the material.
Finally, pioneering works formulated empiric fatigue laws from fractures observation with the aim of quantifying damage in LIBs.
This work is organized as follows: Section 2 is dedicated to the introduction of mechanics and fracture in electrode active materials, explaining the driving force of fracture during battery operation. The experimental observations of cracks are categorized according to the type of active material in Section 3. Finally, Section 4 deepens the interplay between fracture and battery damage.
2. Mechanics in LIBs and Factors Affecting Crack Propagation
Active materials of LIBs consist of micrometric particles, ranging from 100 to 20 , except for silicon nanostructures. Lithium ions migrate between electrodes of opposite polarity and intercalate/deintercalate within their particles when a current is applied to the external circuit. Lithium intercalation causes the deformation of the lattice structure of the host material relative to the amount of lithium inserted, as explained in Figure 1a. Lithium ions diffuse within the particle during intercalation, causing an inhomogeneous concentration, e.g., the particle surface has a greater concentration compared to the core during intercalation, and vice-versa during extraction.
Then, the inhomogeneous lithium concentration within the particle causes differential deformation of the lattice structure, leading to diffusion-induced stress (DIS) [8,9,10,11,12,13,21]. Furthermore, some materials show a two-phase behavior, i.e., two phases with a different lithium content coexist in the same particle, causing a significant strain mismatch at the interface between them, and thus stress, as illustrated in Figure 1b.
DIS was computed at the particle level with a multi-physics approach [8,11,12,13,21], and it was also measured experimentally at the electrode level [22,23].
Micro-flaws originally present in the active material microstructure give rise to fracture and damage issues when subjected to tensile stress. Fractures propagate in the areas where stress is tensile, then stop when the current is reversed and compressive stress is established. Then, the alternation of charge and discharge cycles causes fatigue phenomena and fracture propagation.
The fracture behavior of electrodes active material is affected both by operation condition (current, voltage, number of cycles) and by geometric factors (size and shape of active material microstructure and initial length of micro-flaws).
The higher the external current, the higher the stress, leading to a more critical fracture behavior. Voltage affects the fracture behavior of some active materials, as explained in Section 3, and fractures grow as a function of the number of cycles.
It was shown that the geometry of the active material microstructure, both in terms of size and shape, affects DIS [12], and ultimately has an impact on the fracture behavior. In particular, it was highlighted that smaller particles or nanostructures are less subjected to fracture, or not subjected at all, as will be demonstrated in Section 3, and the particle shape has an influence on fracture too [24]. The dimensions of the initial flaws directly affect the fracture behavior [15], as well as the mechanical properties of the material. Finally, changes in the material composition, such as doping, can improve the fracture behavior.
3. Experimental Characterization of Fracture Mechanics in the Electrodes Active Materials
3.1. Experimental Techniques
The study of the fracture behavior of the electrode microstructure of LIBs requires dedicated instruments and techniques to describe both mechanical and electrochemical features at the same time [25].
- Scanning electron microscopy (SEM) is the most common technique used to observe the electrode microstructure, e.g., particle morphology and fractures, with a precision up to 10 nm. An electron source is collimated into a beam focused on the sample through a set of lenses. The electrons interact with the matter of the sample and some of them are emitted back. The signal from these electrons is used to create the image [26,27].
- Energy-dispersive X-ray spectroscopy (EDX) has the same working principle as SEM, but it is used to identify the type of elements present in the sample by evaluating the energy of the X-rays emitted by the collision of the electrons beam with the sample [28,29]. The materials present in the samples are identified according to the corresponding peaks in the EDX spectrum. EDX is used to detect the variation in material composition during battery aging, and to identify the solid electrolyte interface (SEI) and the products of other undesired reactions.
- Transmission electron microscopy (TEM) is a technique in which a high energy beam of electrons is transmitted through the sample to create a high resolution image and to perform chemical analysis. The sample has to be very thin (less than 150 nm) in order to have a sufficient amount of transmitted electrons. After the interaction with the sample, the following two types of electrons exist: unscattered (no interaction with the sample) and scattered (they change their trajectory due to the interaction with the sample). In the imaging mode, the objective aperture is inserted in the back focal plane of the objective lens. Then, the signal is magnified and projected onto a phosphor screen or charge-coupled camera to obtain the image. Dark areas of the image correspond to low electron transmission through the sample, while bright areas corresponds to high electron transmission. In the diffraction mode, the electrons from the specimen pass through the electromagnetic objective lens, which focuses all the electrons scattered with the same direction into a single point in the image plane. This allows reconstructing the atomic structure (amorphous, polycrystalline or crystalline) of the material [30,31]. TEM is particularly helpful to study two-phase materials, anomalies in the crystallographic structures, as well as side reactions occurring at the electrode/electrolyte interface.
- In-situ TEM and SEM are innovative instruments that can perform a TEM and SEM analysis while the sample is subjected to an external excitation [32,33]. In the LIBs field, electrodes are observed while electrochemically cycled, enabling the characterization of the crystalline structure, the morphology changes of the active material and the crack evolution in real-time.
- Focused Ion Beam (FIB) is generally used for sample preparation rather than imaging. An ion source (generally gallium ions) is used for cutting the sample with high precision, due to the high energy of the ions. In LIBs research, FIB is used to create cross-sections of active material particles, which can later be observed with SEM, or to prepare lamellas to be analyzed with TEM [34].
- Transmission X-ray microscopy (TXM) is a non-destructively way to provide morphological, chemical and structural information of electrode materials up to 10 nm. X-rays can be scattered, absorbed, and re-emitted based on the interaction with the electrons in the matter. The morphological characteristic of the sample is determined by the intensity, energy, and directions of the transmitted X-rays. Furthermore, the chemical composition of the sample can be identified by operating in the X-ray absorption spectroscopy (XAS) mode, whereby the sample is scanned at different energy levels; when the energy of the emitted X-rays equals the core electron binding energy of the element in the sample, the interaction between X-ray photons and the core electrons is increased, and the element composition is identified. X-rays are characterized by high penetration (up to 10 m) and they are more suitable for inspecting bulk material, compared to SEM and TEM [35].This technique is used to study electrode microstructures, chemical and charge distributions, the mechanisms and dynamics of lithium-ions transportation, and chemo-mechanical degradation [36].
- X-ray diffraction analysis (XRD) is used to determine the structural composition of the material, as well as the change in the crystalline structure. The information on the material structure is extrapolated by detecting the intensities and the scattering angles of the X-rays diffracted by the material [37].
- X-ray photoelectron spectroscopy (XPS) is based on the photoelectronic effect. The sample surface is excited with X-rays causing photoelectrons to be emitted from the surface of the sample. The energy of the emitted photoelectrons is measured by an electron energy analyzer. Then, the elemental composition, chemical state, and electronic state of the elements within the material are determined from the binding energy and the intensity of the photoelectron peak. In contrast to the EDX analysis, which has a typical analysis depth of 1–3 m, XPS has a typical analysis depth of less than 5 nm; thus, it can be used to obtain the compositional analysis of ultra-thin layers and thin sample features [38,39].
3.2. Graphite—Li
Graphite has been extensively used as an anode material since the first LIBs developments due to its relatively low cost, as it is abundant on the earth, low working potential (around 0.2 V average vs. Li/Li), high energy and power density, and relatively long lifecycle. Thus, despite the extensive research effort made in the last few years to find alternative anode materials for high-performance LIBs, graphite is still the most used anode material in commercial LIBs.
The structure of graphite is characterized by a stacking sequence of graphene layers, where carbon atoms are arranged in a hexagonal pattern. Lithium intercalates in the graphite structure occupying the interstitial defects between the graphene planes, as shown in Figure 2.
Cracks in graphite particles are reported in the literature, and the research community is in agreement that the number of cycles and current rate are the main factors affecting the crack growth [40,41,42,43,44] (Figure 3), and that the formation of SEI over the fresh active material surfaces is the ultimate cause of capacity fade. Cracks are observed parallel to the larger external surface, leading the graphite to exfoliate [40,45], as shown in Figure 3c,d.
The EDX analysis revealed the presence of SEI inside the graphite particles, because electrolyte components react with the fresh active material, thereby increasing the SEI growth rate [43,45]. On the other hand, the formation of SEI on the cracks surfaces is supposed to reduce the stress intensity factor, hindering the crack growth. This phenomenon is known as roughness or asperity-induced crack closure, and it is caused by the physical contact of the SEI layers grown on the opposite flanks of the crack [45].
Zhang et al. [46] used element scan analysis (ELSA) to identify the location and composition of the SEI layer. According to Figure 4, ELSA shows peaks in F, O and P elements when SEI is encountered, as it is composed of fluorides (), Li-alkyl carbonates (, from EC/DMC decomposition and electrolytes (). Then, they observed the SEI layer both on the particle surface and at the core, confirming the presence of surface and internal cracks.
The SEI layer on the external surface is between 450 nm and 950 nm, while the internal SEI is in the order of 100 nm. Furthermore, an ELSA analysis carried out in aged electrodes (25–50 cycles) showed that the composition remained unchanged, suggesting that SEI remains stable once formed. Zhang et al. [46] explained the nonlinear capacity fade of graphite according to a three-stage approach: in the first stage, where most of the capacity fade occurs, SEI forms on the particle surfaces and in the internal cracks, causing a severe reduction in lithium; in the second stage, the continuous breaking and repairing of the SEI film depleted the lithium further without increasing the SEI layer; in the last stage, structural degradation of graphite particles decreases the number of lithium sites, and this is the cause of the final capacity reduction.
Sun et al. [47] measured the fracture toughness of a notched layer of graphite electrode with a four-points bending test. The measured fracture toughness was 0.75 MPa in ambient air and increased to 1.42 MPa if the sample was cycled in the electrolyte.
The authors highlight that few works dealt with the observation of fractures in graphite electrodes. As all commercial batteries are graphite-based (with very few exceptions), greater attention should be paid to this topic, with the aim of reducing the mechanical damage of anodes.
3.3. Silicon
Silicon is an attractive anode material for high-performance LIBs, especially because of its high gravimetric capacity ( 4200 mAhg−1) and volumetric capacity ( 9786 mAhcm−3), by far the greatest achievable capacity among all the active materials used in LIBs. Furthermore, the relatively low working potential (around V of average value vs. Li/Li) provides a good balance between the risk of lithium plating and retaining a good open circuit potential. Finally, silicon is the second richest raw material in the earth’s crust, so it can be low cost, besides being environmentally friendly and non-toxic. These reasons make silicon one of the most promising candidates for graphite electrodes [48].
On the other hand, the mechanical deformation caused by the Li-Si alloying process is a significant weak point. Silicon, unlike the other materials presented in this review, hosts lithium ions according to an alloying process, which provides storage for 3.75 lithium ions per silicon atom, causing high levels of mechanical deformation (up to 300%) [49]. High deformation leads to high stress, resulting in cracking and electrode pulverization, disconnection between the electrode and current collector, and continuous consumption of lithium ions because of the continuous formation–breaking–reformation process of the SEI layer [48]. These reasons ultimately cause poor reversible capacity and lifecycle.
Preliminary studies concerning silicon anodes started in the late 1990s and became systematic in the late 2000s [48]. Since then, two strategies have been pursued to mitigate the strong mechanical deformation due to lithiation: composition modification and design of stress-mitigating structures.
Nanostructures have been proposed to mitigate the mechanical deformation due to the alloying process, especially nanowires, thin films and nanoparticles [49]. Interestingly, a critical size below which fracture does not occur has been computed in different nano-structures [50,51]. Nevertheless, nanostructures have drawbacks as well. First, the coulombic efficiency in the first cycle is very poor because many lithium ions are consumed by the SEI formation due to the high surface-to-volume ratio. Furthermore, the manufacturing cost of these types of nano-structures may overcome the advantages in terms of high capacity.
Concerning nanowires, they are characterized by a continuous 1D electronic pathway that facilitates efficient charge transport, as compared to nanoparticles [48]. Furthermore, they can grow directly from the current collector, making binder and conductive agents unnecessary but limiting the lithium flux and current rate as a consequence. Several studies observed an anisotropic expansion during the alloying process, which is greater in the [110] direction, making the cross-section elliptical [52,53]. As a result, intense tensile hoop stress arises along the shorter axis of the ellipse, causing severe crack propagation [54], as confirmed by the SEM images in Figure 5.
The lithiation of thin film electrodes causes strains leading to the curvature of the film, which ultimately leads to surface cracks, resembling the ones occurring in drying media, as shown in Figure 6.
Sethuraman et al. [56] computed the average stress of silicon thin film from the substrate curvature with a Multi-beam Optical Sensor (MOS) during lithiation and delithiation. The results of their in-situ experiments are reported in Figure 7.
It was shown that the average stress becomes elastically compressive during lithiation until 12% of the total capacity, reaching −1.75 GPa. Then, plastic flow occurs until the end of lithiation. Stress is reversed during delithiation and becomes elastically tensile until 75% capacity, reaching 1 GPa, followed by plastic flow. Therefore, delithiation is the critical phase from the fracture point of view, as the electrode is subjected to severe tensile stress.
A particular crack pattern arises on the surface of the silicon thin film as a result of lithiation cycles, as observed with SEM [55,57]. Shi et al. [55] showed that the crack density is a function of the number of cycles, as shown in Figure 6. In addition, Li et al. [57] reported that crack density depends on the thickness of the film as well, and a critical size below which cracks do not propagate exists.
Chew et al. [49] established a finite element model (FEM) to compute deformation and crack propagation in silicon thin film, and found the critical thickness of 100 nm for crack propagation.
Concerning silicon nano-particles, crack growth within the same particle was observed during a single lithiation, as reported in Figure 8a–h [51]. At the end of lithiation, the particle is heavily damaged, and cracks propagating along the [110] direction affect the structural stability considerably. Furthermore, the electron diffraction pattern (EDP) analysis reported in Figure 8i,j shows the phase transformation from crystalline (Si) (Figure 8i), to polycrystalline ( (Figure 8j) due to the lithiation process. Figure 8k explains the anisotropic swelling characteristic of silicon nano-particles, leading to cracks predominantly along the [110] direction [51,58].
Furthermore, it was reported that size has a significant impact on the fracture of silicon nanoparticles, and fractures do not occur below a critical size. For example, Liu et al. [51] showed that the critical size is 150 nm in their case study.
The fracture energy of silicon thin film was measured by Pharr et al. [59] by determining the maximum value of the stress during delithiation. The fracture energy was 8.5 ± 4.3 J/m at a small lithium concentration and ranged between 5.4 ± 2.2 J/m and 6.9 ± 1.9 J/m at a larger concentration. They highlighted that the fracture energy of lithiated silicon is similar to pure silicon (corresponding to a fracture toughness of 1 MPa) and is slightly affected by the lithium concentration.
Hybrid structures such as silicon coated with various types of carbonaceous materials, as well as porous structures, have been considered to mitigate volume deformation and obtain better electrochemical performances [48,60,61,62]. Hybrid structures combine silicon and graphite properties, obtaining great capacity and electrochemical performances while alleviating volume deformation [61,62]. For example, Wetjen et al. [63] cycled a Si-graphite electrode and performed an SEM analysis to assess its morphological changes with cycles. They mainly observed severe changes in the silicon nanoparticles and several electrolyte decomposition products. These morphological changes caused an irreversible expansion of the electrode layer, which stabilizes after 60 cycles. Nevertheless, no sign of fractures was detected.
Carbon coating has been considered to increase the electrochemical performance and to reduce the lithiation-induced strain [58]. The coating consists of a thin layer of amorphous carbon deposited over the external surface of silicon particles or nanowires. The thickness of the coating is in the order of 10–100 nm, depending on the application.
In particular, Casino et al. [64] demonstrated that carbon coating mitigates the capacity fade. They observed that an increased coating thickness reduces the capacity drop, but a thickness greater than 60 nm does not have greater beneficial effects. On the other hand, the greater the coating thickness, the lower the nominal capacity. Consequently, a trade-off should be found to obtain the best performance; Casino et al. showed that a coating thickness of 60 nm guarantees good nominal capacity and capacity fade mitigation, as depicted in Figure 9a.
Li et al. [65] studied fracture in carbon-coated particles by performing a TEM analysis. Interestingly, they correlated the geometric factors (particle diameter and coating thickness) with the presence of fractures. They showed that no fractures occur when the ratio between particle diameter and coating thickness is lower than 3.5, fractures are likely when the ratio is between 3.5 and 7, and fractures always occur when the ratio is greater than 7, as shown in Figure 9b.
Xia et al. [66] coated single-crystal silicon with a stepwise bias-graded hydrogenated amorphous carbon with plasma-enhanced chemical vapor deposition. They prepared different samples with different coating thicknesses and varied numbers of coating layers, to assess the better configuration in terms of mechanical properties. Tensile tests and nanoindentation were performed to evaluate tensile strength and the fracture toughness of the samples. They observed that the sample coated with three 100 nm layers has the best mechanical performances, of 50% greater than crystal silicon. They further observed the fracture occurring both in coated and uncoated samples; however, it is not clear if a significant fracture reduction occurs.
Fractures were observed with TEM in carbon-coated silicon particles in some works [65,67,68]. Xu et al. [68] compared the lithiation of two sets of geometrically similar particles (130– 150 nm), one with a 6 nm carbon coating and the other without coating. Few fractures were obeserved in the coated particles, depicted by the red arrows in Figure 10e,f. On the other hand, a greater number of fractures were observed in the uncoated particles, as confirmed by the red arrows in Figure 10a–c. During the lithiation of the coated particles, the coating thickness increases from 6 nm to 8 nm, because of the strong radial stress due to the silicon core expansion. Then, fractures are triggered in the coating thickness and they further propagate in the silicon core. These factors may explain the reason why fracture occurs in coated particles that are smaller than the critical fracture size, i.e., 150 nm as explained by Liu et al. [51].
Nickel and coatings were also studied in nanowires [69,70], but the effect on fractures is less clear. Similarly to particles, faster diffusion is observed with coating, which may be due to the reduction in the compressive stress according to [70].
In conclusion, the major cause of capacity drop has been identified in the pulverization of the electrode structure caused by the high crack density. Electrode pulverization causes the loss of electrical contact, leading to a greater number of areas that are unable to host lithium ions [71]. Currently, this is a significant disadvantage hindering the application of silicon anode in LIBs.
3.4. Silicon Monoxide-SiO
Silicon monoxide (SiO) is an interesting anodic material which has attracted significant attention recently, especially thanks to its ability to overcome the drawbacks of Si anodes concerning the cycling performance. Indeed, SiO particles experience less mechanical deformation during lithiation/delithiation as compared to Si anodes.
SiO exists as a composite of Si nanodomains embedded in an amorphous matrix, with silicon sub-oxides (, y < 2) formed at the interface. The Si nanodomains react with lithium ions, whereas the amorphous matrix transforms into inactive and phases during the first lithiation process. These inactive phases act as a buffer suppressing the volume change of the Si nanodomains during cycling and, thus, reducing the fracture. However, even undergoes capacity fade over cycling [72].
It is believed that the decay of the electrochemical performances of due to repeated lithium extraction and insertion is strictly related to its microstructural evolution, similarly to what is reported for Si particles [73].
Wang et al. [74] investigated the structural evolution of Si nanodomains in during electrochemical cycling with the X-ray pair distribution function (PDF) with HRTEM. They demonstrated that the initial size of Si nanodomains in the amorphous matrix plays a crucial role in preventing the huge volume expansion and thus the fracture in during electrochemical cycling. It was shown that Si nanodomains with a larger initial size experience a size growth at the first cycles, followed by a size decrease in the following cycles, indicating the pulverization of Si domains due to extended fracture. As a consequence, Wang et al. [74] showed that a critical Si nanodomain size of 4– 6 nm exists, below which fracture does not occur, similarly to that reported for Si nanoparticles in Section 3.3.
The size of the entire particles influence the fracture behavior of as well. Hovington et al. [75] performed in situ and ex situ SEM analyses on particles with different sizes during electrochemical cycling. They showed that smaller particles with a size of less than 2 m do not experience fracture, whereas larger particles fracture, and pulverize when the size is larger than 2 m.
Some researches analyzed the effect of the change in the oxygen content in on the electrochemical performance decay, showing that a higher value of oxygen in results in a lower capacity decay. The beneficial effects of a larger oxygen content were attributed to the higher content of the inactive phase which increases the buffering effect against the stress caused by the volume change during lithium insertion and extraction [76,77,78,79].
These results suggest that further studies are necessary to determine the optimized oxygen content in , as well as to control the overall particle and Si nanodomain sizes in order to balance the electrochemical performance and guarantee long-cycle stability.
3.5. Lihium Titanium Oxide-LTO
Lithium titanium oxide (LTO) is a promising anodic material due to its high thermal stability, safety, high rate, high cyclic stability and long life cycle, although it has some drawbacks, such as the higher cost due to the presence of titanium, the higher potential (and consequent low cell voltage), and lower capacity ( 175 mAhg−1) as compared to graphite. The long life cycle and the high stability originate from the so-called “zero-strain” properties of LTO. Indeed, LTO undergoes negligible volume changes during lithiation/delithiation processes, which helps to avoid structural damage and fracture during cycling [80,81].
3.6. Lithium Manganese Oxide–
Lithium manganese oxide (LMO) is a widespread cathode material because of its non-toxicity, low cost, and because manganese is an abundant raw material. Cell voltage can reach up to 4.2 V, ensuring satisfying power. A low extent of self-heating makes LMO one of the safest commercially available cathode materials. Nevertheless, LMO can show poor cycling stability and capacity fading due to Jahn–Teller transformation, structural fatigue, microcracks, and the dissolution of manganese, which is the result of reactions with the electrolyte [82].
LMO presents two different crystalline structures according to the lithium content, namely cubic and tetragonal. LMO has a cubic structure, as depicted in Figure 11a, in the 4 V plateau according to the reaction in Equation (1a). A homogeneous deformation (about 3%) occurs when passing from the unlithiated configuration () to the lithiated configuration (). Then, a phase change occurs when the material is further lithiated and the stoichiometric index x falls in the range of at the 3 V plateau, according to the reaction in Equation (). In this range, the LMO crystalline structure changes from cubic to tetragonal due to the so-called Jahn–Teller transformation, which causes a 13% expansion along the c direction and a 3% contraction in the a direction, as explained in Figure 11b. The Jahn–Teller transformation is usually avoided by operating above 2.96 V.
Severe cracking is observed when the LMO undergoes Jahn–Teller transformation, and intragranular cracks are observed at the cubic/tetragonal ([100] direction) and tetragonal/tetragonal ([110] direction) grain boundaries, indicated in green and orange in Figure 11b, respectively. Thus, cracks appear oriented along the [100] and [110] directions [83].
McGrogan et al. [84] cycled the LMO electrode above Jahn–Teller transformation and milled the cycled electrode with FIB to study the internal cracking network, as shown in Figure 12a,b. The dense crack network, probably caused by Jahn–Teller transformation, allows the electrolyte to penetrate inside the particle, causing the dissolution of , as will be explained in Section 4.
Some damaging mechanisms are observed in the 4 V plateau range as well, when lithium content is in the range , thus Jahn–Teller transformation does not occur.
- The acid attack at the particle surface causes the dissolution of the electrode in the electrolyte, consuming the electrode material [85].
- Stress corrosion cracks along the [111] direction are observed in the 4 V plateau [83,86], enhanced by the acid generated by electrolyte decomposition, and the crack density along this direction is observed to increase with cycling both with SEM and TEM [84,86,87,88,89]. Furthermore, the opening of new cracks allows the electrolyte to wet new surfaces, accelerating the dissolution [84].
- The instability of the delithiated spinel structure in organic electrolyte solvent at highly charged states (e.g., oxygen loss).
- Dynamic and non-equilibrium conditions establish during discharge at a high current, making some crystals more lithiated than others, especially close to the separator. This makes those areas fall within the region which are then subjected to Jahn-Teller transformation and to the detrimental effects explained earlier.
Some works tried to correlate the capacity fade in LMO with the occurrence of fracture due to cycling. Liu et al. [88] compared the increase in free surfaces created by cracks with capacity loss, observing an interesting correlation. They analyzed different samples subjected to an increasing number of cycles with TXM and SEM (Figure 13), and measured the increase in free surfaces created by cracks with an image processing tool.
They assumed that the increasing crack density contributes to the isolation of some parts of the active material, which are no longer able to host lithium ions.
Zhang et al. [90] compared the capacity fade of traditional LMO with an Al/Co doped version. The Al/Co doped LMO is characterized by lower strain mismatch when lithiated, i.e., 0.8% compared to 6% of the traditional LMO. After 350 cycles, the doped LMO shows no cracks compared to the traditional LMO subjected to the same electrochemical test. Furthermore, a capacity retention of 84% was measured with the doped LMO after 650 cycles compared to 75% of the traditional LMO. This study provides a strong evidence that higher electrode deformation leads to a higher crack density, ultimately affecting capacity retention.
3.7. Lithium Iron Phosphate–
Since the first discovery by Goodenough and coworkers in 1997, (LFP) has attracted great research interest, becoming a promising cathode material because of its long lifespan, safety, non-toxicity and environmental friendliness (cobalt free). Nevertheless, low specific energy and low specific power are the main weak points.
LFP crystallizes in the olivine structure, consisting of octahedra and tetrahedra, as shown in Figure 14a. The octahedra contact each other by sharing corners and forming layers in the planes. The layers are linked together by tetrahedral units. Lithium ions are located in the interstitial voids of the framework, forming continuous linear chains along the c-axis in the alternate planes. In this structure, the most favorable lithium diffusion path is through channels aligned with the b-direction [91], as illustrated in Figure 14b.
LFP is a strong phase-separating material at room temperature, meaning that (Li-poor phase) and (Li-rich phase) are energetically favored to co-exist as separate phases. This behavior is also confirmed by the long plateau in the OCV curve that spans almost the whole SOC window.
A comprehensive description of the phase transformation mechanism in LFP requires visualizing the phases distribution in the single particle with a high spatial (nanometer range) and chemical resolution, which is significantly challenging from the experimental point of view. Nevertheless, the two-phase structure of has been experimentally demonstrated with different technologies [93,94]. Experimental results show that the / phase transition mechanism appears quite different according to (de)lithiation conditions and material characteristics. Indeed, some works observed the movement of the phase boundary along the b-axis and others along the a-axis [95,96,97,98,99], as clarified in Figure 15. Therefore, the phase transition in LFP crystals is complex and still under debate.
Although the crystal framework of LFP remains the same during lithium insertion and extraction, the phase transformation leads to significant and anisotropic changes in the lattice parameters of the crystal. The lattice mismatch between the and phases is in the a-axis, in the b-axis, and in the c-axis [100]. This lattice mismatch at the interface between / phases leads to mismatched strains and stresses, which could give rise to cracks formation and propagation during battery operations and cause gradual damage accumulation and capacity fading. Therefore, the direction of crack propagation in LFP particles is strictly connected to the phase transition process, as verified in some experimental works and reported in [95,97,98,99,101,102].
The experimental results describing the fracture behavior of LFP are summarized in Table 1. Variables such as the LFP particles shape and size, the (de)lithiation method (chemical vs. electrochemical), and the adopted experimental techniques lead to different interpretations regarding the phase transition process, the orientation of the phase boundary interface and the cracking mechanism.
Chen et al. [95] synthesized large plate-like LFP crystals with a size of using the hydrothermal method. Then, particles were chemically delithiated and the / phase evolution was investigated using electron microscopy. In a partially delithiated sample, i.e. with composition , Chen et al. observed stripes of alternating contrast running in the direction of the c-axis and aligned with the bc plane of the crystal, that were sometimes separated by fractures. In addition, two crystalline domains separated by a disordered region were recognized in the high-resolution images taken from a thin region of the particle. The Fourier transform of these two crystalline domains indicated that the alternating stripes extending parallel to the bc planes corresponded to and phases; then, the disordered region was induced by the stress field caused by the lattice parameters mismatch at the / phase boundary interface. Based on the experimental results, it was proposed that the / phase boundary is a well-defined region lying in the bc plane, and the phase transformation proceeds along the a-axis, which causes lattice mismatch along the a-axis and the consequent crack formation in the bc plane.
A similar mechanism, with the phase boundary oriented along the bc plane, was also supported by other experimental observations in ex-situ chemically delithiated LFP particles, as reported in [96,97] and illustrated in Figure 16a–d.
The bc phase boundary assumption, although widely accepted in the literature, has been questioned by some experimental observations performed on LFP particles with a different size and morphology [98,99,101]. Indeed, it was shown that the plane is not always the preferred boundary orientation in LFP single particles; the phase transition mechanism as well as the fracture behavior in LFP material depend both on the particle size and morphology.
Gabrisch et al. [98] observed both and fracture planes in spherical LFP particles of nm size subjected to electrochemical cycling. In contrast, only fracture surfaces parallel to planes were observed in chemically delithiated plate-like LFP crystals with a size of .
Fu et al. [99] performed microscopic SEM and TEM investigations on a commercial LFP electrochemically cycled at moderate rates, namely C, C and 1C. Particles were almost spherical with size of 200– 1000 nm, as shown in Figure 17a. Fu et al. used TEM imaging and diffraction techniques to determine the cracking planes. They showed that fracture occurs along the planes, indicating that the / phase boundary is located along the plane and it moves along the b-axis. Figure 17b–f shows some results obtained for fully discharged LFP samples after 50 cycles. The selected area electron diffraction (SAED) pattern in Figure 17b,c was taken from the crack region and verifies the presence of and phases, which are recognized by misaligned diffraction points (Figure 17c) because of the different lattice parameters. The scanning TEM-High-angle annular dark-field (STEM-HAADF) image in Figure 17d also verifies that and phases (identified by different spacing reported in Figure 17e,f) are separated by the crack which is oriented along the plane.
Similarly, Wang et al. [101] performed electron microscope analyses using TEM and SEM on a cycled LFP cathode composed of almost spherical particles with sizes raging from 300 to 600 nm. Their results showed the formation of through-cracks within the LFP particles during cycling. Authors attributed the fracture to the strain misfit induced at the / phase boundary interface, which was supposed to lie in the plane and move along the b-axis.
Yu et al. [97] combined X-ray ptychographic microscopy with XAS and electron microscopy to analyze phase transition and fracture behavior in plate-like single LFP particles of micrometric, submicrometric, and nanometric size. The authors found that phase transition occurred in all partially delithiated particles, independently of their size. However, lattice mismatch led only to the fracture of micrometric and submicrometric particles. On the contrary, mechanical damage was not observed in nanoplates. This seems to be also consistent with the fact that the number of potential dislocation and defect sources for crack propagation decreases with the decrease in the particle size, as reported in [98].
Fracture is also influenced by the lithium extraction and insertion rate since the number of cracks and the dislocation density appears lower at lower rates, as reported in [98,99].
The correlation between phases distribution due to lithium diffusion and the pattern of fracture was reported in [96,97,102]. It was observed that the penetration of delithiated domains within micrometric plate-like particles follows the fracture pattern. Significant delithiation was found to occur on both sides of each crack, as illustrated in Figure 18a,b.
This indicates that new unreacted regions are exposed to the surface, as fresh cracks develop during delithiation. Then, new pathways for penetration of the oxidizing solution to the interior are created, making the delithiation more rapid along the plane of the crack.
Moreover, Fu et al. [99] demonstrated that plane cracking is more detrimental to the cyclic performance as compared to the plane. Indeed, plane cracks are perpendicular to the lithium migration directions and generate inactive segments due to the cutoff of the lithium-ions migration pathway, leading to worse performance decay.
Although several experimental studies were carried out correlating the fracture behavior of LFP particles with the phase transition mechanism, several questions are still unresolved. Few studies explain the effect of cracks propagation on performance decay during battery operations, i.e., capacity fading and impedance growth. Generally, the capacity loss during cycling is mostly attributed to the active material disconnection from the conducting network due to cracking; thus, particles are no longer able to intercalate ions and transport electrons [101]. However, this has not been accurately proven by experiments.
In addition, cracking in LFP particles can also give rise to undesirable side reactions on newly created surfaces exposed to the electrolyte. For example, Gordon et al. [103] observed the extension of a Fe-deficient amorphous layer into the cracks formed during cycling with TEM. Furthermore, it is believed that the SEI layer can form on newly cracked surfaces. The SEI formation consumes lithium ions and its presence slows the intercalation rate of lithium ions, which have to diffuse within the SEI layer before reaching the particle.
Nevertheless, the occurrence of side reactions and the evaluation of their effects on the decay of the battery performances are not clear, thus further experimental studies are needed. Additionally, an accurate relation between crack propagation and capacity fading has not been established yet. Finally, although several works have been carried out both from the experimental and modeling points of view to clarify the propagation of the phase boundary in LFP particles during cycling, an experimental characterization of cracks evolution over time does not exist.
3.8. Lithium Nickel Manganese Cobalt Oxide-
Lithium nickel manganese cobalt oxide (NMC) was first commercialized in 2004 and it exploits the properties of nickel, manganese and cobalt mixed together to create a new-generation material, characterized by a good specific power, life span, safety, and excellent specific energy, despite the high-cost [104]. Nickel, manganese and cobalt are mixed in different quantities. The first commercialized NMC was characterized by 30% nickel, 30% manganese and 30% cobalt (NMC333). The rate of cobalt has been reduced over the years, and currently, nickel-rich cathodes, such as (NMC811), are attracting increasing attention.
NMC is a layered transition metal oxide and consists of small crystals with mostly random orientation (primary particles), densely packed into micron-size particles (secondary particles), as depicted in Figure 19a,b.
This structural arrangement improves the energy density and decreases cathode-electrolyte side reactions as compared to other cathode materials. However, NMC secondary and primary particles experience fracture during battery operations, which is recognized as one of the most significant degradation mechanisms [107].
Cracks can be divided into the following two main categories based on their physical location: intragranular and intergranular cracks. Intragranular cracks occur within the primary particles, whereas intergranular cracks propagate between the primary particles, usually along grain boundaries. Figure 19c,d show the typical features of intergranular and intragranular cracks in NMC particles, respectively. Intragranular cracks are the straight lines within the primary particles and are indicated by the green arrows in Figure 19c, whereas intergranular crack is indicated by the yellow arrows in Figure 19d and grows across several primary particles. Intragranular cracks are smaller, about 10– nm, and denser than intergranular cracks.
Experimental studies performed on electrochemically cycled NMC cathodes indicate that intragranular cracks have two common features [108,109,110]:
- Cracks are predominantly parallel to (003) planes in the layered structure, as shown in Figure 20a,b, where the red arrows mark the cracks.
- The rock-salt phase appears on the crack surface, as shown in Figure 20c,d where the gray arrows mark the direction parallel to the (003) planes, yellow arrows mark the cracks and blue arrows mark the rock-salt phase at the crack periphery. The presence of the rock-salt phase near the crack is recognizable because it appears brighter compared to the layered NMC structure.
Intragranular cracks are classified into classic and premature cracks according to their generation mechanism and morphology.
Classic cracks, indicated by the yellow arrows in Figure 21a,c, have two-crack surfaces running parallel to the crack direction along the (003) planes, i.e., the layers of the transition metal (TM) structure. In addition, the crack tip is clearly recognizable and marked with a yellow circle in Figure 21a.
On the contrary, premature cracks, indicated by the light blue arrows in Figure 21a,c, appear as dark strips parallel to the (003) planes and are randomly distributed, with various spacing among the strips. Figure 21b shows the HAADF image of the premature crack represented in Figure 21a, indicating that the width of the premature crack is about nm, which is higher than the (003) plane spacing of the NMC layered structure, i.e., nm. Consequently, premature cracks are formed by the parallel splitting of two adjacent TM layers. This is the reason why intragranular cracks are predominantly parallel to the (003) planes in the layered structure. In addition, premature cracks are not empty but they contain a rock-salt structure appearing as black dots highlighted by the pink arrow in the annular bright-field (ABF) image shown in Figure 21d.
Several works investigated the origin and propagation of intragranular cracks in NMC particles with different compositions, proposing different mechanisms.
Yan et al. [108] proposed a crack development model, which describes in detail the stages of formation and propagation of intragranular cracks, as illustrated in Figure 22a. They used advanced STEM on cycled (NMC333) and proposed a dislocation-based crack incubation mechanism, with intragranular cracks characteristically initiating from the grain interior. They observed a high density of dislocations in both pristine and cycled samples, and proposed that the dislocation core acts as a nucleation site for crack incubation, with the premature cracks nucleating first at the dislocation core, as shown in Figure 22b–e. Moreover, they also noticed that some premature cracks, developed within NMC333 primary particles, are spatially connected to the classic cracks, as illustrated in Figure 21c. As a consequence, premature cracks first nucleate at the dislocations core; then, they further develop into classic cracks with the two surfaces parallel to (003) planes. Similarly, the development of an intragranular crack in NMC811 proposed by Li et al. [111] consists of three stages, as shown in Figure 23a.
The first stage is the so-called lattice distortion stage and it occurs during the first cycle of the battery. This stage is characterized by the formation of a lattice distortion region appearing as white lines in the NMC primary particles, which are absent in the fresh material, meaning that they are induced by electrochemical cycling. The white lines are clearly visible in the STEM-HAADF images with low magnification, appearing particularly brighter than the surrounding areas and parallel to the (003) planes, as depicted in Figure 23b–e. In addition, Figure 23g shows that the distance between (003) planes in the white lines region is larger than the one in the bulk material. The brighter contrast and the increase in the distance between (003) planes are attributed to the distortion of the lattice structure due to the formation of the transition rock-salt phase, which is illustrated in Figure 23f,h. As a consequence, a tensile strain state, measured with geometric phase analysis (GPA), is induced in the rock-salt phase region and a compressive strain in other regions surrounding the rock-salt phase region, as shown in Figure 23i. The tensile strain continues to distort the lattice structure during the subsequent cycling.
Once the induced stress in the deformed region exceeds the tensile limit of the transformed structure, premature cracks arise. This is considered the second stage of intragranular crack development and it is illustrated in Figure 23j–l.
As already highlighted by Yan et al. [108], these premature cracks can eventually propagate along the (003) plane direction with further cycling of the battery, and develop into classic cracks, which correspond to the third stage of intragranular crack development, as shown in Figure 23m–o.
It was found that intragranular cracking is mainly induced by the distortion and breakdown of the crystalline lattice, which occur due to the following factors:
Nevertheless, the causes for intragranular cracks, as well as the description of the intragranular cracking mechanism, are not completely clear and further experimental studies are required to properly comprehend the phenomenon.
Some experimental studies have been performed to characterize the morphology and the mechanism of the nucleation and evolution of intergranular cracking in NMC secondary particles. The following features have been frequently observed [115]:
- Cracks start to nucleate at the core region of secondary particles and develop towards outer surfaces upon cycling.
- Cracks propagate along primary particles boundaries.
- Inactive layer forms on the primary particle surface.
It is generally assumed that intergranular cracks are induced by the anisotropic lattice volume change of primary particles, which gives rise to mechanical stresses and strain in NMC secondary particles. Lattice volume change is mainly caused by the following factors:
- Phase transitions upon charging and discharging processes. Figure 24a–d shows the differential capacity curves of NMC, as a function of the Ni content and the number of cycles. Considering the charging process, the original layered structure (H1) first turns into the monoclinic phase (M), and then into two other hexagonal phases (H2 and H3) at the end of the charge. The H2–H3 phase transition becomes less pronounced while decreasing the Ni content [106].Phase transitions induce anisotropic lattice parameters changes, as depicted in Figure 25a,b. Indeed, the lattice parameter a keeps the same trend both during charge and discharge, as it decreases during charge and increases during discharge. On the contrary, the variation of the lattice parameter c is significantly different; it first slowly increases during charge and then suddenly decreases due to the H2–H3 phase transition until the end of charging. The process is reversed in discharge, as the c parameter suddenly increases when the transition between H3 and H2 phases occurs, and then decreases until the end of discharge. The large and anisotropic steep change of the lattice parameters caused by the phase transition H2–H3 induces intergranular cracking along grain boundaries. In addition, the higher the nickel content, the greater the c lattice parameter variation, as the H2–H3 phase transition becomes more pronounced. Consequently, larger c-parameter variations cause greater stress, and increase the propagation of intergranular cracks in NMC secondary particles.
- Oxygen release induces phase transformation from the layered structure to the spinel and/or rock-salt structure. The phase transition and the random orientation of primary particles causes anisotropic volume change, thus strain mismatch and the rise of shear stress at the primary particles boundary. The stress and strain fields lead to intergranular cracking nucleation and propagation along the primary particles boundaries, which are the weakest regions within NMC secondary particles [113].
Several studies demonstrated that intragranular and intergranular cracks formation mechanisms strictly depend on the Ni-content [106,115,119], particles size [116], cycles number [120] and current rates [121]. As a consequence, further developments are required to control the influence of these factors and to achieve high cycling stability and structural stabilization, thereby reducing the performance degradation of NMC due to fracture.
One of the most promising strategies to alleviate intergranular cracking and to maintain the structural integrity of NMC is removing the grain boundaries by synthesizing single-crystal NMC particles, which cannot experience integranular fracture.
It was demonstrated that single-crystal NMC has higher volumetric energy density compared to commercial polycrystalline NMC [122]. However, single-crystalline NMC is still under development and further studies are required to optimize the electrochemical performance.
Fan et al. [123] synthesized single-crystal LiNiCoMnO (NMC831106) particles (radius m) and demonstrated that these particles exhibit better cycling performance as compared to commercial polycrystalline NMC. Indeed, polycrystalline and single-crystal NMC particles have a similar initial capacity (around 200 mAh/g), but the capacity decay over cycling of single-crystals is lower than polycrystalline NMC, i.e., 15.5% against 31.7%, as shown in Figure 26. In addition, single-crystal NMC has a larger specific energy density. The improvement in the electrochemical performances of single-crystal NMC was attributed to the absence of intergranular cracking, which decreases the occurrence of irreversible side reactions and avoids the phase transformation from a layered structure to the rock-salt phase, alleviating the structural degradation.
Various techniques have been explored to synthesize the single-crystalline NMC, but they are still far from becoming established technologies for the production of commercial electrodes. Although further studies are needed, in particular to develop adequate synthesis methods, single-crystal NMC particles represent a valid alternative solution for the future development of LIBs with high cycling stability.
Xu et al. [125,126] used nanoindentation to estimate the fracture toughness of NMC532 particles. They performed the indentation directly on the secondary particles (radius of about 10 m) and measured the Young modulus and the hardness. Then, fracture toughness was computed from these mechanical properties and was equal to 0.102 MPa.
3.9. Lithium Nickel Aluminum Cobalt Oxide-
Among the large number of novel cathode materials, lithium nickel aluminum cobalt oxide (NCA) is one of the best performing materials for current LIBs. NCA shares many similarities with NMC; thus, it attracts significant attention for current commercial EVs, because of its high capacity, specific energy, specific power, long lifespan and safety. Furthermore, the replacement of Mn with Al has led to higher structural stability, safety and thermal stability [127,128]. However, a significant capacity fade of NCA was reported during long-term cycling [129,130,131].
Similarly to NMC, the capacity fade of NCA is mainly caused by fractures occurring within primary particles and along grain boundaries during repeated lithium insertion and extraction.
Several works studied the effects of intergranular fracture on the capacity fade of NCA over cycling. Liu et al. [130] monitored the changes of lithiation and delithiation reactions within secondary particles during cycling. Operando XRD was employed to estimate how the occurrence of intergranular fracture affects performance decay. The observed heterogeneous reaction kinetics were attributed to the initiation and propagation of intergranular cracks within the NCA secondary particles, which reduced the contact surface between neighboring primary particles and increased the resistance of electronic and ionic transport. Furthermore, new surfaces of primary particles are exposed to the electrolyte, forming a passivation layer that further increases the electrical and ionic resistance.
Watanabe et al. [129] also analyzed intergranular fracture occurring within the secondary particles of during cycling, confirming that the formation of cracks at the grain boundaries causes the penetration of the electrolyte into the secondary particles and the formation of a NiO-like layer. This layer has a crystalline structure similar to rock-salt and grows on the surfaces of primary particles, resulting in capacity fade and impedance rise. Finally,Watanabe et al. showed that limiting the DOD to 10–70% during cycling prevents the generation of intergranular cracks, reducing capacity decay. However, limiting the DOD during cycling significantly reduces the energy density of the battery, thus resulting in an increase in battery weight and cost. As a consequence, a trade-off should be found to obtain the best performance.
As already discussed for NMC, NCA with a higher Ni content have attracted increasing attention, due to their higher discharge capacity. However, even for NCA, an increase in the Ni content decreases the structural stability and increases capacity decay during cycling.
Park et al. [132] confirmed the impact of the SOC window and the Ni content on the structural stability and cyclic performance of NCA. In addition, they showed that the initial SOC influences the capacity decay of NCA as well. This happens because the H2–H3 phase transition of NCA, which causes the anisotropic lattice parameters variations and the intergranular cracking, is affected by DOD, the initial SOC, and the Ni content. The higher the Ni content, the more pronounced the H2–H3 phase transition is and the anisotropic lattice parameters variation. Furthermore, the initial SOC influences the intensity of the H2–H3 phase transitions as well, even for the same DOD. For example, Park et al. [132] computed the differential charge curves of Ni-rich (NCA95) cycled at up to 100 cycles, with different SOC windows, i.e., from SOC 0% to SOC 60% (2.7–4 V), SOC 40% to SOC 100% (3.76–4.3 V), and SOC 0% to SOC 100% (2.7–4.3 V), as shown in Figure 27.
The H2-H3 phase change occurs at 4.2V according to Figure 27b,d; then, the change occurs at a higher SOC. Nevertheless, the phase transition is less pronounced when the cell is cycled at 0–100% SOC as compared to the SOC range of 40–100%, as confirmed by the comparison of redox peaks of the H2–H3 phase transition in Figure 27b and d. This behavior agrees with the capacity decay shown in Figure 27a, which demonstrates that the highest capacity decay occurs when the cell is cycled in the SOC range of 40–100%, which seems to be the worst condition from the electrochemical performance point of view.
This trend is also confirmed by the SEM images of NCA95 particles cycled for 100 cycles at different SOC windows, as reported in Figure 27e–g. Indeed, particles cycled at 0–60% SOC do not show visible cracks, whereas the number of cracks in NCA95 cycled at 40–100% SOC and 0–100% is considerably higher, with the former exhibiting an increased amount of cracks as compared to the latter.
Park et al. also showed that NCA particles can experience intragranular fractures. However, the intragranular fracture mechanism of NCA is less studied [133,134], compared to NMC; probably because intergranular fractures seem to prevail in NCA, thus being the main reason for the performance decay.
High long-term cycling performances of NCA can be achieved by minimizing strain at grain boundaries due to anisotropic changes in lattice dimension. This can be obtained in different ways, such as the following:
- Removing primary particles or reducing their size to reduce the strain arising along grain boundaries.
- Selecting the voltage range which minimizes the anisotropic change in lattice parameters.
- Coating secondary particles to mechanically mitigate lattice parameters change.
3.10. Lithium Cobalt Oxide-LCO
Lithium cobalt oxide (LCO) was discovered by Goodenough in 1980 [135] and was the first and most successfully commercialized layered transition metal oxide. Nowadays, LCO is still a widespread cathode material and dominates the market of energy storage for micro and portable electronics. The strong points are its relatively high theoretical specific capacity of 274 mAhg, high theoretical volumetric capacity of 1363 mAh cm, low self-discharge, high voltage, and acceptable cycling performance. On the other hand, the major drawbacks are the large presence of cobalt, which is expensive, toxic, and not environmentally friendly, low thermal stability, and the capacity drop due to high current rates or deep cycling (high voltage). The poor thermal stability is caused by the exothermic release of oxygen when the temperature exceeds 200 °C, leading to thermal runaway. Even if thermal runaway is the drawback of many active materials for LIBs, LCO is by far the most critical material from this point of view.
Fractures in LCO are primarily due to the strain misfit at the phase boundary [136]. The following five phase transitions are reported in the literature, as confirmed by the differential capacity curve of LCO reported in Figure 28.
A first-order metal-insulator transition at 3.9 V [138], two order-disorder transitions near Li0.5CoO2 at 4.1 V and 4.2 V [139,140], a transition from the O3 phase to the H1-3 phase at 4.55 V, and a transition from the H1-3 phase to the O1 phase at 4.62 V [140,141]. The latter two transitions (O3 to H1-3 and H1-3 to O1) were believed to be responsible of the capacity fade of LCO above 4.5 V [141,142] because of the significant mismatch stress generated during the phase transition.
Jiang et al. [136] described different types of fractures in LCO particles at the atomic level with TEM analysis. Firstly, they recognized that twin boundaries are common defects in LCO particles (more than 40% of particle samples contain them), and they are the preferred spot of crack nucleation. Twin boundaries are the connections between two LCO particles fused together and they are recognized in Figure 29 as the intersection between two planes (003) (tilted of 109.5°) in direction ().
TEM observations verified that pristine particles are free of cracks and voids at the twin boundaries. On the other hand, modifications of the twin boundary were observed with electrochemical cycles. After 50 cycles of 2.7–4.4 V, the boundary was no longer atomically straight, and some kinks appeared (Figure 29a), indicated by red lines. Extra (003) planes (pink line) were generated to release the local strain with further cycling. The kinks create a highly localized expansion of the (0003) planes, as highlighted by the yellow arrows in Figure 29b, leading to the nucleation of cleavage cracks (Figure 29c). After 300 cycles at 2.7–4.4 V, V-shaped cracks were frequently observed at the twin boundaries (Figure 29d), and their geometry indicates that they are deformation-induced. Figure 29e–h resumes the nucleation and growth process of cleavage cracks.
High voltage cycling (2.7–4.7 V) caused severe crack issues, even after 50 cycles. O3-O1 phase transition, triggered above 4.6 V, causes a large strain mismatch, which gives rise to LCO decomposition and cracks nucleation (Figure 30a). Subsequently, large decomposition cracks develop at the twin boundary (Figure 30b). Figure 30c demonstrates the nucleation and growth process of decomposition cracks. Decomposition cracks are more severe than dislocation cracks observed at low voltage.
Jiang et al. [143] confirmed that deep delithiation (2.7–4.55 V) triggers the O3-O1 phase transition, and causes the increase in stripe-defects in bulk particles, linked to the deformed region at the boundary between the two phases. Furthermore, they observed that these defects increase with the number of cycles.
Hitt et al. [137] performed X-ray nano-tomography analyses of LCO samples based on FF-TXM to observe the induced cracks in overcharged crystalline particles. They analyzed three electrode samples and a total amount of 164 particles, detecting 282 individual cracks with their semi-automatic image process based on nano-tomography data.
Their result concerning the particle morphology points out that pristine particles show no cracks, and most of the cracks were observed parallel to the largest surface areas (i.e., (003) planes) after overcharging. This behavior was observed even in other layered oxides electrodes, as explained in Section 3.8, because of the weak bonding between planes. Furthermore, several parallel cracks intersecting each other with a 109° angle were observed in many particles, as shown in Figure 31, consistent with the twin boundary theory explained earlier [136].
While the direction of cracks is mostly parallel to the (003) plane, their shape and position are more heterogeneous. Many cracks were observed to grow along the plate edges, nucleating from the surface, some cracks were observed to be extended to the entire particle, and other cracks were restricted to the inner part of the particle, suggesting that internal nucleation points exist. These observations showed that pre-existing surface and bulk flaws concur in crack nucleation. Furthermore, Hitt et al. observed with SEM that crack nucleation is facilitated by some surface features, similar to notches arising at the grain boundary. Then, the cracks grow following the grain boundary between two stacked LCO plates.
Hitt et al. [137] evaluated the effects of the charging voltage and the particle size by observing three pristine electrode samples charged at 0.05C at different voltages (4.5 V, 4.6 V, and 4.8 V) with nano-tomography. The goal was to trigger none, one (O3 to H1-3), or both (O3 to H1-3 and H1-3 to O1) phase transitions explained above, and to evaluate their effects on fracture. Furthermore, they categorized the particles according to their size into the following four groups: (a) , (b) , (c) , (d) .
Their observations showed that the higher the cut-off voltage, the higher the fraction of fractured particles. Quantitatively, 46.4% of fractured particles (independently of the size) were observed with a cut-off voltage at 4.5 V, 51.4% at 4.6 V, and 60.3% at 4.8 V, respectively. On the other hand, the effect of cut-off voltage on areal crack density and crack length is more significant. The results in Figure 32a–c show that the last phase transition (H1-3 to O1) occurring above 4.62 V (referred to sample charged at 4.8 V) significantly increased the crack density and length, compared to the phase transition occurring above 4.5 V (referred to sample charged at 4.6 V). This may be explained by the lattice mismatch at the phase boundary: the c-lattice misfit between the H1-3 and O1 phase is approximately 6% [144], which results in large tensile stress in the O1 domains; in contrast, the c-lattice misfit between O3 and H1-3 is only 3%. A modest amount of cracks is observed even in the sample charged at 4.5 V, which is not subjected to any of the aforementioned phase transitions, meaning that LCO does not fracture just when overcharged, but cleavage fractures and fractures caused by phase transitions occurring at low voltage (3.9 V/4.1 V/4.2 V) are significant as well.
Concerning particle size, Hitt et al. [137] observed that its influence is even more significant than the cut-off voltage, as 16% of particles with volume lower than 36 m charged at 4.5 V showed cracks, compared to 73% of particles with a volume greater than 144 m which charged at the same cut-off voltage. The same trend is observed even in areal crack density and in the crack length. These results are effectively reported in Figure 32a–c, highlighting the interplay and the effects of cut-off voltage and particle size. Hitt et al. proposed two explanations to explain the interplay between particle size and fracture behavior. Firstly, they noted that larger particles contain more nucleation points, and larger particles have higher fracture probability, assuming that the density of pre-existent cracks does not change with particle morphology significantly. Secondly, they studied the driving force of crack propagation, (e.g., the energy release rate), and they showed that the energy release rate decreases in a plate-like particle with a surface crack when the ratio between crack size and particle size decreases, thus leading to the assertion that smaller particles contain smaller cracks.
3.11. Lithium-Rich Layered Oxides-LLOs
Li-rich layered oxides (LLOs, , with TM: Ni, Co, Mn) have attracted much attention in the last few years thanks to their higher performance as compared to other commercial cathodes (LCO, LMO, LFP, NMC), such as higher specific capacity (around 250–300 mA h g−1) with a high operating voltage (>3.5 V vs. Li/Li+ in average) and relatively low cost. Therefore, LLO represents one of the most promising candidates for the next generation of cathode materials. However, some drawbacks hinder LLOs commercialization, such as capacity and voltage fading over cycling, and low rate capabilities [145].
It was demonstrated that the capacity fading of LLO over cycling is mainly caused by the intergranular cracking, which is induced by the significant volume change resulting from the anisotropic lattice parameter variations and phase transformations occurring during charge and discharge.
Chen et al. [146] studied the fracture behavior of · particles using operando neutron powder diffraction (NPD) and TXM analysis and monitored the phase, crystallographic and morphological evolution of · particles during cycling. At the beginning of delithiation (2–4.2 V vs. Li/Li), the phase is subjected to a solid solution reaction, causing a 2% volume reduction and the initiation of cracks. With further delithiation (4.2–4.7 V vs. Li/Li), loses oxygen irreversibly, and it transforms in , and the two-phase reaction / occurs. The two-phase reaction of the phase involves a 4.4% strain mismatch, which is the reason for the significant increase in cracking in the electrode particles. The two-phase reaction is reversed at the beginning of discharge (lithiation), but the deformation that occurs during delithiation is not recovered and crack closure does not occur at this stage. Most of the deformation is recovered in the subsequent solid solution, and most of the cracks are healed by the compressive stress. Therefore, Chen et al. [146] note the importance of limiting the occurrence of the two-phase reaction and oxygen evolution to prevent capacity fading of LLO over cycling.
Some works in the literature recognize the inhomogeneous extraction of lithium ions [147] and the structural distortion induced by Mn [148] among the other reasons for intergranular cracking in LLOs. Other structural degradation mechanisms were also related to the capacity fading and the electrochemical performance decrease in LLOs over cycling, including the transformation from the layered structure to the spinel-like structure [149,150] and the surface side reactions occurring between LLO and electrolyte [145,151]. As a consequence, further analyses are required to quantify the impact of fracture on capacity decay and develop adequate mitigation strategies.
3.12. Concluding Remarks
Table 2 summarizes the key information for each type of active material revised in this Section. In particular, the following details are emphasized: the type of fracture mechanism mainly observed experimentally, the occurrence of side reactions on fresh crack surfaces, the fracture index, and the main gaps in literature to be covered in further works. A qualitative fracture index is provided by the authors to judge the fracture behaviour of the materials, both from the fracture tendency and the fracture effects points of view. The fracture index ranges from 1 to 3, with 3 corresponding to the materials most affected by fracture.
4. Fracture Influence on Battery Damage
As shown in previous sections, the mechanical and electrochemical degradation of electrode active materials are related. In the first part of this section, experimental proofs of the crack growth with the number of charge and discharge cycles is given. Later, the correlation between the increase in fracture and LIBs performance decay is explained.
4.1. Crack Growth as a Function of Number of Cycles and Battery Operation
The fracture is a progressive degradation mechanism during cycling. Some experimental works showed that fractures increase with the number of cycles [99,152,153,154], as shown in Figure 33.
Indeed, lithium ions intercalation and deintercalation induce alternating stresses and strains in active material particles due to the continuous expansion and shrinkage, and possible phase transformations. The induced stresses and strains result in damage accumulation upon cycling, finally leading to cracks nucleation and growth.
Cracks are found more frequently in larger particles than in smaller ones (Figure 34a,c).
This can be explained by three main reasons [155]. The first one is linked to the energetic nature of the fracture mechanism. The driving force for crack propagation is provided by the stored elastic energy, which scales with the elastically strained volume () of the particle. This means that, for a given stress, only particles above a certain size have enough elastically stored energy to make the crack grow.
The second reason concerns the crack nucleation mechanism. Indeed, the nucleation of cracks usually occurs at pre-existent defects. Smaller particles contain on average fewer defects; thus, they are less liable to fracture. On the other hand, electrodes with smaller particles have fewer cracks in the single particle but they have a larger number of particles, meaning that the same number of cracks is present on average in electrodes with smaller or larger particles.
Finally, the diffusion-induced stress of particles with different sizes should be taken into account, as crack nucleation and growth depend on the stress level. The probability of fracture decreases with decreasing particle size, as smaller particles exhibit lower stresses due to a more uniform lithium concentration distribution. This is in agreement with the fact that cycling at a high current density and large voltage ranges increases crack nucleation and propagation in electrodes’ active materials, as larger concentration gradients and stresses are induced within active material particles (Figure 34b,c).
4.2. Real-Time Crack Growth Monitoring
From the experimental point of view, few works described the growth process of the same crack in active material particles during battery operations. Indeed, the tracking of crack growth during cycling is not trivial and requires the application of advanced instruments and experimental techniques.
Wu et al. [156] developed a SEM observation methodology to visualize the crack growth in NMC811 by tracing the same secondary particles during cycling. First, they marked the particle to be observed with SEM; then, they cut the particle with FIB to observe the cross-section. They assembled the cathode in a coin cell with Li-metal as counter electrode. After cycling, the cell was disassembled and the cross-section of the marked particle was observed with SEM. Finally, after SEM observation, the cell was re-assembled for further cycles, and the procedure of cycling, disassembling and observing with SEM was repeated. Different experiments were carried out with varying cycling conditions, such as charging rates, cutoff voltages and cycle numbers. Two fracture mechanisms were recognized. NMC secondary particles can burst and generate high crack densities during the initial few cycles due to deep delithiation. Alternatively, NMC particles can follow the fatigue cracking behavior when the depth of delithiation is lower, with the number of cracks gradually increasing during cycling.
Chen et al. [155] took SEM images of the same location of particle before and after cycling to study the crack formation and growth. An increase in the crack length was observed at the end of the test.
Liu et al. [51] used in-situ TEM to analyze the crack growth in single spherical silicon particles during electrochemical lithiation. They observed that the crack length was steadily increasing during the single electrochemical cycle.
Cheng et al. [157] performed in-situ SEM analysis on NMC811. This means that the electrode was electrochemically cycled and observed with SEM at the same time. The evolution of the same cracks in NMC811 particles was monitored in real-time (plotted in Figure 35), thus allowing the characterization of the crack growth.
It is highlighted that experimental analysis of the crack growth is needed to obtain empirical parameters for crack propagation models, such as Paris’ law. Currently, in situ SEM and TEM look the most promising techniques to accomplish this goal, because they allow monitoring the same cracks while the electrode is electrochemically cycled. The pioneering works of Liu et al. [51] and Cheng et al. [157] need to be followed up in the future by studies aiming to perform this type of characterization.
4.3. Correlation between Fracture Mechanics and LIBs Performance Decay
Fracture generally affects the electrochemical performance of LIBs due to the isolation of active material and the creation of new surfaces for SEI growth, resulting in impedance rise and capacity fade. Impedance rise is caused by the loss of contact with the current collector or the conductive matrix, resulting in the interruption of the ions pathway [4]. On the other hand, capacity fade is caused by the isolation of some portion of active material, which becomes inactive and cannot host lithium ions, and by the SEI growth, which consumes lithium ions, no longer available to be cycled [3,158].
It is well demonstrated that battery cycling causes capacity fade and performance degradation [4]. Some works tried to assess the effects of fracture on capacity reduction during battery operations, both from the modeling and experimental points of view.
The correlation between the capacity fade and fracture occurring in electrodes active materials needs to be established, especially with the aim of studying strategies to reduce performance degradation. Although a great efforts have been made to characterize the fracture behavior of electrodes active materials, an accurate correlation between capacity fade and fracture is still lacking.
The evaluation of capacity fade exclusively caused by particles fracture is not trivial. Indeed, there are several factors contributing simultaneously to capacity drop, and chemical and mechanical degradation which occur during battery operations are strictly coupled phenomena. Therefore, it would be necessary to decouple the effect caused by fracture from the other sources of degradation.
Li et al. [121] studied the effect of intergranular cracking in (NMC523) secondary particles, which are composed of aggregated primary particles. Cells with NMC523 single-crystal particles, which cannot be subjected to intergranular cracking, are prepared and cycled with the same test conditions as the ones containing NMC523 polycrystalline particles, in order to quantify the impact of intergranular cracking on the capacity fade over cycling. XRD, XPS and SEM analyses were performed to explain the significant difference in the capacity fade between cells with single-crystalline and polycrystalline particles. The results showed that intergranular fracture is responsible for the capacity fade during cycling. Indeed, cells with single-crystal and polycrystalline particles exhibit the same capacity fade at low current rates (0.1C, 0.2C and 0.5C), meaning that intergranular cracking does not occur at low current rates. On the other hand, cycling at a high current rate (1C) causes a capacity fade of 17% in cells with polycrystalline particles and 11% in cells with single-crystal particles. Then, fracture causes an increase of 35% in the capacity fade, compared to the sample without intergranular cracks.
Further XPS analysis indicated that intergranular cracking induces surface property changes, namely the formation of a poor lithium ions and electrons conductive layer on the new cracked surfaces. This was also confirmed by the electrochemical impedance spectroscopy (EIS) analysis. Indeed, an equivalent circuit was built and the resistances due to the SEI layer () and charge transfer () were computed. It was shown that and increase with cycling both in cells with singular and secondary particles, but the increase is higher in cells with secondary particles. and increased by 278% and 177%, respectively, in cells with polycrystalline particles cycled at 1C, whereas the increase in and was of 107% and 51% in cells with single-crystal particles cycled at 1C. This means that fracture significantly affects resistance, as explained at the beginning of the section.
Finally, although an experimental estimation of the capacity fade due to fracture was provided, the link between the capacity drop and the increase in the crack density over cycling was not provided.
McGrogan et al. [84] induced controlled fracture events in LMO particles to separate the effects caused by mechanical and chemical degradation. They inserted some deep discharge cycles (below 2.96 V), between many constant current cycles to trigger Jahn–Teller transformation and obtain a more aggressive fracture-induced degradation.
The following two different electrochemical responses were observed: capacity fade and impedance rise. The standard cycles increased the crack density, steadily creating new electrode/electrolyte interfaces where dissolution took place, thereby decreasing the capacity. On the other hand, the deep discharge cycles triggered more severe cracks and material isolation, decreasing the electronic conductivity abruptly and ultimately causing a sudden impedance growth. It is interesting to highlight that the two events took place at different time scales: capacity fade occurred continuously over cycling and was not particularly affected by the single deep discharge cycle. On the other hand, impedance growth was triggered just by the deep discharge cycle and remained constant with standard cycles because they were not able to reduce electronic conductivity significantly.
Nevertheless, it must be pointed out that McGrogan et al. did not explain how the deep discharge cycle increased fractures in the material. Thus, it is necessary to show how the cracks increase after the deep discharge cycle with experimental measurements. Nevertheless, the work represents a good starting point for further analyses concerning the dynamic growth of cracks and their relation with LIBs performance decay.
Nam et al. [159] investigated the capacity fading of Ni-rich (NCA) cathodes with different compositions, i.e., 1 − x − y = 0.8, 0.88, 0.95. The cells were charged and discharged for one cycle and the extent of fracture was observed with a SEM analysis and evaluated with an image analysis software. The crack extension in the three cathodes was correlated with the capacity fading and the anisotropic volume variation. It was pointed out that a higher Ni content is more detrimental from the fracture point of view, as it induces higher volume variation, thus higher stress and crack density, leading to more severe capacity fade. However, the analysis was performed over a single cycle of charge and discharge; it would be interesting to perform a similar analysis over a greater number of charge and discharge cycles.
Liu et al. [88] used TXM nanotomography to analyze 3D microstructural parameters from LMO cells cycled under different operating conditions. They tried to establish a correlation between the fracture process in electrodes active material and the capacity loss as a function of the number of cycles, temperature and cut-off voltage. They computed the capacity loss as a function of the increasing cracked surface area using the data collected with TXM. They assumed the capacity drop to be caused just by isolation of active material, which is somehow proportional to the increase in the cracked surface area. The study highlights the impact of the number of cycles, temperature and cut-off voltage on the battery performance decay, and assesses the capacity fade from the measured increase in the cracked surface area. Nevertheless, the strong assumption that capacity fade depends just on the active material isolation was made.
In conclusion, based on actual works, adequate experimental strategies aiming to analyze the crack growth during battery operations require further development. Firstly, the crack growth needs to be monitored while the electrode is cycled, for example in-situ SEM/TEM represents promising techniques, but few works are present in the literature and further studies are required. In-situ crack growth monitoring is necessary to obtain the empirical parameters for models describing the crack growth as a function of number of cycles, such as Paris’ law. Secondly, it is essential to isolate the impact of fracture on performance decay from the other sources of degradation. Finally, the correlation between fracture and performance decay is needed to properly understand and quantify the mechanical damaging mechanism, and to study strategies which mitigate degradation.
5. Conclusions
This work aims to review the state-of-the-art concerning the experimental characterization of fracture mechanics caused by battery operations in the most popular active material used in LIBs electrodes. A summary of the main themes addressed in this work is provided in Table 3.
In the first part of the review, the driving forces of fractures, namely the diffusion-induced stress and the stress at phase boundary, are explained. As a consequence, the factors affecting fractures, e.g., chemical-mechanical properties and microstructure morphology, are discussed.
The third section is dedicated to the experimental characterization of fracture mechanics in active materials. Each material has a specific fracture behavior that cannot be generalized in term of the driving force of fractures, crack characteristics (e.g., direction, spot of nucleation, inter/intragranular), and propagation.
Finally, the effects of fracture on LIBs performance (capacity and internal resistance), as well as the the experimental approach to fatigue phenomena, are discussed.
Besides providing a review of current state-of-the-art, this review aims to highlight possible future developments in this field. According to the authors, some themes are still lacking, or very few are discussed in literature:
- An in-depth description of crack growth as a function of the number of cycles to obtain the empiric coefficients used for crack growth laws, such as Paris’ law.
- Measurements of the toughness of active materials, since this parameter is assumed for most of the common active materials. It is important to point out that although some active materials such as silicon and graphite have been widely studied over the years in the field of classic fracture mechanics, their mechanical properties are strongly influenced by the electrochemical reactions occurring in LIBs; thus, proper experimental measurements are required.
- The relation between performance decay (mainly capacity drop and resistance rise) and the increase in fracture density.
- Quantify how fracture behavior is affected by battery operation with the aim of finding operative strategies to mitigate fractures.
Author Contributions
Conceptualization, D.C. and F.P.; methodology, D.C.; formal analysis, A.S. and F.M.; resources, A.S.; data curation, F.P. and D.C.; writing—original draft preparation, F.P. and D.C.; writing—review and editing, D.C., F.M. and A.S.; visualization, D.C. and F.P.; supervision, F.M., and A.S.; project administration, A.S.; funding acquisition, A.S. All authors have read and agreed to the published version of the manuscript.
Funding
This research received no external funding.
Conflicts of Interest
The authors declare no conflict of interest.
Abbreviations
The following abbreviations are used in this manuscript:
| ABF | Annular bright-field |
| DIS | Diffused induced stress |
| DOD | Depth of discharge |
| DMC | Dimethyl carbonate |
| EC | Ethylene carbonate |
| EDP | Electron diffraction pattern |
| EDX | Energy-dispersive X-ray spectroscopy |
| EIS | Electrochemical impedance spectroscopy |
| ELSA | Element scan analysis |
| FEM | Finite element model |
| FF TMX | Full field transmission X-ray microscope |
| FIB | Focused Ion Beam |
| FMSEM | Field emission scanning electron microscope |
| GPA | Geometric phase analysis |
| HAADF | High-angle annular dark-field |
| HRTEM | High-resolution transmission electron microscope |
| LCO | Lithium cobalt oxide |
| LFP | Lithium iron phosphate |
| LIB | Lithium-ion battery |
| LLO | Li-rich layered oxide |
| LMO | Lithium manganese oxide |
| LTO | Lithium titanate oxide |
| MOS | Multi-beam Optical Sensor |
| NMC | Nickel manganese cobalt oxide |
| NPD | Neutron powder diffraction |
| Pair distribution function | |
| PVDF | Polyvinylidene fluoride |
| SAED | Selected area electron diffraction |
| SEI | Solid electrolyte interface |
| SEM | Scanning electron microscope |
| SOC | State of charge |
| STEM | Scanning transmission electron microscope |
| STMX | Scanning transmission X-ray microscope |
| TEM | Transmission electron microscope |
| TM | Transition metal |
| TXM | Transmission X-rat microscopy |
| XANES | X-ray absorption near edge spectroscope |
| XAS | X-ray absorption spectroscopy |
| XPS | X-ray photoelectron spectroscopy |
| XRD | X-ray diffraction analysis |
References
- Duehnen, S.; Betz, J.; Kolek, M.; Schmuch, R.; Winter, M.; Placke, T. Toward green battery cells: Perspective on materials and technologies. Small Methods 2020, 4, 2000039. [Google Scholar] [CrossRef]
- Porzio, J.; Scown, C.D. Life-Cycle Assessment Considerations for Batteries and Battery Materials. Adv. Energy Mater. 2021, 11, 2100771. [Google Scholar] [CrossRef]
- Birkl, C.R.; Roberts, M.R.; McTurk, E.; Bruce, P.G.; Howey, D.A. Degradation diagnostics for lithium ion cells. J. Power Sources 2017, 341, 373–386. [Google Scholar] [CrossRef]
- Edge, J.S.; O’Kane, S.; Prosser, R.; Kirkaldy, N.D.; Patel, A.N.; Hales, A.; Ghosh, A.; Ai, W.; Chen, J.; Yang, J.; et al. Lithium ion battery degradation: What you need to know. Phys. Chem. Chem. Phys. 2021, 23, 8200–8221. [Google Scholar] [CrossRef] [PubMed]
- Mocera, F.; Somà, A.; Clerici, D. Study of aging mechanisms in lithium-ion batteries for working vehicle applications. In Proceedings of the 2020 Fifteenth International Conference on Ecological Vehicles and Renewable Energies (EVER), Monte-Carlo, Monaco, 10–12 September 2020; pp. 1–8. [Google Scholar]
- Liu, Y.; Zhang, R.; Wang, J.; Wang, Y. Current and future lithium-ion battery manufacturing. IScience 2021, 24, 102332. [Google Scholar] [CrossRef] [PubMed]
- Mukhopadhyay, A.; Sheldon, B.W. Deformation and stress in electrode materials for Li-ion batteries. Prog. Mater. Sci. 2014, 63, 58–116. [Google Scholar] [CrossRef]
- Christensen, J.; Newman, J. Stress generation and fracture in lithium insertion materials. J. Solid State Electrochem. 2006, 10, 293–319. [Google Scholar] [CrossRef]
- Christensen, J.; Newman, J. A mathematical model of stress generation and fracture in lithium manganese oxide. J. Electrochem. Soc. 2006, 153, A1019. [Google Scholar] [CrossRef]
- Zhou, W.; Hao, F.; Fang, D. The effects of elastic stiffening on the evolution of the stress field within a spherical electrode particle of lithium-ion batteries. Int. J. Appl. Mech. 2013, 5, 1350040. [Google Scholar] [CrossRef]
- Clerici, D.; Mocera, F.; Somà, A. Analytical solution for coupled diffusion induced stress model for lithium-ion battery. Energies 2020, 13, 1717. [Google Scholar] [CrossRef]
- Clerici, D.; Mocera, F.; Somà, A. Shape influence of active material micro-structure on diffusion and contact stress in lithium-ion batteries. Energies 2020, 14, 134. [Google Scholar] [CrossRef]
- Clerici, D.; Mocera, F. Micro-scale modeling of Lithium-ion battery. IOP Conf. Ser.: Mater. Sci. Eng. 2021, 1038, 012007. [Google Scholar]
- Li, P.; Zhao, Y.; Shen, Y.; Bo, S.H. Fracture behavior in battery materials. J. Phys. Energy 2020, 2, 022002. [Google Scholar] [CrossRef]
- Clerici, D.; Mocera, F.; Pistorio, F. Analysis of fracture behaviour in active materials for lithium ion batteries. IOP Conf. Ser.: Mater. Sci. Eng. 2022, 1214, 012018. [Google Scholar]
- Clerici, D.; Mocera, F.; Somà, A. Experimental Characterization of Lithium-Ion Cell Strain Using Laser Sensors. Energies 2021, 14, 6281. [Google Scholar] [CrossRef]
- Clerici, D.; Mocera, F.; Somà, A. Electrochemical–mechanical multi-scale model and validation with thickness change measurements in prismatic lithium-ion batteries. J. Power Sources 2022, 542, 231735. [Google Scholar] [CrossRef]
- Lu, B.; Ning, C.; Shi, D.; Zhao, Y.; Zhang, J. Review on electrode-level fracture in lithium-ion batteries. Chin. Phys. B 2020, 29, 026201. [Google Scholar] [CrossRef]
- Wu, J.; Fenech, M.; Webster, R.F.; Tilley, R.D.; Sharma, N. Electron microscopy and its role in advanced lithium-ion battery research. Sustain. Energy Fuels 2019, 3, 1623–1646. [Google Scholar] [CrossRef]
- Yuan, Y.; Amine, K.; Lu, J.; Shahbazian-Yassar, R. Understanding materials challenges for rechargeable ion batteries with in situ transmission electron microscopy. Nat. Commun. 2017, 8, 15806. [Google Scholar] [CrossRef] [Green Version]
- Zhang, X.; Sastry, A.M.; Shyy, W. Intercalation-induced stress and heat generation within single lithium-ion battery cathode particles. J. Electrochem. Soc. 2008, 155, A542. [Google Scholar] [CrossRef]
- Jangid, M.K.; Mukhopadhyay, A. Real-time monitoring of stress development during electrochemical cycling of electrode materials for Li-ion batteries: Overview and perspectives. J. Mater. Chem. A 2019, 7, 23679–23726. [Google Scholar] [CrossRef]
- Cheng, X.; Pecht, M. In situ stress measurement techniques on li-ion battery electrodes: A review. Energies 2017, 10, 591. [Google Scholar] [CrossRef]
- Zhu, M.; Park, J.; Sastry, A.M. Fracture analysis of the cathode in Li-ion batteries: A simulation study. J. Electrochem. Soc. 2012, 159, A492. [Google Scholar] [CrossRef]
- Liu, D.; Shadike, Z.; Lin, R.; Qian, K.; Li, H.; Li, K.; Wang, S.; Yu, Q.; Liu, M.; Ganapathy, S.; et al. Review of recent development of in situ/operando characterization techniques for lithium battery research. Adv. Mater. 2019, 31, 1806620. [Google Scholar] [CrossRef] [PubMed]
- De Jonge, N.; Ross, F.M. Electron microscopy of specimens in liquid. Nat. Nanotechnol. 2011, 6, 695–704. [Google Scholar] [CrossRef] [PubMed]
- Goldstein, J. Practical Scanning Electron Microscopy: Electron and Ion Microprobe Analysis; Springer Science & Business Media: New York, NY, USA, 2012. [Google Scholar]
- Chu, M.W.; Liou, S.; Chang, C.P.; Choa, F.S.; Chen, C. Emergent chemical mapping at atomic-column resolution by energy-dispersive X-ray spectroscopy in an aberration-corrected electron microscope. Phys. Rev. Lett. 2010, 104, 196101. [Google Scholar] [CrossRef]
- Allen, L.J.; D’Alfonso, A.J.; Freitag, B.; Klenov, D.O. Chemical mapping at atomic resolution using energy-dispersive x-ray spectroscopy. MRS Bull. 2012, 37, 47–52. [Google Scholar] [CrossRef]
- Reimer, L. Transmission Electron Microscopy: Physics of Image Formation and Microanalysis; Springer: Berlin/Heidelberg, Germany, 2013; Volume 36. [Google Scholar]
- Winey, M.; Meehl, J.B.; O’Toole, E.T.; Giddings, T.H., Jr. Conventional transmission electron microscopy. Mol. Biol. Cell 2014, 25, 319–323. [Google Scholar] [CrossRef]
- Podor, R.; Ravaux, J.; Brau, H.P. In situ experiments in the scanning electron microscope chamber. In Scanning Electron Microscopy; IntechOpen: Rijeka, Croatia, 2012. [Google Scholar]
- Liu, X.H.; Wang, J.W.; Huang, S.; Fan, F.; Huang, X.; Liu, Y.; Krylyuk, S.; Yoo, J.; Dayeh, S.A.; Davydov, A.V.; et al. In situ atomic-scale imaging of electrochemical lithiation in silicon. Nat. Nanotechnol. 2012, 7, 749–756. [Google Scholar] [CrossRef]
- Bassim, N.; Scott, K.; Giannuzzi, L.A. Recent advances in focused ion beam technology and applications. MRS Bull. 2014, 39, 317–325. [Google Scholar] [CrossRef] [Green Version]
- Guttmann, P.; Bittencourt, C.; Rehbein, S.; Umek, P.; Ke, X.; Van Tendeloo, G.; Ewels, C.P.; Schneider, G. Nanoscale spectroscopy with polarized X-rays by NEXAFS-TXM. Nat. Photonics 2012, 6, 25–29. [Google Scholar] [CrossRef]
- Spence, S.; Lee, W.K.; Lin, F.; Xiao, X. Transmission X-ray Microscopy and Its Applications in Battery Material Research—A Short Review. Nanotechnology 2021, 32, 442003. [Google Scholar] [CrossRef]
- Khan, H.; Yerramilli, A.S.; D’Oliveira, A.; Alford, T.L.; Boffito, D.C.; Patience, G.S. Experimental methods in chemical engineering: X-ray diffraction spectroscopy—XRD. Can. J. Chem. Eng. 2020, 98, 1255–1266. [Google Scholar] [CrossRef]
- Desimoni, E.; Brunetti, B. X-ray photoelectron spectroscopic characterization of chemically modified electrodes used as chemical sensors and biosensors: A review. Materials 2015, 3, 70–117. [Google Scholar] [CrossRef] [Green Version]
- Bondarchuk, O.; LaGrow, A.P.; Kvasha, A.; Thieu, T.; Ayerbe, E.; Urdampilleta, I. On the X-ray photoelectron spectroscopy analysis of LiNixMnyCozO2 material and electrodes. Appl. Surf. Sci. 2021, 535, 147699. [Google Scholar] [CrossRef]
- Lin, N.; Jia, Z.; Wang, Z.; Zhao, H.; Ai, G.; Song, X.; Bai, Y.; Battaglia, V.; Sun, C.; Qiao, J.; et al. Understanding the crack formation of graphite particles in cycled commercial lithium-ion batteries by focused ion beam-scanning electron microscopy. J. Power Sources 2017, 365, 235–239. [Google Scholar] [CrossRef] [Green Version]
- Liu, D.; Wang, Y.; Xie, Y.; He, L.; Chen, J.; Wu, K.; Xu, R.; Gao, Y. On the stress characteristics of graphite anode in commercial pouch lithium-ion battery. J. Power Sources 2013, 232, 29–33. [Google Scholar] [CrossRef]
- Takahashi, K.; Srinivasan, V. Examination of graphite particle cracking as a failure mode in lithium-ion batteries: A model-experimental study. J. Electrochem. Soc. 2015, 162, A635. [Google Scholar] [CrossRef]
- Harris, S.J.; Deshpande, R.D.; Qi, Y.; Dutta, I.; Cheng, Y.T. Mesopores inside electrode particles can change the Li-ion transport mechanism and diffusion-induced stress. J. Mater. Res. 2010, 25, 1433–1440. [Google Scholar] [CrossRef] [Green Version]
- Markervich, E.; Salitra, G.; Levi, M.D.; Aurbach, D. Capacity fading of lithiated graphite electrodes studied by a combination of electroanalytical methods, Raman spectroscopy and SEM. J. Power Sources 2005, 146, 146–150. [Google Scholar] [CrossRef]
- Bhattacharya, S.; Riahi, A.R.; Alpas, A.T. A transmission electron microscopy study of crack formation and propagation in electrochemically cycled graphite electrode in lithium-ion cells. J. Power Sources 2011, 196, 8719–8727. [Google Scholar] [CrossRef]
- Zhang, H.L.; Li, F.; Liu, C.; Tan, J.; Cheng, H.M. New insight into the solid electrolyte interphase with use of a focused ion beam. J. Phys. Chem. B 2005, 109, 22205–22211. [Google Scholar] [CrossRef]
- Sun, G.; Bhattacharya, S.; Alpas, A. Cyclic strain-induced crack growth in graphite during electrochemical testing in propylene carbonate-based Li-ion battery electrolytes. J. Mater. Sci. 2018, 53, 1297–1309. [Google Scholar] [CrossRef]
- Zuo, X.; Zhu, J.; Müller-Buschbaum, P.; Cheng, Y.J. Silicon based lithium-ion battery anodes: A chronicle perspective review. Nano Energy 2017, 31, 113–143. [Google Scholar] [CrossRef]
- Chew, H.B.; Hou, B.; Wang, X.; Xia, S. Cracking mechanisms in lithiated silicon thin film electrodes. Int. J. Solids Struct. 2014, 51, 4176–4187. [Google Scholar] [CrossRef] [Green Version]
- Ryu, I.; Choi, J.W.; Cui, Y.; Nix, W.D. Size-dependent fracture of Si nanowire battery anodes. J. Mech. Phys. Solids 2011, 59, 1717–1730. [Google Scholar] [CrossRef]
- Liu, X.H.; Zhong, L.; Huang, S.; Mao, S.X.; Zhu, T.; Huang, J.Y. Size-dependent fracture of silicon nanoparticles during lithiation. ACS Nano 2012, 6, 1522–1531. [Google Scholar] [CrossRef]
- Liu, X.H.; Zheng, H.; Zhong, L.; Huang, S.; Karki, K.; Zhang, L.Q.; Liu, Y.; Kushima, A.; Liang, W.T.; Wang, J.W.; et al. Anisotropic swelling and fracture of silicon nanowires during lithiation. Nano Lett. 2011, 11, 3312–3318. [Google Scholar] [CrossRef]
- Lee, S.W.; McDowell, M.T.; Choi, J.W.; Cui, Y. Anomalous shape changes of silicon nanopillars by electrochemical lithiation. Nano Lett. 2011, 11, 3034–3039. [Google Scholar] [CrossRef]
- Lee, S.W.; McDowell, M.T.; Berla, L.A.; Nix, W.D.; Cui, Y. Fracture of crystalline silicon nanopillars during electrochemical lithium insertion. Proc. Natl. Acad. Sci. USA 2012, 109, 4080–4085. [Google Scholar] [CrossRef] [Green Version]
- Shi, F.; Song, Z.; Ross, P.N.; Somorjai, G.A.; Ritchie, R.O.; Komvopoulos, K. Failure mechanisms of single-crystal silicon electrodes in lithium-ion batteries. Nat. Commun. 2016, 7, 11886. [Google Scholar] [CrossRef] [Green Version]
- Sethuraman, V.A.; Chon, M.J.; Shimshak, M.; Srinivasan, V.; Guduru, P.R. In situ measurements of stress evolution in silicon thin films during electrochemical lithiation and delithiation. J. Power Sources 2010, 195, 5062–5066. [Google Scholar] [CrossRef]
- Li, J.; Dozier, A.K.; Li, Y.; Yang, F.; Cheng, Y.T. Crack pattern formation in thin film lithium-ion battery electrodes. J. Electrochem. Soc. 2011, 158, A689. [Google Scholar] [CrossRef]
- Liu, X.H.; Huang, J.Y. In situ TEM electrochemistry of anode materials in lithium ion batteries. Energy Environ. Sci. 2011, 4, 3844–3860. [Google Scholar] [CrossRef]
- Pharr, M.; Suo, Z.; Vlassak, J.J. Measurements of the fracture energy of lithiated silicon electrodes of Li-ion batteries. Nano Lett. 2013, 13, 5570–5577. [Google Scholar] [CrossRef] [PubMed]
- Chae, S.; Choi, S.H.; Kim, N.; Sung, J.; Cho, J. Integration of graphite and silicon anodes for the commercialization of high-energy lithium-ion batteries. Angew. Chem. Int. Ed. 2020, 59, 110–135. [Google Scholar] [CrossRef] [Green Version]
- Zhang, X.; Min, B.I.; Wang, Y.; Hayashida, R.; Tanaka, M.; Watanabe, T. Preparation of carbon-coated silicon nanoparticles with different hydrocarbon gases in induction thermal plasma. J. Phys. Chem. C 2021, 125, 15551–15559. [Google Scholar] [CrossRef]
- Zhang, C.; Wang, F.; Han, J.; Bai, S.; Tan, J.; Liu, J.; Li, F. Challenges and Recent Progress on Silicon-Based Anode Materials for Next-Generation Lithium-Ion Batteries. Small Struct. 2021, 2, 2100009. [Google Scholar] [CrossRef]
- Wetjen, M.; Solchenbach, S.; Pritzl, D.; Hou, J.; Tileli, V.; Gasteiger, H.A. Morphological changes of silicon nanoparticles and the influence of cutoff potentials in silicon-graphite electrodes. J. Electrochem. Soc. 2018, 165, A1503. [Google Scholar] [CrossRef] [Green Version]
- Casino, S.; Beuse, T.; Küpers, V.; Boerner, M.; Gallasch, T.; Winter, M.; Niehoff, P. Quantification of aging mechanisms of carbon-coated and uncoated silicon thin film anodes in lithium metal and lithium ion cells. J. Energy Storage 2021, 41, 102812. [Google Scholar] [CrossRef]
- Li, W.; Cao, K.; Wang, H.; Liu, J.; Zhou, L.; Yao, H. Carbon coating may expedite the fracture of carbon-coated silicon core–shell nanoparticles during lithiation. Nanoscale 2016, 8, 5254–5259. [Google Scholar] [CrossRef]
- Xia, Y.; Hirai, Y.; Tsuchiya, T. Fracture behavior of single-crystal silicon microstructure coated with stepwise bias-graded aC: H film. Surf. Coatings Technol. 2021, 405, 126559. [Google Scholar] [CrossRef]
- Gu, M.; Li, Y.; Li, X.; Hu, S.; Zhang, X.; Xu, W.; Thevuthasan, S.; Baer, D.R.; Zhang, J.G.; Liu, J.; et al. In situ TEM study of lithiation behavior of silicon nanoparticles attached to and embedded in a carbon matrix. ACS Nano 2012, 6, 8439–8447. [Google Scholar] [CrossRef] [PubMed]
- Xu, Z.L.; Cao, K.; Abouali, S.; Garakani, M.A.; Huang, J.; Huang, J.Q.; Heidari, E.K.; Wang, H.; Kim, J.K. Study of lithiation mechanisms of high performance carbon-coated Si anodes by in-situ microscopy. Energy Storage Mater. 2016, 3, 45–54. [Google Scholar] [CrossRef] [Green Version]
- Sandu, G.; Brassart, L.; Gohy, J.F.; Pardoen, T.; Melinte, S.; Vlad, A. Surface coating mediated swelling and fracture of silicon nanowires during lithiation. ACS Nano 2014, 8, 9427–9436. [Google Scholar] [CrossRef] [PubMed]
- Luo, L.; Yang, H.; Yan, P.; Travis, J.J.; Lee, Y.; Liu, N.; Molina Piper, D.; Lee, S.H.; Zhao, P.; George, S.M.; et al. Surface-coating regulated lithiation kinetics and degradation in silicon nanowires for lithium ion battery. ACS Nano 2015, 9, 5559–5566. [Google Scholar] [CrossRef] [PubMed]
- Michan, A.L.; Divitini, G.; Pell, A.J.; Leskes, M.; Ducati, C.; Grey, C.P. Solid electrolyte interphase growth and capacity loss in silicon electrodes. J. Am. Chem. Soc. 2016, 138, 7918–7931. [Google Scholar] [CrossRef] [PubMed] [Green Version]
- Choi, I.; Lee, M.J.; Oh, S.M.; Kim, J.J. Fading mechanisms of carbon-coated and disproportionated Si/SiOx negative electrode (Si/SiOx/C) in Li-ion secondary batteries: Dynamics and component analysis by TEM. Electrochim. Acta 2012, 85, 369–376. [Google Scholar] [CrossRef]
- Lu, W.; Zhou, X.; Liu, Y.; Zhu, L. Crack-free silicon monoxide as anodes for lithium-ion batteries. ACS Appl. Mater. Interfaces 2020, 12, 57141–57145. [Google Scholar] [CrossRef]
- Wang, J.; Wang, X.; Liu, B.; Lu, H.; Chu, G.; Liu, J.; Guo, Y.G.; Yu, X.; Luo, F.; Ren, Y.; et al. Size effect on the growth and pulverization behavior of Si nanodomains in SiO anode. Nano Energy 2020, 78, 105101. [Google Scholar] [CrossRef]
- Hovington, P.; Dontigny, M.; Guerfi, A.; Trottier, J.; Lagacé, M.; Mauger, A.; Julien, C.; Zaghib, K. In situ Scanning electron microscope study and microstructural evolution of nano silicon anode for high energy Li-ion batteries. J. Power Sources 2014, 248, 457–464. [Google Scholar] [CrossRef]
- Nguyen, C.C.; Choi, H.; Song, S.W. Roles of oxygen and interfacial stabilization in enhancing the cycling ability of silicon oxide anodes for rechargeable lithium batteries. J. Electrochem. Soc. 2013, 160, A906. [Google Scholar] [CrossRef]
- Takezawa, H.; Ito, S.; Yoshizawa, H.; Abe, T. Structural stabilization on SiOx film anode with large areal capacity for enhanced cyclability in lithium-ion batteries. J. Power Sources 2016, 324, 45–51. [Google Scholar] [CrossRef]
- Meng, X.; Huo, H.; Cui, Z.; Guo, X.; Dong, S. Influences of oxygen content on the electrochemical performance of a-SiOx thin-film anodes. Electrochim. Acta 2018, 283, 183–189. [Google Scholar] [CrossRef]
- Haruta, M.; Doi, T.; Inaba, M. Oxygen-content dependence of cycle performance and morphology changes in amorphous-SiOx thin-film negative electrodes for lithium-ion batteries. J. Electrochem. Soc. 2019, 166, A258. [Google Scholar] [CrossRef]
- Nitta, N.; Wu, F.; Lee, J.T.; Yushin, G. Li-ion battery materials: Present and future. Mater. Today 2015, 18, 252–264. [Google Scholar] [CrossRef]
- Zhang, H.; Yang, Y.; Xu, H.; Wang, L.; Lu, X.; He, X. Li4Ti5O12 spinel anode: Fundamentals and advances in rechargeable batteries. InfoMat 2022, 4, e12228. [Google Scholar] [CrossRef]
- Schilcher, C.; Meyer, C.; Kwade, A. Structural and electrochemical properties of calendered lithium manganese oxide cathodes. Energy Technol. 2016, 4, 1604–1610. [Google Scholar] [CrossRef]
- Ariyoshi, K.; Ukumori, N. Intragranular Fracture Mechanism of Highly Crystalline Lithium Manganese Oxide during Lithium Insertion/Extraction Reactions. ACS Appl. Energy Mater. 2021, 4, 8142–8149. [Google Scholar] [CrossRef]
- McGrogan, F.P.; Raja, S.N.; Chiang, Y.M.; Van Vliet, K.J. Electrochemomechanical fatigue: Decoupling mechanisms of fracture-induced performance degradation in LiXMn2O4. J. Electrochem. Soc. 2018, 165, A2458. [Google Scholar] [CrossRef] [Green Version]
- Thackeray, M.M.; Shao-Horn, Y.; Kahaian, A.J.; Kepler, K.D.; Skinner, E.; Vaughey, J.T.; Hackney, S.A. Structural fatigue in spinel electrodes in high voltage (4 V) Li/LixMn2O4 cells. Electrochem. Solid-State Lett. 1998, 1, 7. [Google Scholar] [CrossRef]
- Warburton, R.E.; Castro, F.C.; Deshpande, S.; Madsen, K.E.; Bassett, K.L.; Dos Reis, R.; Gewirth, A.A.; Dravid, V.P.; Greeley, J. Oriented LiMn2O4 particle fracture from delithiation-driven surface stress. ACS Appl. Mater. Interfaces 2020, 12, 49182–49191. [Google Scholar] [CrossRef]
- Hao, X.; Lin, X.; Lu, W.; Bartlett, B.M. Oxygen vacancies lead to loss of domain order, particle fracture, and rapid capacity fade in lithium manganospinel (LiMn2O4) batteries. ACS Appl. Mater. Interfaces 2014, 6, 10849–10857. [Google Scholar] [CrossRef] [PubMed]
- Liu, Z.; Han, K.; Chen-Wiegart, Y.c.K.; Wang, J.; Kung, H.H.; Wang, J.; Barnett, S.A.; Faber, K.T. X-ray nanotomography analysis of the microstructural evolution of LiMn2O4 electrodes. J. Power Sources 2017, 360, 460–469. [Google Scholar] [CrossRef]
- Yu, Y.S.; Kim, C.; Liu, Y.; Van der Ven, A.; Meng, Y.S.; Kostecki, R.; Cabana, J. Nonequilibrium pathways during electrochemical phase transformations in single crystals revealed by dynamic chemical imaging at nanoscale resolution. Adv. Energy Mater. 2015, 5, 1402040. [Google Scholar] [CrossRef] [Green Version]
- Zhang, Z.; Chen, Z.; Wang, G.; Ren, H.; Pan, M.; Xiao, L.; Wu, K.; Zhao, L.; Yang, J.; Wu, Q.; et al. Dual-doping to suppress cracking in spinel LiMn2O4: A joint theoretical and experimental study. Phys. Chem. Chem. Phys. 2016, 18, 6893–6900. [Google Scholar] [CrossRef] [PubMed]
- Morgan, D.; Van der Ven, A.; Ceder, G. Li conductivity in li x mpo 4 (m = mn, fe, co, ni) olivine materials. Electrochem. Solid-State Lett. 2003, 7, A30. [Google Scholar] [CrossRef]
- Ramana, C.; Mauger, A.; Gendron, F.; Julien, C.; Zaghib, K. Study of the Li-insertion/extraction process in LiFePO4/FePO4. J. Power Sources 2009, 187, 555–564. [Google Scholar] [CrossRef]
- Love, C.T.; Korovina, A.; Patridge, C.J.; Swider-Lyons, K.E.; Twigg, M.E.; Ramaker, D.E. Review of LiFePO4 phase transition mechanisms and new observations from x-ray absorption spectroscopy. J. Electrochem. Soc. 2013, 160, A3153. [Google Scholar] [CrossRef]
- Malik, R.; Abdellahi, A.; Ceder, G. A critical review of the Li insertion mechanisms in LiFePO4 electrodes. J. Electrochem. Soc. 2013, 160, A3179. [Google Scholar] [CrossRef]
- Chen, G.; Song, X.; Richardson, T.J. Electron microscopy study of the LiFePO4 to FePO4 phase transition. Electrochem. -Solid-State Lett. 2006, 9, A295. [Google Scholar] [CrossRef]
- Boesenberg, U.; Meirer, F.; Liu, Y.; Shukla, A.K.; Dell’Anna, R.; Tyliszczak, T.; Chen, G.; Andrews, J.C.; Richardson, T.J.; Kostecki, R.; et al. Mesoscale phase distribution in single particles of LiFePO4 following lithium deintercalation. Chem. Mater. 2013, 25, 1664–1672. [Google Scholar] [CrossRef]
- Yu, Y.S.; Kim, C.; Shapiro, D.A.; Farmand, M.; Qian, D.; Tyliszczak, T.; Kilcoyne, A.D.; Celestre, R.; Marchesini, S.; Joseph, J.; et al. Dependence on crystal size of the nanoscale chemical phase distribution and fracture in LixFePO4. Nano Lett. 2015, 15, 4282–4288. [Google Scholar] [CrossRef] [PubMed] [Green Version]
- Gabrisch, H.; Wilcox, J.; Doeff, M. TEM study of fracturing in spherical and plate-like LiFePO4 particles. Electrochem. Solid-State Lett. 2008, 11, A25. [Google Scholar] [CrossRef]
- Fu, J.; Wang, K.; Liu, D.; Zhang, Z.; Sui, M.; Yan, P. b-Axis Phase Boundary Movement Induced (020) Plane Cracking in LiFePO4. ACS Appl. Mater. Interfaces 2020, 12, 39245–39251. [Google Scholar] [CrossRef]
- Brunetti, G.; Robert, D.; Bayle-Guillemaud, P.; Rouviere, J.; Rauch, E.; Martin, J.; Colin, J.; Bertin, F.; Cayron, C. Confirmation of the domino-cascade model by LiFePO4/FePO4 precession electron diffraction. Chem. Mater. 2011, 23, 4515–4524. [Google Scholar] [CrossRef]
- Wang, D.; Wu, X.; Wang, Z.; Chen, L. Cracking causing cyclic instability of LiFePO4 cathode material. J. Power Sources 2005, 140, 125–128. [Google Scholar] [CrossRef]
- Shapiro, D.A.; Yu, Y.S.; Tyliszczak, T.; Cabana, J.; Celestre, R.; Chao, W.; Kaznatcheev, K.; Kilcoyne, A.; Maia, F.; Marchesini, S.; et al. Chemical composition mapping with nanometre resolution by soft X-ray microscopy. Nat. Photonics 2014, 8, 765–769. [Google Scholar] [CrossRef] [Green Version]
- Gordon, D.; Wu, M.Y.; Ramanujapuram, A.; Benson, J.; Lee, J.T.; Magasinski, A.; Nitta, N.; Huang, C.; Yushin, G. Enhancing cycle stability of lithium iron phosphate in aqueous electrolytes by increasing electrolyte molarity. Adv. Energy Mater. 2016, 6, 1501805. [Google Scholar] [CrossRef]
- Malik, M.; Chan, K.H.; Azimi, G. Review on the synthesis of LiNixMnyCo1-x-yO2 (NMC) cathodes for lithium-ion batteries. Mater. Today Energy 2022, 28, 101066. [Google Scholar] [CrossRef]
- Wagner, A.C.; Bohn, N.; Geßwein, H.; Neumann, M.; Osenberg, M.; Hilger, A.; Manke, I.; Schmidt, V.; Binder, J.R. Hierarchical Structuring of NMC111-Cathode Materials in Lithium-Ion Batteries: An In-Depth Study on the Influence of Primary and Secondary Particle Sizes on Electrochemical Performance. ACS Appl. Energy Mater. 2020, 3, 12565–12574. [Google Scholar] [CrossRef]
- Ryu, H.H.; Park, K.J.; Yoon, C.S.; Sun, Y.K. Capacity fading of Ni-rich NMC cathodes for high-energy-density lithium-ion batteries: Bulk or surface degradation? Chem. Mater. 2018, 30, 1155–1163. [Google Scholar] [CrossRef]
- Xu, Z.; Rahman, M.M.; Mu, L.; Liu, Y.; Lin, F. Chemomechanical behaviors of layered cathode materials in alkali metal ion batteries. J. Mater. Chem. A 2018, 6, 21859–21884. [Google Scholar] [CrossRef]
- Yan, P.; Zheng, J.; Gu, M.; Xiao, J.; Zhang, J.G.; Wang, C.M. Intragranular cracking as a critical barrier for high-voltage usage of layer-structured cathode for lithium-ion batteries. Nat. Commun. 2017, 8, 14101. [Google Scholar] [CrossRef] [PubMed] [Green Version]
- Yan, P.; Zheng, J.; Chen, T.; Luo, L.; Jiang, Y.; Wang, K.; Sui, M.; Zhang, J.G.; Zhang, S.; Wang, C. Coupling of electrochemically triggered thermal and mechanical effects to aggravate failure in a layered cathode. Nat. Commun. 2018, 9, 2437. [Google Scholar] [CrossRef] [Green Version]
- Ahmed, S.; Pokle, A.; Schweidler, S.; Beyer, A.; Bianchini, M.; Walther, F.; Mazilkin, A.; Hartmann, P.; Brezesinski, T.; Janek, J.; et al. The Role of Intragranular Nanopores in Capacity Fade of Nickel-Rich Layered Li (Ni1–x–yCoxMny)O2 Cathode Materials. ACS Nano 2019, 13, 10694–10704. [Google Scholar] [CrossRef]
- Lin, Q.; Guan, W.; Zhou, J.; Meng, J.; Huang, W.; Chen, T.; Gao, Q.; Wei, X.; Zeng, Y.; Li, J.; et al. Ni–Li anti-site defect induced intragranular cracking in Ni-rich layer-structured cathode. Nano Energy 2020, 76, 105021. [Google Scholar] [CrossRef]
- Zheng, J.; Yan, P.; Zhang, J.; Engelhard, M.H.; Zhu, Z.; Polzin, B.J.; Trask, S.; Xiao, J.; Wang, C.; Zhang, J. Suppressed oxygen extraction and degradation of LiNixMnyCozO2 cathodes at high charge cut-off voltages. Nano Res. 2017, 10, 4221–4231. [Google Scholar] [CrossRef]
- Mu, L.; Lin, R.; Xu, R.; Han, L.; Xia, S.; Sokaras, D.; Steiner, J.D.; Weng, T.C.; Nordlund, D.; Doeff, M.M.; et al. Oxygen release induced chemomechanical breakdown of layered cathode materials. Nano Lett. 2018, 18, 3241–3249. [Google Scholar] [CrossRef]
- Zhou, Y.N.; Ma, J.; Hu, E.; Yu, X.; Gu, L.; Nam, K.W.; Chen, L.; Wang, Z.; Yang, X.Q. Tuning charge–discharge induced unit cell breathing in layer-structured cathode materials for lithium-ion batteries. Nat. Commun. 2014, 5, 5381. [Google Scholar] [CrossRef] [Green Version]
- Sun, H.H.; Manthiram, A. Impact of microcrack generation and surface degradation on a nickel-rich layered Li [Ni0.9Co0.05Mn0.05]O2 cathode for lithium-ion batteries. Chem. Mater. 2017, 29, 8486–8493. [Google Scholar] [CrossRef]
- Xia, S.; Mu, L.; Xu, Z.; Wang, J.; Wei, C.; Liu, L.; Pianetta, P.; Zhao, K.; Yu, X.; Lin, F.; et al. Chemomechanical interplay of layered cathode materials undergoing fast charging in lithium batteries. Nano Energy 2018, 53, 753–762. [Google Scholar] [CrossRef]
- Gent, W.E.; Li, Y.; Ahn, S.; Lim, J.; Liu, Y.; Wise, A.M.; Gopal, C.B.; Mueller, D.N.; Davis, R.; Weker, J.N.; et al. Persistent State-of-Charge Heterogeneity in Relaxed, Partially Charged Li1-xNi1/3Co1/3Mn1/3O2 Secondary Particles. Adv. Mater. 2016, 28, 6631–6638. [Google Scholar] [CrossRef]
- Mao, Y.; Wang, X.; Xia, S.; Zhang, K.; Wei, C.; Bak, S.; Shadike, Z.; Liu, X.; Yang, Y.; Xu, R.; et al. High-voltage charging-induced strain, heterogeneity, and micro-cracks in secondary particles of a nickel-rich layered cathode material. Adv. Funct. Mater. 2019, 29, 1900247. [Google Scholar] [CrossRef]
- Kondrakov, A.O.; Schmidt, A.; Xu, J.; Geßwein, H.; Mönig, R.; Hartmann, P.; Sommer, H.; Brezesinski, T.; Janek, J. Anisotropic lattice strain and mechanical degradation of high-and low-nickel NCM cathode materials for Li-ion batteries. J. Phys. Chem. C 2017, 121, 3286–3294. [Google Scholar] [CrossRef]
- Hu, J.; Li, L.; Hu, E.; Chae, S.; Jia, H.; Liu, T.; Wu, B.; Bi, Y.; Amine, K.; Wang, C.; et al. Mesoscale-architecture-based crack evolution dictating cycling stability of advanced lithium ion batteries. Nano Energy 2021, 79, 105420. [Google Scholar] [CrossRef]
- Li, G.; Zhang, Z.; Huang, Z.; Yang, C.; Zuo, Z.; Zhou, H. Understanding the accumulated cycle capacity fade caused by the secondary particle fracture of LiNi1-x-yCoxMnyO2 cathode for lithium ion batteries. J. Solid State Electrochem. 2017, 21, 673–682. [Google Scholar] [CrossRef]
- Kim, Y. Lithium nickel cobalt manganese oxide synthesized using alkali chloride flux: Morphology and performance as a cathode material for lithium ion batteries. ACS Appl. Mater. Interfaces 2012, 4, 2329–2333. [Google Scholar] [CrossRef]
- Fan, X.; Hu, G.; Zhang, B.; Ou, X.; Zhang, J.; Zhao, W.; Jia, H.; Zou, L.; Li, P.; Yang, Y. Crack-free single-crystalline Ni-rich layered NCM cathode enable superior cycling performance of lithium-ion batteries. Nano Energy 2020, 70, 104450. [Google Scholar] [CrossRef]
- Qian, G.; Zhang, Y.; Li, L.; Zhang, R.; Xu, J.; Cheng, Z.; Xie, S.; Wang, H.; Rao, Q.; He, Y.; et al. Single-crystal nickel-rich layered-oxide battery cathode materials: Synthesis, electrochemistry, and intra-granular fracture. Energy Storage Mater. 2020, 27, 140–149. [Google Scholar] [CrossRef]
- Xu, R.; Sun, H.; de Vasconcelos, L.S.; Zhao, K. Mechanical and structural degradation of LiNixMnyCozO2 cathode in Li-ion batteries: An experimental study. J. Electrochem. Soc. 2017, 164, A3333. [Google Scholar] [CrossRef]
- De Vasconcelos, L.; Sharma, N.; Xu, R.; Zhao, K. In-situ nanoindentation measurement of local mechanical behavior of a Li-ion battery cathode in liquid electrolyte. Exp. Mech. 2019, 59, 337–347. [Google Scholar] [CrossRef]
- Chen, C.; Liu, J.; Stoll, M.; Henriksen, G.; Vissers, D.; Amine, K. Aluminum-doped lithium nickel cobalt oxide electrodes for high-power lithium-ion batteries. J. Power Sources 2004, 128, 278–285. [Google Scholar] [CrossRef]
- Jo, M.; Noh, M.; Oh, P.; Kim, Y.; Cho, J. A new high power LiNi0.81Co0.1Al0.09O2 cathode material for lithium-ion batteries. Adv. Energy Mater. 2014, 4, 1301583. [Google Scholar] [CrossRef]
- Watanabe, S.; Kinoshita, M.; Hosokawa, T.; Morigaki, K.; Nakura, K. Capacity fade of LiAlyNi1-x-yCoxO2 cathode for lithium-ion batteries during accelerated calendar and cycle life tests (surface analysis of LiAlyNi1-x-yCoxO2 cathode after cycle tests in restricted depth of discharge ranges). J. Power Sources 2014, 258, 210–217. [Google Scholar] [CrossRef]
- Liu, H.; Wolfman, M.; Karki, K.; Yu, Y.S.; Stach, E.A.; Cabana, J.; Chapman, K.W.; Chupas, P.J. Intergranular cracking as a major cause of long-term capacity fading of layered cathodes. Nano Lett. 2017, 17, 3452–3457. [Google Scholar] [CrossRef] [PubMed]
- Wang, B.; Zhang, F.l.; Zhou, X.a.; Wang, P.; Wang, J.; Ding, H.; Dong, H.; Liang, W.b.; Zhang, N.s.; Li, S.y. Which of the nickel-rich NCM and NCA is structurally superior as a cathode material for lithium-ion batteries? J. Mater. Chem. A 2021, 9, 13540–13551. [Google Scholar] [CrossRef]
- Park, K.J.; Hwang, J.Y.; Ryu, H.H.; Maglia, F.; Kim, S.J.; Lamp, P.; Yoon, C.S.; Sun, Y.K. Degradation mechanism of Ni-enriched NCA cathode for lithium batteries: Are microcracks really critical? ACS Energy Lett. 2019, 4, 1394–1400. [Google Scholar] [CrossRef] [Green Version]
- Park, K.J.; Choi, M.J.; Maglia, F.; Kim, S.J.; Kim, K.H.; Yoon, C.S.; Sun, Y.K. High-capacity concentration gradient Li[Ni0.865Co0.120Al0.015]O2 cathode for lithium-ion batteries. Adv. Energy Mater. 2018, 8, 1703612. [Google Scholar] [CrossRef]
- Besli, M.M.; Shukla, A.K.; Wei, C.; Metzger, M.; Alvarado, J.; Boell, J.; Nordlund, D.; Schneider, G.; Hellstrom, S.; Johnston, C.; et al. Thermally-driven mesopore formation and oxygen release in delithiated NCA cathode particles. J. Mater. Chem. A 2019, 7, 12593–12603. [Google Scholar] [CrossRef] [Green Version]
- Mizushima, K.; Jones, P.; Wiseman, P.; Goodenough, J.B. LixCoO2 (0 < x < −1): A new cathode material for batteries of high energy density. Mater. Res. Bull. 1980, 15, 783–789. [Google Scholar]
- Jiang, Y.; Yan, P.; Yu, M.; Li, J.; Jiao, H.; Zhou, B.; Sui, M. Atomistic mechanism of cracking degradation at twin boundary of LiCoO2. Nano Energy 2020, 78, 105364. [Google Scholar] [CrossRef]
- Hitt, A.; Wang, F.; Li, Z.; Ge, M.; Zhang, Y.; Savsatli, Y.; Xiao, X.; Lee, W.K.; Stephens, R.; Tang, M. Nanotomographic observation and statistical analysis of overcharging induced cracks in LiCoO2 single crystalline particles. Energy Storage Mater. 2022, 52, 320–328. [Google Scholar] [CrossRef]
- Marianetti, C.A.; Kotliar, G.; Ceder, G. A first-order Mott transition in LixCoO2. Nat. Mater. 2004, 3, 627–631. [Google Scholar] [CrossRef] [PubMed]
- Reimers, J.N.; Dahn, J. Electrochemical and in situ X-ray diffraction studies of lithium intercalation in LixCoO2. J. Electrochem. Soc. 1992, 139, 2091. [Google Scholar] [CrossRef]
- Van der Ven, A.; Aydinol, M.; Ceder, G.; Kresse, G.; Hafner, J. First-principles investigation of phase stability in LixCoO2. Phys. Rev. B 1998, 58, 2975. [Google Scholar] [CrossRef]
- Chen, Z.; Lu, Z.; Dahn, J. Staging phase transitions in LixCoO2. J. Electrochem. Soc. 2002, 149, A1604. [Google Scholar] [CrossRef]
- Ohnishi, T.; Mitsuishi, K.; Takada, K. In Situ X-ray Diffraction of LiCoO2 in Thin-Film Batteries under High-Voltage Charging. ACS Appl. Energy Mater. 2021, 4, 14372–14379. [Google Scholar] [CrossRef]
- Jiang, Y.; Qin, C.; Yan, P.; Sui, M. Origins of capacity and voltage fading of LiCoO2 upon high voltage cycling. J. Mater. Chem. A 2019, 7, 20824–20831. [Google Scholar] [CrossRef]
- Amatucci, G.; Tarascon, J.; Klein, L. CoO2, the end member of the LixCoO2 solid solution. J. Electrochem. Soc. 1996, 143, 1114. [Google Scholar] [CrossRef]
- Xie, Y.; Jin, Y.; Xiang, L. Li-rich layered oxides: Structure, capacity and voltage fading mechanisms and solving strategies. Particuology 2022, 61, 1–10. [Google Scholar] [CrossRef]
- Chen, C.J.; Pang, W.K.; Mori, T.; Peterson, V.K.; Sharma, N.; Lee, P.H.; Wu, S.h.; Wang, C.C.; Song, Y.F.; Liu, R.S. The Origin of Capacity Fade in the Li2MnO3·LiMO2 (M= Li, Ni, Co, Mn) Microsphere Positive Electrode: An Operando Neutron Diffraction and Transmission X-ray Microscopy Study. J. Am. Chem. Soc. 2016, 138, 8824–8833. [Google Scholar] [CrossRef]
- Cha, H.; Kim, J.; Lee, H.; Kim, N.; Hwang, J.; Sung, J.; Yoon, M.; Kim, K.; Cho, J. Boosting reaction homogeneity in high-energy lithium-ion battery cathode materials. Adv. Mater. 2020, 32, 2003040. [Google Scholar] [CrossRef]
- Wang, L.; Dai, A.; Xu, W.; Lee, S.; Cha, W.; Harder, R.; Liu, T.; Ren, Y.; Yin, G.; Zuo, P.; et al. Structural distortion induced by manganese activation in a lithium-rich layered cathode. J. Am. Chem. Soc. 2020, 142, 14966–14973. [Google Scholar] [CrossRef]
- Song, B.; Liu, Z.; Lai, M.O.; Lu, L. Structural evolution and the capacity fade mechanism upon long-term cycling in Li-rich cathode material. Phys. Chem. Chem. Phys. 2012, 14, 12875–12883. [Google Scholar] [CrossRef] [PubMed]
- Xu, B.; Fell, C.R.; Chi, M.; Meng, Y.S. Identifying surface structural changes in layered Li-excess nickel manganese oxides in high voltage lithium ion batteries: A joint experimental and theoretical study. Energy Environ. Sci. 2011, 4, 2223–2233. [Google Scholar] [CrossRef]
- Lei, Y.; Ni, J.; Hu, Z.; Wang, Z.; Gui, F.; Li, B.; Ming, P.; Zhang, C.; Elias, Y.; Aurbach, D.; et al. Surface Modification of Li-Rich Mn-Based Layered Oxide Cathodes: Challenges, Materials, Methods, and Characterization. Adv. Energy Mater. 2020, 10, 2002506. [Google Scholar] [CrossRef]
- Kim, U.H.; Kuo, L.Y.; Kaghazchi, P.; Yoon, C.S.; Sun, Y.K. Quaternary layered Ni-rich NCMA cathode for lithium-ion batteries. ACS Energy Lett. 2019, 4, 576–582. [Google Scholar] [CrossRef] [Green Version]
- Zhang, L.; Jiang, J.; Zhang, W. Capacity Decay Mechanism of the LCO+ NMC532/Graphite cells combined with post-mortem technique. Energies 2017, 10, 1147. [Google Scholar] [CrossRef]
- Schweidler, S.; de Biasi, L.; Garcia, G.; Mazilkin, A.; Hartmann, P.; Brezesinski, T.; Janek, J. Investigation into mechanical degradation and fatigue of high-Ni NCM cathode material: A long-term cycling study of full cells. ACS Appl. Energy Mater. 2019, 2, 7375–7384. [Google Scholar] [CrossRef]
- Chen, D.; Kramer, D.; Mönig, R. Chemomechanical fatigue of LiMn1.95Al0.05O4 electrodes for lithium-ion batteries. Electrochim. Acta 2018, 259, 939–948. [Google Scholar] [CrossRef]
- Wu, H.; Qin, C.; Wang, K.; Han, X.; Sui, M.; Yan, P. Revealing two distinctive intergranular cracking mechanisms of Ni-rich layered cathode by cross-sectional scanning electron microscopy. J. Power Sources 2021, 503, 230066. [Google Scholar] [CrossRef]
- Cheng, X.; Li, Y.; Cao, T.; Wu, R.; Wang, M.; Liu, H.; Liu, X.; Lu, J.; Zhang, Y. Real-time observation of chemomechanical breakdown in a layered nickel-rich oxide cathode realized by in situ scanning electron microscopy. ACS Energy Lett. 2021, 6, 1703–1710. [Google Scholar] [CrossRef]
- Ali, Y.; Iqbal, N.; Lee, S. Role of SEI layer growth in fracture probability in lithium-ion battery electrodes. Int. J. Energy Res. 2021, 45, 5293–5308. [Google Scholar] [CrossRef]
- Nam, G.W.; Park, N.Y.; Park, K.J.; Yang, J.; Liu, J.; Yoon, C.S.; Sun, Y.K. Capacity fading of Ni-rich NCA cathodes: Effect of microcracking extent. ACS Energy Lett. 2019, 4, 2995–3001. [Google Scholar] [CrossRef]
- Didier, C.; Pang, W.K.; Guo, Z.; Schmid, S.; Peterson, V.K. Phase Evolution and Intermittent Disorder in Electrochemically Lithiated Graphite Determined Using in Operando Neutron Diffraction. Chem. Mater. 2020, 32, 2518–2531. [Google Scholar] [CrossRef]
- Winter, M.; Besenhard, J.O.; Spahr, M.E.; Novak, P. Insertion electrode materials for rechargeable lithium batteries. Adv. Mater. 1998, 10, 725–763. [Google Scholar] [CrossRef]
- Schweidler, S.; de Biasi, L.; Schiele, A.; Hartmann, P.; Brezesinski, T.; Janek, J. Volume changes of graphite anodes revisited: A combined operando X-ray diffraction and in situ pressure analysis study. J. Phys. Chem. C 2018, 122, 8829–8835. [Google Scholar] [CrossRef]
- Ohzuku, T.; Iwakoshi, Y.; Sawai, K. Formation of lithium-graphite intercalation compounds in nonaqueous electrolytes and their application as a negative electrode for a lithium ion (shuttlecock) cell. J. Electrochem. Soc. 1993, 140, 2490. [Google Scholar] [CrossRef]
Figure 1.
Mechanical stress resulting from inhomogeneous concentration due to (a) single phase-reaction and (b) phase transition.
Figure 1.
Mechanical stress resulting from inhomogeneous concentration due to (a) single phase-reaction and (b) phase transition.

Figure 2.
Crystalline structure of lithiated graphite. Lithium ions are depicted in blue and intercalate between the graphene planes. Carbon atoms are depicted in gray.
Figure 2.
Crystalline structure of lithiated graphite. Lithium ions are depicted in blue and intercalate between the graphene planes. Carbon atoms are depicted in gray.
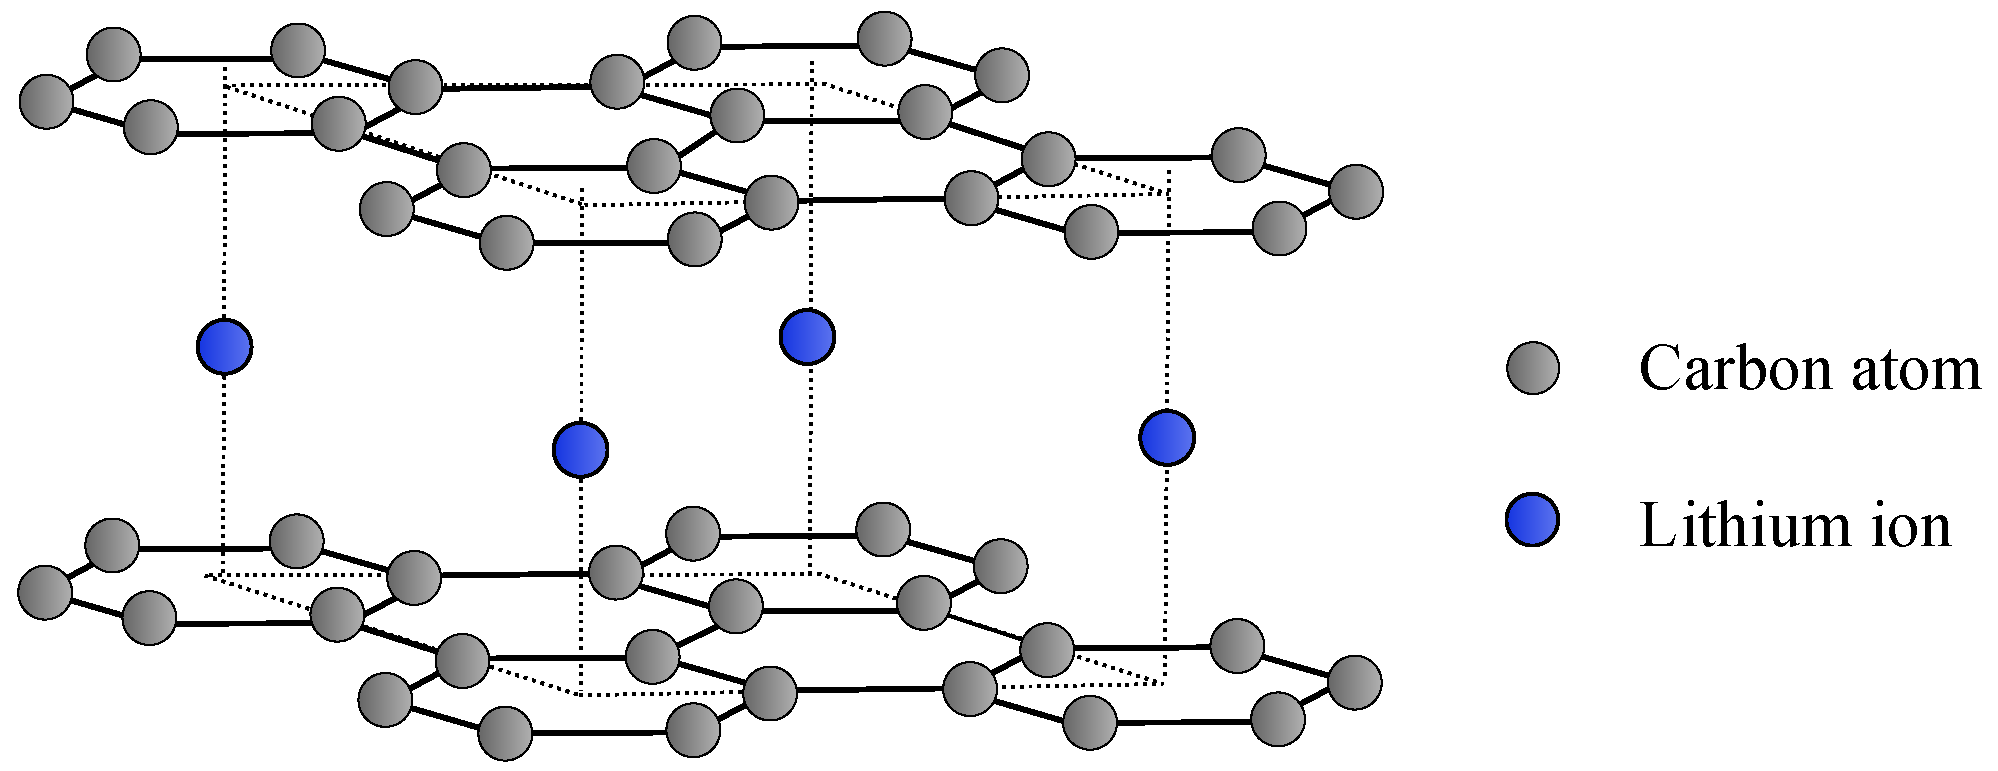
Figure 3.
Cross-sectional SEM image of the (a) pristine graphite and graphite particles from cells cycled at 1C for (b) 200 and (c) 800 cycles. Black arrows point to the cracks. Reproduced with permission from Elsevier from [40], Copyright 2017. (d) Cross-section SEM image of graphite particle and SEI layer; parallel cracks may cause delamination. Reproduced with permission from Elsevier from [45], Copyright 2011.
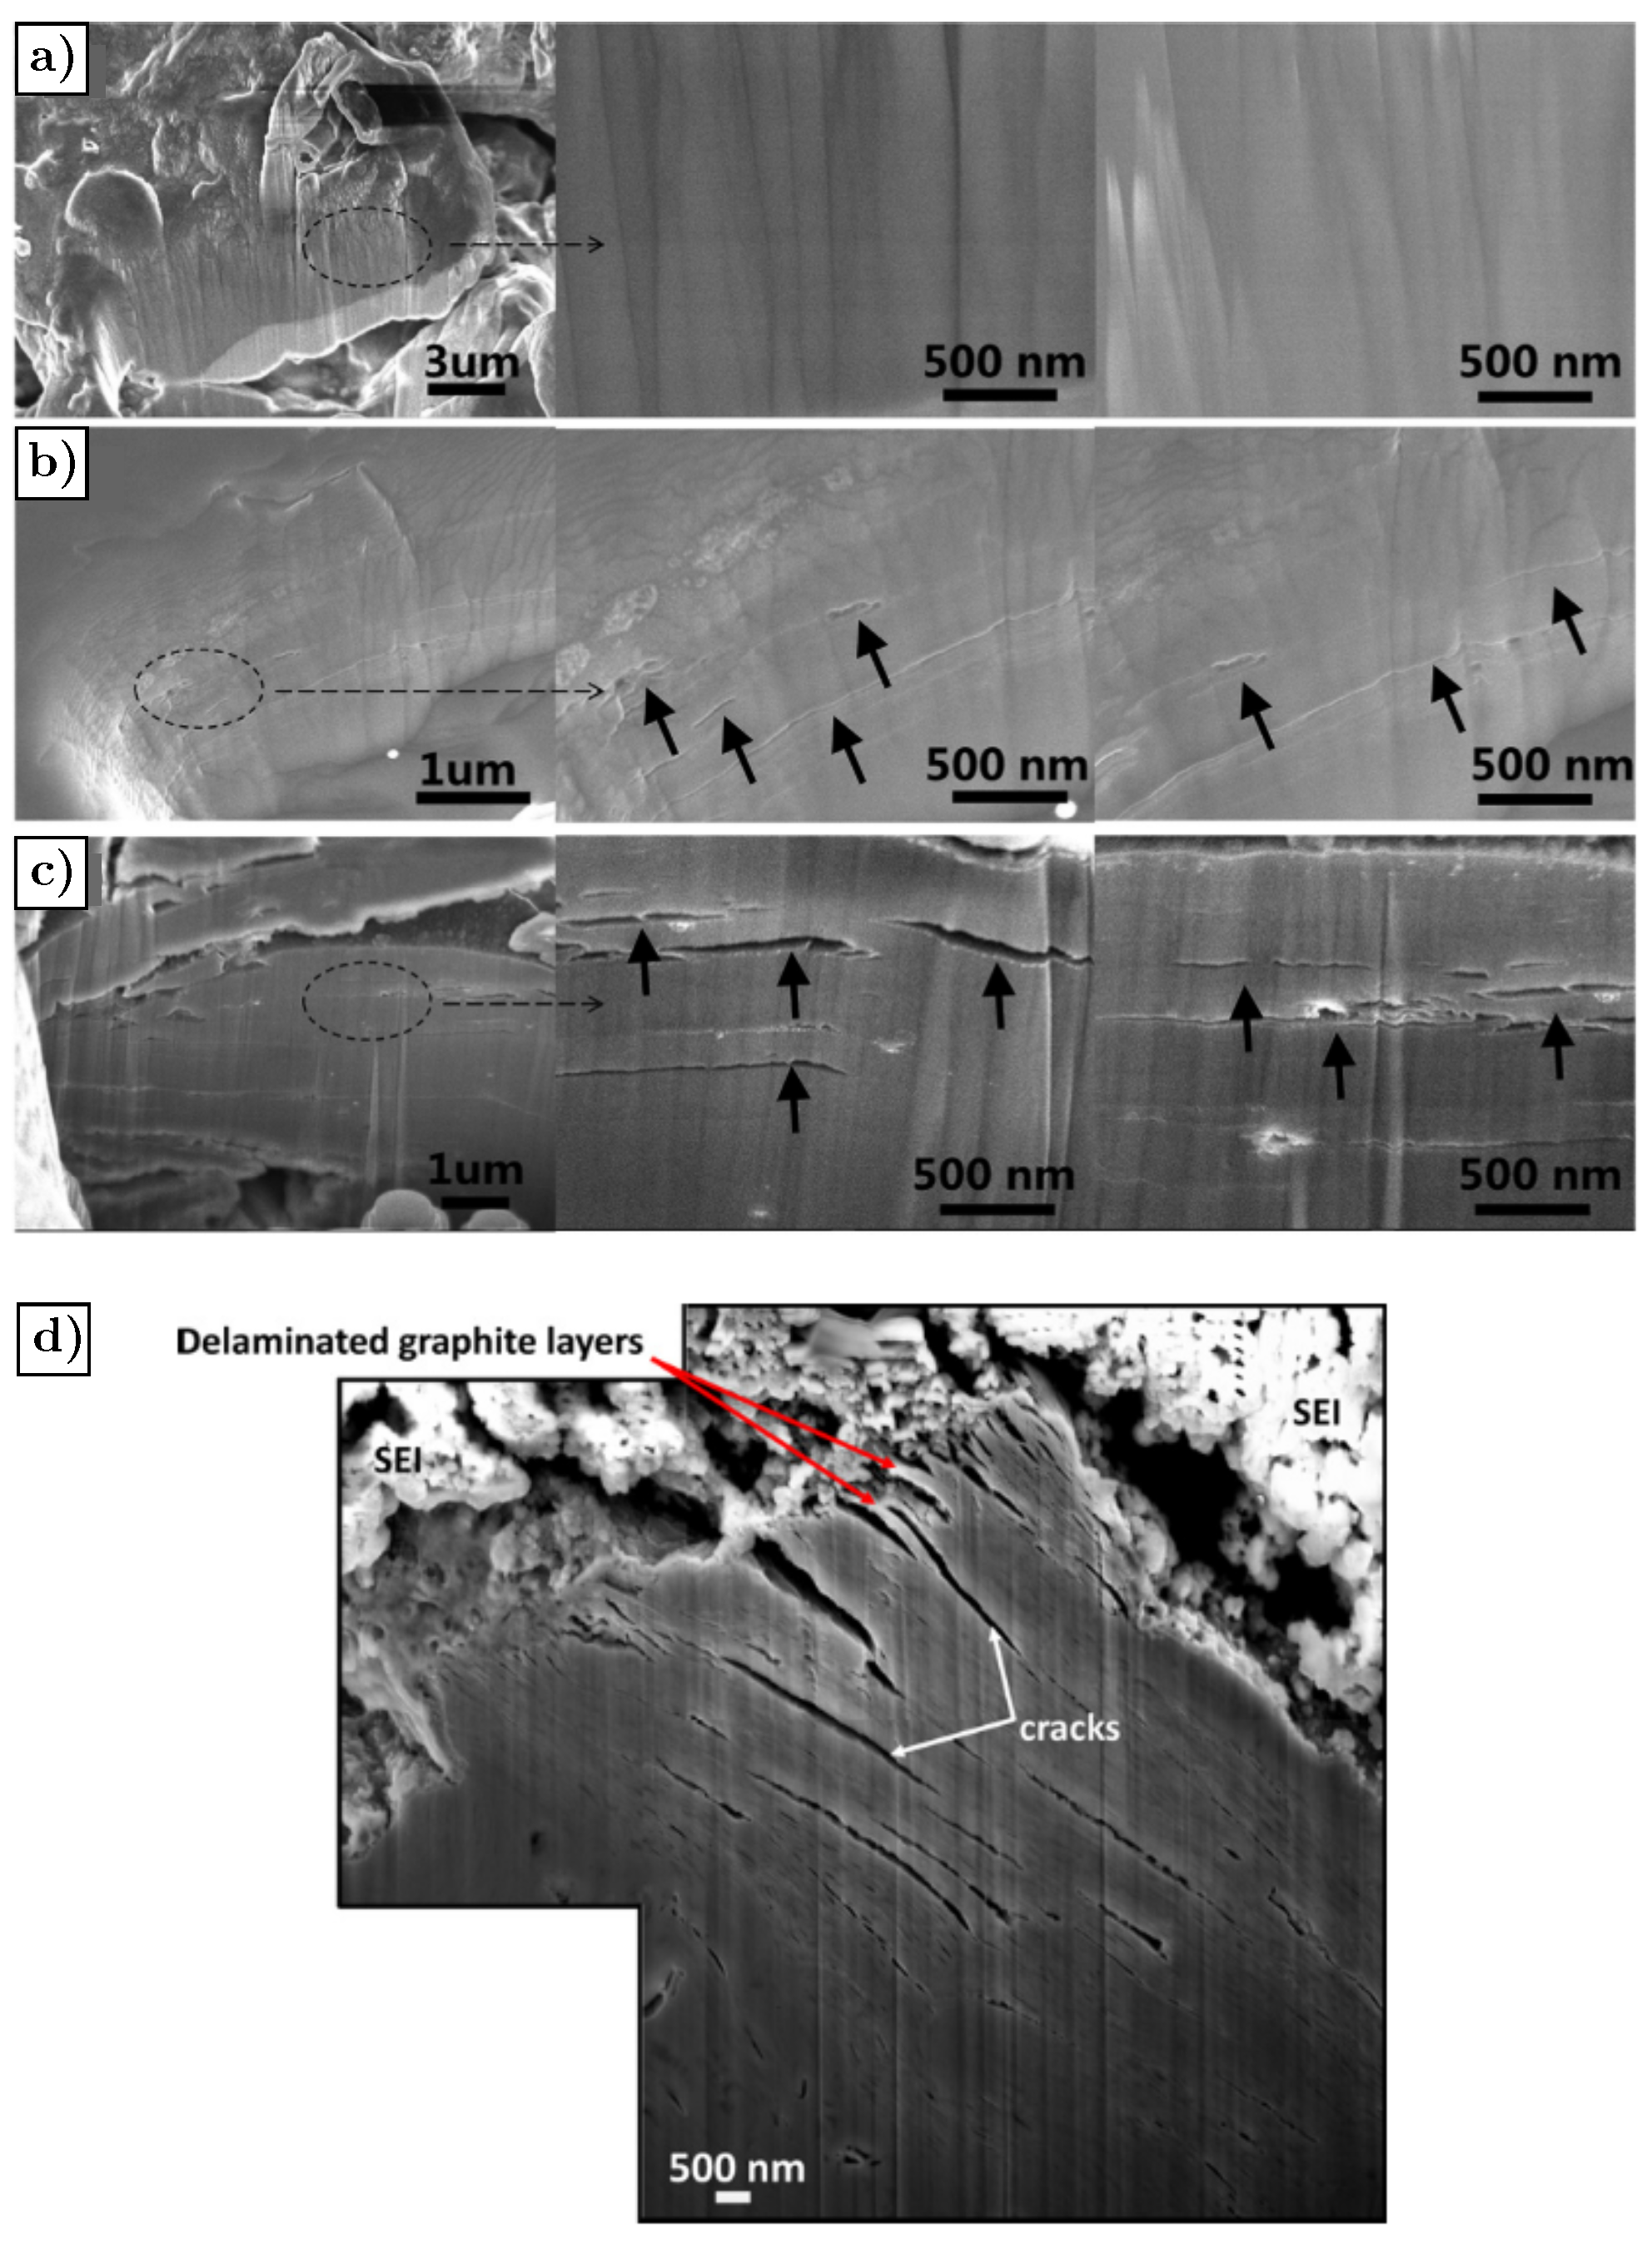
Figure 4.
(a,b) Secondary electron FIB images of the cross-section of a graphite particle. (c,d) The elemental line scan analysis along the black and white lines in panels (a,b), respectively. Adapted with permission by American Chemical Society from [46], Copyright 2005.
Figure 4.
(a,b) Secondary electron FIB images of the cross-section of a graphite particle. (c,d) The elemental line scan analysis along the black and white lines in panels (a,b), respectively. Adapted with permission by American Chemical Society from [46], Copyright 2005.

Figure 5.
SEM images showing cracks in silicon nanowire, pointed out by the red arrow. (a) Top view and (b) Side view. Reprinted with permission from [54], Copyright 2012.
Figure 5.
SEM images showing cracks in silicon nanowire, pointed out by the red arrow. (a) Top view and (b) Side view. Reprinted with permission from [54], Copyright 2012.

Figure 6.
Crack growth as a function of lithiation cycles in thin film after (a) 3, (b) 8, and (c) 50 cycles. (d–f) Detail of crack pattern after 30 lithiation cycles. Reprinted with permission by Nature Publishing Group from [55], Copyright 2016.
Figure 6.
Crack growth as a function of lithiation cycles in thin film after (a) 3, (b) 8, and (c) 50 cycles. (d–f) Detail of crack pattern after 30 lithiation cycles. Reprinted with permission by Nature Publishing Group from [55], Copyright 2016.
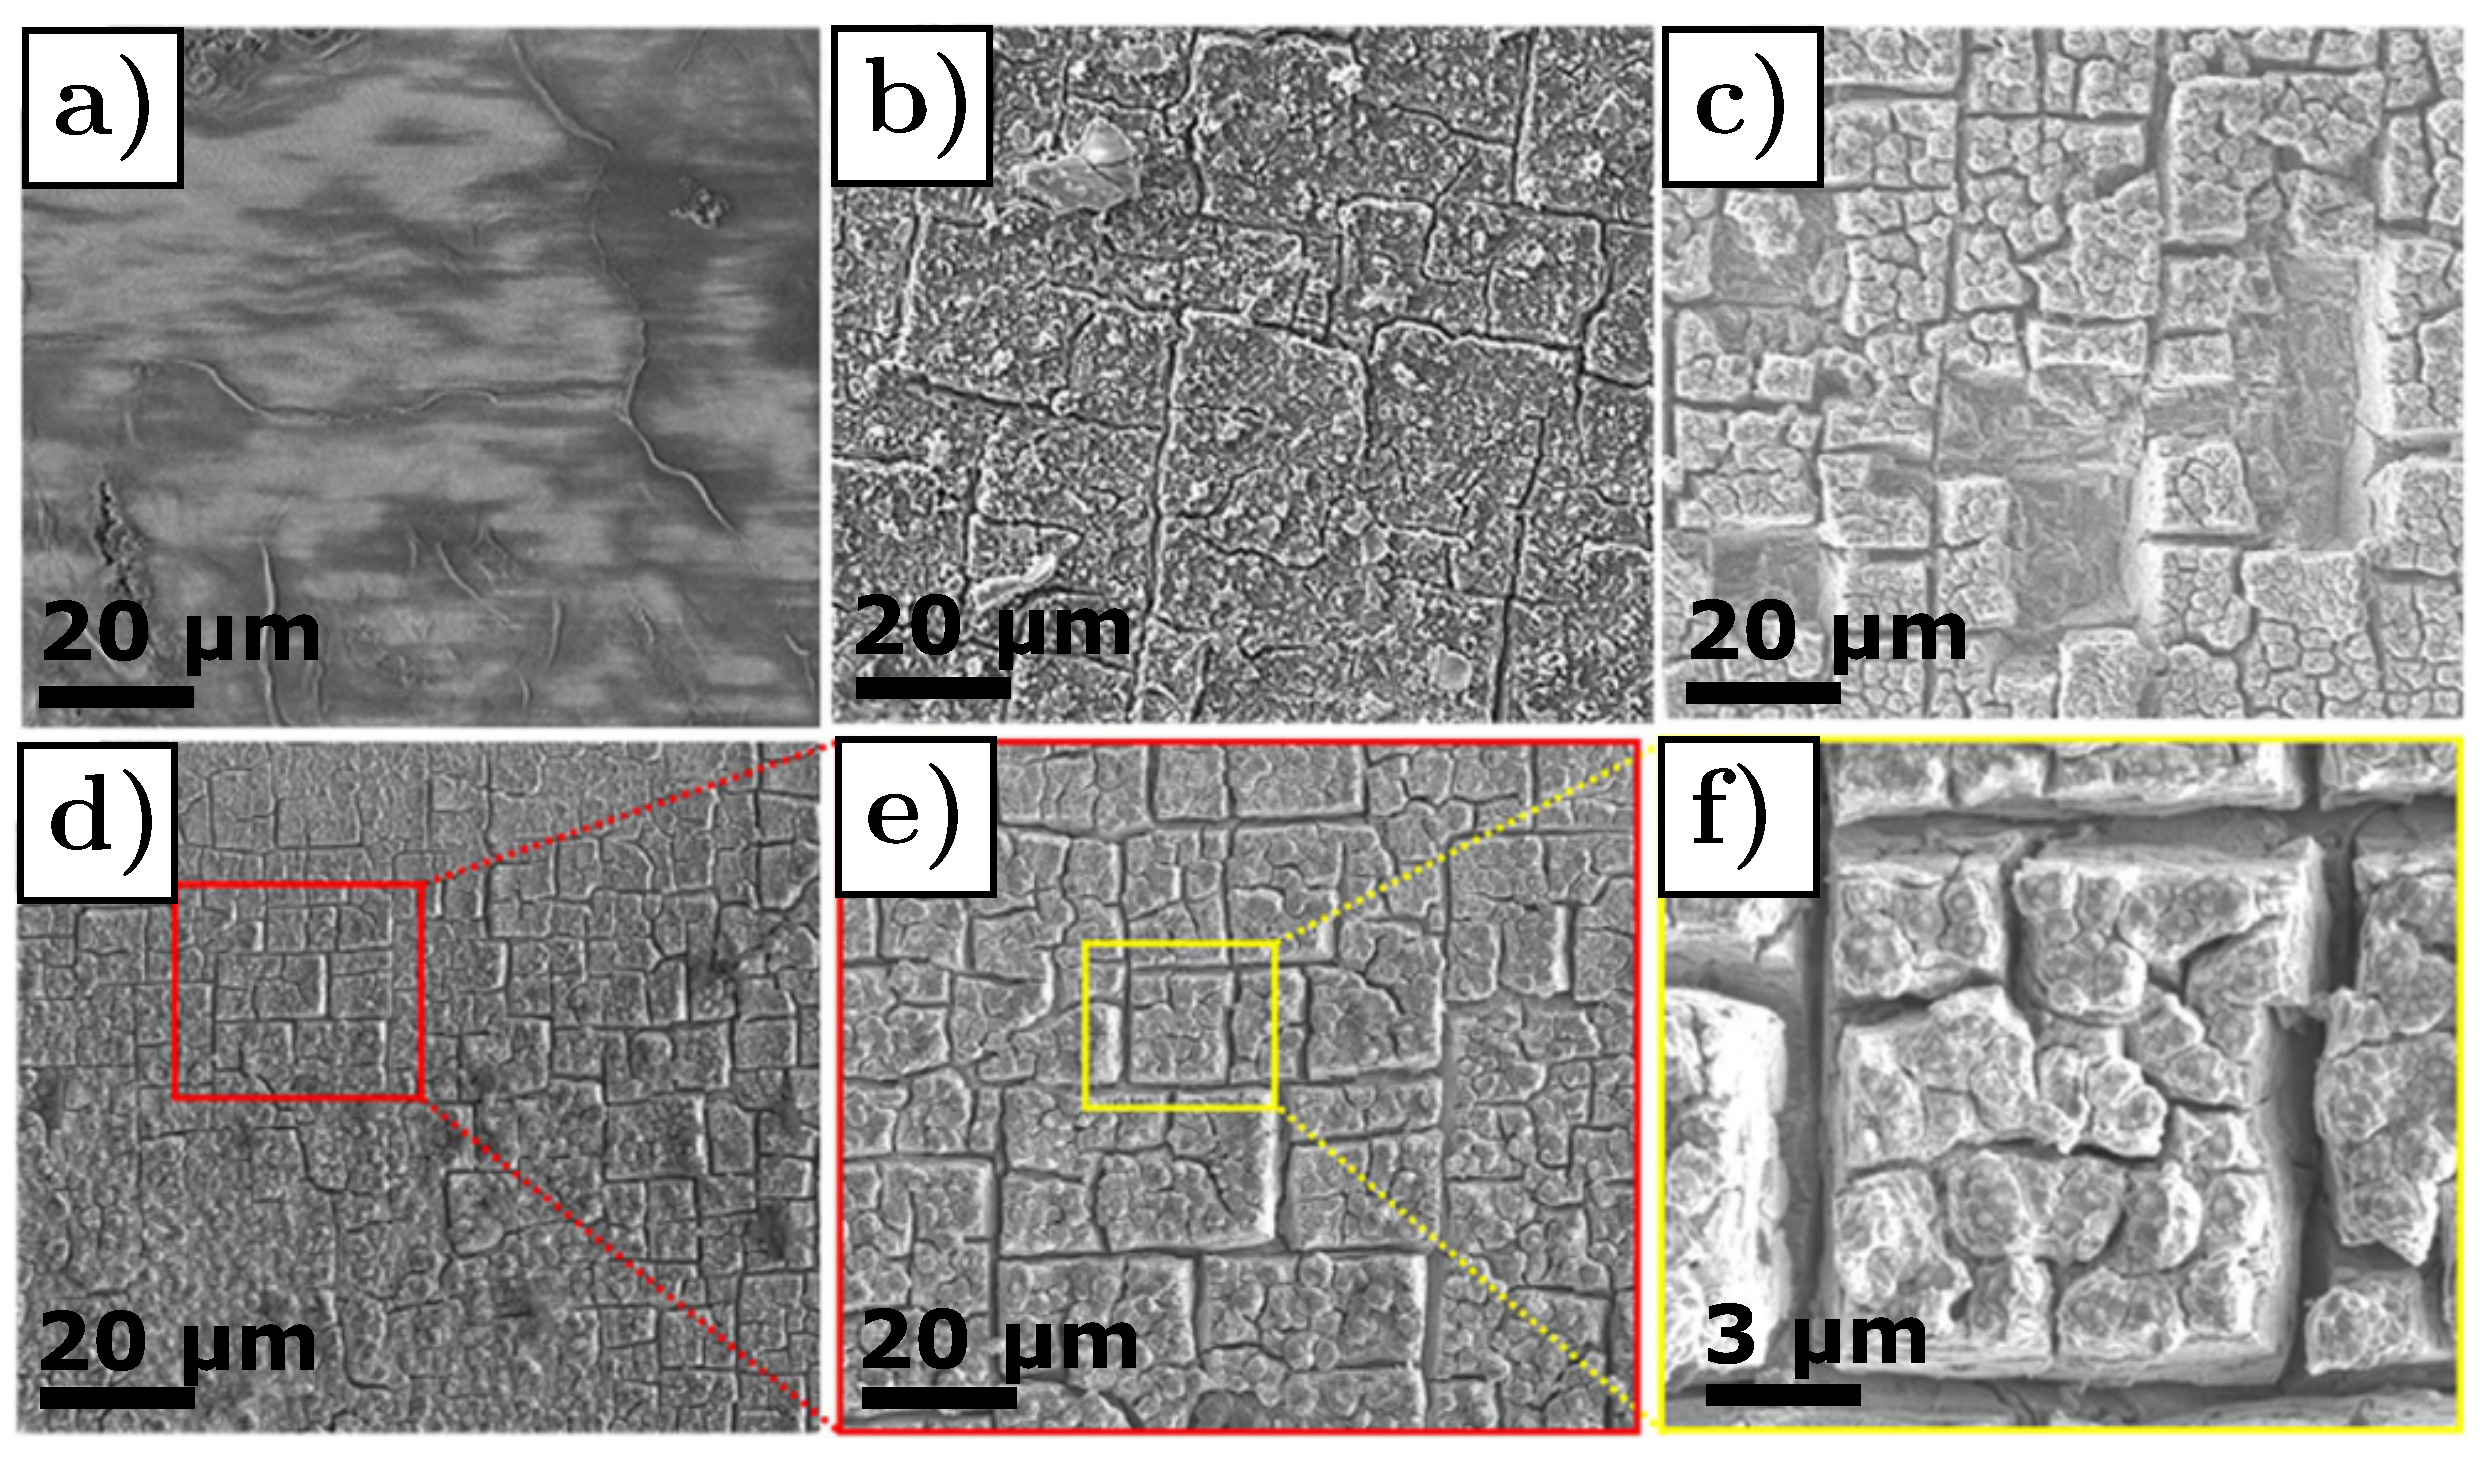
Figure 7.
(a) Cell potential vs. capacity curve corresponding to lithiation and delithiation Si thin−film electrode cycled at C/4 rate, and (b) the corresponding average stress computed from the measured curvature of the substrate. Adapted with permission by Elsevier from [56], Copyright 2010.
Figure 7.
(a) Cell potential vs. capacity curve corresponding to lithiation and delithiation Si thin−film electrode cycled at C/4 rate, and (b) the corresponding average stress computed from the measured curvature of the substrate. Adapted with permission by Elsevier from [56], Copyright 2010.

Figure 8.
(a–h) Crack growth during single lithiation cycle in silicon nano-particle. The black arrows mark the bumps due to anisotropic lithiation of Si before crack formation, whereas the red arrows mark the cracks. (i,j) Electron diffraction pattern showing the silicon phase transformation from (i) crystalline structure (Si) to (j) polycrystalline structure (). (k) Anisotropic swelling in silicon nanoparticle favoring cracks in [110] direction. Reprinted with permission by American Chemical Society from [51], Copyright 2012.
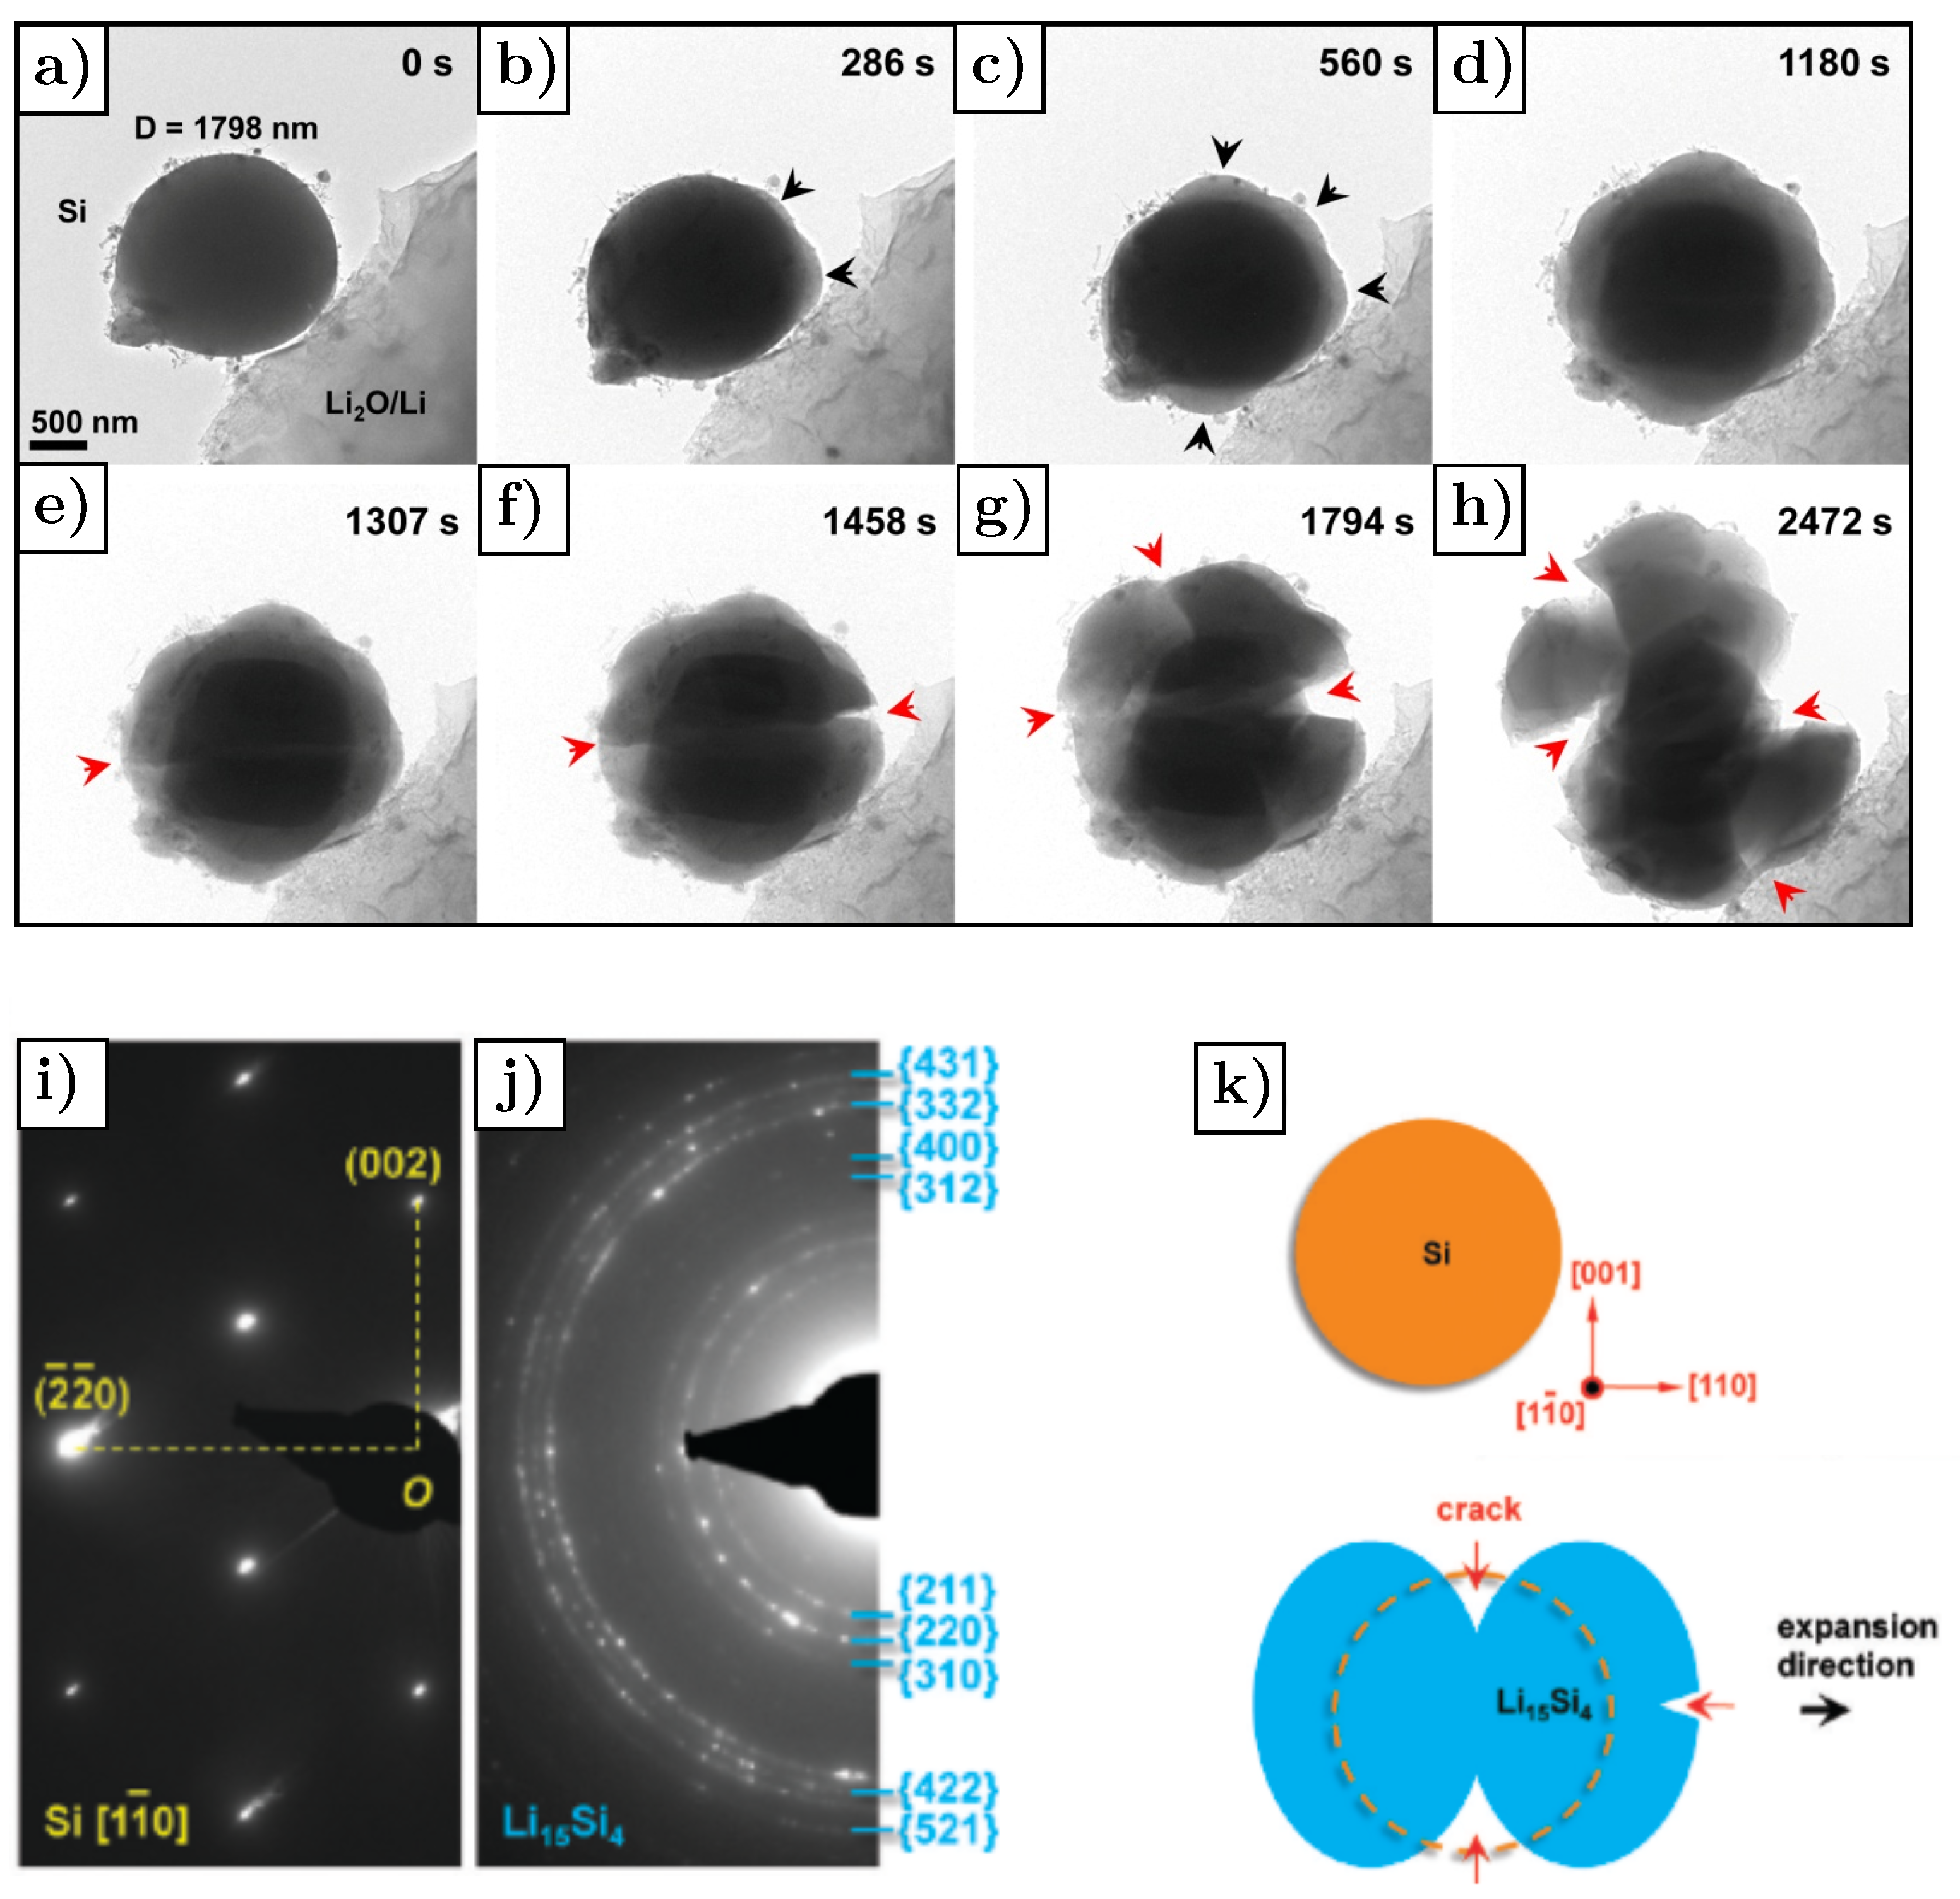
Figure 9.
Effect of carbon coating on capacity fade. (a) Specific delithiation capacity as a function of the number of cycles for silicon thin film with carbon coating of different thickness, namely 10 nm, 40 nm, and 80 nm, for SiC10, SiC40 and SiC80, respectively. Reprinted with permission by Elsevier from [64], Copyright 2021. (b) Occurrence of fracture as a function of the ratio between particle diameter (D) and coating thickness (t). Reprinted with permission by Royal Society of Chemistry from [65], Copyright 2016.

Figure 10.
Lithiation of (a–c) uncoated silicon particle and (d–f) coated silicon particles. The time value depicted in the figure refers to the lithiation time. Reprinted with permission by Elsevier from [68], Copyright 2016.
Figure 10.
Lithiation of (a–c) uncoated silicon particle and (d–f) coated silicon particles. The time value depicted in the figure refers to the lithiation time. Reprinted with permission by Elsevier from [68], Copyright 2016.

Figure 11.
(a) Cubic and (b) tetragonal structure of LMO with the corresponding preferential cracks directions. Reprinted with permission by American Chemical Society from [83], Copyright 2021.
Figure 11.
(a) Cubic and (b) tetragonal structure of LMO with the corresponding preferential cracks directions. Reprinted with permission by American Chemical Society from [83], Copyright 2021.

Figure 12.
(a) Fracture in LMO particle after 16 deep discharge cycles with Jahn–Teller transformation and 51 cycles without Jahn–Teller transformation. (b) Internal view of LMO particle shown in (a) after FIB milling. White arrows point to the cracks. Reprinted with permission by Journal of The Electrochemical Society from [84], Copyright 2018.
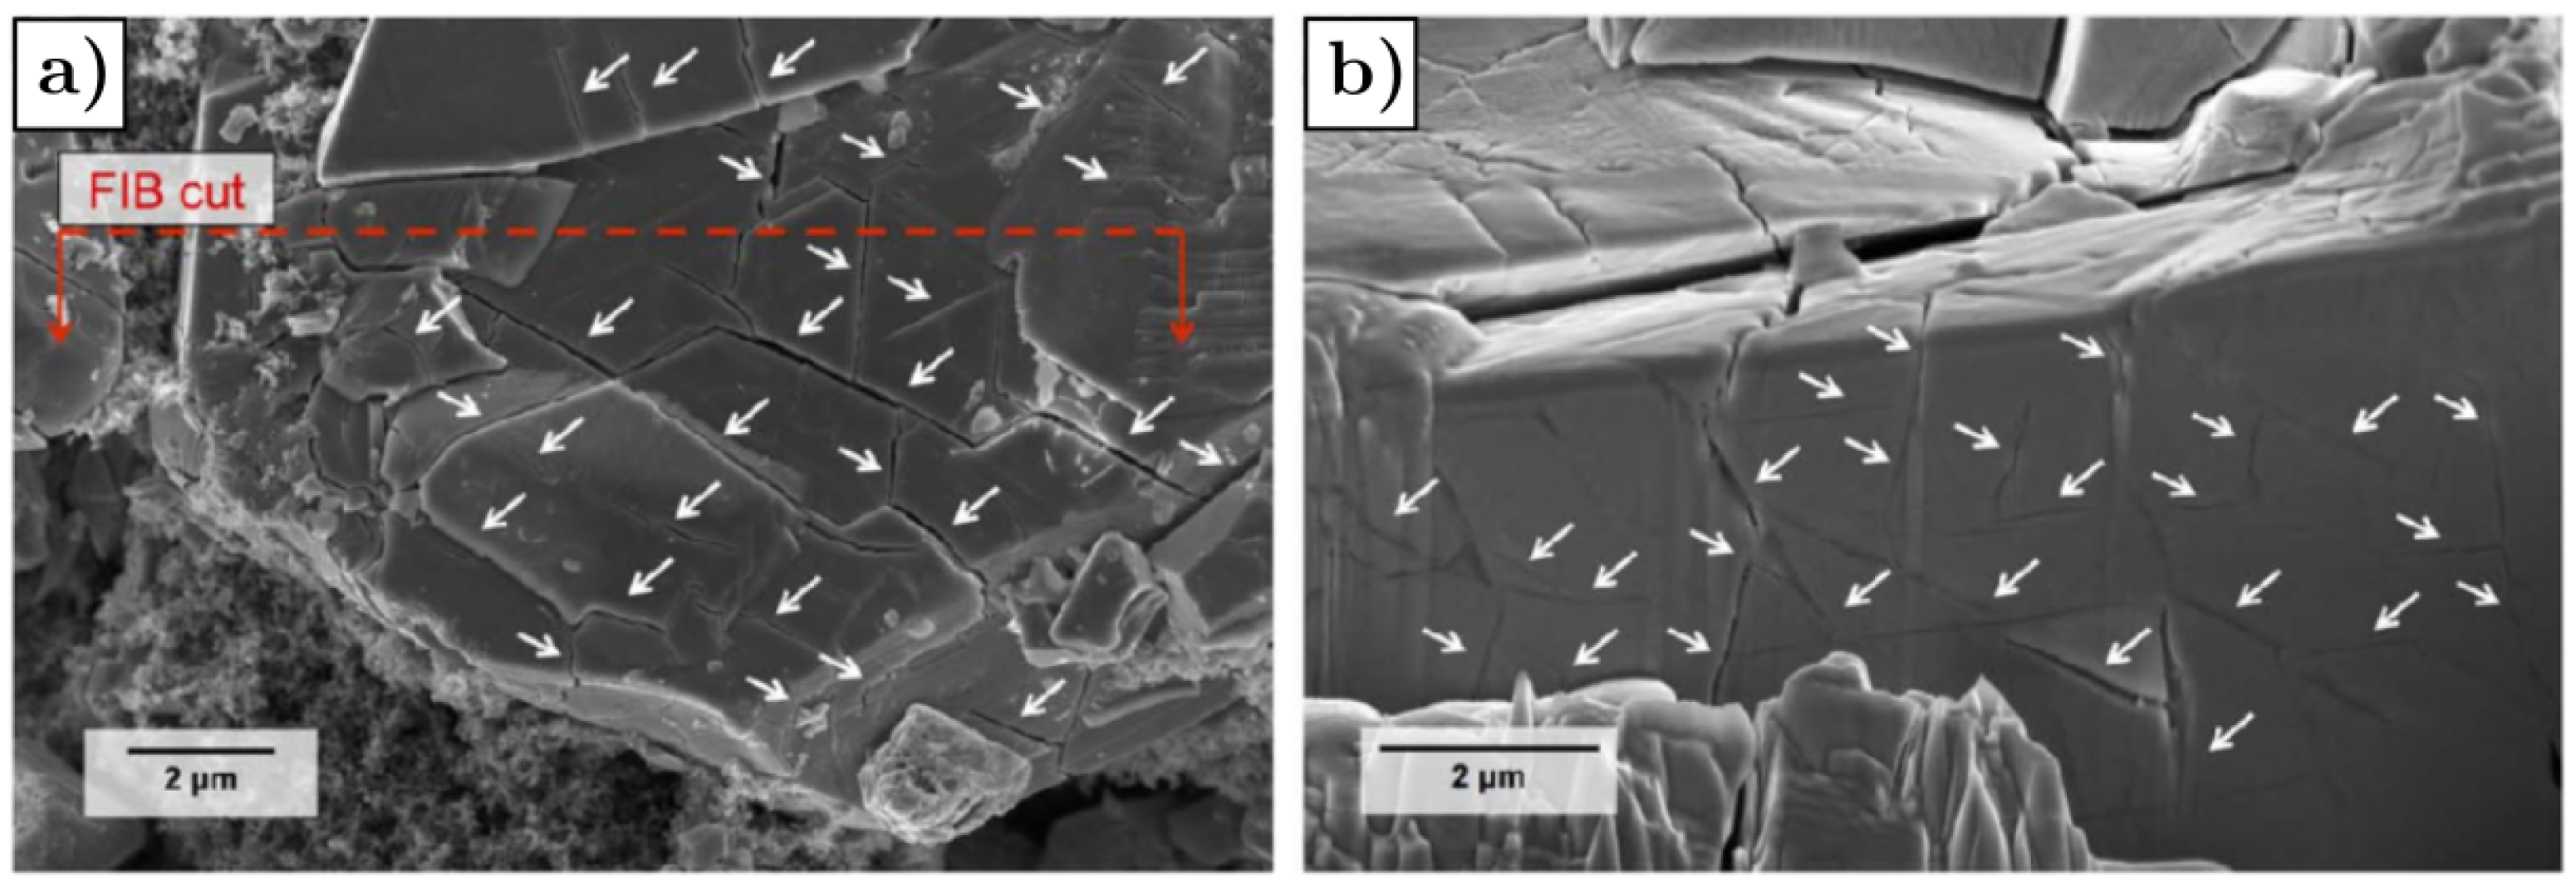
Figure 13.
SEM images of the electrode structure (a) before cycling and after (b) 40 cycles, (c) 125 cycles, (d) 500 cycles, (e) cycled at low voltage to trigger Jahn-Teller transformation and (f) cycled at high temperature. Reprinted with permission by Elsevier from [88], Copyright 2017.
Figure 13.
SEM images of the electrode structure (a) before cycling and after (b) 40 cycles, (c) 125 cycles, (d) 500 cycles, (e) cycled at low voltage to trigger Jahn-Teller transformation and (f) cycled at high temperature. Reprinted with permission by Elsevier from [88], Copyright 2017.

Figure 14.
(a) Crystal structure of LFP. Reprinted with permission by Elsevier from [92], Copyright 2009. (b) Schematic illustration of lithium intercalation mechanism in LFP single crystal. Lithium ions diffuse along 1D channels in the b-direction, and channels are stacked in layers parallel to planes, indicated by the dotted lines.
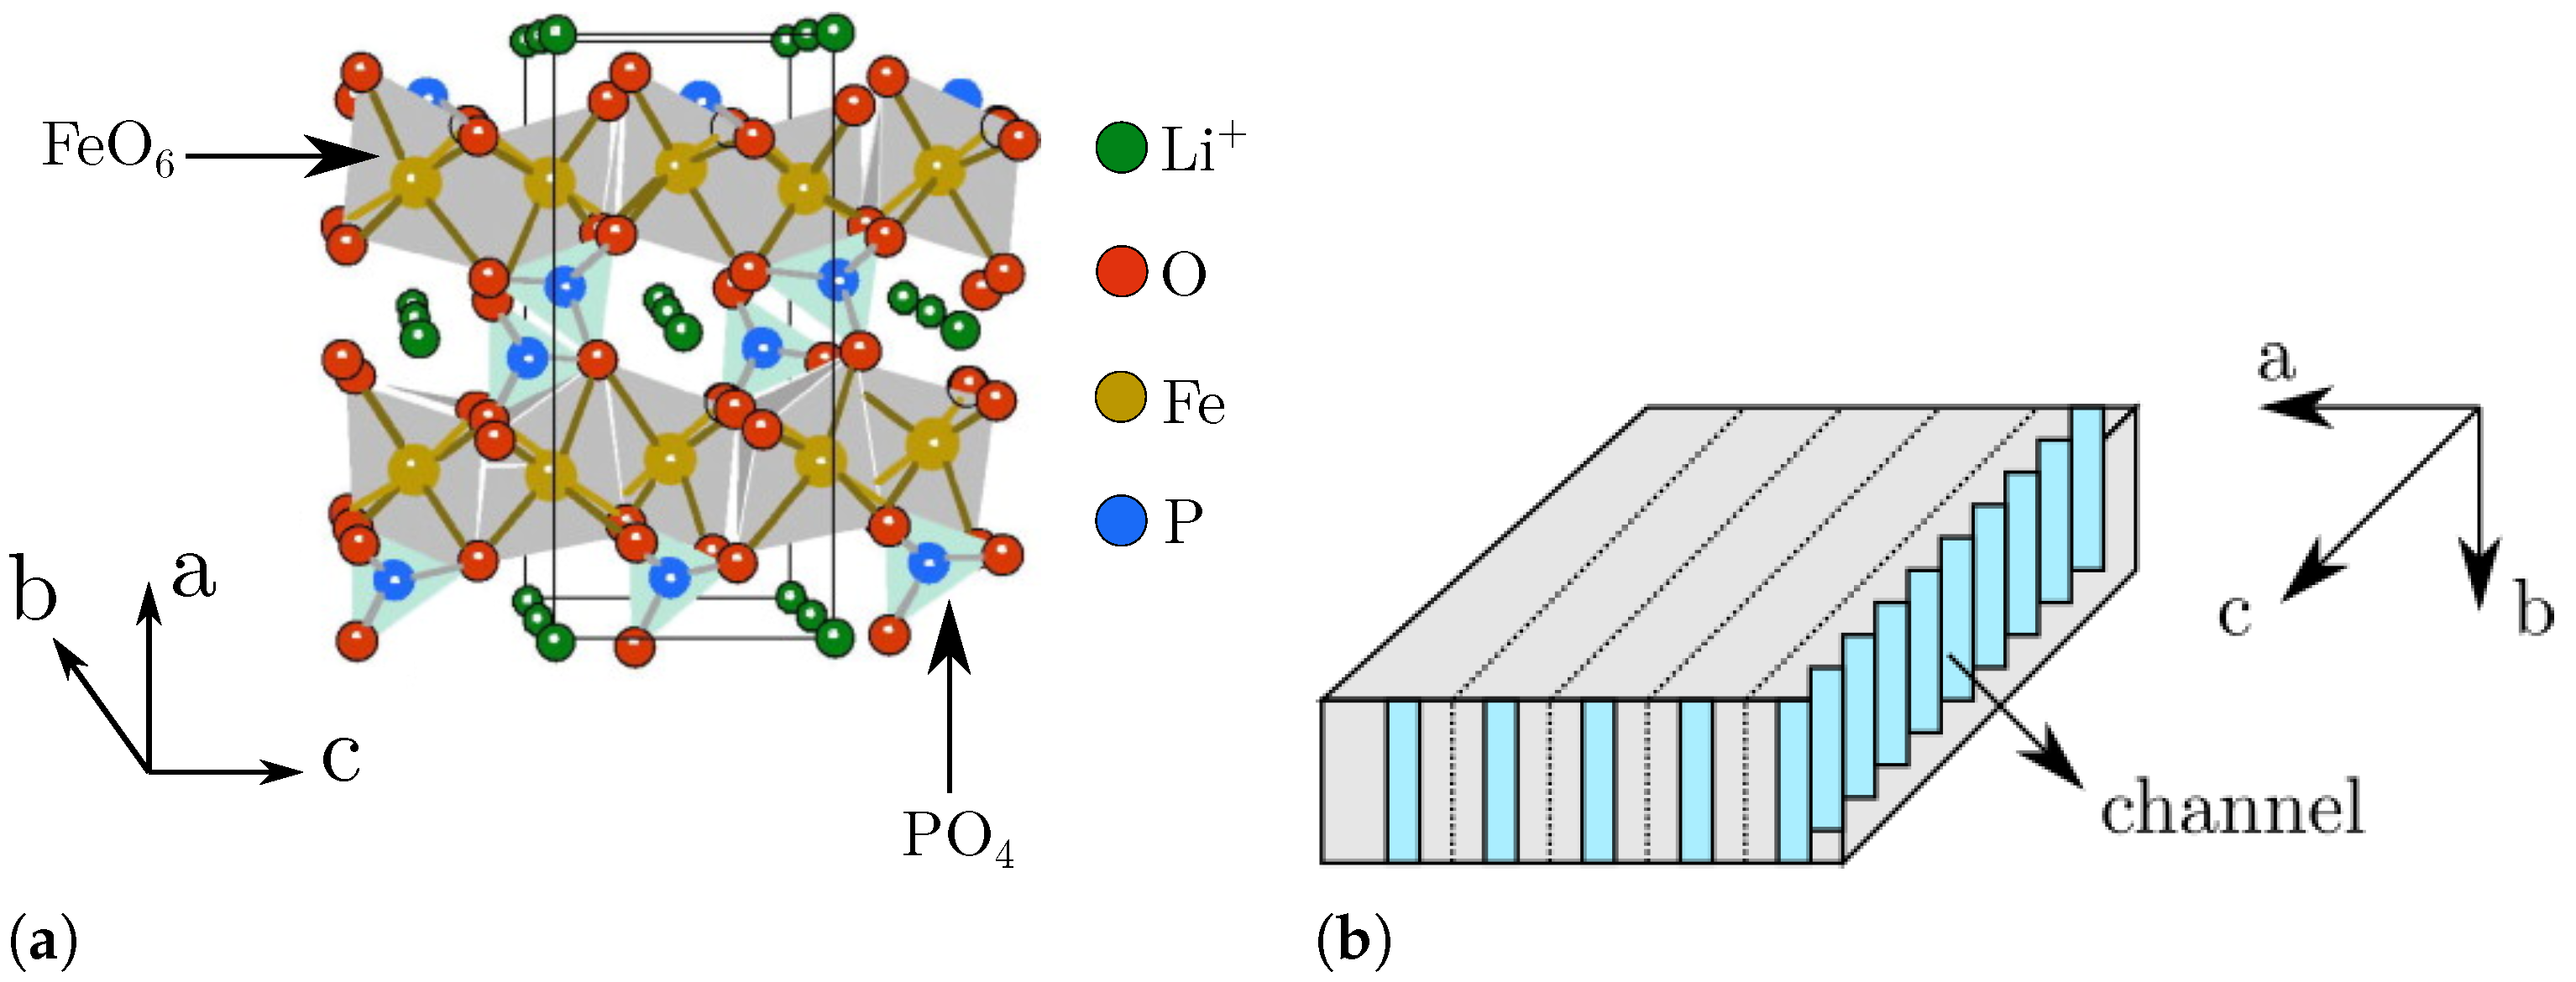
Figure 15.
Scheme of the phase boundary movement for LFP. (a) Phase boundary moving along the b-axis; (b) Phase boundary moving along the a-axis.
Figure 15.
Scheme of the phase boundary movement for LFP. (a) Phase boundary moving along the b-axis; (b) Phase boundary moving along the a-axis.
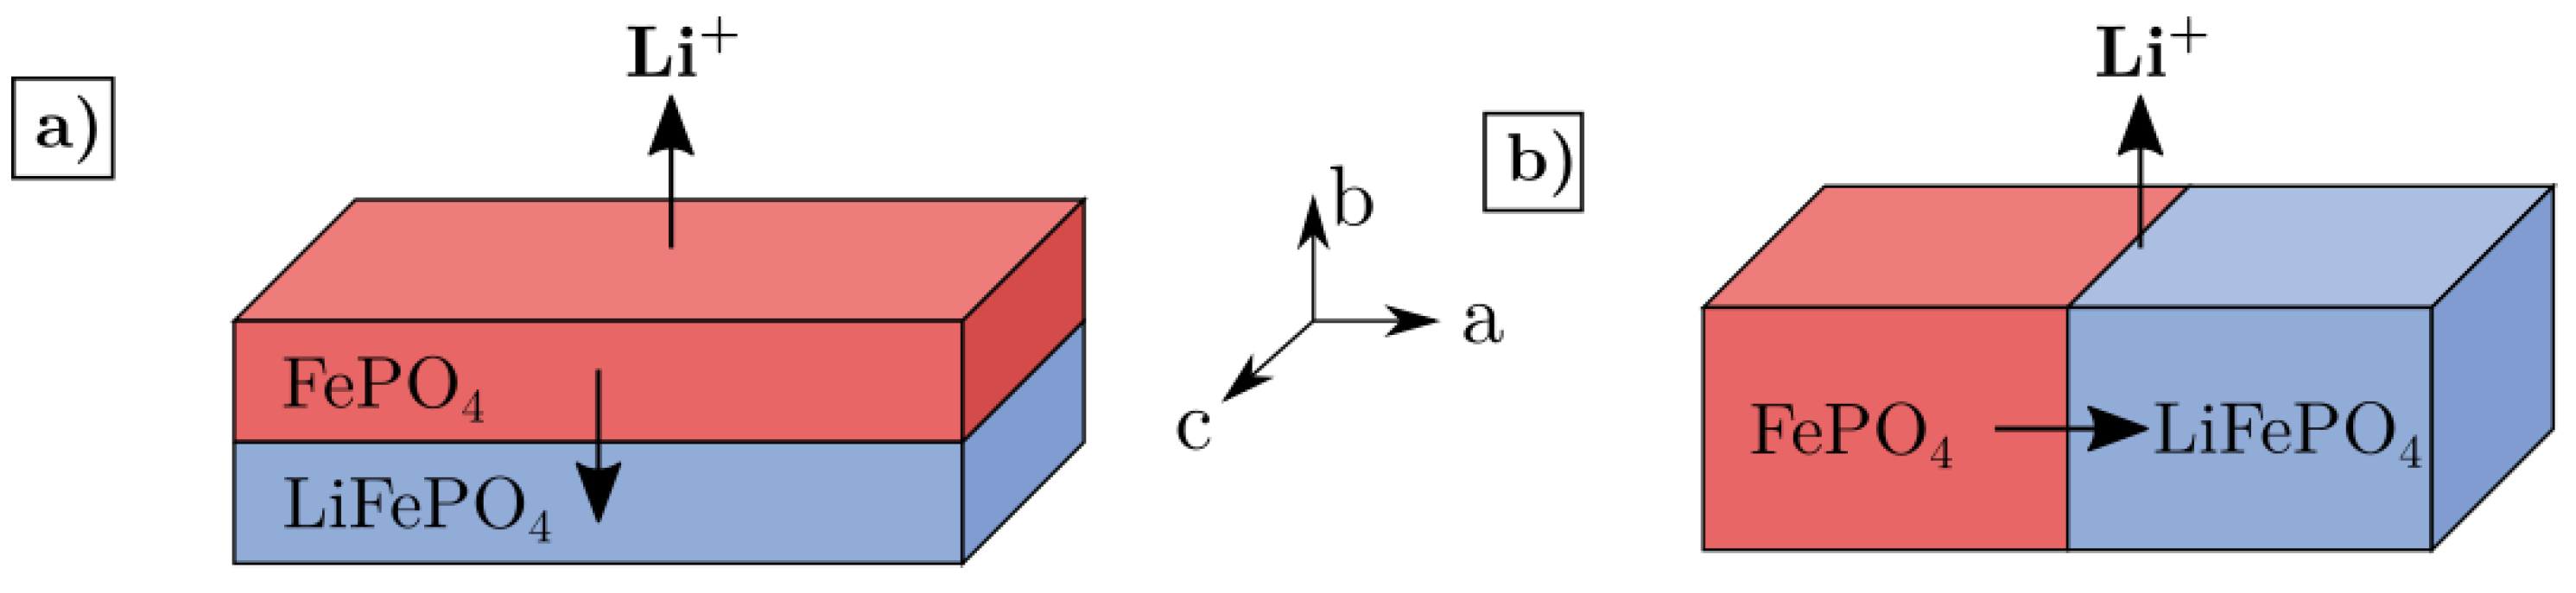
Figure 16.
Top: Electron microscopy results for a micrometric plate-like LFP crystal subjected to partial chemical delithiation. (a) SEM image and (b) High-resolution transmission electron (HRTEM) image with the inset of the Fourier transform pattern obtained from the region marked with the green box. The red arrows indicate the crack running parallel to the c-axis. Reprinted with permission by American Chemical Society from [97], Copyright 2015. Bottom: SEM observations of partially delithiated crystal. (c) SEM image and (d) STEM-HAADF image, showing cracks evenly spaced and oriented along the c-axis. Reprinted with permission by American Chemical Society from [96], Copyright 2013.
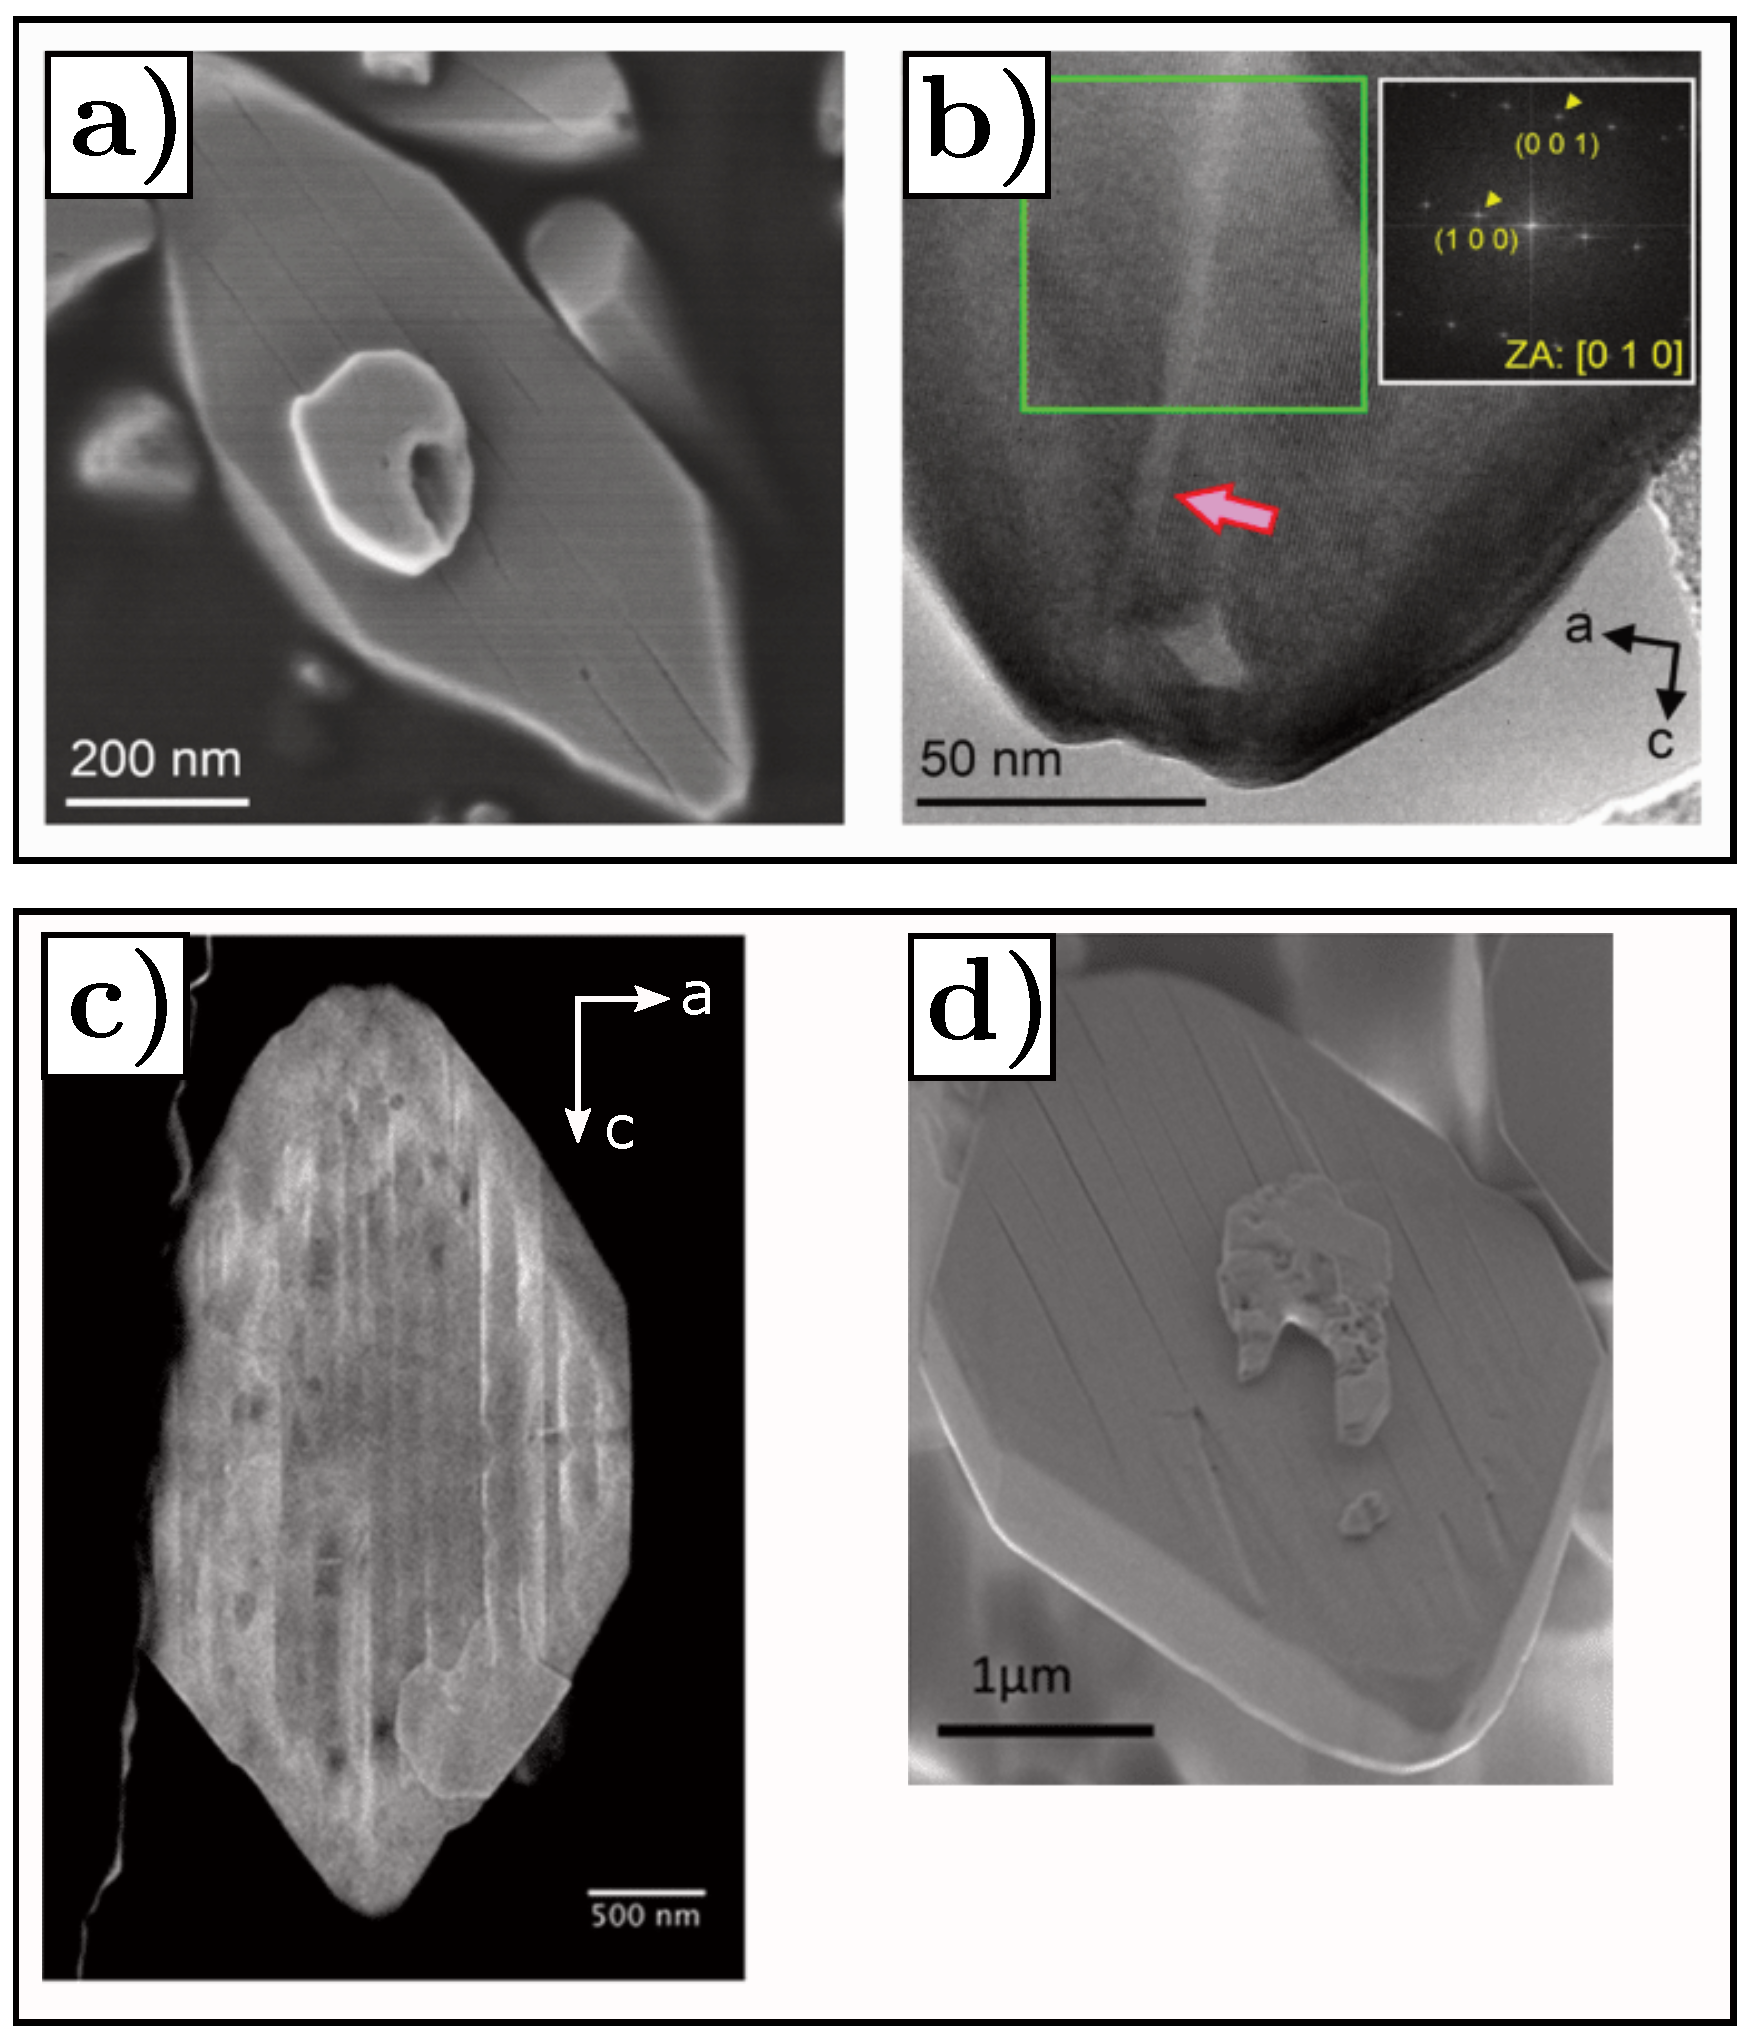
Figure 17.
and phases separated by plane cracks in a LFP crystal electrochemically cycled, with (a) STEM-HAADF image of the crystal at SOC, (b,c) SAED patterns and (d–f) STEM-HAADF images. Reprinted with permission by American Chemical Society from [99], Copyright 2020.
Figure 17.
and phases separated by plane cracks in a LFP crystal electrochemically cycled, with (a) STEM-HAADF image of the crystal at SOC, (b,c) SAED patterns and (d–f) STEM-HAADF images. Reprinted with permission by American Chemical Society from [99], Copyright 2020.

Figure 18.
Relation between defects and phase distribution within micrometric LFP chemically delithiated plate-like crystal, with (a) SEM image and (b) Chemical phase distribution map. Reprinted with permission by American Chemical Society from [97], Copyright 2015.
Figure 18.
Relation between defects and phase distribution within micrometric LFP chemically delithiated plate-like crystal, with (a) SEM image and (b) Chemical phase distribution map. Reprinted with permission by American Chemical Society from [97], Copyright 2015.
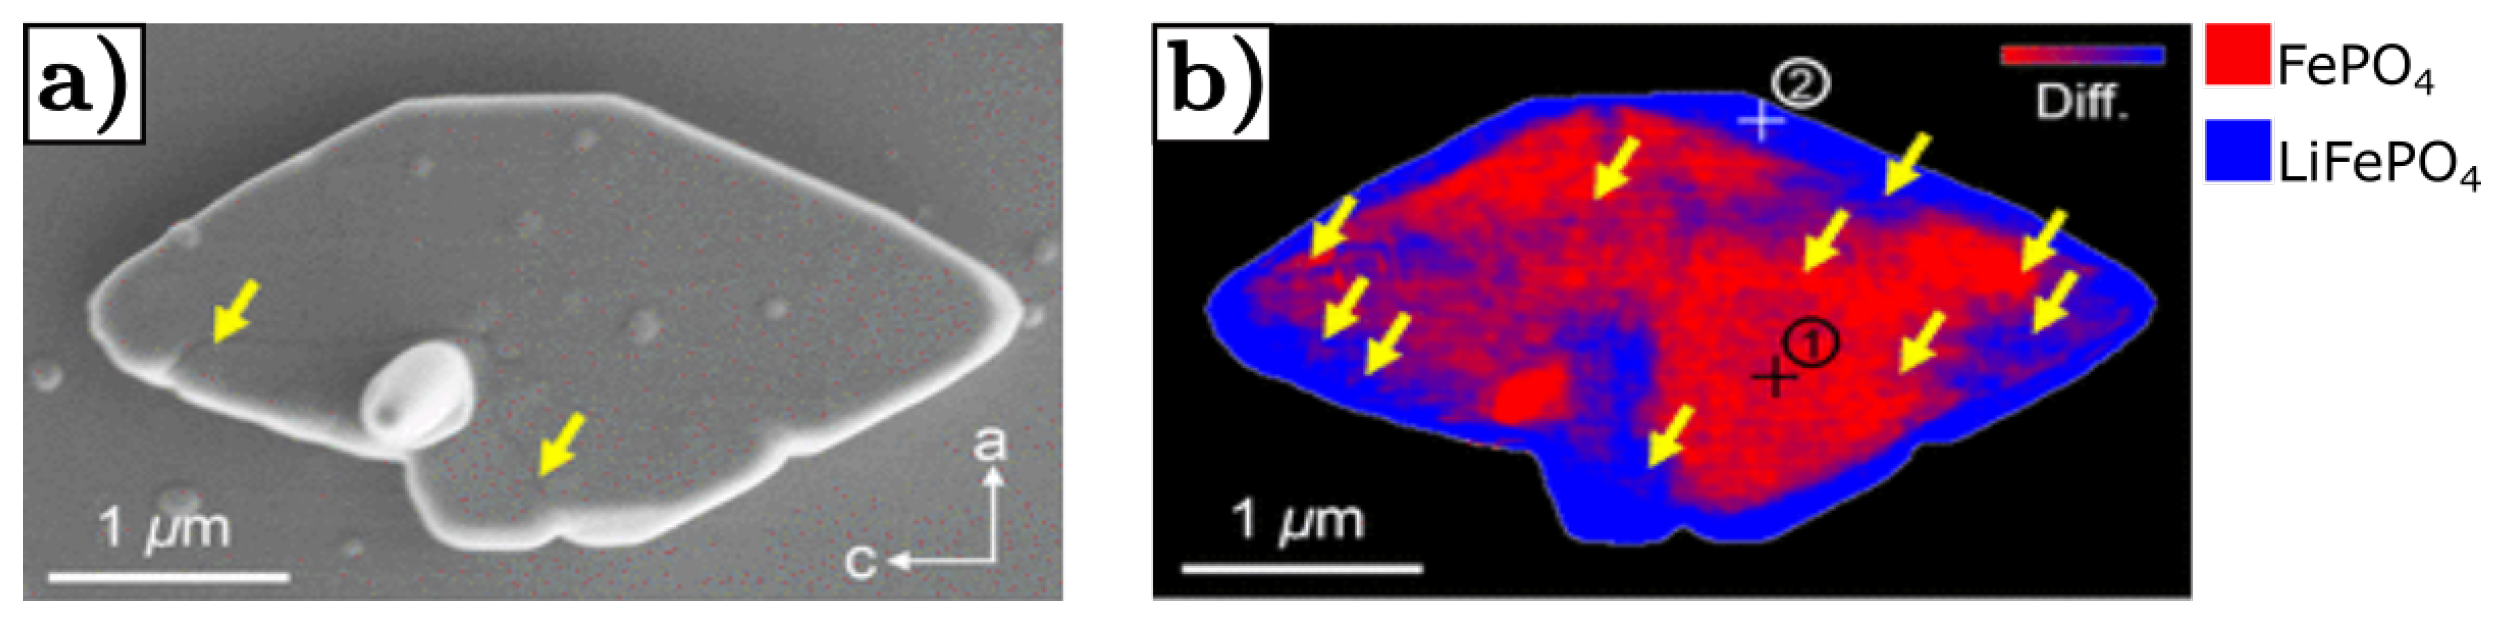
Figure 19.
(a,b) SEM images of NMC secondary and primary particles. Reproduced with permission from [105], ©2020 American Chemical Society. (c,d) TEM images of the cross-section of discharged NMC cathode after 100 cycles: intragranular cracks within primary particles are marked with green arrows, whereas intergranular cracks developing along grain boundaries are marked with yellow arrows. Reprinted with permission by American Chemical Society from [106], Copyright 2018.

Figure 20.
(a,b) SEM image of electrochemically cycled (NMC622) particles, showing cracks parallel to the (003) planes. Cracks are marked with red arrows. Reprinted with permission of [109] ©2018 Springer Nature. (c) Intragranular cracks in Li1+x (NCM851005) after 200 cycles, with (d) High-resolution image of the marked area in (c) showing the rock-salt phase along the crack surface. The direction parallel to (003) planes, cracks and the rock-salt phase are marked with grey, yellow and blue arrows, respectively. Reprinted with permission from American Chemical Society by [110], Copyright 2019.
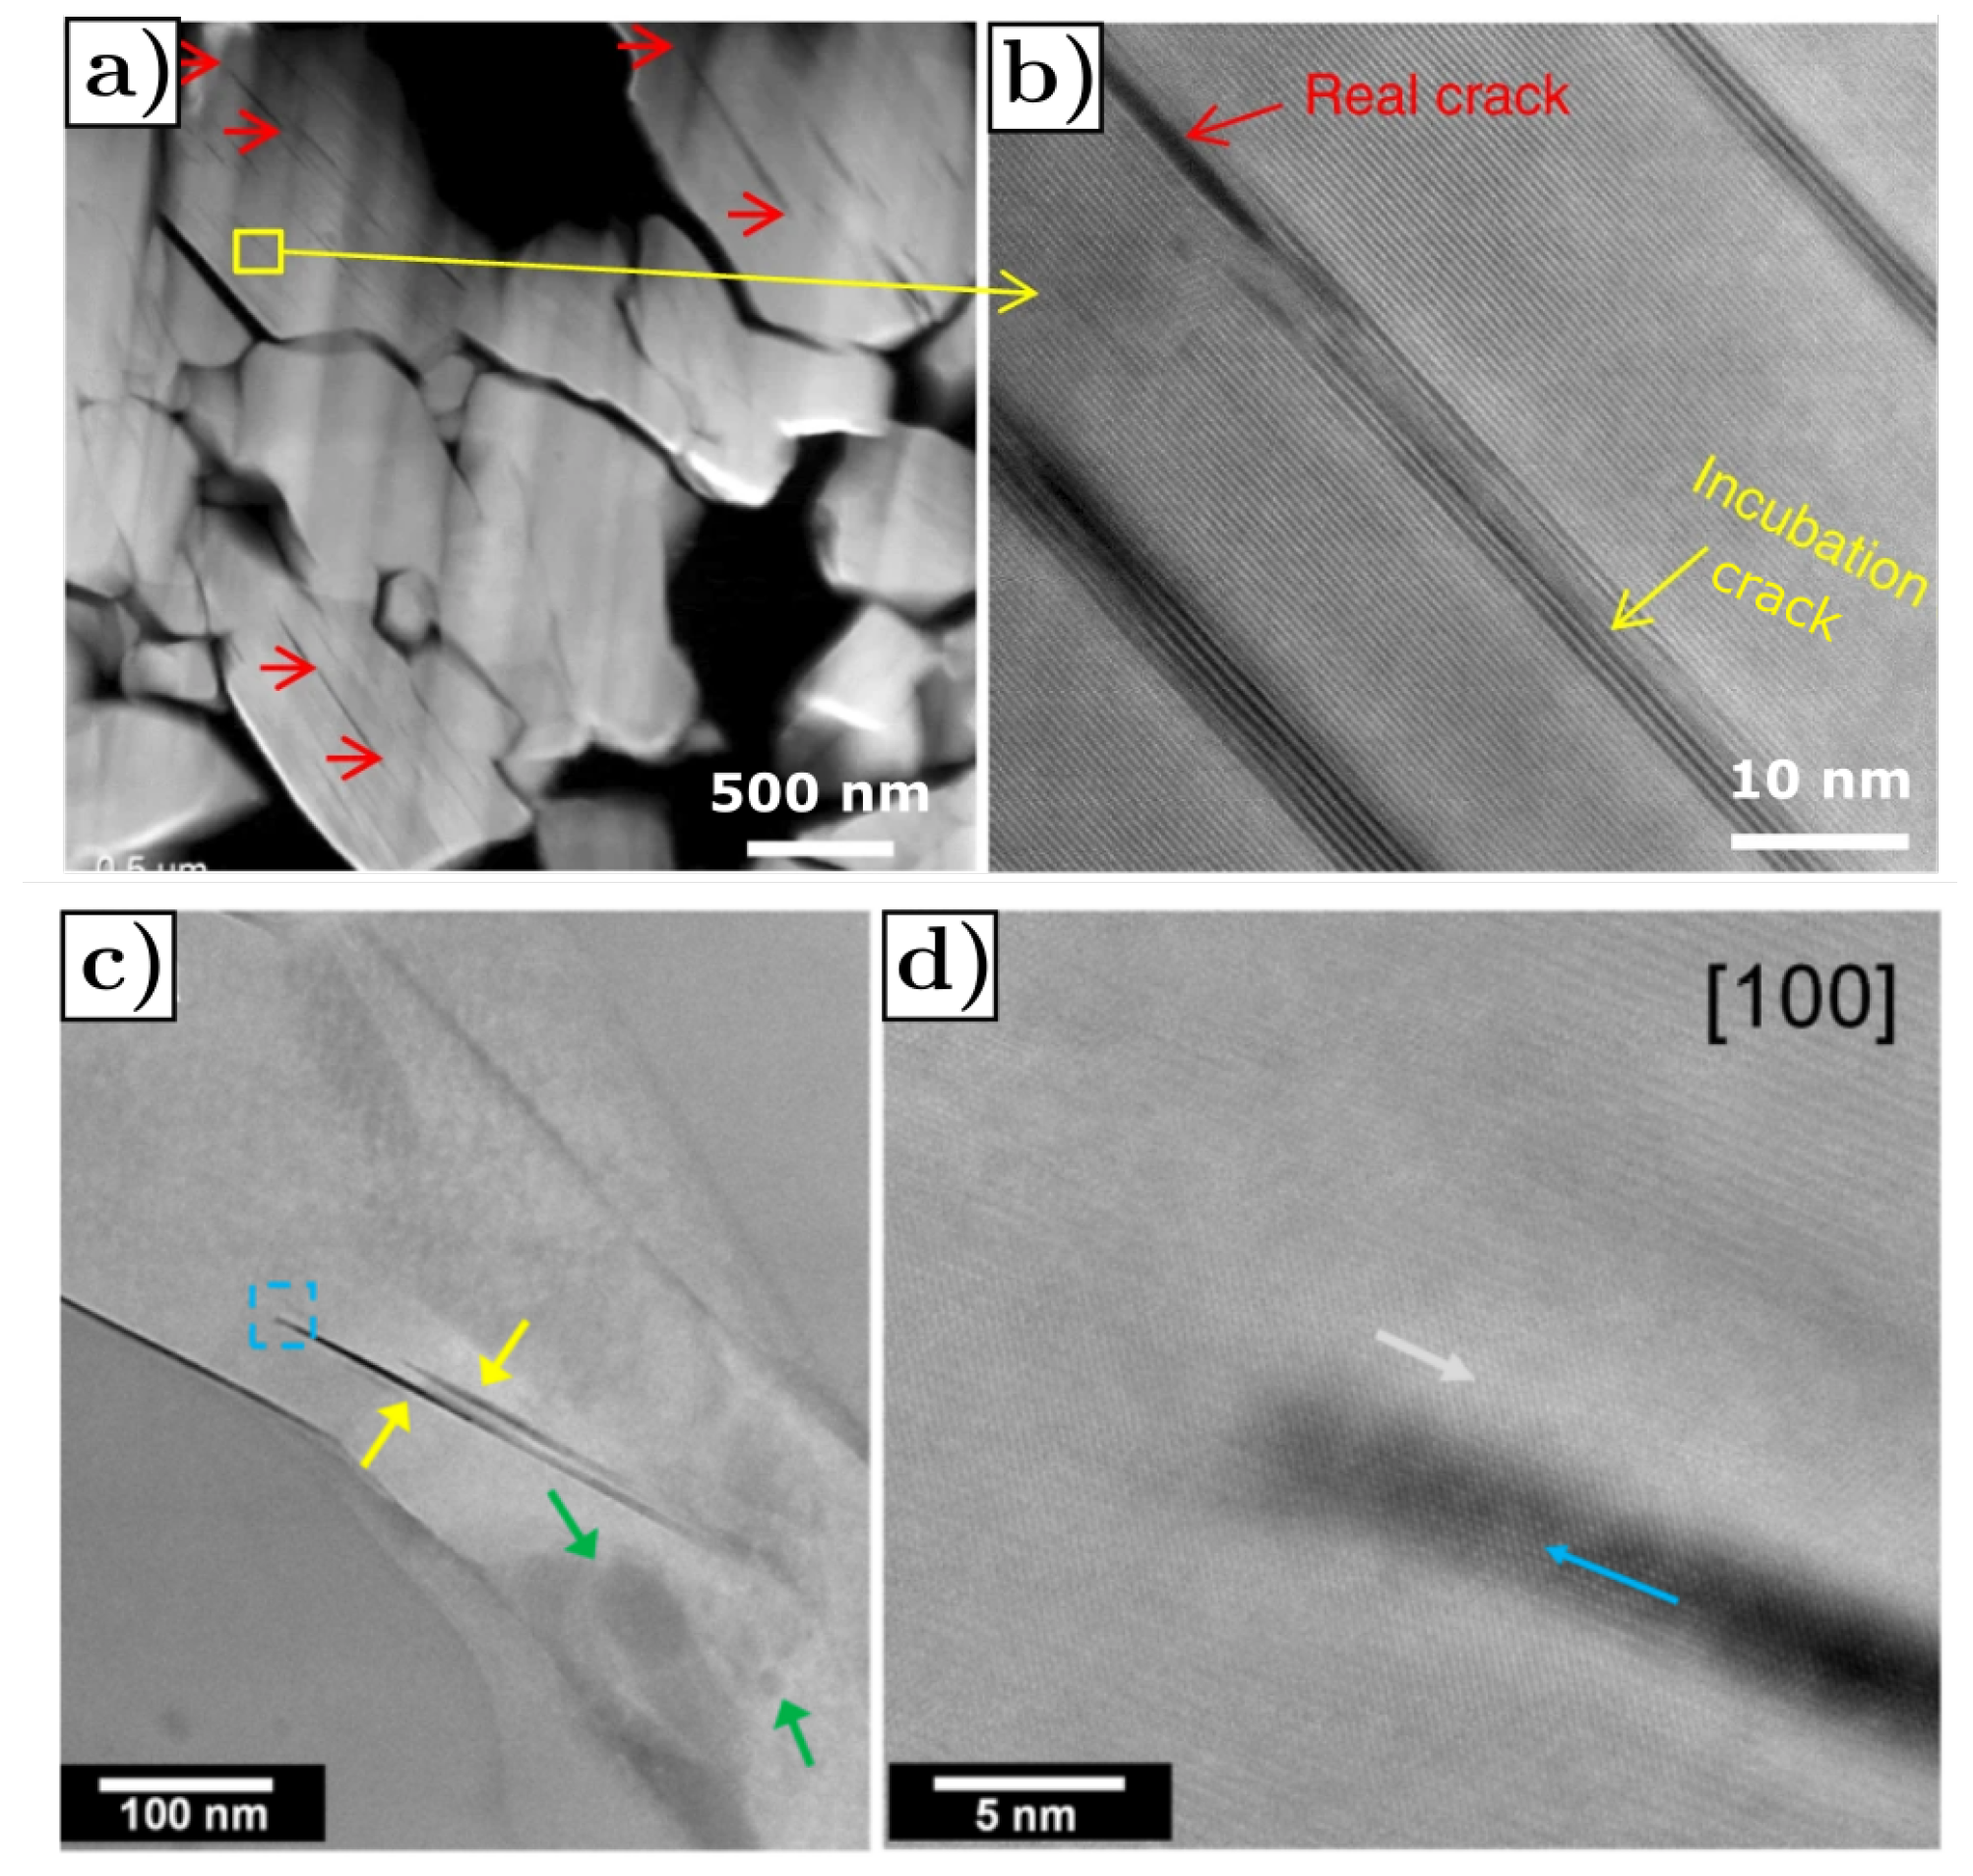
Figure 21.
(a,c) HAADF images from cycled NMC333 cathode particle showing intragranular cracks along the (001) plane. The yellow and light blue arrows indicate classic and premature cracks, respectively. (b) HAADF and (d) ABF images along [010] axis of the premature crack showed in (a). Reprinted with permission from Springer Nature by [108], Copyright 2017.

Figure 22.
(a) Schematic diagrams of the dislocation-assisted crack incubation, propagation and multiplication process in NMC cathode particles. (b,c) Nucleation of premature cracks at the dislocation core in NMC333 cycled particles, also schematized in (d). (e) Edge dislocations associated with intragranular cracks in cycled NMC333 particles. Crack tip is indicated with the red arrows. Reprinted with permission from Springer Nature by [108], Copyright 2017.
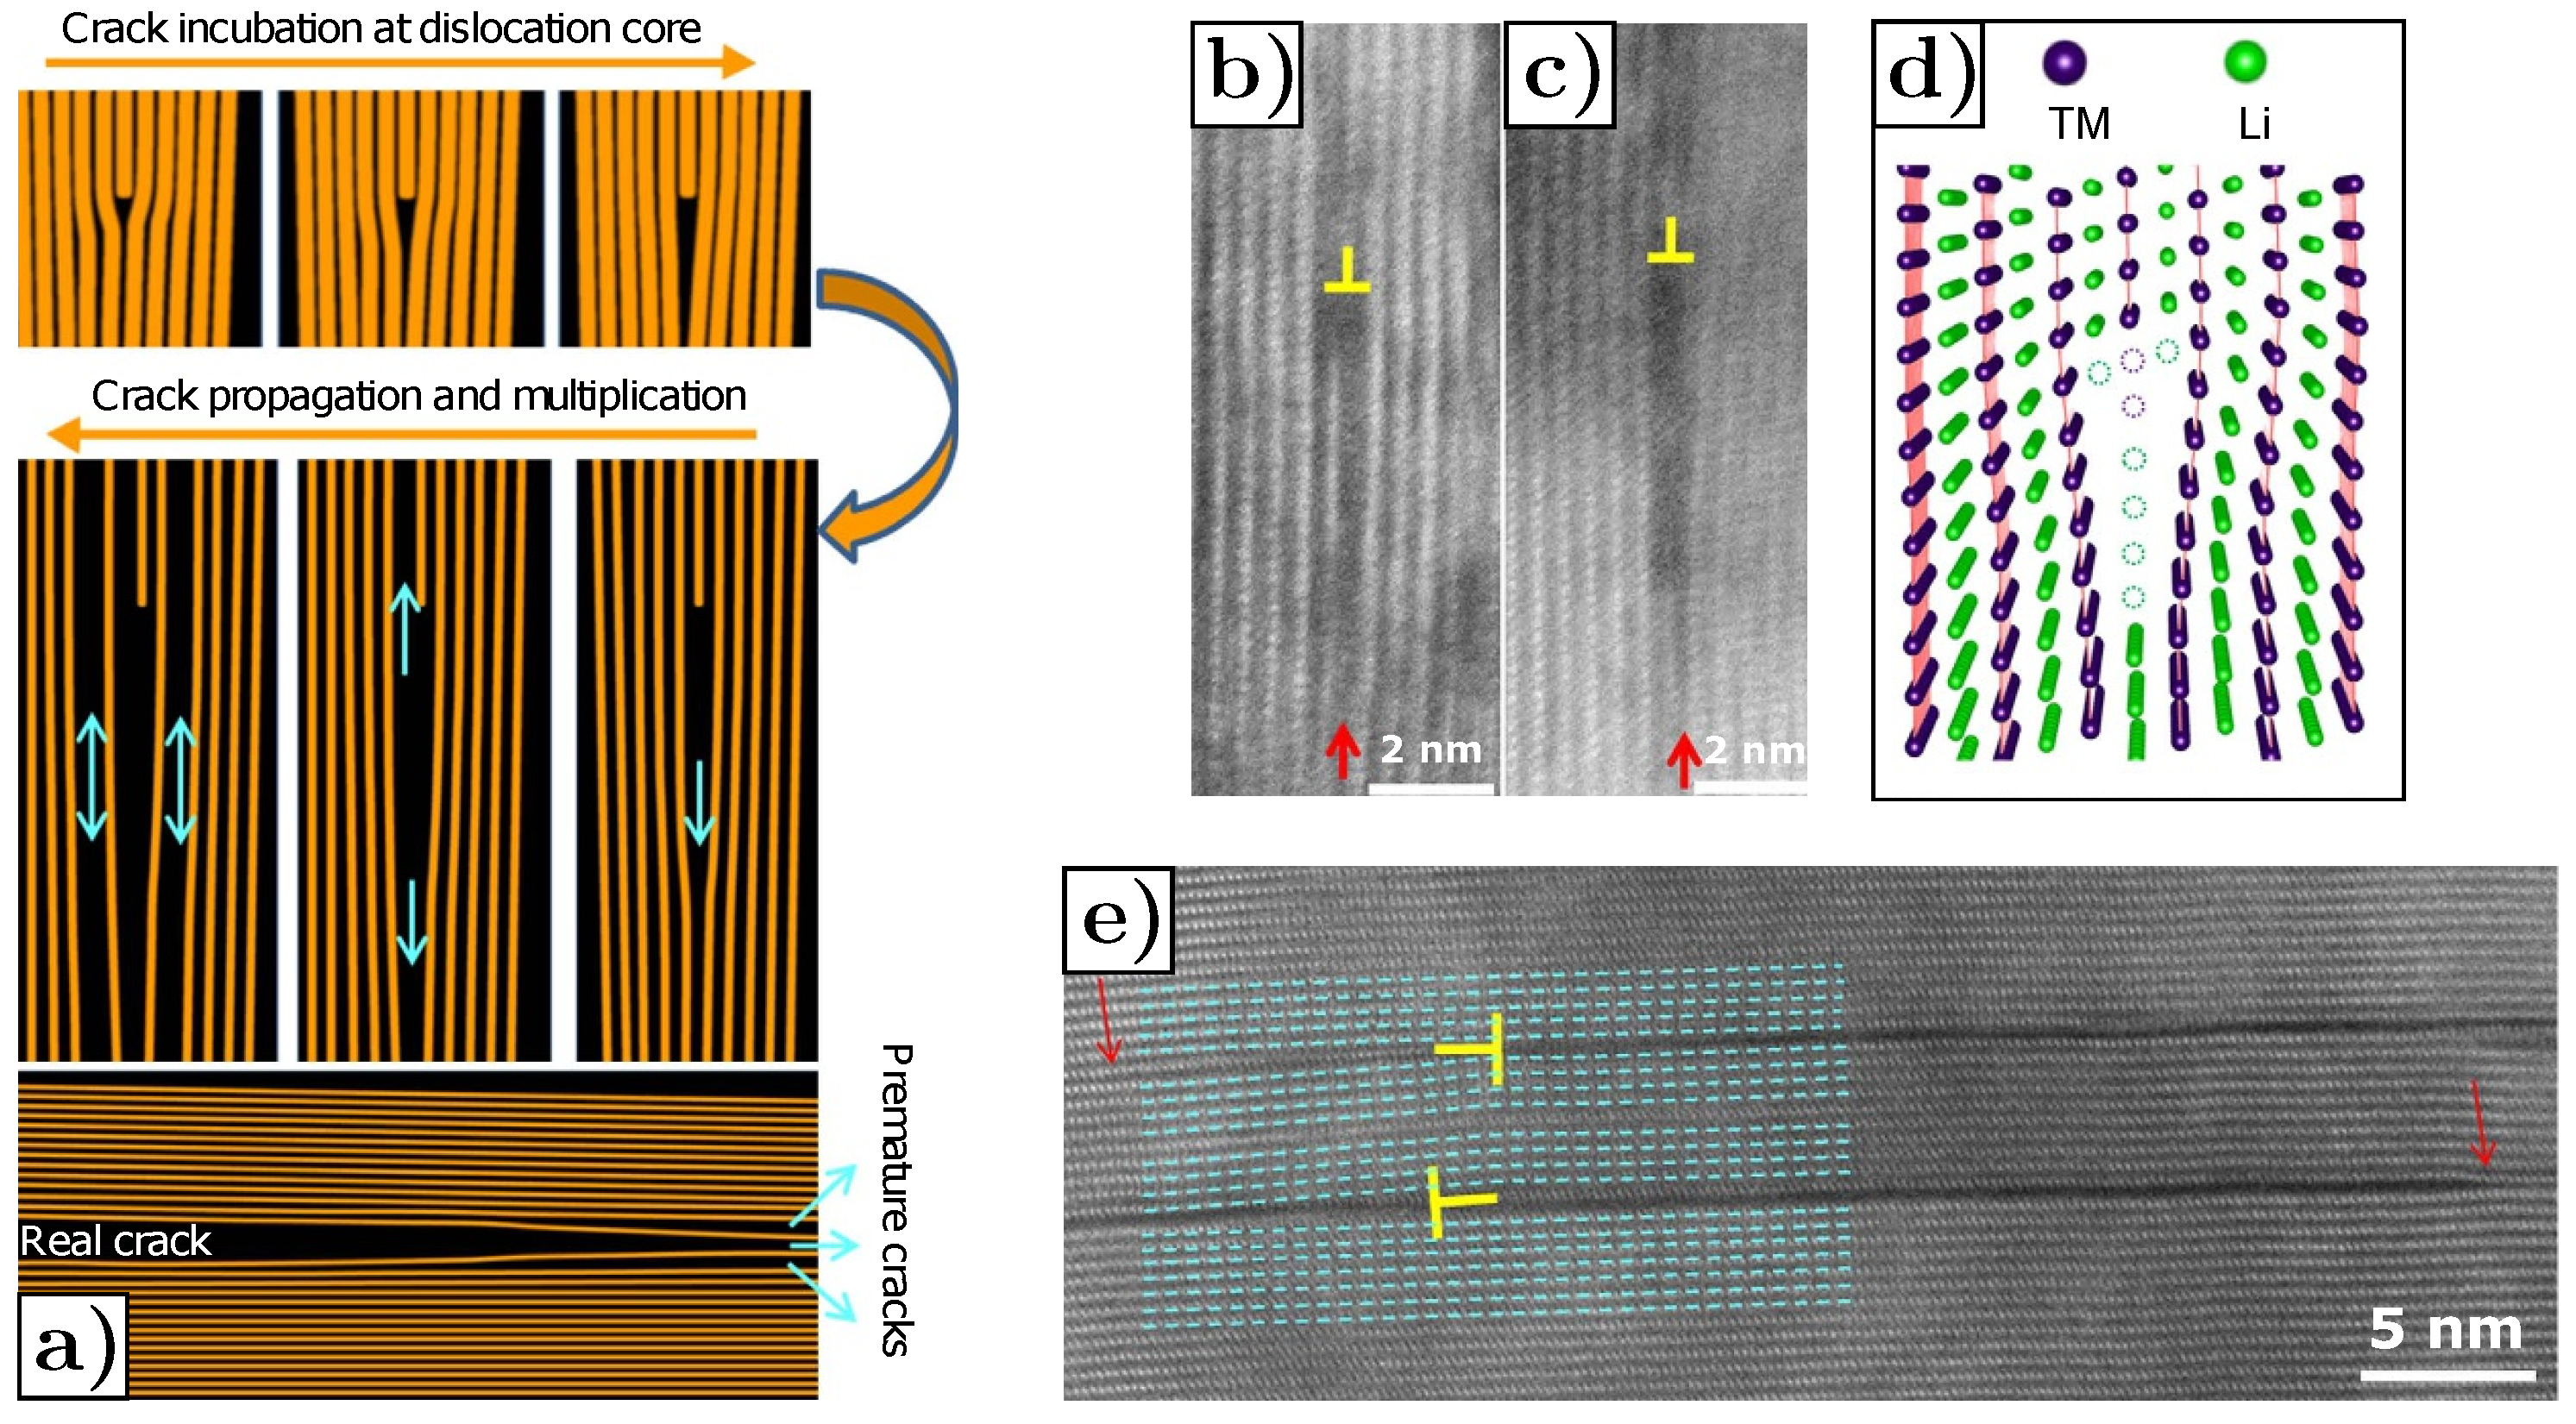
Figure 23.
(a) Development process of intragranular cracks in NMC811: (b–i) Lattice distortion stage, (j–l) Premature crack stage and (m–o) Classical crack stage. STEM-HAADF images of cycled NMC811 particle in <010> zone projection, after (b–d) 50 cycles and (c–e) 20 cycles. The white lines appear with different length. (f) STEM-HAADF image of enlarged morphology of a white line shown in (a). (g) High-resolution STEM-HAADF image, showing the lattice distortion of the white line region. (h) Atomic-resolution STEM-HAADF image from the region marked by yellow dashed square box in (f), showing the detailed structure of the white line, with the formation of the rock-salt phase. (i) Strain map simulated by GPA due to lattice distortion. (j–l) Atomic-resolution STEM-HAADF images of premature intragranular crack in NMC811 particle after 50 cycles, showing the presence of the rock-salt phase both in the (k) partially cracked region and (l) uncracked tip. (m–o) Atomic-resolution STEM-HAADF images of mature intragranular crack in NMC811 particle after 100 cycles, showing the increase in the crack length along the (003) plane and in the rock-salt phase thickness. Reprinted with permission from Elsevier by [111], Copyright 2020.
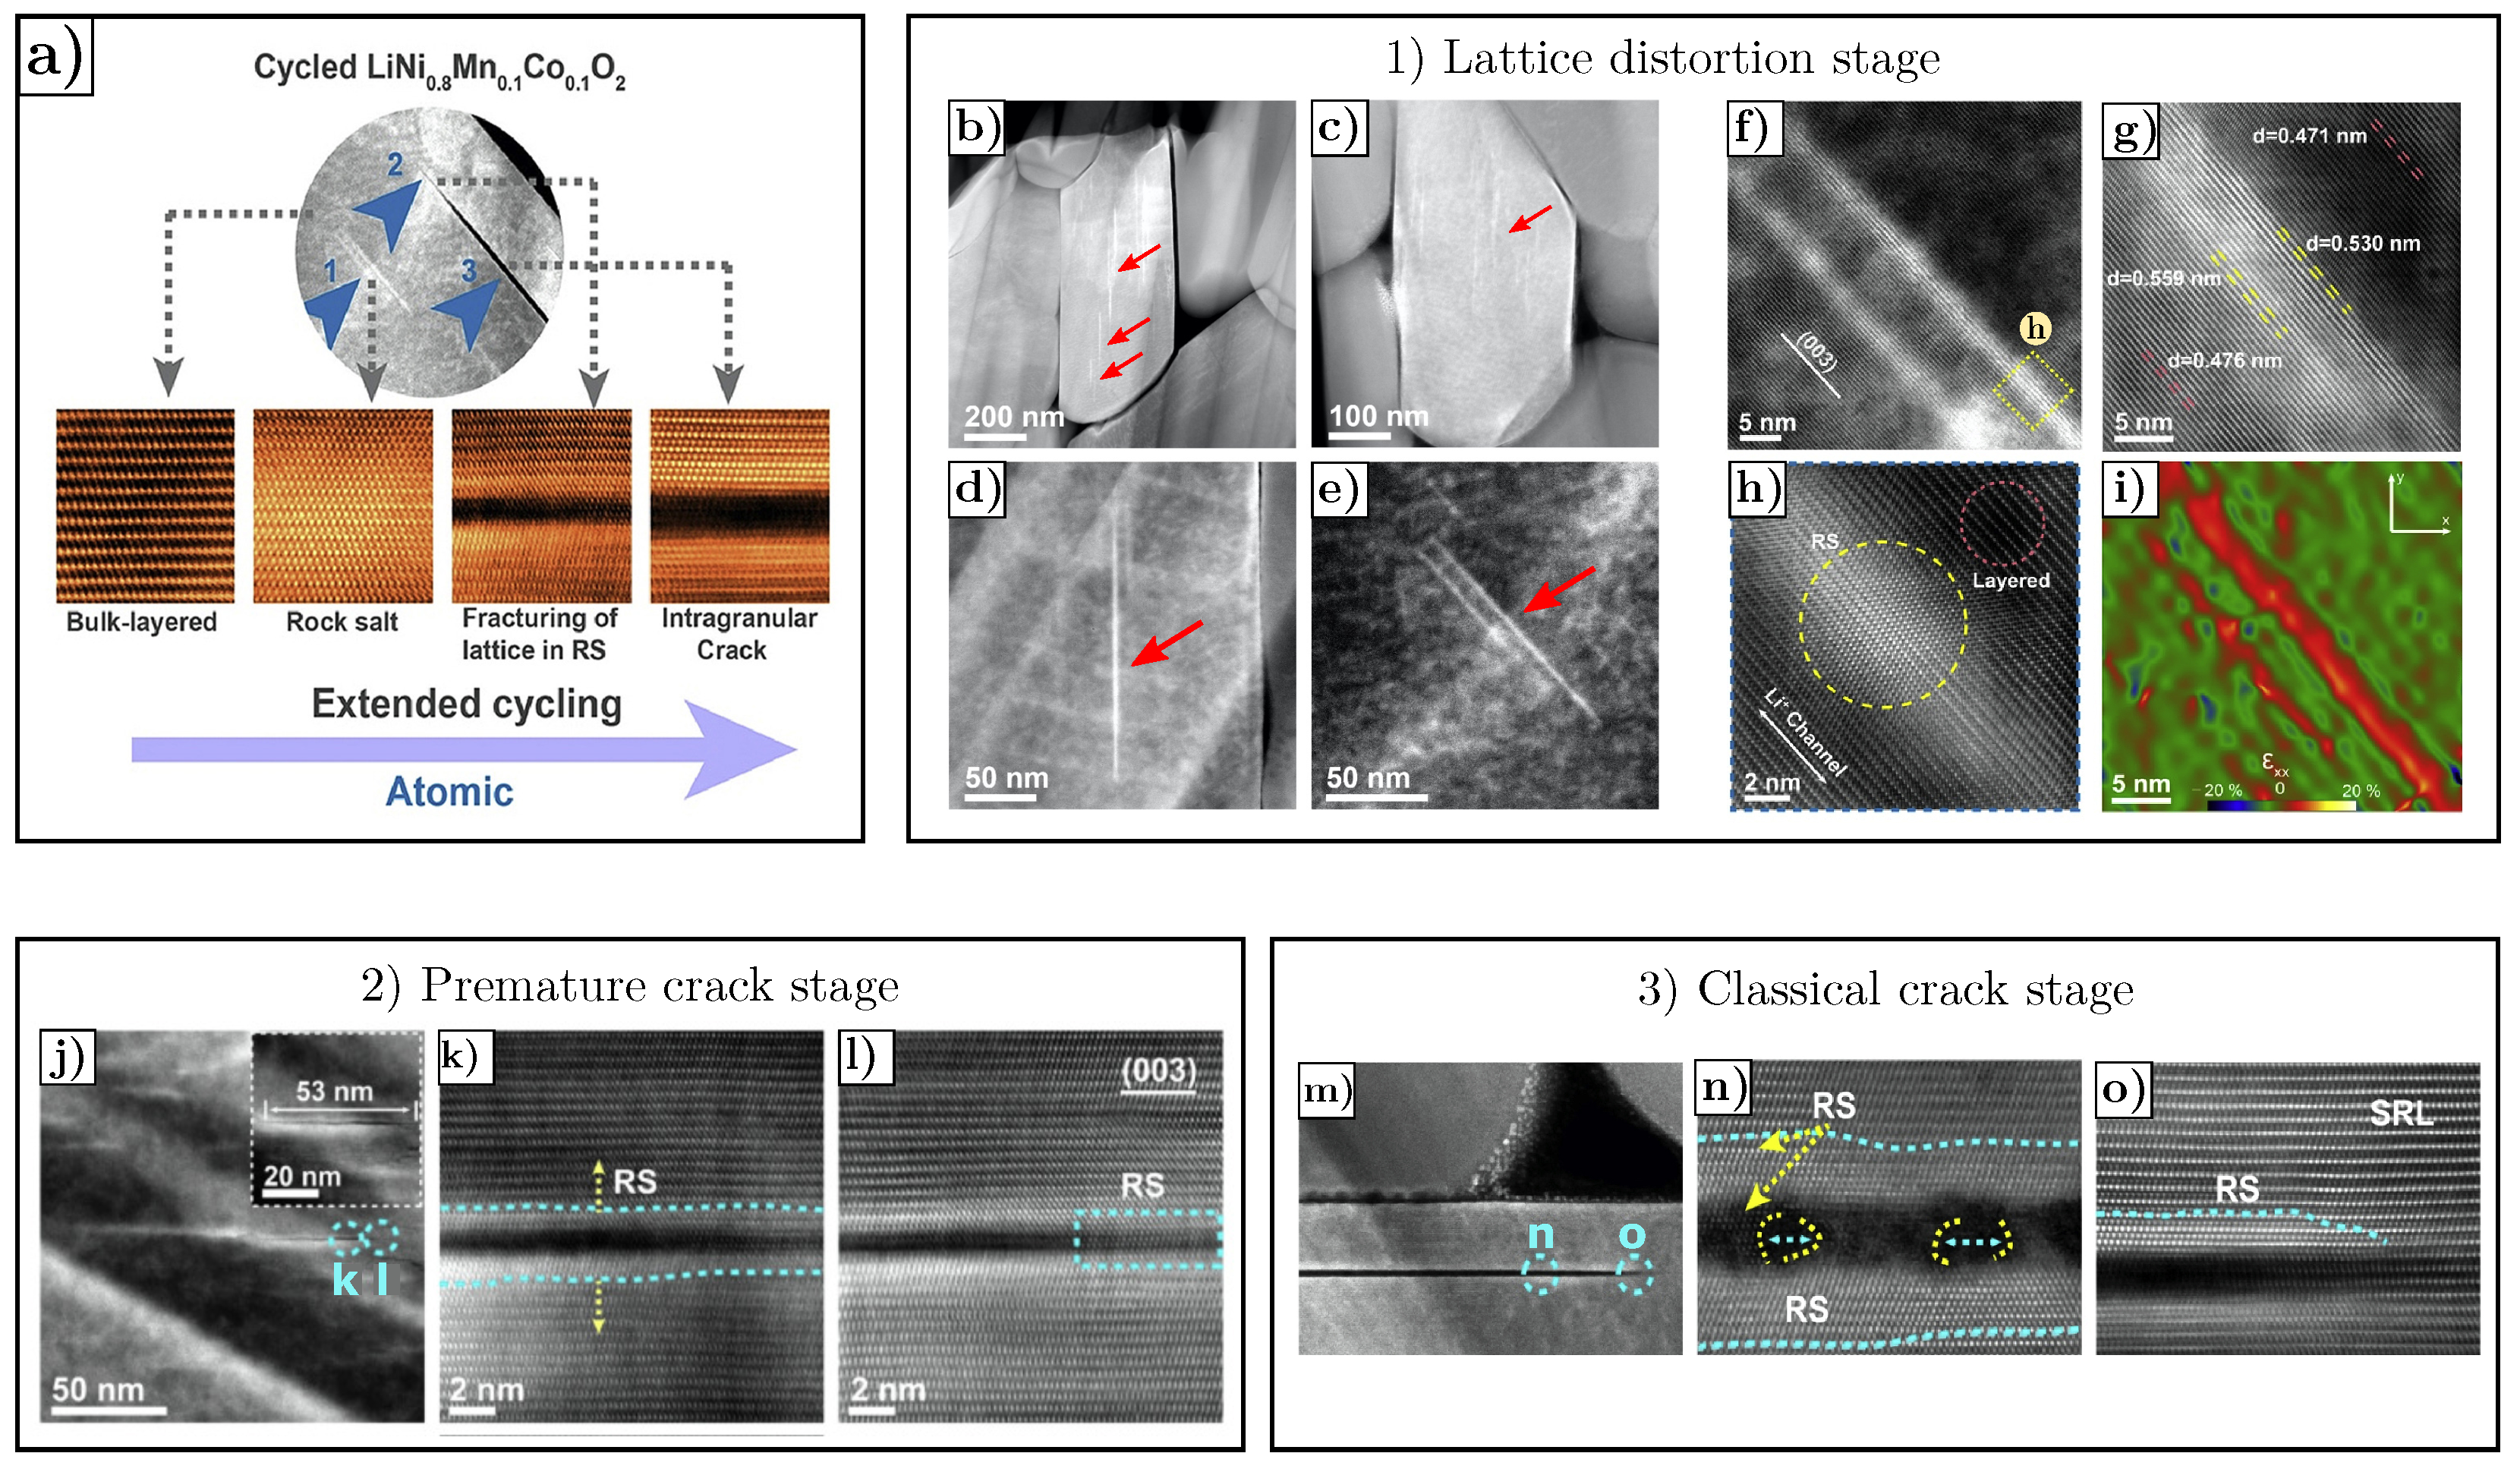
Figure 24.
Differential capacity curves of
with different Ni content: (a) , (b) , (c) , and (d) as a function of the number of cycles. Reprinted with permission of [106], ©2018 American Chemical Society.
Figure 24.
Differential capacity curves of
with different Ni content: (a) , (b) , (c) , and (d) as a function of the number of cycles. Reprinted with permission of [106], ©2018 American Chemical Society.
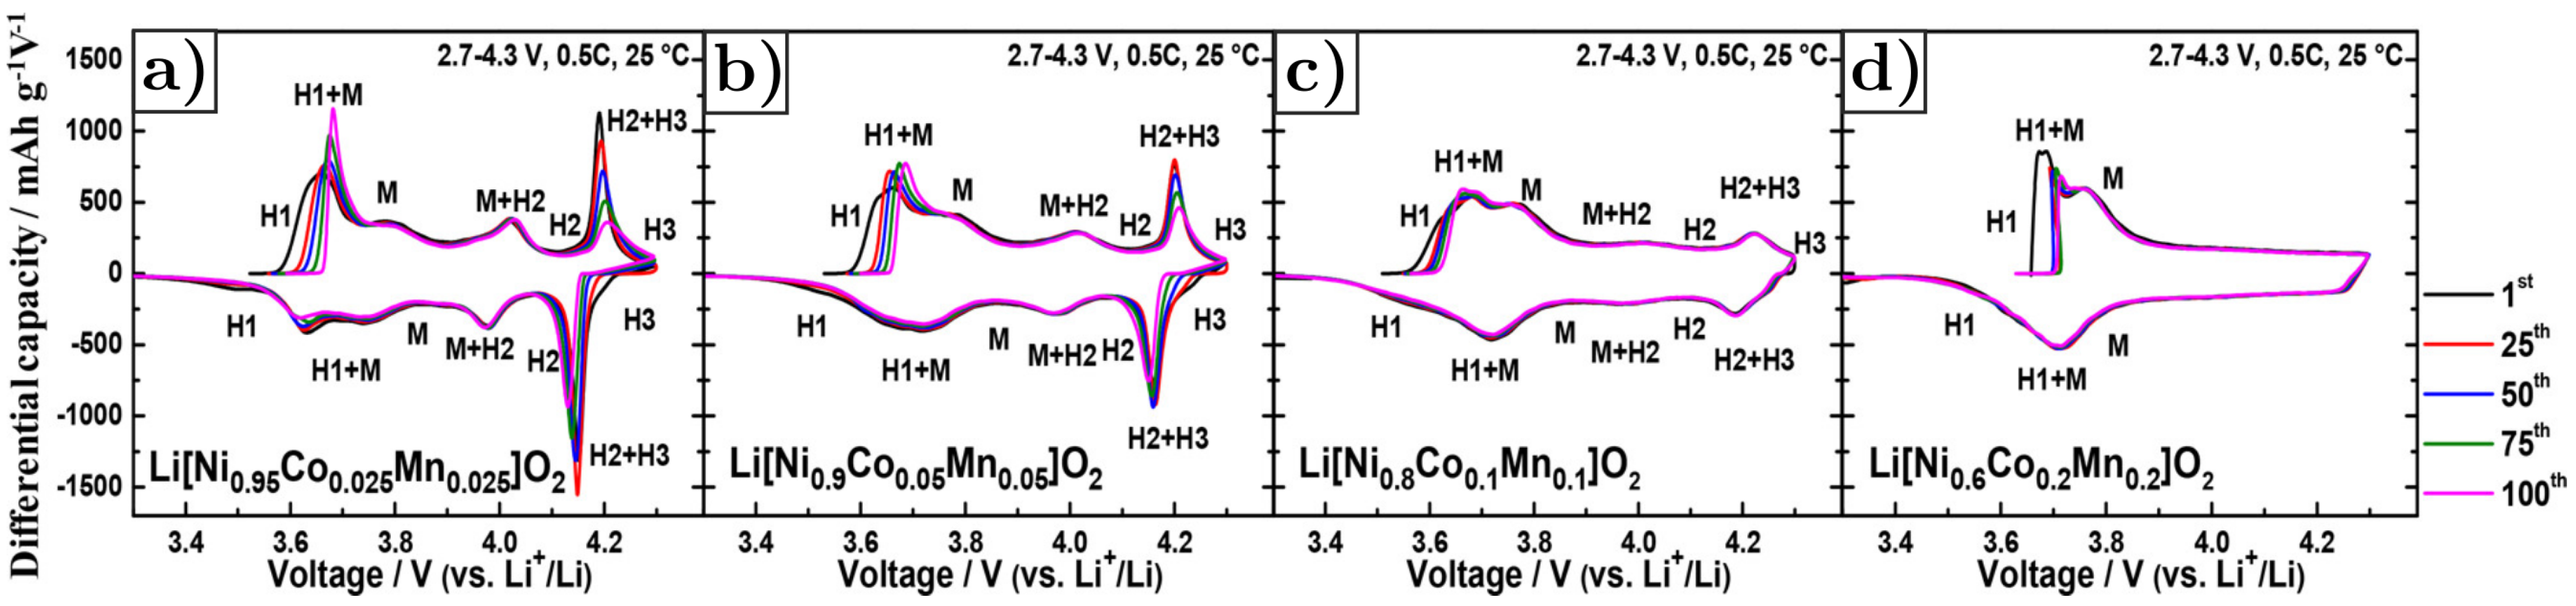
Figure 25.
(a) a-axis and (b) c-axis lattice parameters of as a function of the Ni content (, , and ) and the cell voltage. Reprinted with permission of [106], ©2018 American Chemical Society.
Figure 25.
(a) a-axis and (b) c-axis lattice parameters of as a function of the Ni content (, , and ) and the cell voltage. Reprinted with permission of [106], ©2018 American Chemical Society.
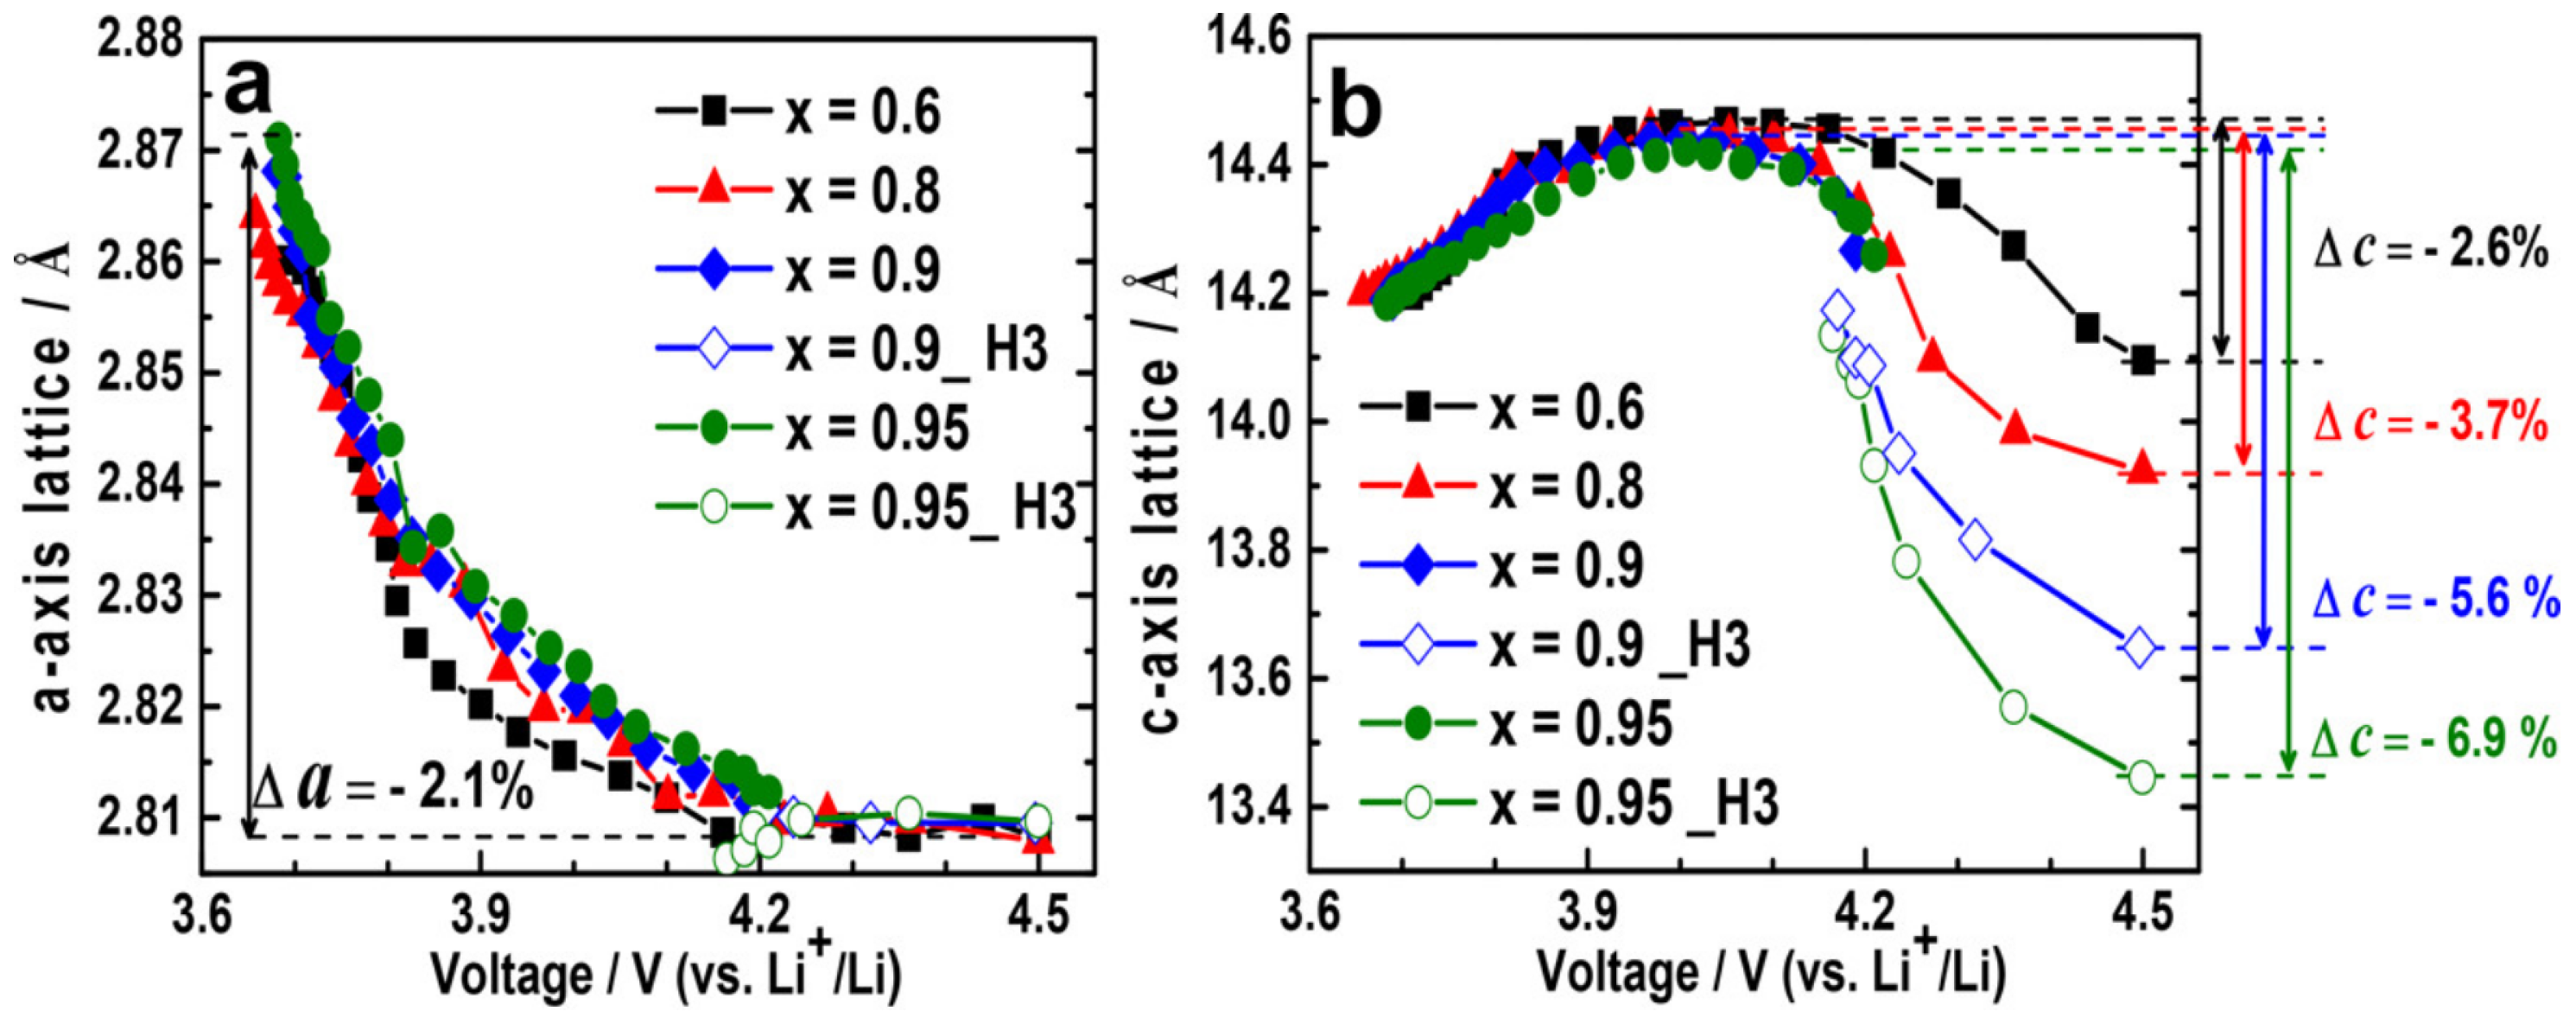
Figure 26.
(a) Comparison of capacity and (b) Energy density decay between single-crystalline (SC-NCM) and commercial polycrystalline (N-NCM) NMC831106 cycled at 1C in the voltage range of 2.75–4.4 V over 150 cycles. Reprinted with permission of [123], ©2020 Elsevier.
Figure 26.
(a) Comparison of capacity and (b) Energy density decay between single-crystalline (SC-NCM) and commercial polycrystalline (N-NCM) NMC831106 cycled at 1C in the voltage range of 2.75–4.4 V over 150 cycles. Reprinted with permission of [123], ©2020 Elsevier.

Figure 27.
(a) Capacity decay of NCA95 during cycling at different DOD and initial SOC values. Derivative of charge-discharge curves of NCA95 cycled (b) from SOC 40 to 100% (3.76–4.3 V) (c) from SOC 0 to 60%, (d) from SOC 0 to 100%. Cross-sectional SEM images of NCA95 particles cycled for 100 cycles (e) from SOC 0 to 60%, (f) from SOC 40 to 100% and (g) from SOC 0 to 100%. Reprinted with permission by American Chemical Society from [132], Copyright 2019.
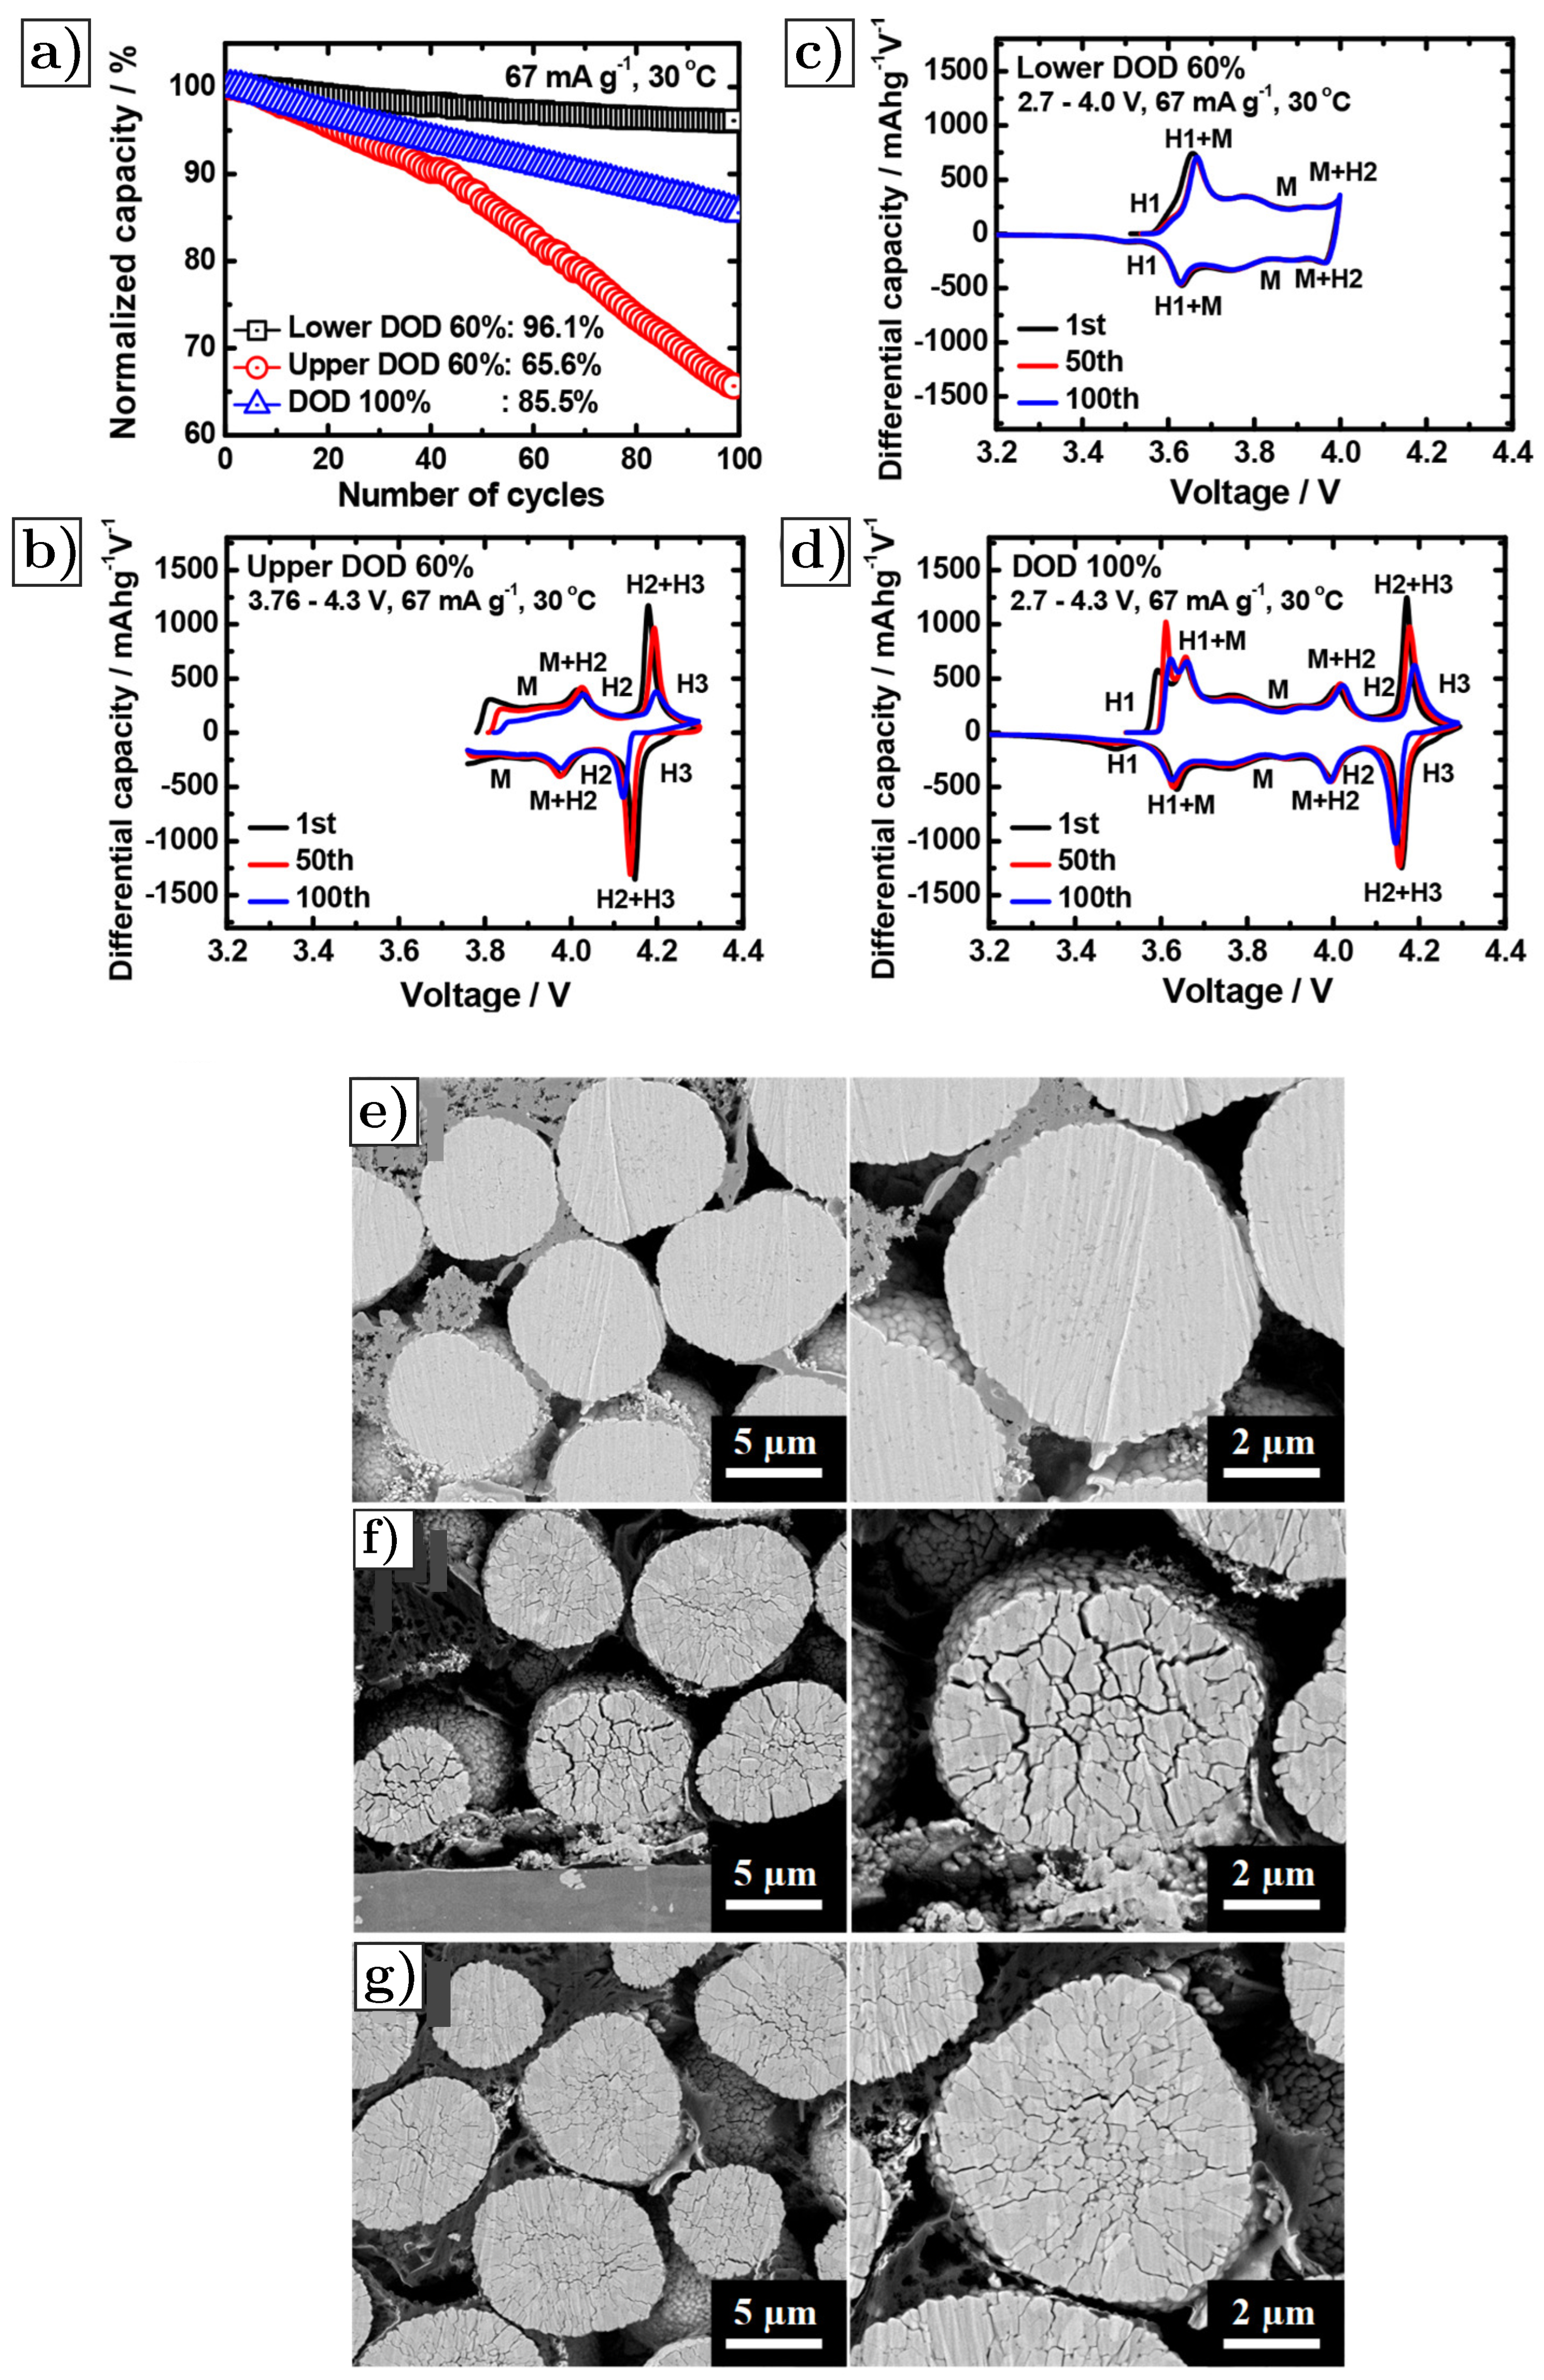
Figure 28.
Differential capacity curve of a fresh LCO half-cell charged to 4.8 V at 0.05C. Most relevant phase transitions are highlighted by the black arrows. Adapted with permission by Elsevier from [137], Copyright 2022.
Figure 28.
Differential capacity curve of a fresh LCO half-cell charged to 4.8 V at 0.05C. Most relevant phase transitions are highlighted by the black arrows. Adapted with permission by Elsevier from [137], Copyright 2022.
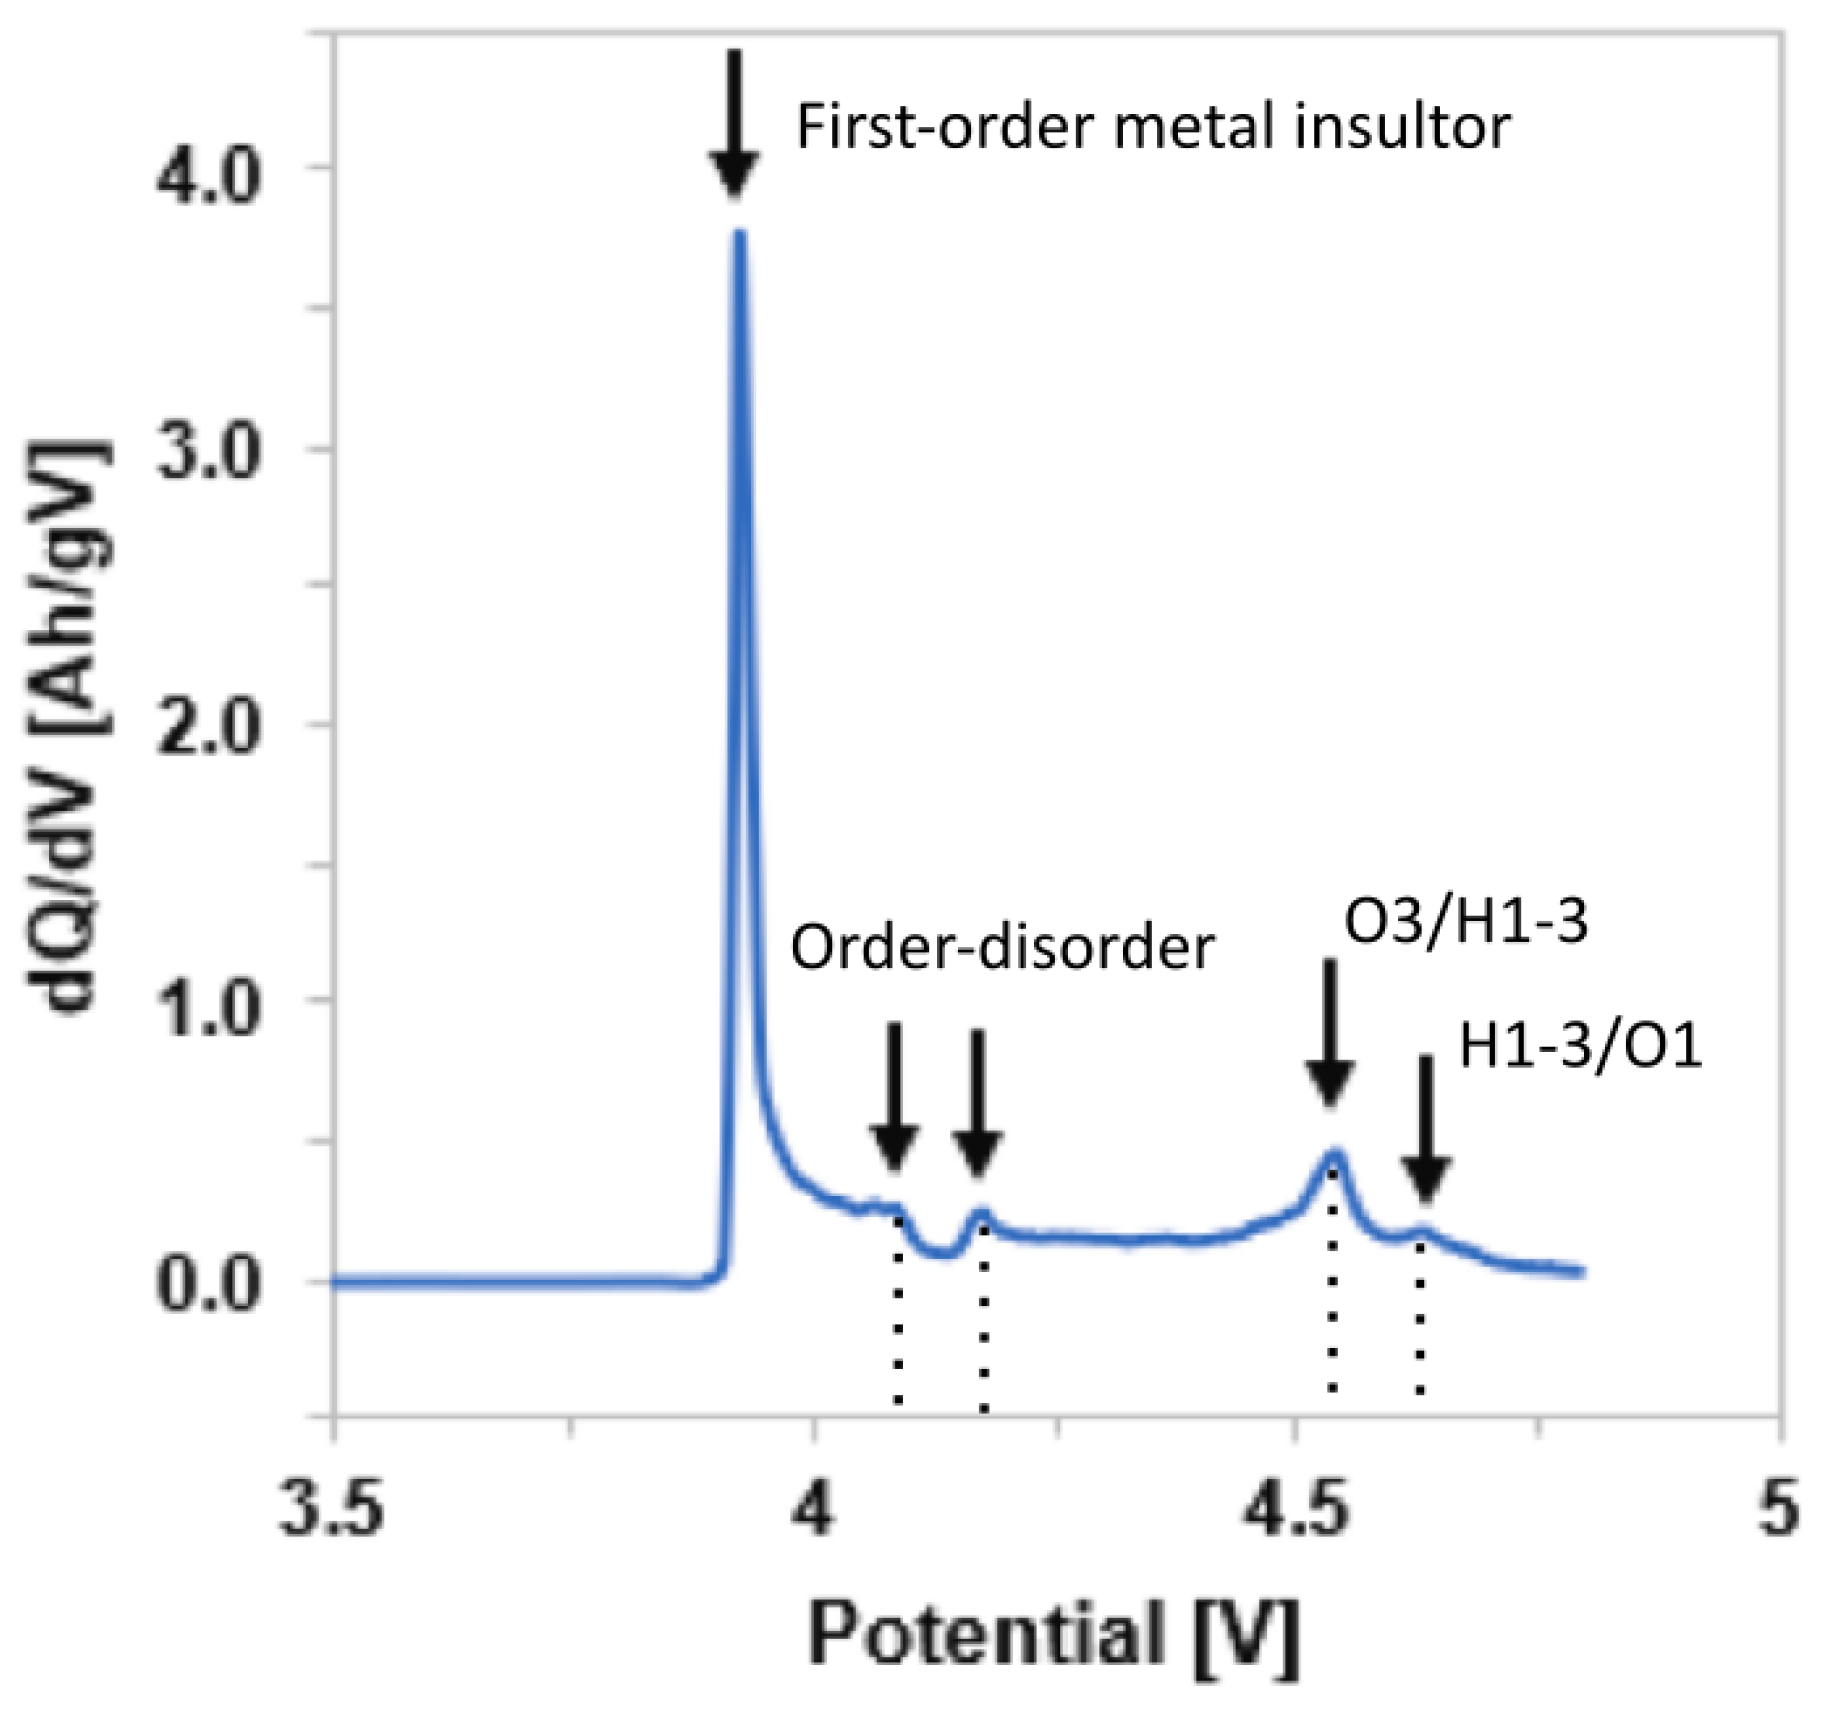
Figure 29.
Cleavage crack’s nucleation and propagation. (a) STEM-HAADF image showing the nucleation of cleavage cracks at the kinks occurring after 50 cycles. The (0003) plane is highly strained as indicated by the yellow arrows. (b,c) Further deformation-induced crack growth at the twin boundary. Pink lines indicate the extra (0003) planes generated to release the local strain. (d) V-shaped cleavage cracks induced by deformation. (e–h) Schematic diagrams to illustrate the cleavage crack nucleation and growth process. Reprinted with permission by Elsevier from [136], Copyright 2020.

Figure 30.
Phase transition induced cracking at the twin boundary. (a) A STEM-HAADF image showing the O1 phase (light blue region) formed at the highly distorted twin boundary, indicated by the light blue line. Incubation cracks at the twin boundary are marked by yellow arrows. (b) Decomposition crack formed along an O1 phase strip. (c) Schematic diagrams illustrating the cracking mechanism induced by phase transition at the twin boundary. Reprinted with permission by Elsevier from [136], Copyright 2020.

Figure 31.
Cracking along the twin boundary. (a) Reconstructed image from X-ray nano-tomography reprinted from [137]. (b,c) SEM images of a cross-section of LCO particles (milled with FIB), showing cracks originating from twin boundary and their planes direction. Reprinted with permission by Elsevier from [136], Copyright 2020.
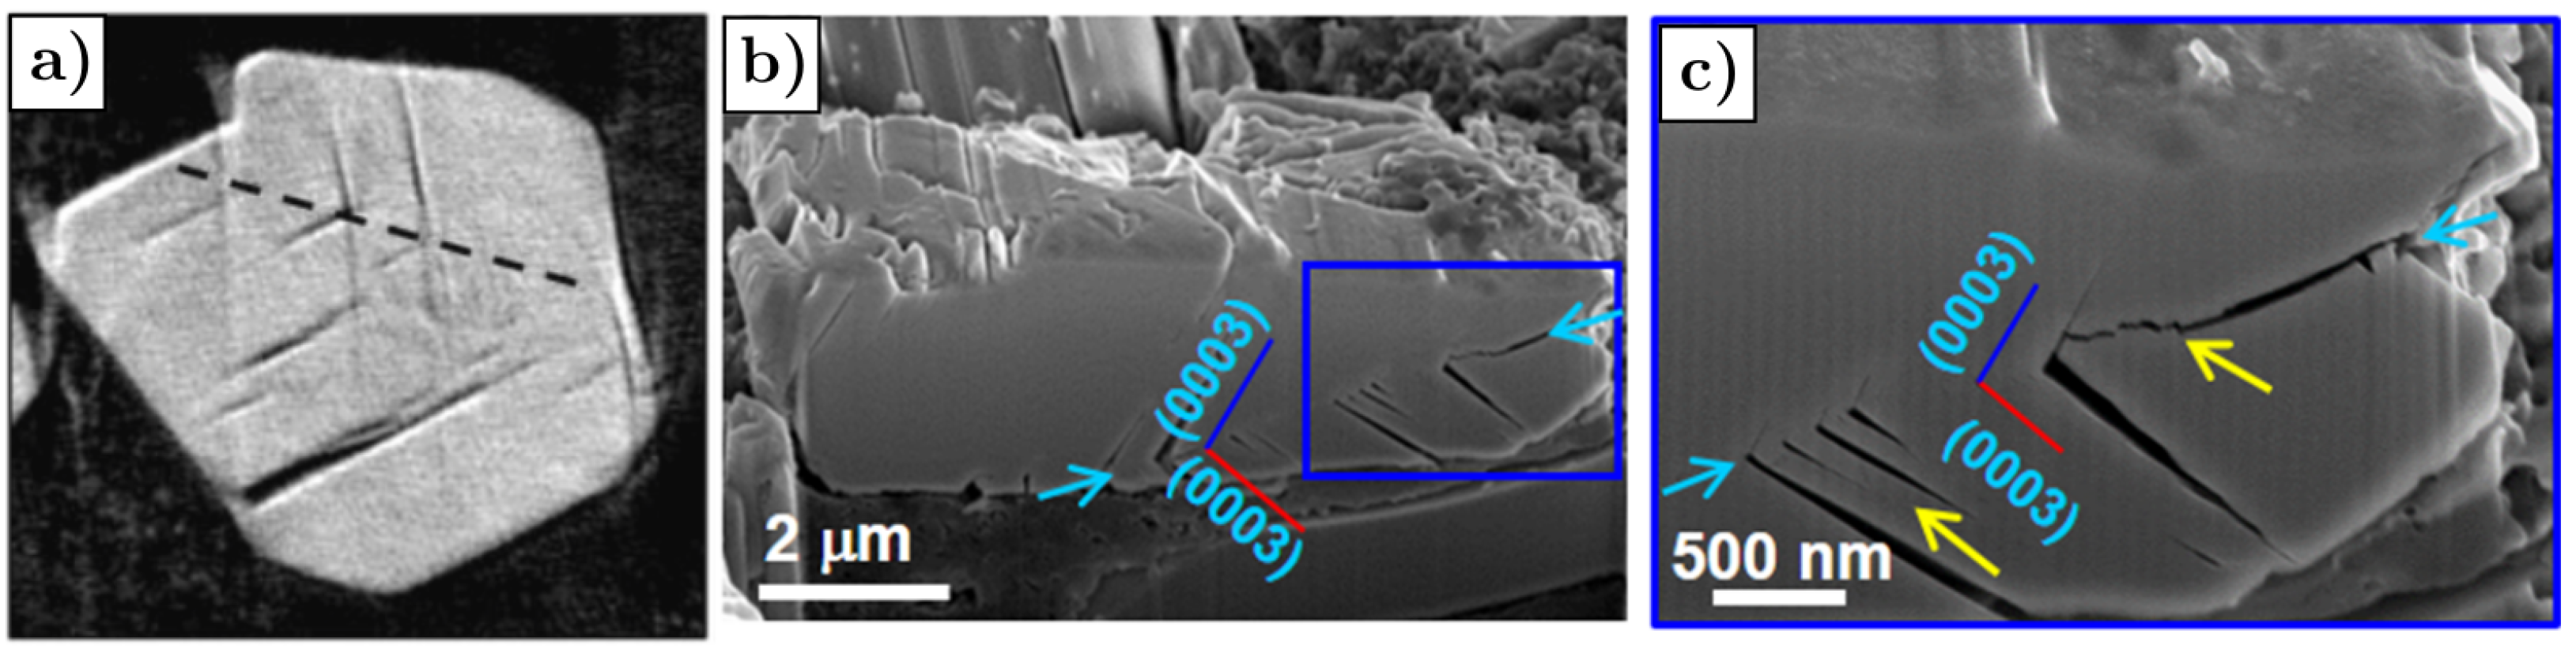
Figure 32.
(a) The percentage of LCO particles within a given volume range that contains cracks after a single charge cycle to a given cutoff voltage. (b) The crack area per unit of volume for particles within a given volume range after a single charge cycle to a given cutoff voltage. (c) The average individual crack area (proportional to crack length) for particles within a given volume range after a single charge cycle to a given cutoff voltage. Reprinted with permission by Elsevier from [137], Copyright 2022.
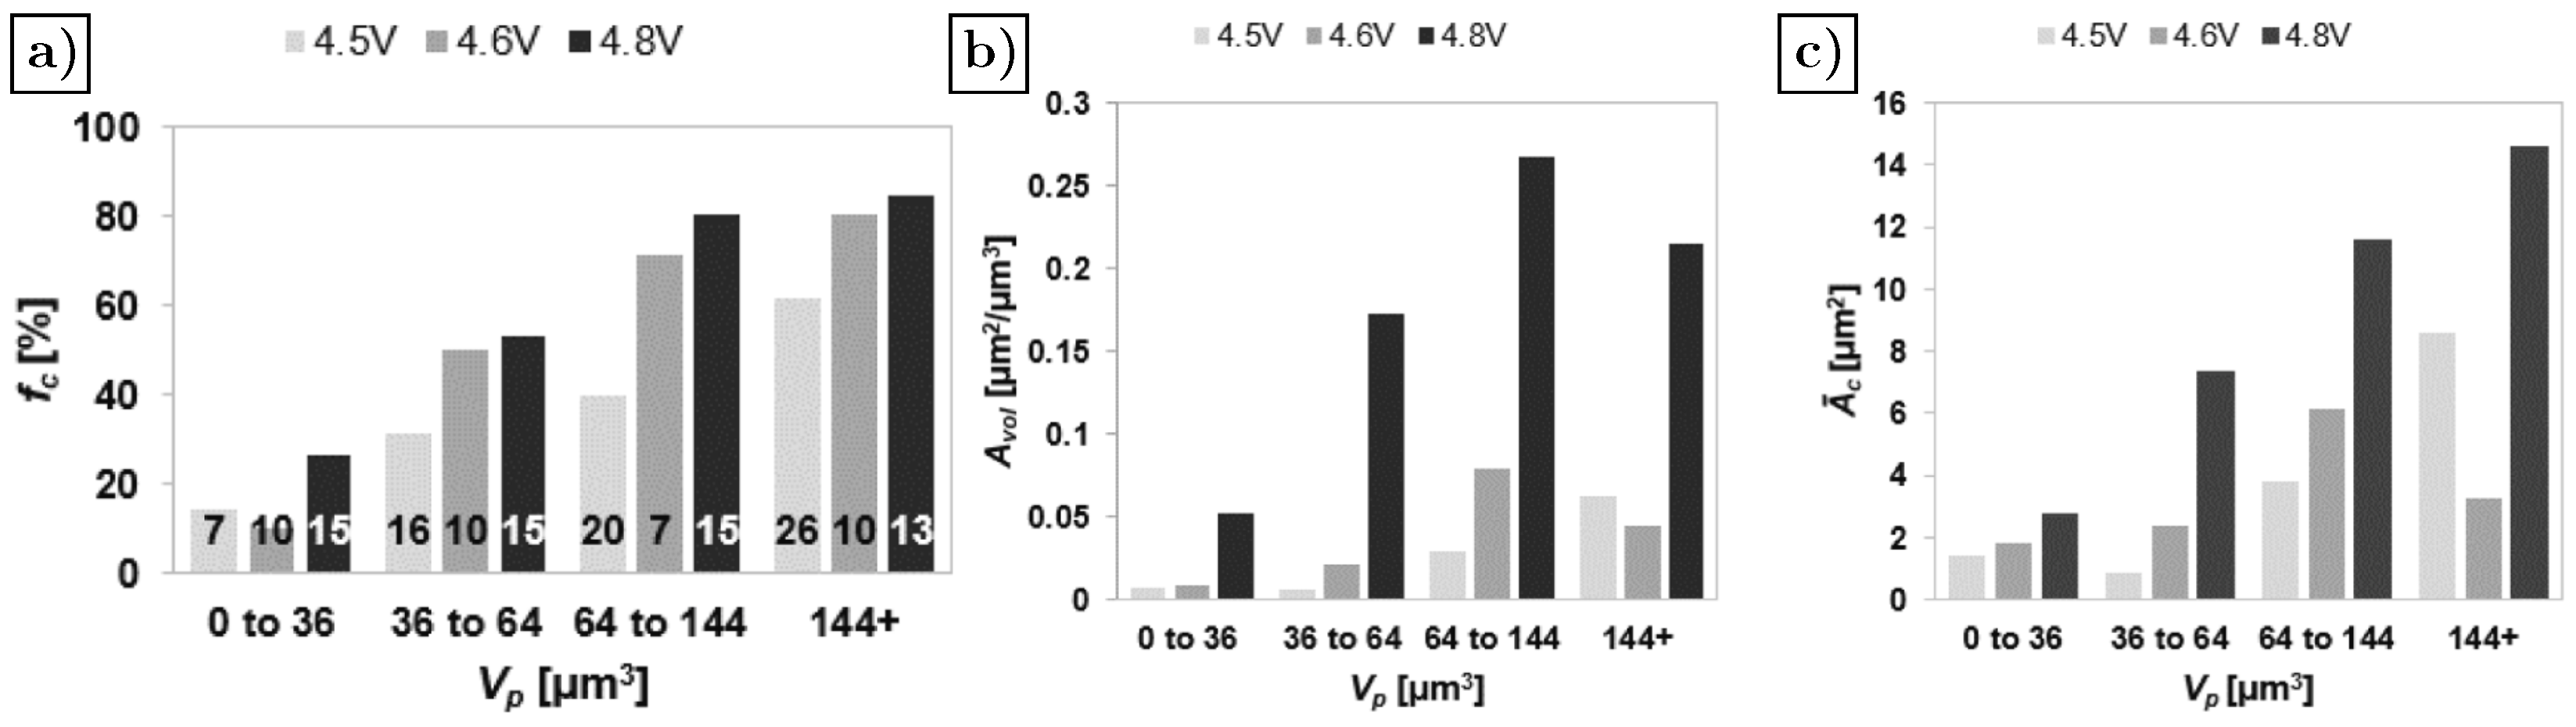
Figure 33.
(a–f) Cross sectional SEM images of cracks evolution in cathode cycled at 1C. Samples (a) before cycling, (b) after 1 cycle, (c) after 50 cycles, (d) after 100 cycles, (e) after 200 cycles, and (f) crack density as a function of the cycle numbers. Reprinted with permission by American Chemical Society from [99], Copyright 2018. Top view and cross-sectional SEM images of the NCM851005 cathode (g,j) before cycling, (h,k) after 100 cycles and (i,l) after 500 cycles at 1C. Reprinted with permission by American Chemical Society from [154], Copyright 2019. (m–p) FESEM images of hervester LCO/NMC532 cathode electrodes at various cycle numbers. Reprinted with permission by MDPI from [153], Copyright 2017. (q,r) Cross-sectional SEM images of at first cycle and after 1000 cycles, respectively. Reprinted with permission by American Chemical Society from [152], Copyright 2019.

Figure 34.
(a) Fracture in NMC particles of different size, after 50 cycles at 10C. (b) Fracture in NMC particles after 50 cycles at 1C, 2C, 3C, 5C and 10C. Reprinted with permission by Elsevier from [116], Copyright 2018. (c) Fracture occurrence in as a function of current rates and particles radius. Reprinted with permission by Elsevier from [155], Copyright 2017.
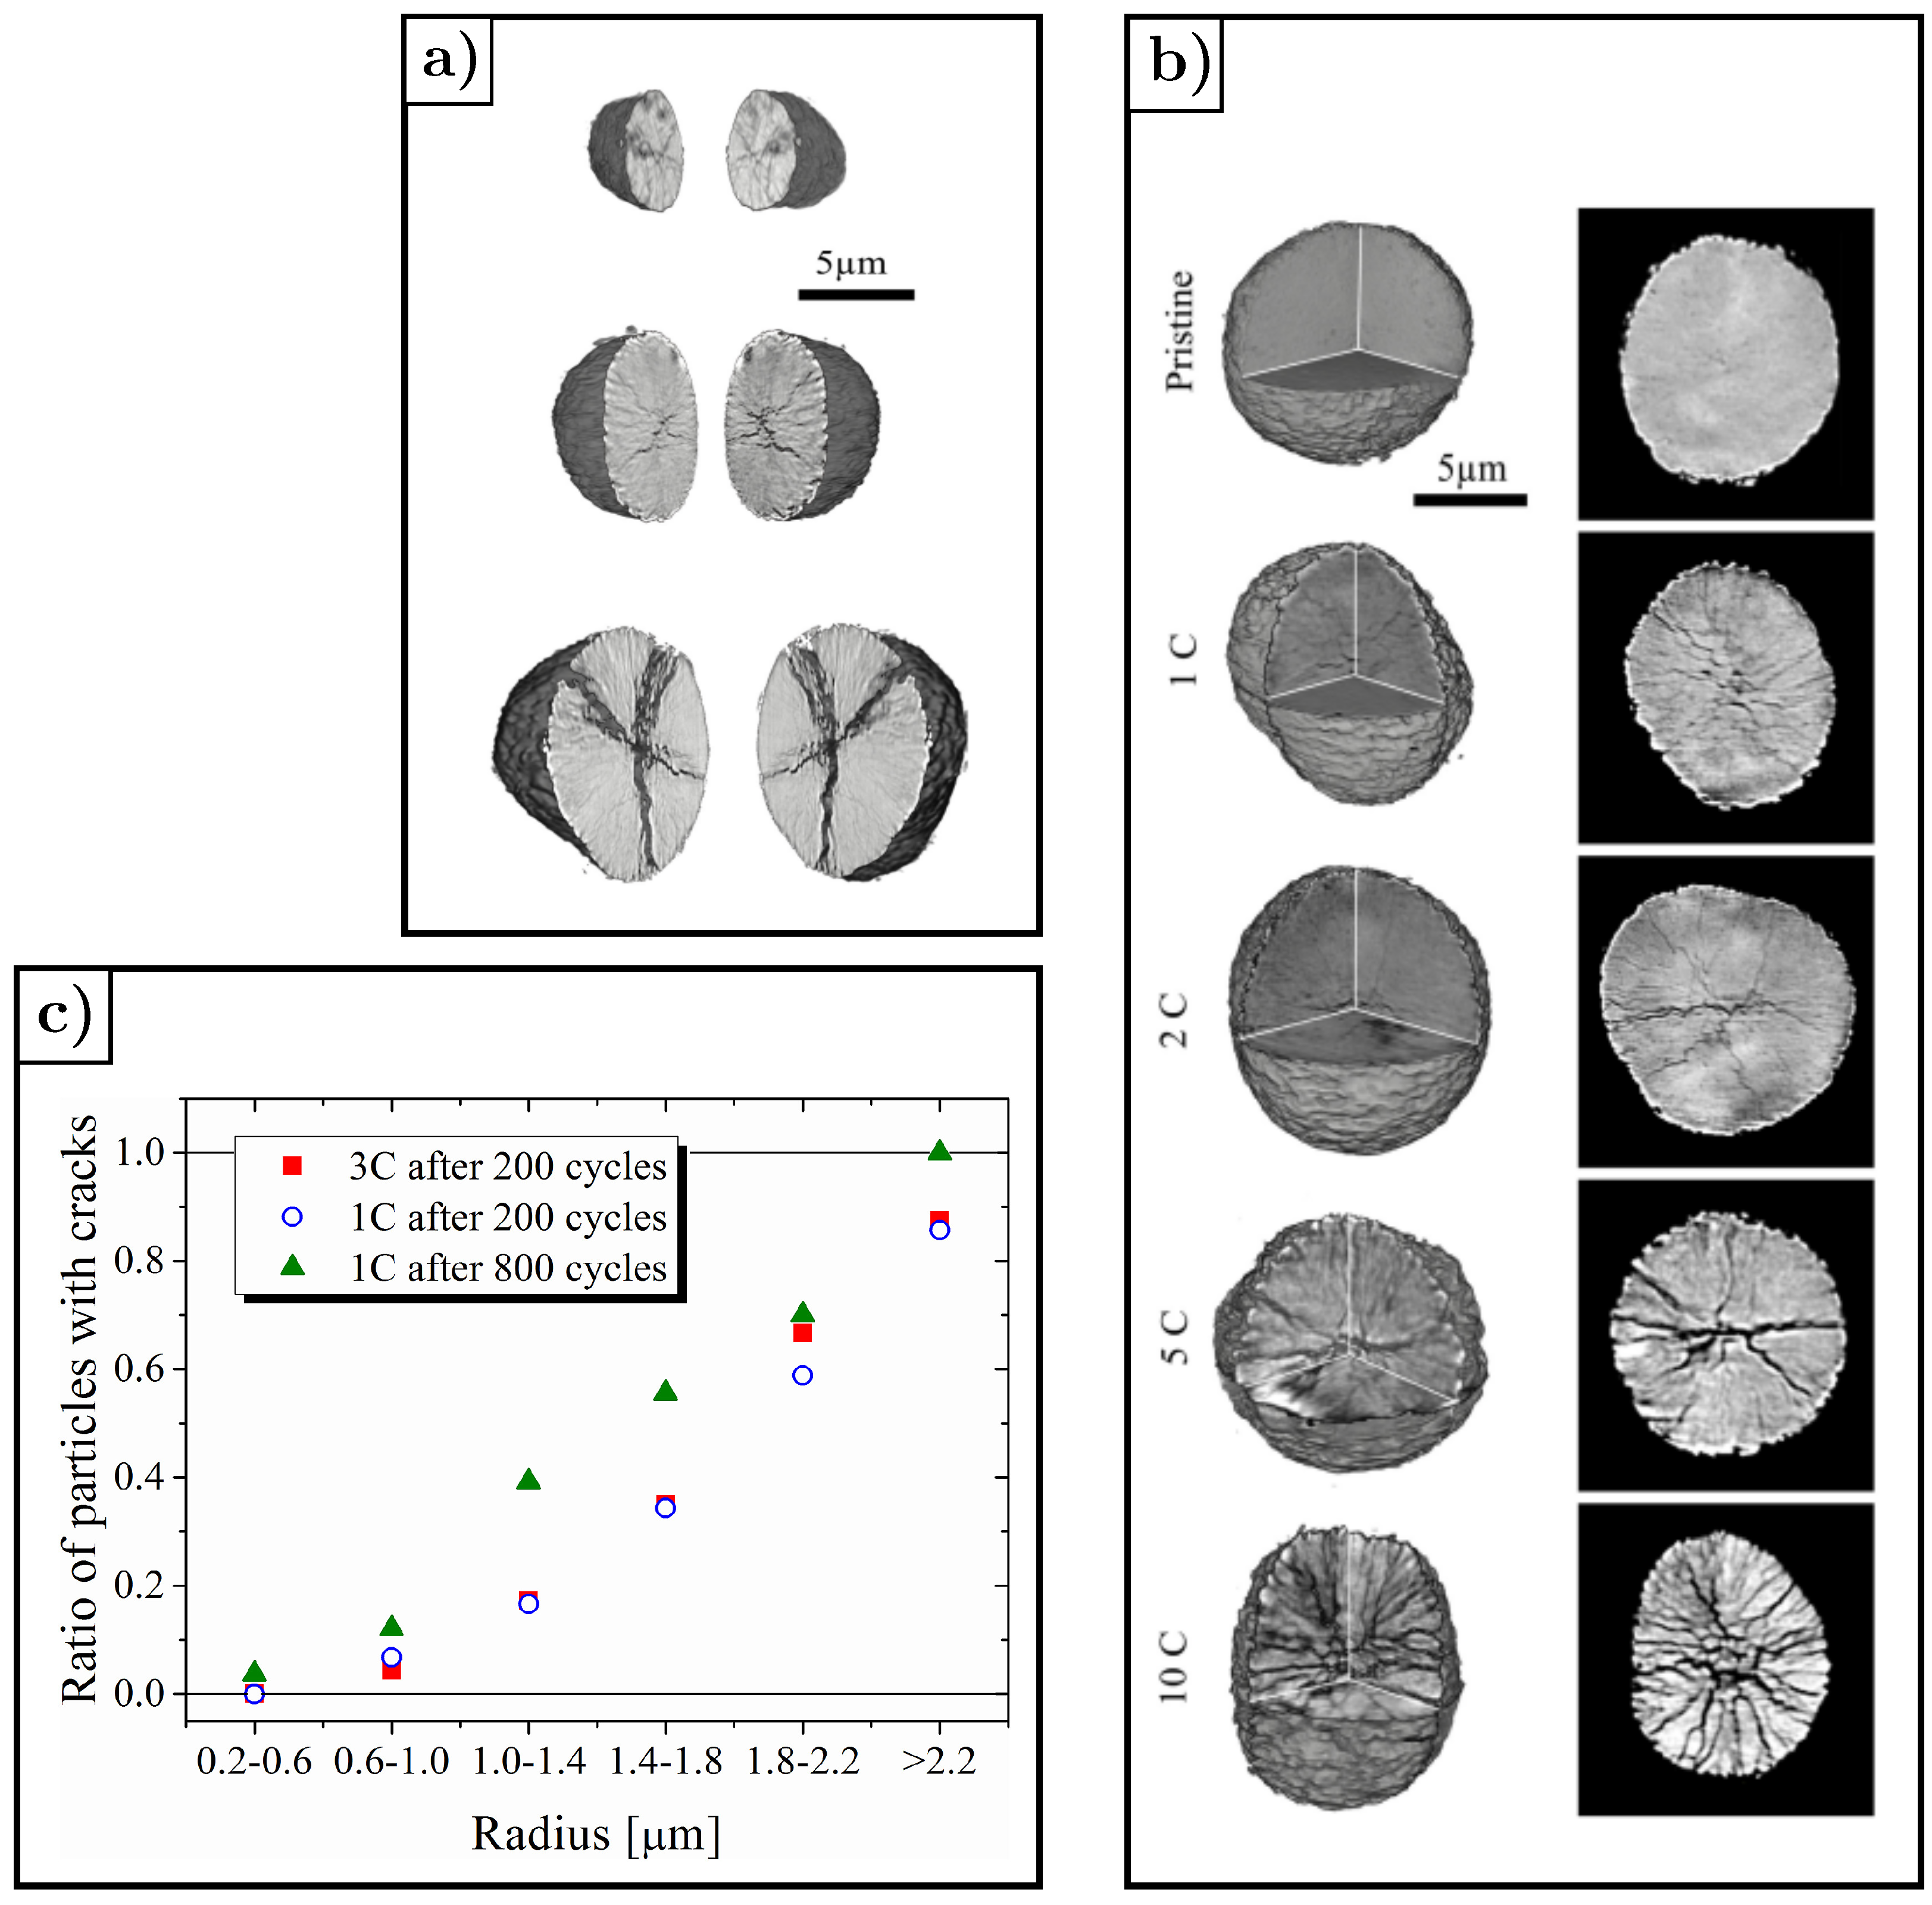
Figure 35.
Measures of crack length and area as a function of number of cycles with in-situ SEM. The material is NMC811 cycled with a lithium counter electrode at 0.5C and 2.7 V–4.7 V. Reprinted with permission by Elesevier from [157], Copyright 2021.
Figure 35.
Measures of crack length and area as a function of number of cycles with in-situ SEM. The material is NMC811 cycled with a lithium counter electrode at 0.5C and 2.7 V–4.7 V. Reprinted with permission by Elesevier from [157], Copyright 2021.


Table 1.
Review of the different experimental works performed on the cracking mechanism in LFP grouped according to particle morphology, particle size, (de)lithiation method, and experimental characterization technique.
Table 1.
Review of the different experimental works performed on the cracking mechanism in LFP grouped according to particle morphology, particle size, (de)lithiation method, and experimental characterization technique.
| Particle Morphology | Particle Size | Method | Technique | Fracture Observation | Ref. |
|---|---|---|---|---|---|
| Platelet | Chemical delithiation | SEM, TEM, HRTEM | Parallel to plane | [95] | |
| Almost Spherical | Electrochemical cycling | XRD, TEM, FMSEM | Parallel to plane | [101] | |
| Almost Spherical | Electrochemical cycling | TEM | Parallel to and planes | [98] | |
| Platelet | Chemical delithiation | TEM | Parallel to plane | [98] | |
| Almost Spherical | Electrochemical cycling | SEM, TEM | Parallel to plane | [99] | |
| Platelet | Chemical delithiation | SEM, TEM, HRTEM | Superficial and internal crack along c-axis | [97] | |
| Platelet | Chemical delithiation | SEM, TEM, HRTEM | Superficial and internal crack along c-axis | [97] | |
| Platelet | Chemical and Electrochemical delithiation | SEM, TEM HRTEM | No crack | [97] | |
| Platelet | Chemical delithiation | SEM, TEM STEM, STMX FF TMX, XANES | Cracks along c-axis mostly localized in the centre of the particle | [96] |
Table 2.
Summary of key information for fracture in active materials revised in Section 3. The fracture index assumes the value of 1 for materials less prone to fracture, and 3 for materials which are extensively subjected to fracture during battery operations.
Table 2.
Summary of key information for fracture in active materials revised in Section 3. The fracture index assumes the value of 1 for materials less prone to fracture, and 3 for materials which are extensively subjected to fracture during battery operations.
| Active Material | Fracture Index | Fracture Mechanism | Side Reaction | Lacks to Cover |
|---|---|---|---|---|
| Graphite | 2 | Superficial exfoliation and internal cracks | SEI formation and growth on the crack surfaces | Few detailed characterizations of fracture mechanisms |
| Silicon | 3 | Surface cracks in thin film, internal and superficial crack in nano-wires and nano-particles | SEI formation and growth on the crack surfaces | Development of new structures with different composition mitigating volume change |
| 2 | Cracks due to volume changes | SEI formation and growth on the crack surfaces | Determination of the optimal composition and particle size to mitigate volume change | |
| LMO | 2 | Intragranular cracks at the phase boundary due to Jahn–Teller transformation | dissolution | Few studies on the correlation between fracture and capacity decay |
| LFP | 1 | Cracks at the phase boundary interface | Fe-deficient amorphous layer on crack surfaces | Few studies on side reactions at crack surfaces, correlation between fracture and capacity decay, and controversial results about the correlation between fracture and phase transformation |
| NMC | 2 | Intragranular and intergranular fracture | Rock-salt formation on crack surfaces | Not clear crack initiation and growth mechanism and few studies on the correlation between fracture and capacity decay |
| NCA | 2 | Intergranular and intragranular fracture | Rock-salt formation on crack surfaces | Not clear effects influencing intergranular fracture and few studies on intragranular cracking |
| LCO | 1 | Cleavage cracks and cracks at the twin boundary due to phase transition | Not observed | Few characterization of fracture mechanisms, side-reaction at crack surfaces and correlation between fracture and capacity decay |
| LLO | 2 | Intergranular cracking | Not observed | Not clear effects influencing intergranular fracture and poor characterization of fracture mechanisms, side-reaction at crack surfaces and correlation between fracture and capacity decay |
Table 3.
Summary of the state-of-art of experimental fracture mechanics in the most popular active material used for LIBs electrodes.
Table 3.
Summary of the state-of-art of experimental fracture mechanics in the most popular active material used for LIBs electrodes.
| Material | Crystal Structure Deformation | Crack Morphology | Crack Growth with Cycling | Effects of Fracture on Electrochemical Performance |
|---|---|---|---|---|
| Graphite | [160,161,162,163] | [40,43,45,46] | [42,44] | [46] |
| Silicon | - | [49,50,54,55,57] | [51,55,57] | [71] |
| SiO | - | [72,73,74,75] | - | - |
| LMO | [83,85,86,87,89] | [83,86,89] | [84,87,88,155] | [84,88] |
| LFP | [93,94,95,96,97,98,99,100] | [95,96,97,99,101] | [98,99,101] | [99,101,103] |
| NMC | [106,108,109,110,111,112,113,114,115] | [108,109,110,111,113,115] | [106,108,110,111,115,152,153,154,156,157,159] | [106,112,115,121,159] |
| NCA | [132] | [132,134] | [129,130,133] | [132] |
| LCO | [136] | [136,137] | [136] | - |
| LLO | [146] | [146] | - | - |
Publisher’s Note: MDPI stays neutral with regard to jurisdictional claims in published maps and institutional affiliations. |
© 2022 by the authors. Licensee MDPI, Basel, Switzerland. This article is an open access article distributed under the terms and conditions of the Creative Commons Attribution (CC BY) license (https://creativecommons.org/licenses/by/4.0/).
Share and Cite
MDPI and ACS Style
Pistorio, F.; Clerici, D.; Mocera, F.; Somà, A. Review on the Experimental Characterization of Fracture in Active Material for Lithium-Ion Batteries. Energies 2022, 15, 9168. https://doi.org/10.3390/en15239168
AMA Style
Pistorio F, Clerici D, Mocera F, Somà A. Review on the Experimental Characterization of Fracture in Active Material for Lithium-Ion Batteries. Energies. 2022; 15(23):9168. https://doi.org/10.3390/en15239168
Chicago/Turabian StylePistorio, Francesca, Davide Clerici, Francesco Mocera, and Aurelio Somà. 2022. "Review on the Experimental Characterization of Fracture in Active Material for Lithium-Ion Batteries" Energies 15, no. 23: 9168. https://doi.org/10.3390/en15239168
Note that from the first issue of 2016, this journal uses article numbers instead of page numbers. See further details here.