Article

Multidisciplinary Assessment of a Novel Carbon Capture and Utilization Concept including Underground Sun Conversion

1
Energieinstitut an der Johannes Kepler, Universität Linz, Altenberger Straße 69, 4040 Linz, Austria
2
Montanuniversität Leoben, Chair of Process Technology and Industrial Environmental Protection, Franz-Josef-Strasse 18, 8700 Leoben, Austria
3
Johannes Kepler Institute for Energy, Johannes Kepler University Linz, Altenberger Straße 69, 4040 Linz, Austria
4
RAG Austria AG, Schwarzenbergplatz 16, 1015 Vienna, Austria
*
Author to whom correspondence should be addressed.
Energies 2022, 15(3), 1021; https://doi.org/10.3390/en15031021
Submission received: 29 November 2021 / Revised: 12 January 2022 / Accepted: 14 January 2022 / Published: 29 January 2022
(This article belongs to the Special Issue Progress in Power-to-Gas Energy Systems)

Abstract

:
The current work investigates the feasibility of a novel Carbon Capture and Utilization (CCU) approach—also known as Underground Sun Conversion (USC) or geo-methanation. The overall objective of the current work is a comprehensive assessment on the technical, economic and legal aspects as well as greenhouse gas impacts to be concerned for establishing USC technology concept. This is achieved by applying multidisciplinary research approach combining process simulation, techno-economic and greenhouse gas assessment as well as legal analysis allows answering questions about technical, economic feasibility and greenhouse gas performance as well as on legal constraints related to large scale CCU using geo-methanation in depleted hydrocarbon reservoirs. CO2 from the industry and renewable H2 from the electrolyser are converted to geomethane in an underground gas storage and used in industry again to close the carbon cycle. Process simulation results showed the conversion rates vary due to operation mode and gas cleaning is necessary in any case to achieve natural gas grid compliant feed in quality. The geomethane production costs are found to be similar or even lower than the costs for synthetic methane from Above Ground Methanation (AGM). The GHG-assessment shows a significant saving compared to fossil natural gas and conventional power-to-gas applications. From a legal perspective the major challenge arises from a regulative gap of CCU in the ETS regime. Accordingly, a far-reaching exemption from the obligation to surrender certificates would be fraught with many legal and technical problems and uncertainties.

1. Introduction

The European Green Deal sets the scene for a climate neutral European Union (EU) by 2050. According to the so-called ‘European Climate Law’, the target of zero net Greenhouse Gas (GHG) emissions has to be reached by 2050 with an intermediate goal of at least 55% GHG emission reduction until 2030 compared to 1990 emission levels [1]. This puts new challenges on the energy sector and the energy intensive industries to adapt for climate neutral production [2] within a timeframe of 29 years [3]. It is widely agreed that decarbonization of industry can only be achieved by applying a mix of technologies: fuel switch, electrification, material and energy efficiency, re-use and recycling, material substitution, Carbon Capture and Storage (CCS) [4] as well as Carbon Capture and Utilization (CCU). According to a report of the International Energy Agency (IEA) decarbonization will be hardly possible without CCS and CCU. Considering GHG mitigation aspects and economic aspects the demand for Carbon Capture Utilization and Storage (CCUS) solutions in industry will grow significantly in the upcoming decades. However, the topic of CCU and CCS and the arising question on technical and economic feasibility as well as the achievable climate mitigation effect is not new as it already has been risen by [5] where three CCS technologies were compared. Since then, significant technology development has been achieved and today several CCU technology options at different technology readiness levels (TRL) are available [6]. Amongst those are horticultural production, methanol production, polymer synthesis, mineral carbonation, concrete curing, algae production as well as power-to-gas [7] or power-to-X solutions [8]. Producing synthetic methane—among other hydrocarbons—via methanation of hydrogen (H2) and carbon dioxide (CO2) is currently a broadly examined CCU route in scientific literature [9]. pointed out the globally rising supply for CCU technologies and that in the year 2030 there will be the potential to use 910 Mt per year for the production of CO2-based fuels in order to use up the emitted CO2.
Today two main routes for methanation of H2 and CO2 exist: biological and catalytic methanation [10,11]. The research focuses besides technological feasibility and improvements also on economic viability and environmental aspects [12,13,14,15,16]. Reference [16] conducted a techno-economic analysis for SNG production using catalytic methanation and found two major factors influencing the economic feasibility of SNG as an CCU option: (1) hydrogen costs; and (2) the CO2 prices assumed as a credit. In fact, also a CO2 price of 100 EUR/t cannot compensate the higher production costs of green hydrogen compared to H2 from steam reforming. Comprehensive research on the techno-economics and climate impact of various CCU pathways also has been conducted by [9] showing that catalytic conversion pathways show promising economics and feasible greenhouse gas savings. Catalytic methanation requires high reactant gas purities due to the sensitivity of the metal catalyst towards contaminants, which is currently a restriction especially for large scale application as required for CCU purposes for industry. Recent experiments with real by-product gases from steel industry for example have clearly shown that without gas cleaning a constant degradation of the catalyst material occurs. A carbon filter delivered satisfying results not showing a significant catalyst degradation at lab-scale. Upscaling the lab-results for a steel mill aiming at completely substituting natural gas by integrated SNG production would still require a significant amount of catalyst [17].
In contrast to catalytic methanation the reaction in biological methanation is more robust towards impurities and intermittent reaction gas supply. However, biological methanation demands bigger reactor dimension due to lower space-time yields. This is one of the major limitations of biological methanation [18]. In summary the techno-economics and also the greenhouse gas impacts of SNG production using catalytic methanation or other CCU approaches like methanol production is well covered by recent scientific works. Ref. [19] for example showed that SNG production from biogas catalytic methanation—as a viable example for biogenic CO2 use—leads to significant GHG-savings compared to fossil natural gas. The origin of the CO2 makes a difference although from a “cradle-to-gate” perspective CO2 implies—regardless the industrial source—a credit of approximately—0.8 kg CO2eq/kgCO2captured which corresponds to a CO2 uptake of—2.69 kg CO2/kgSNG [20]. The remaining question nevertheless is, if a carbon uptake or at least carbon neutrality can be justified by establishing a loop applying large scale underground methanation. Depending on assumptions concerning CAPEX and OPEX taken into the results of techno-economic analysis of CCU pathways can differ significantly—also among identical products [21].
In a recent review on the technology readiness levels of carbon capture utilization and storage concepts, the option of CCU in depleted gas reservoirs has been neglected if this option only was referred to be a CO2 storage option [22]. However depleted gas reservoirs offer a great potential to be the biological methanation reactors of the future overcoming the limitation of scale. For geo-methanation CO2 and H2 are injected into a porous underground reservoir and converted to methane by microbes already present in the reservoir.
Whereas underground storage of CO2 and also H2 in depleted hydrocarbon reservoirs, coal seams, aquifers and salt caverns already has been discussed numerously in research [23,24,25,26] the simultaneous injection of CO2 and H2 for exploiting the potential of underground biological methanation still lacks recognition. Although the work of [27] focusses on H2 underground storage the identified need for more know how on microbiological data can also be transferred to geo-methanation, which will require more field tests. Microbial activity and the conversion of H2 to CH4 is mostly described as potential pitfall for underground hydrogen storage [27,28] and not as a potential for using underground storage facilities for targeted geo-methanation of H2 with additionally injected CO2 to develop a large scale CCU possibility for future decarbonization. Reference [29] showed that carbon neutrality for hydrocarbons from high CO2 gas condensate reservoirs can be achieved by closing the loop applying CCS. The work clearly indicates that closing carbon cycles provides carbon neutral option but it lacks of economic perspectives as well as a detailed greenhouse gas assessment and solely takes into account a CCS option ignoring potentials for CCU.
A current study reports two demonstration projects which investigate the feasibility of geo-methanation: HyChico in Argentina and Underground Sun Conversion (USC) in Austria [30]. The lack of projects investigating large scale CCU utilizing the natural presence of microbes in underground reservoirs provides the first evidence of a lack of technical and economic feasibility studies for that approach.
Existing studies strongly focus on large scale hydrogen storage in different geological formations. Reference [31] for example examined systemic aspects of large scale H2 storage in Romania. Reference [32] studied the cost of H2 storage in French salt caverns and concluded that this is economically feasible as the storage costs only make up a minor share of the total hydrogen costs. Another work on the economics of hydrogen underground storage has been done by Reference [33] where the storage in salt caverns has been compared with storage in buried pipes and an aboveground tank. According to a recent review several studies exist that estimate the costs of H2 underground storage, but partly focusing on storage in salt caverns [34]. There is a lack of detailed investigations for underground storage in depleted gas reservoirs in terms of techno-economics. The existing studies strongly focus on technical aspects such as the work done by [35] or [36] who examined the behaviour of H2 in the reservoir and defined criteria for choosing reservoirs. Reference [37] studied the environmental impacts of H2 storage in a depleted gas reservoir.
In contrast only a few studies investigate underground methanation of H2 and CO2. The few available works concentrate on technical feasibility and potentials like [30] or [38]. To the knowledge of the authors there are no other recent studies on underground methanation of H2 and CO2 in depleted gas reservoirs available.
The research project USC investigates the in situ microbial methanation of carbon dioxide and hydrogen in depleted natural gas reservoirs and aims to develop a process chain for its industrial utilization. Results from the Underground Sun Storage research project [39] have strongly indicated that microbial consortia present in depleted biogenic gas reservoirs are capable of using hydrogen for the formation of methane. Such a technology would make it possible to generate and convert large amounts of renewable energy, both in Austria and in areas with a high potential and export this energy to densely populated areas with a lower renewable energy generation potential. In addition, this represents a huge source by potentially providing the urgently needed flexibility, which renewable energy sources currently lack. The utilization of CO2 in that process enables the creation of a sustainable carbon cycle.
In general, there are two main use cases for the USC technology:
  • Seasonal electricity storage (use of the USC technology for large-scale long-term storage of renewable electricity)
  • CCU (use the USC technology for the production of green SNG from renewable electricity and CO2 from the industry)—main focus of this paper.
The produced geomethane can be used in different sectors (mobility, power, heat, industry) and within these for various applications (e.g., in mobility as a fuel for ships, busses and trucks; in industry as a power source or chemical feedstock; for electricity production in gas fired power plants; or for space heating).
Whereby use case 2 is the one in focus of the analysis conducted in the current work. The novelty of the current work can be found in the following aspects:
  • Addressing underground methanation as use case for large scale CCU;
  • Assessing the techno-economics and greenhouse gas performance for this use case;
  • Assessing the technical feasibility of this approach by process simulations in demonstration-scale;
  • Assessing these aspects based on data derived from the field trial conduction in Austria within the project USC.
Additionally, the legal aspects concerning CO2 capture and reuse are investigated to provide a holistic picture for large scale CCU. The embedding of the respective processes in the legal framework is crucial for their realisation, which is why a legal analysis of it is provided in this paper. The development of a green gas certificate system is also of great relevance. Indeed, a uniform European system for guarantees of origin must be established quickly. Therefore, the current status is also subjected to a legal analysis in this regard, and related difficulties are presented.

2. Materials and Methods

2.1. Process Simulations

For the simulations performed in this work, Aspen Plus® flowsheet simulations were developed with the goal to establish a reliable data base for the technical ability of an upscaled underground geo-methanation process. Based on these data the possibility to integrate such a process in future CCU scenarios shall be assessed. Therefore, a series of process flowsheets were mapped out representing the existing USC pilot plant in Pilsbach, Upper Austria, designed and operated by RAG Austria AG [40]. Figure 1 and Figure 2 show a simplified version of the established flowsheets for two operating modes named BATCH and CYCLE. For both modes, all relevant process components from the pilot plant operated in Pilsbach have been included in the simulation setup.
The lower half of each figure represents the storing of natural gas mixed with CO2 and H2 produced from renewable energy sources. Starting with blending of CO2 with Natural Gas (NG) from a nearby natural gas reservoir, H2 produced by Electrolysis (ELEC) is added afterwards. The electrolyser is operated at 65 °C and 30 bars, with an efficiency of 70%. Once the gas is mixed, it is compressed to 45 bar (INPUT) and injected into the depleted gas reservoir acting as bio-/geo-reactor for the methanation of CO2 and H2 (RESERVOIR). A total operating volume (TOV) of 500,000 Nm³ with injection/production rates up to 2000 Nm³/h can be managed with the pilot plant. On the upper half of the figures the withdrawal of natural gas and any converted synthetic natural gas (geo-methane) from the reservoir is shown. The produced gas stream including reservoir and reaction water according to Equation (1) [41], as well as not-converted H2, CO2 and higher hydrocarbons (OUTPUT wet), is fed to a free water knockout (FWKO) and a gas drying unit (GDU).
CO 2 + 4 H 2 = CH 4 + 2 H 2 O   ( g ) Δ H r 0 = 165   kJ / mol
For both units split fractions of 0.9 for water were implemented. The separated water is stored in a tank from where it can be further treated and possibly re-used in the overall process concept (e.g., for the PEM electrolyser). Then, the pre-treated dry gas (OUTPUT dry) is tempered and fed into a membrane-based gas separation unit with a split fraction of 0.2 for hydrogen and CO2, and 0.8 for methane and higher hydrocarbons. While the PERMEATE contains the main share of CO2 and H2, the RETENTATE is rich on natural gas and geo-methane.
Depending on the operating mode, the PERMEATE is either re-injected into the reservoir after being blended with the NG, CO2 and H2 mixture (CYCLE mode), or it is re-injected into the Austrian gas grid with the RETENTATE (BATCH mode). For both modes, a RECYCLE resp. BYPASS stream is implemented, to limit the flow rate of dry gas fed to the installed membrane unit to 600 Nm³/h. Furthermore, in CYCLE mode, injection and production take place at different wells (LEH002 & LESP-001A) which were drilled in the same reservoir structure but 200 m apart from each other. In BATCH mode, the geo-methane is retrieved from the very same well it was injected to (LEH002).

2.2. Techno-Economic Assessment

The techno-economic assessment (TEA) of the USC technology is performed for CCU use cases, two different USC plant configurations (performance of the plant) and for two different plant sizes (defined by the nominal gas volume flow into the underground pore storage). Further, the TEA is done for the timeline which starts in 2025 and end in far future (2050). To perform the TEA different methods are used.
First, the TEA is carried out in large part in accordance with the guideline “Tech-no-Economic Assessment and Life Cycle Assessment—Guidelines for CO2 Utilization” by Zimmermann et al. (2018) [42].
Second, for calculating the future cost reduction potentials due to learning curve effects and economies of scale the Tool CoLLeCT (Component Level Learning Curve Tool), see Böhm et al. (2019) [43], an in-house development of the Energieinstitut an der JKU Linz, is used. CoLLeCT represents a tool for calculation and analysis of overall learning curves for variable assemblies by observance of the learning rates of its sub-components and their properties. Thus, it allows a detailed analysis of the cost structure as well as the com-prehension of components from comparable and well-known technologies. So, it is rendered possible to determine the cost development of complex structures on a low technology readiness level according to future production volumes. Additionally, the modular approach allows for a consideration of spill-over effects from concurrent us-ages of technologies and components.
Third, for calculating the production costs of geomethane for different use cases out of the USC plant the tool PResTiGE (Power to gas assessment tool), see Böhm et al. (2020) [44], an in-house development of the Energieinstitut an der JKU Linz, is used. PResTiGE is a toolbox for current and prospective techno-economic and environmental benchmarking of PtG systems. The tool comprises data from demo sites and benchmark systems as options for electricity storage or applications of the gaseous products H2 or SNG at different scales, in forms that are regionally adaptable over all process steps of the PtG system and product application. The assessment results reveal the optimal PtG system configuration and implementation (i.e., with minimal cost and maximal system benefits). Sensitivities can be systematically analysed to explore the robustness of the results. The quantitative economic assessment via PResTiGE is based on the specific production costs of hydrogen or SNG, which are calculated from the total annual costs in relation to the amount of annually produced energy. The total annual costs are calculated using the so-called “annuity method” following VDI 2067.

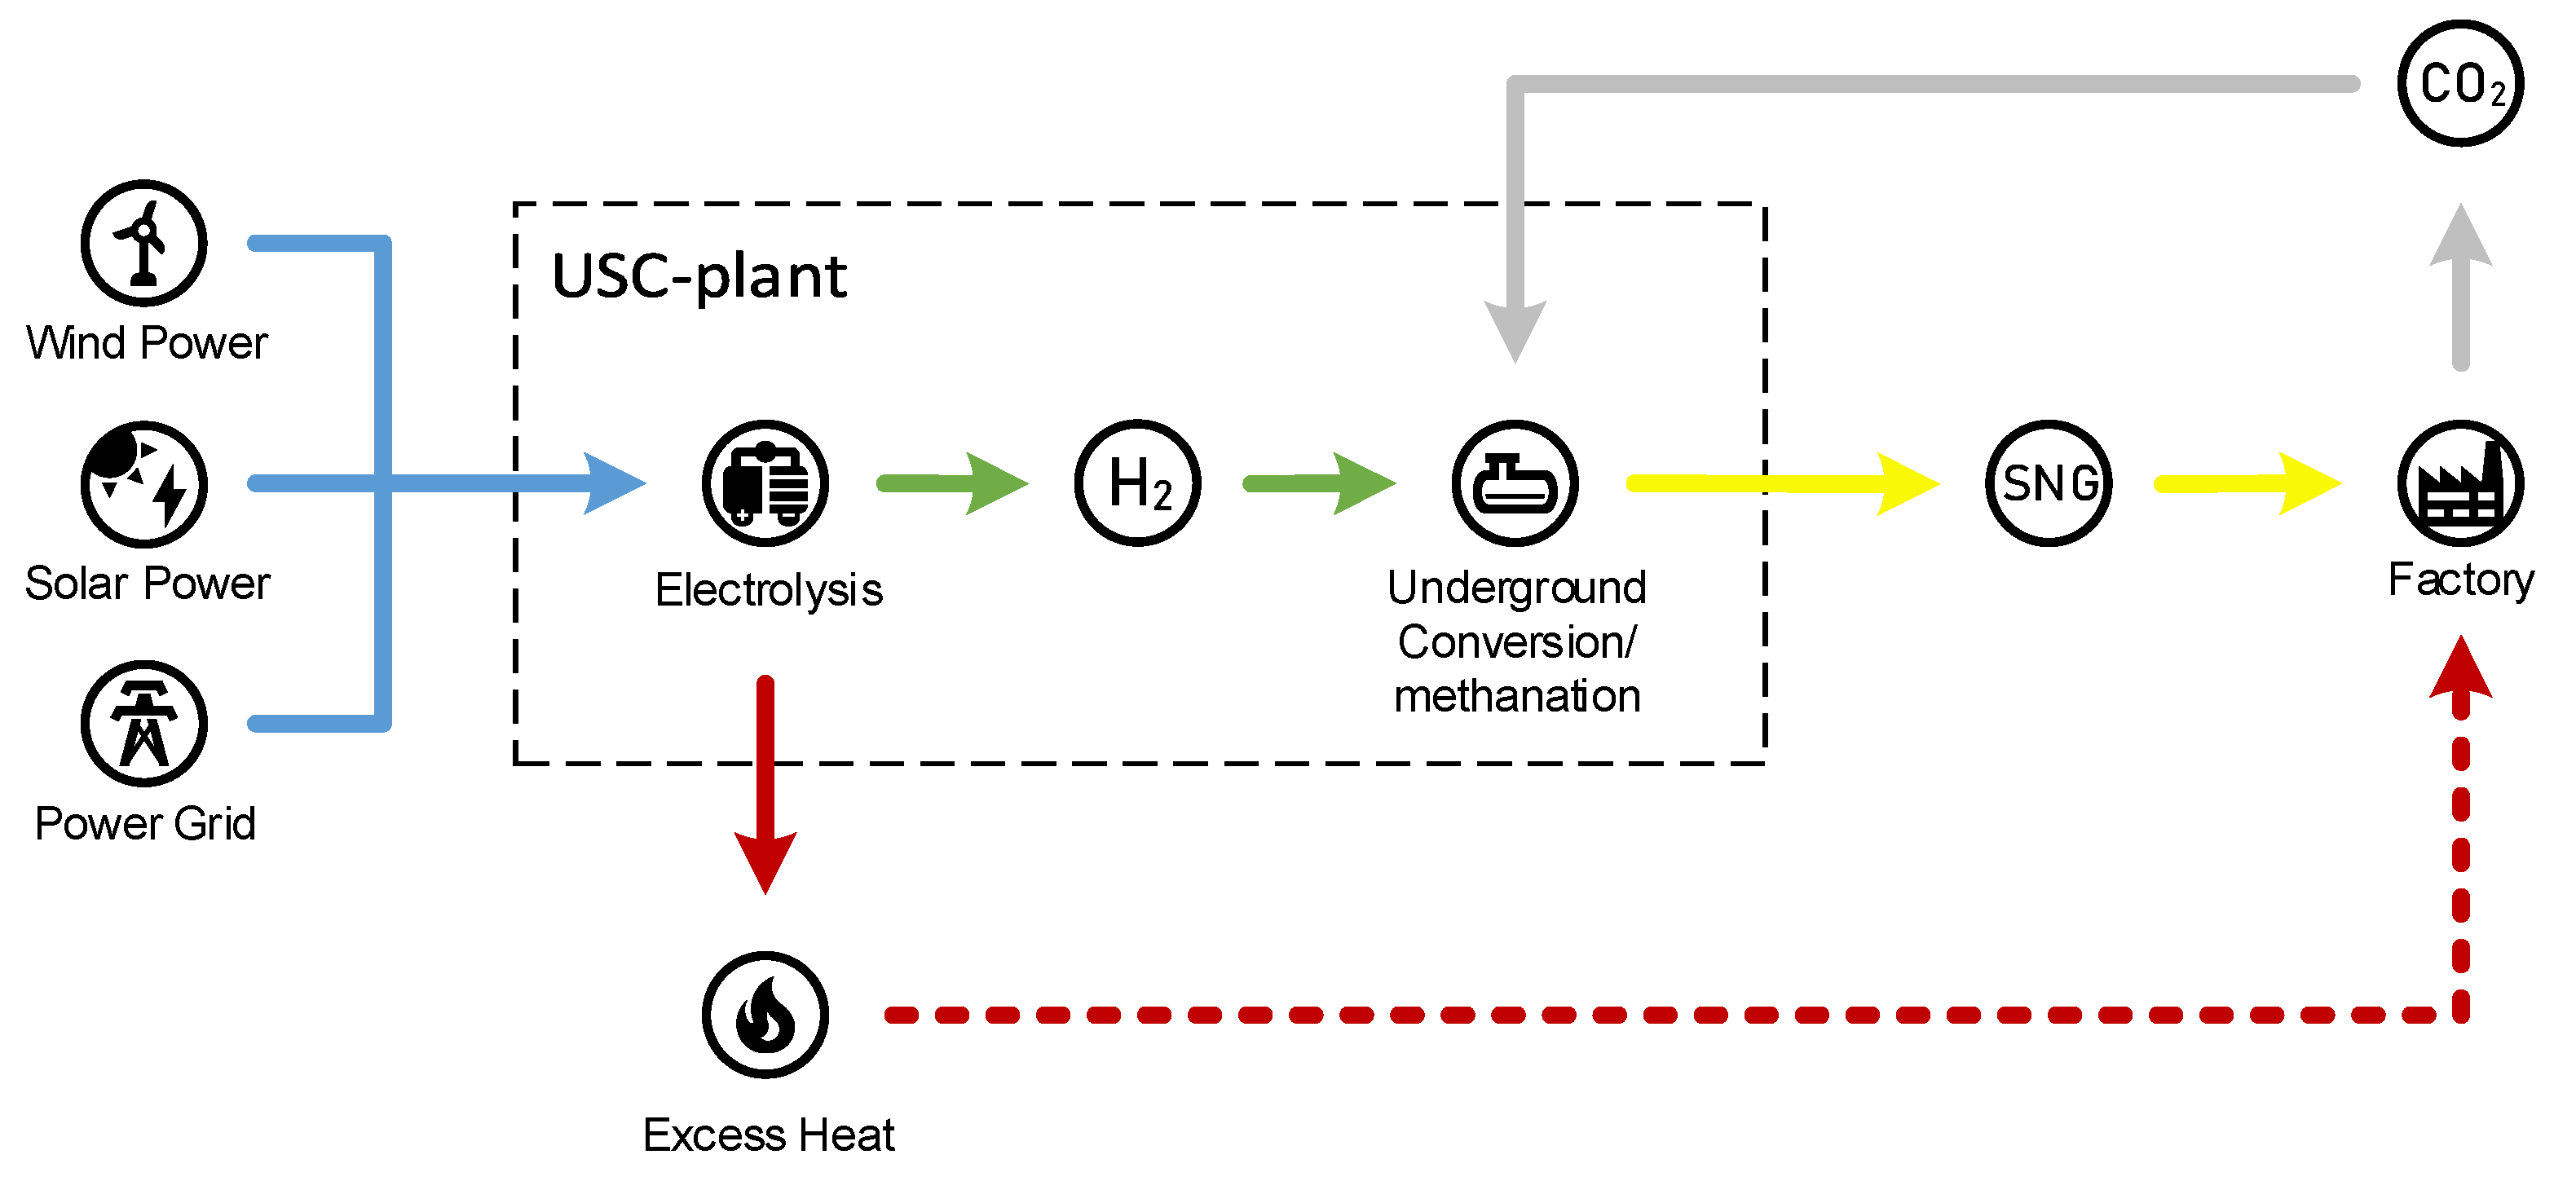
2.2.1. Overview of the Assessed CCU Use Case

The goal of the use case CCU is to produce a maximum amount of SNG with green electricity and CO2 from industry for the use in industry. In Figure 3 the interaction of the individual components and players are shown.
CO2 from the industry (from processes available the whole year) and renewable H2 from the electrolyser are converted in the underground pore storage to geomethane. The geomethane is again used in the same industry process, where previously the CO2 was released.

2.2.2. General Parameters and Data for the TEA

In Table 1 the most important general parameters for the TEA are listed.

2.2.3. USC Plant Configurations

Based on the real data of the test series directly at the storage facility as well as the laboratory tests, two possible configurations of a USC plant are derived, which essentially differ in terms of the stored and withdrawn gas composition (input/output), and thus by the H2 conversion, the efficiency and the stoichiometric ratios:
  • USC base (average case);
  • USC advance (close to the theoretical optimum);
The gas composition (proportion of CH4, H2 and CO2) of the injected and withdrawn volume flow for the two plant configurations is shown in Figure 4.
In the plant configuration base, 20% H2, 5% CO2 and 75% CH4 are stored in the underground pore storage. After the conversion, the output volume flow consists of 11.1% H2, 2.8% CO2 and 86.1% CH4. Thus, the share of CH4 in the overall mixture is increased by 11.1 percentage points. In comparison, a significantly higher proportion of H2 (30%) is stored in the advance plant configuration. Similar to the plant configurations base, CO2 is added stoichiometrically (7.5%). The remaining share in the volume flow is accounted for CH4 (62.5%). In the advance plant configuration, it is assumed, that all H2 and CO2 is converted to CH4, which means that 100% CH4 is available at withdrawal.
Based on the gas composition, further characteristic data (volume flows, mass flows, energy flows, H2 or CO2 demand, CH4 production, etc.) of the USC plants are be derived.

2.2.4. USC Plant Size

The USC demo plant was designed for a gas input volume flow of 2000 Nm³/h. In the TEA, larger plants with a volume flow of
  • 25,000 Nm³/h
  • 100,000 Nm³/h
are considered.
Depending on the USC plant size (NOTE: The term “USC plant size” refers to the nominal gas input volume flow to the underground storage) and the plant configuration (see Section 2.2.3), the required electrolysis capacity, the corresponding methane production and the converted amount of CO2 result, see Table 2.
There is a strong influence of the plant size and, above all, the plant configuration on the required electrolysis capacity, the corresponding geomethane production and the converted amount of CO2. Between the plant configuration base and advance there is a factor of three. This means that with the same plant size (volume flow of the plant) three times more geomethane can be produced in the advance than in the base process configuration. This is due to the lower conversion of H2 in the base compared to the advance configuration (see therefore Figure 4).

2.2.5. USC Plant Investment Costs

The total investment costs of the USC pilot plant (confidential data) and their subdivision into individual cost items (e.g., costs for the electrolyser, installations above ground and underground, etc.) serve as a starting point for future cost projections.
The aim of a USC plant is the production (and storage) of SNG, which is why the Figure 5 shows the specific investment costs of USC plants in relation to the production of 1 kWSNG. The costs are compared to a state of the art aboveground (catalytic) methanation (AGM) with an equivalent methanation (SNG output) and included with all necessary devices for storage in an underground pore storage (drilling, compressors, pipes, etc.).
The specific investment costs of USC plants are highly influenced by the process configuration. In base configuration the costs are approximately double as high as in the advance configuration. The reason for this can be found, among other things, in the size of the electrolyser (due to the composition of the input gas) and consequently the SNG production. Between base and advance lies a factor of three, i.e., in the advance process configuration a three times larger electrolyser is used and the SNG production is also three times higher than in the base case (see Table 2). However, there will be a reduction in investment costs in the future due to learning curve effects.
Compared to a conventional Above Ground Methanation (AGM) plants the specific investment costs of USC plants are generally higher, especially for the process configuration base. However, it should be noted that with a USC system, large quantities of gas (carrier gas required for the process; depending on the process configuration 62.5–75% of the volume flow of the plant) are additionally stored. In comparison to the AGM system, only the amount of SNG produced in the process is stored (the amount of SNG produced in USC and AGM is equal; depending on the plant configuration 20–30% of the volume flow of an USC plant).

2.3. Greenhouse Gas Assessment

For assessing the greenhouse gas performance for chosen USC scenarios the ISO 14040/44 Life Cycle Assessment (LCA) methodology has been applied. The methodology consists of four steps: (1) definition of goal and scope defining the technical system boundary as well as temporary and geographical boundaries; (2) Life Cycle Inventory (LCI) where mass and energy flows to and from the system are gathered; (3) Life Cycle Impact Assessment (LCIA) finally normalizing and attributing mass and energy flows to environmental impact categories and (4) interpretation [53,54]. The methodology of LCA is vastly discussed in the scientific literature [55,56,57,58,59] in the context of power-to-gas applications also [60,61,62]. Accordingly there will not be a detailed description of the general methodology within the current work.
The Greenhouse Gas Assessment (GHG-Assessment) is conducted using GaBi ts 10 LCA software and the corresponding Professional database as well as ecoinvent v3.6 database. Data for background processes is derived from named LCA databases. Mass and energy flows in foreground processes are based on assumptions in techno-economic evaluation according to the process design. Figure 6 shows the system boundaries for the geo-methanation process and also displays foreground and background processes. Erection of infrastructure (i.e., road to plant) and construction plant (i.e., piping, electrolyser, compressors, etc.) are not considered in the assessment considering that the specific impact broken down to the functional unit is comparably low due to long life time [63] and power-to-gas system components play a minor role for the environmental impact of produced gases [64].
Figure 6 shows the applied “cradle-to-gate” system boundaries without considering the end use of the produced geo-methane. The function of the system is to produce synthetic methane from H2 and CO2. Accordingly, the functional unit is 1 MJ CH4 produced within the geo-methanation process. Carbon dioxide as a by-product of ammonia production is assumed to be the external carbon source in order to reflect the industrial CCU use case also applied in techno-economic analysis. The geographic boundary is Austria and the temporary boundary is the timeframe from 2017 to 2021 which corresponds to the duration of the field trial.
In line with the technoeconomic analysis, LCA also examines three scenarios differing in plant configuration showing different conversion rates for CO2 and H2 to CH4 in the underground storage resulting in different gas mixtures as an output. The mass balance representing the LCI for GHG-assessment is shown in Figure 7.
As the mass balance shows, a significant amount of gas is kept in the loop and injected again to the underground pore storage. The operating energy used for geo-methanation is solely made up by electricity for electrolysis, gas injection and gas withdrawal. For the scaling and the electricity consumption of the compressors, a calculation based on the real gas values of methane and hydrogen was performed [65,66]. The electricity demand for the advance case is estimated to be 728 MJ/h for electrolysis, 288 MJ/h for injection and ranges from 181 MJ/h for the advance case up to 233 MJ/h for the base case for gas withdrawal. Due to the obtained gas mixtures an allocation procedure for CH4 and H2 as energetically usable process outputs based on the lower heating value (LHV) was developed (see Table 3).
All three scenarios were further analysed applying the following three different electricity sources for each of them for operating the electrolyser:
  • 100% wind power
  • 100% solar power
  • Austrian grid mix
The other electricity consuming components (i.e., use the AT electricity mix). Table 4 shows the applied processes from LCA databases. Additionally, two different CO2 sources have been assumed—one biogenic from biogas and the other from ammonia synthesis (see also Table 4).
For the LCIA CML 2015 method is applied, which is a problem-oriented classification of material and energy flows for impact assessment and categorizes results in so-called midpoint categories. The GHG-performance is expressed in the Global Warming Potential (GWP) measured in kg CO2-equivalents (kg CO2eq).

3. Results

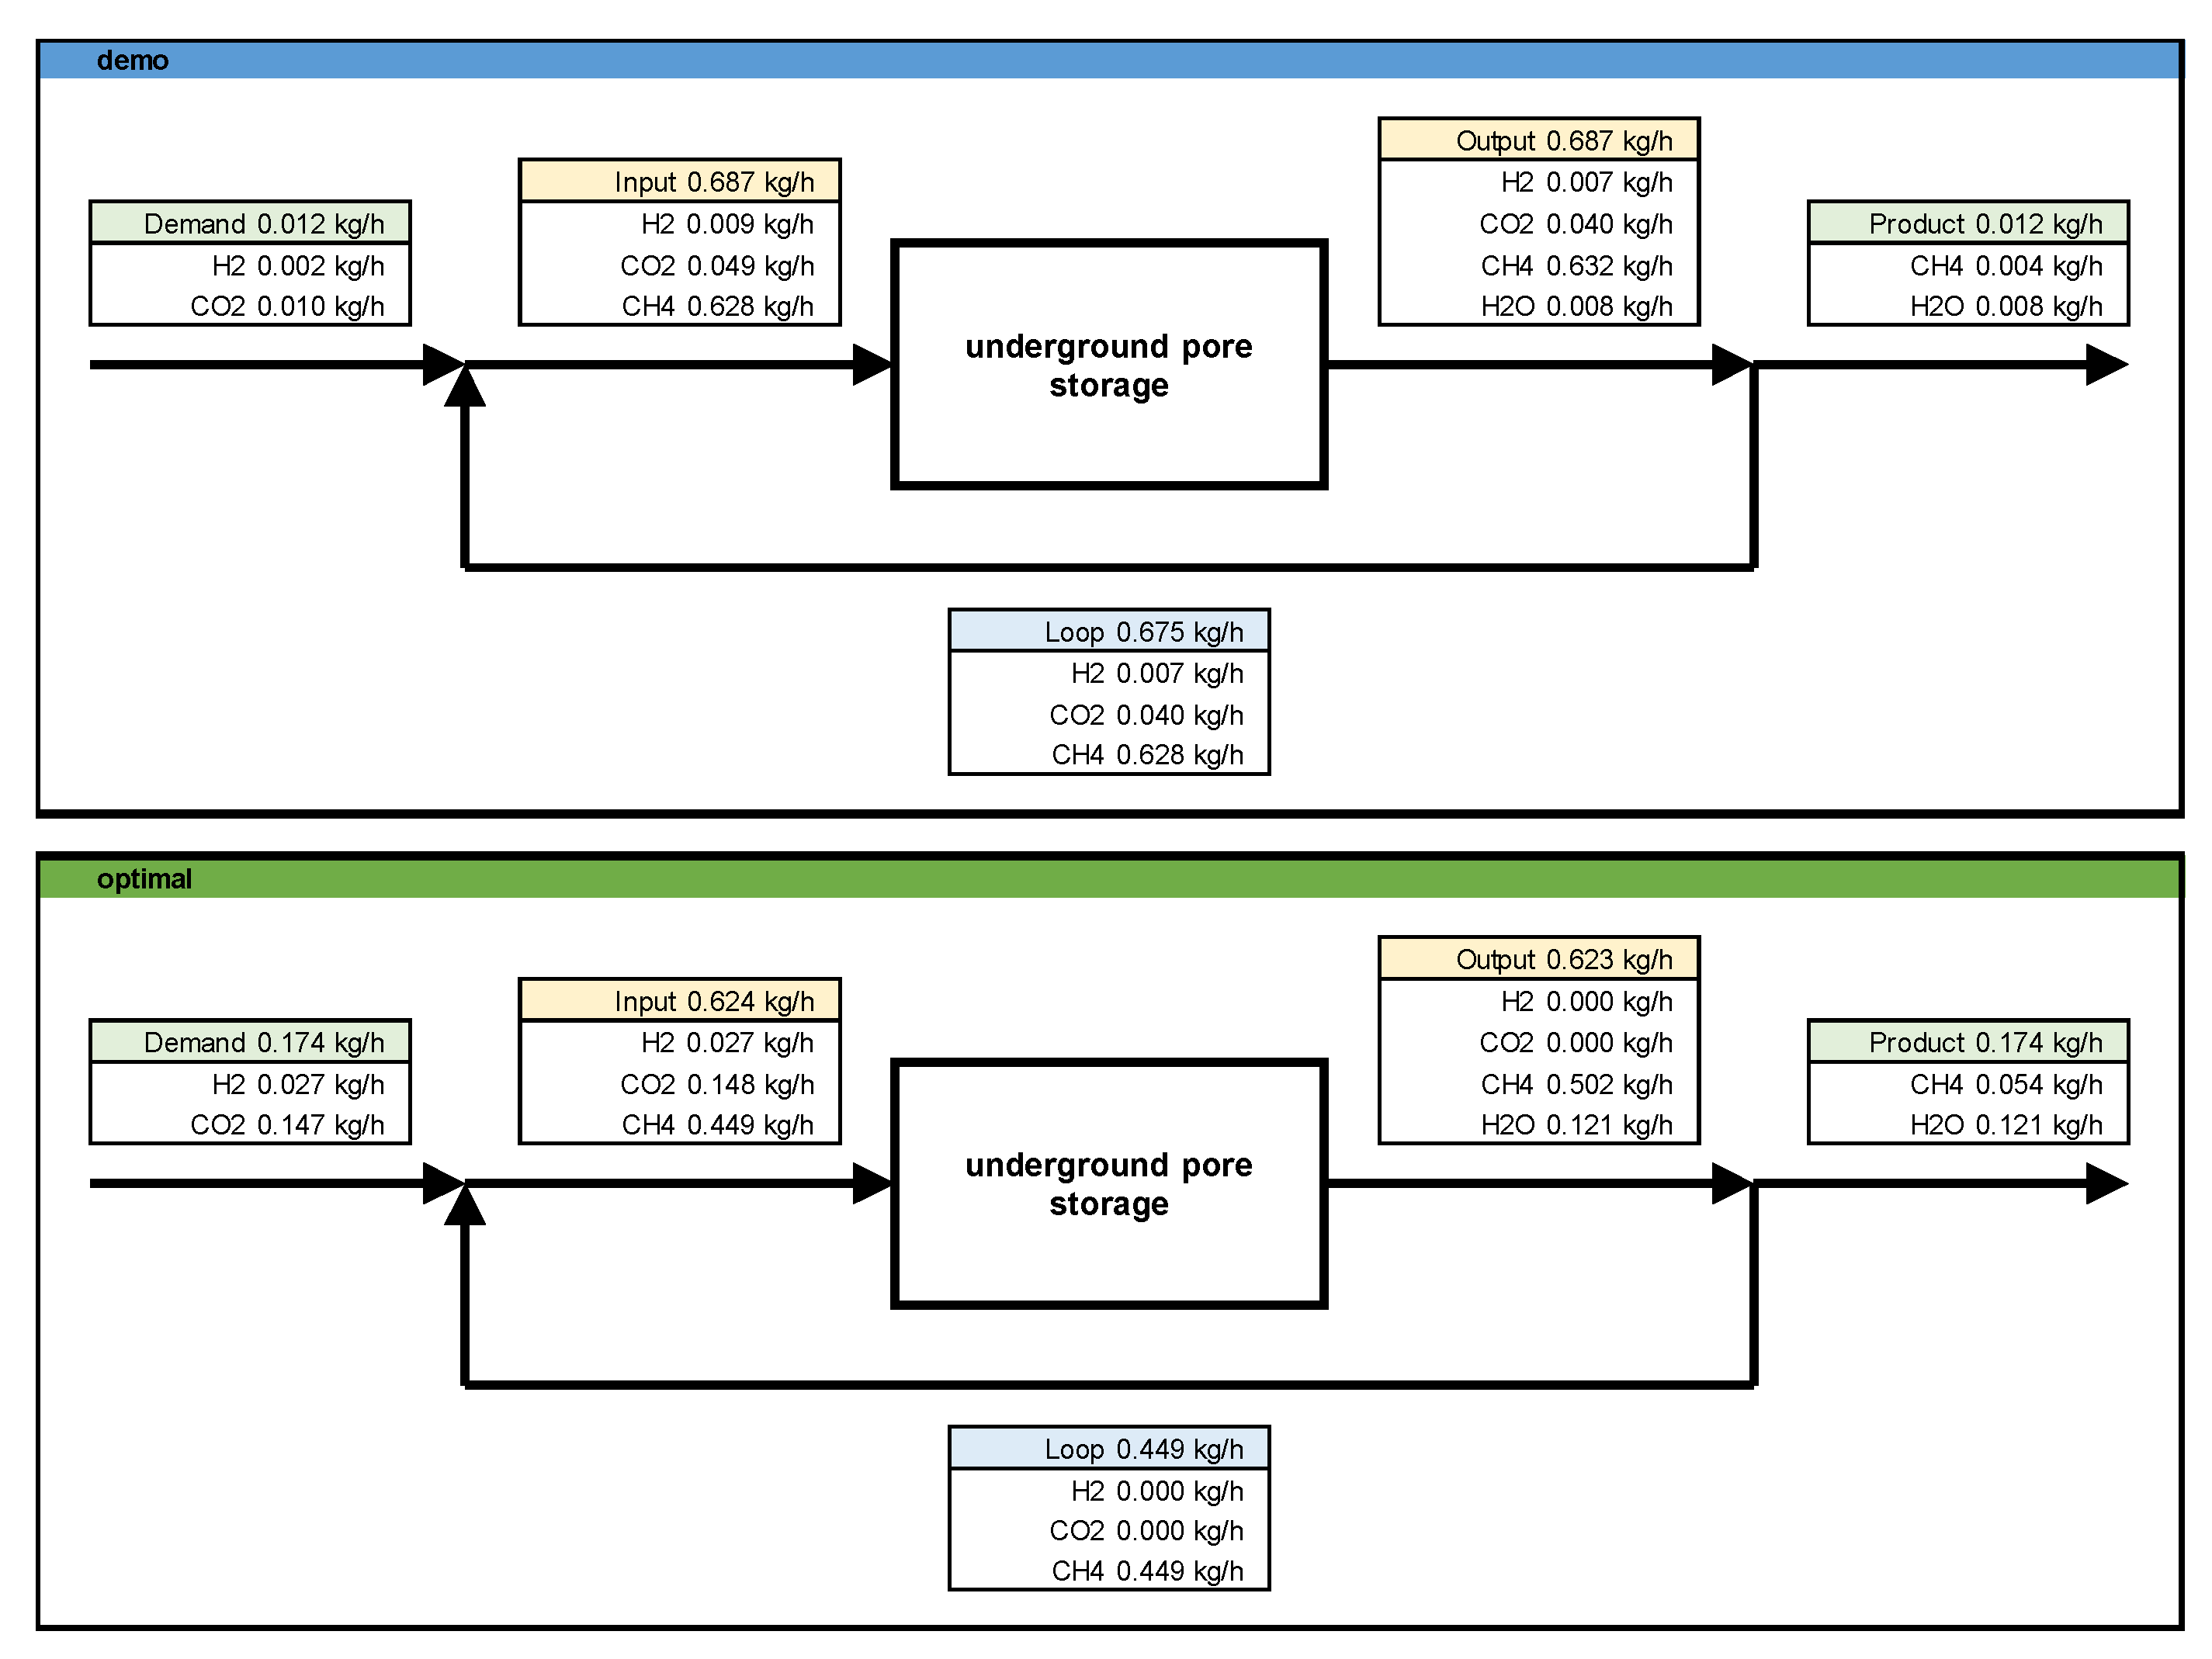
3.1. Process Simulations

With the established flowsheets (Figure 1 and Figure 2) a series of simulations was performed with varying partial conversion rates for the bio-methanation reaction taking place in the downhole reservoir according to the Sabatier equations for CO2 methanation Equation (1) [41]. In addition, two different gas mixtures were considered for the injected gas stream, one containing 10 vol.-% H2 and 2.5 vol.-% CO2 (reaction stoichiometry, INPUT 1), and another one with an increased hydrogen amount of 20 vol.-% and 2.8 vol.-% of CO2 (hydrogen surplus of 80%. INPUT 2). Finally, also the injection and production flow rates were varied between 1000 and 2000 Nm³/h. All variations were simulated for both operating modes (BATCH and CYCLE). Table 5 shows the gas composition of the individual streams on the injection side of the simulated geo-methanation process [67]. The simulation results shown in the following figures represent the CYCLE operating mode with a flow rate of 2000 Nm³/h.
For INPUT Case 1, Figure 8 shows the gas composition in vol.-% of the dry gas stream after the water separation units (OUTPUT dry, left) as well as the final product stream after an integrated membrane unit for gas upgrading (PRODUCT, right). A series of partial conversion rates from 0.1 to 0.9 in steps of 0.1 was considered. A value of 1.0 would represent full conversion of any CO2 to geo-methane through the downhole geo-methanation process. For Case 1 in CYCLE mode, the methane content varies between 87.4 and 97.3 vol.-% for the dry output stream, as well as between 95.5 and 98.3 vol.-% for the final product stream. The hydrogen share decreases for the dry output stream from 9.1 to 1.1 vol.-% with increasing conversion rate. On the product side, hydrogen is already at a low level of 2.5 vol.-% with a 0.1 conversion rate due to the high efficiency of the membrane unit. For a partial conversion rate of 0.9, almost no hydrogen and CO2 are present in the product gas anymore, leaving 98.3 vol.-% CH4 and 1.3 vol.-% of higher hydrocarbons in the product (all values in vol.-% (dry)).
Figure 9 shows the composition of all relevant gas streams for simulation Case 1 and a selected partial conversion rate of 0.7. This value represents one specific operation mode conducted in the field. For this simulation, the gas composition from the injected gas stream with 86.3 vol.-% of methane upgraded to 94.7 vol.-% during the geo-methanation and further up to 97.6 vol.-% with the membrane unit. H2 and CO2 started with 10 respectively 2.5 vol.-%, and decreased to 0.8 and 0.2 vol.-% for the final product stream (all values in vol.-% (dry)).
The second simulation case addresses an elevated amount of hydrogen to be stored in the underground gas reservoir. This INPUT Case 2 includes 20 vol.-% of H2 and 2.8 vol.-% of CO2 as INPUT (highly over-stoichiometric, H2:CO2 = 7.14:1). Figure 10 gives an overview on the gas composition of the output stream in vol.-% (dry) prior to the membrane unit (left) as well as the one after the gas upgrading took place (right). Due to the higher amount of hydrogen injected, and the resulting surplus of hydrogen for the methanation reaction, higher shares of hydrogen remain present in the produced gas streams (e.g., 12.4 and 3.4 vol.-% compared to 1.1 and 0.2 vol.-% for Case 1, all values in vol.-% (dry).
Figure 11 summarises the gas compositions for all relevant gas streams from the simulation of INPUT Case 2. Again, a partial conversion rate of 0.7 was selected. The gas composition from the injected gas stream with 76.1 vol.-% methane increased to 84.3 and 94.6 vol.-% with the geo-methanation as well as the gas upgrading unit at the surface. H2 and CO2 started with 20 and 2.8 vol.-%, and de-creased to 3.8 and 0.2 vol.-% for the final product stream (all values in vol.-% (dry)).

3.2. Techno-Economic Assessment

In this chapter the main results of the TEA, the costs for conversion of H2 and CO2 to geomethane and the total costs for the production of geomethane as well as the comparison to the costs of a SNG production in an Above Ground Methanation, are summarised.

3.2.1. Conversion Costs

The costs for the conversion of H2 and CO2 to geomethane are charged to the customer by the storage operator. The storage operator incurs costs for the construction and operation of the plant. In return, revenues are generated for the storage the carrier gas (which is from a today’s perspective necessary for the USC process) and the storage of the produced geomethane. The difference is the cost for conversion to geomethane, which the storage operator charges to the customer. In Figure 12 the structure of the conversion costs is shown in detail for a 100,000 Nm³/h USC plant for the base and advanced configuration 2025 and 2050. Additionally, for comparison, the conversion costs with an AGM (equivalent SNG output) are shown.
The specific investment costs and OPEX are different for the process configurations base and advance, since they depend on the amount of SNG produced (Note: The absolute investment costs are independent of the process configuration. In base, the specific investment costs are higher than in advance, since the amount of produced gas is comparatively low).
The specific revenues for storage behave similarly. In the base configuration, a large amount of carrier gas is required and stored, and a comparatively small amount of geomethane is produced, making the specific revenues for storage very high. In comparison, in the advance configuration much more geomethane is produced and at the same time less carrier gas is stored, which means that the specific revenues for storage are significantly lower.
In Figure 12, the USC technology is compared to conventional methane production using aboveground catalytic methanation (AGM). Compared to the USC technology, the specific investment costs of an AGM are in the base configuration significantly lower and at a similar level in the advance configuration. In the AGM process, no carrier gas is required, therefore only revenues for the storage of the produced gas are generated, which are very low compared to the storage of carrier gas required for USC process.

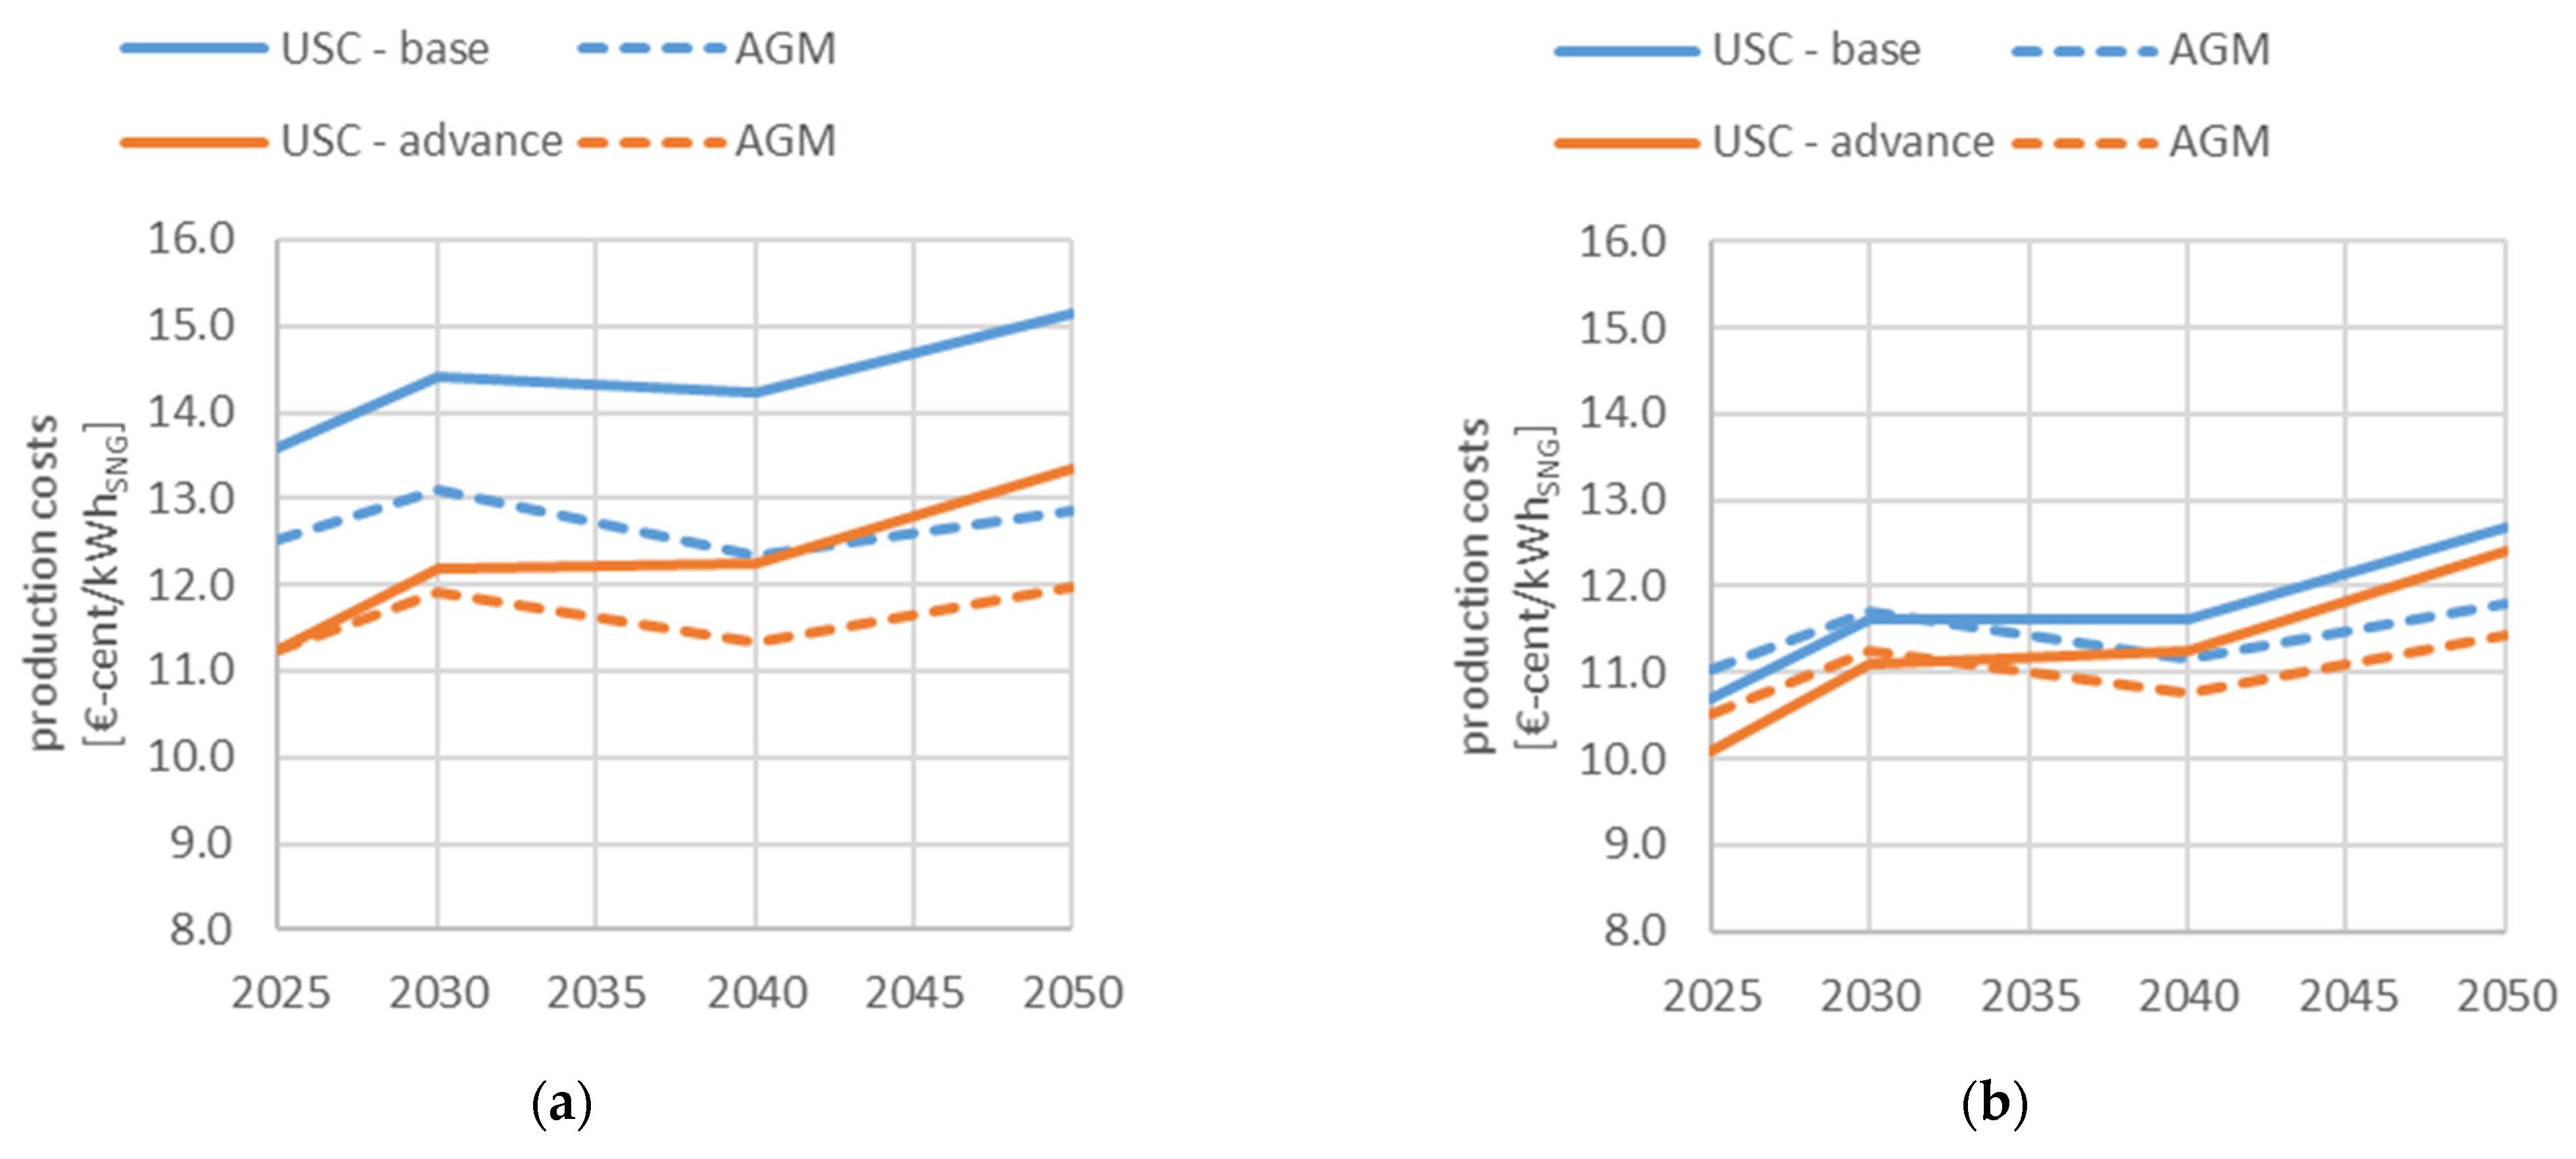
3.2.2. Geomethane Production Costs

The total costs for geomethane production consist of the conversion costs (tariff for conversion, which is charged to the customer by the storage operator) and operational costs for producing the H2 with an electrolyser (electricity, electricity tariffs, water), CO2 from industry and revenues for excess heat (use in district heating or for process heat) and oxygen. In Figure 13 the structure of the production costs is shown in detail for a 100,000 Nm³/h USC plant for the base and advanced configuration 2025 and 2050.
The largest share of the production costs is accounted for electricity, which increases in future, to power the electrolyser to produce H2. Especially in early installations (2025), the tariff for conversion also contributes a significant part to the total cost. Not to be neglected should be the revenues generated by the sale of excess heat and oxygen from the electrolysis process.
In Figure 14 the development of the specific production costs of geomethane for two different plant sizes (injection and withdrawal volume flows of 25,000 and 100,000 Nm³/h) up to the year 2050 are shown, whereby a distinction is also made between the plant configurations base and advance. For comparison, the production costs of SNG produced with a conventional Above Ground Methanation with equivalent SNG capacity are shown.
Both, plant configuration and size have a significant impact on production costs, i.e., the larger the plant or the better the plant configuration (or plant performance) the lower the costs. In general, the production costs of AGM are lower than those of USC. In an advance plant configuration, the production costs of USC and AGM are in a similar range. In the base configuration, the costs of USC are higher than with AGM.
The geomethane production costs are in the range of 10.1–13.6 cent/kWh in 2025 and 12.4–15.2 cent/kWh in 2050. Especially for comparatively large plant with 100,000 Nm³/h, both plant configurations show similar costs. The production costs will remain at a similar level in the future as in 2025 due to the high full load hours of the plant and the rising electricity costs in the future. The high full load hours mean that the share of conversion costs in the total production costs is rather low compared to the share of electricity costs. Therefore, the electricity costs have a higher influence on the total costs. This means that if the share of electricity costs increases more than the share of conversion costs (mainly investment costs) of the plant decreases due to learning curve effects, the production costs will remain the same (or increase slightly) in the future.

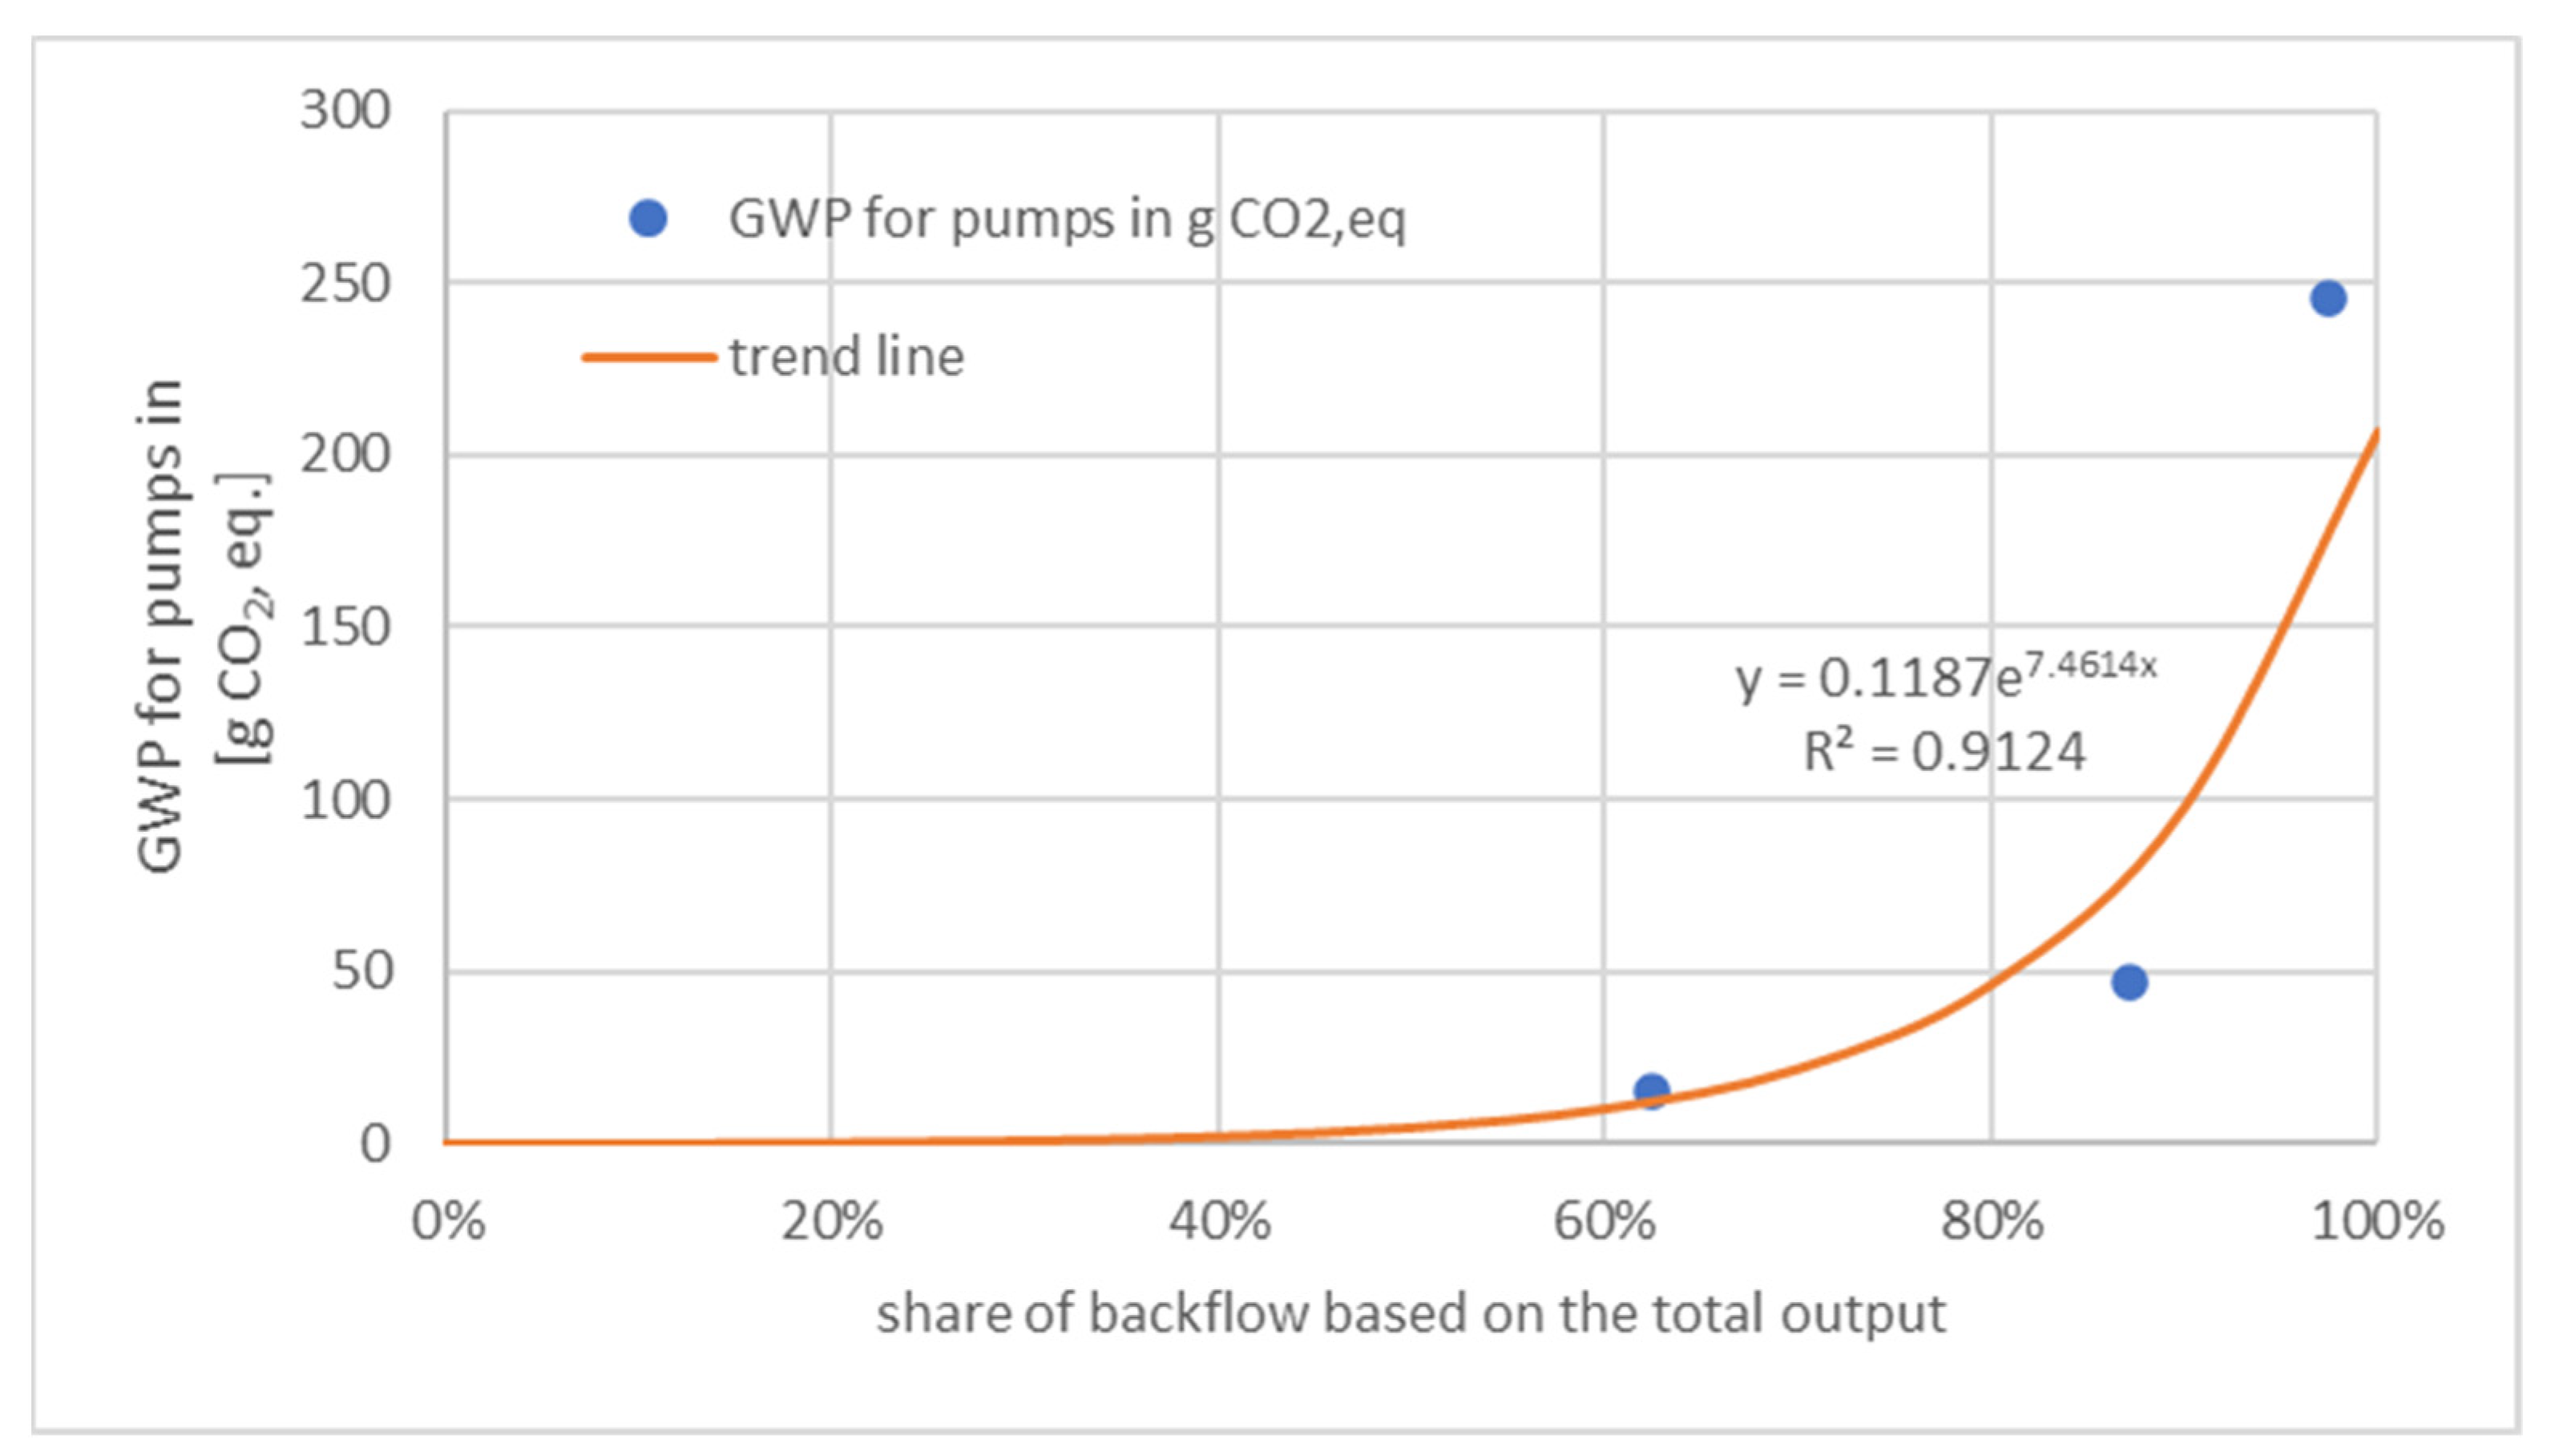
3.3. Greenhouse Gas Assessment

The results for the GWP in Figure 15 clearly show that the electricity needed for compressors are a major contributor to the GWP in case of base case, where the electricity is for compressing the gas is responsible for 56% if AT electricity mix is used for electrolysis up to 77% if wind power is used for hydrogen production. As the GWP impact of electricity used for compressing operations decreases, the significance of electricity used for hydrogen production increases. This is majorly due to increased conversion efficiencies in the underground pore storage and therefore less gas is compressed in the loop (see Figure 7). As expected, renewable power sources are clearly favorable in terms of GWP. The impact of water use and CO2 source are neglectable in terms of GWP of synthetic methane produced applying USC.
Figure 16 shows the comparison of USC Scenarios with relevant benchmark processes regarding their GWP. It is shown that in the advance case using wind power the obtained GWP of 1 MJ synthetic methane has a comparable GWP as upgraded biogas and conventional (above ground) methanation applying CO2 from biogas upgrading and wind power (PtG with biogas CO2 and wind el.). All scenarios of the base and advance case show a significant GHG-saving ranging from approximately 26% up to 90% for the wind power operated advance case.
All benchmark processes refer to a “cradle-to-gate” system boundary, except natural gas for which the GHG emission factor for combustion is considered. This is due to the fact that the “cradle-to-gate” boundary leads to the wrong conclusion as for fossil energy carriers the GHG emissions for their production a comparably low and the majority of GHG emissions occur during the use phase. So, it is common to use the “cradle-to-use” system boundary for fossil fuel comparators [71].

4. Discussion

4.1. Interpretation of Process Simulations and Comparison with Field Experiments

Considering the dry output stream of Case 1, the minimum required value for methane of 96 vol.-% according to ÖVGW G31 [72] can only be met with a high CO2 partial conversion rate of 0.8 and above. The same applies for the other gases in the product stream as the corresponding values for H2 and CO2 stayed below their maximum values. With the updated norm G B210 released in 2021 [73], the new upper limit for H2 of 10 vol.-% can be achieved with every conversion rate simulated. The same applies for CO2 with a maximum value of 2.5 vol.-%. Nevertheless, the specification window including the Wobbe index, the higher heating value as well as the relative density of the gas mixture cannot be met with a conversion rate below 0.8. The integration of a membrane unit would result in the successful upgrading of gas mixtures with conversion rates above 0.2. Such gas streams would meet the specifications of the updated norm G B210 for injection into the Austrian gas grid, respectively the EN 16726 norm for gas infrastructure and gas quality [74].
For Case 2 with an elevated share of hydrogen (20 vol.-% instead of 10 vol.-%), the implementation of one membrane unit for gas upgrading results in a final product stream which does not meet the required specifications of ÖVGW G B210, independent of the downhole conversion rate. Although the thresholds of the individual gas components can be met, all product gas compositions are outside of the specification window. Additional gas treatment or a different gas upgrading system is required, to meet the given specifications of the Austrian gas grid (e.g., catalytic methanation unit on surface [75]).
The simulation results for both cases and operating modes are well aligned with the actual measurements obtained in the field. Conversion throughout the reservoir is heterogenous as the microbes are also not dis-tributed homogenously throughout the reservoir. Additionally, the conversion rates depend on the time the gas remains in the reservoir. Therefore, different conversion rates ranging from 0.1 up to 0.9 were observed for different regions in the gas reservoir.

4.2. Techno-Economic Assessment

As discussed in Böhm et al. (2021) [76], the production of H2 with an electrolyser and (district) heating systems have several synergies, that should be exploited in terms of achieving a high primary energy efficiency and further to increase the macro- and business economic efficiency.
In Figure 17 the economic effect in terms of geomethane production costs with and without the revenue for excess heat for a 100,000 Nm³/h USC plant (advance configuration) and a comparable AGM are shown. If the excess heat from the electrolyser is not used, for example in district heating systems, the production costs will rise about 20%. In case of AGM, the SNG production costs will rise about 30%, since also excess heat form the catalytic methanation is available.
In general, the calculated geomethane production costs are in a similar range compared the other calculations done for the costs for producing of conventional SNG, e.g., [16] or [10]. However, a direct comparison of the geomethane production costs with conventional SNG production costs is not reasonable, because no long-term storage, like it is done in the USC technology, is gas taken into account. Additionally, as shown in Section 3.2.1 and Section 3.2.2, electricity and investment costs, and in particular the future development of these, have a significant influence on SNG production costs. Further, if the value for storing gas increases due to the growing demand for seasonal storage, the gas storage tariff will also rise. This will result in higher revenues for storing the carrier gas, which in turn will reduce the cost of converting H2 and CO2 in the USC process. However, these developments depend very strongly on the future energy and climate policy framework conditions.
Further questions have arisen in the course of this project regarding the relevance of the USC technology from an overall energy system perspective such as the need for seasonal electricity storage and the pricing of this as a system service, the use of CO2 from industrial processes in terms of a carbon cycle economy. These and others will be investigated in the follow-up projects Underground Sun Storage 2030 [77], Carbon Cycle Economy Demonstration [78] and USC FlexStore [79].

4.3. Greenhouse Gas Assessment

From a GHG-perspective two major preconditions have to be fulfilled to achieve a favourable GHG-performance and to maximize GHG-savings compared to fossil counterparts and EU-28 mix based PtG products: (1) renewable electricity sources have to be used for hydrogen production (i.e., wind and solar power); and (2) conversion efficiencies of CO2 and H2 in the geo-methanation process have to be increased significantly, and simultaneously the amount of gas kept in the loop has to be decreased in order to save electricity for compressing.
As the electricity demand for compressing has been identified main driver for the GHG-emissions related to synthetic methane produced in geo-methanation process the impact of the share of backflow (gas kept in the loop) on the total system output has been issue of further investigation. Due to a constant compressor electricity demand in all three cases due to the constant output rate of 1000 Nm³ per h, while due to increasing backflow the overall product gas output is decreasing. As shown in Figure 18, the GWP from the compressors would be neglectable, due to the exponential growth of GWP with increasing backflow rates, if there would be no backflow.
For a future application the aim is to reach low backflow rates, therefore the base and advance case are much more representative for the technology rollout than the demo plant.
A limitation of GHG-assessment results from the “cradle-to-gate” boundary for synthetic methane and the use of industrial CO2 for geo-methanation. Only a temporary CO2 storage is achieved and in case of feeding in the synthetic methane to the gas grid a combustion has to be assumed as use case. Accordingly, the carbon is again released to the atmosphere and does not account to be carbon neutral due to its fossil origin. Therefore, the aim of the USC geo-methanation is to close the carbon cycle so that the amount of CO2 injected to the underground porous storage equals the amount of CO2 released by burning the geo-methane. This concept fit the approach of converting “spent carbon” emissions into “working carbon” emission which leads to reduced carbon emissions in the overall economy as the CO2 is recycled and kept in the loop [80].

4.4. Legal Aspects

4.4.1. Carbon Capture and Utilization

CCU enables CO2 not to be emitted directly, but to shift the emission. Depending on the specific use of the carbon dioxide, a shorter, longer or possibly permanent avoidance of carbon dioxide emissions is made possible. There is no specific comprehensive legal basis for CCU at European level. However, there are provisions in particular in the ETS Directive [81] and the Monitoring and Reporting Regulation (MRR) [82] which are of great importance for CCU applications.
The European emissions trading system (EU ETS) aims to reduce greenhouse gas emissions and applies to emissions from activities listed in Annex I of the ETS Directive and greenhouse gases listed in Annex II of the Directive which include CO2. The source of CO2 plays an important role in the legal assessment, since depending on whether it is fossil or biogenic, certain rules are applied or not. According to Annex I no. 1 ETS Directive installations exclusively using biomass are not covered by this Directive and Annex IV of the ETS Directive and Article 38(2) MRR state that the emission factor of biomass shall be zero. Therefore, no allowances have to be surrendered for emissions from biomass.
Based on the ETS Directive and in particular Article 14(1), the Commission implementing Regulation on the monitoring and reporting of greenhouse gas emissions pursuant to the ETS Directive was adopted (MRR). Together with the Commission implementing Regulation on the verification of data and on the accreditation of verifiers pursuant to the ETS Directive [83] (AVR) they regulate the ETS compliance cycle. Monitoring, Reporting and Verification (MRV) provide traceability and transparency, creating trust in emissions trading and thus ensuring enforcement of the EU ETS [84].
The EU ETS aims at reducing greenhouse gas emissions and it has already been stated that CCU provides the possibility to retain CO2 emissions (depending on the actual deployment pathway for a shorter or longer retention). Thus, whether and if so, to what extent CCU applications are taken into account in the EU ETS, is to be assessed.
As described above Article 2(1) ETS Directive stipulates that the Directive shall apply to emissions from the activities listed in Annex I of the ETS Directive and greenhouse gases listed in Annex II ETS Directive. Article 3(b) ETS Directive defines emissions as ‘the release of greenhouse gases into the atmosphere from sources in an installation or the release from an aircraft performing an aviation activity listed in Annex I of the gases specified in respect of that activity’ [85]. In order to speak of emissions, the release of greenhouse gases into the atmosphere is therefore necessary. The question arises whether allowances have to be surrendered for re-used CO2 and thus not (immediately) emitted CO2.
The ETS regime sets incentives for long-term geological storage (in a under the CCS Directive [86] permitted storage site) by providing exemptions of having to surrender of ETS allowances (cf. Article 12(3a) ETS Directive). With regard to the question of how CCU is handled under the EU ETS regime, the following not only looks at the current status of the legislation, but also presents the previously existing legal situation and the development towards the current legal situation. For CCU, there is no provision in the ETS Directive comparable to that in Article 12(3a) ETS Directive for CCS. However, the MRR also contains provisions on transferred CO2. In an older version of the MRR (EU 601/2012 [87]—no longer in force) Article 49(1) contained the allowance deduction possibility in the case of CCS as defined in the CCS Directive. Subsequently, it was stated that ‘for any other transfer of CO2 out of the installation, no subtraction of CO2 from the installation’s emissions shall be allowed.’ Recital 13 of the MRR 601/2012 stated that transfers of inherent or pure CO2 should, in order to close potential loopholes, only be allowed subject to very specific conditions. It further stated that concerning the transfer of pure CO2 the condition was that it should only occur for the purposes of storage in a geological site pursuant to the Union’s greenhouse gas emission allowance trading scheme. Interestingly, it was also noted in the recital that those conditions should not, nevertheless, exclude the possibility of future innovations. Thus, any deductibility for transferred CO2 beyond the exception referred to above was explicitly excluded. With regard to the production of precipitated calcium carbonate (PCC), MRR 601/2012 contained a specific provision, which enshrined that where CO2 is used in the plant or transferred to another plant for the production of PCC, that amount of CO2 shall be considered emitted by the installation producing the CO2 (cf. Annex IV Section 10. B. MRR 601/2012).
Article 49(1) and Annex IV Section 10 of the MRR 601/2012, more precisely, their validity, was the subject of a preliminary ruling requested by the Administrative Court of Berlin (Verwaltungsgericht, Berlin, Germany). The so-called Schaefer Kalk case (Schaefer Kalk GmbH & Co. KG v Federal Republic of Germany) [88] concerned the refusal to allow Schaefer Kalk GmbH & Co. KG to subtract from the emissions subject to the monitoring obligation the carbon dioxide produced in an installation for the calcination of lime transferred to a precipitated calcium carbonate installation. Schaefer Kalk was of the opinion that CO2 that is transferred to a plant not subject to the EU ETS, where it is used for the production of PCC may be deducted from the emissions reported under its monitoring plan, as this transferred CO2 is chemically bound in the PCC and, due to the lack of release into the atmosphere, does not correspond to emissions within the meaning of the ETS Directive. This dispute ended up before the Berlin Administrative Court, which doubted the validity of the aforementioned provisions and therefore stayed the proceedings and referred the questions for a preliminary ruling to the European Court of Justice. First of all, the Court stated that it follows from the very wording of Article 3(b) of the ETS Directive ‘that, for there to be an emission within the meaning of that provision, a greenhouse gas must be released into the atmosphere’. Furthermore it found that, the MRR is based on the ETS Directive and has to be within its boundaries. The provision in Article 12(3a) of the ETS Directive does not mean that the EU legislator assumed that operators are not obliged to surrender only in the case of permanent geological storage, according to the Court. It stated that it has to be verified whether there is a release of CO2 into the atmosphere. Pursuant to the Court, it is undisputed that the CO2 used for the production of PCC is chemically bound in this stable product. The Court held that Article 49(1), second sentence, and Annex IV, Section 10, Subsection B, of MRR 601/2012 were excessive, and therefore ruled in its judgment of 19 January 2017 that they were ‘invalid in so far as they systematically include the carbon dioxide (CO2) transferred to another installation for the production of precipitated calcium carbonate in the emissions of the lime combustion installation, regardless of whether or not that CO2 is released into the atmosphere.’ [88].
The MRR has been adapted accordingly. The phrase ‘for any other transfer of CO2 out of the installation, no subtraction of CO2 from the installation’s emissions shall be allowed’ in Article 49(1) MRR has been removed. Instead, in addition to the already existing deductibility of emissions relating to CCS, the provision that the operator shall subtract from the emissions of the installation any amount of CO2 originating from fossil carbon in activities covered by Annex I to the ETS Directive that is not emitted from the installation, but transferred out of the installation and used to produce PCC, in which the used CO2 is chemically bound, has been included in Article 49(1)(b) MRR. Furthermore recital 17 of the revised MRR now states that CO2 that is transferred for the production of PCC and chemically bound in it should not be considered as released into the atmosphere. However, beyond this specific case, CCU is not rewarded in a comparable way in the ETS regime. In March 2018 the ETS Directive has been revised [89]. According to recital 14 in the ETS Directive, the main long-term incentive of the ETS Directive for, inter alia, breakthrough innovations in low-carbon technologies and processes, including environmentally safe carbon capture and utilization, is its carbon price signal and the fact that allowances will not need to be surrendered for CO2 emissions that are avoided or permanently stored.
The fact that the phrase ‘for any other transfer of CO2 out of the installation, no subtraction of CO2 from the installation’s emissions shall be allowed’ has been removed entirely and that it is also stated in the recital of the ETS Directive that no allowances are to be surrendered for avoided CO2 emissions as well as the considerations of the court give the impression that not only the one explicitly mentioned case is to benefit from the exemption, but also others that would fulfil the relevant criteria. However, even though CCU can certainly provide a contribution to achieving climate and energy policy goals, a far-reaching exemption from the obligation to surrender certificates is fraught with many (legal and also technical) problems and uncertainties and cannot be implemented so easily without further ado. The question of when CO2 is permanently avoided or ‘permanently bound’ and the associated problem of ‘internal carbon leakage’, which has to be assessed specifically for each case, is only mentioned here as an example [90]. Therefore, and since there is no further explicit mention in the MRR or ETS Directive it has to be assumed that surrendering ETS allowances when using captured CO2 for other purposes (than the one explicitly addressed) is still necessary. For a proper integration of CCU into the ETS regime clear CO2 accounting rules and a life cycle analysis to establish the final CO2 emission reduction effect are required [91].
The Commission announced in the Circular Economy Action Plan that they ‘will explore the development of a regulatory framework for certification of carbon removals based on robust and transparent carbon accounting to monitor and verify the authenticity of carbon removals’ in order to ‘incentivise the uptake of carbon removal and increased circularity of carbon’ [92]. Already anchored in the current legal framework is the Innovation Fund, which aims at bringing low-carbon technologies to the market. The ‘Fit for 55′ package contains proposals for adapting the EU ETS, which also include provisions regarding CCU. It now remains to be seen how the legal framework will develop and which provisions will actually be adopted and in what form.

4.4.2. Certificates for Green Gases

With the amendment of the Renewable Energy Directive (EU) 2018/2001 (RED II), the scope of guarantees of origin (GO) is extended to renewable gases (including hydrogen), creating new possible verification paths. For sector coupling, the design of the guarantees of origins transitions when converting from one form of energy to another (conversion) is of particular relevance. With the RED II, a fundamental change is now emerging. Article 19 of RED II extends the scope of guarantees of origin for gases to biomethane, synthetic gases and hydrogen (cf. recital 59 RED II).
A uniform European system for guarantees of origin must be established. It must be possible to serve demand markets quickly and effectively and without great expense. Producers and suppliers of climate-neutral gases must be able to use the option of indirectly passing on proof of origin and sustainability information to end consumers and thus generate additional value. To this end, a standardised European guarantee of origin system for these gases should be introduced quickly.
Pursuant to Article 15(1) RED I, guarantees of origin for electricity, heating and cooling produced from renewable energy sources were introduced. Now Article 19(1) RED II extends the system of guarantees of origin to other forms of energy from renewable energy sources.
According to Article 19(1) RED II, guarantees of origin are (electronic) documents that serve as proof of the amount or share of renewable energy in the energy mix of an energy supplier vis-à-vis the end customer. According to Article 19(7) RED II, guarantees of origin contain, among other things, at least information on the energy source, the form of energy, namely electricity, gas, heating or cooling. They are also tradable throughout Europe and can be transferred and invalidated independently of the physical delivery of the energy quantity concerned. Article 19 RED II extends this system of guarantees of origin to renewable gases. According to Article 19(7) lit. b ii RED II, guarantees of origin for renewable gases, including hydrogen, shall now also be explicitly possible. This means that, according to recital 59 RED II, the aim is to achieve uniform verification of the origin of gas from renewable energy sources and more intensive cross-border trade in such gas [93].
While guarantees of origin have so far been established primarily in the electricity sector for the purpose of providing transparent and reliable information to consumers in order to exclude double marketing of ecological properties, comprehensive GOs introduced across sectors can potentially pursue more diverse goals. The information provided by a GO can be the basis for statistical purposes, for accelerating the market integration of renewable energies and for steering or incentivising policy measures (for example, meeting quotas). More precisely defined interfaces of GOs to European emissions trading are also necessary. The complexity of a future cross-sectoral verification system poses new challenges for market and regulatory actors. On the other hand, there are far-reaching opportunities in the form of new differentiation and marketing possibilities for suppliers, new sources of income for renewable energy producers and additional verification options for energy consumption in industry, mobility and the building sector. GOs can thus play an important role as an instrument in the operational implementation of the energy transition.
A uniform European system for proof of origin and GHG intensity is the most important prerequisite for cross-border trade in renewable and decarbonised gases.
Another big question is how an ‘electricity guarantee of origin’ can be converted into a ‘gas guarantee of origin’. This means whether and in what form energy conversions are accompanied by corresponding conversions of guarantees of origin which has far-reaching implications for the issuing and use of GOs [94].
For conversion processes, there are no specific regulations in RED II on how to deal with these conversions. More specific regulations are to be made in this regard in the revision process of EN 16325 as to whether and under what conditions a transfer of the green attribute can take place during conversion from one form of energy to another [95].
In any case, it should be avoided that the property ‘renewable energy’ is marketed twice. Double marketing defines the multiple sale of the renewable energy property to different consumers. This could be done by devaluing GOs for energy inputs (e.g., electricity) and issuing ‘conversion’ GOs for energy outputs (e.g., gas). The auxiliary energy input for conversion processes must be taken into account. ‘Conversions GOs’ may be particularly necessary for Power-to-X applications such as the conversion of electricity (grid supply) into hydrogen, liquid fuels and heating or cooling [94].
Other conversion options exist in the conversion of gases and liquid fuels to electricity or in the combustion of gases and liquid fuels for heat and cold generation. Furthermore, GO conversions could occur during the methanation of hydrogen, provided that separate GO systems for hydrogen and other gases are permanently established. In contrast, the initial issuance of GOs in direct conversion, such as wind turbines and electrolysers for the production of hydrogen, only takes place after the conversion process, which means that GO conversion is not necessary [94].
A more difficult question is whether conversion of GO is sufficient to ‘inherit’ the renewable property when energy is purchased from the grid to produce another form of energy, such as electricity purchased from the public grid for use in an electrolyser. In the transport sector, the RED II goals provide for additional requirements as a prerequisite for creditability of the renewable energy property that electricity purchased from the grid must fulfil. The documentation of these requirements currently goes beyond the scope of GOs, since according to Article 19 of RED II they initially only serve to inform consumers. A function with regard to the fulfilment of renewable energy expansion targets is not currently envisaged. In principle, however, it is also possible to expand the purpose of GOs and to impose different requirements on GOs for different verification purposes. For example, one could define which properties a GO must have in order to enable the inheritance of renewable properties through GO conversion when energy is purchased from the grid.
Another problem or challenge is grid and storage losses and how to handle them. So far, losses that occur during intermediate storage and transport of energy are not taken into account when issuing and invalidating GOs. Losses in this case are implicitly covered by untracked energy volumes. As the share of renewable energy generation covered by GO in the energy system increases, a uniform regime for dealing with losses also becomes more important [96].
Expanding the GO system brings issues such as the design of GOs for gases with regard to the qualitative information content as well as corresponding labelling regulations and residual mix calculations, as they are currently common in the electricity sector. Furthermore, it is unclear how the mixing of gases (especially the admixture of hydrogen to biomethane in the gas grid) or the grid and storage losses as well as the interfaces between GOs and existing verification systems, such as sustainability certificates for biomass or mass balancing systems for biomethane, are to be handled. It also needs to be clarified whether the conversion of GO is sufficient to ‘inherit’ the renewable property when energy is drawn from the grid to produce another form of energy, such as electricity drawn from the public grid for use in an electrolyser.
Although the expansion of the scope of GO systems creates additional technical and administrative effort in the short to medium term, new potential uses also arise in the area of environmental accounting for the various actors in the electricity, heat and transport sectors.

5. Conclusions and Outlook

The comparison between the process simulations performed in Aspen Plus® and the experiments in the field revealed high variations in the partial conversion rate for the geo-methanation taking place in the underground gas reservoir. Independent of the achieved conversion rate, a gas upgrading system such as a reverse-selective membrane unit is required for a basic scenario to achieve the specifications of the Austrian gas grid for injection (ÖVGW G B210). For cases with an increased amount of hydrogen to be stored and converted seasonally, the gas upgrading system needs to be extended, as with a single membrane unit the specifications cannot be met (e.g., by implementing a surface catalytic post-methanation).
The techno-economic assessment has shown that the production costs of geo-methane with a USC plant can be, under certain conditions (i.e., advance process configuration or comparatively large plant), similar or lower than the costs of SNG produced with a conventional aboveground methanation plant.
However, it must be taken into account that in order to produce geomethane with a USC plant, according to current knowledge, large quantities of carrier gas are required by the process and must be stored simultaneously with the hydrogen and CO2 used for underground methanation. Therefore, the USC technology is particularly suitable when large quantities of gas have to be stored already. This commonly occurs for reasons of system relevance or supply security. As an additional benefit of this storage process, geomethane can be produced from renewable hydrogen and CO2, thus contributing to the achievement of climate targets.
The greenhouse gas assessment also shows that geomethane produced in a USC plant leads to greenhouse gas savings compared to fossil natural gas and synthetic natural gas produced by using H2 from electrolysis driven by an EU28 electricity grid mix. Applying renewable electricity and aiming at a low backflow rate in order to reduce needed compressing capacity are prerequisites to achieve a favourable GHG-performance.
While the ETS regime sets incentives for CCS by providing exemptions of having to surrender of ETS allowances, CCU is not equally incentivised. Except for the possibility of deduction from the plant’s emissions for transferred CO2 used to produce precipitated calcium carbonate, CCU is not rewarded in a comparable way in the ETS regime. It must be noted, however, that a far-reaching exemption from the obligation to surrender certificates would be fraught with many legal and technical problems and uncertainties. In any case, clear CO2 accounting rules and a life cycle analysis are required for a proper integration of CCU into the ETS regime.
In the field of green gas certification, there is no uniform European classification (terminology) for climate-neutral gases throughout the EU. The introduction of a uniform European system for guarantees of origin for gases is necessary. Nevertheless. there are, of course, also some challenges in expanding the GO system; for example, if it is extended to other forms of energy. However, additional issues exist concerning the design of GOs for gases with regard to the quality or furthermore, how the mixing of gases (admixture of hydrogen to biomethane) is to be handled when feeding-in to the gas grid. It also needs to be clarified whether the conversion of GO is sufficient to ‘inherit’ the renewable property when energy is drawn from the grid to produce another form of energy.
Uniform green gas certification within Europe is necessary, but certainly brings some challenges.

Author Contributions

Conceptualization, A.Z.; methodology, A.Z., K.F.-F., P.W.-Z., A.V. and M.-T.H.; validation, A.Z., K.F.-F., P.W.-Z., A.V. and M.-T.H., M.L., S.B. and M.P.; formal analysis, A.Z., K.F.-F., P.W.-Z., A.V. and M.-T.H.; investigation, A.Z., K.F.-F., P.W.-Z., A.V. and M.-T.H.; writing—original draft preparation, A.Z., K.F.-F., P.W.-Z., A.V., M.-T.H.; writing—review and editing, A.Z., K.F.-F., P.W.-Z., A.V., M.-T.H., M.L., S.B. and M.P.; supervision, A.Z. All authors have read and agreed to the published version of the manuscript.

Funding

This research was funded by the Austrian Research Promotion Agency (FFG), grant number 855231.

Institutional Review Board Statement

Not applicable.

Informed Consent Statement

Not applicable.

Data Availability Statement

Not applicable.

Acknowledgments

The work performed in this article was conducted as part of the research project “Underground Sun Conversion (USC)”, funded by the FFG and including the following partners: RAG Austria AG, Chair of Process Technology and Industrial Environmental Protection as well as Chair of General and Analytical Chemistry at Montanuniversität Leoben, Department of Agrobiotechnology at IFA-Tulln, acib the Austrian Centre of Industrial Biotechnology, Energieinstitut at Johannes Kepler Universität Linz, and AXIOM Angewandte Prozesstechnik Ges.m.b.H. The authors would also like to acknowledge the work of Hanna Weiss during her Bachelor thesis and Daniel C. Rosenfeld for his work in the field of LCA in the project during his employment at the Energieinstitut at Johannes Kepler Universität Linz.

Conflicts of Interest

The authors declare no conflict of interest. This paper reflects only the author’s view, and the founding sponsors had no role in the design of the study, in the collection, analyses, or interpretation of data, in the writing of the manuscript, and in the decision to publish the results.

References and Note

  1. Regulation (EU) 2021/1119 of THE European Parliament and of the Council of 30 June 2021 Establishing the Framework for Achieving Climate Neutrality and Amending Regulations (EC) No 401/2009 and (EU) 2018/1999 (‘European Climate Law’) OJ 2021 L 243/1. Available online: https://eur-lex.europa.eu/legal-content/EN/TXT/?uri=celex%3A32021R1119 (accessed on 8 November 2021).
  2. Gabrielli, P.; Gazzani, M.; Mazzotti, M. The Role of Carbon Capture and Utilization, Carbon Capture and Storage, and Biomass to Enable a Net-Zero-CO2 Emissions Chemical Industry. Ind. Eng. Chem. Res. 2020, 59, 7033–7045. [Google Scholar] [CrossRef] [Green Version]
  3. Papadis, E.; Tsatsaronis, G. Challenges in the decarbonization of the energy sector. Energy 2020, 205, 118025. [Google Scholar] [CrossRef]
  4. Rissman, J.; Bataille, C.; Masanet, E.; Aden, N.; Morrow, W.R.; Zhou, N.; Elliott, N.; Dell, R.; Heeren, N.; Huckestein, B.; et al. Technologies and policies to decarbonize global industry: Review and assessment of mitigation drivers through 2070. Appl. Energy 2020, 266, 114848. [Google Scholar] [CrossRef]
  5. Markewitz, P.; Kuckshinrichs, W.; Leitner, W.; Linssen, J.; Zapp, P.; Bongartz, R.; Schreiber, A.; Müller, T.E. Worldwide innovations in the development of carbon capture technologies and the utilization of CO2. Energy Environ. Sci. 2012, 5, 7281–7305. [Google Scholar] [CrossRef] [Green Version]
  6. IEA. Energy Technology Perspectives 2020-Special Report on Carbon Capture Utilisation and Storage; IEA: Paris, France, 2020. [Google Scholar]
  7. Patricio, J.; Angelis-Dimakis, A.; Castillo-Castillo, A.; Kalmykova, Y.; Rosado, L. Method to identify opportunities for CCU at regional level—Matching sources and receivers. J. CO2 Util. 2017, 22, 330–345. [Google Scholar] [CrossRef]
  8. Farfan, J.; Fasihi, M.; Breyer, C. Trends in the global cement industry and opportunities for long-term sustainable CCU potential for Power-to-X. J. Clean. Prod. 2019, 217, 821–835. [Google Scholar] [CrossRef]
  9. Do, T.N.; You, C.; Kim, J. A CO2 utilization framework for liquid fuels and chemical production: Techno-economic and environmental analysis. Energy Environ. Sci. 2022, 15, 169. [Google Scholar] [CrossRef]
  10. Götz, M.; Lefebvre, J.; Mörs, F.; McDaniel Koch, A.; Graf, F.; Bajohr, S.; Reimert, R.; Kolb, T. Renewable Power-to-Gas: A technological and economic review. Renew. Energy 2016, 85, 1371–1390. [Google Scholar] [CrossRef] [Green Version]
  11. Ghaib, K.; Ben-Fares, F.-Z. Power-to-Methane: A state-of-the-art review. Renew. Sustain. Energy Rev. 2018, 81, 433–446. [Google Scholar] [CrossRef]
  12. Romeo, L.M.; Bailera, M. Design configurations to achieve an effective CO2 use and mitigation through power to gas. J. CO2 Util. 2020, 39, 101174. [Google Scholar] [CrossRef]
  13. Schildhauer, T.J.; Calbry-Muzyka, A.; Witte, J.; Biollaz, S.; Jansohn, P. Producing Renewable Methane–Demonstration of CCU from Biomass. In Proceedings of the 14th Greenhouse Gas Control Technologies Conference, Melbourne, Australia, 21–26 October 2018. [Google Scholar] [CrossRef]
  14. Chwoła, T.; Spietz, T.; Więcław-Solny, L.; Tatarczuk, A.; Krótki, A.; Dobras, S.; Wilk, A.; Tchórz, J.; Stec, M.; Zdeb, J. Pilot plant initial results for the methanation process using CO2 from amine scrubbing at the Łaziska power plant in Poland. Fuel 2020, 263, 116804. [Google Scholar] [CrossRef]
  15. Meylan, F.D.; Piguet, F.-P.; Erkman, S. Power-to-gas through CO2 methanation: Assessment of the carbon balance regarding EU directives. J. Energy Storage 2017, 11, 16–24. [Google Scholar] [CrossRef]
  16. Szima, S.; Cormos, C.-C. CO2 Utilization Technologies: A Techno-Economic Analysis for Synthetic Natural Gas Production. Energies 2021, 14, 1258. [Google Scholar] [CrossRef]
  17. Wolf-Zoellner, P.; Medved, A.R.; Lehner, M.; Kieberger, N.; Rechberger, K. In Situ Catalytic Methanation of Real Steelworks Gases. Energies 2021, 14, 8131. [Google Scholar] [CrossRef]
  18. Thema, M.; Weidlich, T.; Hörl, M.; Bellack, A.; Mörs, F.; Hackl, F.; Kohlmayer, M.; Gleich, J.; Stabenau, C.; Trabold, T.; et al. Biological CO2-Methanation: An Approach to Standardization. Energies 2019, 12, 1670. [Google Scholar] [CrossRef] [Green Version]
  19. Guilera, J.; Filipe, M.; Montesó, A.; Mallol, I.; Andreu, T. Carbon footprint of synthetic natural gas through biogas catalytic methanation. J. Clean. Prod. 2021, 287, 125020. [Google Scholar] [CrossRef]
  20. Bargiacchi, E.; Thonemann, N.; Geldermann, J.; Antonelli, M.; Desideri, U. Life Cycle Assessment of Synthetic Natural Gas Production from Different CO2 Sources: A Cradle-to-Gate Study. Energies 2020, 13, 4579. [Google Scholar] [CrossRef]
  21. Centi, G.; Perathoner, S.; Salladini, A.; Iaquaniello, G. Economics of CO2 Utilization: A Critical Analysis. Front. Energy Res. 2020, 8, 241. [Google Scholar] [CrossRef]
  22. Regufe, M.; Pereira, A.; Ferreira, A.; Ribeiro, A.; Rodrigues, A. Current Developments of Carbon Capture Storage and/or Utilization–Looking for Net-Zero Emissions Defined in the Paris Agreement. Energies 2021, 14, 2406. [Google Scholar] [CrossRef]
  23. Lankof, L.; Tarkowski, R. Assessment of the potential for underground hydrogen storage in bedded salt formation. Int. J. Hydrogen Energy 2020, 45, 19479–19492. [Google Scholar] [CrossRef]
  24. Lemieux, A.; Shkarupin, A.; Sharp, K. Geologic feasibility of underground hydrogen storage in Canada. Int. J. Hydrogen Energy 2020, 45, 32243–32259. [Google Scholar] [CrossRef]
  25. Tarkowski, R. Underground hydrogen storage: Characteristics and prospects. Renew. Sustain. Energy Rev. 2019, 105, 86–94. [Google Scholar] [CrossRef]
  26. Gabrielli, P.; Poluzzi, A.; Kramer, G.J.; Spiers, C.; Mazzotti, M.; Gazzani, M. Seasonal energy storage for zero-emissions multi-energy systems via underground hydrogen storage. Renew. Sustain. Energy Rev. 2020, 121, 109629. [Google Scholar] [CrossRef]
  27. Dopffel, N.; Jansen, S.; Gerritse, J. Microbial side effects of underground hydrogen storage–Knowledge gaps, risks and opportunities for successful implementation. Int. J. Hydrogen Energy 2021, 46, 8594–8606. [Google Scholar] [CrossRef]
  28. TNO. Large-Scale Energy Storage in Salt Caverns and Depleted Fields (LSES)–Project Findings, 2020th ed.; TNO: The Hague, The Netherlands, 2020. [Google Scholar]
  29. Jukić, L.; Vulin, D.; Kružić, V.; Arnaut, M. Carbon-Negative Scenarios in High CO2 Gas Condensate Reservoirs. Energies 2021, 14, 5898. [Google Scholar] [CrossRef]
  30. Strobel, G.; Hagemann, B.; Huppertz, T.M.; Ganzer, L. Underground bio-methanation: Concept and potential. Renew. Sustain. Energy Rev. 2020, 123, 109747. [Google Scholar] [CrossRef]
  31. Iordache, I.; Schitea, D.; Gheorghe, A.V.; Iordache, M. Hydrogen underground storage in Romania, potential directions of development, stakeholders and general aspects. Int. J. Hydrogen Energy 2014, 39, 11071–11081. [Google Scholar] [CrossRef]
  32. Le Duigou, A.; Bader, A.-G.; Lanoix, J.-C.; Nadau, L. Relevance and costs of large scale underground hydrogen storage in France. Int. J. Hydrogen Energy 2017, 42, 22987–23003. [Google Scholar] [CrossRef]
  33. Bünger, U.; Michalski, J.; Crotogino, F.; Kruck, O. Large-scale underground storage of hydrogen for the grid integration of renewable energy and other applications. Compend. Hydrogen Energy 2016, 4, 133–163. [Google Scholar] [CrossRef]
  34. Zivar, D.; Kumar, S.; Foroozesh, J. Underground hydrogen storage: A comprehensive review. Int. J. Hydrogen Energy 2020, 46, 23436–23462. [Google Scholar] [CrossRef]
  35. Amid, A.; Mignard, D.; Wilkinson, M. Seasonal storage of hydrogen in a depleted natural gas reservoir. Int. J. Hydrogen Energy 2016, 41, 5549–5558. [Google Scholar] [CrossRef] [Green Version]
  36. Matos, C.R.; Carneiro, J.F.; Silva, P.P. Overview of Large-Scale Underground Energy Storage Technologies for Integration of Renewable Energies and Criteria for Reservoir Identification. J. Energy Storage 2019, 21, 241–258. [Google Scholar] [CrossRef]
  37. Tschiggerl, K.; Sledz, C.; Topic, M. Considering environmental impacts of energy storage technologies: A life cycle assessment of power-to-gas business models. Energy 2018, 160, 1091–1100. [Google Scholar] [CrossRef]
  38. Perez, A.; Pérez, E.; Dupraz, S.; Bolcich, J. Patagonia Wind-Hydrogen Project: Underground Storage and Methanation. In Proceedings of the 21st World Hydrogen Energy Conference 2016, Zaragoza, Spain, 13–16 June 2016. [Google Scholar]
  39. RAG Austria AG. Underground.Sun.Storage. Available online: https://www.underground-sun-storage.at/ (accessed on 15 November 2021).
  40. RAG Austria AG. Underground Sun Conversion. Available online: https://www.underground-sun-conversion.at (accessed on 9 November 2021).
  41. Sabatier, P.; Senderens, J.B.; Acad, C.R. New methane synthesis. Compt. Rend. Acad. Sci. 1902, 134, 514–516. [Google Scholar]
  42. Zimmermann, A.; Berlin, T.U.; Wunderlich, J.; Buchner, G.; Müller, L.; Armstrong, K.; Michailos, S.; Marxen, A.; Naims, H.; Mason, F.; et al. Techno-Economic Assessment & Life-Cycle Assessment Guidelines for CO2 Utilization; CO2Chem Media and Publishing Ltd.: Sheffield, UK, 2018. [Google Scholar] [CrossRef]
  43. Böhm, H.; Goers, S.; Zauner, A. Estimating future costs of power-to-gas–A component-based approach for technological learning. Int. J. Hydrogen Energy 2019, 44, 30789–30805. [Google Scholar] [CrossRef]
  44. Böhm, H.; Zauner, A.; Rosenfeld, D.C.; Tichler, R. Projecting cost development for future large-scale power-to-gas implementations by scaling effects. Appl. Energy 2020, 264, 114780. [Google Scholar] [CrossRef] [Green Version]
  45. Agora Energiewende; Aurora Energy Research. In 65 Prozent Erneuerbare bis 2030 und ein Schrittweiser Kohleausstieg: Auswirkungen der Vorgaben des Koalitionsvertrags auf Strompreise, CO2-Emissionen und Stromhandel. 2018. Available online: https://static.agora-energiewende.de/fileadmin/Projekte/2018/65_EE_und_Kohleausstieg/142_Stromsektor-2030_65-Prozent-EE-und-schrittweiser-Kohleausstieg_WEB.pdf (accessed on 17 November 2021).
  46. Greimel, F.; Neubarth, J.; Fuhrmann, M.; Führer, S.; Habersack, H.; Haslauer, M.; Hauer, C.; Holzapfel, P.; Auer, S.; Pfleger, M.; et al. SuREmMA: Sustainable River Management-Energiewirtschaftliche und Umweltrelevante Bewertung Möglicher Schwalldämpfender Massnahmen; Federal Ministry for Agriculture and Forestry, Environment and Water Management: Vienna, Austria, 2017.
  47. Energy Brainpool GmbH & Co. KG. Update: Trends der Strompreisentwicklung-EU Energy Outlook 2050. Available online: https://blog.energybrainpool.com/update-trends-der-strompreisentwicklung-eu-energy-outlook-2050/ (accessed on 29 November 2018).
  48. Deloitte. Strommarktstudie 2030-Ein Neuer Ausblick für Die Energiewirtschaft; Deloitte. 2018. Available online: https://www2.deloitte.com/content/dam/Deloitte/de/Documents/energy-resources/Deloitte-Strommarktstudie-2030.pdf (accessed on 19 November 2021).
  49. Haas, R.; Resch, G.; Burgholzer, B.; Totschnig, G.; Lettner, G.; Auer, H.; Geipel, J. Stromzukunft Österreich 2030-Analyse der Erfordernisse und Konsequenzen Eines Ambitionierten Ausbaus Erneuerbarer Energien; IG Windkraft, Kompost & Biogas Verband Österreich, IG-Holzkraft: Wien, Austria, 2017. [Google Scholar]
  50. Öko-Institut e.V. Strompreis- und Stromkosteneffekte Eines Geordneten Ausstiegs aus der Kohleverstromung; Öko-Institut e.V.: Berlin, Germany, 2019. [Google Scholar]
  51. FH Erfurt. Strommarkt 2050-Analyse Möglicher Szenarien der Entwicklung des Deutschen und Mitteleuropäischen Strommarktes bis zum Jahr 2050; FH Erfurt: Erfurt, Germany, 2018. [Google Scholar]
  52. Frontier Economics. Economic Trends Resarch, Georg Consulting, Visionometrics. Folgenabschätzung des CO2-Sektorziels Für Die Energiewirtschaft im Klimaschutzplan 2050: Studie im Auftrag der RWE AG. 2018. Available online: https://www.frontier-economics.com/media/2263/frontier-et-al-folgenabschatzung-ksp2050-endbericht-2.pdf (accessed on 19 November 2021).
  53. ISO 14044; Umweltmanagement-Ökobilanz. Anforderungen und Anleitungen. Deutsches Institut für Normung, 2006. Available online: https://www.beuth.de/de/norm/din-en-iso-14044/279938986 (accessed on 19 November 2021).
  54. Klöpffer, W.; Grahl, B. Ökobilanz (LCA): Ein Leitfaden für Ausbildung und Beruf; WILEY-VCH: Weinheim, Germany, 2009. [Google Scholar]
  55. Klöpffer, W. Life Cycle Assessment. From the Beginning to the Current State. Environ. Sci. Pollut. Res. 1997, 4, 223–228. [Google Scholar] [CrossRef]
  56. Guinée, J.; De Haes, H.U.; Huppes, G. Quantitative life cycle assessment of products: 1:Goal definition and inventory. J. Clean. Prod. 1993, 1, 3–13. [Google Scholar] [CrossRef]
  57. Rebitzer, G.; Ekvall, T.; Frischknecht, R.; Hunkeler, D.; Norris, G.; Rydberg, T.; Schmidtg, W.-P.; Suh, S.; Weidemai, B.P.; Pennington, D.W. Life cycle assessment. Part1: Framework, goal, scope, definition, inventory analysis, and applications. Environ. Int. 2004, 30, 701–720. [Google Scholar] [CrossRef]
  58. Reap, J.; Roman, F.; Duncan, S.; Bras, B. A survey of unresolved problems in life cycle assessment. Int. J. Life Cycle Assess. 2008, 4, 374. [Google Scholar] [CrossRef]
  59. Finnveden, G.; Hauschild, M.Z.; Ekvall, T.; Guinée, J.; Heijungs, R.; Hellweg, S.; Koehler, A.; Pennington, D.; Suh, S. Recent developments in life cycle assessment. J. Environ. Manag. 2009, 91, 1–21. [Google Scholar] [CrossRef]
  60. Lotrič, A.; Sekavčnik, M.; Kuštrin, I.; Mori, M. Life-cycle assessment of hydrogen technologies with the focus on EU critical raw materials and end-of-life strategies. Int. J. Hydrogen Energy 2021, 46, 10143–10160. [Google Scholar] [CrossRef]
  61. Schreiber, A.; Peschel, A.; Hentschel, B.; Zapp, P. Life Cycle Assessment of Power-to-Syngas: Comparing High Temperature Co-Electrolysis and Steam Methane Reforming. Front. Energy Res. 2020, 8, 287. [Google Scholar] [CrossRef]
  62. Zhang, X.; Bauer, C.; Mutel, C.L.; Volkart, K. Life Cycle Assessment of Power-to-Gas: Approaches, system variations and their environmental implications. Appl. Energy 2017, 190, 326–338. [Google Scholar] [CrossRef]
  63. Ivanov, O.L.; Honfi, D.; Santandrea, F.; Stripple, H. Consideration of uncertainties in LCA for infrastructure using probabilistic methods. Struct. Infrastruct. Eng. 2019, 15, 711–724. [Google Scholar] [CrossRef] [Green Version]
  64. Bareiß, K.; de la Rúa, C.; Möckl, M.; Hamacher, T. Life cycle assessment of hydrogen from proton exchange membrane water electrolysis in future energy systems. Appl. Energy 2019, 237, 862–872. [Google Scholar] [CrossRef]
  65. Unternehmensberatung Babel. Realgasfaktoren für Wasserstoff. Available online: http://www.unternehmensberatung-babel.de/industriegase-lexikon/industriegase-lexikon-n-bis-z/realgasfaktor/realgasfaktoren-wasserstoff.html (accessed on 29 January 2021).
  66. Engineering Units. Determine Compressability Factor, Z Factor. Available online: http://engineeringunits.com/compressibility-factor-z-factor/ (accessed on 29 January 2021).
  67. Bauer, S. Underground Sun Conversion Final Report; Rag Austria AG: Vienna, Austria, 2021. [Google Scholar]
  68. Zhang, X.; Witte, J.; Schildhauer, T.; Bauer, C. Life cycle assessment of power-to-gas with biogas as the carbon source. Sustain. Energy Fuels 2020, 4, 1427–1436. [Google Scholar] [CrossRef]
  69. Juhrich, K. CO2-Emissionsfaktoren für Fossile Brennstoffe; Umweltbundesamt: Dessau-Roßlau, Germany, 2016.
  70. Reiter, G.; Lindorfer, J. Global warming potential of hydrogen and methane production from renewable electricity via power-to-gas technology. Int. J. Life Cycle Assess. 2015, 20, 477–489. [Google Scholar] [CrossRef]
  71. Zhou, Y.; Swidler, D.; Searle, S.; Baldino, C. Life-Cycle Greenhouse Gas Emissions of Biomethane and Hydrogen Pathways in the European Union; White Paper; International Council on Clean Transportation: Berlin, Germany, 2021. [Google Scholar]
  72. Österreichische Vereinigung für das Gas-und Wasserfach. Erdgas in Österreich—Gasbeschaffenheit Richtlinie G31; Österreichische Vereinigung für das Gas-und Wasserfach: Vienna, Austria, 2001. [Google Scholar]
  73. Österreichische Vereinigung für das Gas-und Wasserfach. Erdgas in Österreich—Gasbeschaffenheit Richtlinie G B210; Österreichische Vereinigung für das Gas-und Wasserfach: Vienna, Austria, 2021. [Google Scholar]
  74. European Standard EN 16726:2015+A1:2018 (E); Gas Infrastructure—Quality of Gas—Group H. Europoean Committee for Standardization: Brussels, Belgium, 2018.
  75. Biegger, P.; Kirchbacher, F.; Medved, A.R.; Miltner, M.; Lehner, M.; Harasek, M. Development of Honeycomb Methanation Catalyst and Its Application in Power to Gas Systems. Energies 2018, 11, 1679. [Google Scholar] [CrossRef] [Green Version]
  76. Böhm, H.; Moser, S.; Puschnigg, S.; Zauner, A. Power-to-hydrogen & district heating: Technology-based and infrastructure-oriented analysis of (future) sector coupling potentials. Int. J. Hydrogen Energy 2021, 46, 31938–31951. [Google Scholar] [CrossRef]
  77. RAG Austria AG. Underground Sun Storage 2030. Available online: https://www.uss-2030.at/ (accessed on 16 November 2021).
  78. RAG Austria AG. Carbon Cycle Economy Demonstration. Available online: https://www.rag-austria.at/forschung-innovation/carbon-cycle-economy-demonstration.html (accessed on 16 November 2021).
  79. RAG Austria AG. USC FlexStore. Available online: https://www.eranet-smartenergysystems.eu/global/images/cms/Content/Fact%20Sheets/ERANetSES_FactSheet_JC19_USC-FlexStore.pdf (accessed on 15 November 2021).
  80. Rodin, V.; Lindorfer, J.; Böhm, H.; Vieira, L. Assessing the potential of carbon dioxide valorisation in Europe with focus on biogenic CO2. J. CO2 Util. 2020, 41, 101219. [Google Scholar] [CrossRef]
  81. Directive 2003/87/EC of the European Parliament and of the Council of 13 October 2003 Establishing a System for Greenhouse Gas Emission Allowance Trading within the Union and Amending Council Directive 96/61/EC, OJ 2003 L 275/32. Commission Delegated Regulation (EU) 2021/1416, OJ 2021 L 305/1. Available online: https://eur-lex.europa.eu/legal-content/EN/ALL/?uri=CELEX%3A32003L0087 (accessed on 15 November 2021).
  82. Commission Implementing Regulation (EU) 2018/2066 of 19 December 2018 on the Monitoring and Reporting of Greenhouse Gas Emissions Pursuant to Directive 2003/87/EC of the European Parliament and of the Council and Amending Commission Regulation (EU) No 601/2012, OJ 2018 L 334/1. Commission Implementing Regulation (EU) 2020/2085, OJ 2020 L 423/37. Available online: https://eur-lex.europa.eu/legal-content/EN/TXT/?uri=uriserv:OJ.L_.2018.334.01.0001.01.ENG (accessed on 15 November 2021).
  83. Commission Implementing Regulation (EU) 2018/2067 of 19 December 2018 on the Verification of Data and on the Accreditation of Verifiers Pursuant to Directive 2003/87/EC of the European Parliament and of the Council, OJ 2018 L 334/94. Available online: https://eur-lex.europa.eu/legal-content/EN/TXT/?uri=CELEX%3A32018R2067 (accessed on 15 November 2021).
  84. European Commission. EU ETS Handbook; European Commission: Brussels, Belgium, 2015. [Google Scholar]
  85. An Installation Is According to Article 3(e) ETS Directive ‘A Stationary Technical Unit Where one or more Activities Listed in Annex I are Carried Out and any other Directly Associated Activities Which Have a Technical Connection with the Activities Carried Out on That Site and Which Could Have an Effect on Emissions and Pollution’.
  86. Directive 2009/31/EC of the European Parliament and of the Council of 23 April 2009 on the Geological Storage of Carbon Dioxide and Amending Council Directive 85/337/EEC, European Parliament and Council Directives 2000/60/EC, 2001/80/EC, 2004/35/EC, 2006/12/EC, 2008/1/EC and Regulation (EC) No 1013/2006 OJ 2009 L 140/114. Regulation (EU) 2018/1999 of the European Parliament and of the Council, OJ 2018 L 328/1. Available online: https://eur-lex.europa.eu/legal-content/EN/TXT/?uri=celex%3A32009L0031 (accessed on 15 November 2021).
  87. Commission Regulation (EU) No 601/2012 of 21 June 2012 on the Monitoring and Reporting of Greenhouse Gas Emissions Pursuant to Directive 2003/87/EC of the European Parliament and of the Council, OJ 2012 L 181/30. Available online: https://eur-lex.europa.eu/legal-content/EN/ALL/?uri=CELEX%3A32012R0601 (accessed on 15 November 2021).
  88. ECJ 19.01.2017 C 460/15; ECLI:EU:C:2017:29; Judgment of the Court (First Chamber) of 19 January 2017. Schaefer Kalk GmbH & Co. KG: Verbandsgemeinde Diez, Germany, 2017.
  89. Directive (EU) 2018/410 of the European Parliament and of the Council of 14.03.2018 Amending Directive 2003/87/EC to Enhance Cost-Effective Emission Reductions and Low-Carbon Investments, and Decision (EU) 2015/1814, OJ 2018 L 76/3. Available online: https://eur-lex.europa.eu/legal-content/DE/TXT/?uri=CELEX%3A32018L0410 (accessed on 15 November 2021).
  90. Porteron, S.; de Bruijne, E.; Le Den, X.; Zotz, F.; Olfe-Kräutlein, B.; Marxen, A. Identification and Analysis of Promising Carbon Capture and Utilisation Technologies, Including Their Regulatory Aspects; European Commission: Brussels, Belgium, 2019. [Google Scholar]
  91. IOGP. The Potential for CCS and CCU in Europe; IOGP: Madrid, Spain, 2019. [Google Scholar]
  92. European Commission. Circular Economy Action Plan; European Commission: Brussels, Belgium, 2020. [Google Scholar]
  93. Castro, J.; Landspersky, M.; Nürnberger, K.; Schmidt, P.; Weindorf, W.; Kalis, M.; Yilmaz, Y. Ad hoc Beratung bei der Umsetzung der Monitoring Verordnung für Die 4. Phase des EU Emissionshandels; Umweltbundesamt: Dessau-Roßlau, Deutschland, 2020.
  94. Purkus, A.; Sakhel, A.; Werner, R.; Maaß, C. Herkunftsnachweise für Erneuerbare Energien Jenseits des Stromsetors, Chancen und Herausforderungen; HIR Hamburg Institut Research: Hamburg, Germany, 2020. [Google Scholar]
  95. Verwimp, K.; Moody, P.; Van Stein Callenfels, R.; Kovacs, A.; Vanhoudt, W.; Barth, F.; Pedraza, S.; Lehtovaara, M.; Klimscheffskij, M.; White, A. Identification of the Main Challenges Which Currently Exist in the Management of Guarantee of Origin System (Task 1.3). In Technical Support for RES Policy Development and Implementation; European Commission: Brussels, Belgium, 2020. [Google Scholar]
  96. Cornélis/Lenzen. Guarantees of Origin and Disclosure. Core Theme 3 Report; (Horizon 2020 Project, Grant Agreement N°101035887); Concerted Action-Renewable Energy Sources Directive. 2020. Available online: https://www.ca-res.eu/fileadmin/cares/PublicArea/CA-RES3FinalPublication/CARES3_Final_CT3_Summary.pdf (accessed on 17 November 2021).
Figure 1. Simplified version of Aspen Plus® flowsheet for BATCH mode.
Energies 15 01021 g001
Figure 2. Simplified version of Aspen Plus® flowsheet for CYCLE mode.
Energies 15 01021 g002
Figure 3. Overview diagram of the use case CCU.
Energies 15 01021 g003
Figure 4. Gas composition (proportion of CH4, H2 and CO2) during injection and withdrawal.
Energies 15 01021 g004
Figure 5. Specific investment costs of USC plants related to the process configuration (base and advance) and year of installation and additionally the costs for an Above Ground (catalytic) Methanation (AGM) with comparable SNG production. (A plant with a nominal volume flow of 100,000 Nm³/h is given as a reference. The upper value of the error indicator indicates the costs for a 25,000 Nm³/h plant).
Energies 15 01021 g005
Figure 6. System boundary for the LCA of the Underground Sun Conversion process using the example of the advance scenario.
Energies 15 01021 g006
Figure 7. Gas composition (proportion of CH4, H2 and CO2) during injection and withdrawal.
Energies 15 01021 g007
Figure 8. Gas composition of dry gas stream after water separation (left), and of product gas stream (right); all values in vol.-% (dry) for INPUT Case 1 (10% H2 and 2.5% CO2).
Energies 15 01021 g008
Figure 9. Gas composition per gas stream; all values in vol.-% (dry) for INPUT Case 1 (10% H2 and 2.5% CO2).
Energies 15 01021 g009
Figure 10. Gas composition of dry gas stream after water separation (left), and gas composition of product gas stream (right); all values in vol.-% (dry) for INPUT Case 2 (20% H2 and 2.8% CO2).
Energies 15 01021 g010
Figure 11. Gas composition per gas stream; all values in vol.-% (dry) for INPUT Case 2 (20% H2 and 2.8% CO2).
Energies 15 01021 g011
Figure 12. Cost for conversion for a 100,000 Nm³/h USC plant and a comparable AGM.
Energies 15 01021 g012
Figure 13. Geomethane production costs with a 100,000 Nm³/h USC plant and a comparable AGM.
Energies 15 01021 g013
Figure 14. Geomethane production costs. (a) plant size 25,000 Nm³/h (b) plant size 100,000 Nm³/h.
Energies 15 01021 g014
Figure 15. Global Warming Potential (GWP) for USC Scenarios (source: authors own based on GaBi ts 10 and ecoinvent v3.6).
Energies 15 01021 g015
Figure 16. Global Warming Potential (GWP) for USC Scenarios compared to relevant benchmark processes (source: authors own based on GaBi ts 10 and ecoinvent v3.6 and [68,69,70]).
Energies 15 01021 g016
Figure 17. Geomethane production costs with and without revenue for excess heat for a 100,000 Nm³/h USC plant (advance configuration) and a comparable AGM.
Energies 15 01021 g017
Figure 18. Relationship between backflow and GWP from compressor usage (Source: Energieinstitut an der JKU).
Energies 15 01021 g018
Table 1. General parameters and data for the TEA.
ParameterSub-ParameterValue
Interest rate 4%
Observation period 20 years
Electrolyserinvestment costs 1Year 2025: 800–930 EUR/kW
Year 2050: 200–260 EUR/kW
plant efficiencyYear 2025: 65.0%
Year 2050: 72.5%
time hot stand-by1 h
power hot stand-by2% of nominal power
Lifetime stackYear 2025: 6 years
Year 2050: 18 years
Lifetime BoP30 years
Excess heat (share of nominal power)Year 2025: 25%
Year 2050: 20%
Above Ground MethanationInvestment costs 1Year 2025: 410–470 EUR/kW
Year 2050: 200–250 EUR/kW
Efficiency/degree of conversion78%
Lifetime20 years
Excess heat (share of nominal power)17%
CO2 costs 40 EUR/t
Sale price for excess heat Year 2025: 50 EUR/MWh
Year 2050: 57 EUR/MWh
Sale price for oxygen 50 EUR/t
Electricity costs 2 Year 2025: 45 EUR/MWh
Year 2050: 75 EUR/MWh
Tariff for long-term storage service 3 7860 EUR/MW
1 Depending on nominal power, for detail see [44]. 2 Based on [45,46,47,48,49,50,51,52]. However, the projected electricity prices differ due to system’s assumptions (among other things, to the underlying climate protection targets and their measures) there is a clear trend towards higher electricity prices. 3 Compare the tariff calculator for long-term storage service of RAG Energy Storage GmbH—https://www.rag-energy-storage.at/speicherdienstleistungen/tarifrechner.html (accessed on 19 May 2021).
Table 2. Nominal electric power of the electrolyser and CH4 production related to the plant size (volume flow gas input) and process con-figuration.
Volume Flow
Gas Input
(Nm³/h)
Process
Configuration
Nominal Electric
Power EL
(MW)
Geomethane
Production
(MW)
CO2 Demand
(Converted)
(t_CO2/h)
25,000base12.56.91.2
advance37.520.73.7
100,000base50.027.64.9
advance150.082.714.7
Table 3. Energy allocation in scenarios based on LHV of H2 (3.0 kWh/Nm3) and CH4 (9.9 kWh/Nm3) and volumetric gas composition shown in Figure 7.
GasBaseAdvance
CH496.0%100.0%
H24.0%0.0%
Source: authors own.
Table 4. Life cycle inventory—process and their accumulated process from the database.
ProcessGaBi ts Professional/Ecoinvent v3.6 Process
ElectricityAT: Electricity from wind power ts (GaBi ts 10 Professional Database)
AT: Electricity from photovoltaic ts (GaBi ts 10 Professional Database)
AT: Electricity grid mix ts (GaBi ts 10 Professional Database)
Renewable electricity mix 2030AT: Electricity from hydro power ts (GaBi ts 10 Professional Database) (56.7%)
AT: Electricity from wind power ts (GaBi ts 10 Professional Database) (21.6%)
AT: Electricity from photovoltaic ts (GaBi ts 10 Professional Database) (13.9%)
AT: Electricity from biomass (solid) ts (GaBi ts 10 Professional Database) (5.7%)
AT: Electricity from biogas ts (GaBi ts 10 Professional Database) (2.1%)
CO2DE: Carbon dioxide (CO2) by-product ammonia (NH3) (economic allocation ts (GaBi ts 10 Professional Database)
WaterEU-28: Water (deionised) ts (GaBi ts 10 Professional Database)
Source: authors own based on GaBi ts 10 Professional and ecoinvent 3.6.
Table 5. Gas composition of process streams on injection side of the geo-methanation process (values in vol.-% dry).
StreamCO2CH4H2Other (N2, CmHn)
NG0.298.4-1.4
CO2100---
H2--100-
INPUT Case 12.586.3101.2
INPUT Case 22.876.1201.1
Publisher’s Note: MDPI stays neutral with regard to jurisdictional claims in published maps and institutional affiliations.

