
Neutronic Analysis of Start-Up Tests at China Experimental Fast Reactor

1
Korea Atomic Energy Research Institute (KAERI), Daejeon 34057, Korea
2
International Atomic Energy Agency (IAEA), A-1400 Vienna, Austria
3
Ulsan National Institute of Science and Technology (UNIST), Ulsan 44919, Korea
*
Author to whom correspondence should be addressed.
Energies 2022, 15(3), 1249; https://doi.org/10.3390/en15031249
Submission received: 16 November 2021
/
Revised: 20 December 2021
/
Accepted: 4 January 2022
/
Published: 8 February 2022
(This article belongs to the Topic Nuclear Energy Systems)
Abstract
:The China Experimental Fast Reactor (CEFR) is a small, sodium-cooled fast reactor with 20 MW(e) of power. Start-up tests of the CEFR were performed from 2010 to 2011. The China Institute of Atomic Energy made some of the neutronics start-up-test data available to the International Atomic Energy Agency (IAEA) as part of an international neutronics benchmarking exercise by distributing the experimental data to interested organizations from the member states of the IAEA. This benchmarking aims to validate and verify the physical models and neutronics simulation codes with the help of the recorded experimental data. The six start-up tests include evaluating criticality, control-rod worth, reactivity effects, and neutron spectral characteristics. As part of this coordinated research, the IAEA performed neutronics calculations using the Monte Carlo codes Serpent 2 and OpenMC, which can minimize modeling assumptions and produce reference solutions for code verification. Both codes model a three-dimensional heterogeneous core with an ENDF/B-VII.1 cross-section library. This study presents the calculation results with a well-estimated criticality and a reasonably good estimation of reactivities. The description and analysis of the core modeling assumptions, challenges in modeling a dense SFR core, results of the first phase of this project, and comparative analysis with measurements are presented.
1. Introduction
Although several fast-reactor experiments have been performed in the past several decades in various countries [1], only a few neutronics benchmarks are available [2]. The China Institute of Atomic Energy (CIAE) proposed some of the neutronics start-up-test data for the International Atomic Energy Agency (IAEA) benchmark within the scope of the IAEA’s coordinated research activity [3]. The coordinated research project (CRP) on “Neutronics Benchmark of CEFR Start-Up Tests” was launched in 2018. The objective of this benchmark is to validate and verify the actual physical models and neutronics simulation codes by comparing calculation results against collected experimental data.
The China Experimental Fast Reactor (CEFR) is a small, sodium-cooled fast reactor (SFR). It has a core with a high neutron leakage due to its small size and is fueled with uranium oxide (UO2). The core is surrounded by stainless steel (SS) radial reflectors and boron-carbide (B4C) shielding [3]. The CEFR core with 20 MW(e) of power reached its first criticality in July 2010 [4], and several start-up tests were performed from 2010 to 2011. Twenty-nine participating research organizations independently performed calculations with various code systems during the blind phase, and they are now comparing the results with the measurement data as the second phase of the project. As a part of this coordinated research, the IAEA performed neutronics calculations using Monte Carlo (MC) codes Serpent 2 [5] and OpenMC [6], which can minimize modeling assumptions and produce reference solutions for code verification. The two codes model the same three-dimensional (3D) heterogeneous core with the ENDF/B-VII.1 continuous-energy cross-section library [7]. The five physics start-up tests considered for this CRP include the evaluation of criticality, control-rod worth, void reactivity, temperature coefficient, and swap reactivity. The main objective of this benchmark is to improve the understanding of the start-up of SFRs and validate the state-of-the-art fast-reactor-analysis computer codes against the latest experimental data obtained from the modern experimental SFR.
2. CEFR Benchmark Description
2.1. Core Description and Modeling
The CEFR is a small pool-type reactor with a thermal power of 65 MW. Its designed life is 30 years and its refueling period is 80 days. Seventy-nine fuel subassemblies with UO2 were loaded at the initial core. The overall core height was 800 mm, which consisted of a fuel region of 450 mm and a blanket region of 350 mm located above and below the fuel region. The fuel region had subassemblies with annular fuel pellets using the UO2 fuel with 64.4 wt.% of 235U, and the blanket region had subassemblies with traditional fuel pellets using the UO2 fuel with 0.3 wt.% of 235U. Boron carbide, a neutron-absorbing material, with different 10B enrichment was used in the boron-shielding subassemblies and control-rod subassemblies.
A 3D heterogeneous core model was prepared in Serpent 2 and OpenMC and used for the analysis. All the subassemblies were modeled from the bottom of the grid plate to the upper shielding of the SS subassemblies; other parts were ignored because of neutronics insignificance. The CEFR subassembly pins were kept separate using a wrapper wire, spirally wrapped around each fuel pin. Considering the wire itself is much more important than modeling it, such as smearing it into coolant or claddings [8]. These wrapper wires were modeled into the geometry by smearing them into the cladding of the fuel pin, thereby keeping the volume conserved. Two types of SSs were used in the subassemblies: (1) 15-15Ti for claddings and wrapper wires and (2) 316Ti for other structural components. The densities of significant materials, such as the UO2 fuel for the fuel and blanket regions or the B4C for the control rod and shielding, have been referred to as the measured loading amount.
The dimensions of the structures and the densities of the materials change based on the temperature so that it causes reactivity to decrease; therefore, modeling of the thermal expansion in both radial and axial directions was considered while performing the calculations. Firstly, the criterion for axial expansion is the bottom plate. The structure material increases to be larger than the fuel material at 250 °C since the expansion coefficient varies depending on the material, which is listed in Table 1. All the calculations, except those for the temperature coefficient, were performed at a temperature of 250 °C. The geometry expansion in all directions was considered. The radial expansion was modeled considering the expansion of the grid plate. The axial expansion of the subassemblies, such as the fuel and reflector, was modeled considering the extension from the bottom. The axial expansion of the control-rod subassemblies was modeled considering the increase in the height from the top. Even though thermal expansion was considered for the control-rod subassemblies, the inserted positions of the control rods used the measured values. The material’s density change was also considered for the increase in dimensions to compensate for the total weight. Figure 1 depicts the cross-sectional views of the core using Serpent 2 and OpenMC.
2.2. Start-Up Tests Used in the Benchmark
As listed in Table 2, six of the sixteen experiments were selected, based on their high-quality measurements and qualified data, for the start-up benchmark problem set: (1) fuel loading and first criticality, (2) control-rod worth at the cold state during operation loading, (3) sodium-void reactivity coefficients, (4) rod-swap reactivity coefficients, (5) temperature coefficients, and (6) foil activation for the distribution of the reaction rate [9]. We present all experiments except for the foil activation.
2.3. Coefficient-Measurement Methods in the Experiments
The order of the computation follows the measurement procedure provided by the CIAE. The S-curves for each control rod were gauged before the measurement of the reactivity coefficients. Initially, some control rods moved to reach criticality before the state of the core was changed. For example, by the replacement of the void fuel subassembly, rod swapping, or a change in temperature. Positive or negative reactivity into the core was followed by the movement of the control rods to meet the core criticality again. The control rods were moved to make the core critical; however, the critical state also has uncertainty because it is not equal to exactly 1. The equation for the reactivity calculation consists of two terms:
where is the reactivity change due to state change such as the control-rod insertion, temperature change, or swapping subassemblies; is the reactivity from critical states before and after changing the state of the core; is the reactivity change due to the movement of some control rods reaching criticality; is keff before state change; is keff after state change; is a type of control rod; is the differential rod worth of control rod ; and is the change of position for control rod .
The values of keff do not always correspond exactly to 1.00000 at the critical state; therefore, is not equal to zero. The measurement data provide both the reactivity coefficients and their uncertainties; however, it is not clear how the uncertainty of the measurement data was calculated. In the computer simulation, the reactivity is calculated in the same way as in Equation (1). Its uncertainty can be calculated as follows:
where is the uncertainty of reactivity; and are the uncertainties of and , respectively; and is the uncertainty of the rod worth of control rod i. Note that the uncertainty in this study considers only the statistical uncertainty in the given neutron histories, and does not consider covariance data from nuclear-data libraries.
3. Simulation Codes and Computation Options
Two Monte-Carlo-based calculation codes, Serpent 2 and OpenMC [6], were used for the simulation for code-to-code verification. Serpent 2 is a reactor physics-simulation code that uses the Monte Carlo method developed by the VTT Technical Research Centre of Finland [5]. OpenMC is an open-source, Monte-Carlo particle-transport code developed at the Massachusetts Institute of Technology. Both codes support useful functions for fast-reactor-core simulations, such as a hexagonal lattice, a routine for on-the-fly Doppler-broadening (OTF DB) for temperature, and mixture definition using several materials [10,11].
The two codes use different OTF DB methods and different library formats: target motion sampling for Serpent 2 using the ACE format library and Windowed Multipole (OpenW, WMP) for OpenMC using both the HDF5-format library and windowed multipole library [12,13]. Although these OTF DB methods can be used for simulations, this benchmark requires cross-section libraries only for dozens of isotopes at certain fixed temperatures. For consistency, the authors generated the ACE-format continuous-energy libraries at specific temperatures from ENDF/B-VII.1 raw data [7], and they were processed using NJOY2012 with a reconstruction tolerance of 0.001. The HDF5-format library was obtained by converting the calculated ACE format library. To properly account for self-shielding in the unresolved resonance-energy range, both codes use the probability-table method. All calculations were performed in the eigenvalue calculation with 50 inactive and 1000 active cycles of 500,000 source neutrons to provide less than 10 pcm uncertainty of eigenvalue. The adequacy of 50 inactive cycles was confirmed by checking the convergence of keff and the Shannon entropy in each cycle. Owing to the long mean free path of fast neutrons, the fission source distribution could converge rapidly. The standard deviation of the eigenvalue, keff, appeared to be approximately 5–6 pcm and 3–4 pcm for all calculation results in Serpent 2 and OpenMC, respectively.
4. Calculation Results
4.1. Criticality
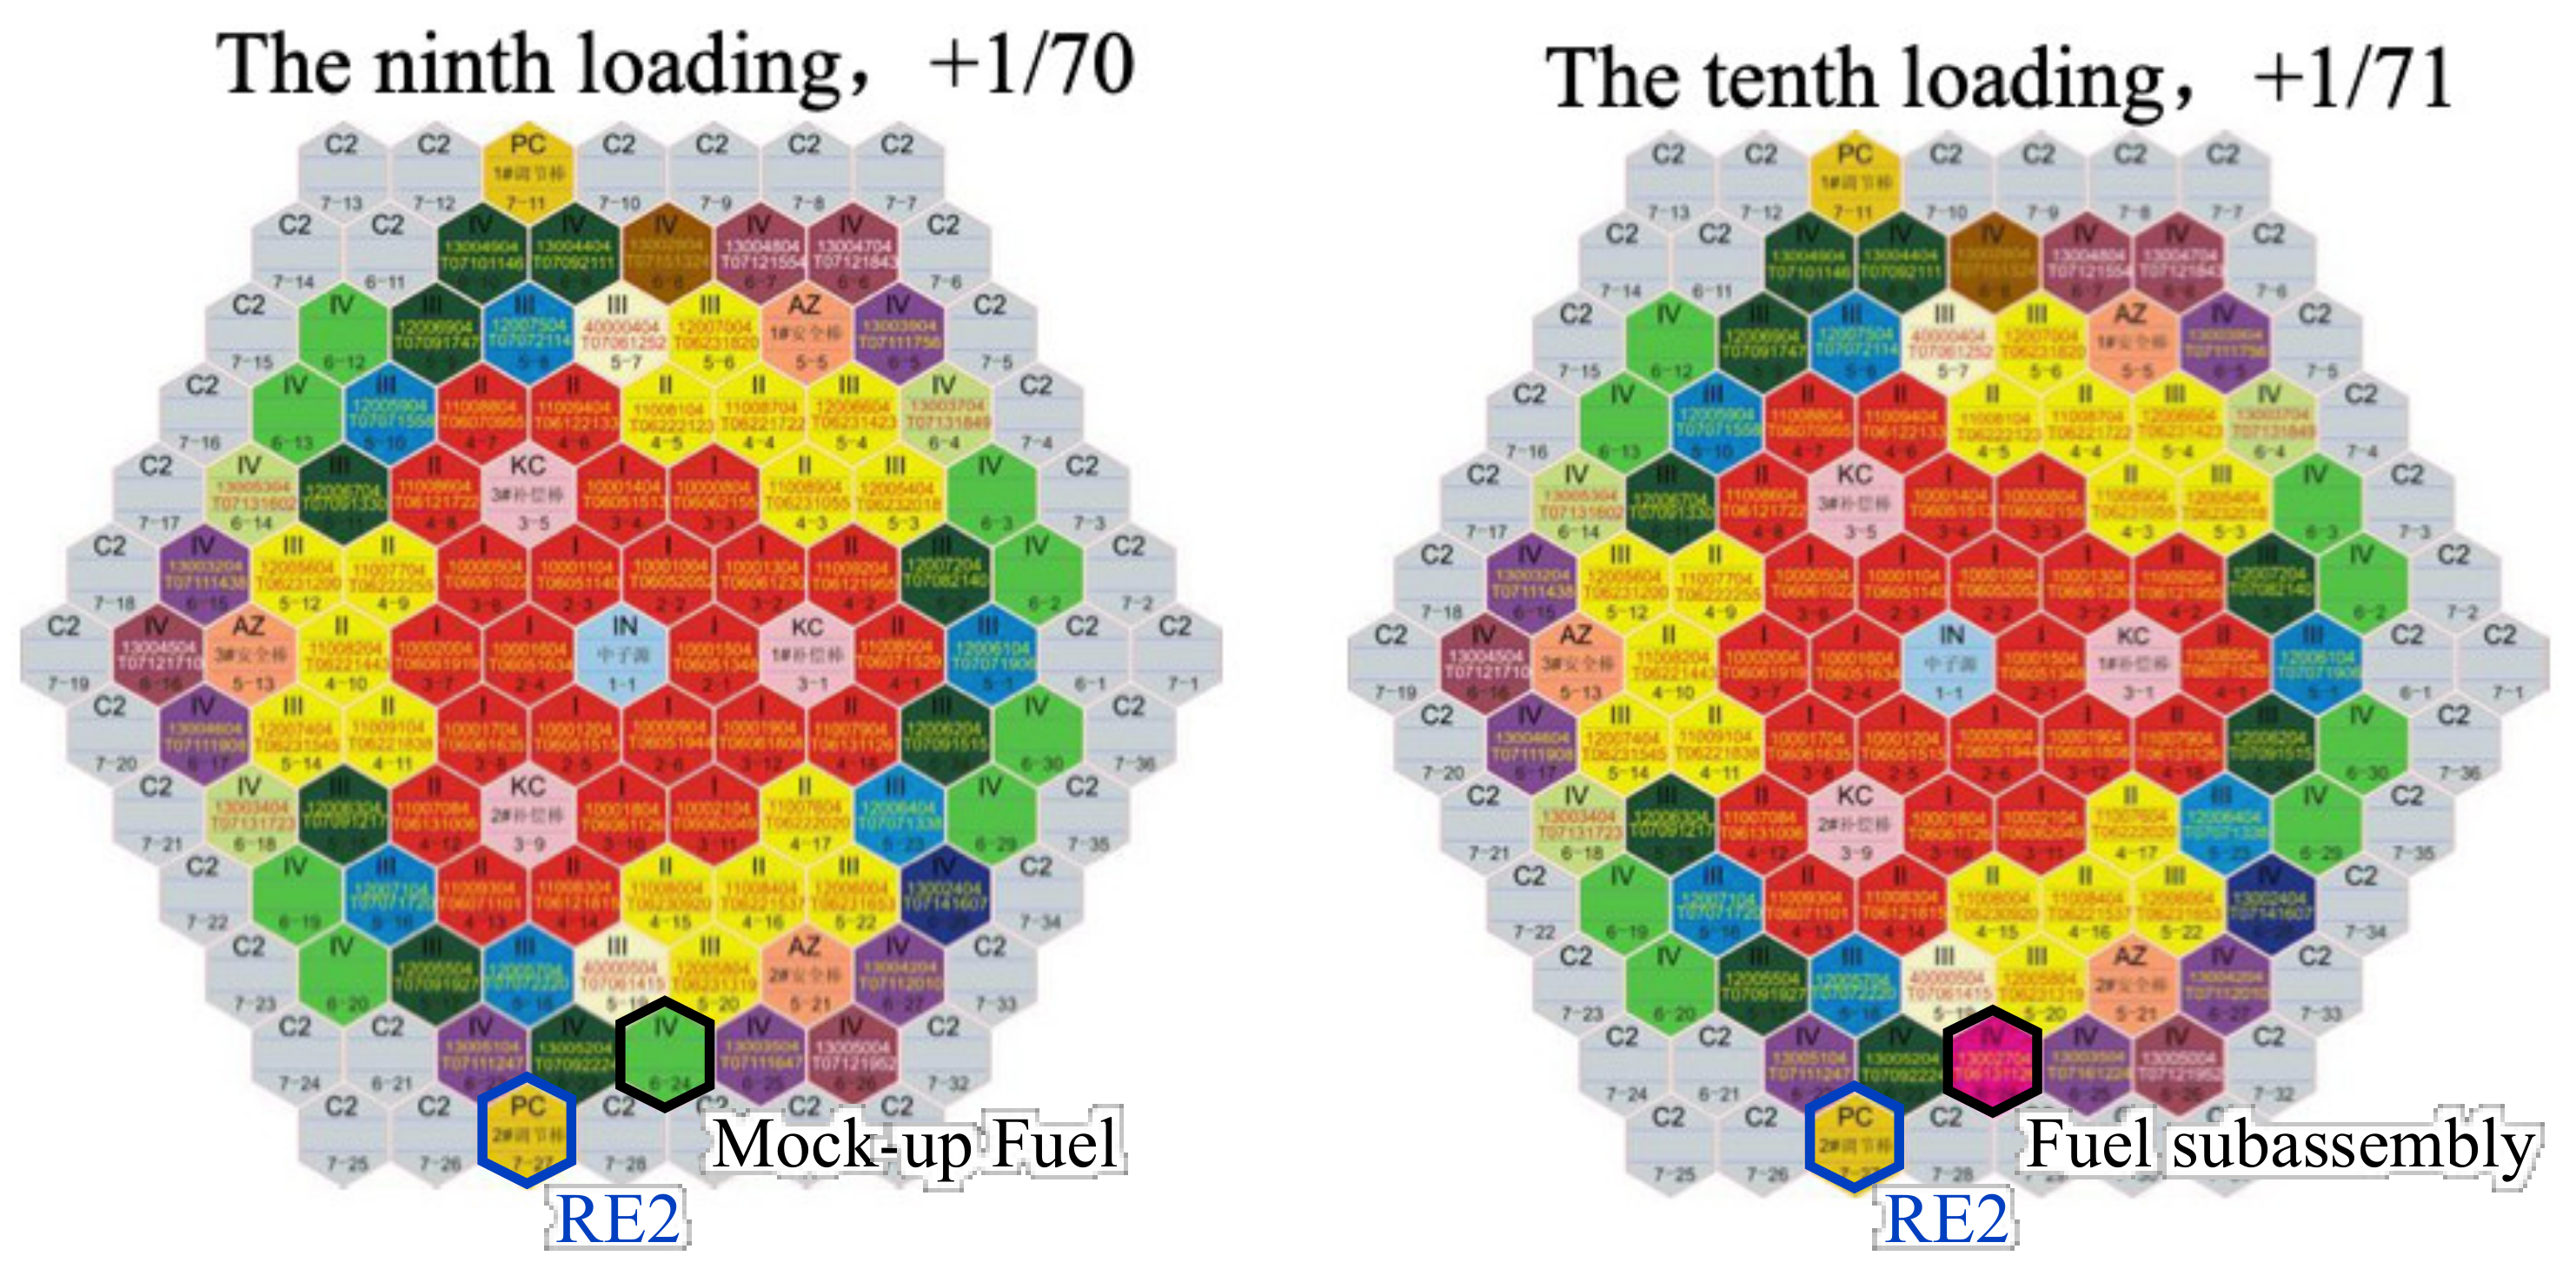
The start-up test was initiated with a core loaded with 79 mock-up fuel subassemblies consisting of SS instead of fuel rods in the fuel positions and all the control-rod subassemblies, which were right above the fuel region. The reactor reached its first criticality when the mock-up fuel subassemblies were replaced incrementally with real fuel subassemblies. Using the extrapolation of the reciprocal count rate for the loading amount, the number of fuel subassemblies in the core increased from 24 to 72. This process is also called subcritical extrapolation. After the tenth loading with 71 fuel subassemblies, the loading of the next subassembly turned the core supercritical. The subcritical extrapolation ended at this moment. The next step is called supercritical extrapolation, which uses the control rods to reach criticality by the period method [9].
The core-loading patterns of the ninth and tenth steps are depicted in Figure 2. To bring the core to a critical state, one control-rod subassembly, which was a regulating subassembly 2 (RE2), was inserted. The core eventually reached criticality with 72 fuel subassemblies loaded, with the RE2 inserted at the 70 mm position in the experiment. The experiment was performed in the cold state (250 °C) [9].
The experimental data are compared with the calculation results of the Serpent 2 and OpenMC codes in Table 3 and Figure 3. The simulation results tended to show the same states as in the experiments, and both MC simulation solutions for each item were identical within 1σ. Reactivity decreased with the insertion of RE2 in the core with 72 FAs. At the predicted critical state, the reactivities of Serpent 2 and OpenMC were −39 pcm and −56 pcm, respectively. In other words, the MC code simulation, which considers thermal expansion using the ENDF/B-VII.1 library, narrowly underestimated the core criticality. In the same case of the criticality test with 71 fuel subassemblies at the subcritical state, Serpent 2 and OpenMC used 1.3 GB and 0.20 GB memory, respectively. Using OpenMP with 27 threads, Serpent 2 and OpenMC took 4 h and 8 h, respectively. Serpent 2 used the internal unionized energy-grid format and the Woodcock delta-tracking method to reduce the simulation time; however, both these methods required significantly large memories.
4.2. Control-Rod Worth
The experiment was performed in the cold state (250 °C) in the operation layout, which had 79 fuel subassemblies [9]. The control assemblies had the same dimensions but used different 10B enrichments in B4C: the regulating subassemblies (RE) used 92 wt.% of 10B and the shim subassemblies (SH) and safety subassemblies (SA) used natural 19.8 at% of 10B abundance. The experimental data for the control-rod worth are provided in two forms: the integral worth and the typical S-curve.
4.2.1. Integral Control-Rod Worth
The objective of the first simulation was to calculate the integral control-rod worth. Integral worth is defined as the total reactivity change when one or several control rods move from top to bottom, measured by the rod-drop method [9]. The exact rod positions in each rod-drop experiment are listed in Table 4. The 0 mm reference was set at the bottom of the fuel region. The results of the comparison of the integral control-rod (or group) worth are summarized in Table 4 and Figure 4. The regulating subassemblies with natural 10B, which were located mostly outside the active core, have the least value among all three types of control subassemblies. The safety subassemblies were located near the reflector periphery, and the location of the shim subassemblies was closer to the center of the core. Therefore, the worth of the shim subassemblies is higher than those of the safety subassemblies, even with the same dimensions and materials. For the same type of control subassemblies, that is, shim rods, the rod worth is different owing to the asymmetric core configuration. The rod worths of SH2 and SH3 are similar because SH2 (3–9 in Figure 2) and SH3 (3–5 in Figure 2) are located symmetrically. However, SH1 (3–1 in Figure 2) is located on the right side, and its rod worth is higher than that of SH2 and SH3. The rod worth of SH1 is 9.8% higher than that of the other SH rods in the experimental data. Furthermore, the rod worth of SH1 is 2.8–3.9% higher than that of the other SH rods in the simulation results. Evidently, all the integral control-rod-worth calculation results indicated the same value of the measurement within 2σ. However, the absolute difference caused an underestimation of some integral rod worths.
Most of the experiments, except Task 1 (Section 4.1), were performed in the operation core with 79 fuel subassemblies. The SA rods were at the out-of-core position, and the positions of the other rods varied based on the measurement. A comparison of power distribution or flux distribution was performed for the core with “2 × RE + 3 × SH + 3 × SA B (before)” case in Table 4, in which two RE and three SH rods and three SA rods were located at the middle of the active core and outside of the active core, respectively. Figure 5 and Figure 6 depict the normalized radial assembly power distributions. These results are the code-to-code verification to confirm correctness of the benchmark modeling and the match of the results between the two codes. The relative uncertainly of assembly power is around 0.0003. All 79 fuel subassemblies were of the same type; thus, the radial power exhibited a typical shape with a higher-level power in the center region, as depicted in Figure 5 and Figure 6. The Serpent 2 result is the same within 2σ as the OpenMC result, as depicted in Figure 7. Figure 8 describes the flux spectra using the SCALE 238 energy-group structure, and the neutron fluxes are tallied from the entire core including all reflectors. It is a typical neutron spectrum of an SFR concentrated in the 0.1–1.0 MeV range, and there are dips due to significant scattering resonances of 23Na and 56Fe [14]. The Serpent 2 result is the same, within 2σ, as the OpenMC result.
4.2.2. S-Curve
The next simulation was for calculating the S-curve. The control-rod worth was uneven along the elevation. Changes in the position of the rod affect reactivity calculations, such as temperature coefficients, sodium-void worth, and swap reactivity. The measurement data of the S-curve exist as normalized values, which do not consider absolute control-rod worth and exhibit an axial shape regardless of the control-rod type such as SH1, SH2 or SH3. To compare absolute values, the normalized S-curve was multiplied by the integral control-rod worth. For the computational simulation, one single rod position was inserted in 50 mm steps from the top to the bottom of the core, and the remaining control rods were at the out-of-core position. Figure 9 depicts the S-curves for regulating rods (REs) and shim rods (SHs). Both the computation results are the same within 19 pcm and are in good agreement with the measurement data. The SH rod curves look smooth due to large absolute value of SH rod worth of 1,800 pcm, while RE rods curves look rough due to the small value of RE rod worth and their relatively large uncertainties. The control-rod position during the S-curve calculation was different from that of the integral rod-worth calculation. Significantly, the computation results of the rod worth of SH1 deviate by up to 1σ of the measurement, and these errors led to an underestimation of the S-curve.
4.3. Sodium-Void Reactivities
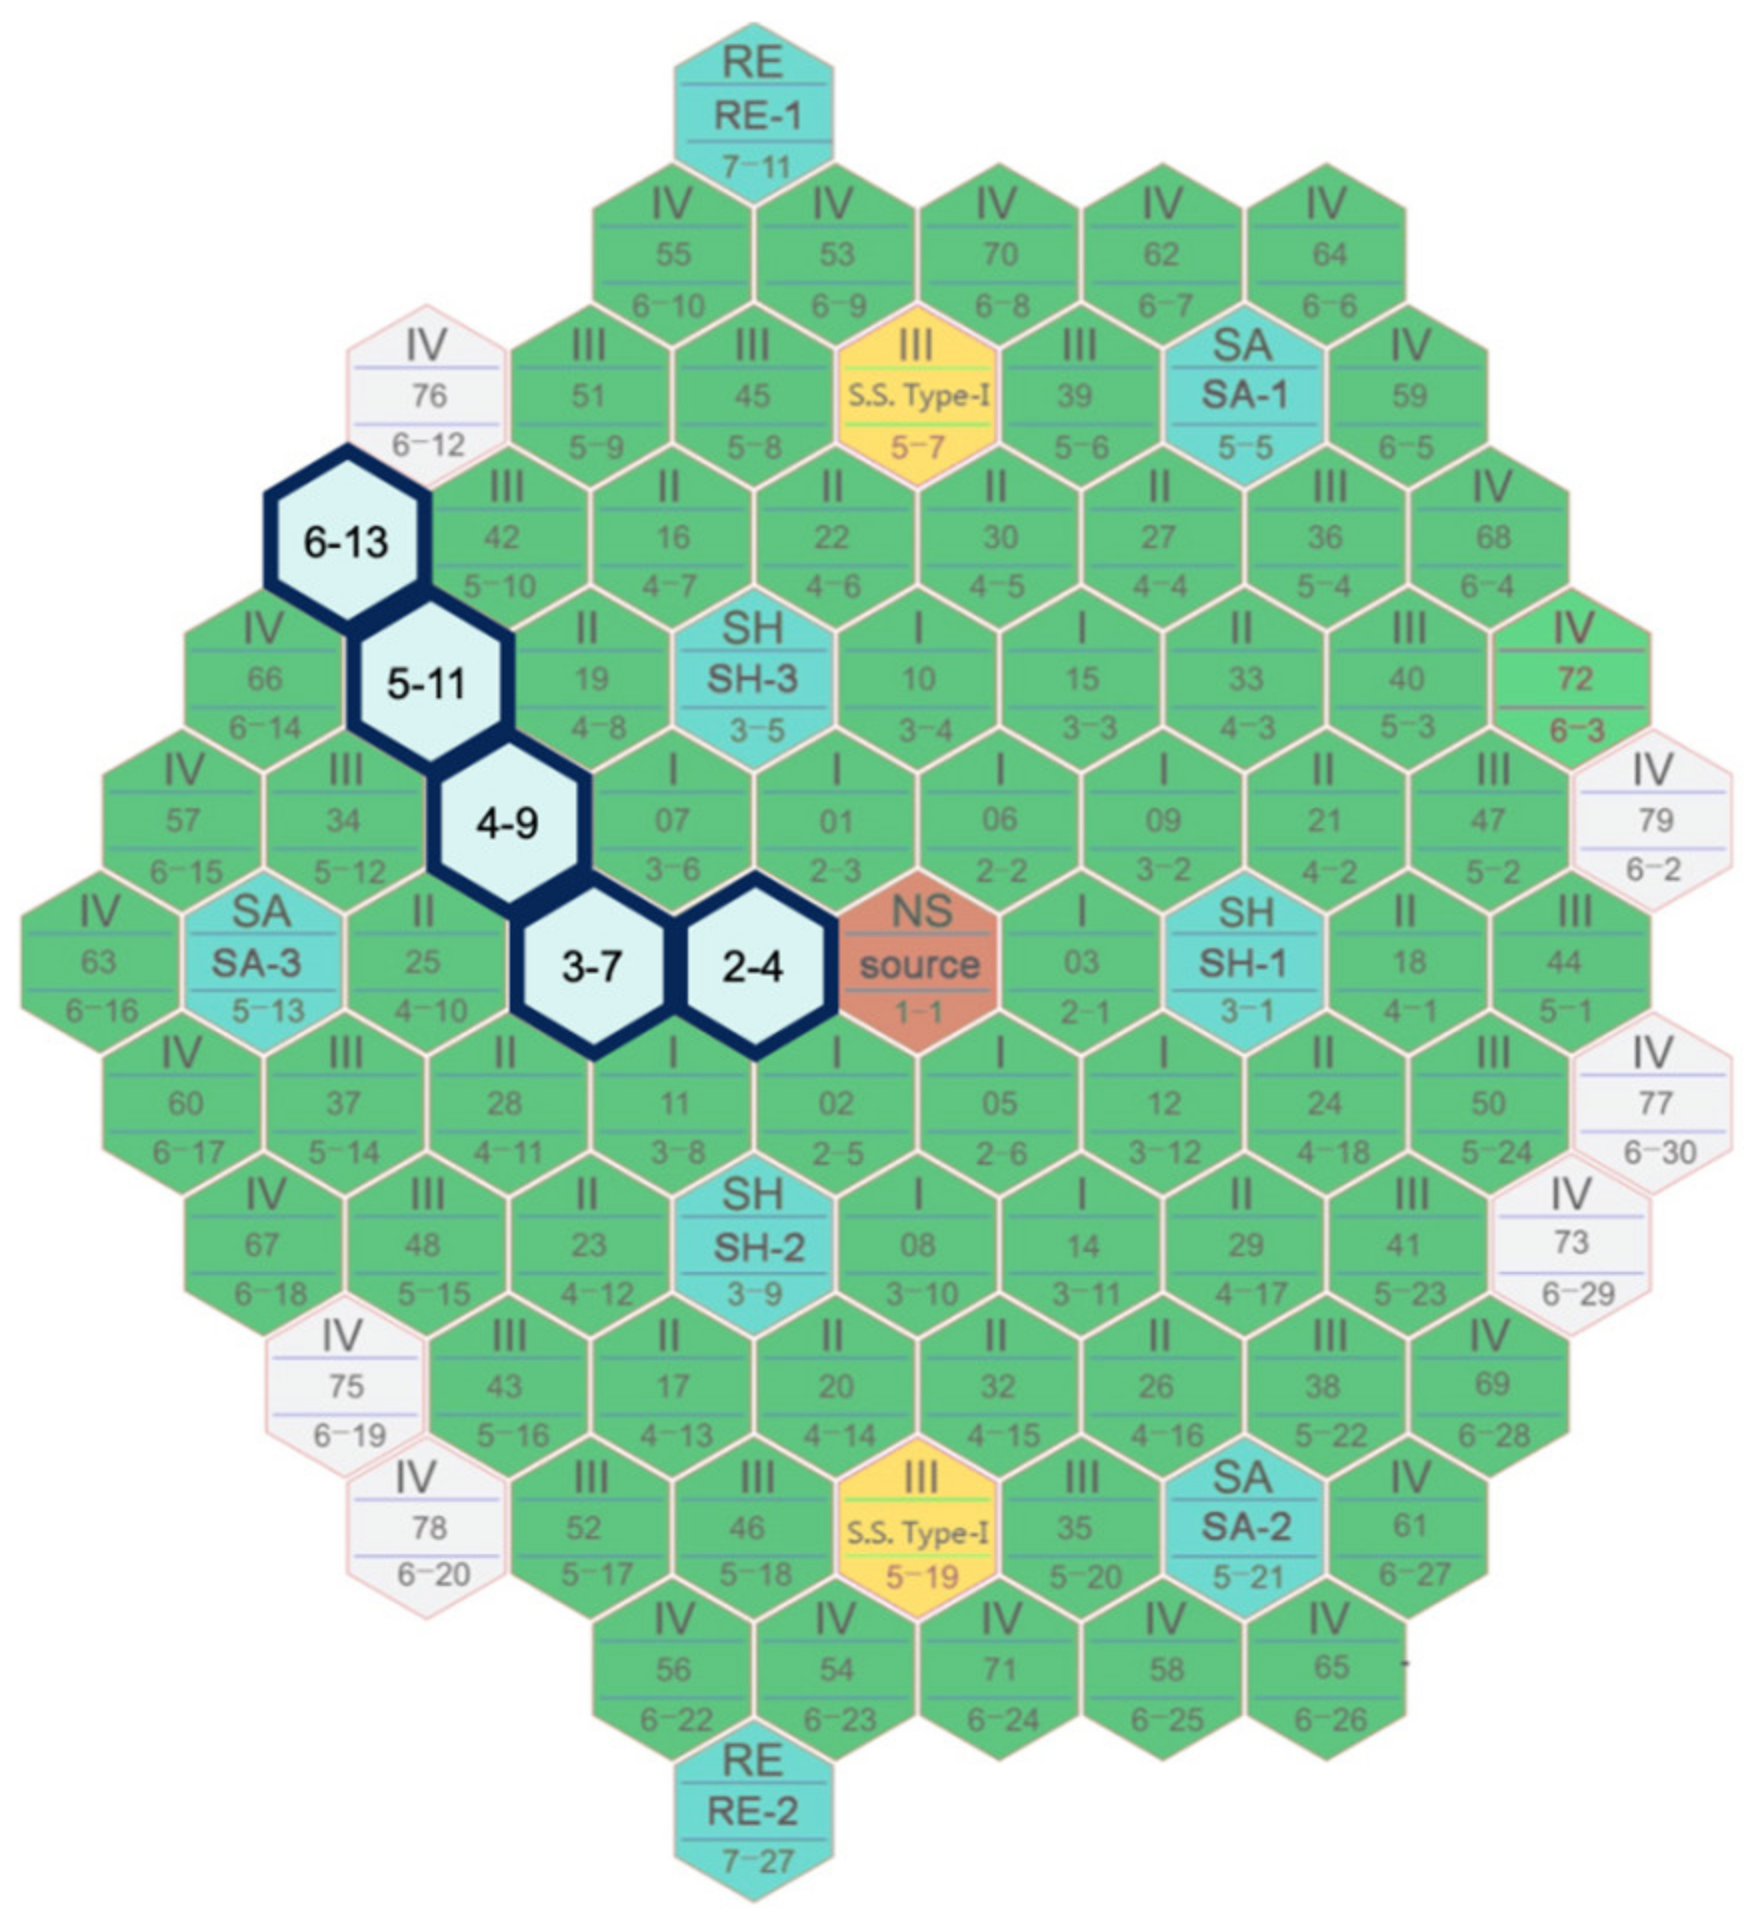
The sodium-void reactivity is measured by replacing a fuel subassembly by a vacuum-sealed fuel subassembly and then searching for the critical position of the control rods. The vacuum-sealed fuel subassembly is filled with helium at low pressure and sealed so that that the sodium coolant cannot pass through. Five different fuel subassembly locations, as depicted in Figure 10 were measured. The measurements were obtained in the cold state during operation loading with 79 fuel subassemblies, and the target temperature was 250 °C [9]. The positions of the control rods, SH and SA, were fixed in the core (Table 5) with RE rods moving to attain criticality.
The comparison of the sodium-void worth at five different positions is summarized in Table 6 and Figure 11. In the case of a typical large-sized fast-reactor core, the sodium-void reactivity may appear slightly higher than 0. However, the sodium-void reactivity of the CEFR is always negative owing to the small core size with high neutron leakage; moreover, the values are similar regardless of the location because (1) the center of the core has more neutrons and less leakage and (2) the outside of the core has fewer neutrons and more neutron leakage. The simulation results match the measurement data within 1σ; however, the calculation results have considerable uncertainties since only RE rods among the SH and RE rods are moved to measure void reactivity, and the RE banks have large uncertainties compared to their S-curves. Additionally, even though within 1σ uncertainty, the absolute value of the differential rod worth for the RE rods of Serpent 2 is lower than that of OpenMC between 300 mm to 350 mm, which is the range that RE rods move to measure the sodium-void worth, and the sodium-void worth of Serpent 2 is also smaller than that of OpenMC.
4.4. Temperature Coefficients
The measurements were performed at the core during operation loading with 79 FAs. Ten data sets were obtained by increasing the temperature from 250 to 300 °C and then decreasing it from 300 to 250 °C. The SA rods were at the out-of-core position, and the SH and RE rods moved to meet the criticality variations (see Table 7). Fourteen thermocouples were installed above the reactor core to obtain the average outlet temperature of sodium, which was assumed to be uniform [9].
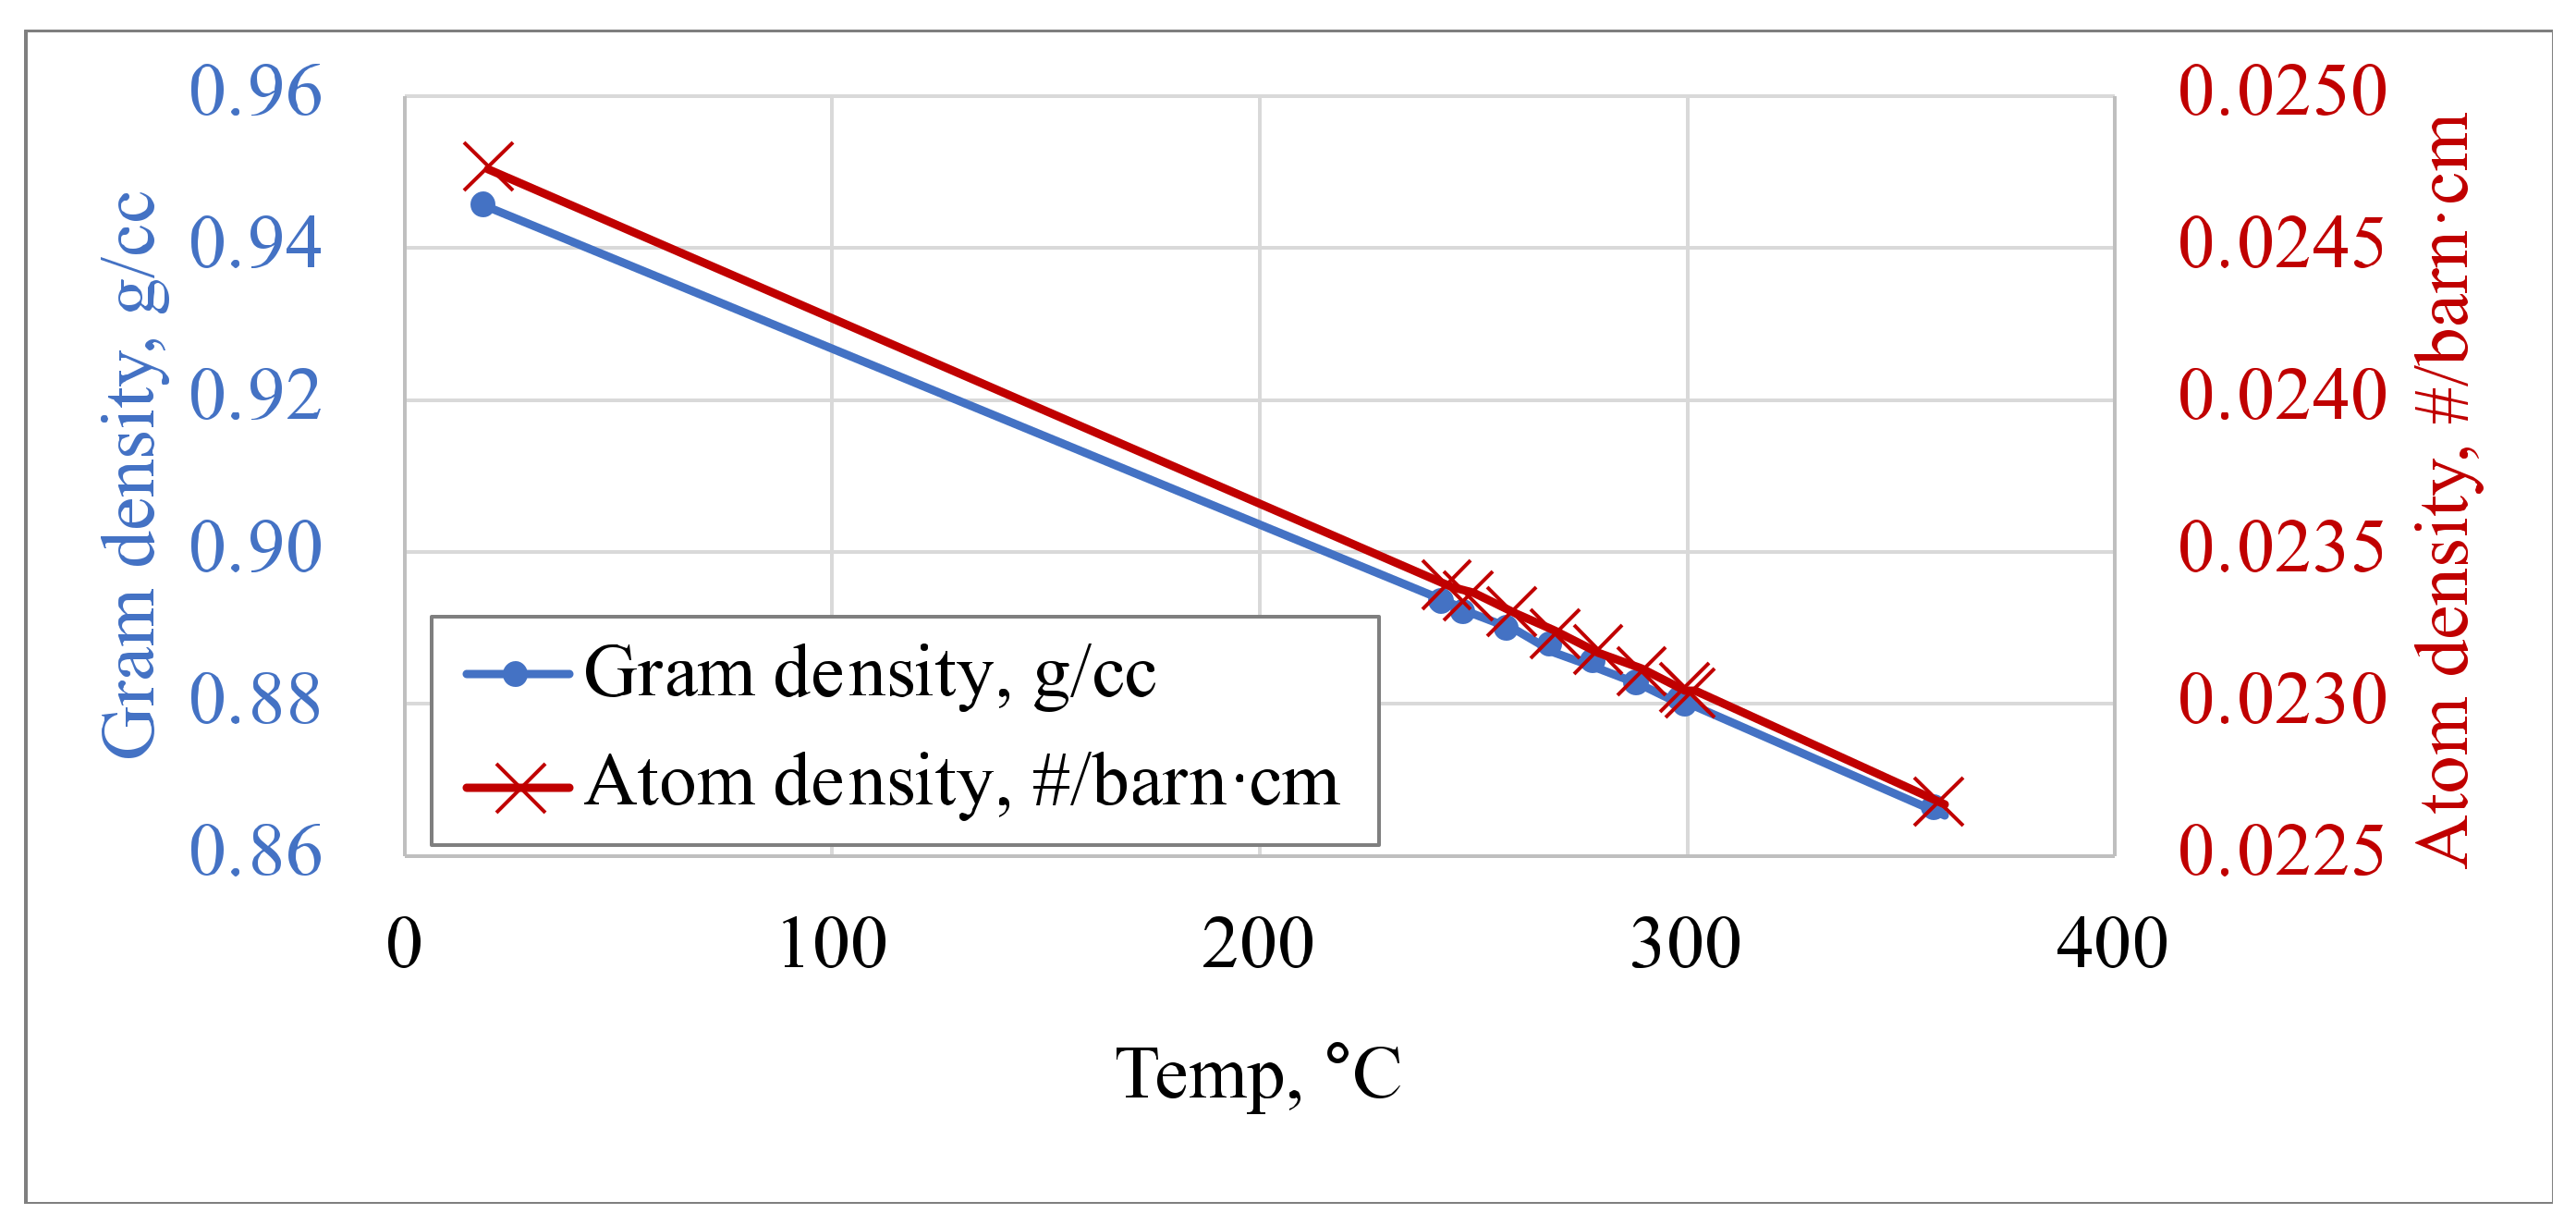
Thermal expansion was applied to the computations, material densities, and dimension changes based on the given temperature. Although the overall weights of solid materials compensated, the amount of sodium coolant changed. The density of sodium varied with temperature as
where T is the temperature in centigrade [9]. Figure 12 shows density change by Equation (3).
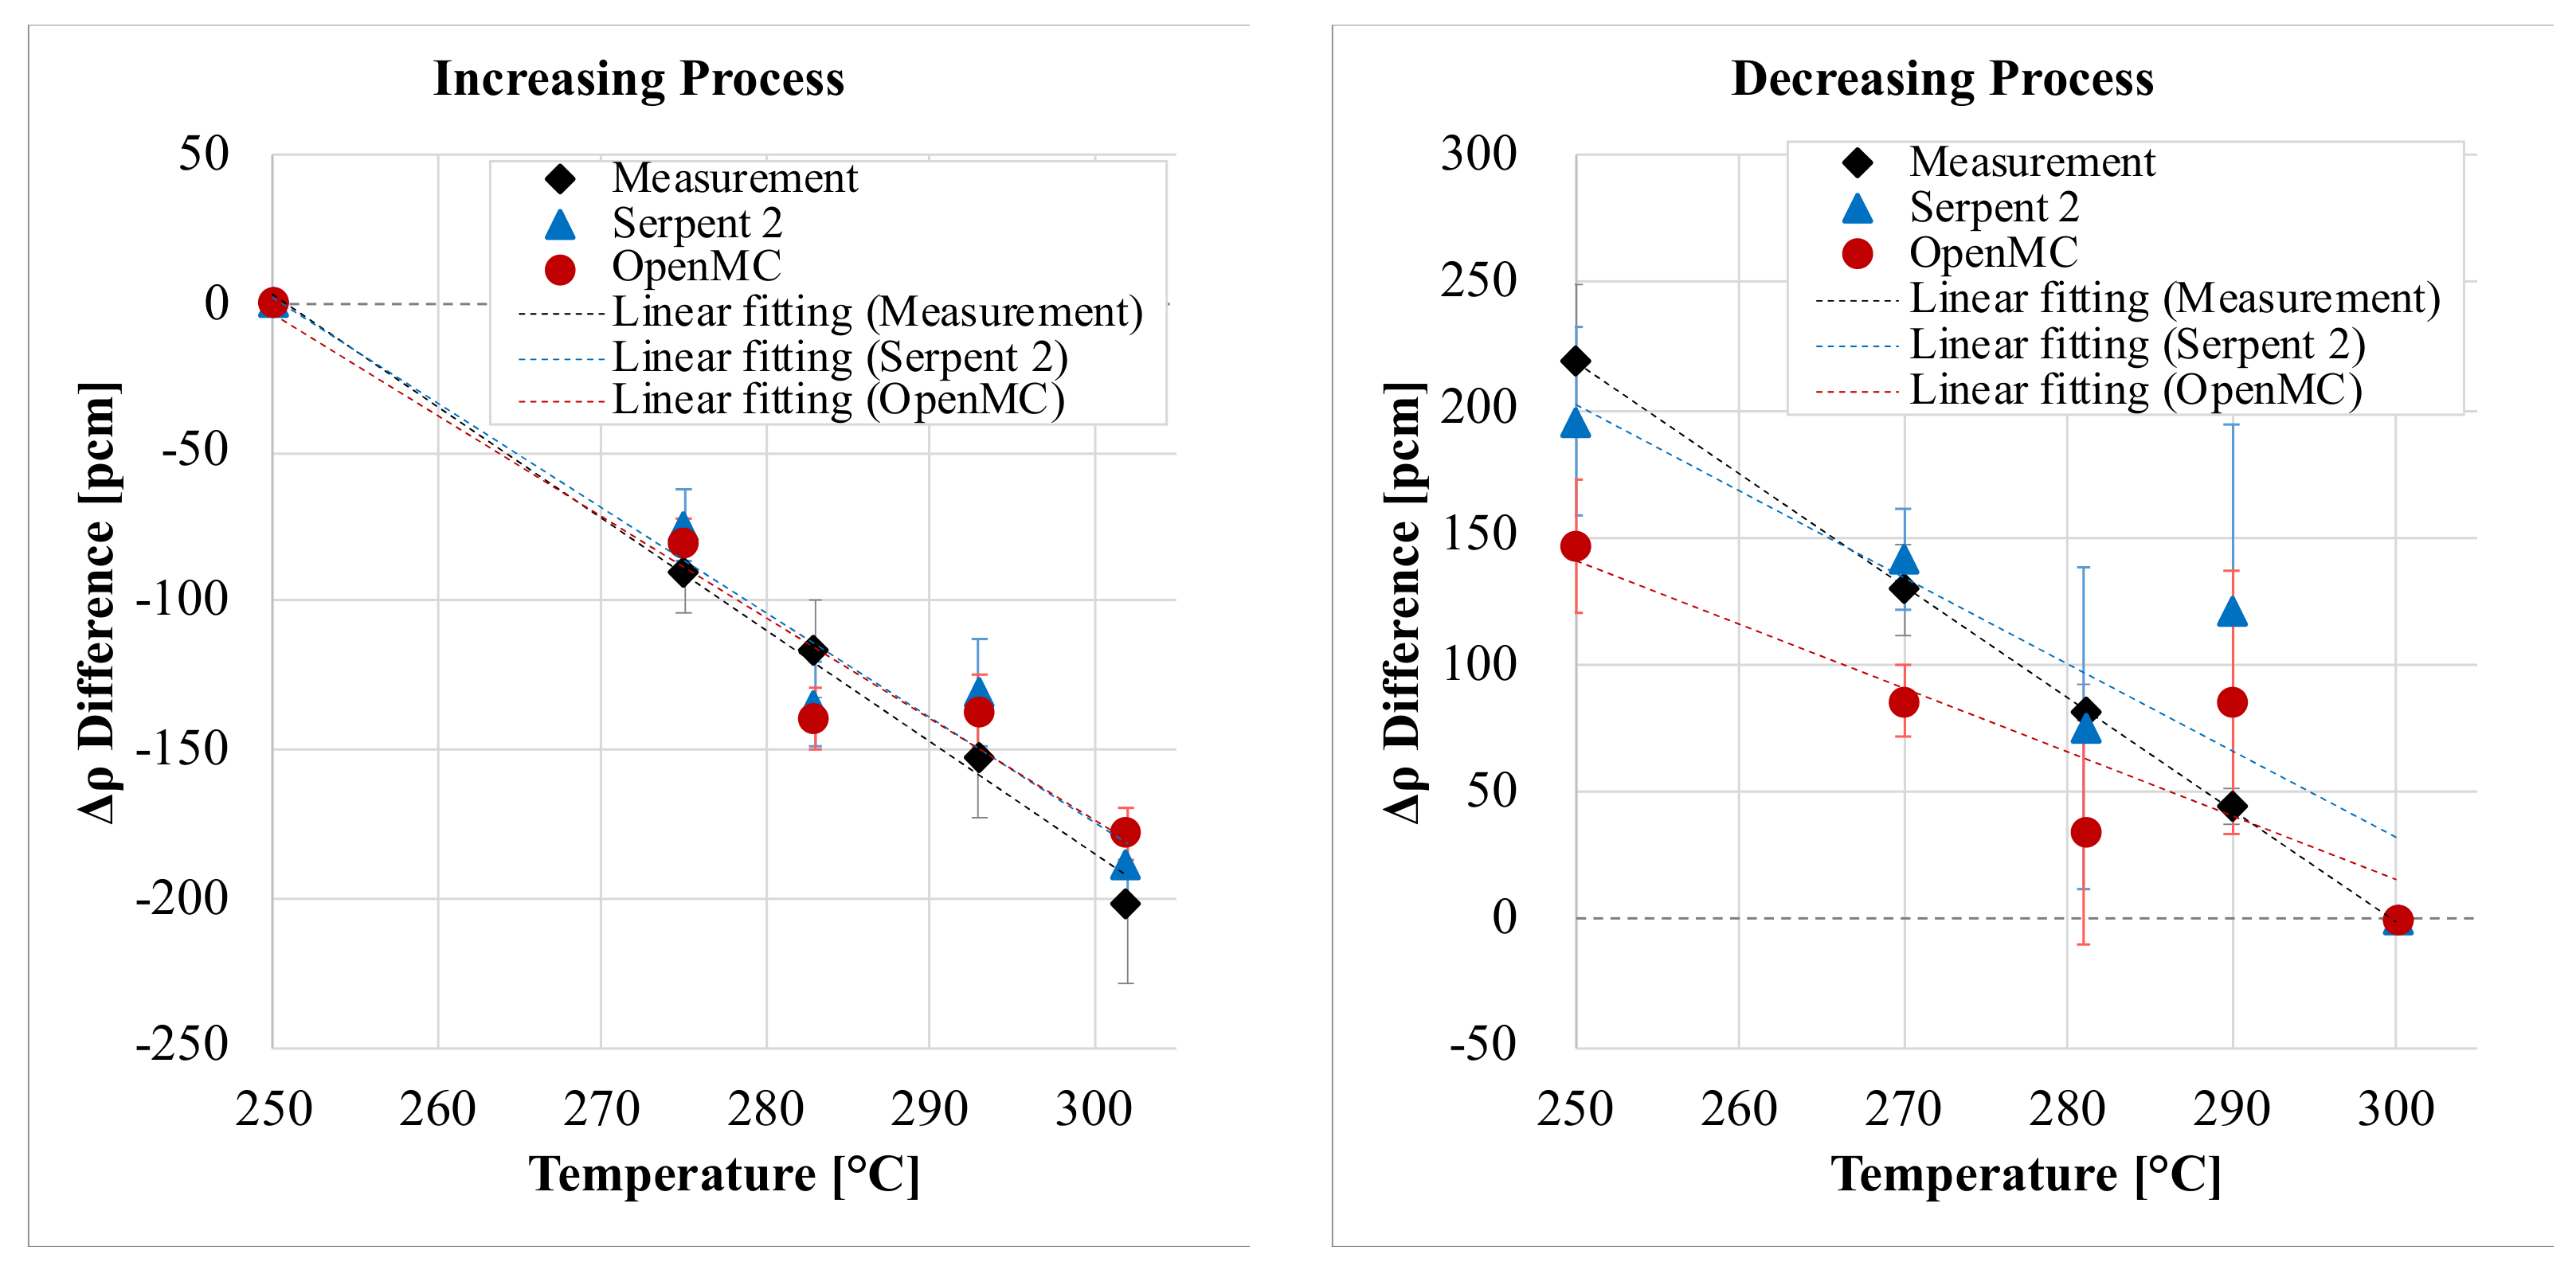
In the experimental data, two different temperature coefficients are provided based on an increasing or a decreasing procedure in temperature. The temperature coefficient is obtained from the slope of the reactivity change as a function of temperature. The MC simulation results and measurements are summarized in Table 7. The reactivity decreases with an increase in the temperature, as depicted in Figure 13. Hence, the temperature coefficients are negative. This situation is attributed to the following: (1) an expansion of the fuel leads to a decrease in its density, (2) radial expansion of the cladding affects the decrement of the sodium volume, (3) the sodium volume between subassemblies and increased core size increases owing to the radial expansion of the grid plate, and (4) the sodium density decreases because the increase in temperature increases the leakage and leads to a reduction in reactivity [15]. The simulation results of the temperature coefficients agree well with the measurements depicted in Figure 14.
4.5. Swap Reactivity
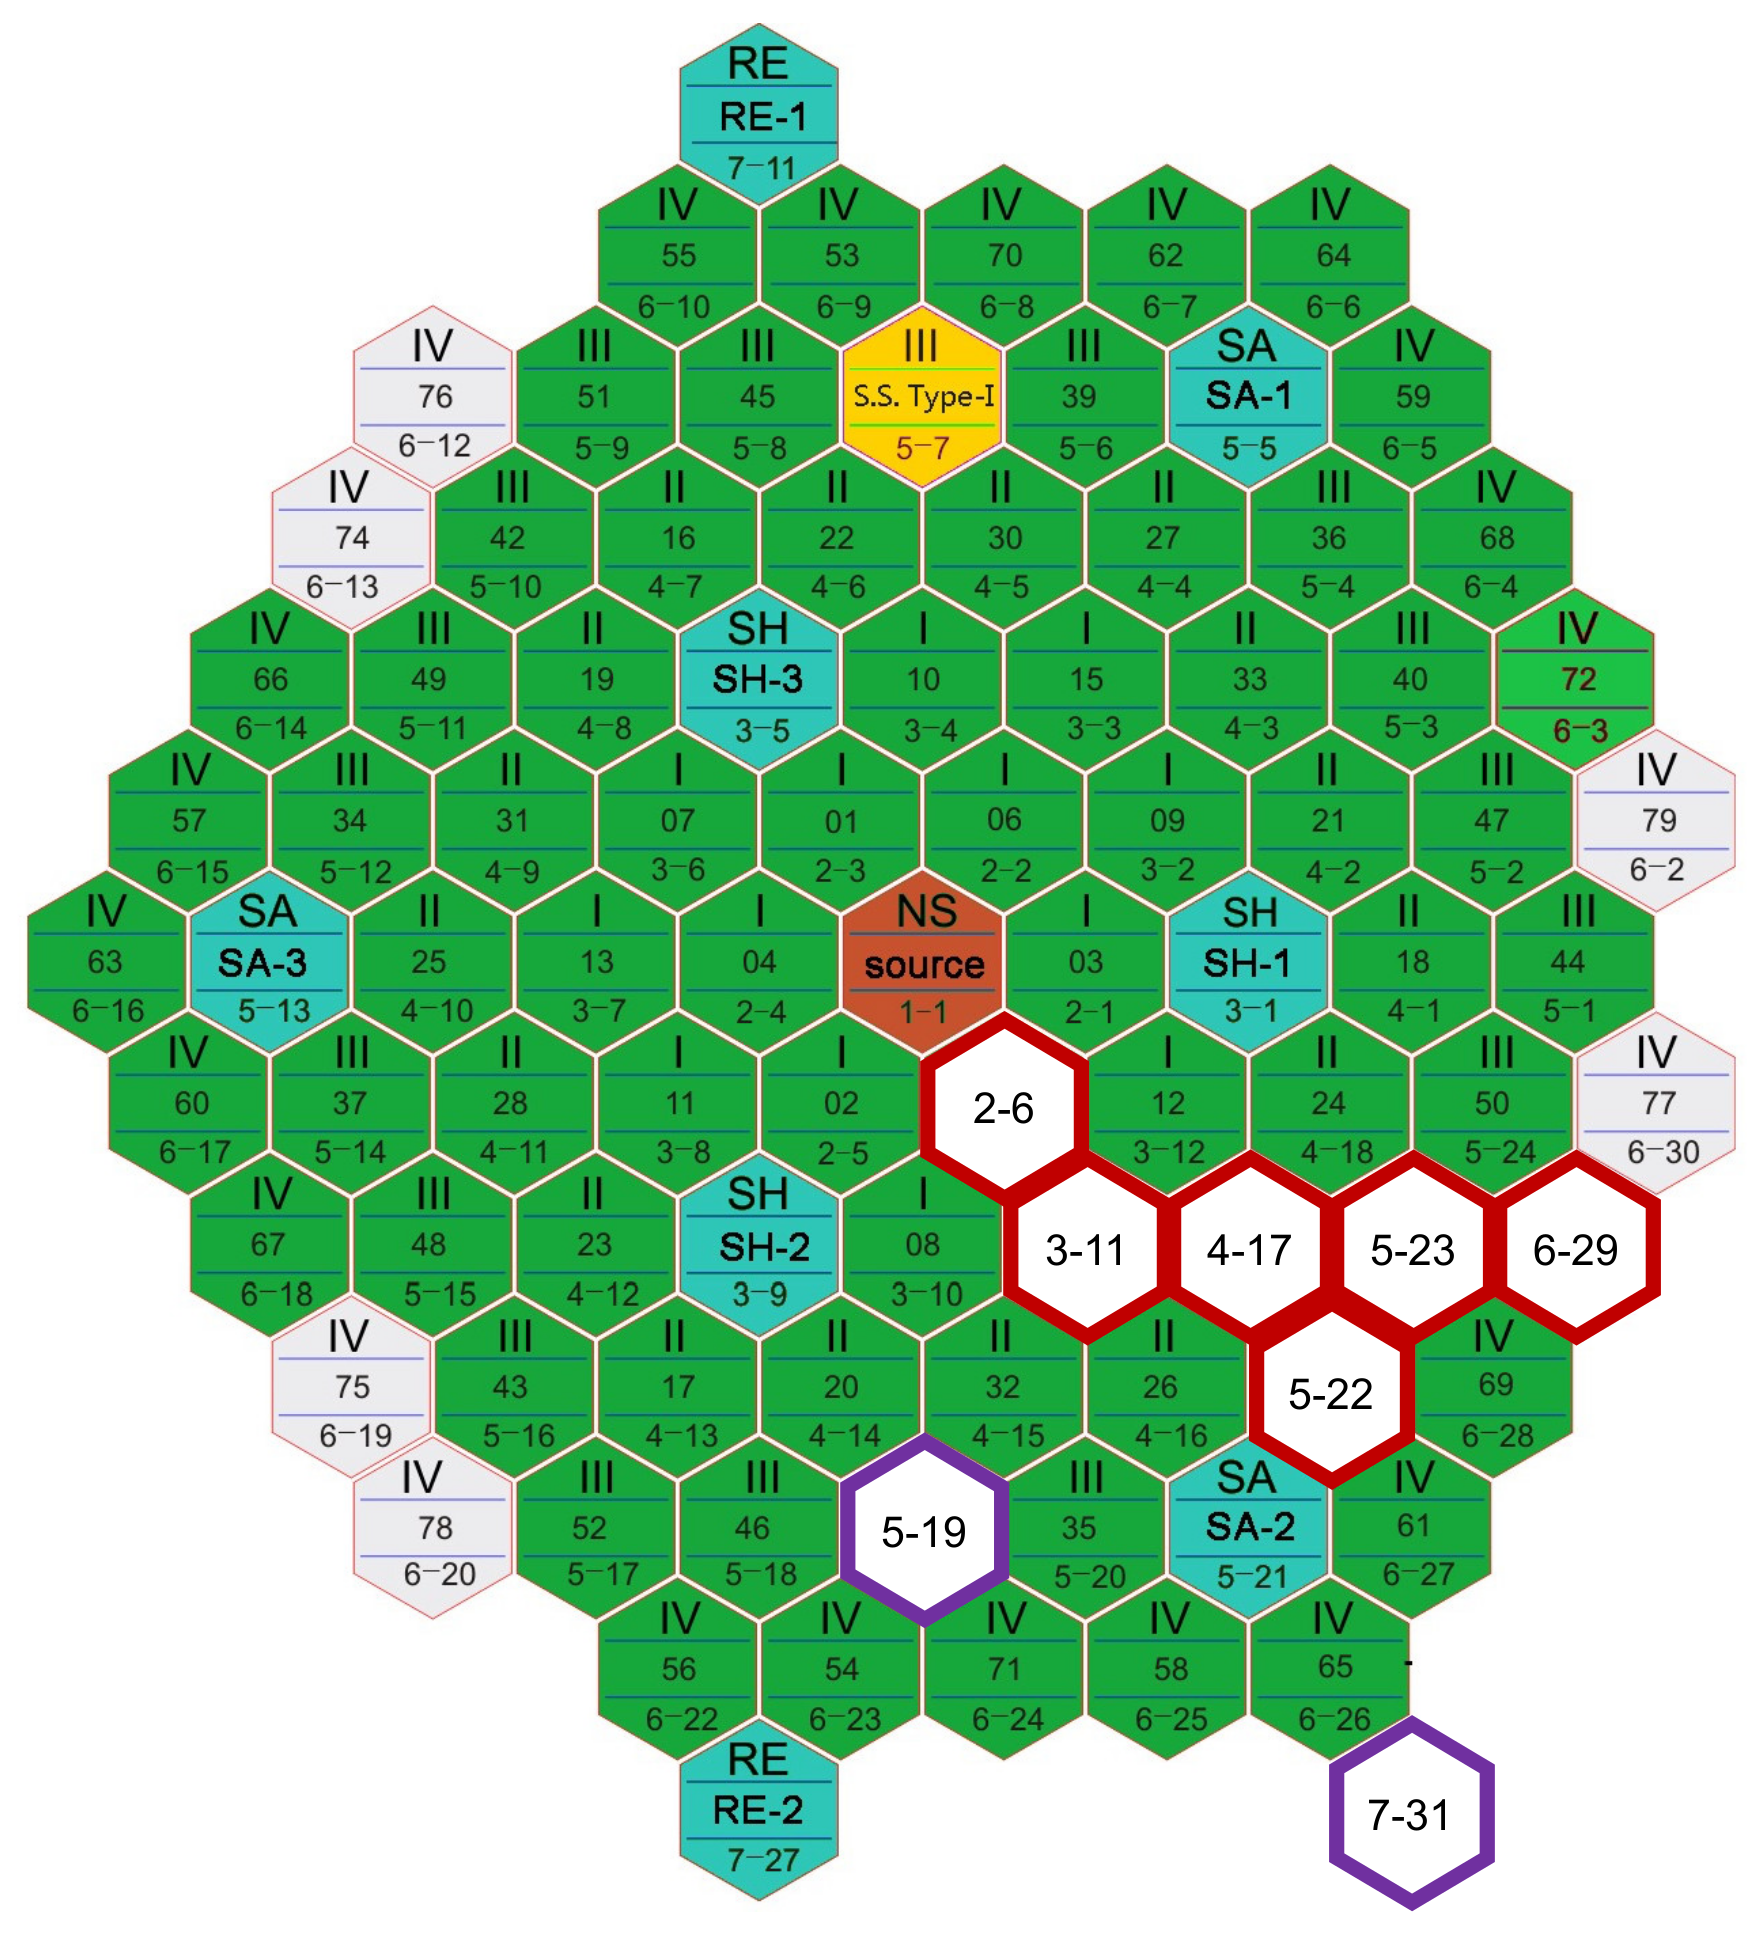
Eight positions were chosen for swap-reactivity measurements. Six fuel subassemblies and two type-I SS subassemblies, as depicted in Figure 15 and Table 8, were used to calculate the swap reactivity. Swap-reactivity measurements were performed in order to change the positions of the fuel and SS subassemblies. For the swap reactivity of the fuel subassembly, the fuel subassembly was replaced with the SS subassembly. In other words, the number of fuel subassemblies was reduced by one, and the number of SS subassemblies increased by one. For the SS subassembly swap reactivity, 78 fuel subassemblies were loaded before adding one fuel subassembly. The SA rods were at the out-of-core position, and the RE and SH rods moved to attain criticality. The measurement was performed in the core with 79 fuel subassemblies at 250 °C.
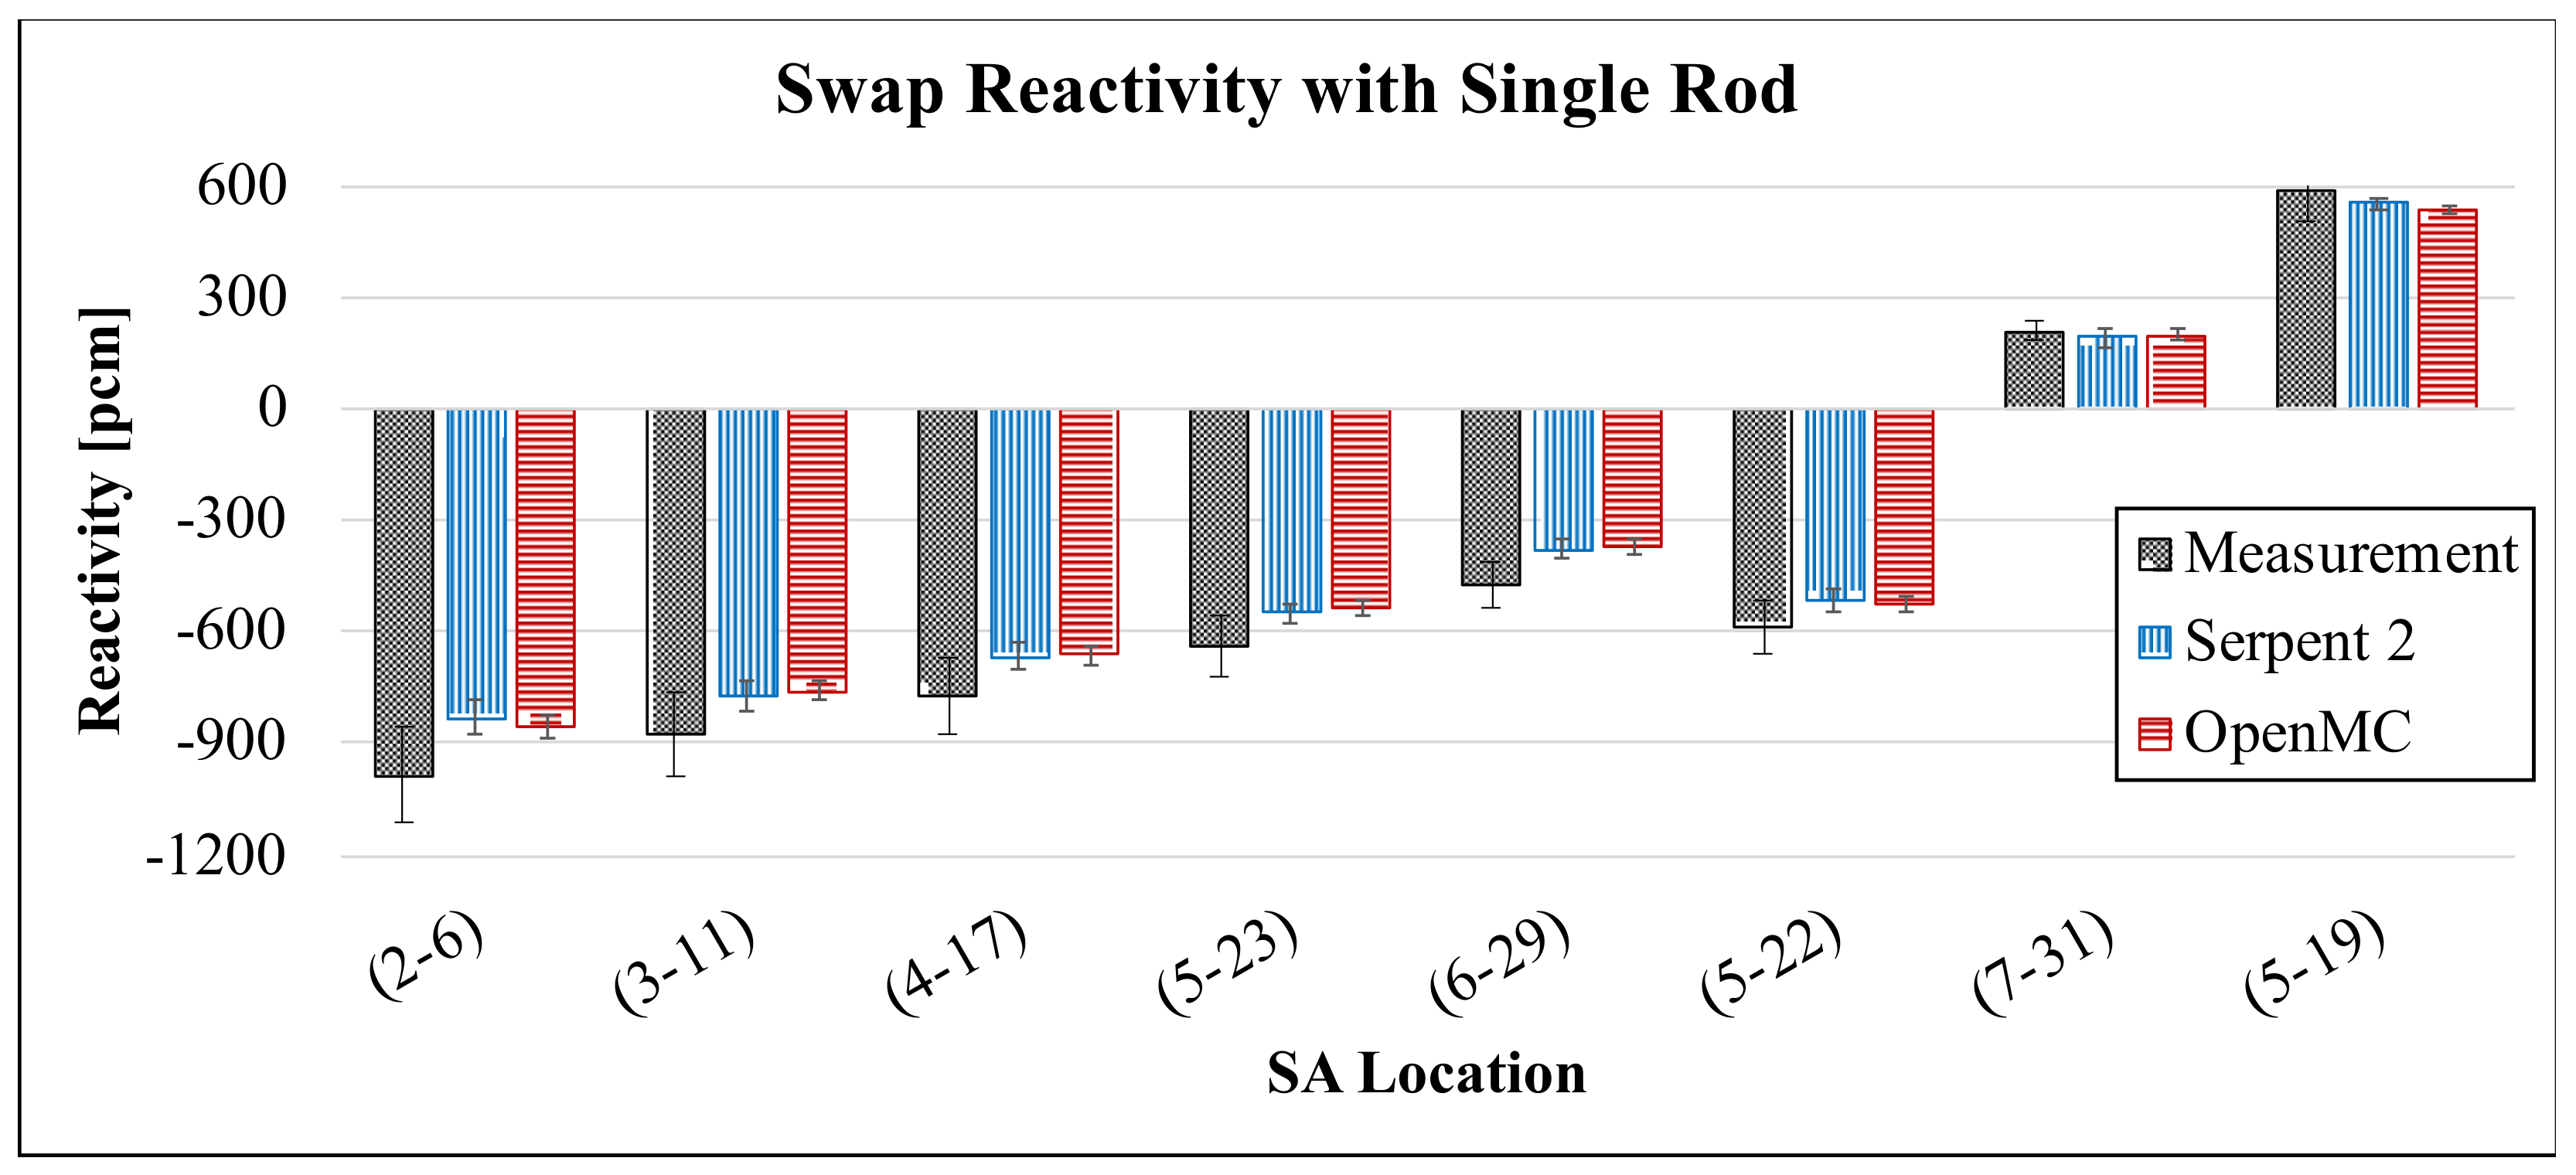
The swap reactivities were measured in two ways: with more than two control rods moving to reach the criticality of the core in the “multiple rod” case, and only one control rod moving in the “single rod” case. These results are compared and summarized in Table 9 and Table 10, respectively. The swap reactivities of the fuel subassemblies always caused negative reactivity due to the loss of fuel, whereas the swap reactivities of the SS subassemblies appeared positive due to the addition of one fuel subassembly. Furthermore, the closer the swapping is to the center of the core, the more negative the reactivity because the loss of fuel in the center region needs more reactivity compensation. The measurement of the SS subassembly swap reactivity involved adding one fuel subassembly from 78 fuel subassemblies; therefore, the swap reactivities were positive in both the (7–31) and (5–19) cases. In the other six cases, the absolute value of the fuel subassembly swap reactivity increased near the center. Therefore, loading the fuel subassembly outside the core can cause a lower excessive reactivity even though the same number of fuel SAs are used in the reactor core. Both the “multiple rods” and “single rod” results show the same trend, as depicted in Figure 16 and Figure 17, respectively. The underestimation of the shim rod worth leads to low calculation values for the swap reactivities because the movement of the shim rod is dominant in the swap-reactivity calculation. Nonetheless, the swap reactivity based on the measurement position is the same within 1σ for both the “multiple rods” and “single rod” cases.
5. Conclusions
As part of the IAEA’s CRP, the “neutronics benchmark of CEFR start-up tests,” the IAEA performed neutronics calculations using two different Monte Carlo codes: Serpent 2 and OpenMC. These codes use the same ENDF/B-VII.1 continuous-energy cross-section library, which is pre-generated at particular temperatures by NJOY2012. The objectives of modeling the CEFR core with two different MC codes are (1) to confirm whether there is any modeling error and (2) to minimize the geometry assumption of the heterogeneous core model. Five types of start-up tests were simulated and verified with measurement data: the evaluation of criticality, control-rod worth, void reactivity, temperature coefficient, and swap reactivity. In particular, the reactivity or coefficient was calculated with the control-rod worth and criticality in the same manner as the measurement procedure.
The evaluation of the core criticality with 72 fuel subassemblies indicates that the MC simulation underestimates the results by approximately 45 pcm. The criticality test solution indicates that modeling the core as a heterogeneous model applying thermal expansion using the ENDF/B-VII.1 library provides remarkable accuracy. The integral control-rod worth and S-curves were calculated for safety evaluation and coefficient calculation, respectively. The regulating rod worth was the least value because B4C uses boron with natural abundance, and rods were located mostly outside of the core. Because the other rods used enriched 10B as an absorber, the shim and safety rod worths were higher than those of the regulating rod worth; however, the values were different based on the position of rods in the core. The calculated S-curves also follow the trends of measurement data well. Most of the control-rod-worth results agree well with the measurements within 1σ. However, some results, such as the SH1 rod, agree within 2σ and are slightly underestimated. Because the reactivities of the start-up tests were calculated by control-rod movement and criticality, this underestimation can affect the calculation results. However, the results of all coefficients indicate a good agreement with the measurement results within 1σ.
Void reactivity always shows a negative value wherever a specific fuel subassembly is replaced by a fuel subassembly with a vacuum instead of sodium because the loss of coolant leads to neutron leakage. The temperature coefficient also possesses a negative value in the cold state (250–302 °C) owing to thermal expansion and changes in the sodium density. The swap reactivity of the fuel subassembly is negative and that of the SS subassembly is positive.
Serpent 2 and OpenMC results are the same within 1σ of standard deviation. All the simulation results make sense. Furthermore, they show significant agreement with the measurement data within 2σ of measurement uncertainty. As the number of histories increases when there is no need to limit the computation time, the uncertainty in the results can be decreased, making the analysis of results clearer. The ratio of calculated to experimental (C/E) values lies in the 0.87–1.12 range. Typically, the results were close to the C/E of 1.0. However, when the control rod moved significantly or the change in the reactivity itself was small, uncertainty increased and the C/E tended to move away from 1.0.
For future work, these results will be interpreted together with other institutions’ results and analyzed from various perspectives depending on cross-section libraries or methodologies, such as deterministic or stochastic.
Author Contributions
Conceptualization, J.C. and C.B.; formal analysis, J.C., C.B.; resources, V.K. and D.L.; writing—original draft preparation, J.C.; writing—review and editing, J.C. and C.B.; visualization, J.C.; supervision, V.K. and D.L.; project administration, C.B.; funding acquisition, D.L. All authors have read and agreed to the published version of the manuscript.
Funding
This research received no external funding.
Institutional Review Board Statement
Not applicable.
Informed Consent Statement
Not applicable.
Data Availability Statement
Not applicable.
Acknowledgments
The authors especially thank the China Institute of Atomic Energy for providing experimental data through the IAEA and Xingkai Huo from the China Institute of Atomic Energy for providing technical support to this project. The data and information presented in the paper are part of an ongoing IAEA coordinated research project on “Neutronics Benchmark of CEFR Start-Up Tests” (I31032).
Conflicts of Interest
The authors declare no conflict of interest.
References
- IAEA. Status of Fast Reactor Research and Technology Development; IAEA-TECDOC-1691; IAEA: Vienna, Austria, 2013. [Google Scholar]
- Bernnat, W.; Blanchet, D.; Brun, E.; Buiron, L.; Fridman, E.; Guilliard, N.; Keresztúri, A.; Kim, T.K.; Kozlowski, T.; Kudo, T.; et al. Benchmark for Neutronic Analysis of Sodium-Cooled Fast Reactor Cores with Various Fuel Types and Core Sizes; NEA-NSC-R--2015-9; Nuclear Energy Agency of the OECD (NEA): Paris, France, 2016. [Google Scholar]
- IAEA. E. IAEA CRP: Neutronics Benchmark of CEFR Start-Up Tests (I31032). Available online: https://iaea.org/projects/crp/i31032 (accessed on 15 November 2021).
- IAEA. Power Reactor Information System: CEFR. Available online: https://pris.iaea.org/PRIS/CountryStatistics/ReactorDetails.aspx?current=1047 (accessed on 15 November 2021).
- Leppänen, J.; Pusa, M.; Viitanen, T.; Valtavirta, V.; Kaltiaisenaho, T. The Serpent Monte Carlo code: Status, development and applications in 2013. Ann. Nucl. Energy 2015, 82, 142–150. [Google Scholar] [CrossRef]
- Romano, P.K.; Horelik, N.E.; Herman, B.R.; Nelson, A.G.; Forget, B.; Smith, K. OpenMC: A state-of-the-art Monte Carlo code for research and development. Ann. Nucl. Energy 2015, 82, 90–97. [Google Scholar] [CrossRef] [Green Version]
- Chadwick, M.B.; Herman, M.; Obložinský, P.; Dunn, M.; Danon, Y.; Kahler, A.; Smith, D.; Pritychenko, B.; Arbanas, G.; Arcilla, R.; et al. ENDF/B-VII.1 Nuclear Data for Science and Technology: Cross Sections, Covariances, Fission Product Yields and Decay Data. Nucl. Data Sheets 2011, 112, 2887–2996. [Google Scholar] [CrossRef]
- Tran, T.Q.; Choe, J.; Du, X.; Lee, H.; Lee, D. Neutronic simulation of China experimental fast reactor start-up tests–part II: MCS code Monte Carlo calculation, Ann. Nucl. Energy 2020, 148, 107710. [Google Scholar] [CrossRef]
- Huo, X.; Hu, Y.; Chen, X.; Xu, L.; Duan, T. Technical Specifications for Neutronics Benchmark of CEFR Start-Up Tests (CRP-I31032) V5.0; NCBI: Beijing, China, 2018. [Google Scholar]
- Forget, B.; Xu, S.; Smith, K. Direct Doppler broadening in Monte Carlo simulations using the multipole representation. Ann. Nucl. Energy 2014, 64, 78–85. [Google Scholar] [CrossRef] [Green Version]
- Viitanen, T. Implementing a Doppler-Preprocessor of Cross Section Libraries in Reactor Physics Code Serpent. Master’s Thesis, Helsinki University of Technology, Espoo, Finland, 2009. [Google Scholar]
- Josey, C.; Forget, B.; Smith, K. Windowed multipole sensitivity to target accuracy of the optimization procedure. J. Nucl. Sci. Technol. 2015, 52, 987–992. [Google Scholar] [CrossRef] [Green Version]
- Viitanen, T.; Leppänen, J. Target motion sampling temperature treatment technique with elevated basis cross-section temperatures. Nucl. Sci. Eng. 2014, 177, 77–89. [Google Scholar] [CrossRef]
- Yang, W.S. Fast Reactor Physics and Computational Methods. Nucl. Eng. Technol. 2012, 44, 177–198. [Google Scholar] [CrossRef] [Green Version]
- Stock, R. Encyclopedia of Nuclear Physics and Its Applications; John Wiley & Sons: Hoboken, NJ, USA, 2013; ISBN 978-3-527-40742-2. [Google Scholar]
Figure 1.
Cross-sectional views of 3D CEFR core of Serpent 2 (left) and OpenMC (right). XY-plane at the center view shows 79 fuel subassemblies surrounded by SS reflectors and B4C shielding. The boundary condition is given as void; thus, Serpent represents void boundary condition in black color. YZ and ZX planes at the center show axial configuration. All subassemblies have SS reflector at the bottom region.
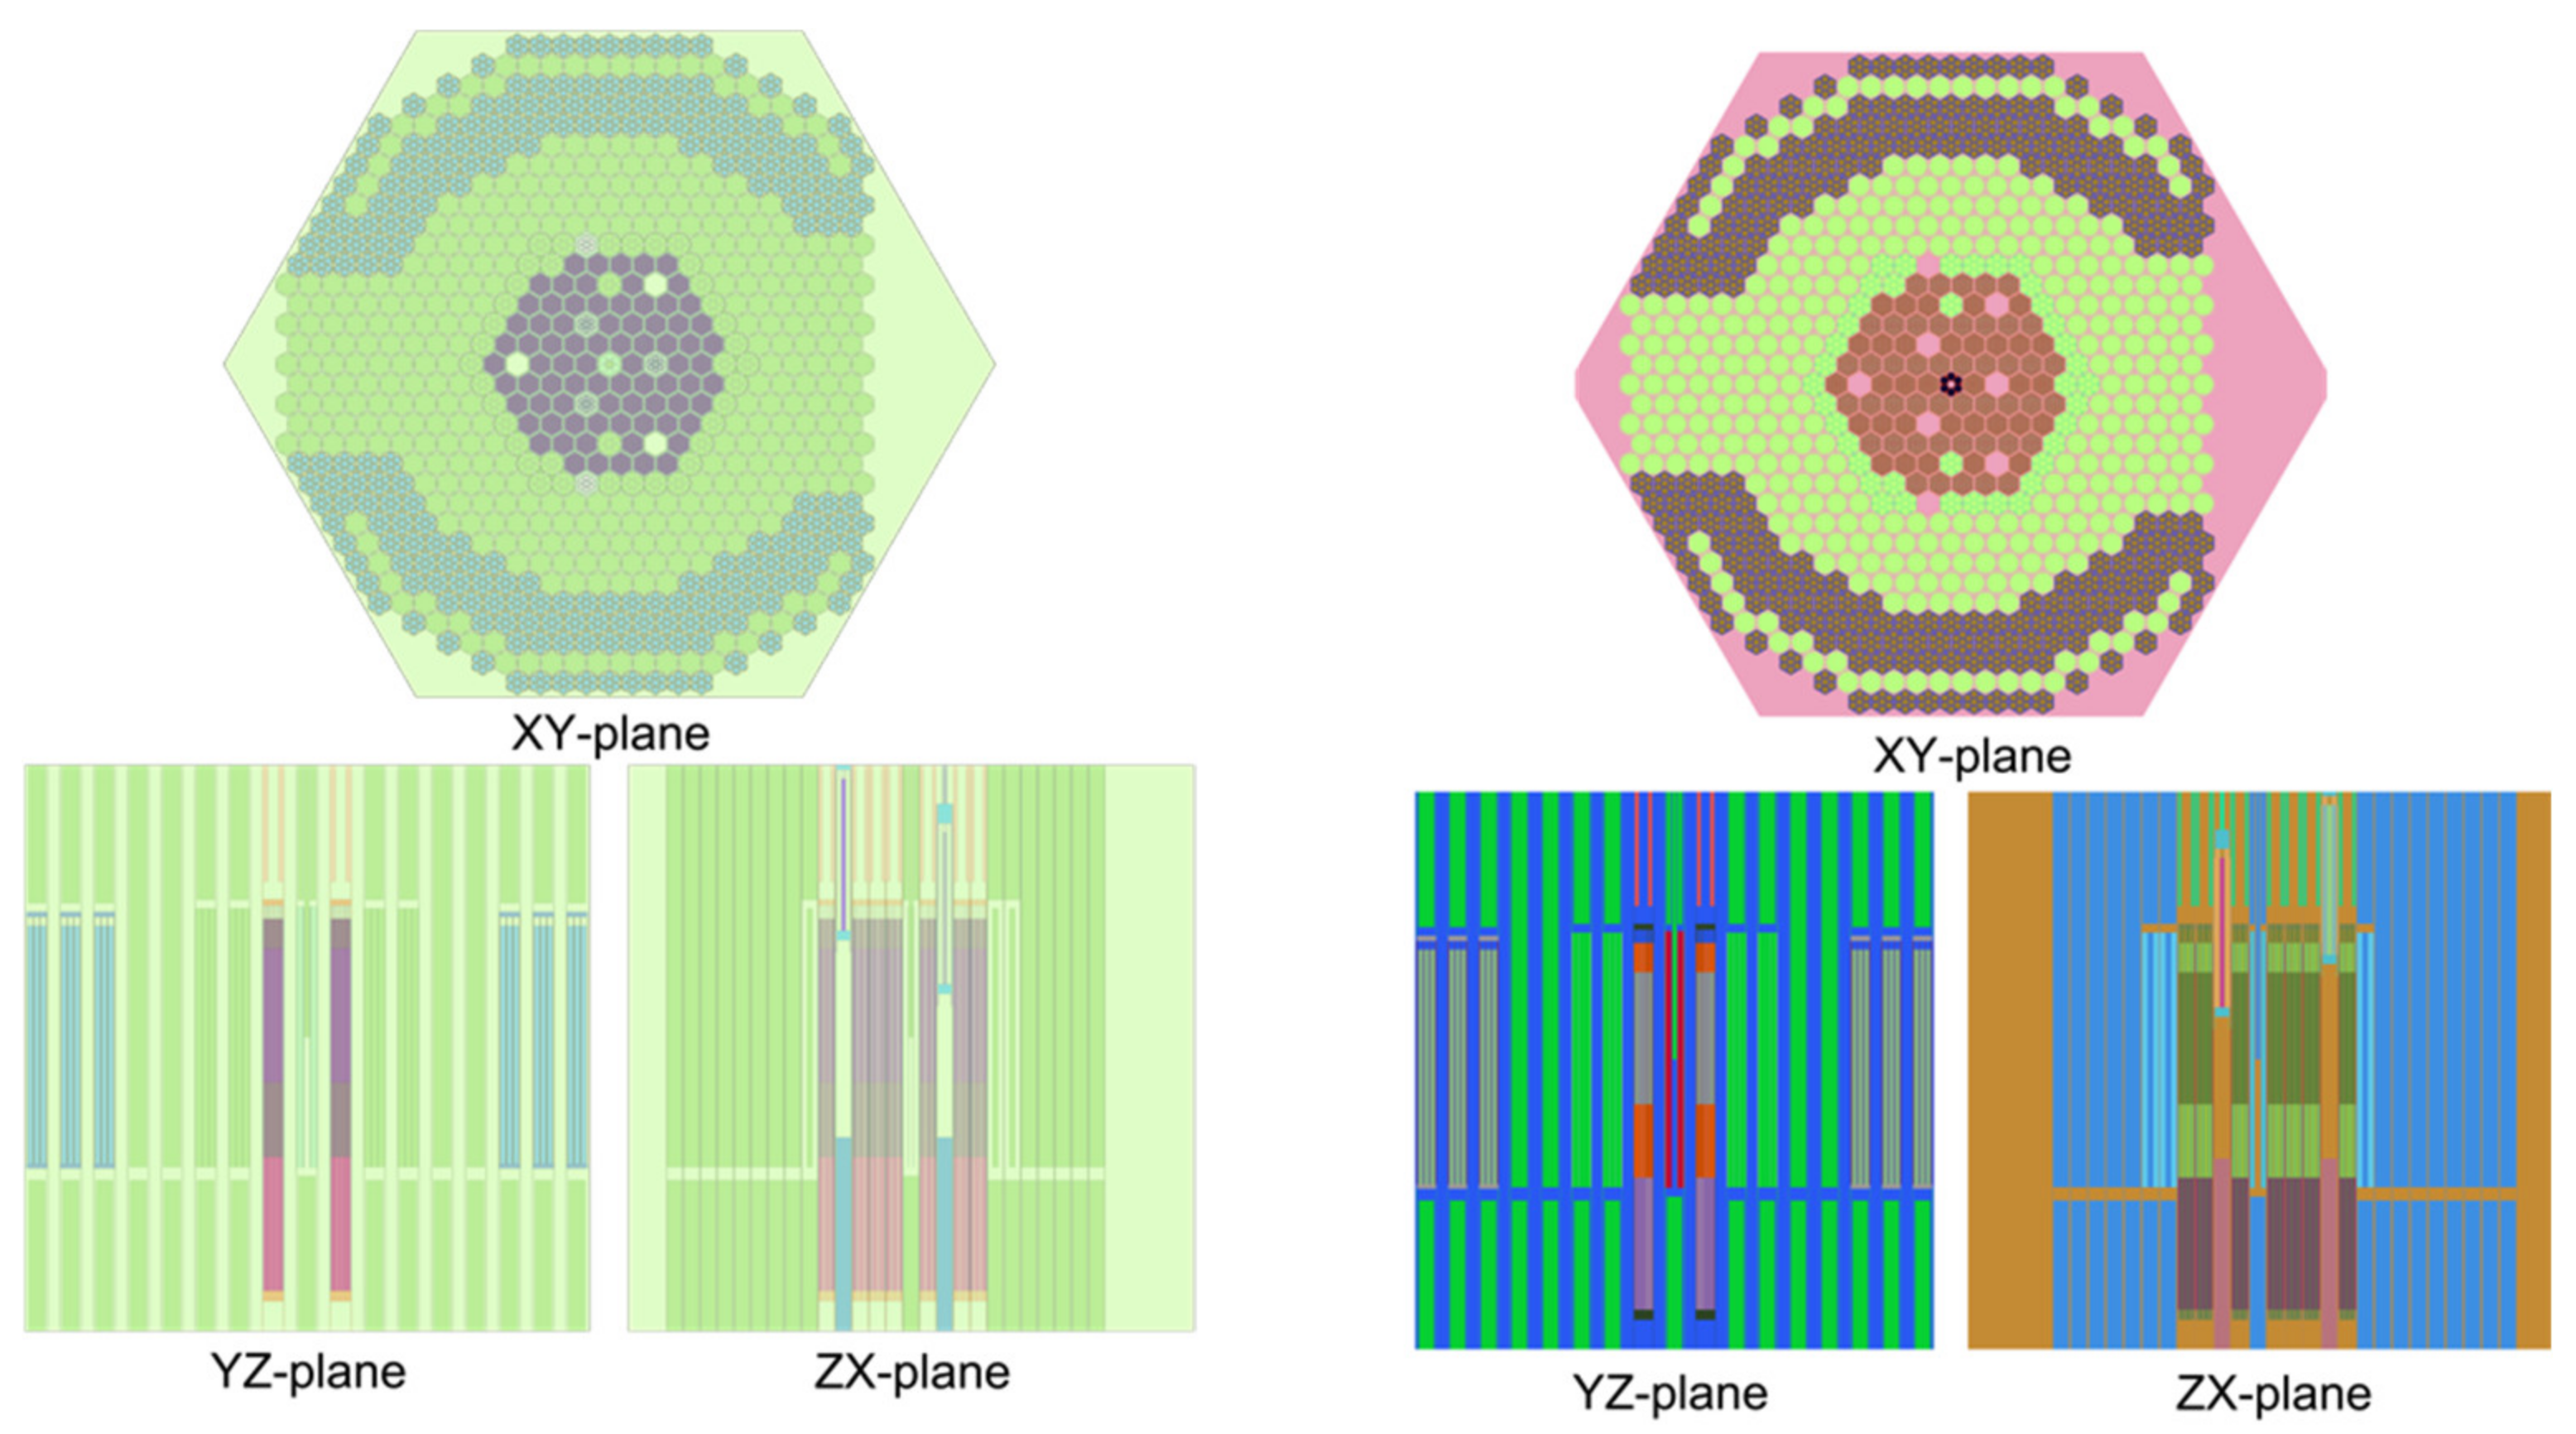
Figure 2.
Core-loading pattern with fuel subassemblies and mock-up fuel subassemblies. (Left: 71 fuel subassemblies and 8 mock-up fuel subassemblies; Right: 72 fuel subassemblies and 7 mock-up fuel subassemblies). Bright green colored positions are for fuel subassemblies. Colored positions with number I to IV are for fuel SAs. AZ, KC and PC are positions for control rods. IN is position for neutron source SA. C2 is for SS SA.

Figure 3.
Results of criticality.

Figure 4.
Comparisons of Control-Rod Worths. i.e., RE2 means regulating rod No. 2, and 2 × RE means two regulating rods; RE1 and RE2.
Figure 4.
Comparisons of Control-Rod Worths. i.e., RE2 means regulating rod No. 2, and 2 × RE means two regulating rods; RE1 and RE2.

Figure 5.
Normalized assembly power distribution of Serpent 2 at operation loading with control-rod positions of “2 × RE + 3 × SH + 3 × SA Before” (keff = 1.00192 ± 0.00006).
Figure 5.
Normalized assembly power distribution of Serpent 2 at operation loading with control-rod positions of “2 × RE + 3 × SH + 3 × SA Before” (keff = 1.00192 ± 0.00006).
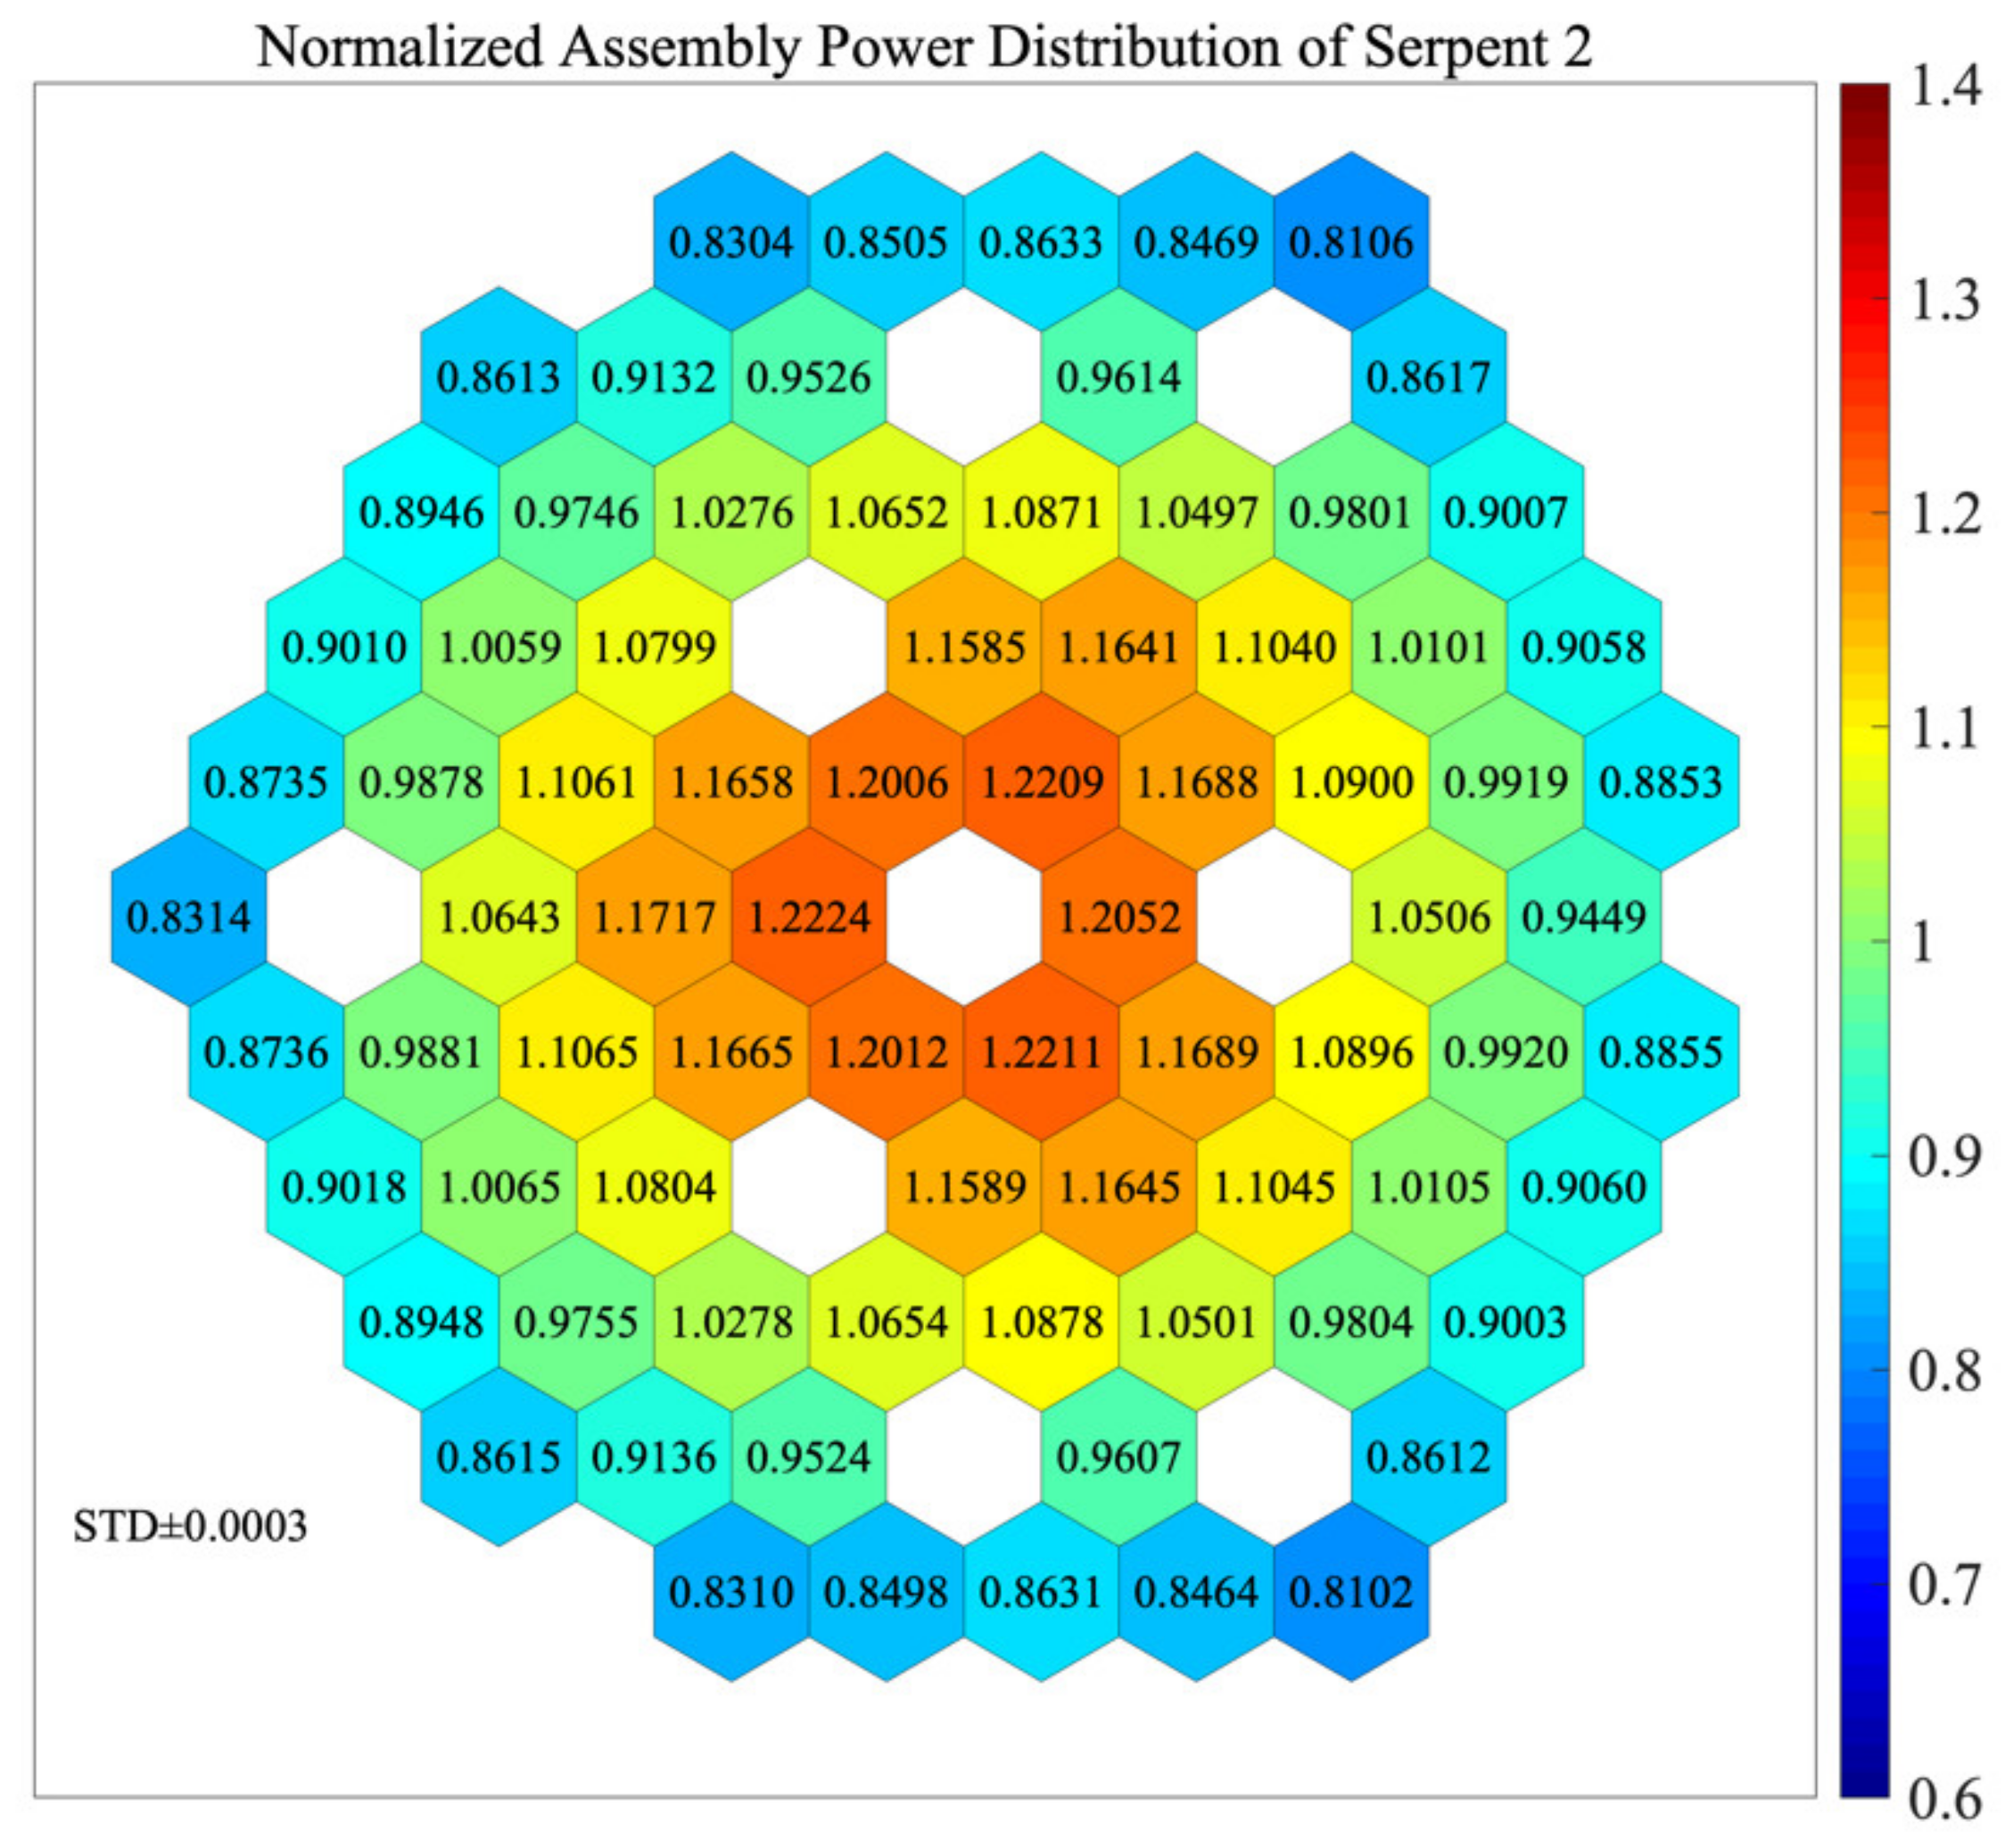
Figure 6.
Normalized assembly power distribution of OpenMC at operation loading with control-rod positions of “2 × RE + 3 × SH + 3 × SA Before” (keff = 1.00181 ± 0.00004).
Figure 6.
Normalized assembly power distribution of OpenMC at operation loading with control-rod positions of “2 × RE + 3 × SH + 3 × SA Before” (keff = 1.00181 ± 0.00004).
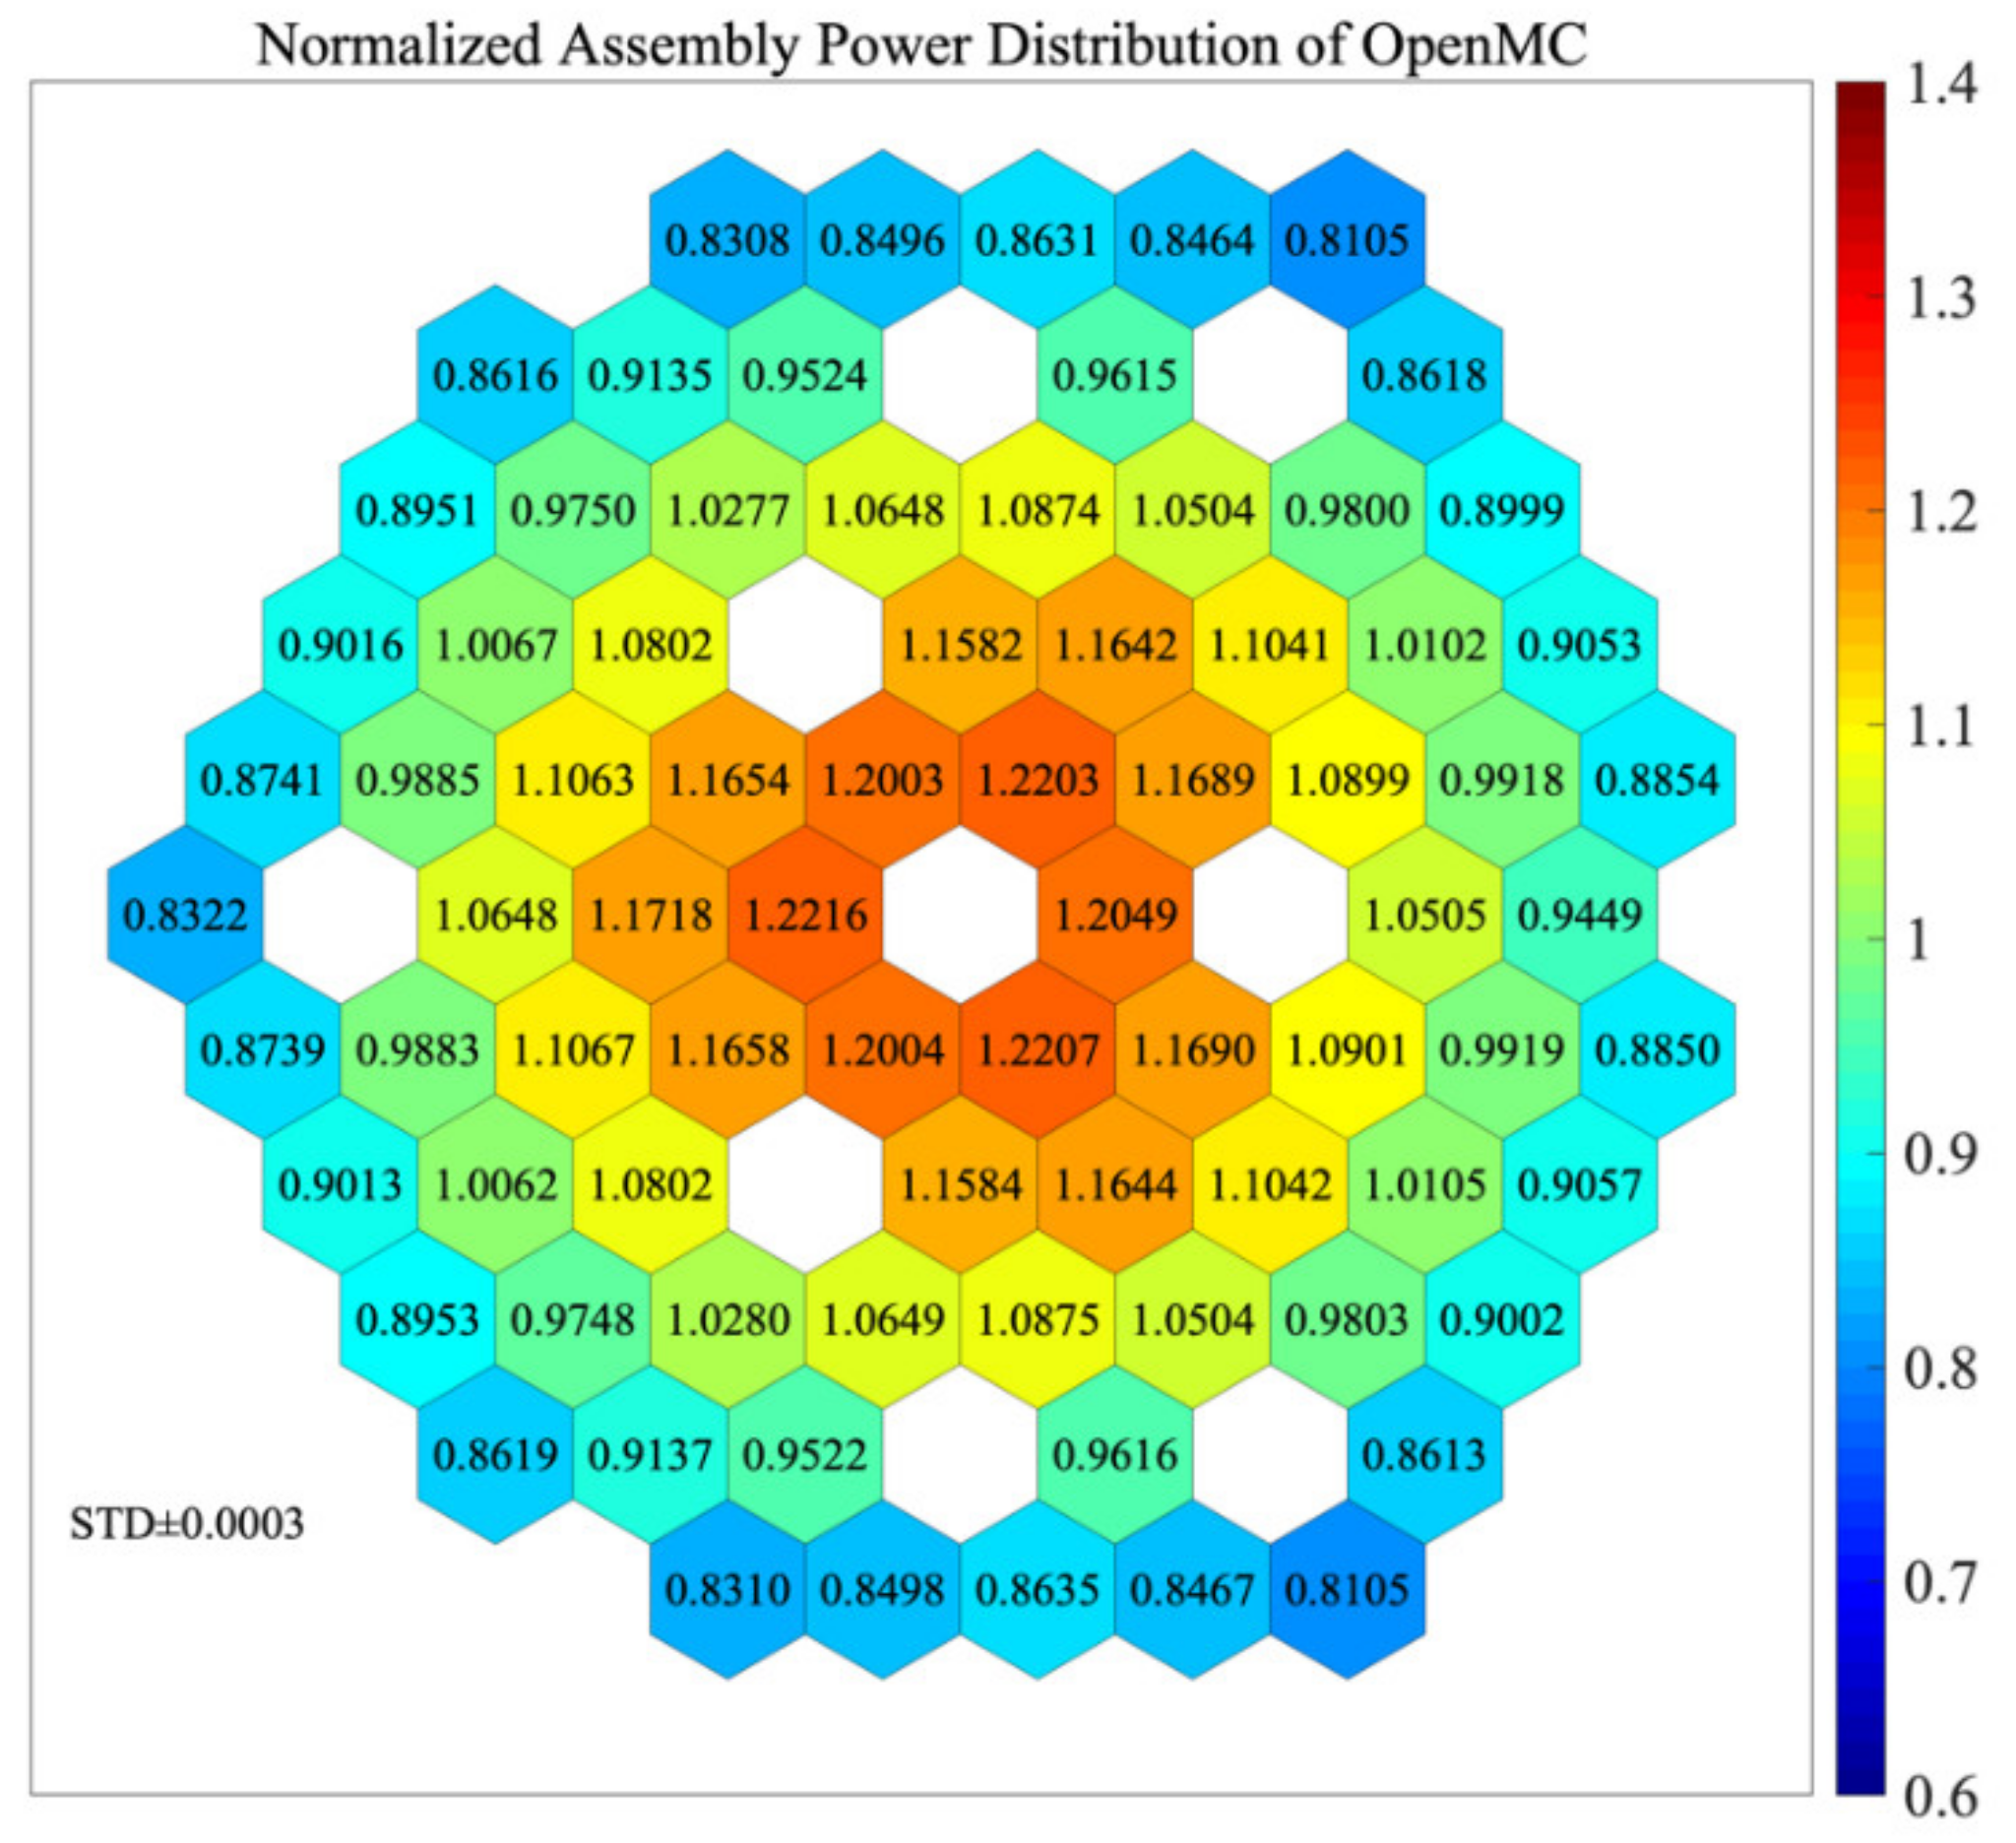
Figure 7.
Difference in assembly power at operation loading with control-rod positions of “2 × RE + 3 × SH + 3 × SA Before”.
Figure 7.
Difference in assembly power at operation loading with control-rod positions of “2 × RE + 3 × SH + 3 × SA Before”.

Figure 8.
Flux distribution comparison at operation loading with control-rod positions of “2 × RE + 3 × SH + 3 × SA Before”.
Figure 8.
Flux distribution comparison at operation loading with control-rod positions of “2 × RE + 3 × SH + 3 × SA Before”.
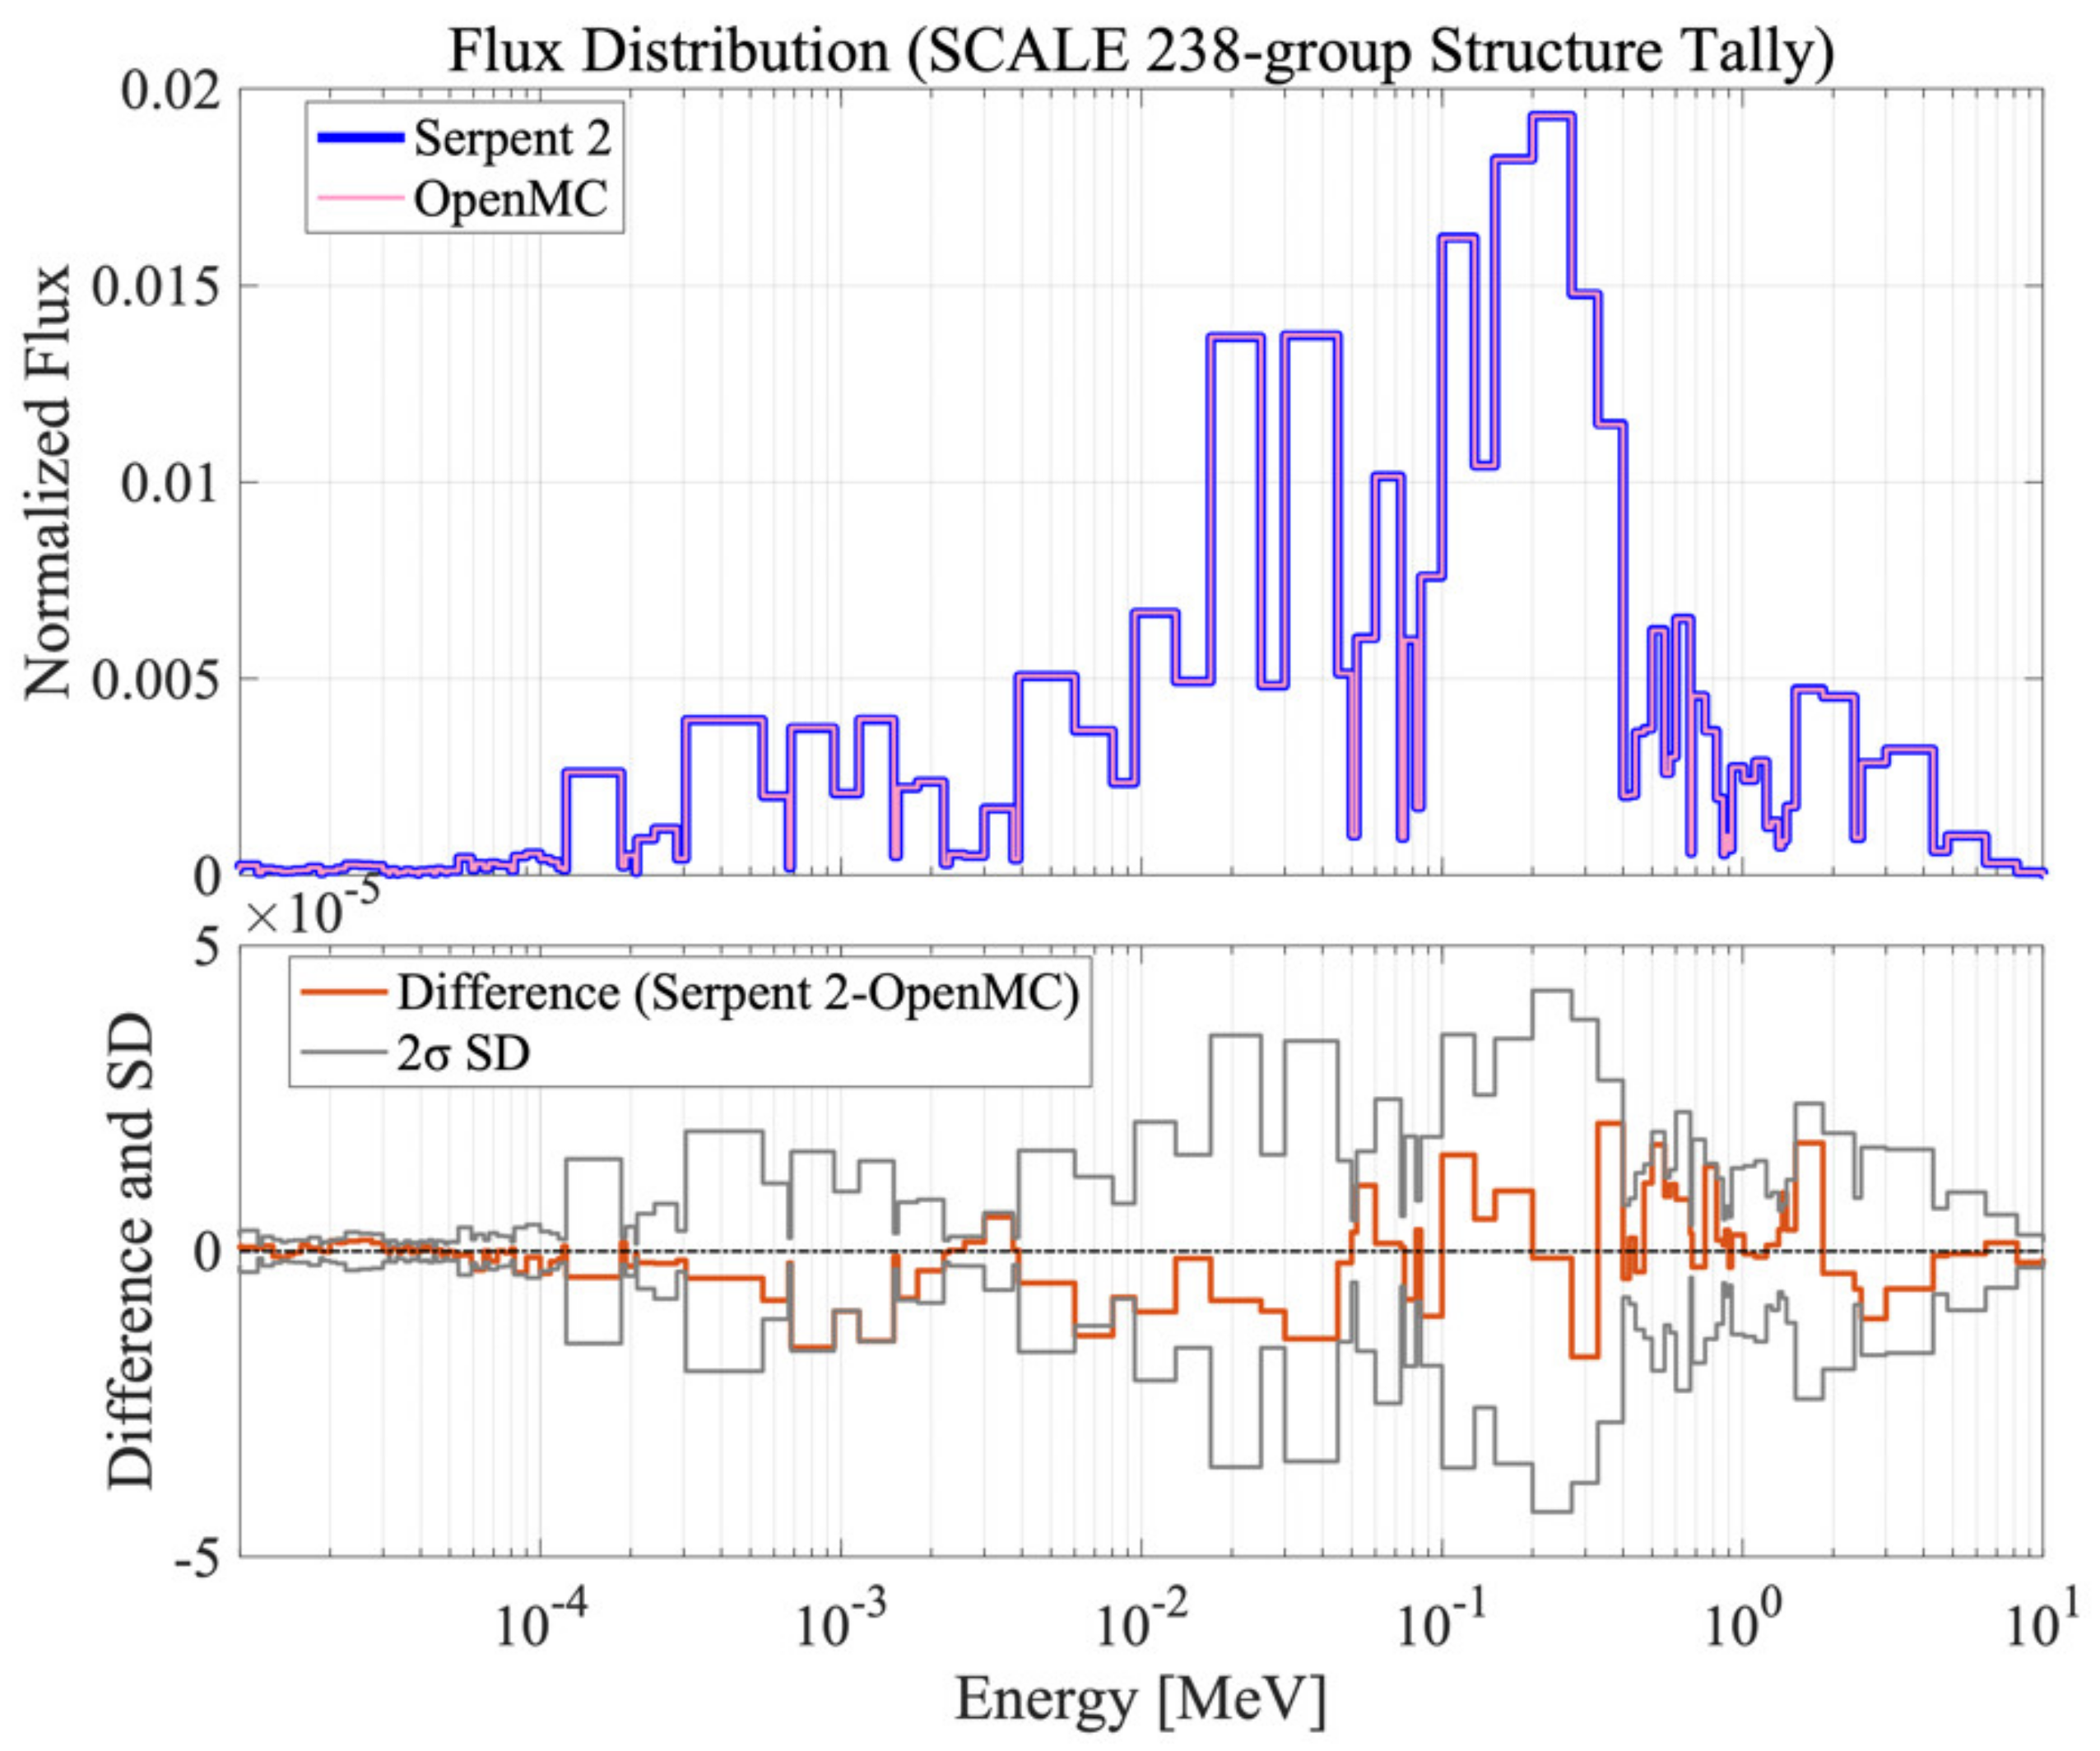
Figure 9.
S-curves of regulating rods (RE1, RE2) and shim rods (SH1, SH2, SH3). The standard of the bottom is the bottom of the fuel region.
Figure 9.
S-curves of regulating rods (RE1, RE2) and shim rods (SH1, SH2, SH3). The standard of the bottom is the bottom of the fuel region.

Figure 10.
Positions and Void FA Loading for Void Reactivity Measurement.

Figure 11.
Sodium-void worth.

Figure 12.
Sodium density as function of temperature.

Figure 13.
Reactivity change as function of temperature: increasing process and decreasing process.

Figure 14.
Results of temperature coefficients.
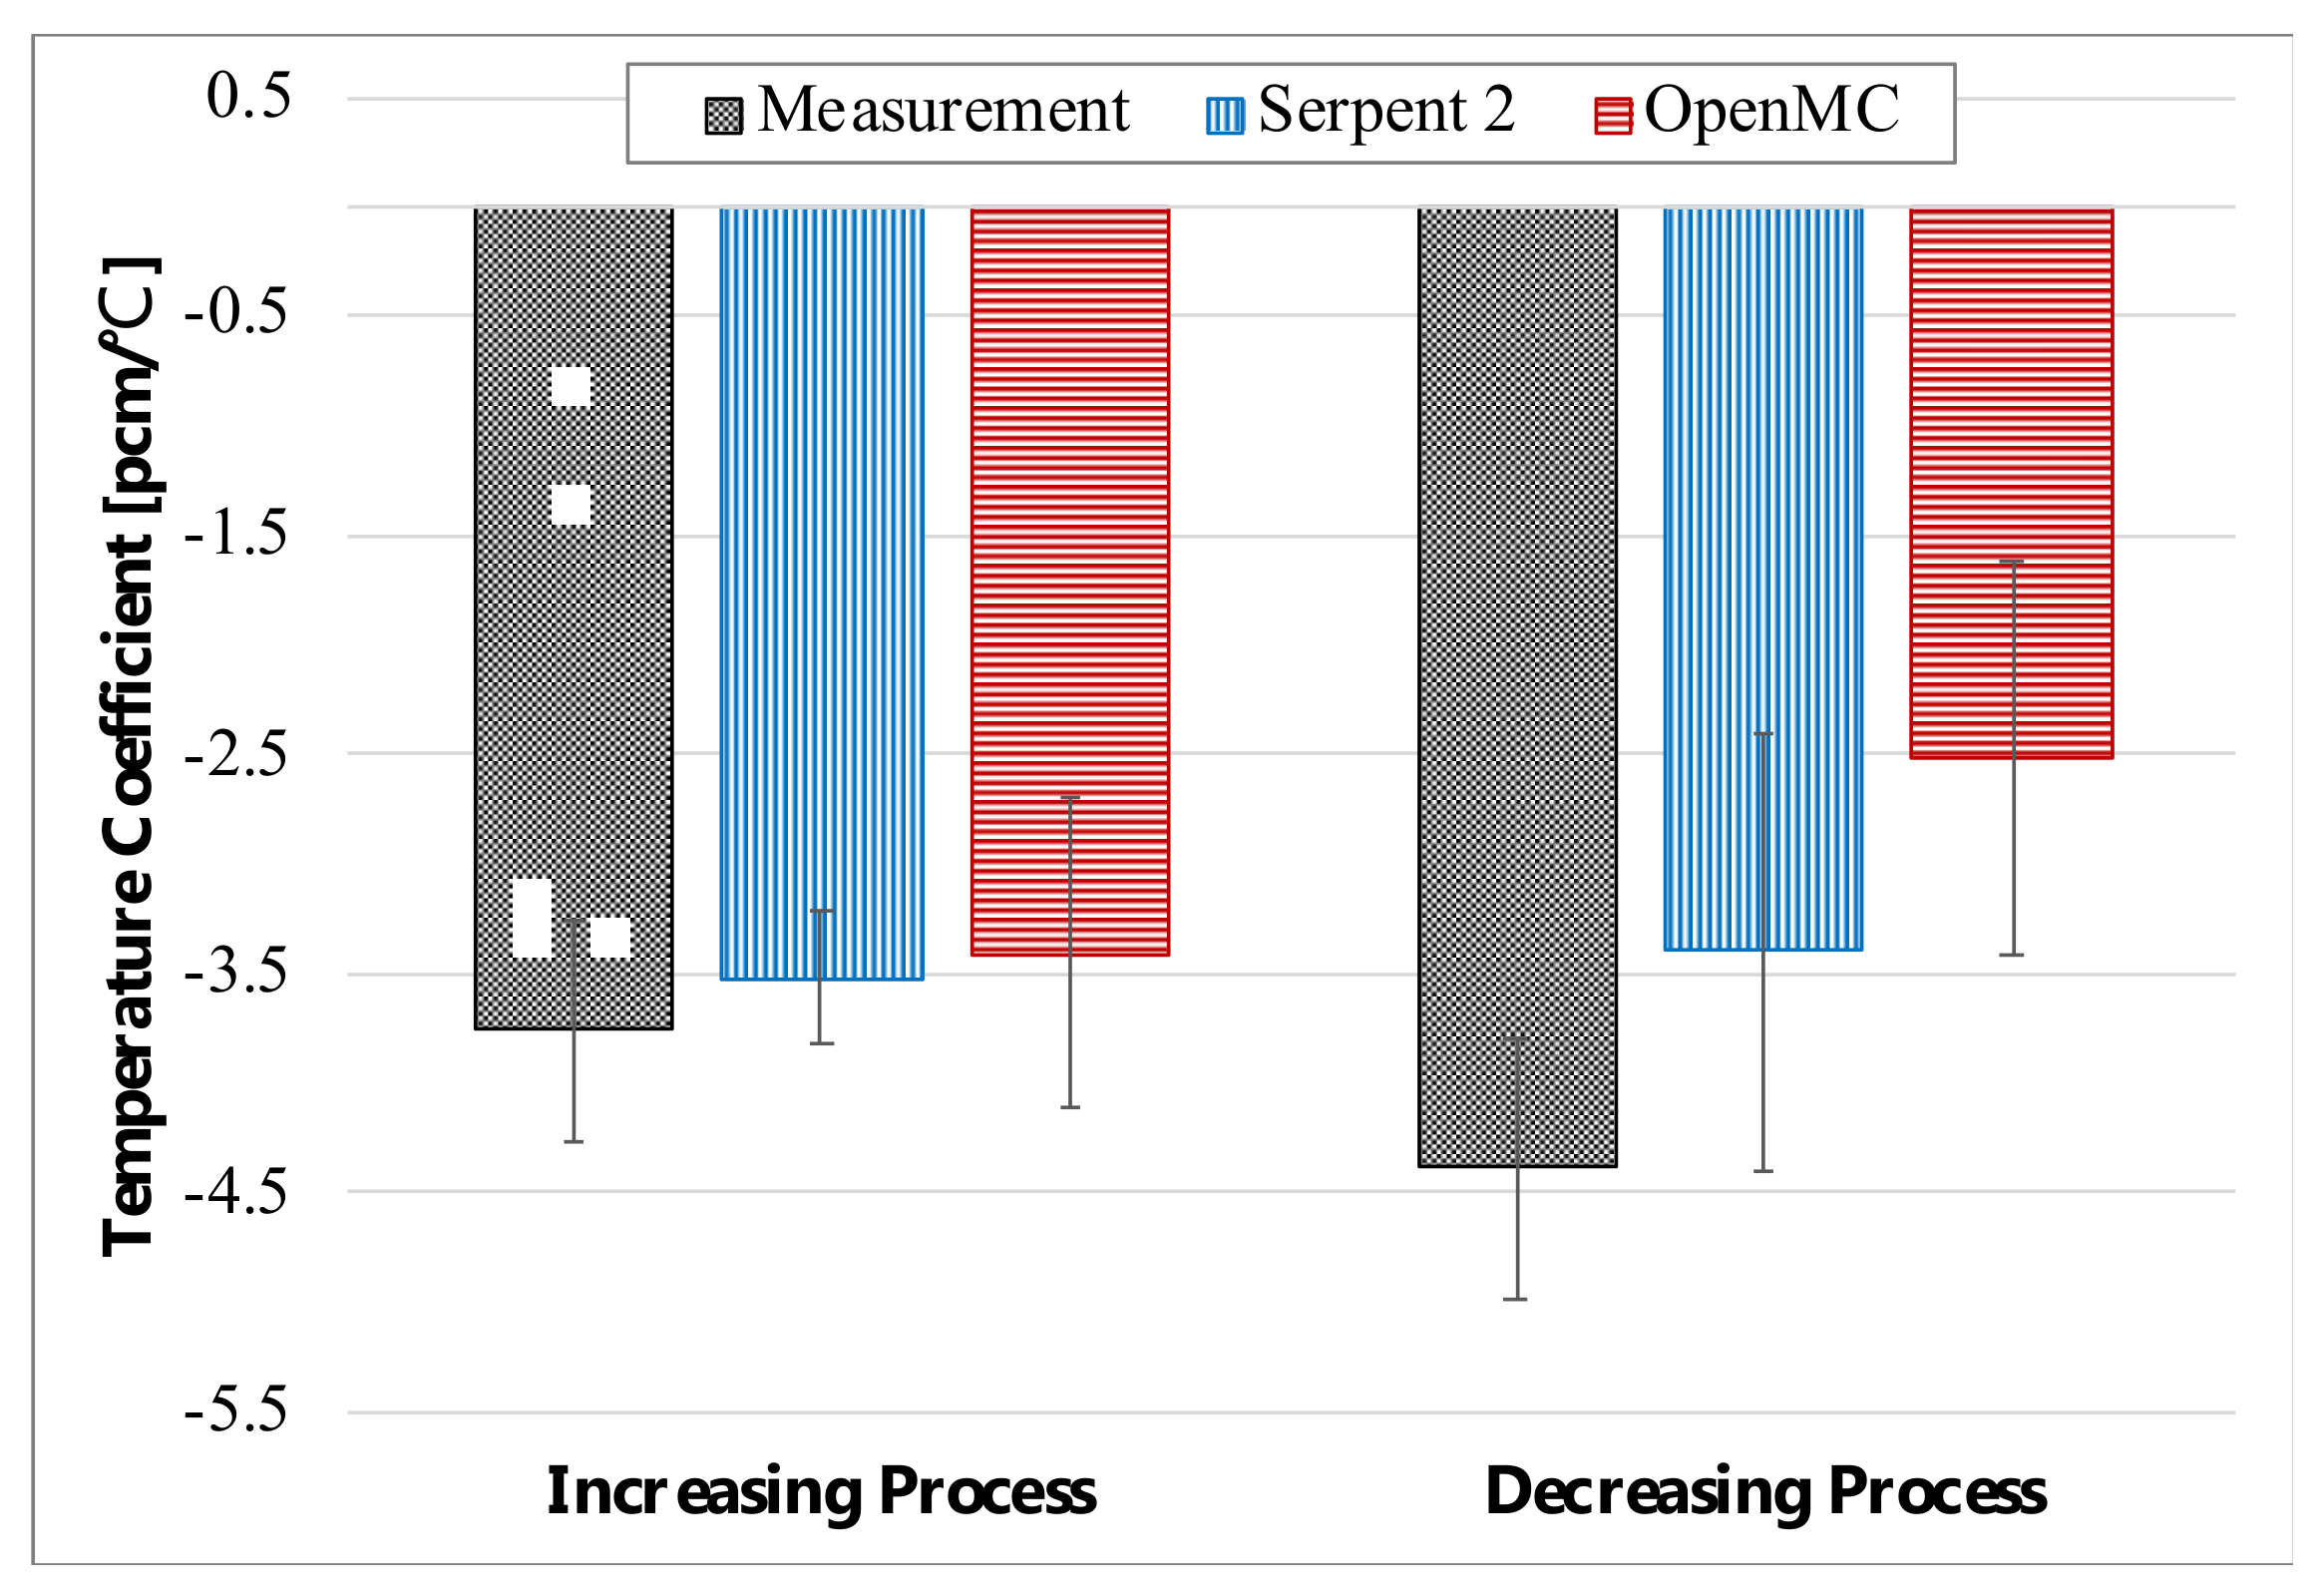
Figure 15.
Positions and subassembly loading for swap-reactivity measurement. (Red color: fuel subassemblies; Purple color: type-I SS subassemblies).
Figure 15.
Positions and subassembly loading for swap-reactivity measurement. (Red color: fuel subassemblies; Purple color: type-I SS subassemblies).

Figure 16.
Comparison of swap reactivity results: test case of multiple rods.
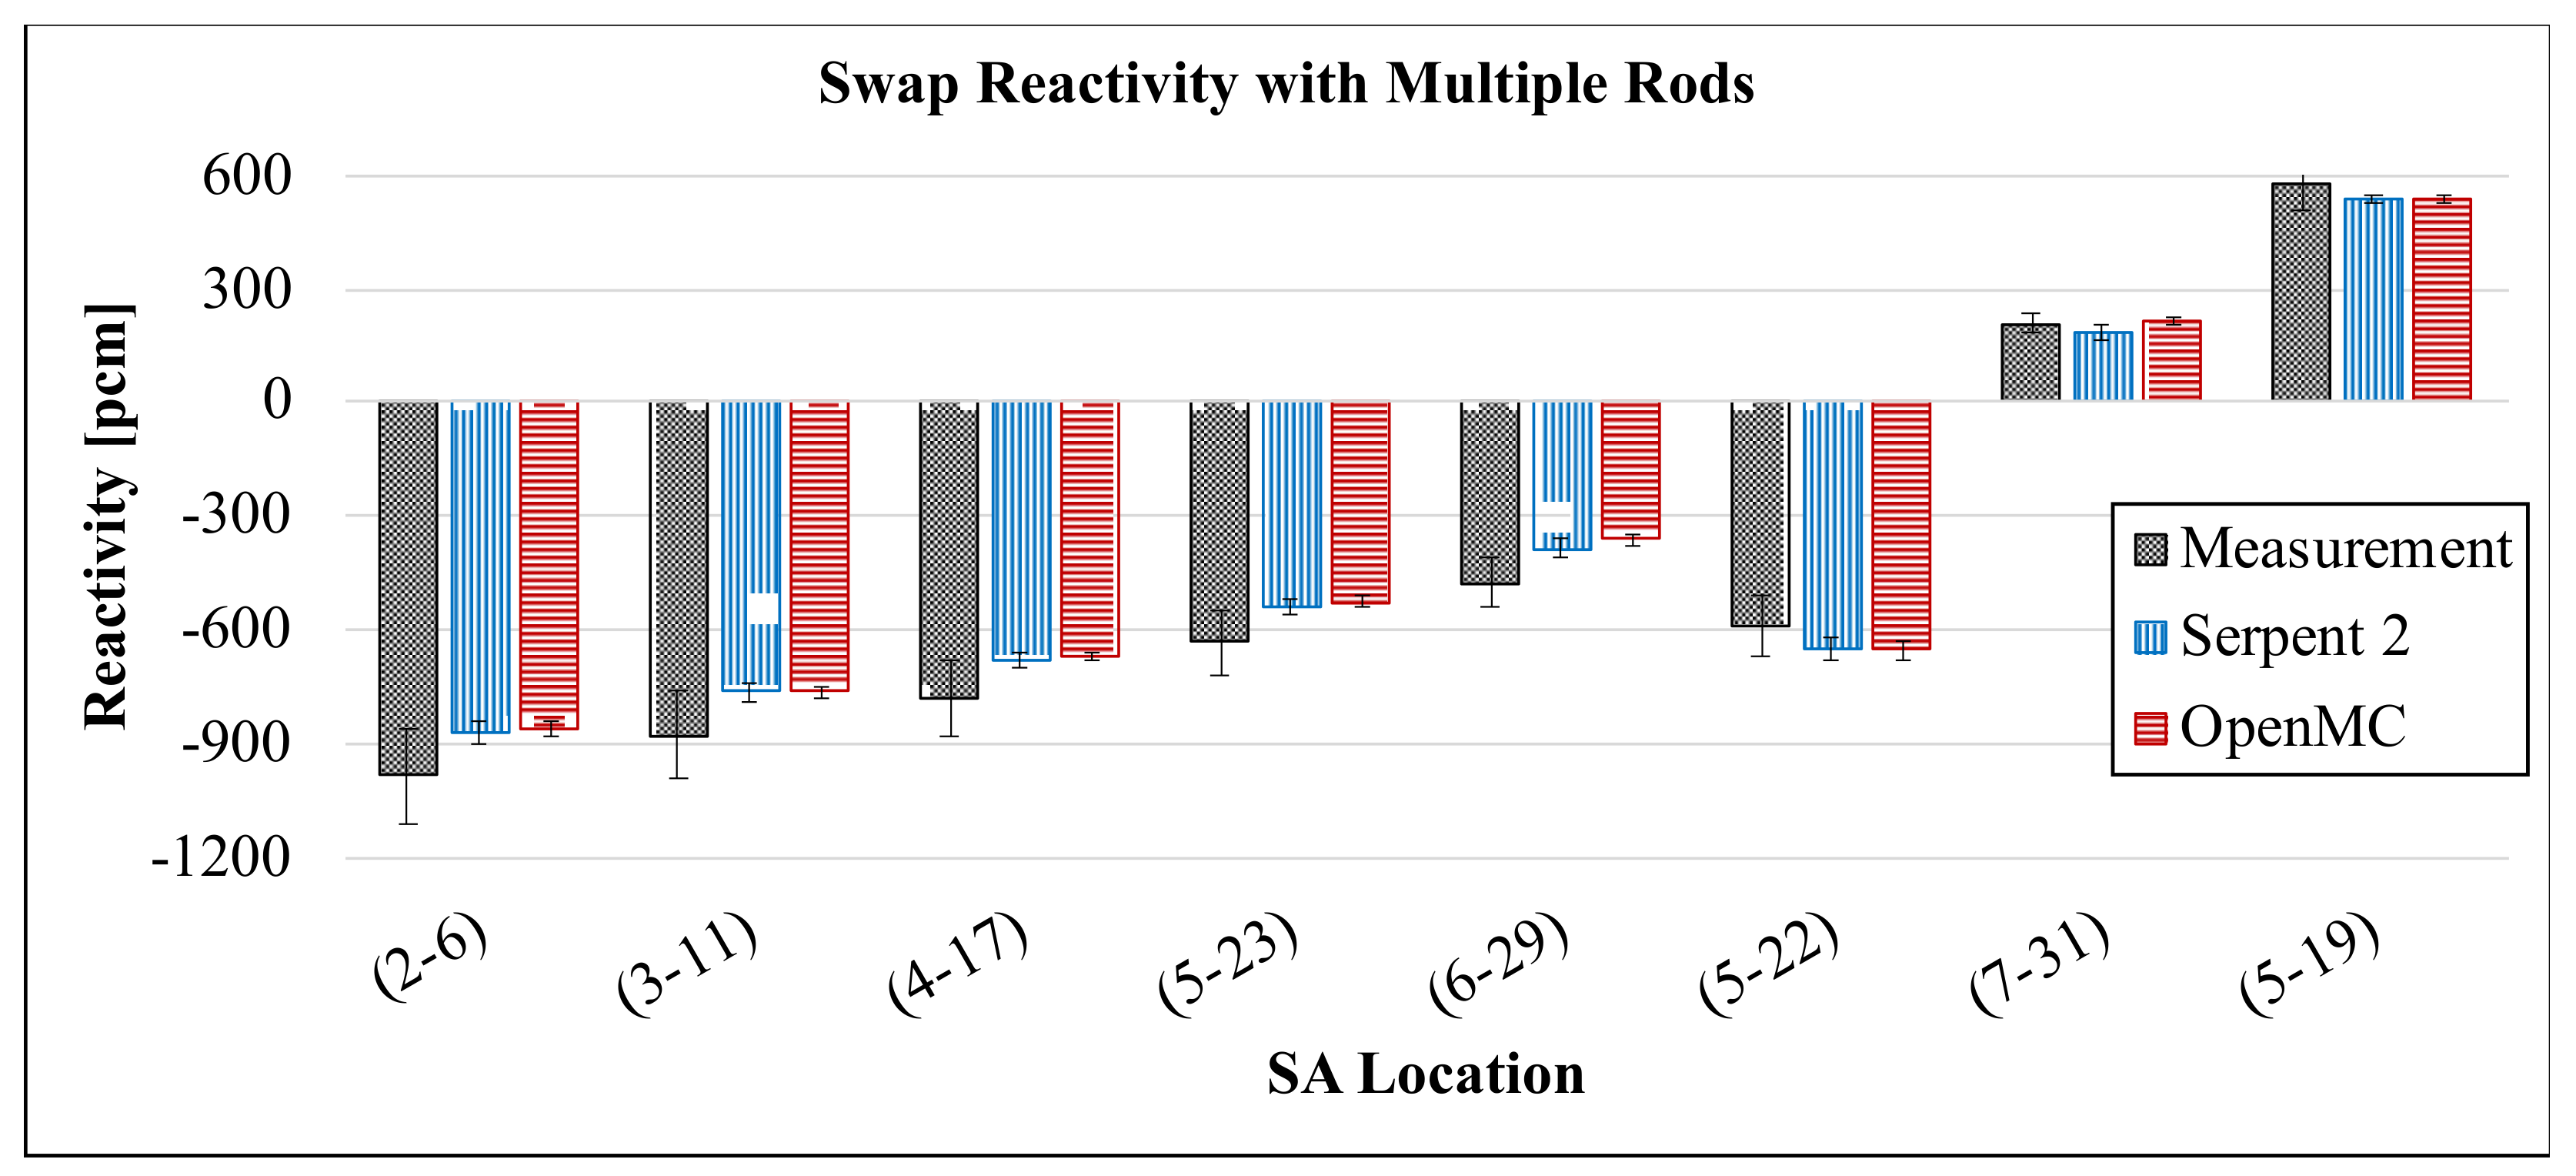
Figure 17.
Comparison of swap reactivity results: test case of single rod.

Table 1.
Thermal expansion coefficients of various materials [3].
Table 1.
Thermal expansion coefficients of various materials [3].
| Material | Linear Expansion Coefficient [1/°C] |
|---|---|
| Fuel | 1.10 × 10⁻⁵ |
| Blanket fuel | 1.00 × 10⁻⁵ |
| B4C | 4.20 × 10⁻⁶ |
| Stainless steel | 1.80 × 10⁻⁵ |
Table 2.
List of Start-up Test.
| Category | Experiment | Data Provided | Result Generated |
|---|---|---|---|
| Criticality | Fuel loading and first criticality | Y | Y |
| Criticality at cold state in operation loading | N | N | |
| Criticality at hot state in operation loading | N | N | |
| Measurement of starting point of nuclear heating | N | N | |
| Control-rod worth | Calibration at first criticality | N | N |
| Calibration at cold state in operation loading | Y | Y | |
| Calibration at hot state in operation loading | N | N | |
| Reactivity coefficients | Pressure coefficient | N | N |
| Flow-rate coefficient | N | N | |
| Sodium-void reactivity | Y | Y | |
| Rod-swap reactivity | Y | Y | |
| Temperature coefficient | Y | N | |
| Foil activation | Distribution of reaction rate | Y | N |
| Cross-section ratios | N | N | |
| Neutron spectrum | N | N | |
| Nuclear-power calibration | N | N |
Table 3.
Results of Criticality.
| No. of Fuel Subassemblies | RE2 [mm] | Core State | ρ(Δk/k) [pcm] | ||
|---|---|---|---|---|---|
| Measured | Serpent 2 | OpenMC | |||
| 71 | OOC 1 | Subcritical | N/A | −350 ± 6 | −367 ± 4 |
| 72 | 190 | Supercritical | 40 | −2 ± 6 | −11 ± 4 |
| 72 | 170 | Supercritical | 34 | −11 ± 6 | −21 ± 4 |
| 72 | 151 | Supercritical | 25 | −19 ± 6 | −25 ± 4 |
| 72 | 70 | Predicted critical | 0 | −39 ± 6 | −56 ± 4 |
1 OOC = Out-of-core; other rods except RE2 are OOC.
Table 4.
Results of Control-Rod Worth.
| Rod or Rod Group | Rod Worth (dk/kk’) [pcm] | ||
|---|---|---|---|
| Measurement | Serpent 2 | OpenMC | |
| RE1 | 150 ± 9 | 150 ± 8 | 132 ± 4 |
| RE2 | 149 ± 9 | 146 ± 8 | 150 ± 4 |
| SH1 | 2019 ± 250 | 1906 ± 8 | 1914 ± 5 |
| SH2 | 1839 ± 225 | 1854 ± 8 | 1861 ± 5 |
| SH3 | 1839 ± 226 | 1854 ± 8 | 1842 ± 5 |
| SA1 | 945 ± 100 | 897 ± 8 | 903 ± 6 |
| SA2 | 911 ± 100 | 879 ± 8 | 892 ± 4 |
| SA3 | 946 ± 98 | 961 ± 8 | 960 ± 4 |
| 3 × SH + 2 × RE | 2877 ± 335 | 3055 ± 8 | 3049 ± 4 |
| SH2 + SH3 + 2 × RE | 881 ± 76 | 989 ± 8 | 1002 ± 4 |
| 3 × SA | 2981 ± 395 | 2803 ± 8 | 2809 ± 6 |
| SA1 + SA2 | 1950 ± 226 | 1798 ± 8 | 1795 ± 5 |
| 2 × RE + 3 × SH + 3 × SA | 6079 ± 989 | 6042 ± 8 | 6055 ± 5 |
| 2 × RE + SH2 + SH3 + 3 × SA | 3899 ± 551 | 3914 ± 8 | 3927 ± 5 |
Table 5.
Fixed Control-Rod Positions at Void Worth Test.
| Control Rod | Rod Position [mm] | |
|---|---|---|
| Shim rods | SH1 | 239.3 |
| SH2 | 239.2 | |
| SH3 | 239.8 | |
| Safety rods | SA1 | 498.3 |
| SA2 | 499.8 | |
| SA3 | 499.1 | |
Table 6.
Results of void worth.
| Measurement Position in Core | Rod Positions | Temp. *** [°C] | Sodium-Void Worth [pcm] | ||||
|---|---|---|---|---|---|---|---|
| RE1 | RE2 | Measurement | Serpent 2 | OpenMC | |||
| (2–4) | O * | 277.6 | 277.3 | 248 | −39 ± 6 | −32 ± 22 | −41 ± 15 |
| V ** | 336.8 | 336.8 | 247 | ||||
| (3–7) | O | 278.0 | 277.4 | 248 | −43 ± 6 | −29 ± 22 | −52 ± 16 |
| V | 337.9 | 337.9 | N/A | ||||
| (4–9) | O | 277.7 | 277.6 | 248 | −41 ± 6 | −37 ± 22 | −36 ± 15 |
| V | 338.0 | 337.6 | N/A | ||||
| (5–11) | O | 278.4 | 276.2 | 248 | −40 ± 6 | −36 ± 22 | −46 ± 15 |
| V | 338.0 | 337.5 | N/A | ||||
| (6–13) | O | 302.9 | 303.3 | 248 | −33 ± 6 | −25 ± 16 | −41 ± 11 |
| V | 338.1 | 337.8 | N/A | ||||
* O = Original, ** V = Void. Replacing with a void fuel subassembly, *** The temperature during the experiment. Computations are performed with a fixed temperature at 250 °C as described in Section 2.1.
Table 7.
Results of temperature coefficient.
| Process | Rod Position [mm] | Temp. [°C] | Measurement | Serpent 2 | OpenMC | |||||||
|---|---|---|---|---|---|---|---|---|---|---|---|---|
| RE1 | RE2 | SH1 | SH2 | SH3 | Δρ [pcm] | Coef. [pcm/°C] | Δρ [pcm] | Coef. [pcm/°C] | Δρ [pcm] | Coef. [pcm/°C] | ||
| Increasing | 207 | 208 | 248 | 248 | 248 | 250 | 0 * | −3.8 ± 0.5 | 0 * | −3.5 ± 0.3 | 0 * | −3.4 ± 0.7 |
| 212 | 213 | 254 | 253 | 254 | 274 | −91 ± 13 | −75 ± 17 | −81 ± 12 | ||||
| 240 | 239 | 253 | 253 | 254 | 283 | −116 ± 16 | −135 ± 23 | −140 ± 17 | ||||
| 283 | 283 | 253 | 253 | 254 | 293 | −152 ± 20 | −131 ± 31 | −137 ± 22 | ||||
| 308 | 307 | 255 | 255 | 256 | 302 | −202 ± 27 | −189 ± 23 | −178 ± 15 | ||||
| Decreasing | 408 | 409 | 502 | 162 | 162 | 300 | 0 * | −4.4 ± 0.6 | 0* | −3.4 ± 1.0 | 0 * | −2.5 ± 0.9 |
| 283 | 284 | 254 | 254 | 254 | 290 | 45 ± 7 | 121 ± 161 | 85 ± 112 | ||||
| 285 | 285 | 502 | 162 | 162 | 280 | 81 ± 12 | 75 ± 107 | 34 ± 74 | ||||
| 232 | 232 | 502 | 162 | 162 | 270 | 129 ± 17 | 141 ± 34 | 86 ± 24 | ||||
| 119 | 119 | 502 | 162 | 163 | 250 | 220 ± 29 | 196 ± 61 | 146 ± 43 | ||||
* Starting point.
Table 8.
Subassembly positions for swap reactivity test.
| Position | Type of Subassembly Loaded after Swap | |||||||
|---|---|---|---|---|---|---|---|---|
| (2–06) | (3–11) | (4–17) | (5–23) | (6–29) | (5–22) | (7–31) | (5–19) | |
| (2–06) | SS | Fuel | Fuel | Fuel | Fuel | Fuel | SS | SS |
| (3–11) | Fuel | SS | Fuel | Fuel | Fuel | Fuel | SS | SS |
| (4–17) | Fuel | Fuel | SS | Fuel | Fuel | Fuel | SS | SS |
| (5–23) | Fuel | Fuel | Fuel | SS | Fuel | Fuel | SS | SS |
| (6–29) | Fuel | Fuel | Fuel | Fuel | SS | Fuel | SS | SS |
| (5–22) | Fuel | Fuel | Fuel | Fuel | Fuel | SS | SS | SS |
| (7–31) | Fuel | Fuel | Fuel | Fuel | SS | Fuel | Fuel | SS |
| (5–19) | Fuel | Fuel | Fuel | SS | Fuel | Fuel | SS | Fuel |
Table 9.
Results of swap reactivity with multiple rods.
| Subassembly Position | Temp. [°C] | Swap Reactivity [pcm] | ||
|---|---|---|---|---|
| Measurement | Serpent 2 | OpenMC | ||
| (2–06) | 246 | −986 ± 128 | −871 ± 30 | −859 ± 20 |
| (3–11) | 246 | −880 ± 114 | −763 ± 23 | −765 ± 15 |
| (4–17) | 246 | −777 ± 101 | −678 ± 21 | −670 ± 15 |
| (5–23) | 246 | −634 ± 82 | −536 ± 20 | −525 ± 14 |
| (6–29) | 246 | −474 ± 62 | −384 ± 25 | −363 ± 17 |
| (5–22) | 246 | −590 ± 77 | −650 ± 32 | −654 ± 22 |
| (7–31) | 246 | 210 ± 27 | 188 ± 19 | 216 ± 13 |
| (5–19) | 246 | 582 ± 76 | 536 ± 12 | 538 ± 9 |
Table 10.
Results of swap reactivity with single rod.
| Subassembly Position | Temp. [°C] | Swap Reactivity [pcm] | ||
|---|---|---|---|---|
| Measurement | Serpent 2 | OpenMC | ||
| (2–06) | 246 | −984 ± 128 | −832 ± 44 | −856 ± 31 |
| (3–11) | 246 | −880 ± 114 | −763 ± 23 | −765 ± 15 |
| (4–17) | 246 | −875 ± 114 | −771 ± 38 | −757 ± 26 |
| (5–23) | 246 | −634 ± 82 | −536 ± 20 | −525 ± 14 |
| (6–29) | 246 | −772 ± 100 | −664 ± 34 | −662 ± 23 |
| (5–22) | 246 | −590 ± 77 | −650 ± 32 | −654 ± 22 |
| (7–31) | 246 | −639 ± 83 | −548 ± 27 | −537 ± 19 |
| (5–19) | 246 | 582 ± 76 | 536 ± 12 | 538 ± 9 |
Publisher’s Note: MDPI stays neutral with regard to jurisdictional claims in published maps and institutional affiliations. |
© 2022 by the authors. Licensee MDPI, Basel, Switzerland. This article is an open access article distributed under the terms and conditions of the Creative Commons Attribution (CC BY) license (https://creativecommons.org/licenses/by/4.0/).
Share and Cite
MDPI and ACS Style
Choe, J.; Batra, C.; Kriventsev, V.; Lee, D. Neutronic Analysis of Start-Up Tests at China Experimental Fast Reactor. Energies 2022, 15, 1249. https://doi.org/10.3390/en15031249
AMA Style
Choe J, Batra C, Kriventsev V, Lee D. Neutronic Analysis of Start-Up Tests at China Experimental Fast Reactor. Energies. 2022; 15(3):1249. https://doi.org/10.3390/en15031249
Chicago/Turabian StyleChoe, Jiwon, Chirayu Batra, Vladimir Kriventsev, and Deokjung Lee. 2022. "Neutronic Analysis of Start-Up Tests at China Experimental Fast Reactor" Energies 15, no. 3: 1249. https://doi.org/10.3390/en15031249
Note that from the first issue of 2016, this journal uses article numbers instead of page numbers. See further details here.