
Meso-Mechanical Characteristics of Granite with Natural Cracks after Mud Acid Corrosion
by
Rongchen Tong
1,2,3, 
Hejuan Liu
1,2,3,*,
Jianfeng Liu
4,
Yingkun Shi
5,
Lihuan Xie
1,2,3 and
Shengnan Ban
1,2,3 1
State Key Laboratory of Geomechanics and Geotechnical Engineering, Institute of Rock and Soil Mechanics, Chinese Academy of Sciences, Wuhan 430071, China
2
University of Chinese Academy of Sciences, Beijing 100049, China
3
Hubei Key Laboratory of Geo-Environmental Engineering, Institute of Rock and Soil Mechanics, Chinese Academy of Sciences, Wuhan 430071, China
4
College of Water Resource and Hydropower, Sichuan University, Chengdu 610041, China
5
Shandong Hi-Speed Company Limited, Jinan 250014, China
*
Author to whom correspondence should be addressed.
Energies 2022, 15(3), 721; https://doi.org/10.3390/en15030721
Submission received: 15 September 2021
/
Revised: 5 December 2021
/
Accepted: 12 January 2022
/
Published: 19 January 2022
(This article belongs to the Special Issue Climate Change, Energy Efficiency and Technological Innovation)
Abstract
:Most of the discovered high-temperature geothermal energy systems are often related with granite that is characterized by natural faults, fractures and cracks of different size. However, the porosity and permeability of the granite matrix is very low, greatly limiting the efficiency of heat extraction in granitic rock. Chemical stimulation, which is regarded as one of the most important means of reservoir stimulation, has consequently received more and more attention. In this paper, a Triassic granite obtained from the eastern region of Liaoning Province in China was reacted with three different concentration of mud acid solution (8% HCl + 1% HF, 10% HCl + 2% HF, 12% HCl + 3% HF) and the resulting microstructure changes studied by scanning electron microscopy (SEM) and nuclear magnetic resonance (NMR). The experimental results show that the number of micropores in the granite increases after chemical corrosion by mud acid solution. A higher mud acid solution concentration results in a much higher pore volume. Triaxial compression tests on the granite before and after chemical corrosion were carried out to study the effect of acidification on the mechanical characteristics of granite, showing that the peak stress and elastic modulus of granite decreases 25.7% and 16.5%, respectively, after exposure to mud acid solution (12% HCl + 3% HF) corrosion for three weeks at room temperature. The particle flow program PFC2D based on discrete element method was used to investigate the mechanical response before and after the chemical corrosion. Considering that the granite is rich in microcracks, the study is simplified by considering them all grouped into one main closed fracture. The influences of main crack inclination angle, crack length, friction coefficient and confining pressure on the mechanical response were investigated. Under the triaxial compression loading state, wing cracks appear at the initial crack tip, then secondary cracks begin to appear. The sensitivity analysis shows that three characteristic strengths (crack initiation strength, damage strength and peak strength) are strongly correlated with crack length, crack inclination angle, crack surface friction coefficient and confining pressure. These three characteristic strengths decrease 60%, 59% and 53%, respectively, compared with their initial values with the increase of main crack length from 6 mm to 22 mm, while they present positive correlation with the fracture friction coefficient from 0 to 1.0 and confining pressure from 10 to 50 MPa. There is a critical inclination angle of the main crack (i.e., 45°), meaning that these three characteristic strengths of granite decrease with inclination angles smaller than 45°, while they increase with an inclination angle larger than 45°. After the corrosion effect of mud acid solution on granite, the pore structure was changed and mechanical properties was damaged, which further affect the failure mode and failure process of granite samples affected by mud acid solutions. This paper provides a theoretical reference for evaluating the effect of chemical stimulation technology on the mechanical characteristics of granite, serving for the continuous hydraulic stimulation design after the chemical stimulation.
1. Introduction
In order to mitigate the climate change effects effected by greenhouse gases, more and more countries have set carbon neutrality goals. China proposes to strive for a carbon dioxide peak by 2030 and then achieve the goal of “carbon neutrality” by 2060. To achieve this goal, it is necessary to change the structure of the energy supply. Geothermal energy is a kind of renewable energy, which is characterized by high efficiency, low carbon, stable operation and wide distribution [1]. Geothermal heating can solve the serious smog problems experienced in winter in China, fossil fuel energy depletion, and greenhouse gas effect mainly caused by coal-fired power plants, cement mills, etc. At present, the development of shallow and middle depth (<2000 m) geothermal energy is relatively mature [2]. However, there are various technical and economic challenges for the development of geothermal energy stored in high-temperature rock masses at deeper depths [3]. Many countries including the United Kingdom, Germany, Japan, Australia, etc. have carried out nearly 30 experimental and demonstrative Enhanced Geothermal System (EGS) engineering projects for power generation from high-temperature rocks at deep depths [4]. Many of these EGS projects extract the heat from granite. The exploration and exploitation of high-temperature rock masses in China started late and the first demonstration EGS project is located in the Gonghe Basin in northwestern China, where granite with a temperature of 236 °C was found at a depth of 3750 m [5].
The artificial geothermal reservoir reconstruction methods for granitic rocks mainly include hydraulic fracturing method, chemical stimulation method and thermal stimulation method, etc. [6,7]. According to the experiences accumulated from global EGS engineering projects [8], if the reservoir is stimulated by chemical solutions before hydraulic fracturing, the permeability and porosity performance of the reservoir can be obviously improved. In recent years, some scholars have studied the mechanism of influence of acid solutions on the porosity, permeability and mechanical properties of rock materials [9,10,11,12]. Uniaxial and triaxial compression tests as well as splitting tests were conducted on granite specimens after acidic solution erosion experiments at a variety of different pH values and flow rates by Miao et al. [13]. The strength loss, deformation behavior and mechanical parameter responses of the granite were compared and analyzed. Miao et al. [14] explored the macro/mesoscopic damage evolution law and failure mechanisms of rock masses under chemical corrosion conditions through numerical simulation. Among the various available techniques, the use of mud acid solutions is regarded as a common sandstone acidification treatment [15], and some scholars have consequently studied the acidification effect and mechanism in granites. It is found that the most effective mud acid solution is composed of 12 wt% HCl and 3 wt% HF [16]. HCl in the mud acid solution will dissolve minerals (e.g., albite, K-feldspar and biotite) in the granite. HF will dissolve silicate minerals and quartz, and generate other precipitates (e.g., CaF2, AlF3, K3AlF6, Na3AlF6) [17]. Luo et al. [18] found that the number and size of cracks in rock increased significantly after corrosion. Lin et al. [19] found that mud acid solution can significantly reduce the tensile strength of granite, developing internal fractures and forming a more complex fracture network. However, few studies concern the failure mechanism of granite after the application of mud acid solution corrosion. The variation of mechanical properties of granite due to the generation of microcracks after chemical corrosion may affect the design of any hydraulic fracturing process that follows the chemical stimulation [19].
The granite matrix is often rich in natural microcracks ranging in size from μm to mm, which greatly affects the mechanical properties of the granite, especially after the penetration of chemical solutions. Many previous works were about the mechanical properties of various rocks containing defects and cracks, and it was found that acidification effects may strengthen the distribution of micro defects and are helpful for reservoir stimulation. Liu et al. [20] investigated the crack initiation and development in rocks under shear loading conditions. Misra et al. [21] studied the deformation process at the tips of preexisting planar shear cracks in similarity experiments conducted on polymethylmethaacrylate (PMMA) models. Willemse et al. [22] found that sliding along a pre-existing flaw can result in the formation of tensile cracks where stresses concentrate near the flaw tips, and these tensile cracks belonged to the class of wing cracks, which generally are oriented oblique to the pre-existing flaw. Simulated samples with cracks were used in mechanical compression experiments [23,24], and the generation of wing cracks, initial cracks and secondary cracks and the failure mode of samples during loading were discussed in detail. Wong et al. [25] studied the compression failure process of rock samples with open cracks and closed cracks with different friction coefficients. Besides, numerical simulation tests are often widely applied in studying the failure process of rock mass. Simulators such as ABAQUS, ANSYS, FLAC3D and CASRock regard rock mass as a continuous medium, and the finite element method, finite difference method, cellular automata were used in the discretization equation and simulate the expansion process of static and dynamic cracks in rock mass [26,27,28,29]. Discrete element methods, without specifying complex crack initiation criteria, regard a rock mass as a discontinuous discrete medium and have been widely applied in simulating crack propagation and failure analysis of rock masses [30]. Cracks propagate when the stress between elements reaches the specified tensile or shear strength, so the new generated cracks are much closer to the real situation. The particle flow simulator PFC based on the discrete element method has attracted more attention in recent years. Hadjigeorgiou et al. [31] used PFC2D to analyze the stability of vertical excavations in rock with the help of discrete fracture systems to better capture the structural complexity of the rock mass. Shemirani et al. [32] studied the mode I fracture toughness of rock by direct and indirect methods with the help of a particle flow simulation.
In this paper, granite samples were obtained from Sanguliu rock mass located in eastern Liaoning Province in China. The microstructure, mechanical and failure characteristics of the granite after mud acid solution corrosion were studied. The effect of high temperature was not considered in the experiments on mud acid solution corrosion on granite due to safety considerations. At the mesoscale, considering the strengthened natural microcracks after chemical corrosion will further develop under mechanical loading, the particle flow numerical simulation software PFC2D was used to study the mechanical response of the granite before and after the chemical corrosion. To simply the problem, all discrete micro-cracks were simplified as a single main closed crack in the granite, which is regarded as the initial model of granite before mud acid corrosion. The initiation and propagation of the main crack in granite may depend on different fracture parameters and confining pressure, which are discussed in detail.
2. Mud Acid Corrosion on the Microstructure of Granite
2.1. Sampling Location and Mineral Composition of Granite
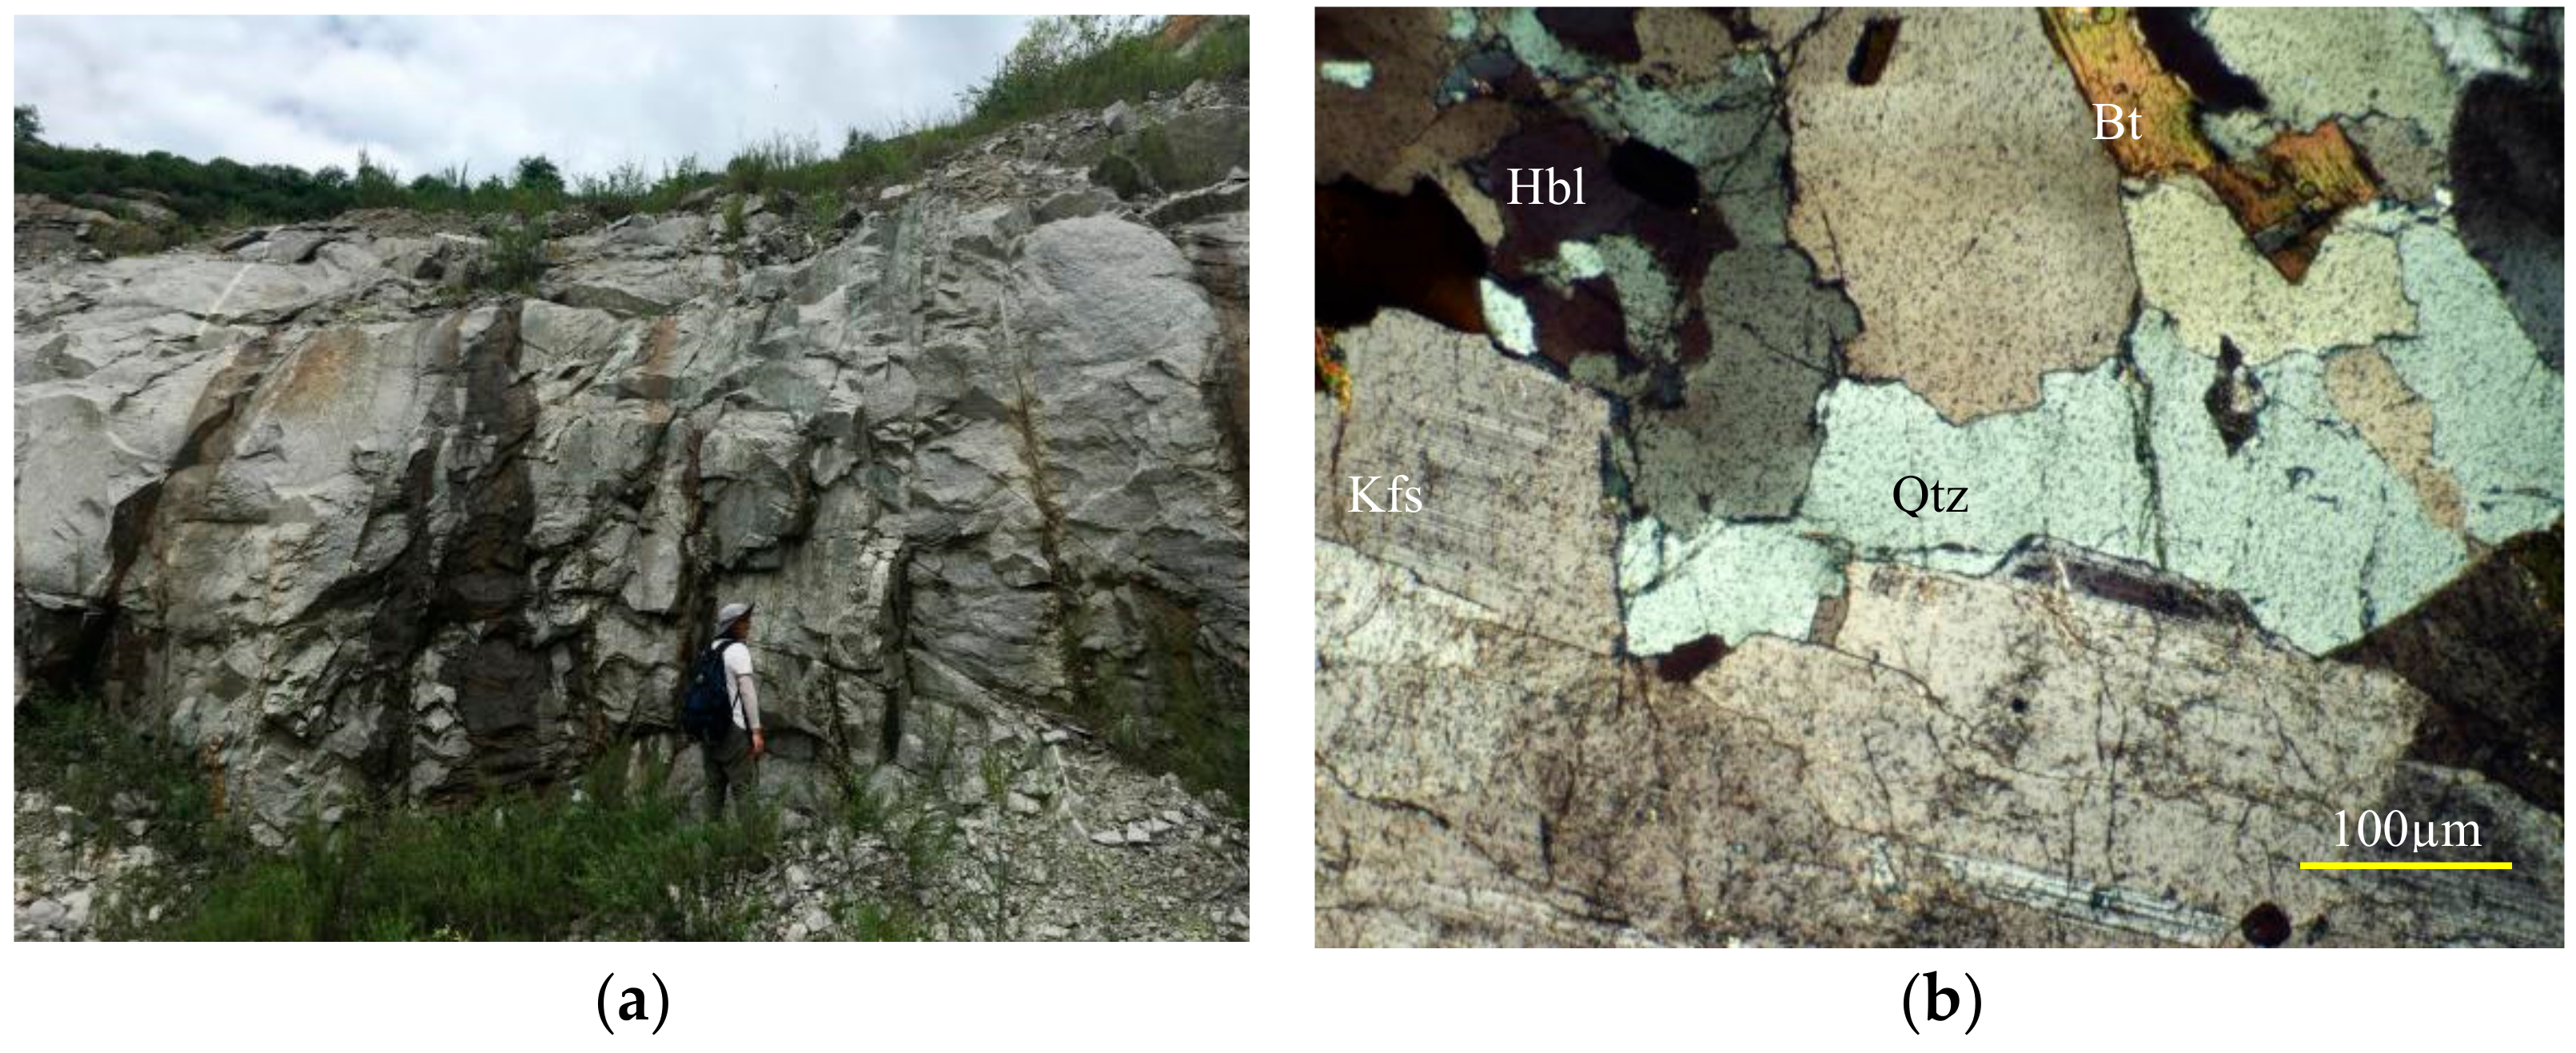
Mesozoic granites are widely developed in Eastern Liaoning Province, and many hot springs are found in granite outcropping areas. These hot spring areas are basically controlled by a deep complex fault system under the influence of Tanlu fault zone, including the NNE strike slip fault, NW normal fault and NE high angle normal fault [33,34,35]. This paper used fresh Triassic granite obtained from the Sanguliu rock mass quarry in Dandong city of Liaoning Province in the experiments. The exposed rock mass in the field is seriously cut by faults or cracks at different scales (Figure 1a). Granite has a coarse grain structure, and it is rich in intergranular cracks and intracrystalline cracks (Figure 1b). The main mineral components include potassium feldspar, albite, quartz, amphibole, etc (see Table 1 for details).
2.2. Mud Acid Corrosion and Triaxial Compression Mechanical Tests
To ensure the consistency of the experimental samples, 12 small cylinders with a diameter of 25 mm and a height of 50 mm were cut from the same granite block. Four samples (S0) were dried at 105 °C for 24 h and used as the comparison group, and two of them were used in the triaxial compression test with the confining pressure of 10MPa before chemical corrosion. Six granite samples were divided into three groups (i.e., S1, S2 and S3) and each group has two granite samples.
Three kinds of mud acid solutions with different proportions (12 wt% HCl + 3 wt% HF, 10 wt% HCl + 2 wt% HF and 8 wt% HCl + 1 wt% HF) were used in the acidification test. The mud acid solution of 12 wt% HCl + 3 wt% HF is composed of 28.2 mL of 38% HCl solution and 7.1 mL of 40% HF solution, and then diluted with 64.7 mL of deionized water. The mud acid solution of 10 wt% HCl + 2 wt% HF is composed of 23.2 mL of 38% HCl solution and 4.7 mL of 40% HF solution, and then diluted with 72.1 mL of deionized water. The mud acid solution of 8 wt% HCl + 1 wt% HF is composed of 18.4 mL of 38% HCl solution and 2.3 mL of 40% HF solution, and then diluted with 79.3 mL of deionized water.
After washing with clean water, these six granite samples were put into a SX2 muffle furnace (Subo Instrument Co., Ltd., Shaoxing, China) and dried at 105 °C for 24 h. After cooling to room temperature, S1, S2, and S3 were soaked in three different concentration of mud acid solutions (8 wt% HCl + 1 wt% HF, 10 wt% HCl + 2 wt% HF and 12 wt% HCl + 3 wt% HF) of 100 mL, respectively, while the control sample S0 was not further processed. The samples were submerged into the mud acid solution to ensure that the granite fully reacted with the chemical solutions. The chemical reactions were carried out at the room temperature of 23 °C and the reaction time was 21 days. After the mud acid corrosion test was completed, one sample from each group was used for our triaxial mechanical tests, while the other one was used to study the changes in the microstructure by the scanning electron microscopy (SEM) and nuclear magnetic resonance (NMR) methods.
The triaxial mechanical tests of granite samples before and after acidification were carried out on the MTS815.03 electro-hydraulic servo triaxial testing machine at the Institute of Rock and Soil Mechanics in Wuhan (China). Its high-precision servo system and sensors ensure the accurate recording of loading and deformation history. The confining pressure was increased to 10 MPa and kept constant, and then the axial load was applied at a constant displacement rate of 0.0005 mm/s until the sample was damaged.
2.3. Experimental Analysis of Mud Acid Corrosion on Microstructure
The relevant parameters of spectrum measured by nuclear magnetic resonance (NMR) before and after the reaction were used to inverse the pore structure of granite [36]:
where is the pore radius, is lateral surface relaxation constant of granite and is the geometric factor, and of spherical pores is equal to 3, of columnar pores is equal to 2. Therefore, the spectrum distribution can reflect the pore size and pore distribution of granite before and after chemical solution exposure. The pore size is related to the position of spectral peak, and the number of pores corresponding to pore size is related to the peak area.
The spectrum distribution characteristics of granite before and after acidification are drawn in Figure 2. It can be seen that the spectrum distribution of these granite samples after acidification in different concentrations of mud acid changes obviously compared with the initial state without chemical solution exposure. The effective signals are in the range of 0.01~10,000 ms, indicating that pores with different sizes are developed. The spectrum of the initial granite has the double peaks. The amplitude of the first peak and the second peak are basically the same, and the proportion of spectral peaks is 43% and 57%, respectively. The signal value of higher relaxation time is lower, which is basically not reflected in the curve. It shows that the pores in this group of rock samples are mainly small and medium-sized pores, and large-diameter pores are developed at the same time, but its proportion is very limited and the distribution is discontinuous. The spectrum of granite after acidification shows similar double peaks. Nevertheless, with the increase of the mud acid concentration, the amplitudes of both peaks of the curve increase, indicating that the number of pores increases, the small and medium-sized pores of granite samples are developed to a large extent, and the increase of small pores is relatively more obvious.
At the same time, according to the scanning electron microscopy (SEM) results of granite samples after acidification, the microstructure characteristics can be visualized more clearly, the quartz in granite was dissolved and obvious dissolved pores were found (Figure 3).
Generally, the dissolution of silicate minerals is assumed to depend on the chemical reactions that occur at the interface of minerals, with the bridging bonds between Si being broken because of its reaction with protons [38,39]. In acidic solution, granitic minerals (e.g., quartz, K-feldspar, albite, biotite, hornblende and clinochlore) will dissolve because of the chemical reactions with acidic materials. The silicon-oxygen bonds are broken to form anions as either His or HSi , and cations as either or in separate parallel reactions for quartz minerals. Hydrofluoric acid solution dissolves the silicate minerals (e.g., albite, K-feldspar and biotite) much faster than hydrochloric acid solution, and it dissolves quartz. Therefore, the mixed solution of HCl + HF is widely applied to enhance the reservoir permeability of granite in EGS projects [17].
2.4. Mechanical Characteristics of Granite after Mud Acid Corrosion in the Triaxial Compression Tests
The stress-strain curves of granite samples before and after acidification through the triaxial compression tests under 10 MPa confining pressure are drawn in Figure 4. It shows that the compressive mechanical properties of granite samples were degraded due to the impacts of mud acid solution. The higher the concentration of the mud acid solution, the lower the peak strength of the granite sample that it reacted with. Figure 5 shows the failure modes of four groups (S0, S1, S2 and S3) of granite specimens after triaxial tests, indicating that the granite has strong brittleness.
It can be observed that there was a strong correlation between the mud acid concentration and the deterioration of mechanical parameters. Especially, the peak strength of granite sample S3 soaked in a mud acid solution with the concentration of 12 wt% HCl and 3 wt% HF is 194.2 MPa, while the peak strength of sample (S0) not soaked in mud acid solution is 258 MPa. Therefore, the peak strength of granite sample S3 decreased by about 24%. The elastic modulus of granite sample S0 is 29.6 GPa, and the elastic modulus of rock sample S3 is reduced to about 24.7 GPa, while the Poisson’s ratio shows no obvious variation. The mechanical parameters of granite before and after chemical corrosion are shown in Table 2. Combined with the analysis of pore changes before and after acidification discussed in Section 2.3, it can be reasonably speculated that the deterioration of mechanical parameters of the sample is related to pore development.
3. Numerical Model Establishment and Parameters Input
Based on the microscopic analysis discussed in Section 2.3, it is proved that the defects in granite increase after mud acid corrosion. However, it is difficult to reproduce them accurately by numerical methods. However, the mechanical properties of rock are controlled by the dominant defects to a great extent. Therefore, the microcracks in the granite were grouped and simplified as a single closed crack and a two-dimensional model was established in the PFC2D based on Section 2.4 for representing the initial fractured granite sample.
3.1. Theory of Discrete Element Method and Contact Models Used in the PFC2D Simulater
In PFC2D, the program simulates the mechanical behavior of a collection of circular rigid particles that may be bonded together at the contact points. The particle denotes a body that occupies a finite amount of space. The rigid particles interact only at the soft contacts. The displacements and contact forces of a whole assembly of particles are solved by tracking the movements of each particle. Newton’s second law is used to calculate the displacements and rotations of the individual particles under the control of the contact forces, body forces and applied forces. The force-displacement law, however, is used to compute the contact forces generated by the relative motion at each contact between the particles. A variety of contact models are built in PFC2D simulator, including a linear parallel bond model, flat-joint model, smooth-joint model, etc. Each contact model defines a force-displacement law.
In this paper, the linear parallel bond model was used to characterize the contact relationship between particles for the initial granite. As shown in Figure 6a, the defined contact mode between particles is face-to-face contact, which is called cemented bond. Cemented bonds can transfer force and moment, and their key strength parameters can be divided into normal bonding strength and tangential bonding strength. When the shear stress or normal stress of the cemented bond reaches the corresponding bonding strength, it will lead to the damage of the cemented bond and the formation of microcracks, which can no longer bear the tensile stress [30].
The smooth-joint model was used to represent the cracks. In the smooth-joint model, the normal direction of the contact between particles is not the normal direction of the contact surface, but the normal direction of the customized joint surface. As shown in Figure 6b, it enables the particles on both sides of the crack to slide along the joint surface without rotating around each other [40].
3.2. Establishment of Geometry
Based on the PFC2D simulator results, a rectangular geometric model with the dimensions of 25 mm × 50 mm was established and a single closed crack was inserted. The number of particles was 13,535, the particle size ratio was 1.66, and the minimum radius was 0.12 mm. The linear parallel bond model was used to represent the matrix part, and the smooth-joint model was embedded to generate a closed single crack. As shown in Figure 7a, the embedded crack with the length L of 0.01 m and the inclination angle α = 45° was placed in the middle of the geometry. Figure 7c is a partial enlarged view of Figure 7b. The pink balls represent the particles, the blue meshes represent the parallel bond model, and the green part indicates the smooth-joint model of the crack part.
3.3. Calibration of Micro-Parameters Based on Experimental Data
3.3.1. Adjustment of Micro-Parameters for the Granite Matrix
Most of the input parameters in the PFC2D model are based on the micro properties of rocks, which can describe the properties of particles, the contact properties between particles, and between particles and walls. However, the data obtained from uniaxial or triaxial mechanical experiments are mostly parameters representing the macro properties of rock mass, which makes it difficult to determine the parameters in PFC2D model. In this paper, the “trial and error method” [41,42,43] was used to calibrate the micro-parameters of granite.
Firstly, the geometric parameters of the granite without considering cracks are consistent with the model in Section 3.2 (also consistent with the sample in the triaxial test). By adjusting the elastic and strength parameters of the model, the overall macro mechanical properties are consistent with the triaxial mechanical test values of S3. Based on the above parameter calibration process, the micro-parameters of the granite matrix in Section 3.2 were determined and shown in Table 3.
3.3.2. Adjustment of Micro-Parameters for Single Main Closed Crack in Granite
According to the studies of Bai et al. [44] and Xian et al. [45], under the condition of compression loading and when the axial force is small, the upper and lower parts of internal closed cracks are closely bonded, and the shear stress on the surface is not enough to overcome the friction. No relative dislocation is observed, and the displacement field of the rock is continuous. The whole sample is in the elastic deformation state, and the deformation parameters are basically consistent with the rock. Based on the test results in the above, the “trial and error method” was also used to calibrate the micro-parameters of the smooth-joint model for the pre-existing crack. Firstly, a high coefficient of friction was assigned to the crack surface, so that the surface does not slide during the triaxial loading process. Subsequently, the micro-stiffness parameters were continuously adjusted to make the elastic modulus of the sample consistent with S3 under the same conditions. Finally, the micro-parameters of the smooth-joint model for the pre-existing crack were obtained and shown in Table 4.
3.3.3. Boundary Conditions
Axial stress and constant confining pressure (i.e., 10 MPa) were applied by the wall at the four boundaries of the model. Axial stress was applied at the upper and lower walls, and the loading speed was adjusted to 0.01 m/s in order to improve the calculation speed of numerical simulation. Since the model uses high local damping to absorb excess kinetic energy, the simulation process at this loading speed was still quasi-static loading [46]. In order to simulate the flexible boundary surrounding the specimen in the triaxial test, the wall stiffness on both sides was set to 1/10 of the stiffness in the granite [47]. The simulation continued till the post-peak period of granite.
4. Results
4.1. Characteristic Strength Analysis of the Fractured Rock during Loading
The generation of cracks is almost simultaneous with the propagation of elastic waves in rocks. Using relevant equipment (such as acoustic emission devices, etc.), the propagation of elastic waves can be tracked [48]. The failure of brittle rock is caused by the formation of macro cracks due to continuous accumulation of microcracks. In order to analyze the relationship between rock strength and the accumulation state of microcracks, crack initiation strength , damage strength and peak strength are commonly used to define the propagation of microcracks at different stages [49]. corresponds to the starting point of microcrack initiation. When the axial loading continues to increase, the number of microcracks increases steadily, which is basically linearly related to the axial strain. When the deviatoric stress exceeds , the generation of microcracks accelerates greatly, and the number of microcracks increase nonlinearly. In PFC2D, both the propagation of cracks and acoustic emission can be recorded by programming.
Figure 8 shows the correlation between deviatoric stress, number of microcracks, cumulative number of microcracks and axial strain. Before the deviatoric stress reaches the crack initiation strength, the granite is in the elastic stage and there is very limited number of microcracks. When the deviatoric stress exceeds , the number of microcracks begins to increase. When the deviatoric stress reaches the damage strength of rock , the number of microcracks increases significantly. At the same time, the relationship between the cumulative number of cracks and axial strain changes from linear growth trend in the previous stage to exponential growth state. It shows that the granite is in the accelerated failure state, and the growth rate of cracks becomes larger until the partial stress reaches the peak strength . Afterwards, the granite is at the brittle failure state, and the stress drops suddenly.
It can be seen that the crack growth rate also conforms to the transition from linear to nonlinear for the rock with pre-existing cracks. Therefore, it is reasonable and meaningful to define different stages () of rock failure process according to fracture propagation rate.
4.2. Damage Mechanism Analysis
To study the failure mechanism under triaxial compression, the evolution of crack distribution of the granite with time is shown in Figure 9. According to the simulation results in Figure 9, when the deviatoric stress reaches the crack initiation strength value, the wing crack initiates at the tip of the pre-existing main crack and expands with the increase of deviatoric stress. The propagation direction of cracks is almost perpendicular to the pre-existing main crack (see Figure 9a,b).
When the deviatoric stress reaches the damage strength of granite, secondary cracks occur at the tip of the pre-existing crack and continue to expand towards the top and bottom boundary of the granite. At the same time, microcracks are generated irregularly and scattered throughout the granite (see Figure 9c,d). When many secondary cracks continue to expand, which results in a macro shear failure surface, the deviatoric stress reaches the peak strength and falls, showing the characteristics of brittle failure (see Figure 9e). The above simulation results are basically consistent with the failure mode summarized by Lee et al. [24].
4.3. Local Stress Distribution in the Granite with a Single Main Crack
The compression failure of rock with a closed single crack often begins in the vicinity of the pre-existing crack [21,22]. In order to study the reason of pre-existing crack initiation, the fish language-based programming is carried out in PFC2D simulator to generate measurement regions in the crack area. By calculating the stress distribution in the process of crack initiation and propagation of the wing crack, the stress tensor of each point in this region can be calculated and displayed as cross lines. When the cross is set to display the maximum principal stress value, the maximum principal stress cloud is obtained.
Figure 10a–c show the variation of the maximum principal stress cloud of the crack area in the wing crack propagation stage with time. At the initial stage of the wing crack propagation, the tensile stress area in which the maximum principal stress is greater than 0, appears at the pre-existing crack tip, and the included angle between the orientation and the crack surface is close to 90°. The crack continues to expand with the increase of axial loading, and the position of tensile stress area also migrates, but it is always concentrated at the wing crack tip.
Figure 10d shows a partial enlarged view of the principal stress cross at the wing crack tip. It can be seen that the stress cross is regularly distributed in the displayed area. The two branches of the cross represent two pairs of principal stresses perpendicular to each other, and their length represents the absolute value of the principal stress. The different color represents the principal stress sequence (e.g., blue represents , green represents and red represents ). By observing the blue part of the principal stress, it is not difficult to find that the tensile stress direction is basically perpendicular to the crack propagation direction. Based on the above two points, the generation and transfer of tensile stress area at the wing crack tip are closely related to the development of the wing crack at the crack tip.
5. Discussion
The new cracks formed in deep rocks are highly dependent on the geometric parameters of pre-existing cracks and the in-situ stress conditions that are complex and changeable. Here we considered the effects of crack length, inclination angle, internal friction angle and confining pressure on the mechanical properties of granite. Furthermore, the evolution of mechanical properties and failure under various conditions were discussed in detail.
5.1. Failure Modes of Granite under Different Conditions
5.1.1. Influence of Pre-Existing Crack Inclination Angle
Figure 11 shows the evolution of microcracks in the main crack bearing granite with the different inclination angle (i.e., 15 °, 30 °, 45 °, 60 ° and 75 °). Other conditions were the same as those of the model used in Section 4.
The pre-existing main crack extended towards the axial loading direction until a shear failure surface occurred. This shows that different inclination angle of the initial main crack still did have an impact on the propagation mode of the pre-existing crack. When the crack inclination angle was equal to 15°, the propagation length of the wing cracks was the largest, which was about 12 mm. With the increase of inclination angle, the length of wing crack decreased from 12 mm to almost 0 mm. The angle between wing crack and pre-existing main crack was basically unchanged, while the propagation angle of secondary cracks changed continuously. When the inclination angle of the main crack was equal to 60°, the propagation angle of secondary cracks was almost equal to 0°.
5.1.2. Influence of Main Crack Length
Figure 12 shows the evolution of microcracks in the granite with the main crack length of 0.006 m, 0.01 m, 0.014 m, 0.018 m and 0.022 m. The main crack inclination angle α of these models was 45°. Other inputs were the same with that of shown in Section 4.
Results show that the main crack length did not affect the macro shear failure mode, while the crack propagation patterns were affected. With the increase of the pre-existing crack length in granite, the final propagation length of wing crack also increased from about 4 mm to 15 mm, and the final propagation direction was basically parallel to the axial loading direction. In the case of long pre-existing cracks, the propagation process of secondary cracks was accompanied by the emergence of some tensile cracks and may even change the propagation path of secondary cracks. When L = 0.014 m, 0.018 m and 0.022 m, the secondary cracks in the upper right corner of the sample expanded and tensile cracks appeared. These tensile cracks further expanded and resulted in the damage of the granite.
5.1.3. Influence of Crack Surface Friction Coefficient
Figure 13 shows microcrack distribution in the single crack bearing granite considering impacts of different crack surface friction coefficients (i.e., 0, 0.25, 0.5, 0.75, 1) under triaxial compression simulation tests. Other inputs were the same as that used in Section 4. Results show that the friction coefficient µ of the pre-existing main crack had relatively small impact on the failure mode and propagation of secondary cracks in the granite. The morphology of secondary cracks under different friction coefficients was basically the same. However, with the increase of friction coefficient, the length of wing crack decreased from about 5 mm to 0 mm, and the total number of microcracks increased from 1399 to 1966.
5.1.4. Influence of Confining Pressure
Figure 14 illustrates the microcrack distribution in the main crack-bearing granite at the moment of peak strength in the triaxial compression numerical tests considering the impacts of different confining pressures (i.e., 10, 20, 30, 40 and 50 MPa). Other input parameters were the same with that used in Section 4. Results show that the applied confining pressure had only a slight effect on the failure mode. With the increase of confining pressure, the length of wing crack decreased, the number of secondary cracks on the pre-existing main crack surface increased from about 5 mm to 0 mm, the total number of microcracks also increased from 1399 to 2084.
5.2. Analysis of Characteristic Strength
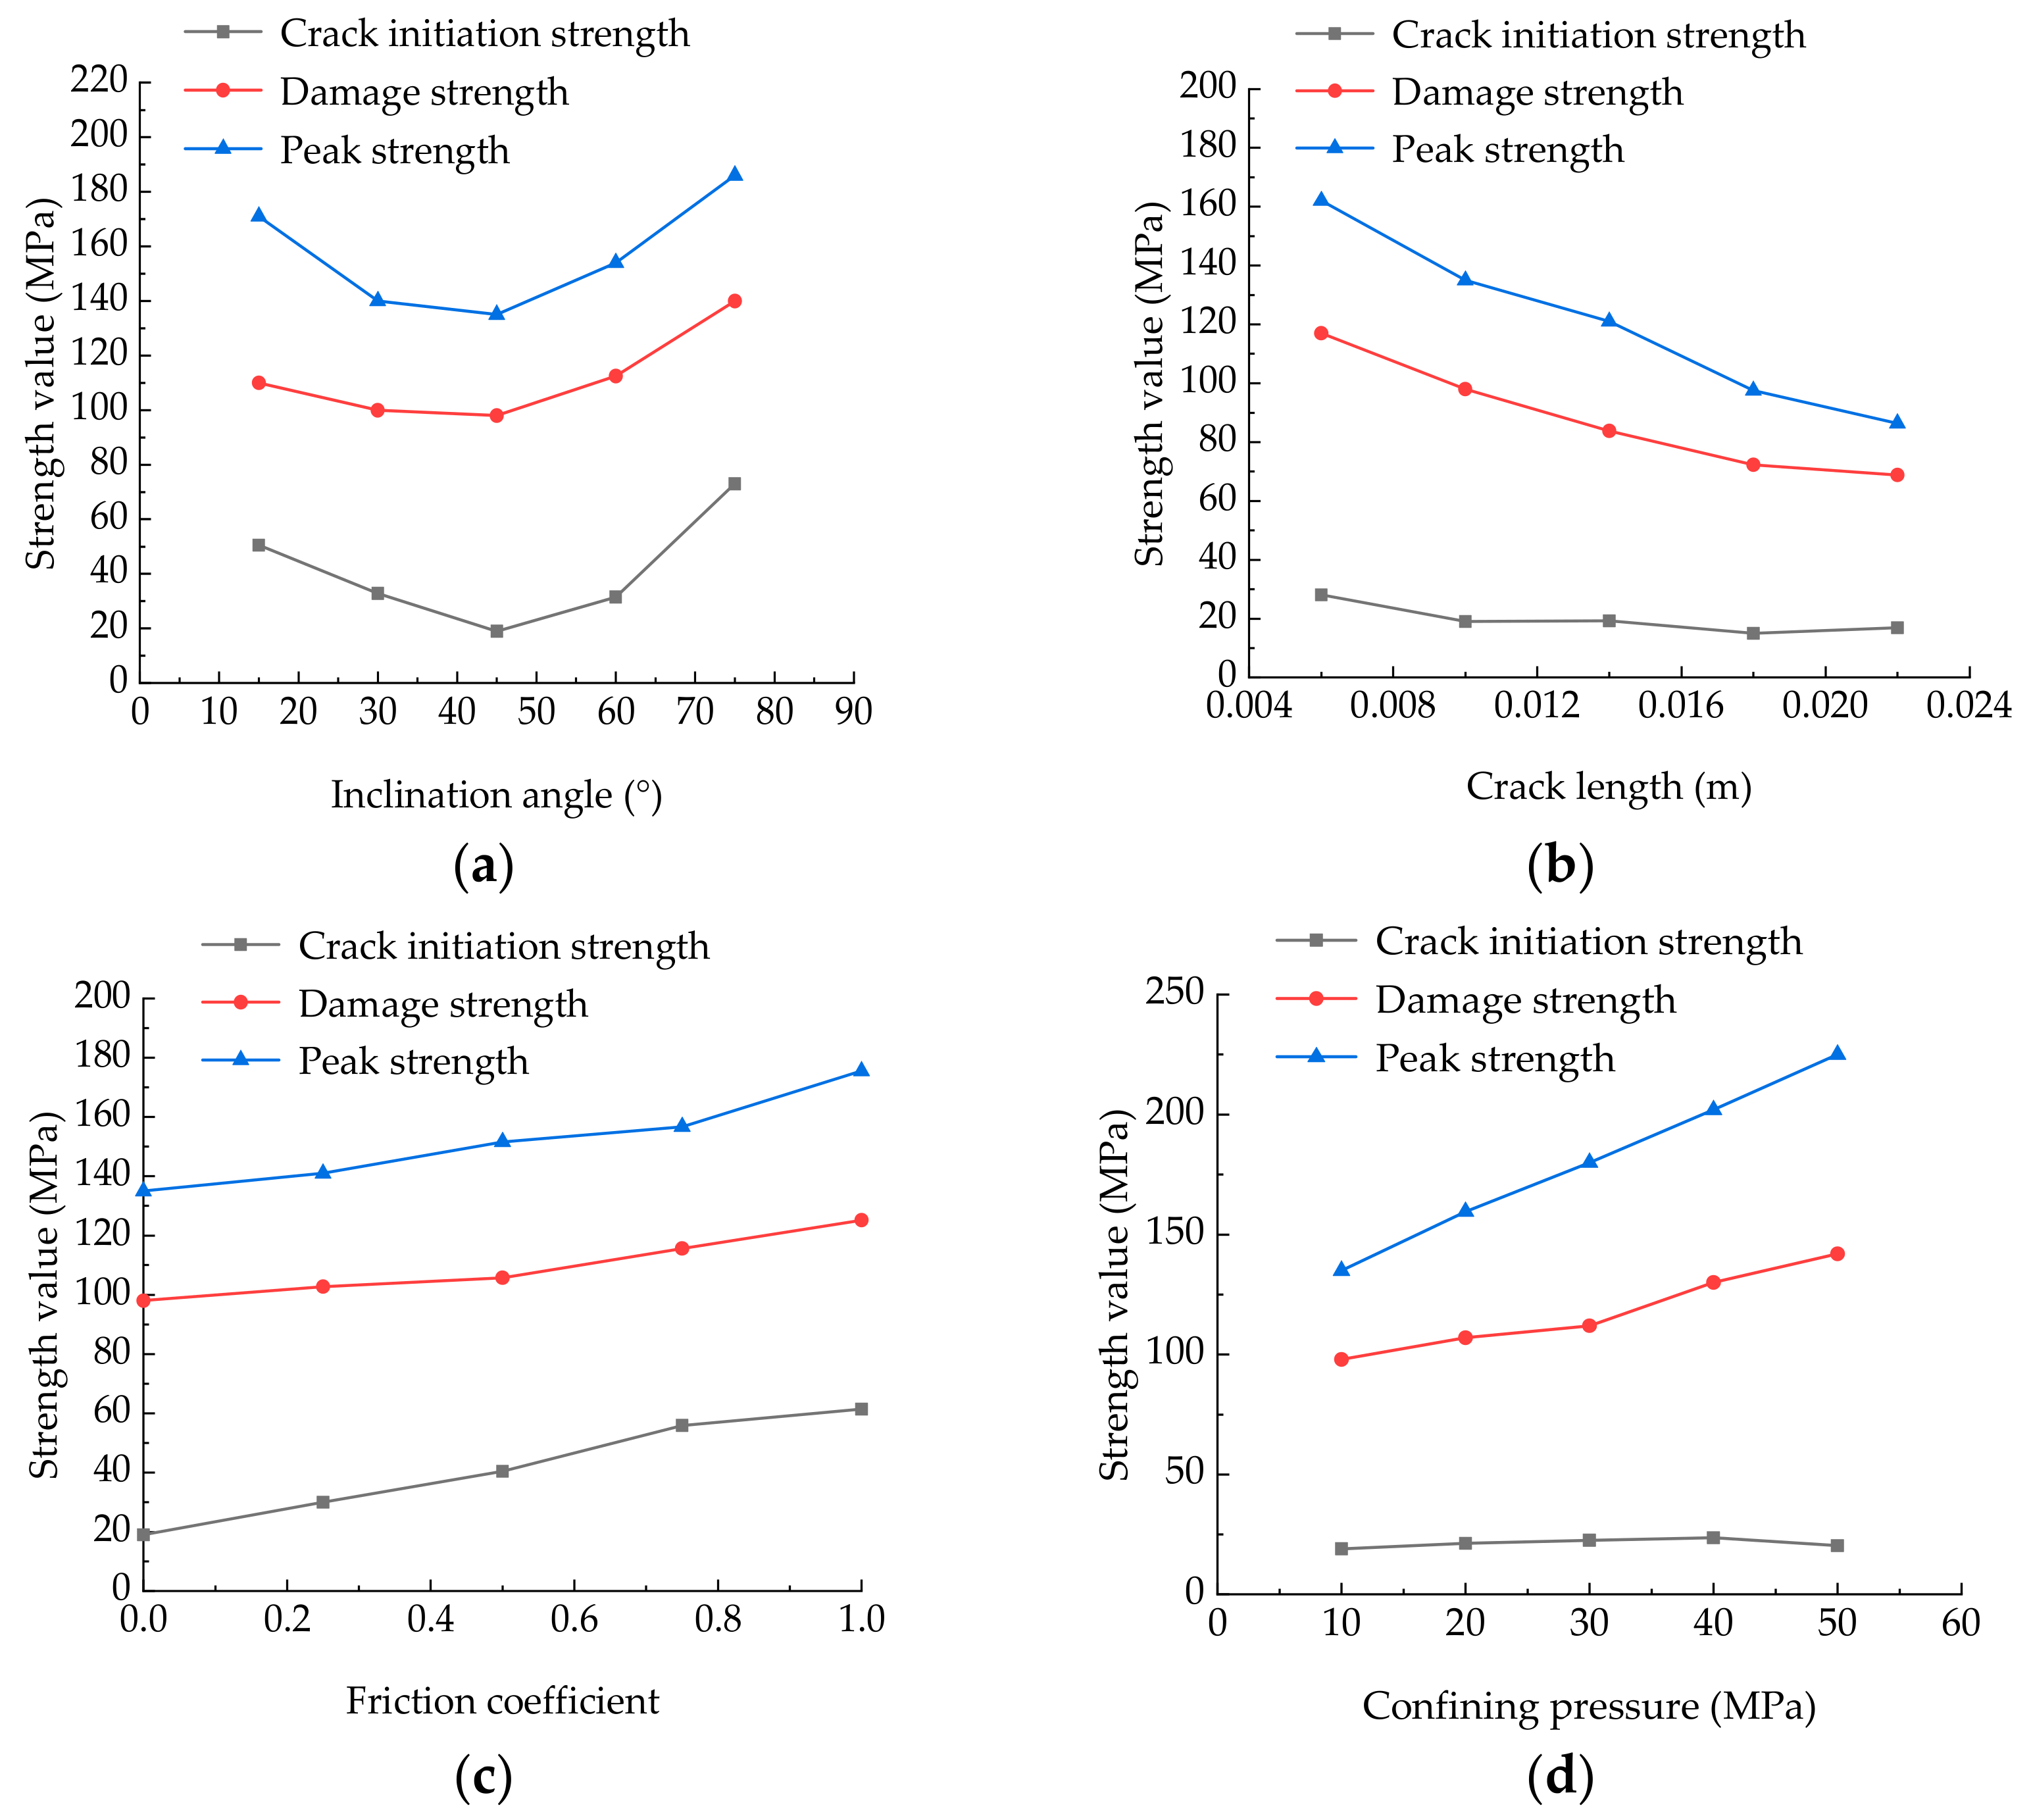
In order to study the variation law of rock characteristic strength (crack initiation strength, damage strength and peak strength) under the influence of multiple parameters (crack length, crack surface friction coefficient, crack inclination angle and confining pressure), the sensitivity analysis was carried out (see Figure 15).
It can be seen from Figure 15a that the inclination angle of the main crack in the granite greatly affect the characteristic strength. With the increase of the inclination angle, three characteristic strengths all decreased at first and then increased. Among them, the peak strength reached the lowest value of 137 MPa at α = 45°, and the peak strength reached the maximum value of 186 MPa at α = 75°. Lee et al. [24] also observed a similar variation law of peak strength through experiments, and the minimum value of the peak strength occurs when the inclination angle was 45°. Compared with other cases, when the inclination angle of the main crack was 45°, the microcracks were the earliest to initiate and eventually damaged much faster, which was consistent with the law revealed by Li’s theoretical solution of fracture mechanics [50].
Figure 15b shows that there was a negative correlation between these three characteristic strengths and the main crack length. When the length of the main pre-existing crack increased, the decrease of is smaller, and the decrease of and were much larger. The relationship between peak strength and crack length was consistent with the results of Yang et al. [51]. The proportion of these three strengths remained relatively stable, was about 16% of , while was about 75% of . This indicates that the longer the pre-existing crack was, it was much easier it was to propagate.
Figure 15c shows the positive correlation between these three characteristic strengths and the friction coefficient of the main crack surface. The increase of the roughness of the crack surface led to the increase of the crack initiation strength, damage strength and peak strength. However, the total increments of these three characteristic strengths were relatively small, and the increments were similar. All of them were in the range of 20 and 35 MPa. It is not difficult to see that the greater the friction coefficient of the crack surface was, the more difficult it was for the granite to become damaged. Wong et al. [52] proved a similar law through experiments. However, the difference between the deviatoric stress at the initiation stage and complete failure stage was basically unchanged, and the period started from initiation to complete failure of the granite was basically not affected.
Figure 15d reveals the influence of confining pressure on three characteristic strengths, indicating that both and had a good linear relationship with confining pressure, especially the peak strength would be improved due to the increase of confining pressure. When the confining pressure increased from 10 MPa to 50 MPa, the peak strength increased from 137 MPa to 225 MPa at the same time, and the increase range was about 64%. However, the crack initiation strength was almost not affected by the confining pressure, which was always about 20 MPa. The test results of Chen et al. [53] also revealed a strong linear relationship between characteristic strength and confining pressure. With the increase of confining pressure, the period started from crack initiation to complete failure of granite became longer. The strength of the rock was determined by the meso parameters, in which the tensile strength was determined by the normal bonding strength, and the shear strength was determined by the tangential bonding strength and the friction angle. Therefore, the much longer period of the crack propagation process of the granite could be related to the increase of shear strength caused by the increase of confining pressure [41].
6. Conclusions
Based on the microstructure analysis performed by the T2 spectrum and scanning electron microscopy methods, triaxial compression tests of Triassic granite from Eastern Liaoning (China) before and after mud acid corrosion, together with the numerical tests in PFC2D, the following conclusions may be drawn:
- (1)
- With the increase of the concentration of mud acid solution from 8 wt% HCl + 1 wt% HF to 12 wt% HCl + 3 wt% HF, the amplitudes of two peaks in the T2 spectrum curve increase, indicating that the number of micropores is significantly increased and the corrosion effect is strengthened. In the compression process, the elastic modulus of granite samples after mud acid corrosion are seriously deteriorated from 29.6 GPa to 24.7 GPa, and the compressive strengths are deteriorated from 258 MPa to 194.2 MPa.
- (2)
- The triaxial compression simulation tests show that, when the deviatoric stress reaches the crack initiation strength , the wing cracks initiate in the tensile stress area at both ends of the main crack and expand perpendicularly to the main crack. The number of microcracks increases steadily, which is basically linearly related to the axial strain. When the deviatoric stress reaches the damage strength of granite, secondary cracks occur at the tip of the main crack and continue to propagate towards the top and bottom edge of the rock. At the same time, the relationship between the number of microcracks and axial strain changes from linear growth trend in the previous stage to exponential growth state. Until the deviatoric stress reaches the peak strength , the macroscopic shear surface is completely formed and the specimen is destroyed.
- (3)
- The effects of main closed crack inclination angle, crack length, crack surface friction coefficient and confining pressure on the three characteristic strengths are different. With the increase of inclination angle, all three characteristic strengths decrease at first and then increase. They decrease with inclination angle that is smaller than 45°, while increase with the inclination angle that is larger than 45°. When the length of the main pre-existing crack increases from 6 mm to 22 mm, these three characteristic strengths (//) decrease 60%, 59% and 53%, respectively. The increase of main crack surface friction coefficient from 0 to 1.0 will improve these three characteristic strengths, and their increments are similar. , and have a good linear relationship with confining pressure. The crack initiation strength is hardly affected by the confining pressure, and the peak strength will increase significantly with the increase of confining pressure from 10 to 50 MPa.
In this paper, the mechanical properties of granite before and after acidification were obtained from triaxial compression tests conducted at the room temperature. The mechanical response at high temperature (>150 °C) was not studied due to the limitations of the experimental apparatus. All of the factors will be considered in further studies.
Author Contributions
Conceptualization, R.T. and H.L.; methodology, R.T. and H.L.; software, R.T.; validation, R.T., H.L. and J.L.; formal analysis, R.T.; investigation, R.T., H.L., Y.S., L.X. and S.B.; resources, H.L., J.L. and Y.S.; data collection, R.T.; writing—original draft preparation, R.T.; writing—review and editing, R.T., H.L., Y.S., L.X. and S.B.; visualization, R.T.; supervision, H.L.; project administration, H.L.; funding acquisition, H.L. All authors have read and agreed to the published version of the manuscript.
Funding
This work was supported by the Youth Project of National Natural Science Foundation of China (Grant Nos. 51809259 and 41674180), the CAS Pioneer Hundred Talents Program, the State Key Laboratory of Hydraulics and Mountain River Engineering (Grant No. SKHL1917), and the Key Laboratory of Deep Earth Science and Engineering (Sichuan University), Ministry of Education (Grant No. SESE202002).
Institutional Review Board Statement
Not applicable.
Informed Consent Statement
Not applicable.
Data Availability Statement
The data presented in this study are available on request from the corresponding author.
Conflicts of Interest
The authors declare no conflict of interest.
References
- Soltani, M.; Farshad, M.K.; Mohammd, S.; Behnam, R.; Mohammad, J.; Kobra, G.; Jatin, S.N. Environmental, economic, and social impacts of geothermal energy systems. Renew. Sustain. Energy Rev. 2021, 140, 110750. [Google Scholar] [CrossRef]
- Ramos-Escudero, A.; García-Cascales, M.S.; Urchueguía, J.F. Evaluation of the shallow geothermal potential for heating and cooling and its integration in the socioeconomic environment: A case study in the region of Murcia, Spain. Energies 2021, 14, 5740. [Google Scholar] [CrossRef]
- Knoblauch, T.; Stauffacher, M.; Trutnevyte, E. Communicating low-probability high-consequence risk, uncertainty and expert confidence: Induced seismicity of deep geothermal energy and shale gas. Risk Anal. 2018, 38, 694–709. [Google Scholar] [CrossRef] [PubMed] [Green Version]
- Breede, K.; Dzebisashvili, K.; Liu, X.; Falcone, G. A systematic review of enhanced (or engineered) geothermal systems: Past, present and future. Geotherm. Energy 2013, 1, 4. [Google Scholar] [CrossRef] [Green Version]
- Fu, Y.R.; Li, M.L.; Wang, S.Y.; Guo, Q.Q.; Guo, L.; Wang, G.L.; Wang, X.Y. Present situation and prospect of hot dry rock exploration and development. Oil Drill. Prod. Technol. 2018, 40, 526–540. [Google Scholar]
- Hofmann, H.; Babadagli, T.; Zimmermann, G. Hot water generation for oil sands processing from enhanced geothermal systems:process simulation for different hydraulic fracturing scenarios. Appl. Energy 2014, 2014, 524–547. [Google Scholar] [CrossRef]
- Rodriguez, V.O.; Valdez, A.V.; Borderie, C.L.; Pijaudier, C.G.; Rivera, M.H. Estimation of fracture energy from hydraulic fracture tests on mortar and rocks at geothermal reservoir temperatures. Rock Mech. Rock Eng. 2021, 54, 4111–4119. [Google Scholar] [CrossRef]
- Timothy, K. The EGS Collab Project: An intermediate scale field test to address enhanced geothermal system challenges. E3S Web Conf. 2020, 205, 01002. [Google Scholar] [CrossRef]
- Yutkin, M.P.; Radke, C.J.; Patzek, T.W. Chemical compositions in salinity waterflooding of carbonate reservoirs: Theory. Transp. Porous Media 2021, 136, 411–429. [Google Scholar] [CrossRef]
- Talukdar, M.; Roy, D.G.; Singh, T.N. Correlating mode-I fracture toughness and mechanical properties of heat-treated crystalline rocks. J. Rock Mech. Geotech. Eng. 2018, 10, 91–101. [Google Scholar] [CrossRef]
- Wojtacki, K.; Daridon, L.; Monerie, Y. Computing the elastic properties of sandstone submitted to progressive dissolution. Int. J. Rock Mech. Min. Sci. 2017, 95, 16–25. [Google Scholar] [CrossRef] [Green Version]
- Sun, C.; Ling, S.; Wu, X.; Chen, J.; Jiang, W. Oxidation of black shale and its deterioration mechanism in the slip zone of the Xujiaping landslide in Sichuan Province, Southwestern China. Catena 2021, 200, 105139. [Google Scholar] [CrossRef]
- Miao, S.J.; Cai, M.F.; Guo, Q.F.; Wang, P.T.; Liang, M.C. Damage effects and mechanisms in granite treated with acidic chemical solutions. Int. J. Rock Mech. Min. Sci. 2016, 88, 77–86. [Google Scholar] [CrossRef]
- Miao, Z.; Li, S.; Xie, J.; Huo, R.; Li, X. Three-dimensional reconstruction and numerical simulation analysis of acid-corroded sandstone based on CT. Shock. Vib. 2021, 2021, 1–14. [Google Scholar] [CrossRef]
- Paccaloni, G.; Tambini, M. Advances in matrix stimulation technology. J. Pet. Technol. 1993, 45, 256–263. [Google Scholar] [CrossRef]
- Portier, S.; Vuataz, F.D.; Nami, P.; Sanjuan, B.; Gerard, A. Chemical stimulation techniques for geothermal wells: Experiments on the three-well EGS system at Soultz-sous-Forêts, France. Geothermics 2009, 38, 349–359. [Google Scholar] [CrossRef]
- Schill, E.; Genter, A.; Cuenot, N.; Kohl, T. Hydraulic performance history at the Soultz EGS reservoirs from stimulation and long-term circulation tests. Geothermics 2017, 70, 110–124. [Google Scholar] [CrossRef]
- Luo, J.; Zhu, Y.; Guo, Q.; Tan, L.; Zhuang, Y.; Liu, M.; Zhang, C.; Zhu, M.; Xiang, W. Chemical stimulation on the hydraulic properties of artificially fractured granite for enhanced geothermal system. Energy 2018, 142, 754–764. [Google Scholar] [CrossRef]
- Lin, C.; Mao, J.; Yang, X.; Zhao, J. Experimental study on the strength and failure mechanism of hollow hot dry rocks under brazilian splitting tests. Arab. J. Sci. Eng. 2021. [Google Scholar] [CrossRef]
- Liu, X.; Wu, L.; Zhang, Y.; Wu, X. The characteristics of crack existence and development during rock shear fracturing evolution. Bull. Eng. Geol. Environ. 2020, 80, 1671–1682. [Google Scholar] [CrossRef]
- Misra, S.; Mandal, N.; Dhar, R.; Chakraborty, C. Mechanisms of deformation localization at the tips of shear fractures: Findings from analogue experiments and field evidence. J. Geophys. Res. Solid Earth 2009, 114. [Google Scholar] [CrossRef]
- Willemse, E.J.M.; Pollard, D.D. On the orientation and patterns of wing cracks and solution surfaces at the tips of a sliding flaw or fault. J. Geophys. Res. Solid Earth 1998, 103, 2427. [Google Scholar] [CrossRef]
- Einstein, A.B.H. Fracture coalescence in rock-type materials under uniaxial and biaxial compression. Int. J. Rock Mech. Min. Sci. 1998, 35, 863–888. [Google Scholar]
- Lee, H.; Jeon, S. An experimental and numerical study of fracture coalescence in pre-cracked specimens under uniaxial compression. Int. J. Solids Struct. 2011, 48, 979–999. [Google Scholar] [CrossRef] [Green Version]
- Wong, R.; Chau, K.T. Crack coalescence in a rock-like material containing two cracks. Int. J. Rock Mech. Min. Sci. 1998, 35, 147–164. [Google Scholar] [CrossRef]
- Wang, Z.; Zeng, Q.; Lu, Z.; Wan, L.; Gao, G. Numerical simulation of conical pick cutting arc rock plate fracture based on ANSYS/LS-DYNA. Adv. Mater. Sci. Eng. 2020, 2020, 6563520. [Google Scholar] [CrossRef]
- Zhang, W. Numerical and theoretical analysis on hydraulic fracture of rock masses based on contour integral and auto-remeshing technology. Geotech. Geol. Eng. 2020, 38, 4675–4684. [Google Scholar] [CrossRef]
- Fu, J.W.; Chen, K.; Zhu, W.S.; Zhang, X.Z.; Li, X.J. Progressive failure of new modelling material with a single internal crack under biaxial compression and the 3-D numerical simulation. Eng. Fract. Mech. 2016, 165, 140–152. [Google Scholar] [CrossRef]
- Mei, W.; Li, M.; Pan, P.Z.; Pan, J.; Liu, K. Blasting induced dynamic response analysis in a rock tunnel based on combined inversion of Laplace transform with elasto-plastic cellular automaton. Geophys. J. Int. 2021, 225, 699–710. [Google Scholar] [CrossRef]
- Potyondy, D.O.; Cundall, P.A. A bonded particle model for rock. Int. J. Rock Mech. Min. Sci. 2004, 41, 1329–1364. [Google Scholar] [CrossRef]
- Hadjigeorgiou, J.; Esmaieli, K.; Grenon, M. Stability analysis of vertical excavations in hard rock by integrating a fracture system into a PFC model. Tunn. Undergr. Space Technol. 2009, 24, 296–308. [Google Scholar] [CrossRef]
- Shemirani, A.B.; Sarfarazi, V.; Haeri, H. Direct and indirect methods for determination of mode I fracture toughness using PFC2D. Comput. Concr. 2017, 20, 57–63. [Google Scholar]
- Li, S.; Liu, J.; Zhao, G.; Wu, F.; Han, Z.; Yang, Z. Key geochronology of Mesozoic deformation in the eastern block of the North China Craton and its constraints on regional tectonics: A case of Jiaodong and Liaodong Peninsula. Acta Petrol. Sin. 2004, 2, 633–646. [Google Scholar]
- Liu, J.L.; Mo, J.I.; Shen, L.; Guan, H.M.; Davis, G.A. Early Cretaceous extensional structures in the Liaodong Peninsula:Structural associations, geochronological constraints and regional tectonic implications. Sci. China 2011, 54, 823–842. [Google Scholar] [CrossRef]
- Liu, H.J.; Wang, H.W.; Lei, H.W.; Zhang, L.W.; Zhou, L. Numerical modeling of thermal breakthrough induced by geothermal production in fractured granite. J. Rock Mech. Geotech. Eng. 2020, 12, 900–916. [Google Scholar] [CrossRef]
- Claudio, D.P.; Alessio, A.; Joel, S.; Lionel, E.; Emilie, C. Micro-crack enhanced permeability in tight rocks: An experimental and microstructural study. Tectonophysics 2015, 665, 149–156. [Google Scholar]
- Liu, H.J.; Shi, Y.K.; Fang, Z.M.; Liu, J.F.; Zhang, L.W.; Tong, R.C. Seepage characteristics of thermally and chemically treated Mesozoic granite from geothermal region of Liaodong Peninsula. Environ. Earth Sci. 2021, 80, 599. [Google Scholar] [CrossRef]
- Crundwell, F.K. The mechanism of dissolution of minerals in acidic and alkaline solutions: Part II application of a new theory to silicates, aluminosilicates and quartz. Hydrometallurgy 2014, 149, 265–275. [Google Scholar] [CrossRef]
- Tsomaia, N.; Brantley, S.L.; Hamilton, J.P.; Pantano, C.G.; Mueller, K.T. NMR evidence for formation of octahedral and tetrahedral Al and repolymerization of the Si network during dissolution of aluminosilicate glass and crystal. Am. Mineral. 2003, 88, 54–67. [Google Scholar] [CrossRef]
- Cheng, C.; Chen, X.; Zhang, S.F. Multi-peak deformation behavior of jointed rock mass under uniaxial compression: Insight from particle flow modeling. Eng. Geol. 2016, 213, 25–45. [Google Scholar] [CrossRef]
- Fakhimi, A.; Villegas, T. Application of dimensional analysis in calibration of a discrete element model for rock deformation and fracture. Rock Mech. Rock Eng. 2007, 40, 193–211. [Google Scholar] [CrossRef]
- Yoon, J. Application of experimental design and optimization to PFC model calibration in uniaxial compression simulation. Int. J. Rock Mech. Min. Sci. 2007, 44, 871–889. [Google Scholar] [CrossRef]
- Li, W.H.H. Relationship between the deformation characteristics and microscopic properties of sandstone explored by the bonded-particle model. Int. J. Rock Mech. Min. Sci. 2012, 56, 34–43. [Google Scholar]
- Bai, S.; Ren, W.; Feng, D.; Chen, J.; Chia, J. Failure mechanism and strength properties of rockmass containing close intermittent joints under plane stress condition. Chin. J. Rock Mech. Eng. 1999, 18, 635–640. [Google Scholar]
- Xian, W.P.; Li, X.B.; Zhao, Q.; Han, G. Strength and deformation characteristics of rock with single pre-existing fissure under different loading conditions. China Meas. Test. 2017, 43, 124–129. [Google Scholar]
- Bian, K.; Chen, Y.A.; Liu, J.; Cui, D.S.; Li, Y.R.; Liang, W.D.; Han, X. The unloading failure characteristics of shale under different water absorption time using the PFC numerical method. Rock Soil Mech. 2020, 41, 355–367. [Google Scholar]
- Zhou, F.X.; Zhao, M.; Ying, S. Analysis of mechanical behavior for unsaturated soil by three-dimensional discrete element method. J. Fuzhou Univ. 2020, 48, 779–785. [Google Scholar]
- Shen, H.M.; Li, Q.; Li, X.Y.; Ma, J.L. Laboratory experiment and numerical simulation on brittle failure characteristics of Longmaxi formation shale in Southern Sichuan under different stress conditions. Rock Soil Mech. 2018, 39, 254–262. [Google Scholar]
- Huang, D.; Li, X.Q.; Zou, J.Z.; Song, W.C. Crack evolution and energy dissipation of marble containing flaws. J. Yangtze River Sci. Res. Inst. 2020, 37, 130–136. [Google Scholar]
- Li, X.; He, X.; Chen, H. Crack initiation characteristics of opening-mode crack embedded in rock-like material under seepage pressure. Chin. J. Rock Mech. Eng. 2012, 31, 1317–1324. [Google Scholar]
- Yang, S.Q.; Jing, H.W. Strength failure and crack coalescence behavior of brittle sandstone samples containing a single fissure under uniaxial compression. Int. J. Fract. 2011, 168, 227–250. [Google Scholar] [CrossRef]
- Wong, R.; Chau, K.T.; Tang, C.A.; Lin, P. Analysis of crack coalescence in rock-like materials containing three flaws—Part I: Experimental approach. Int. J. Rock Mech. Min. Sci. 2001, 38, 909–924. [Google Scholar] [CrossRef]
- Chen, Y.; Zuo, J.P.; Li, Z.H.; Dou, R. Experimental investigation on the crack propagation behaviors of sandstone under different loading and unloading conditions. Int. J. Rock Mech. Min. Sci. 2020, 130, 104310. [Google Scholar] [CrossRef]
Figure 1.
(a) Complex fracture system in the Sanguliu granite in the field; (b) microcracks observed by the optical microscopy (Kfs: K-feldspar, Qtz: quartz, Hbl: hornblende, Bt: biotite).
Figure 1.
(a) Complex fracture system in the Sanguliu granite in the field; (b) microcracks observed by the optical microscopy (Kfs: K-feldspar, Qtz: quartz, Hbl: hornblende, Bt: biotite).
Figure 2.
Distribution characteristics of spectra of granite corroded by mud acid solutions with three different concentration (S1–S3) (S0 is the original granite sample without mud acid corrosion for comparison).
Figure 2.
Distribution characteristics of spectra of granite corroded by mud acid solutions with three different concentration (S1–S3) (S0 is the original granite sample without mud acid corrosion for comparison).
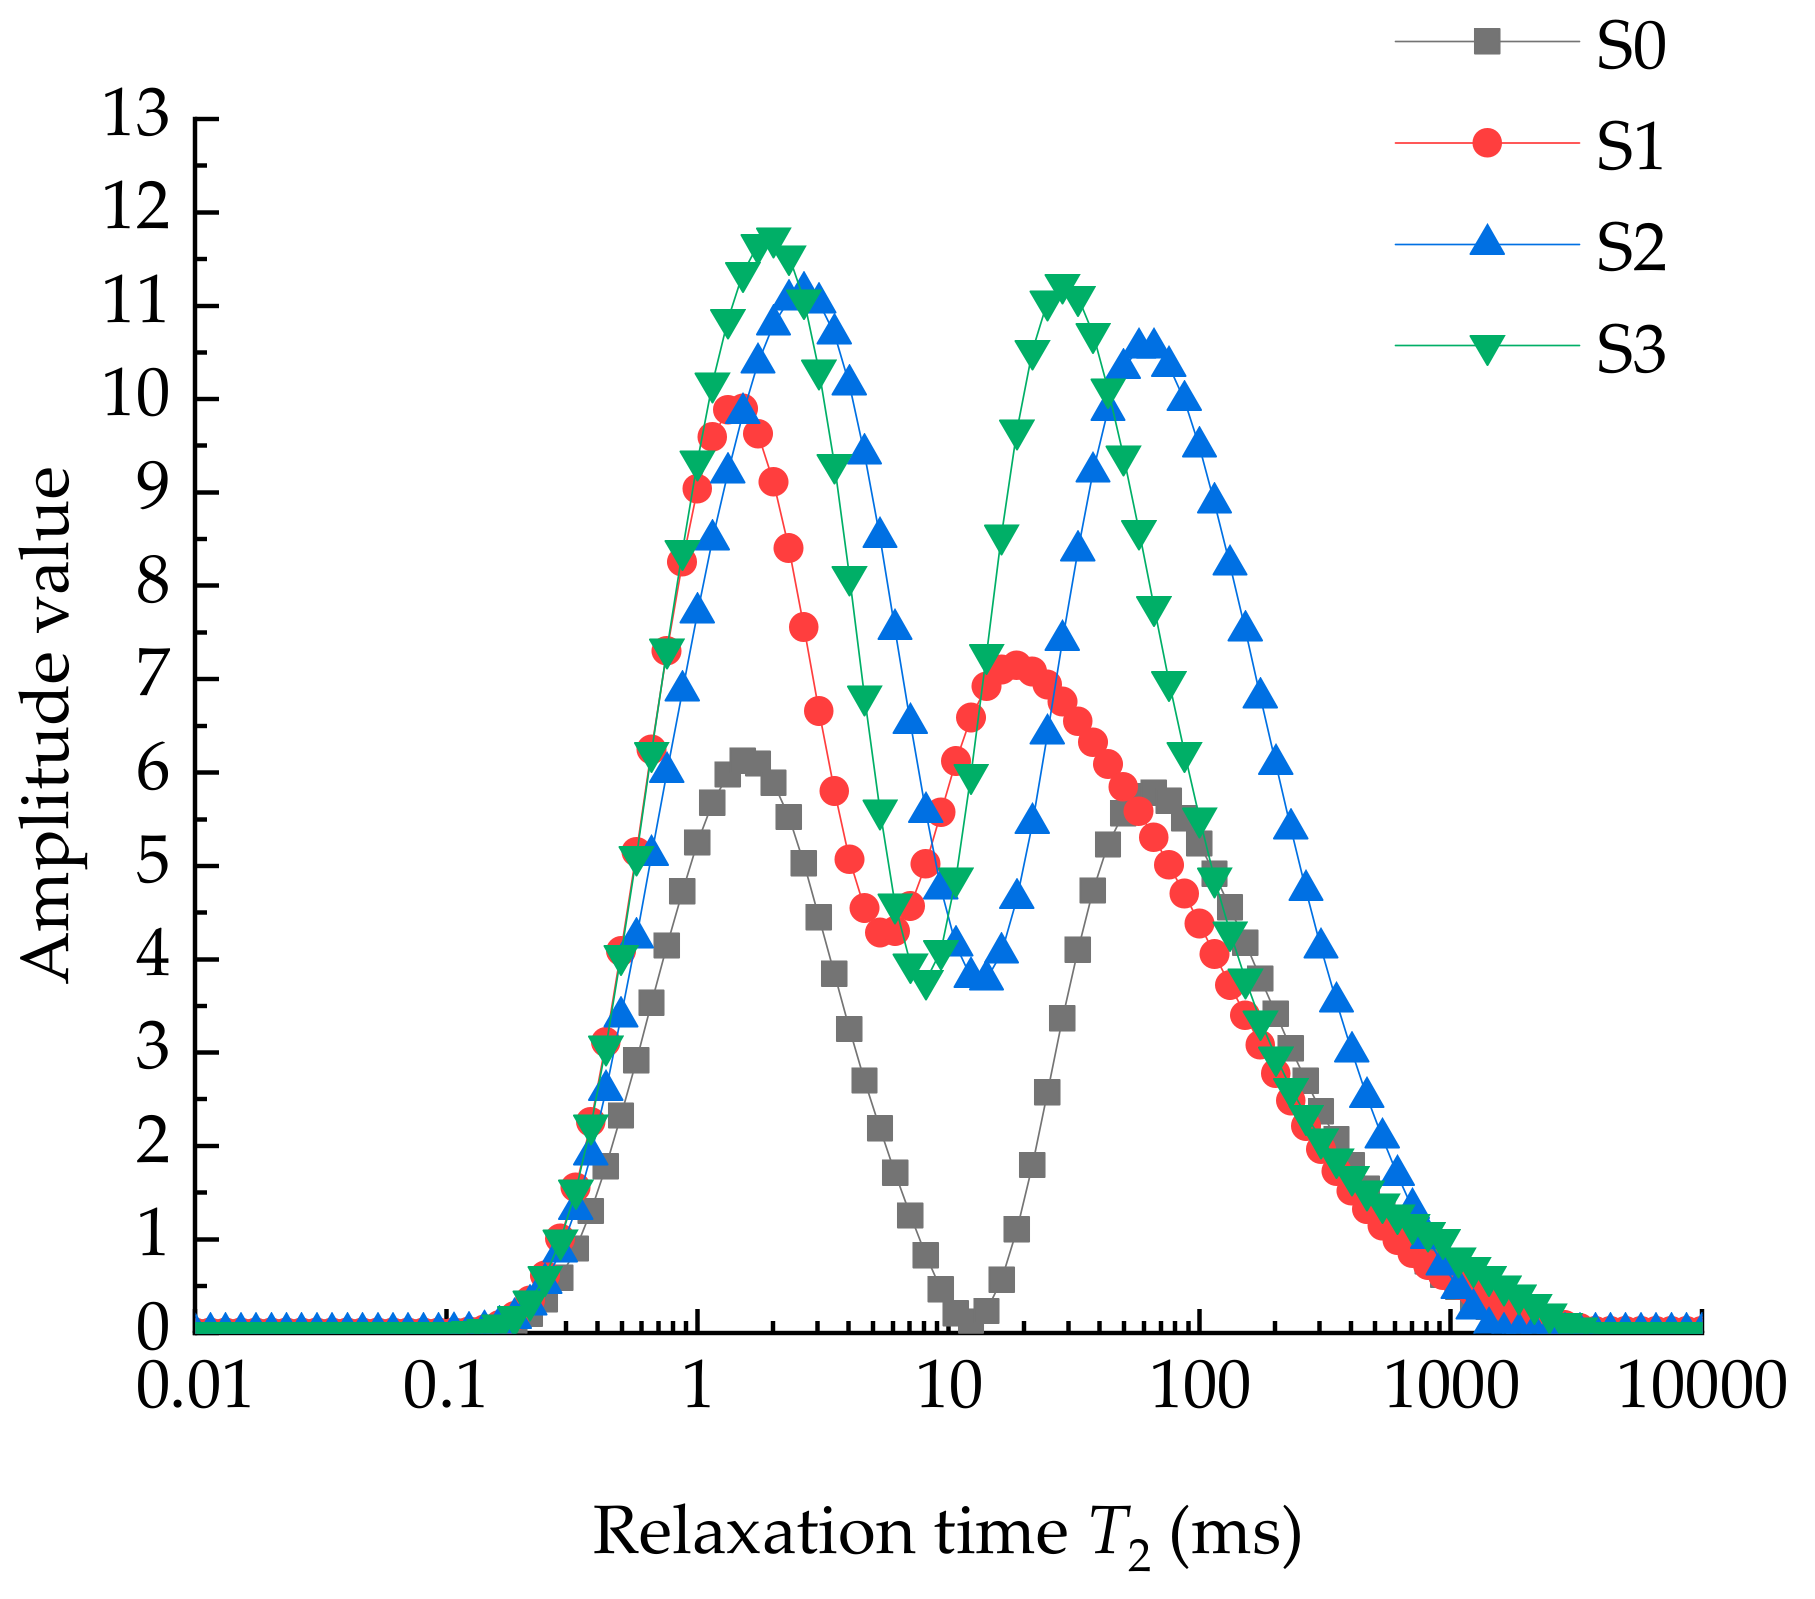
Figure 3.
(a,b): Scanning electron microscopy observations of corrosion pores in a granite sample (S3) corroded by high concentration mud acid solution [37].
Figure 3.
(a,b): Scanning electron microscopy observations of corrosion pores in a granite sample (S3) corroded by high concentration mud acid solution [37].
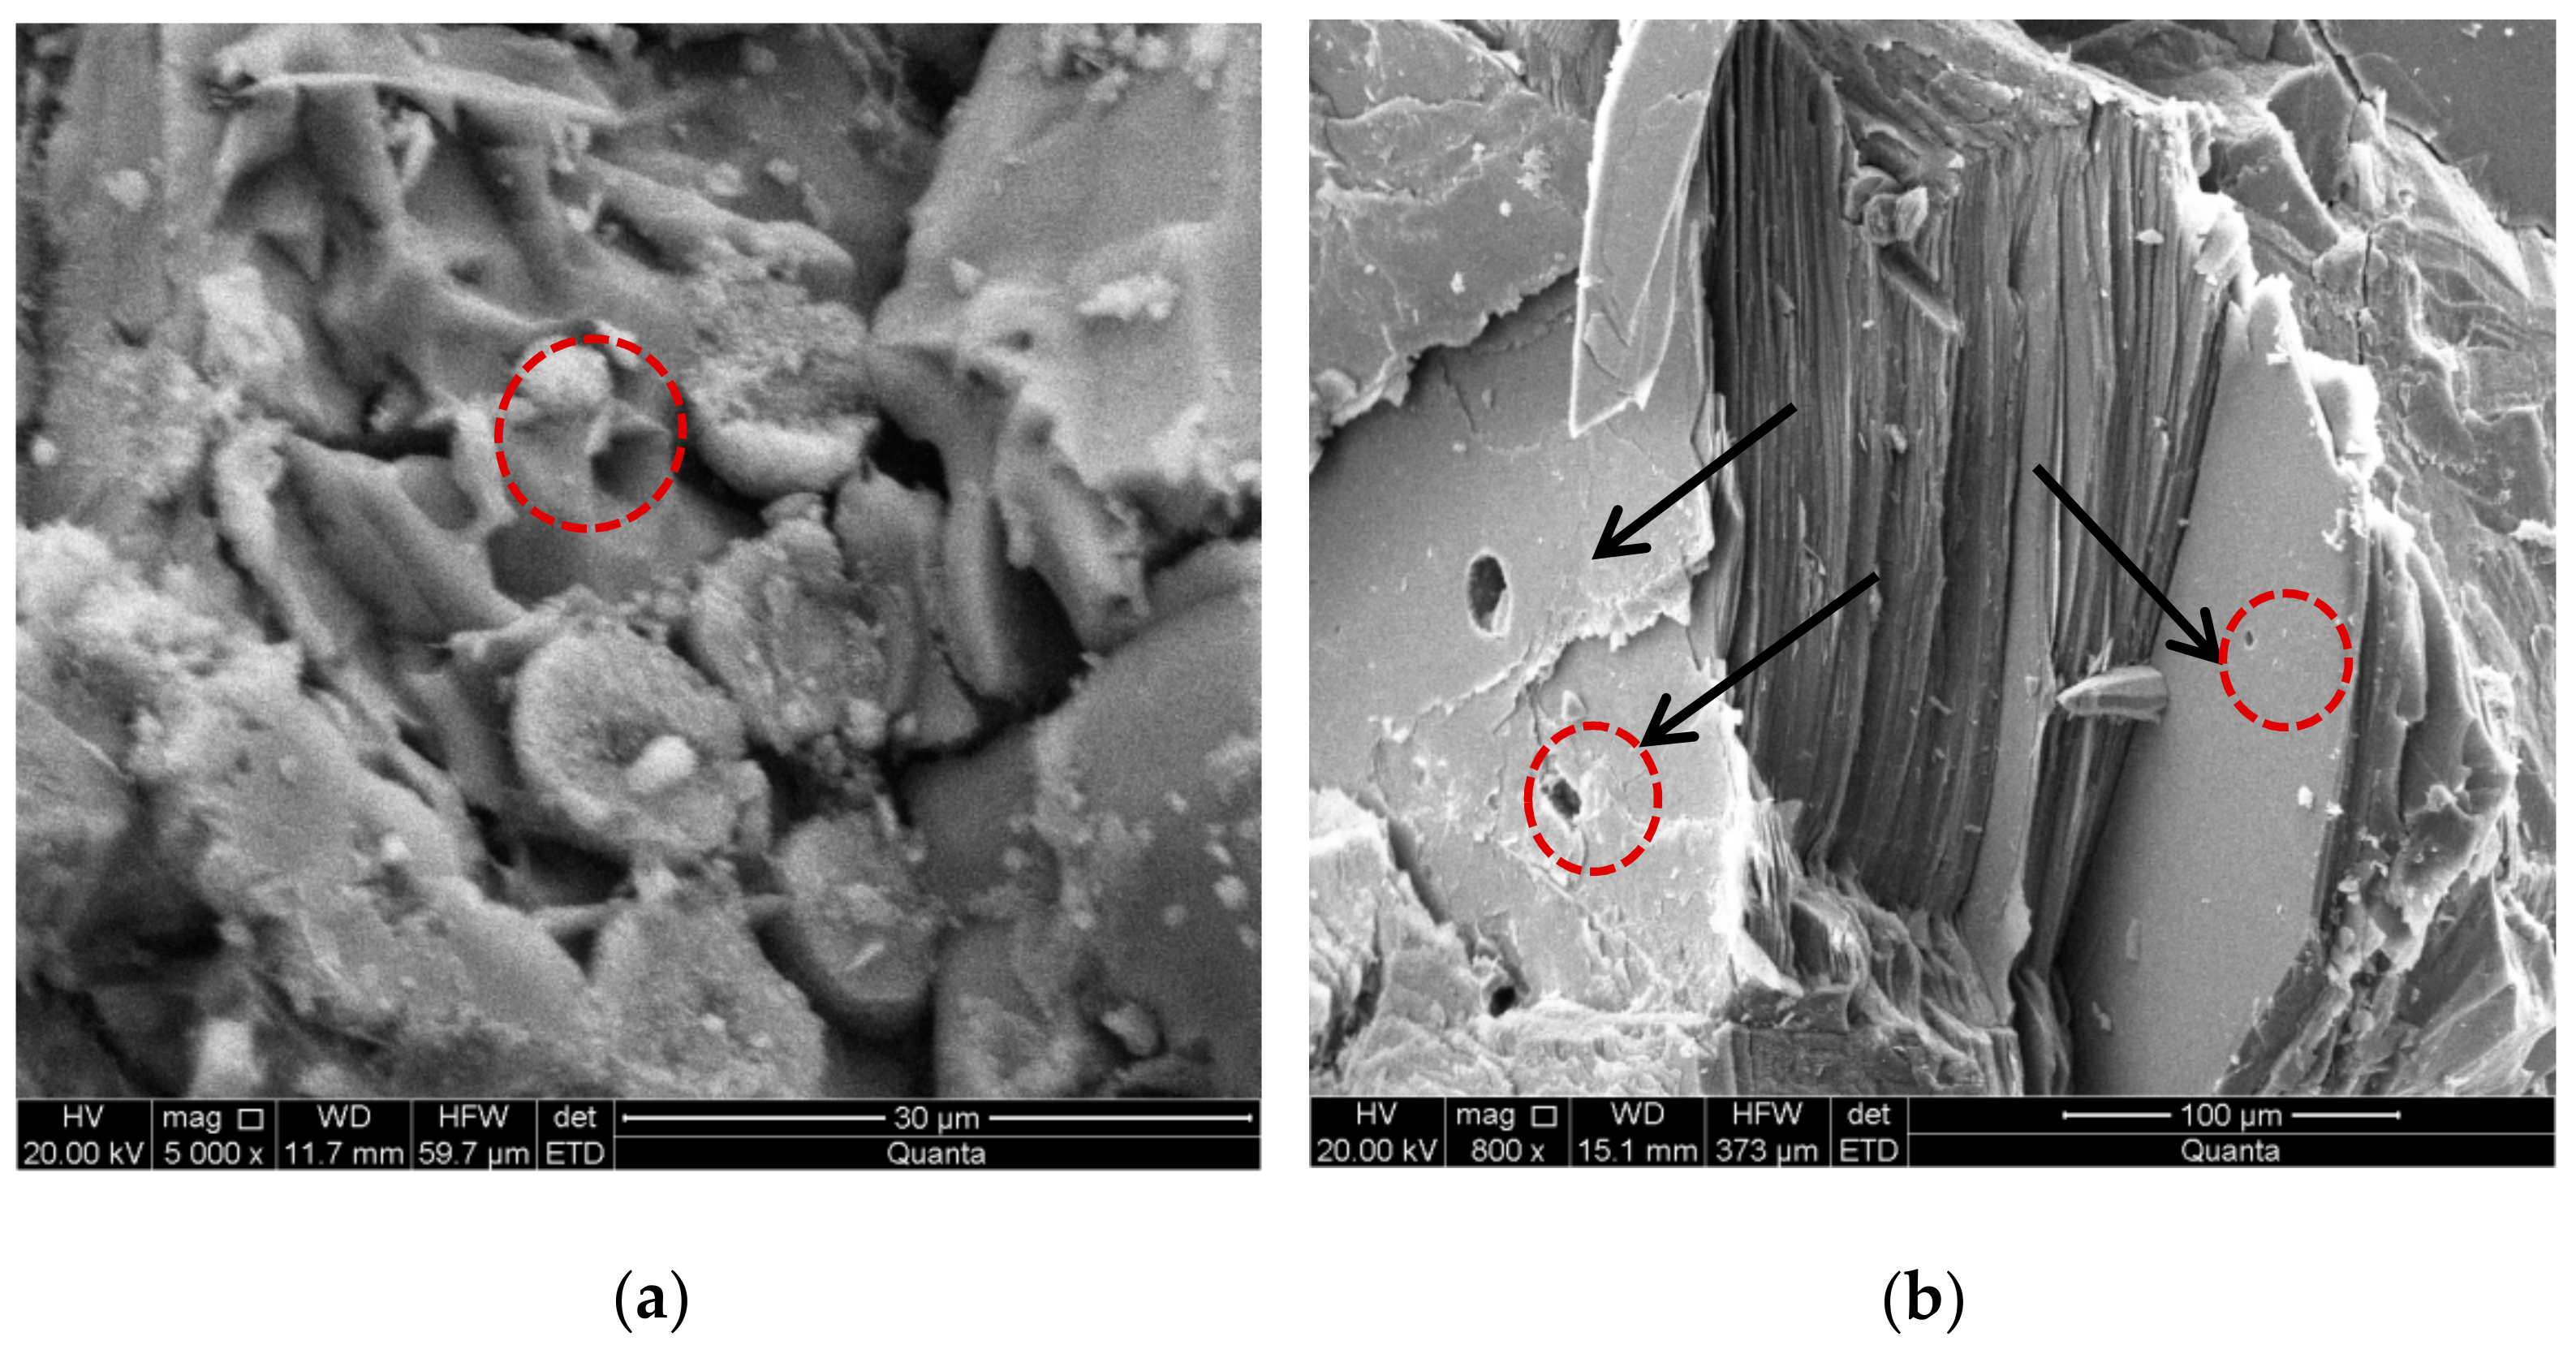
Figure 4.
Stress-strain curve of triaxial compression test of granite before and after corrosion.

Figure 5.
The granite samples after triaxial compression tests: (a) S0; (b) S1; (c) S2; (d) S3.
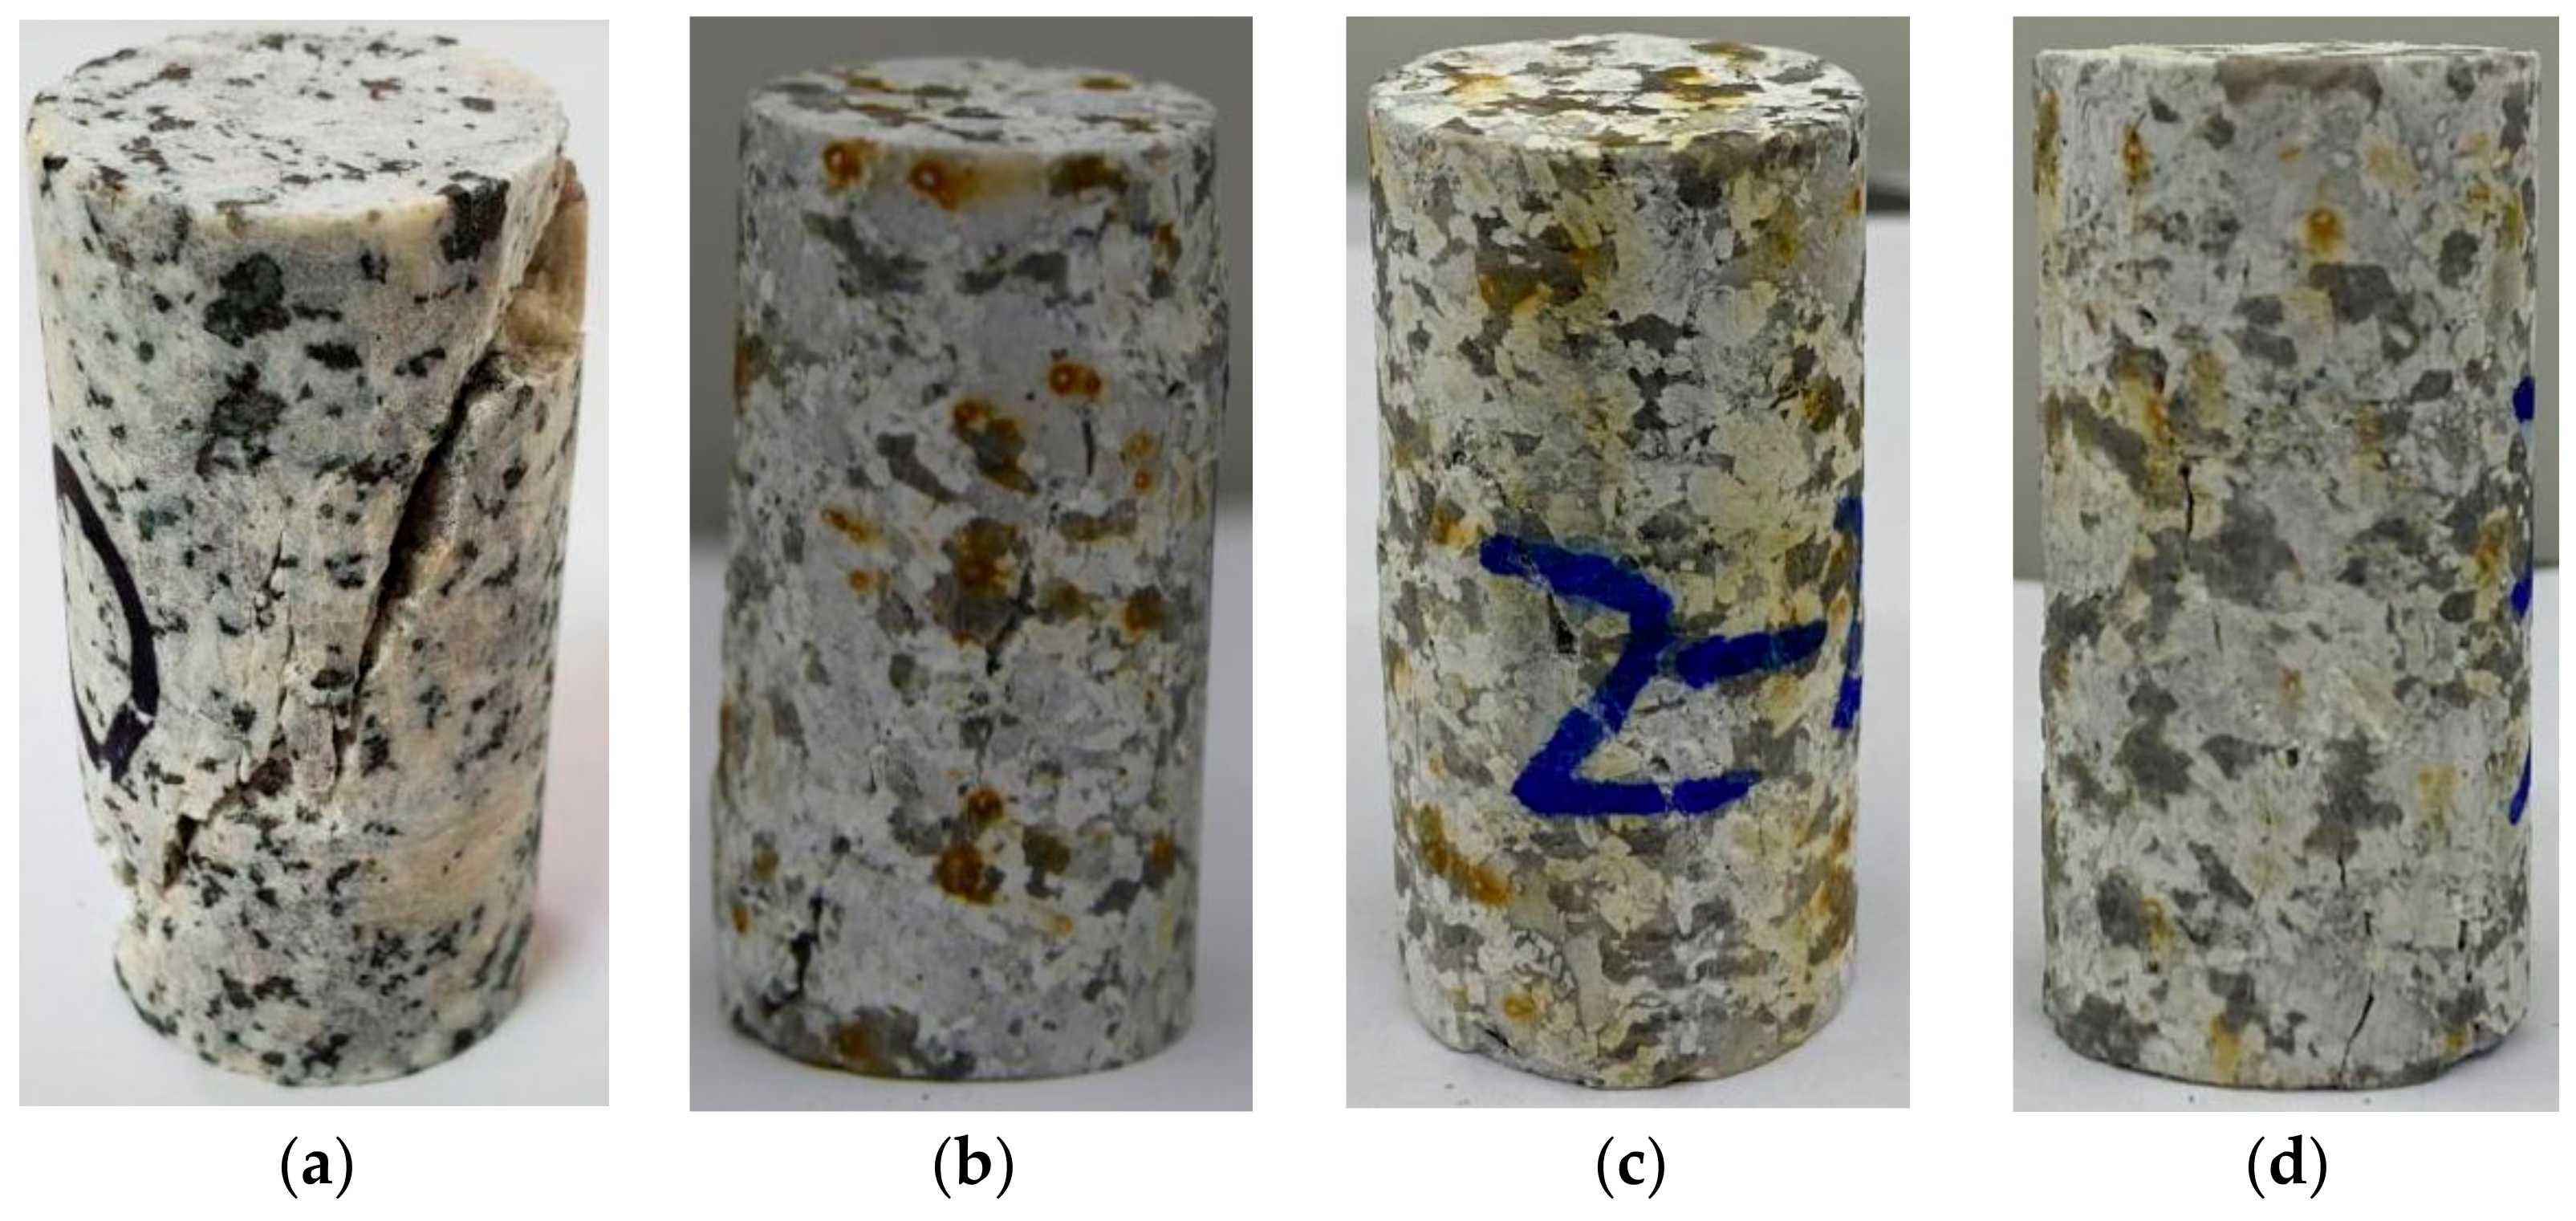
Figure 6.
Linear parallel bond model and smooth-joint model between particles: (a) Linear parallel bond model; (b) Smooth-joint model.
Figure 6.
Linear parallel bond model and smooth-joint model between particles: (a) Linear parallel bond model; (b) Smooth-joint model.
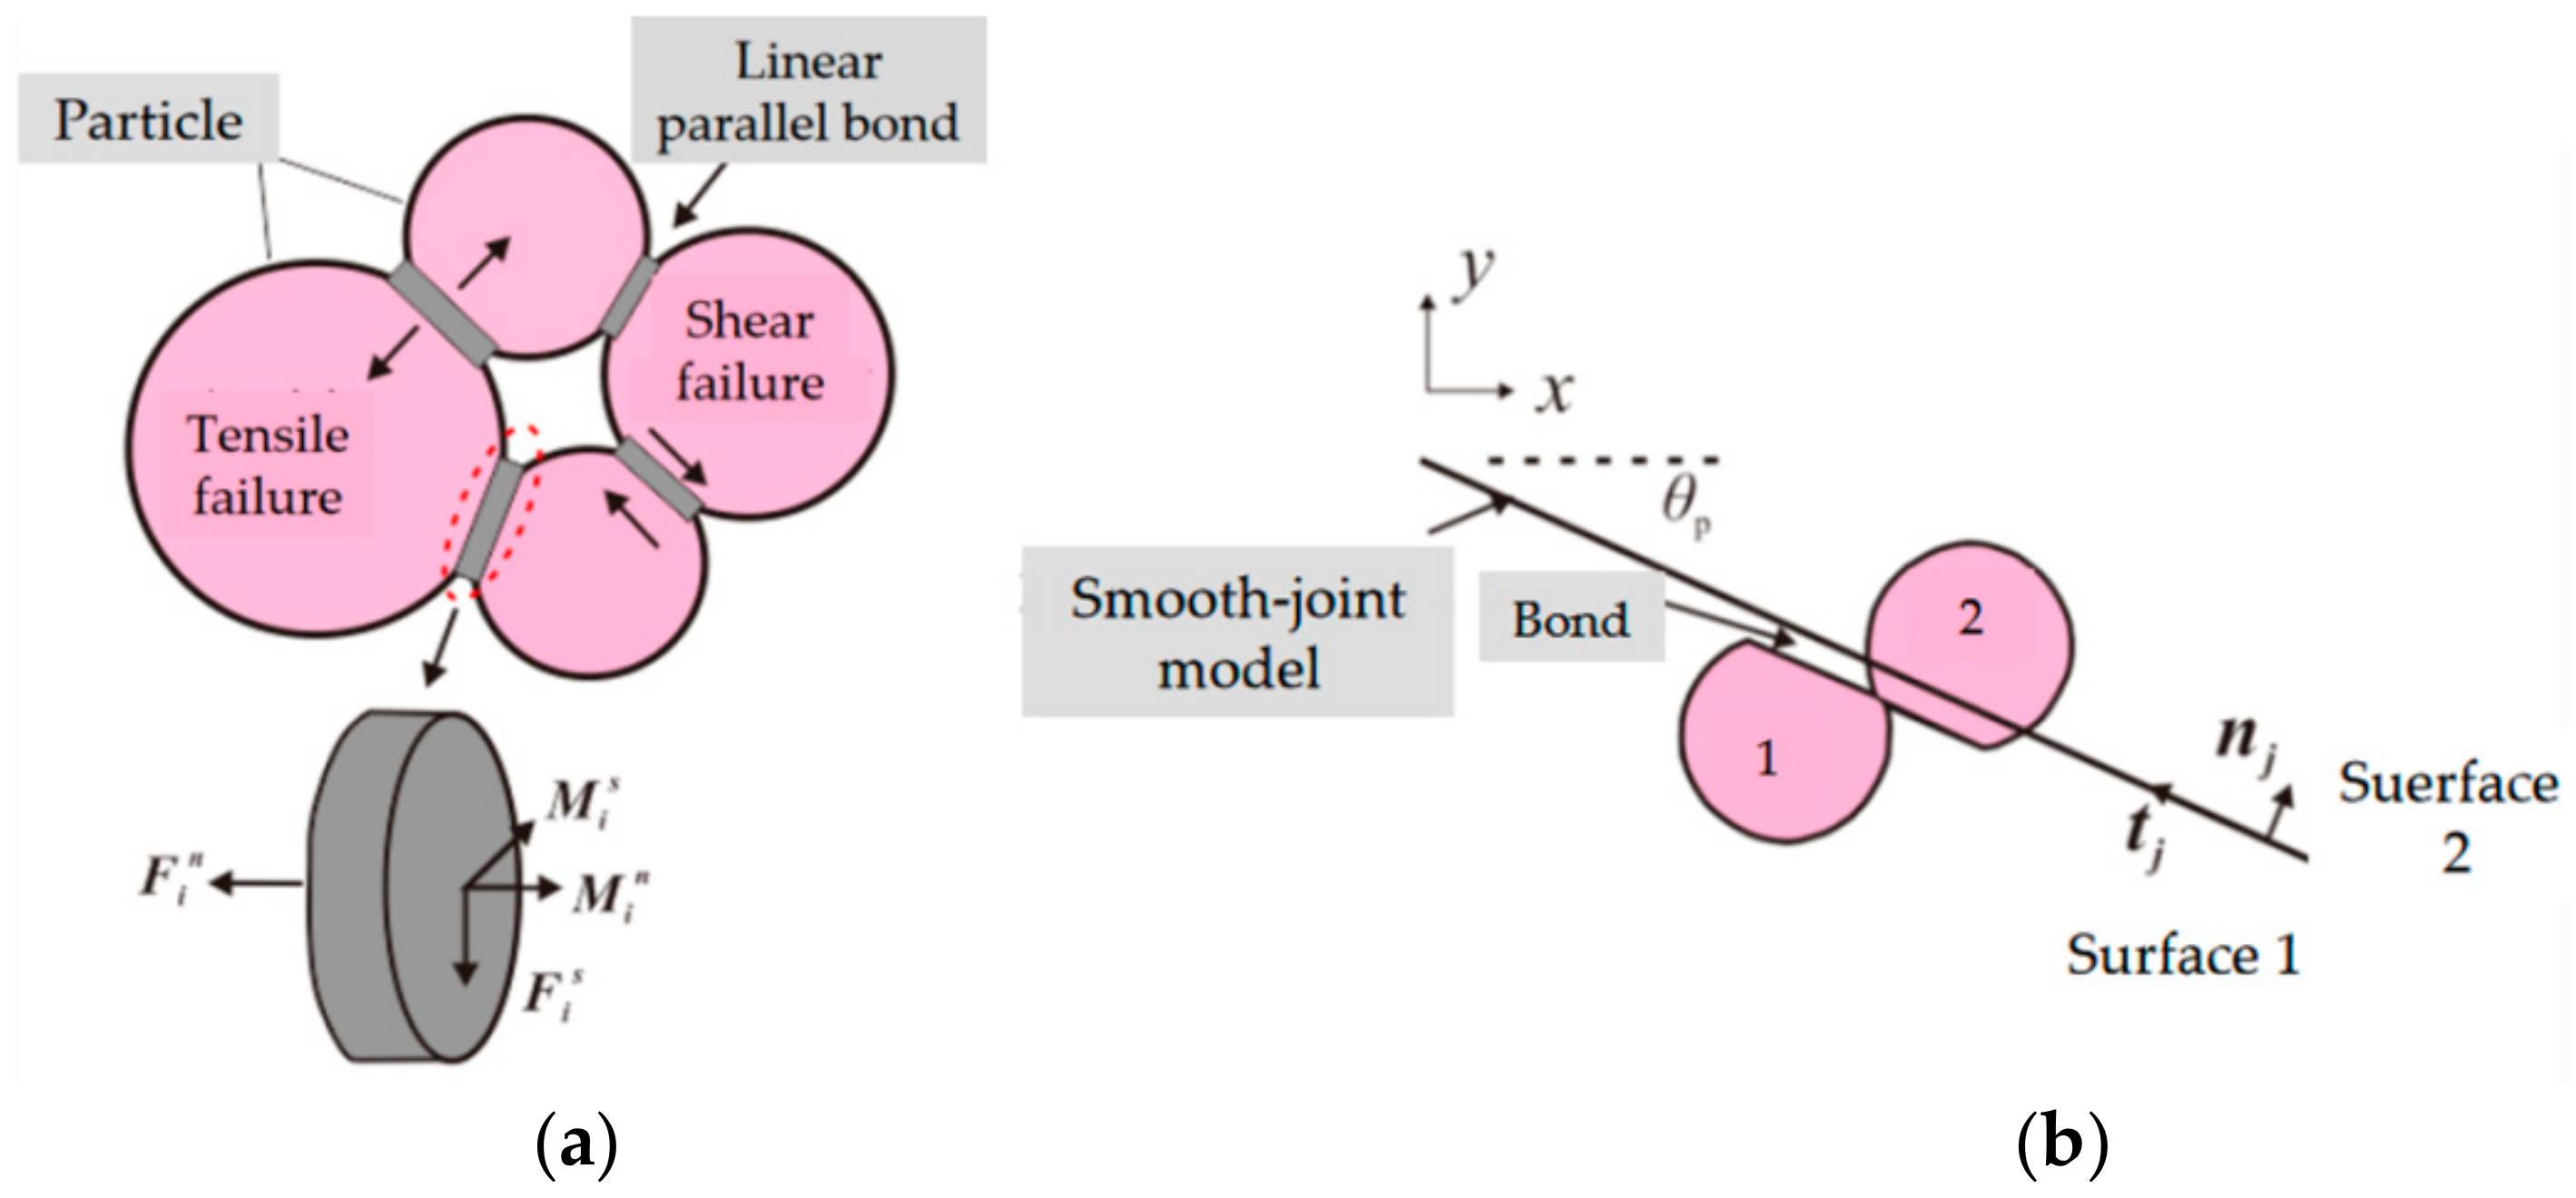
Figure 7.
Two-dimensional geometry of the granite with single closed crack in the PFC2D: (a) Geometric sketch; (b) Model with particles and contacts; (c) A partial enlarged view of (b).
Figure 7.
Two-dimensional geometry of the granite with single closed crack in the PFC2D: (a) Geometric sketch; (b) Model with particles and contacts; (c) A partial enlarged view of (b).
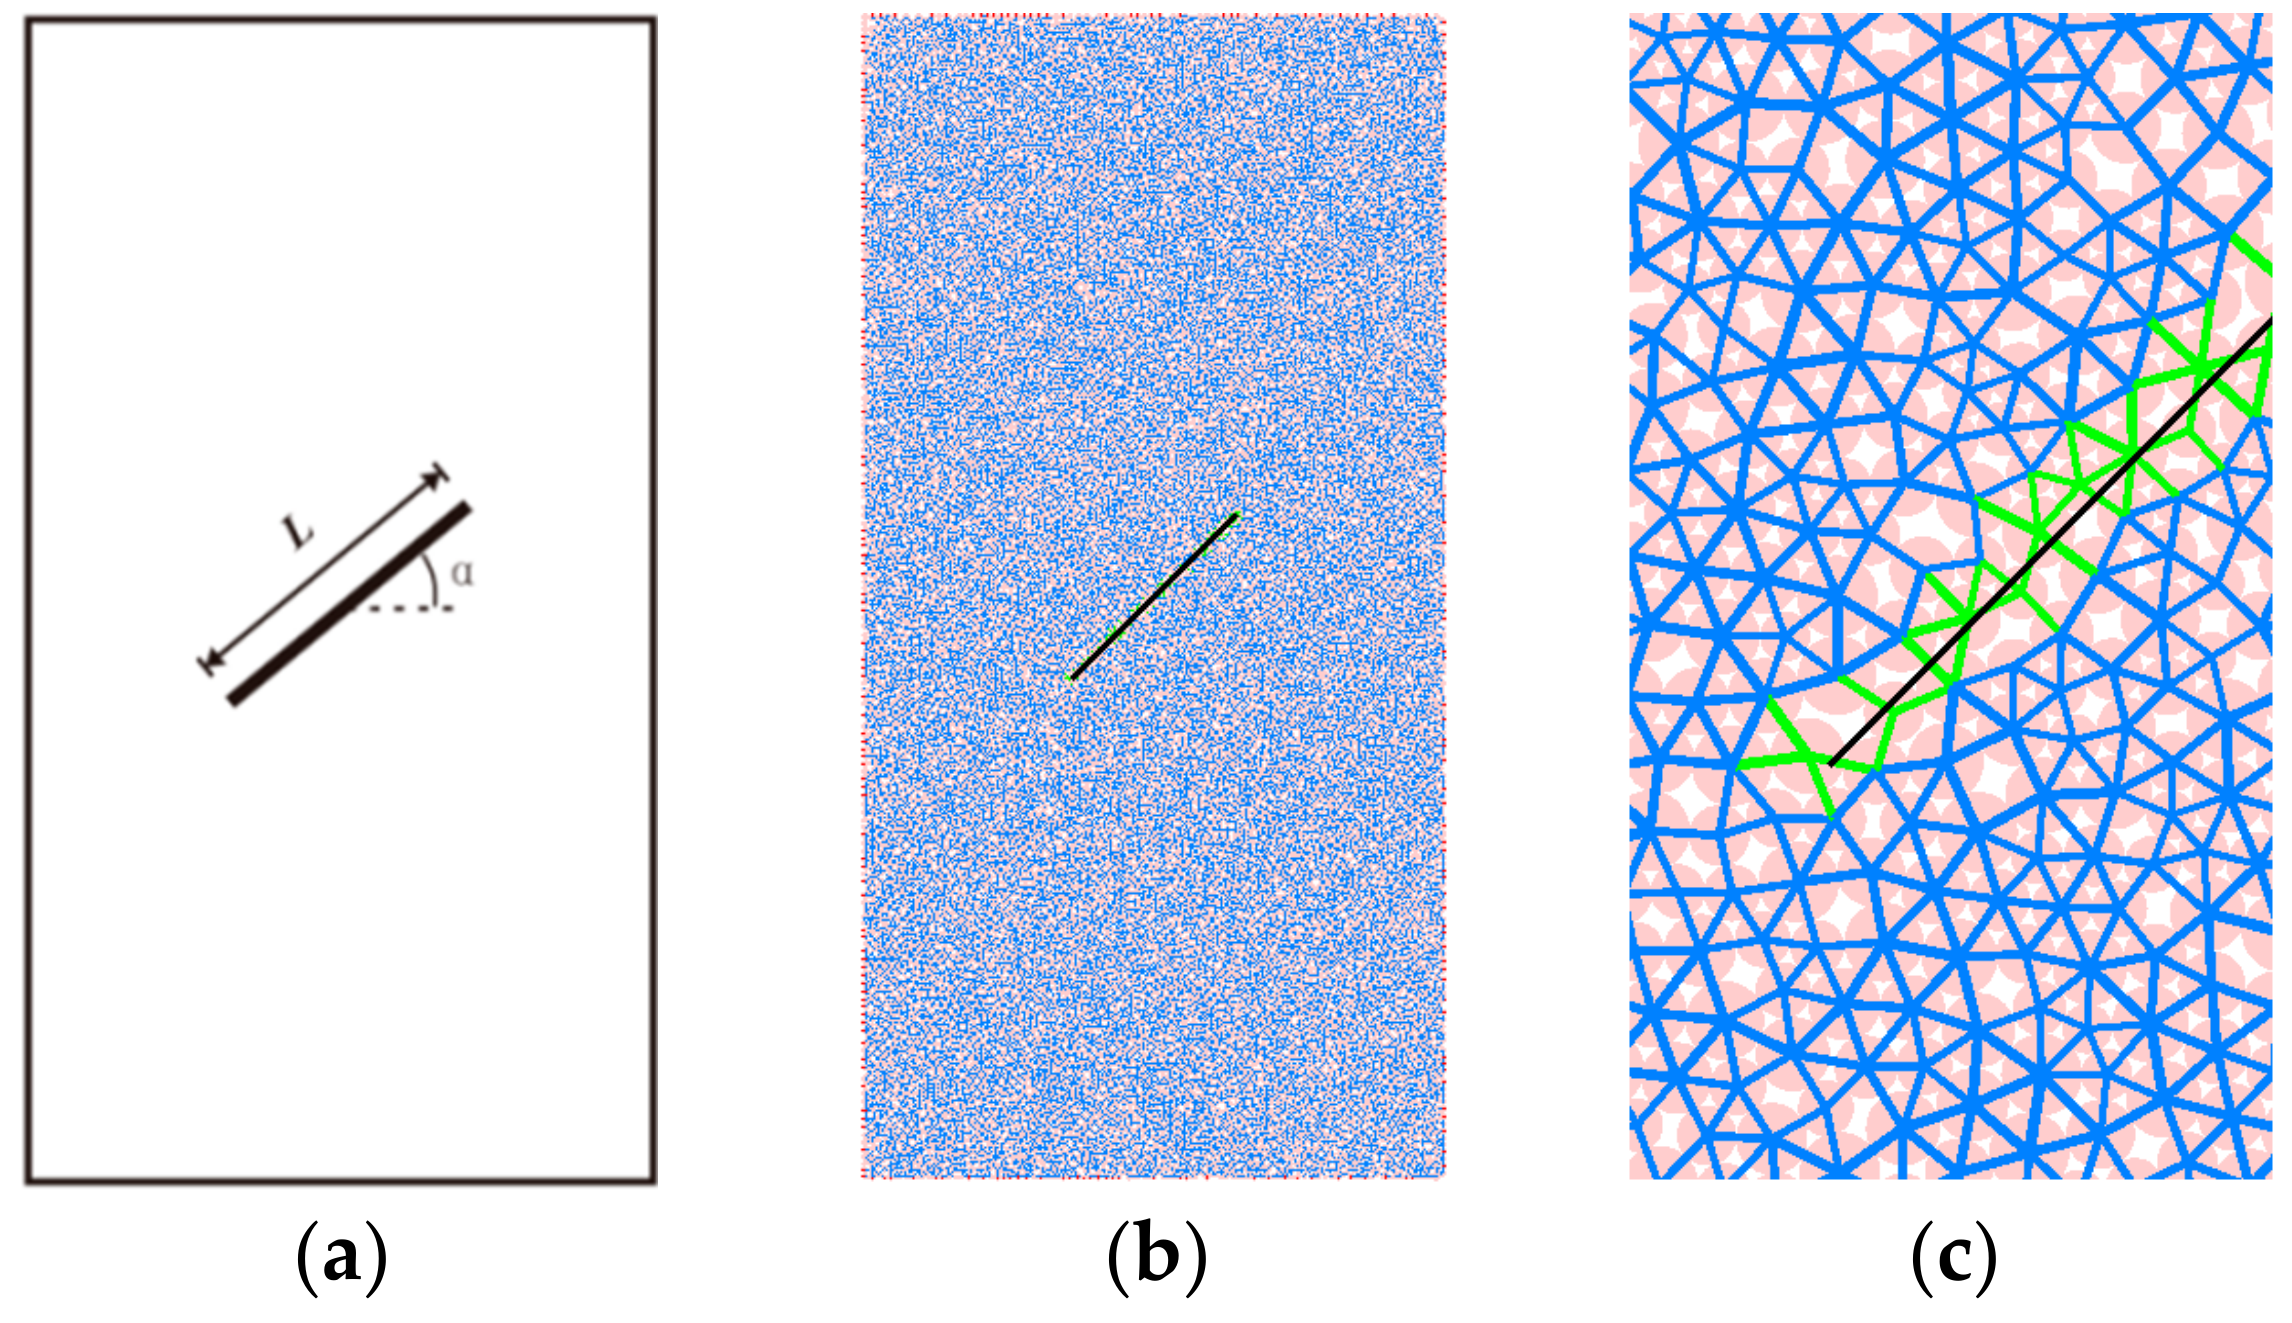
Figure 8.
Relationship between deviatoric stress, number of microcracks, cumulative number of microcracks and axial strain.
Figure 8.
Relationship between deviatoric stress, number of microcracks, cumulative number of microcracks and axial strain.
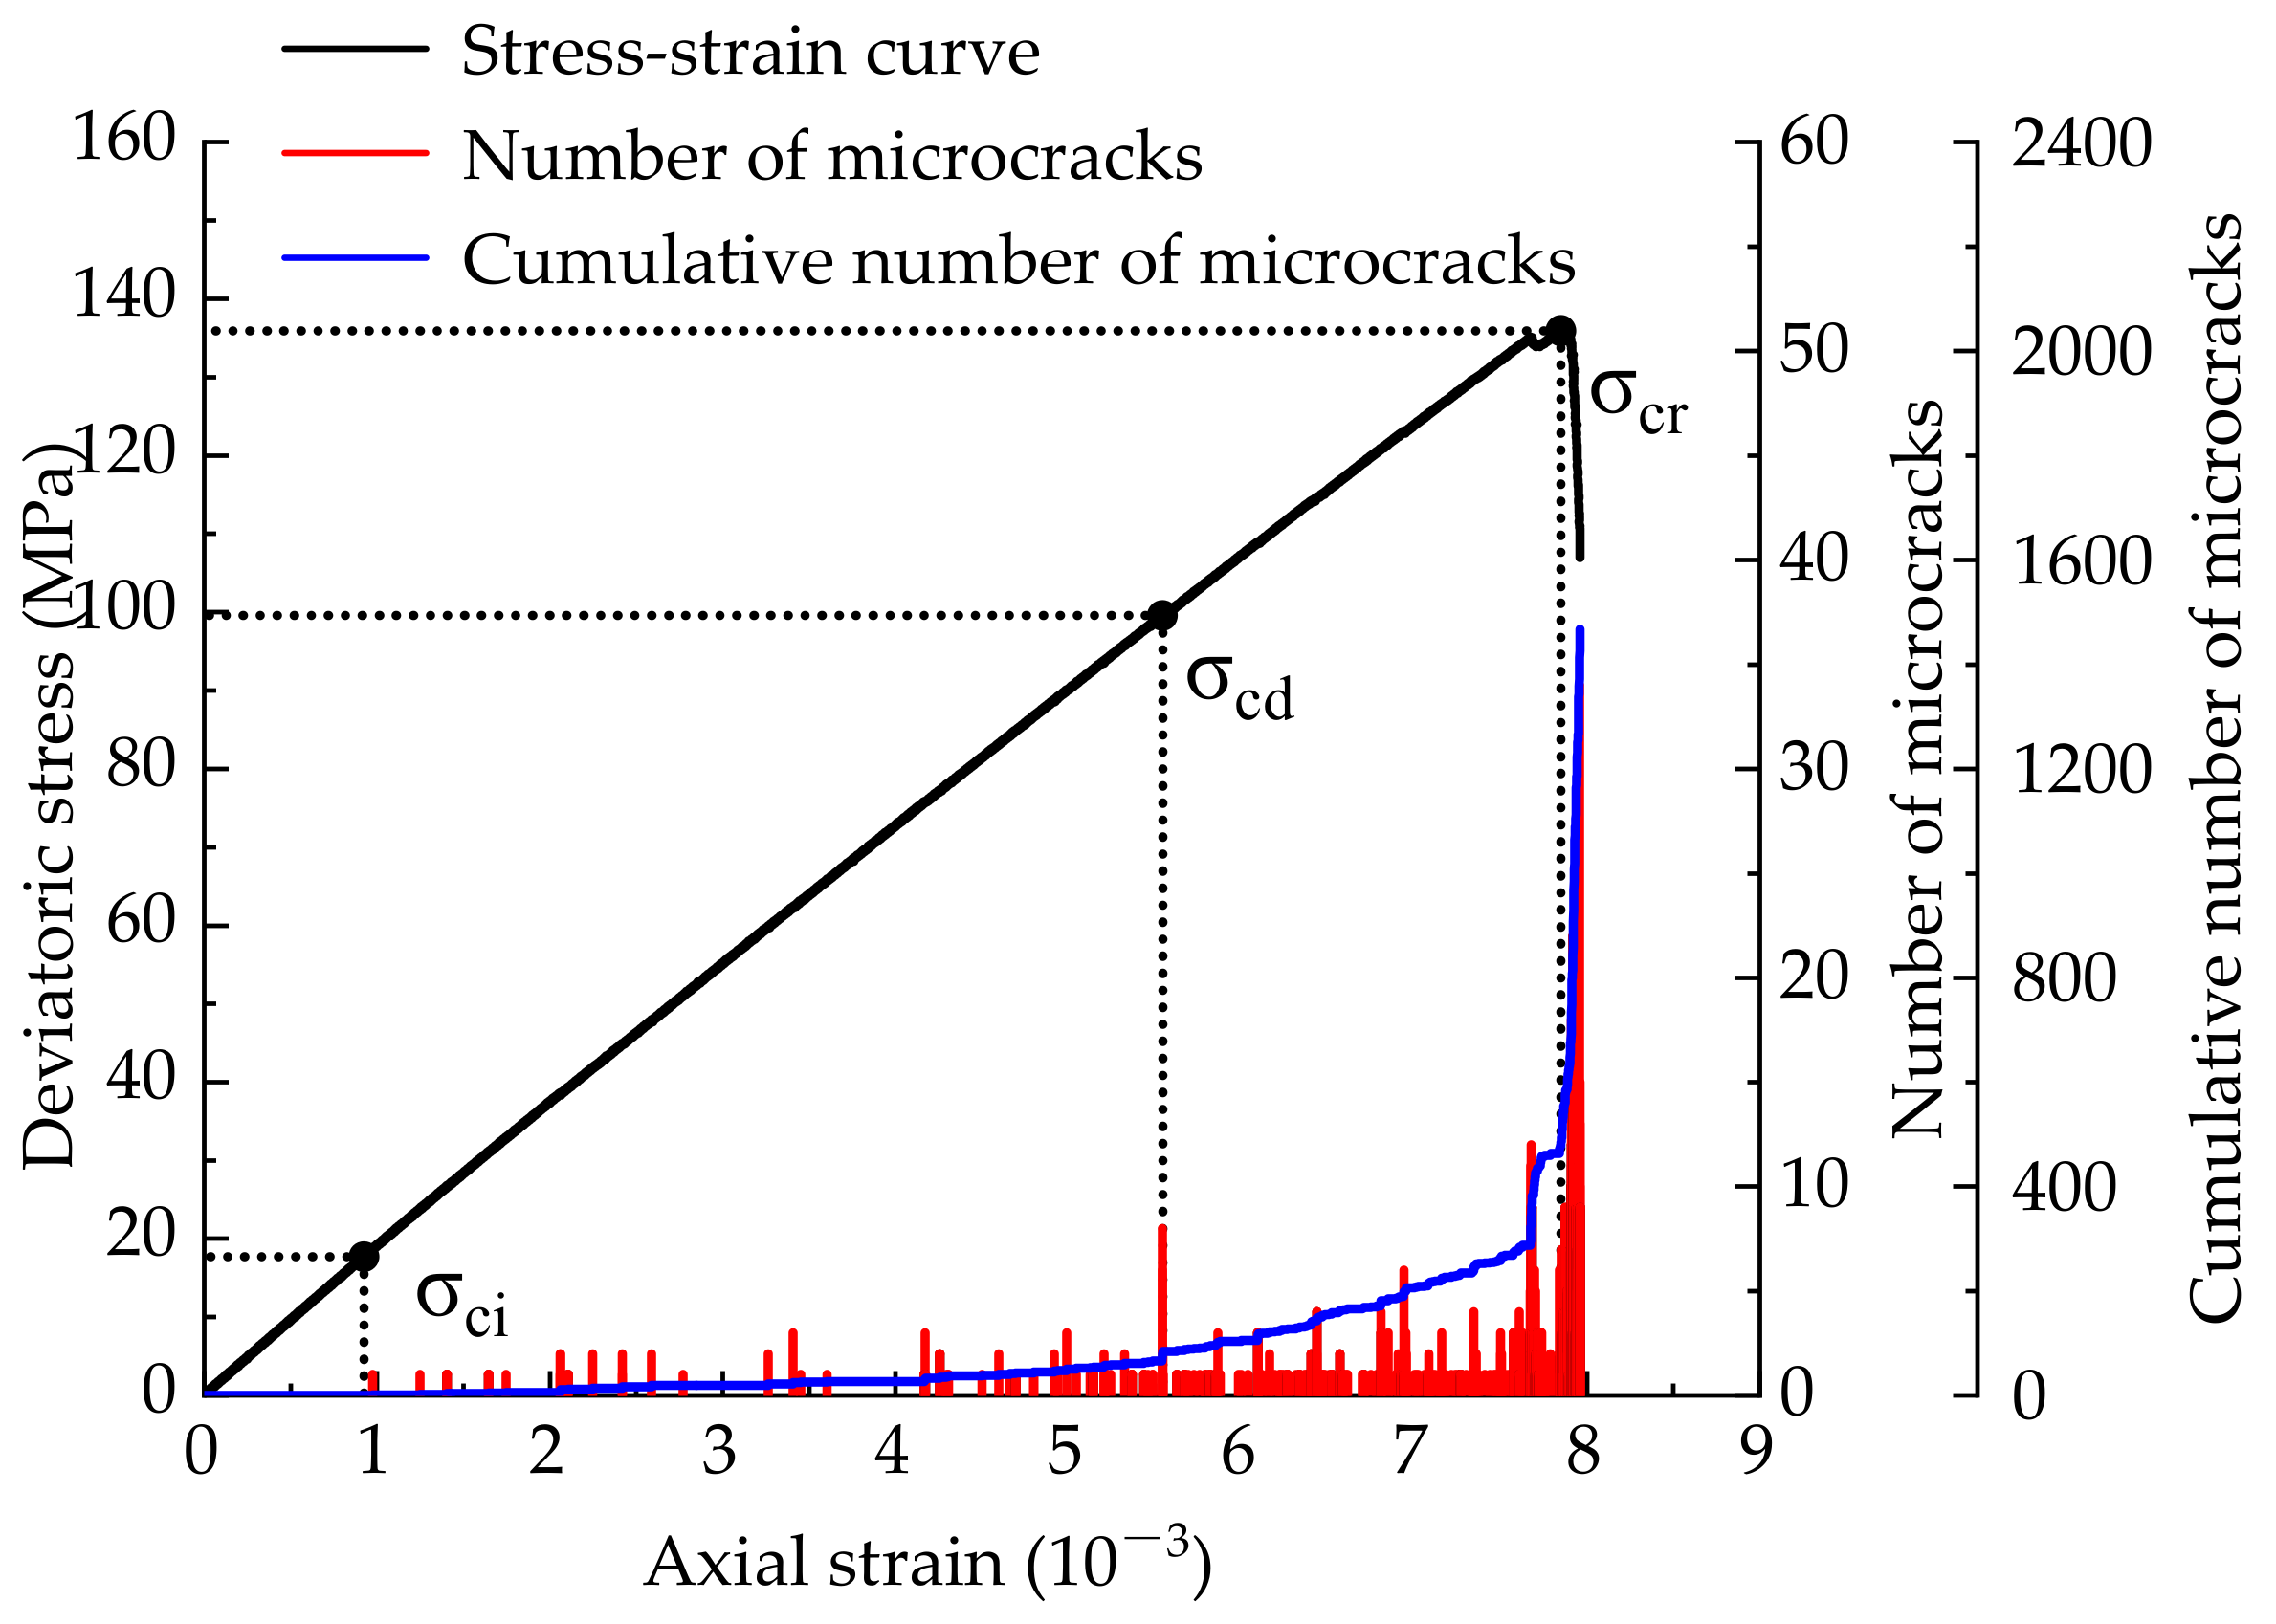
Figure 9.
Dynamic failure process of simulated granite sample with single closed crack: (a) ; (b) ; (c) ; (d) ; (e) .
Figure 9.
Dynamic failure process of simulated granite sample with single closed crack: (a) ; (b) ; (c) ; (d) ; (e) .
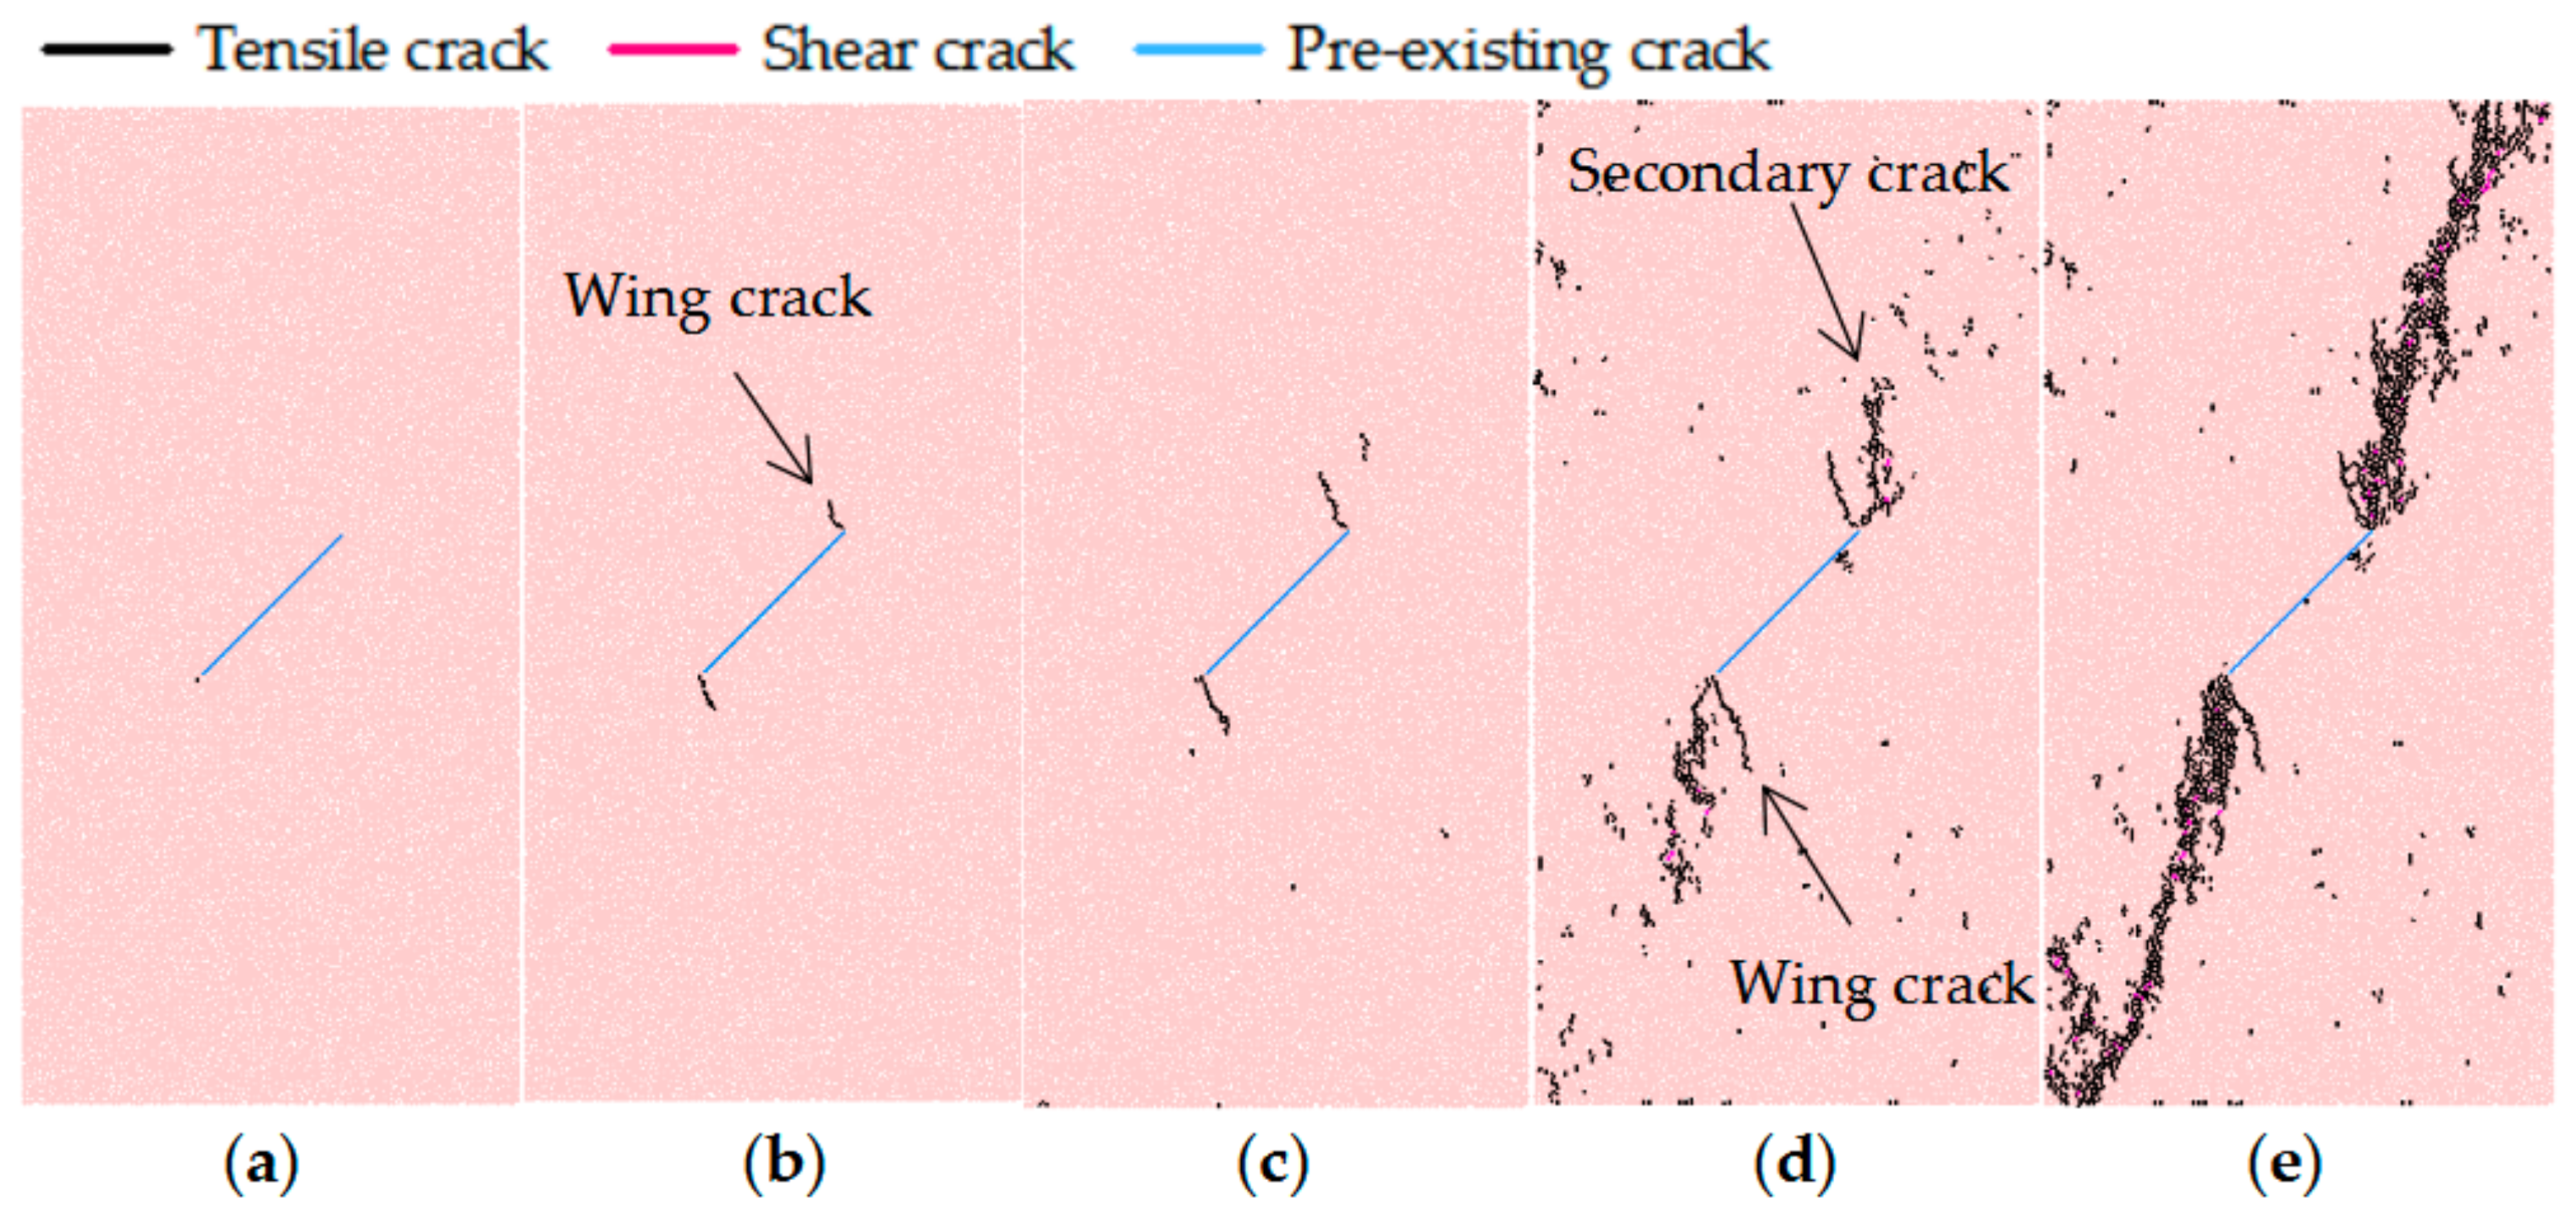
Figure 10.
Temporal evolution of principal stress contour in pre-existing crack area: (a) ; (b) ; (c) ; (d) .
Figure 10.
Temporal evolution of principal stress contour in pre-existing crack area: (a) ; (b) ; (c) ; (d) .
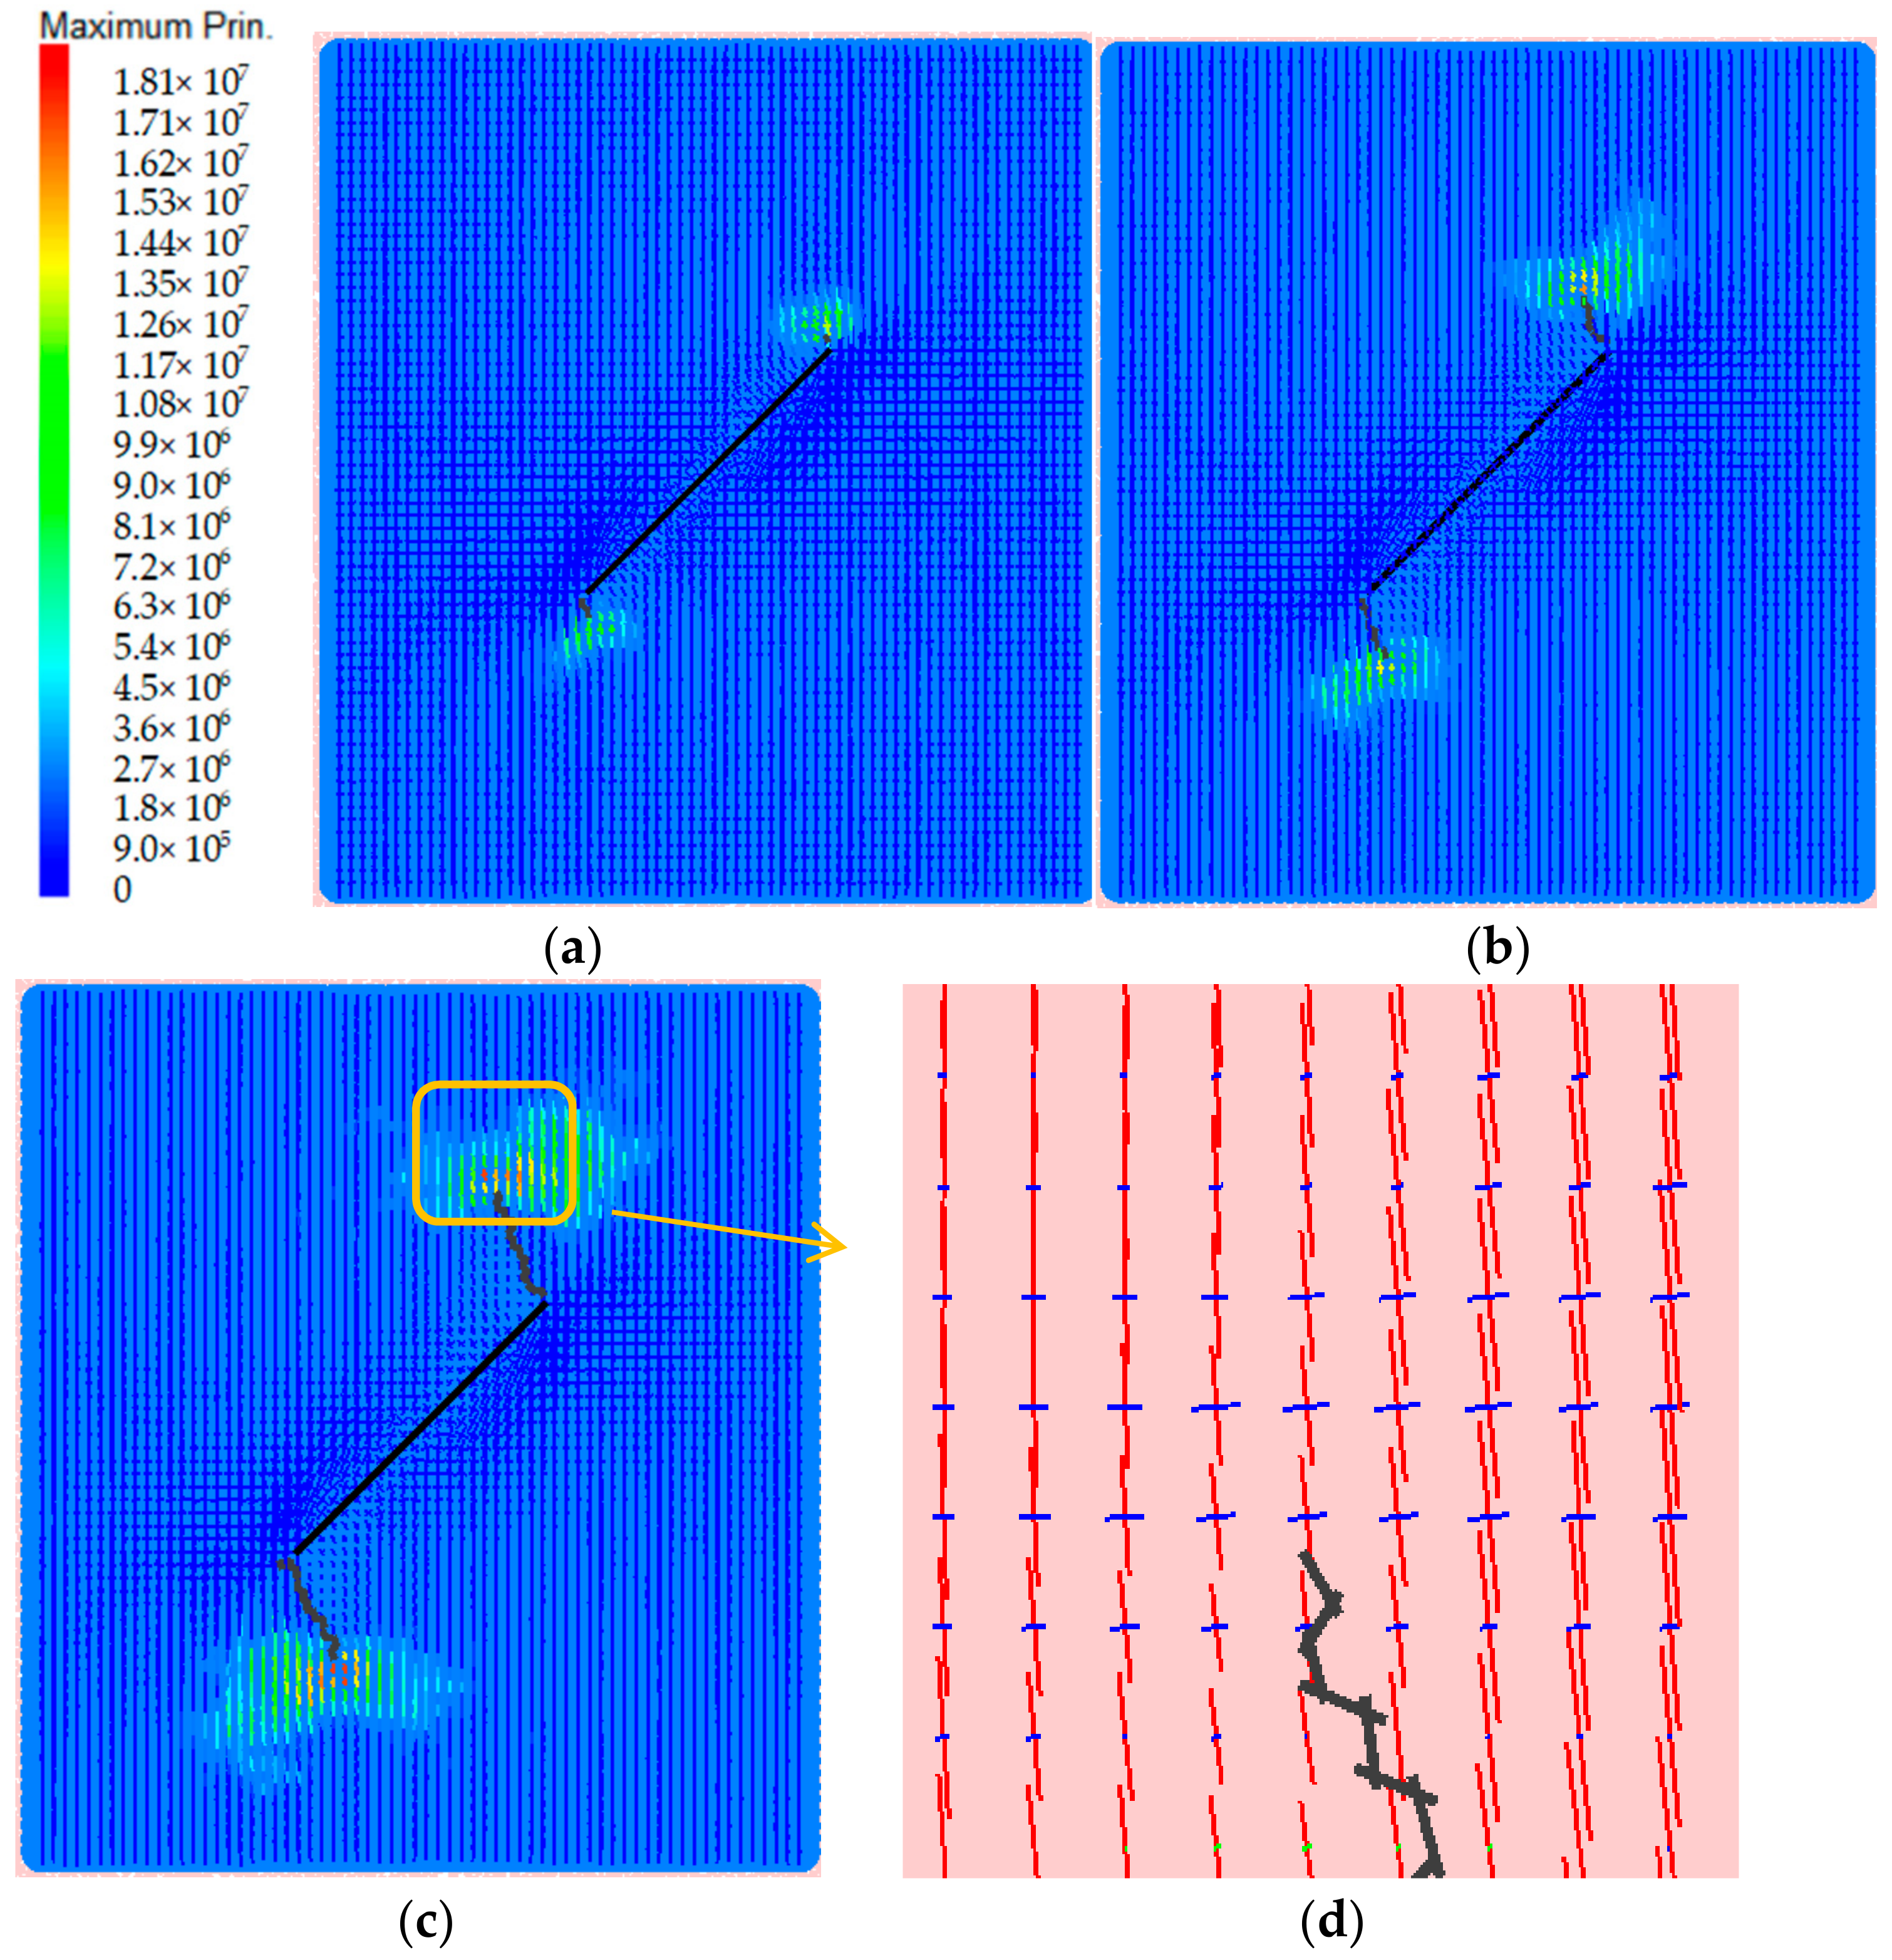
Figure 11.
Cracks distribution in the main crack bearing granite with different inclination angles at the moment of peak strength: (a) 15°; (b) 30°; (c) 45°; (d) 60°; (e) 75°.
Figure 11.
Cracks distribution in the main crack bearing granite with different inclination angles at the moment of peak strength: (a) 15°; (b) 30°; (c) 45°; (d) 60°; (e) 75°.
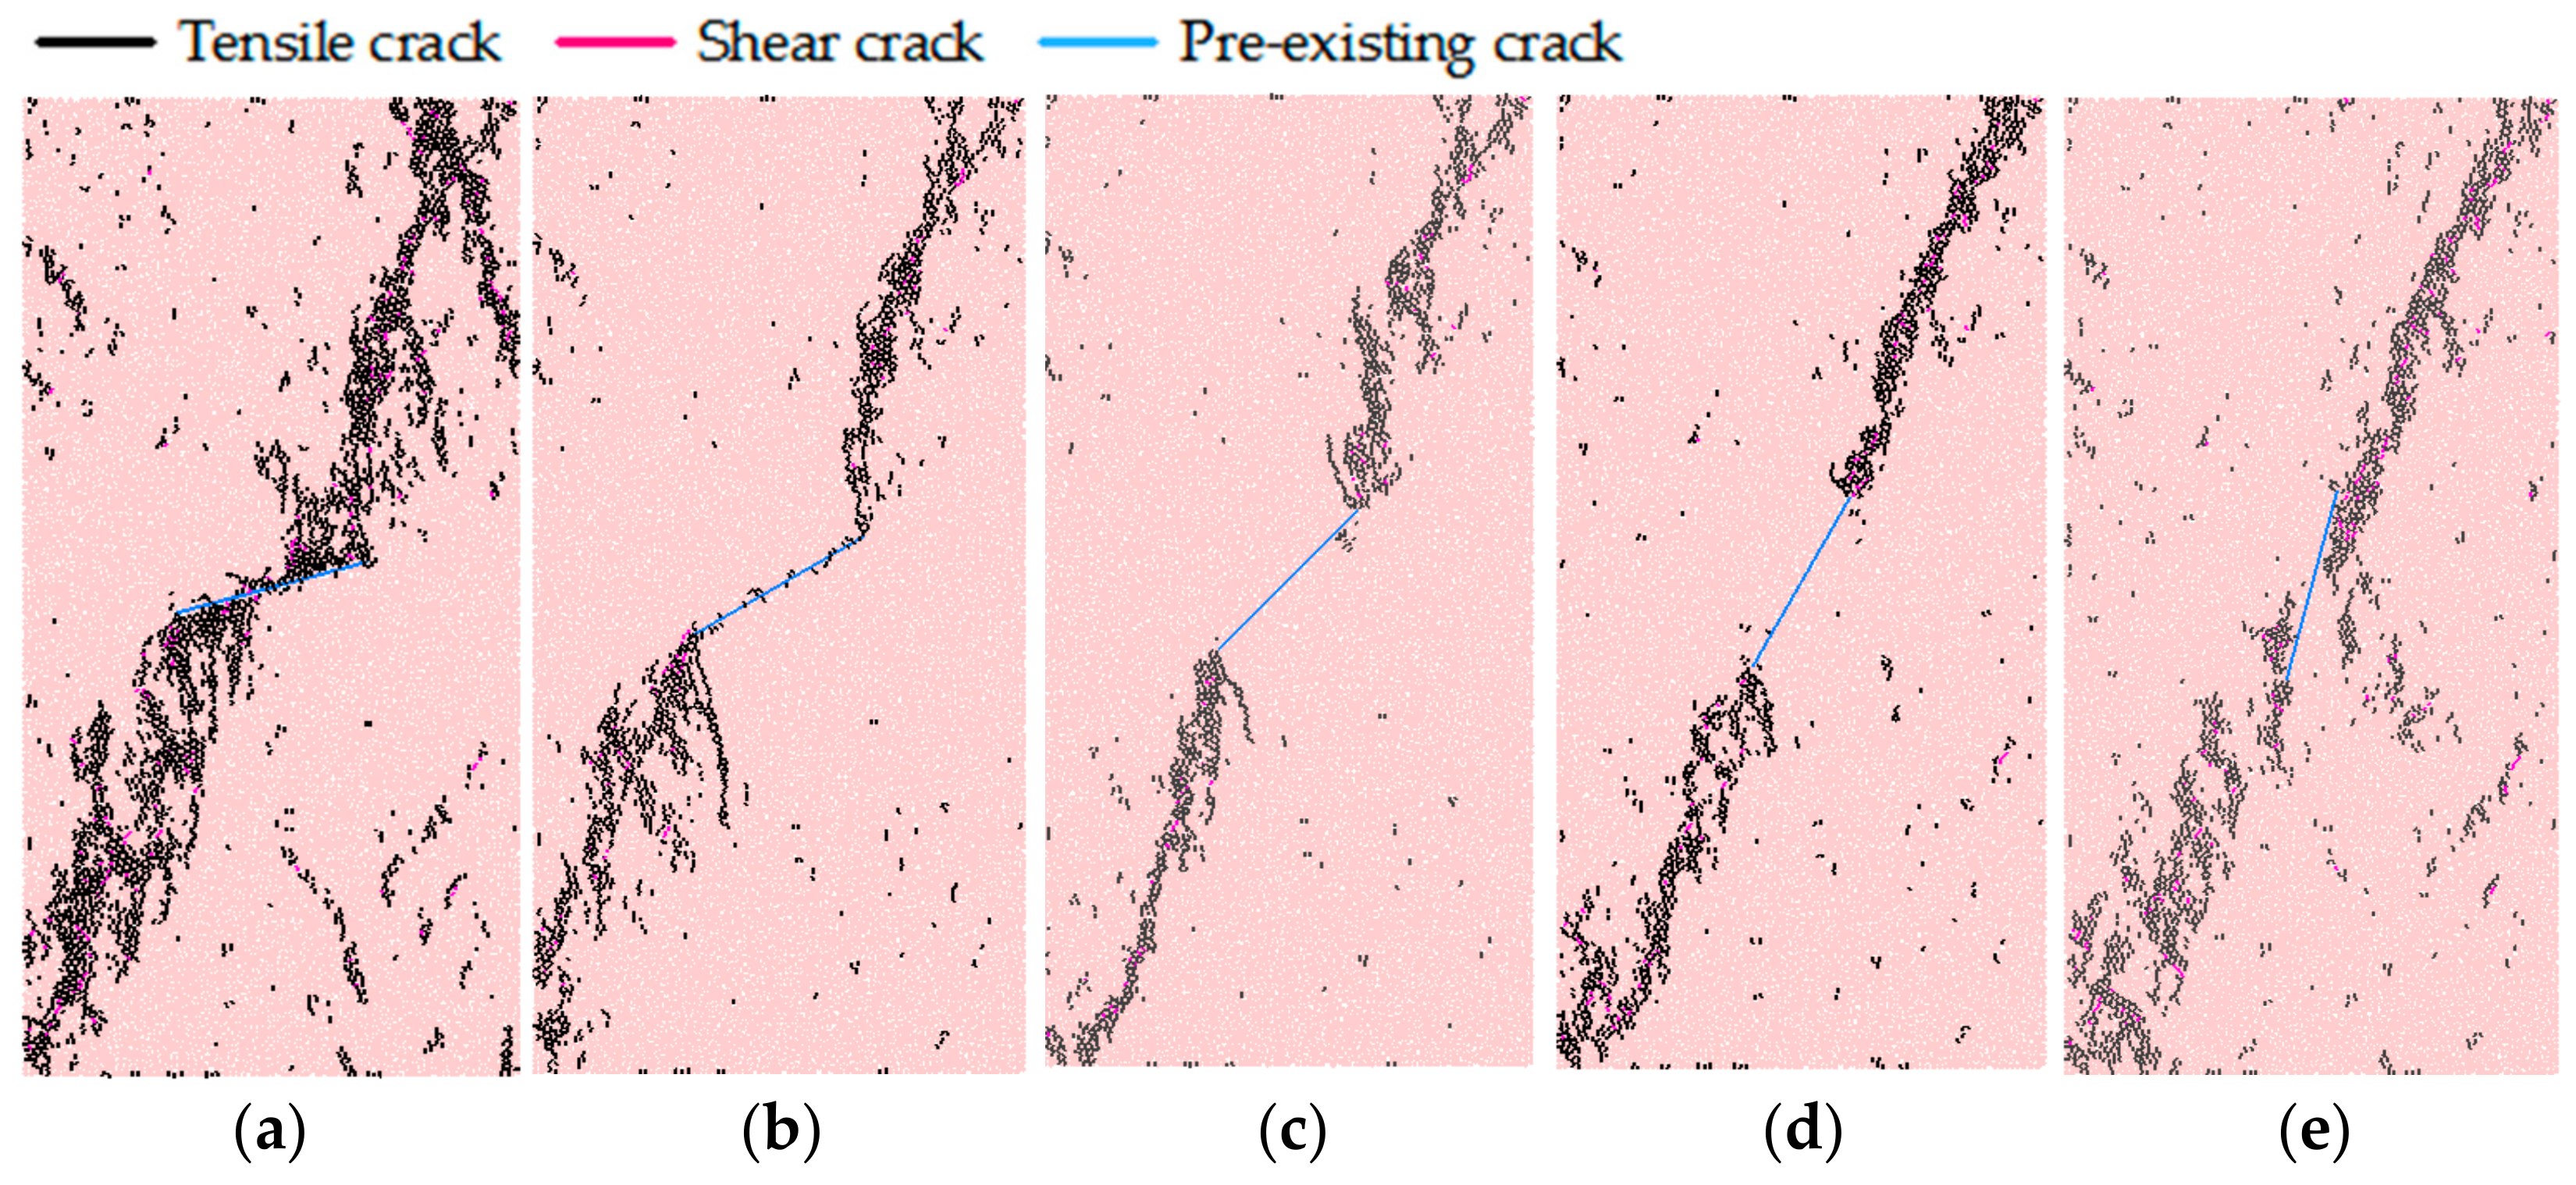
Figure 12.
Cracks distribution in the main crack bearing granite at the moment of peak strength considering different crack lengths: (a) L = 0.006 m; (b) L = 0.01 m; (c) L = 0.014 m; (d) L = 0.018 m; (e) L = 0.022 m.
Figure 12.
Cracks distribution in the main crack bearing granite at the moment of peak strength considering different crack lengths: (a) L = 0.006 m; (b) L = 0.01 m; (c) L = 0.014 m; (d) L = 0.018 m; (e) L = 0.022 m.
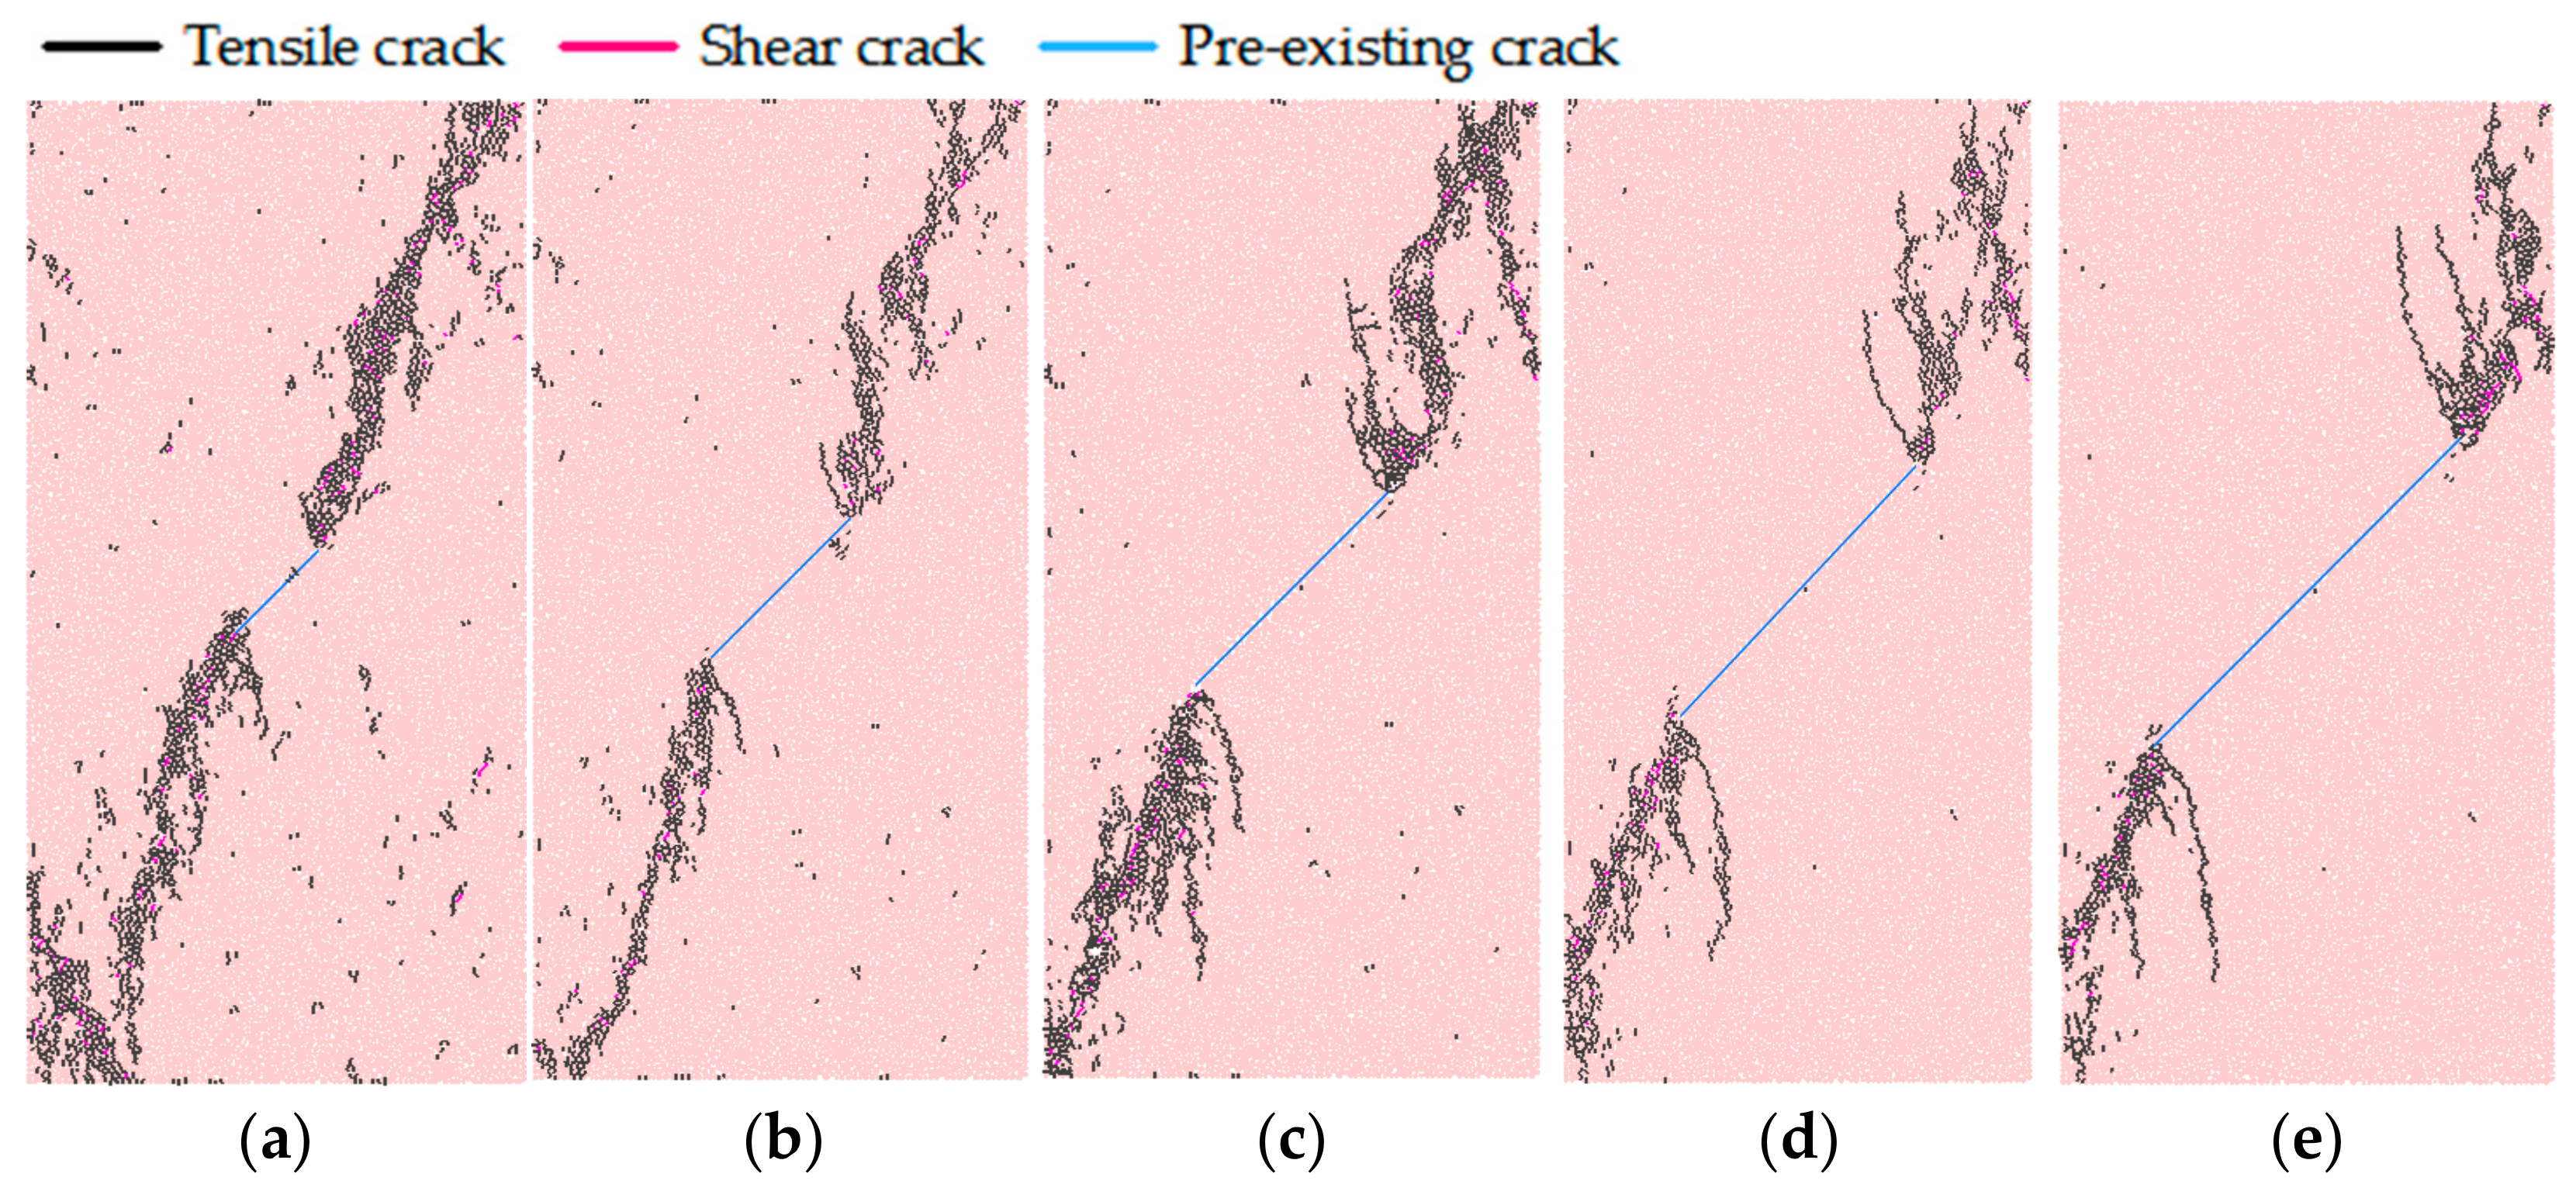
Figure 13.
Cracks distribution in the main crack bearing granite at the moment of peak strength considering different friction coefficients: (a) µ = 0; (b) µ = 0.25; (c) µ = 0.5; (d) µ = 0.75; (e) µ = 1.
Figure 13.
Cracks distribution in the main crack bearing granite at the moment of peak strength considering different friction coefficients: (a) µ = 0; (b) µ = 0.25; (c) µ = 0.5; (d) µ = 0.75; (e) µ = 1.
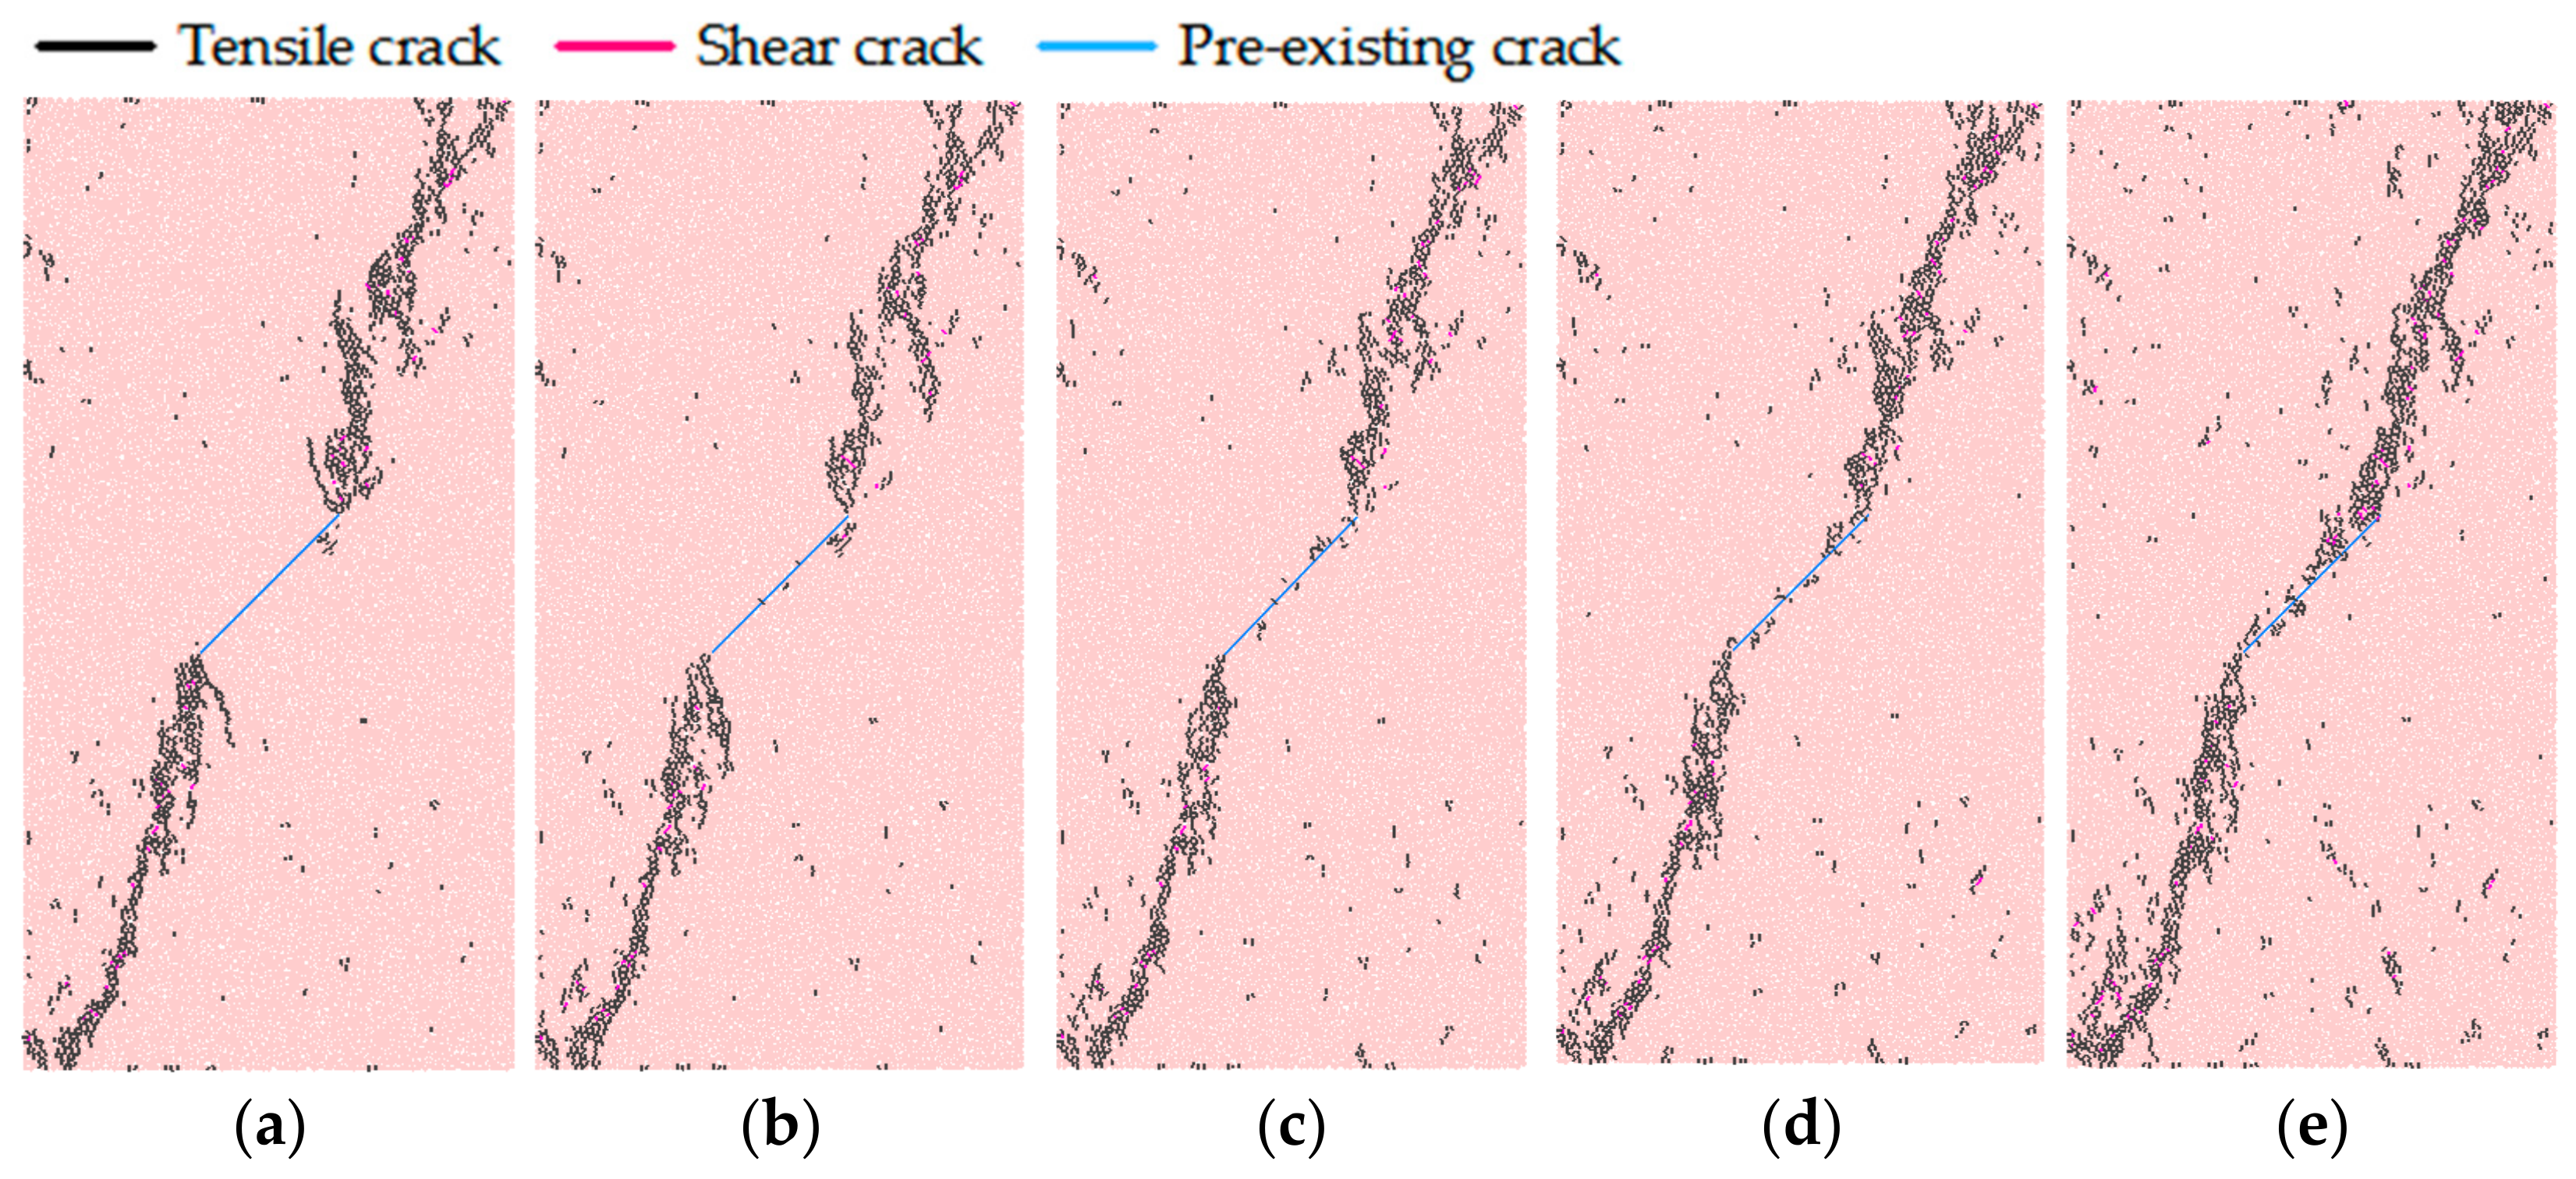
Figure 14.
Cracks distribution in the main crack bearing granite at the moment of peak strength considering different confining pressures: (a) 10 MPa; (b) 20 MPa; (c) 30 MPa; (d) 40 MPa; (e) 50 MPa.
Figure 14.
Cracks distribution in the main crack bearing granite at the moment of peak strength considering different confining pressures: (a) 10 MPa; (b) 20 MPa; (c) 30 MPa; (d) 40 MPa; (e) 50 MPa.
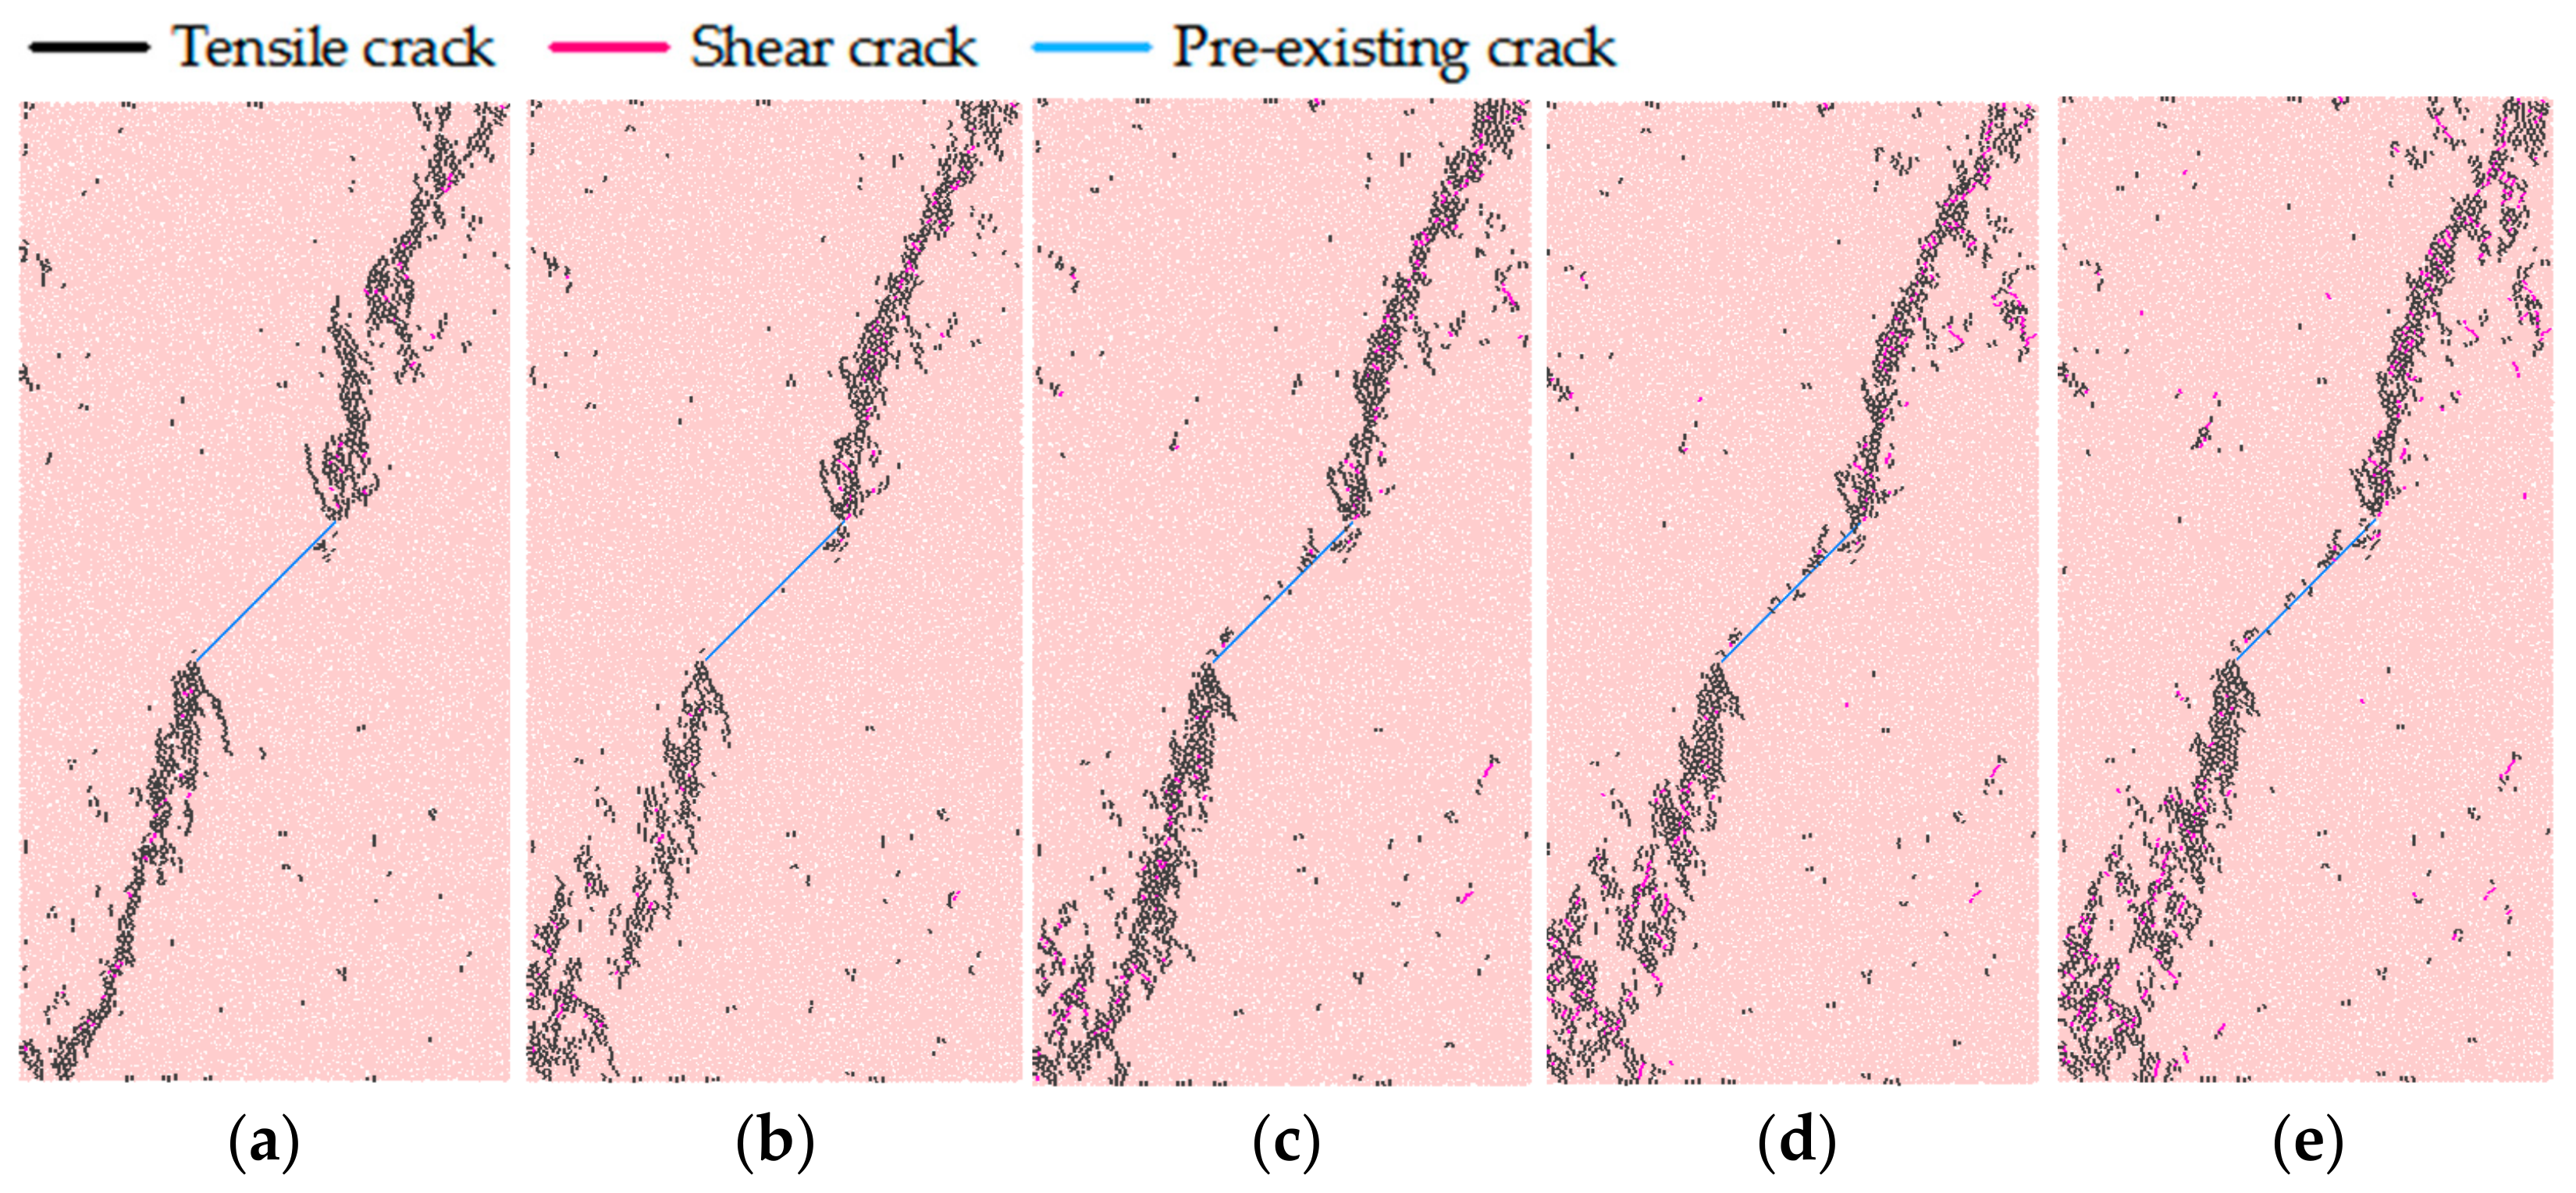
Figure 15.
Variation of characteristic rock strength under different conditions: (a) inclination angle of main crack; (b) main crack length; (c) friction coefficient; (d) confining pressure.
Figure 15.
Variation of characteristic rock strength under different conditions: (a) inclination angle of main crack; (b) main crack length; (c) friction coefficient; (d) confining pressure.

Table 1.
Mineral composition of Triassic granite in the Sanguliu pluton of the Liaodong area.
| Potassium Feldspar | Albite | Quartz | Biotite | Amphibole | Clinochlore |
|---|---|---|---|---|---|
| 39.76% | 26.08% | 17.7% | 9.2% | 5.57% | 1.69% |
Table 2.
Mechanical parameters of granite before and after chemical corrosion.
| Sample Number | Peak Stress /MPa | Young’s Modulus/GPa | Poisson’s Ratio |
|---|---|---|---|
| S0 | 258 | 29.6 | 0.216 |
| S1 | 224.1 | 26.5 | 0.218 |
| S2 | 216.1 | 25 | 0.221 |
| S3 | 194.2 | 24.7 | 0.22 |
Table 3.
Meso-mechanical parameters of granite matrix after corrosion by mud acid solution.
| Parameter Class | Parameter Name | Value |
|---|---|---|
| Particles | Minimum particle radius/mm | 0.12 |
| Particle radius ratio | 1.66 | |
| Effective modulus of particles/GPa | 11.3 | |
| Ratio of the normal to shear stiffness of particles | 1.8 | |
| Friction coefficient | 0.6 | |
| Parallel bond contact model | Effective modulus of bonds/GPa | 11.3 |
| Ratio of the normal to shear stiffness of bonds | 1.8 | |
| Tensile strength of bonds/MPa | 39 | |
| Cohesion strength of bonds/MPa | 65 | |
| Local friction angle/(°) | 20 |
Table 4.
Meso-mechanical parameters of smooth joint model for crack.
| Parameters in SJ Model | Value |
|---|---|
| normal stiffness (GPa/m) | 50,000 |
| shear stiffness (GPa/m) | 20,000 |
| friction coefficient | 0 |
Publisher’s Note: MDPI stays neutral with regard to jurisdictional claims in published maps and institutional affiliations. |
© 2022 by the authors. Licensee MDPI, Basel, Switzerland. This article is an open access article distributed under the terms and conditions of the Creative Commons Attribution (CC BY) license (https://creativecommons.org/licenses/by/4.0/).
Share and Cite
MDPI and ACS Style
Tong, R.; Liu, H.; Liu, J.; Shi, Y.; Xie, L.; Ban, S. Meso-Mechanical Characteristics of Granite with Natural Cracks after Mud Acid Corrosion. Energies 2022, 15, 721. https://doi.org/10.3390/en15030721
AMA Style
Tong R, Liu H, Liu J, Shi Y, Xie L, Ban S. Meso-Mechanical Characteristics of Granite with Natural Cracks after Mud Acid Corrosion. Energies. 2022; 15(3):721. https://doi.org/10.3390/en15030721
Chicago/Turabian StyleTong, Rongchen, Hejuan Liu, Jianfeng Liu, Yingkun Shi, Lihuan Xie, and Shengnan Ban. 2022. "Meso-Mechanical Characteristics of Granite with Natural Cracks after Mud Acid Corrosion" Energies 15, no. 3: 721. https://doi.org/10.3390/en15030721
Note that from the first issue of 2016, this journal uses article numbers instead of page numbers. See further details here.