
A Review of Environmental and Economic Implications of Closing the Nuclear Fuel Cycle—Part One: Wastes and Environmental Impacts


1
National Nuclear Laboratory, Central Laboratory, Sellafield, Seascale CA20 1PG, UK
2
Dalton Nuclear Institute, The University of Manchester, Manchester M13 9PL, UK
3
Department of Chemical Engineering and Analytical Science, The University of Manchester, Manchester M13 9PL, UK
*
Authors to whom correspondence should be addressed.
Energies 2022, 15(4), 1433; https://doi.org/10.3390/en15041433
Submission received: 8 December 2021
/
Revised: 13 February 2022
/
Accepted: 13 February 2022
/
Published: 16 February 2022
(This article belongs to the Topic Nuclear Energy Systems)
Abstract
:Globally, around half a million tonnes of spent nuclear fuel (SNF) will be in dry or wet storage by around 2050. Continued storage is not sustainable, and this SNF must eventually either be disposed (the open nuclear fuel cycle) or recycled (the closed fuel cycle). Many international studies have addressed the advantages and disadvantages of these options. To inform this debate, a detailed survey of the available literature related to environmental assessments of closed and open cycles has been undertaken. Environmental impacts are one of the three pillars that, alongside economic and societal impacts, must be considered for sustainable development. The aims are to provide a critical review of the open literature in order to determine what generic conclusions can be drawn from the broad base of international studies. This review covers the results of life cycle assessments and studies on waste arisings, showing how the management of spent fuels in the open and closed cycles impact the environment, including the use of natural resources, radioactive waste characteristics (heat loading, radiotoxicity and volume) and the size of the geological repository. In the framework of sustainable development, the next part of this review will consider economic impacts.
1. Introduction
It is clear that nuclear energy can make a major contribution to global low-carbon energy needs and, for example, in the United Kingdom, this is reflected in the recent Energy White Paper, which includes a role for nuclear in meeting the UK’s target of “Net Zero” carbon emissions by 2050 [1]. Realising the ambitions of decarbonising heating and vehicle fleets will prove challenging and require considerable effort, which will likely not be limited solely to electrification. Until now, nuclear energy has been deployed almost exclusively in generating low-carbon (typically baseload) electricity, but the potential for high-temperature nuclear systems to contribute beyond electricity generation in the form of hydrogen production or direct heating should be appreciated. However, whilst much focus is placed on the types of nuclear reactors that will be required to meet future requirements, the radioactive wastes and particularly the spent nuclear fuels (SNFs), sometimes referred to as used nuclear fuel (UNF), arising from current and future use of nuclear energy will need to be managed. Of course, the full nuclear system, including the management of SNF, must be competitive with other forms of low-carbon energy on economic as well as environmental grounds. Spent fuel is managed either through the storage and disposal of SNF in a waste repository (the “open” or “once-through” cycle), or by reprocessing and recycling the uranium (U) and plutonium (Pu) into new fuel, with the disposal of a reduced volume of immobilised, high-level (i.e., heat-generating) waste (HLW), known as the “closed cycle” [2], noting as well that different degrees of closed cycles are possible. A summary of these and finer distinctions is provided at the start of Section 2.1. Today, the recycling of plutonium as a thermal mixed oxide fuel (termed “partially closed” or “twice-through” cycle) is in industrial operation in some countries, notably France [3]. However, obtaining the optimum benefits of closed fuel cycles requires plutonium multi-recycling (the “fully closed” fuel cycle) and potentially the multi-recycling of minor actinides (MA, i.e., neptunium, americium and curium) [4,5,6]. As this review will show, the multi-recycling of actinides can deliver substantial benefits in sustainability, environmental impacts and HLW management through the reuse of depleted uranium stocks and plutonium, coupled with the burning of minor actinides.
Current nuclear power reactors and associated fuel cycles are mature, safe and reliable technologies for the generation of low-carbon energy and overseen by strong regulatory bodies, but new reactor technologies, applications and optimum long-term strategies for the fuel cycle exist and are under consideration globally. These advanced fuel cycles, however, require investment in research and development, and must address other areas such as safety, security and proliferation management, as well as the economics of an expanded fuel cycle infrastructure. As Choi et al. [7] have stated, “no consensus about the best approach to manage spent fuels has been reached at any level of scholarly, professional, or policy debate”. One of the key challenges to address in deploying current and future nuclear systems, of course, is cost. Nuclear-generated energy, whether for electricity, heat, hydrogen or synthetic fuels, needs to be competitive with other forms of low-carbon energy, whichever reactor system or fuel cycle is selected, so economic studies are a key factor in decision making. The economics of open versus closed fuel cycles will be discussed in part two of this review.
This paper, however, will place the economic costs of closing the fuel cycle in the context of the environmental and waste management benefits that can accrue from the recycling and reuse of materials. As will be described in Section 2.3, this covers two pillars of sustainable development as frequently applied to nuclear fuel cycle options (economics and the environment) to support our understanding of sustainability when applied to the nuclear fuel cycle. By postponing the economic review until part two, it should be noted that significant factors affecting life cycle analyses (discussed in Section 3.2) will be missing from the discussion in this paper; a more full discussion will be had in part two, which will have the benefit of being able to discuss both the economic and environmental aspects of the fuel cycle.
The paper is structured as follows: Section 2 frames the challenges by providing a background to different fuel cycle options, including concepts of sustainability, available data on spent fuel arisings and reprocessing capacity. Section 3 focuses on the potential environmental benefits of closed fuel cycles, while Section 4 is a discussion section which considers matters arising from this report.
2. Background and Context
2.1. Nuclear Fuel Cycles
The nuclear fuel cycle holds an extremely important position in the generation of nuclear energy, not simply because it is the process by which nuclear fuel makes its way to a reactor but because there are a range of fuel cycle options available depending on the fuel used in the reactor and the management of the spent fuel when discharged from the reactor. With national and global drives to reduce CO2 emissions, nuclear energy has become a more relevant technology in recent years, particularly in much of the developed West, where it has been somewhat dormant for some time. With renewed interest in nuclear energy comes interest in the range of nuclear systems that are available, in addition to interest in which fuel cycle serves us best. Indeed, some systems are reliant on specific fuel cycles in order to function, and given the considerable degree of planning, resources and effort involved in developing and organising a nuclear fuel cycle it is critical that decisions are made in sufficient time as to which ones to pursue.
Natural uranium consists almost entirely of two isotopes: 238U (99.283%) and 235U (0.711%). Nuclear fission relies on the interaction of a neutron with a fissile nucleus to release energy (and additional neutrons—which enables a chain-reaction of fission events). 235U is the only naturally occurring fissile isotope and, as such, typically forms the fuel for nuclear reactors. Fission occurs preferentially when the neutrons have low energy, yet newly created neutrons are generated with high energy (known as fast neutrons); contemporary reactors utilise a moderator to reduce the energy of neutrons such that they successfully lead to fission. Neutrons slowed sufficiently are said to be “thermalised”, and the reactors “thermal reactors”. Reactors which have been specifically designed to operate without a moderator slowing the neutrons are known as “fast reactors” (FRs).
Neutron capture also occurs within reactor cores; 238U (making up over 99% of natural uranium) has a strong tendency to capture high-energy neutrons. The challenge in a reactor, therefore, is to limit the amount of neutron capture relative to fission. Commonly, artificially raising the proportion of 235U (typically to 3–5%) by enrichment is necessary to achieve this.
A powerful consequence of neutron capture by 238U is the production of transuranic elements, especially plutonium. The 239Pu produced is fissile, and similar to 235U is able to undergo fission. So while 238U is not fissile, when it undergoes neutron capture it breeds a fissile isotope, and as such is said to be “fertile”. This process has tremendous potential, in that it is possible for a reactor containing a relatively small proportion of fissile fuel to breed more fissile fuel than was originally present. A reactor designed with a useful application of this process is a “breeder reactor”. Such reactors are more complex than contemporary reactors, which utilise only 0.7% of natural uranium; however, in the event that uranium resources become scarce enough to warrant the investment, utilising the remaining 99.3% to breed fuel would vastly extend the lifetime of uranium reserves. Beyond this, naturally occurring 232Th is also fertile, and utilising the world’s combined uranium and thorium reserves would result in energy security for thousands of years. (Reactors based on thorium fuels and the associated thorium fuel cycle are outside the scope of this review, but see, for example, references [8,9,10,11].)
The various fuel cycle options on offer fulfil different scenarios based on the degree to which the above processes are implemented in future reactor systems.
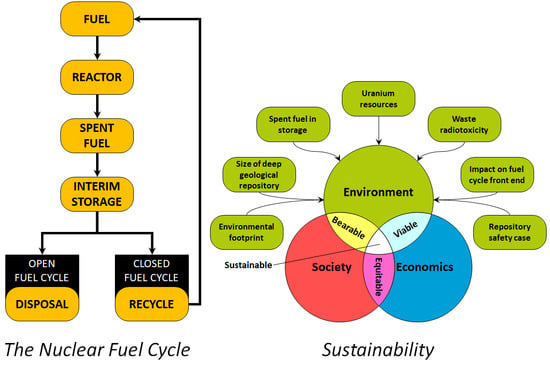
The nuclear fuel cycle comprises a series of stages, from mining, enrichment and fuel fabrication at the “front end” to SNF storage, reprocessing (if a closed cycle is followed), waste conditioning and disposal at the “back end” (see Figure 1) [12]. The central part of the cycle is the choice of reactor. The reactor and its fuel obviously heavily impact the fuel cycle selection, as well as the nuclear materials and facilities needed. In the past, different stages of the fuel cycle were developed rather independently (one consequence of this is the build-up of the UK plutonium stockpile at Sellafield [13]), but now there is greater emphasis on development of the system as a whole interconnected entity. Fuel cycle models, such as the ORION code [14,15], are a powerful tool to understand and optimise the full system. Fuel cycle models connect the different stages and/or facilities in order to track nuclear material through the chosen fuel cycle. When SNF inventories are needed as input data they are calculated using codes such as FISPIN (a spent nuclear fuel inventory code suite available from [16]). Costs can be associated with each stage depending on industrial experience [17], other data or reasoned assumptions. Typically, these fuel cycle scenarios or similar life cycle assessment studies track specific metrics; examples include the amounts of radioactive wastes for disposal, the “lifetime” and radiotoxicity of the wastes produced, the size of the waste repository, environmental indicators, etc.
In this paper the common forms of the nuclear fuel cycle discussed most frequently will be:
- The open or once-through cycle (OTC), where spent uranium oxide (UOX) fuels are stored before direct disposal in a deep geological repository (DGR), also known as a geological disposal facility (GDF) in the UK.
- The partially closed, thermal recycle or twice-through cycle (TTC), based on reprocessing SNF to recover fissile material (i.e., uranium and plutonium), which is then recycled as mixed oxide (MOX) fuel, sometimes referred to as plutonium mono-recycling.
- The fully closed cycle (FCC), in which SNF is reprocessed and fissile materials are usually recycled in a fast reactor multiple times to maximise the energy value of the fuel components, also referred to as plutonium multi-recycling. There are a number of variations in this concept, such as transition scenarios where light water reactors (LWRs) and FRs operate together, or a fleet comprised only of FRs. FRs can be configured to either burn or breed plutonium depending on the nuclear fuel cycle strategy to be followed.
- The partitioning and transmutation (P&T) scenario, where MAs are also recycled for burning (usually) in fast reactors or accelerator-driven systems (ADS). As will be seen later, after the separation of plutonium the MA account for the majority of the heat generation and radiotoxicity in the medium to longer term. The P&T scenario is thus aimed at minimising the MA waste burden to the DGR, rather than for its energy value.
2.2. Benefits of New Systems
The potential benefits of, or drivers for, introducing advanced nuclear technologies (including fuel cycles) are usually recognised to be [18]:
- Sustainability, including more efficient use of natural resources.
- Reduction in volume and/or heat load of waste.
- Reduction in the radiotoxicity of waste.
- Economic benefits.
- Enhanced proliferation resistance and/or inherent physical protection.
- Plutonium management.
- Improved public acceptability.
This paper will address topics one–three in the list above. Non-proliferation, security and plutonium management are substantial issues in their own rights, and beyond the present scope. How to improve public acceptability is also a complex topic that warrants dedicated consideration, although an increase in public acceptability is a likely outcome if safe and secure recycling and reuse technologies are deployed as a result of a general public preference for a “circular economy”. Examples where the public may have relevant interests could realistically include a preference for recycling rather than disposal, concerns around the disposal of radioactive waste and near-term job creation. Conversely, however, reprocessing can also be controversial due to the production of plutonium and the associated security and proliferation concerns, as well as past links to domestic nuclear weapons programmes. Due to this uncertainty, public acceptability (social or political) is also not considered any further in this paper. This leads to outputs which can be quantified and costed but not necessarily “valued”. For example, the costs of fuel cycles, which must, in any case, conform to local workplace and public/environmental regulations, can be estimated (often with many difficulties), whereas the importance to the public, both local and worldwide, will depend on individual values and beliefs. There are techniques that attempt to rationally and/or collegially attach monetary value to saving a life and hence “value” risks; some of these have been applied to the nuclear sector (e.g., [19]). However, such analyses may be dependent on the particular economic and regulatory regime that is in place and, regardless of technique, may or may not be palatable to wider society. Some of these issues are discussed in a recent report from the University of Manchester [20].
2.3. Sustainability
This review of closed versus open fuel cycles is made under the framework of analysing the sustainability of nuclear fuel cycle options. Sustainable development has been defined as “development that meets the needs of the present without compromising the ability of future generations to meet their own needs” [21], and is based on meeting a combination of economic, societal and environmental requirements [22]. Drivers for an energy system for each of the three areas can be summarised thus:
- Economic drivers concern achieving affordable energy prices based on long-term predictable production costs that are resilient to international influences [23].
- Societal drivers largely concern public acceptability, including reducing risks to health as well as the promotion of intra- and intergenerational equity. Specifically, for nuclear energy, concerns over nuclear safety, security and proliferation risks are also relevant.
- Environmental ambitions can be broken down into three broad drivers:
- ○
- Reducing greenhouse gas emissions (i.e., the carbon footprint).
- ○
- Reducing waste generation to a level where nature can absorb it, and consumption of resources to a point where they can be regenerated (i.e., the environmental footprint).
- ○
- Preserving finite natural resources.
This paper focuses on the environmental aspects of sustainable development, but, as noted earlier, the equal importance of the economic and societal goals must be accounted for in an ultimate assessment of nuclear energy system and fuel cycle options.
The United Nations Economic Commission for Europe (UNECE) has stated that “sustainable pathways for nuclear development emerge as part of the full consideration of the regulatory, social, technical, environmental and economic aspects… as well as national capability and capacity” [24]. Similar views were expressed earlier by Stamford and Azapagic [25], who developed a series of 43 indicators across 22 categories for the life cycle assessment of nuclear and other energies split into technoeconomic, environmental and social sustainability issues (Table 1). Their later paper described the application of this approach to an assessment of nuclear energy in the UK [26]. The assessment of social sustainability and the technique of social life cycle assessment received greater clarity in 2020 with the publication of UNEP’s updated guidelines [27], but, to the authors’ knowledge, this framework is yet to be applied in the nuclear sector.
Recently, the question of whether nuclear energy is sustainable, and hence part of the “EU Taxonomy” of environmentally sustainable economic activities suitable for investment, was considered by the Joint Research Centre (JRC) of the European Union [28]. To be sustainable in this context an activity must be able to make a substantial impact towards mitigating climate change and “do no significant harm” with respect to the other environmental objectives of the Taxonomy Regulation, viz.:
- Sustainable use and protection of water and marine resources.
- Transition to a circular economy.
- Pollution prevention control.
- Protection and restoration of biodiversity and ecosystems.
The key question surrounding nuclear energy concerns the impacts on these other environmental impacts and specifically the management of radioactive wastes.
2.4. Spent Nuclear Fuel Arisings
Firstly, we should consider the “source term” for radioactive wastes, i.e., the SNF arisings from the use of nuclear energy. Currently, there are around 450 operating reactors around the world providing nearly 400 GW of nuclear generation capacity [29]. However, definitive estimates of global SNF accumulation over this century are harder to find. International Atomic Energy Agency (IAEA) figures [30] estimate 11,500 t (tonnes of heavy metal) of SNF would be generated per year from 2010, with 445,000 t generated in total by 2020. Since 89% of nuclear electricity is from LWRs [29], the majority of this SNF will be uranium oxide fuels. Table 2 (adapted from [30,31]) shows that the current reprocessing capacity is around 2500 t/a (tonnes per annum), although this could in future rise to ca. 6000 t/a once the Rokkasho Reprocessing Plant in Japan is operational and new plants in Russia, China and India are constructed and commissioned. These data would suggest a somewhat higher rate of SNF accumulating in storage than that published by the IAEA in 2016 of 7000 t/a [32]. By 2020 around one-quarter of spent fuel arisings were estimated to be reprocessed, with the rest in interim storage (Figure 2). Another source [33] estimates that around 550,000 tonnes of SNF is expected to accumulate in 17 countries by 2050, consistent with the IAEA estimated rate. An OECD-NEA study that took a long-term and global view estimated that by 2150 the OTC could generate 4.5 megatonnes (Mt) of SNF worldwide [34]. Only Sweden and Finland are likely to have DGRs for SNF operational by the early 2030s, and their capacities are 12,000 and 5500 t, respectively [35,36]. The United States filed a licence application for the Yucca Mountain (YM) repository in 2008, but long-standing political problems have suspended the process indefinitely [37]. Further, YM has a capacity limited to 70,000 t of SNF, which is about half the projected arisings for the current US reactor fleet when decommissioned around the mid-century [38].
The OECD’s Nuclear Energy Agency (NEA) and International Energy Agency (IEA) estimated in 2015 [39] that to maintain global warming below 2 °C global nuclear capacity would need to increase from 396 GW to 930 GW by 2050, i.e., 17% of global electricity production. This increase is predominantly expected to arise from non-OECD countries, particularly China, India and the Middle East. Less optimistically, the IAEA estimates low and high cases for nuclear by 2050 of between about 350 and 750 GW [29], contrary to needs to maintain global warming under the new, lower target of 1.5 °C, which they estimated might require 960 to 2300 GW in 2050 [40]. Increased nuclear capacity will obviously increase the amount of SNF discharged; a 1 GWe reactor discharges ~23 t of SNF per year [41] (or between 17.5 and 27 t per year for burnups of 45 and 65 GWd/t and initial enrichments of 4 and 5% 235U, respectively [28]).
The UK is an interesting case in point, as it is transitioning from a fuel cycle based on reprocessing (the TTC) to one based on storage (the OTC), until the availability of a DGR. The UK currently has around 5500 tonnes of unreprocessed advanced gas-cooled reactor (AGR) fuel stored, pending decisions to declare it as waste and dispose of in a repository towards the end of this century [42]. There is also expected to be a further 1050 tonnes of PWR fuel from Sizewell B (assuming a 40-year plant lifetime), plus another ~900 t of fuels from experimental and other reactors [43]. Hinkley Point C will generate around another 3600 t [44] (Section 6.38.4), and any further new build will increase the inventory. The UK will also have 3200 t of HLW from reprocessing around 65,000 tonnes of SNF in Magnox and the Thermal Oxide Reprocessing Plant (THORP) reprocessing plants [43,45], as well as ~140 t of separated plutonium from reprocessing (without recycling) that is in interim storage, pending decisions to either declare it as waste for disposal in the DGR or to convert it into MOX fuel for new reactors [13].
2.5. Fuel Cycle Modelling
Section 2.1 introduced the concept of fuel cycle models, which are probably the most important tools available to analyse the impacts of various fuel cycle options at the macro-scale over decades or even centuries. Results from various fuel cycle models are contained within this report, and whilst this report is not intended as a review of fuel cycle models or their use internationally, a few comments are relevant around their applications and sensitivities to contextualise later discussions of the results from such models.
A benchmark exercise was completed by the OECD-NEA, in which five fuel cycle models were compared against three different scenarios [46]. The codes were COSI6 (developed by CEA, France), DE-SAE2.2 (Rosatom, Russia), EVOLCODE2.0 (CIEMAT, Spain), FAMILY21 (JAEA, Japan) and VISION2.2 (INL, Idhao, USA). The scenarios were an LWR-based OTC, the TTC and a transition scenario from LWRs to fast reactors with plutonium and MA recycling. It was concluded that the OTC was too simple to use as a benchmark of the code capabilities. For the more complex scenarios differences appear, but these can be reduced by fine-tuning the assumptions (related to the initial conditions and missing assumptions, requiring iterations of the models to converge). The authors note that a similar benchmark exercise coordinated by MIT [47] led to similar conclusions.
A study of the sensitivities of outputs from variations in input parameters was made for a selection of six international fuel cycle models by the OECD-NEA [48]. The scenario selected for the sensitivity study was of 200 years duration, with a transition from a fleet of PWRs to sodium fast reactors (SFR) with MOX fuel, maintaining constant electricity production. The results of their studies are summarised in Figure 3. With respect to this review, it is seen that MA recycling only has a significant effect on the waste characteristics and variations in reprocessing strongly affect the back-end storage of nuclear materials as well as affecting the inventories of materials in a non-linear way (noted by question marks). This is due to reprocessing controlling the supply of plutonium for fast reactors in the transition period.
The importance of internationally benchmarking the national fuel cycle codes and understanding the impacts of various assumptions and input parameters is apparent from these examples. The useful role of international organisations, such as the OECD-NEA, in this regard is also evident. In the UK the fuel cycle model of choice is the ORION code [14,15]. Further fuel cycle studies will be discussed below in the appropriate sections of the paper.
3. Environmental Assessments of Fuel Cycles
3.1. Natural Resources (Uranium Utilisation)
The main natural resource affecting the sustainable and economic production of nuclear energy is of course the supply of uranium ore for enrichment and conversion into nuclear fuel. Current nuclear reactors utilise 0.6–0.7% of the uranium fuel for energy production. In the OTC the remaining uranium (and plutonium) is retained in the SNF and disposed of as high-level radioactive waste. The TTC, which incorporates the reprocessing and recycling of MOX fuel, as well as potentially reprocessed uranium fuel, improves uranium utilisation by about 15–25% compared to the OTC [23]. Uranium utilisation is the amount of fresh uranium used in the fuel cycle; typically for closed cycles the savings in fresh uranium required to manufacture newly enriched uranium fuels are calculated as % uranium utilisation savings compared to the OTC. Further gains of nearly 15% are achievable if Generation III reactors, such as the EPR, replace the current fleet [49]. Whilst the resource savings can be significant over the lifetime of reactors (approximately 1500 t of natural uranium per year is saved in the French TTC for instance [5]), the overall percentage utilisation is still very low (~1%). To illustrate these points, Poinssot and coworkers have explored several scenarios based on the French nuclear energy system [22,23,49,50]; some key inputs and outputs are summarised in Table 3. Taking the example of the 408 TWe scenario, it is seen here that the TTC based on the current reactor fleet requires 7647 t/y of fresh natural uranium. However, if France converted to the OTC, then it would need 9145 t/a; hence, the use of the TTC provides savings of 16.4% in uranium resources per year. The use of a fleet based on the EPR (and a higher capacity of 453 TWe) uses 6590 t/a, and the adoption of a fast-reactor-based fleet would theoretically reduce the uranium requirements to zero. The TTC is the system currently implemented in France and so based on real data, whereas the other scenarios are designed to match the electricity generation and enable like-for-like comparisons. From this analysis, therefore, utilisation of uranium resources can be improved by:
- Improving the probability of 238U fission.
- The use of depleted uranium stocks.
- Recycling and reusing fissile material.
Consequently, the use of FRs is promoted to improve resource utilisation, as the uranium utilisation is ~75% and depleted uranium can be used. Fast reactors also burn plutonium more effectively, enabling the multi-recycling of spent MOX fuels. Estimates of enhanced uranium utilisation vary from 30–100 times [41,51], meaning that uranium resources would last thousands of years if used with FR technology.
The French results are typical; the capabilities of FRs to extend the life of existing uranium resources have been well-known for a long time. The smaller but still useful impacts of the TTC to improve uranium utilisation are perhaps less widely appreciated, but are validated by similar findings from other studies. For example, Gao and Ko [52] constructed an equilibrium-based fuel cycle analysis of seven systems (with three different conversion or breeding ratios applied to systems with FRs). The systems all used pressurised water reactors (PWRs), plus Canada Deuterium Uranium (CANDU) reactors and FRs (the SFR is assumed) with different fuel cycles. As well as the OTC, a DUPIC (direct use of PWR spent fuel in CANDU) fuel cycle was considered. Closed fuel cycle options were modelled with either PUREX (plutonium uranium reduction extraction) reprocessing—for U and Pu separation only—or pyroprocessing—separation of U, transuranics and high-heat-generating radionuclides. The systems are listed in Table 4.
Equivalent actinide losses of 0.1% were applied to both PUREX and pyroprocesses, an equivalence which may not be justified in practice. SFR fuels were either MOX, with aqueous reprocessing, or metal alloys, with pyroprocessing. Their results are summarised in Table 5, where it is seen that uranium utilisation is reduced for the different closed fuel cycles compared to the OTC by 8% for the DUPIC cycle, 13% for the TTC and by 17–91% for SFR burner cycles, increasing to >99% for the SFR option in the breeder mode (liquid metal breeder reactor, LMBR). The same team [53] evaluated four of the same scenarios (PWR with OTC, DUPIC recycling, TTC and SFR with pyroprocessing) to evaluate material flows. Burnups of DUPIC fuel in CANDU, MOX in PWR and metal fuel in SFR were 7.5, 55 and 121 GWd/t, respectively, where approximately:
- One CANDU reactor was needed for every two PWRs (to sustain the DUPIC cycle).
- One MOX-burning PWR for every seven UO2-fuelled PWRs (in the TTC).
- One SFR for every PWR (in the Pyro-SFR cycle).
These three recycling scenarios were calculated to use 8.2%, 12.4% and 39.6% less uranium, respectively, than the OTC. Similarly, MIT calculated that plutonium recycling saves 15% and reprocessed uranium recycling saves 10% of uranium resources [54]. In their fuel cycle modelling using the CAFCA code, uranium savings of 24% were predicted by 2050 with MOX and RepU recycling, rising to 33–47% by 2100 based on a transition to FRs (conversion ratios of 0.75 to 1.23) at a growth rate for nuclear energy of 2.5%. An interesting observation is that starting up FRs based on enriched uranium also saves uranium resources (by around 50% at 2100) because of the earlier phasing out of LWRs compared with the OTC, as well as scenarios based on the recycling of transuranics (TRUs) from LWRs to start up the fast reactors. Figure 4 from the OECD-NEA illustrates the savings in uranium resources quite clearly, where it is seen that the TTC (mono-recycling) uses only 75–89% of the uranium needed for the OTC and multi-recycling uses around 0.4% of the uranium used in the OTC [55].
The question of uranium resource management was addressed from a global perspective by the OECD-NEA [34]. They simulated the impacts of global growth in nuclear energy from (a) a homogenised view of the world and (b) a macro-regional approach based on four groups taken from the Intergovernmental Panel on Climate Change (IPCC):
- IPCC-1: Central and Eastern Europe (including states of the former Soviet Union).
- IPCC-2: North America, Western Europe and Pacific OECD nations (such as Australia and Japan).
- IPCC-3: centrally planned Asia (including India and China).
- IPCC-4: Latin America, Caribbean, Middle East and Africa.
Two scenarios were modelled: the OTC and the closed cycle with a transition to fast reactors. The growth in nuclear energy is predicted to be strongest in IPCC-3 and IPCC-4, which overtake IPCC-2 in the second half of the 21st century. Uranium reserves are estimated at 40 MtU (not including seawater), and Figure 5 illustrates the breakdown by region; interestingly, IPCC-3, which is predicted to have the strongest growth in nuclear energy, only contains ~5% of the reserves. Their predictions are that, with the OTC, conventional resources will run out by 2100 and non-conventional resources by 2150, with stresses on uranium appearing maybe a few decades earlier than 2100 due to the needs to ensure committed resources for the full lifetime of a reactor. A consequence of this is that the number of uranium mines is estimated to increase from ~15 in 2020 to ~80 by 2100 as well as rapid growth from 2050 in PWR fuel fabrication requirements in the IPCC-3 and IPCC-4 regions, overtaking IPCC-2 capacities by 2080. Spent PWR fuels, on the other hand, would exceed 2 Mt by 2100. As would be expected from the estimated uranium savings from the TTC (10–25% range quoted above), the TTC does not extend uranium reserves significantly; in their scenario, 10 to 20 years is estimated dependent on reprocessing capacities and fuel burnups. The authors then present a variety of model results for the PWR-FR fuel cycle from both the homogenised and regional worldviews. Some general conclusions from their assessments were that LWRs will be needed throughout this century; peak reprocessing capacity is required by the mid-century; and that the ability to deploy infrastructure on the required scale by that time will probably limit the rate of fast reactor building, particularly in the IPCC-3 and IPCC-4 regions. Regional solutions with fuel cycle facilities provided by a limited number of countries were noted as a means for addressing practical implementation challenges (e.g., security-related ones).
Specifically, the OECD-NEA group concluded that:
- “…potential future scarcity of uranium resources is not unreasonable, but is a very serious prospect for regions of the world where the energy demand growth is and will very probably continue to be high and where nuclear energy will be employed to at least partially meet that demand.”
- “…rapid development of fast reactors, especially in areas with rapidly expanding economies and strong energy demand growth, is essential for nuclear energy sustainability, for the global saving of natural uranium resources and for the reduction of high-level waste generation requiring disposal.”
- “In the case of an open cycle, increased pressure on the uranium market is to be expected towards the end of the current century.”
Superficially, this is contrary to the MIT study (and others), which have concluded “There is no shortage of uranium resources that might constrain future commitments to build new nuclear plants for much of this century at least” [54]. However, the two views are perhaps closer than expected; it is the emphasis that it is different. Uranium reserves (excluding seawater) are not predicted to be exceeded before the end of this century; that is, after the generation of LWRs built before 2040 will be decommissioned. However, for the continued use of thermal reactors in the 22nd century it seems likely that there would be uranium supply problems. However, not only is this a long-term problem (>50 y), it is dependent on the expected growth in nuclear energy this century; thus, there is significant uncertainty over the extent of the perceived problems. Therefore, the issue is, rather, what value should be placed on ensuring sustainability for future generations via the prudent utilisation of natural uranium resources over the next 50 years or so?
3.2. Environmental Assessment and Life Cycle Analysis (LCA)
3.2.1. Background—LCA of Nuclear Energy
LCA has been highlighted by the United Nations as an important tool in analysing energy systems [24]. This is because LCAs are a powerful tool for assessing the impacts of energy options in a holistic manner, particularly from the viewpoint of sustainability. LCA analyses a system “from cradle to grave”. It relies, therefore, on having detailed sets of data, such as mass flows of reagents and products in a process, energy usage, wastes or discharges generated for each stage, facility or component of the system, process or product being analysed. The usual application of LCA is to assess the environmental footprint and impacts of the system, process or product in terms of a standardised set of environmental indicators. These indicators may vary between studies but generally include greenhouse gas emissions, other atmospheric pollutants, pollution or use of water resources, land use and pollution, use of natural resources, increases in the toxicity of the ecosystem and wastes generated (in the specific case of nuclear energy the generation of radioactive wastes is a key aspect). Obviously, dependent on the system being analysed, some of the environmental indicators will be more important than others, and so the interpretation of LCA results is important. While powerful, LCAs are a complicated measure; the efficacy of a model is dependent on the data that is used, and the detail included within the model. It is therefore wise to appreciate that a degree of variability is naturally to be expected between different assessments. Therefore, the International Organisation for Standardisation (ISO) has two standards (ISO 14040 and 14044) that relate to LCA studies to ensure that the tools are properly applied. LCA is commonly seen as a key tool in the growth of a circular economy and sustainable development.
The JRC in their assessment of the sustainability of nuclear energy placed a very strong emphasis on the use of LCA as a primary analytical tool [28]. Both these studies noted that, generally speaking, there are fewer applications of these methods to nuclear energy than other systems, and that the most numerous studies related to analysis of the carbon footprint of nuclear versus other energies. These have been critically reviewed by a number of authors, with the general consensus being that they are much lower than fossil fuels and probably between solar and wind or hydro in terms of CO2 emissions, with the front end of the fuel cycle providing the largest contribution [56,57,58]. For example, Warner and Heath [56] evaluated the LWR fuel cycle to be in the range 3.7 to 110 gCO2eq/kWh, and another study [58] calculated a mean value of 66 gCO2eq/kWh. An OECD-NEA review [51] also shows that (indirect) carbon emissions from nuclear are as low as wind power and agrees that these emissions are principally from energy used in uranium mining and enrichment. The recent JRC review concludes that nuclear GHG emissions are comparable to hydro and wind (28 vs. 26, 26 gCO2eq/kWh) in addition to being well below their threshold of 100 gCO2eq/kWh for energy sources that are defined to make a substantial contribution towards mitigating climate change [28].
Whilst nuclear power may only be responsible for ~10% of electricity production (in 2013), this equates to a saving of 1.2–2.4 Gt of CO2 emissions per year, or, alternatively, the use of nuclear power has prevented over 60 Gt CO2 from entering the atmosphere since 1971, equivalent to about two years’ worth of emissions [24]. IAEA estimates are somewhat higher, at 74 Gt CO2 saved between 1971 and 2018, which is equivalent to the total emissions from the entire power sector between 2013 and 2018 [40].
As described above, sustainability is considered as the combination of technical performance, economic viability, environmental preservation and societal acceptance. This report does not intend to review the environmental (or sustainability) credentials of nuclear energy compared to other forms of energy; it is instead focused on the different fuel cycle options for spent fuel management if nuclear forms part of the low-carbon energy mix. Suffice to say, in this context, various studies have clearly demonstrated the low environmental footprint of nuclear energy, which compares very well with renewables [23,26,59,60]; interested readers are directed towards those references quoted in the preceding paragraph and references therein. Indeed, on the basis of this evidence the JRC concluded that there was “no science based evidence” that nuclear energy was worse for the environment (or human health) than the renewable energies already included in the EU Taxonomy [28].
3.2.2. Nuclear Fuel Cycle LCA
Most of the published nuclear-related LCA studies are based on the OTC, with little consideration of how fuel cycle choices affect the environmental footprint. To address this gap, Poinssot and coworkers have produced a series of papers using the French nuclear fuel cycle as an example of applying an LCA approach to this question [22,23,49,50]. These studies are complemented by recent reports from Paullilo and coworkers based on fuel cycle experience in the United Kingdom [61,62]. The fuel cycles and indicators used to assess the environmental footprints in both French and UK studies are similar—see Table 6.
Firstly, using their bespoke LCA tool “NELCAS”, comparisons have been made for nuclear energy with coal, oil and gas, photovoltaics, hydro and wind power [23]. Nuclear energy was found to have the lowest impacts for greenhouse gas (GHG) emission and land-use indices and to be in the top three in all categories except water withdrawal and consumption. It is worth noting that French nuclear energy has a particularly low value for GHG emissions (5.29 gCO2eq/kWh) because the enrichment plant is powered by onsite nuclear reactors. Any further improvement in the carbon footprint would require reducing front-end mining, enrichment activities, transportation (or avoiding use of fossil fuels in transportation) and the size of geological repositories (through less mining and construction).
The different parts of the current French TTC were then analysed, where the dominant impacts (>70%) in most categories were shown to be due to front-end activities, particularly mining. The exceptions were water withdrawal and consumption in addition to technological waste, which are dominated by the reactor. Recycling (reprocessing and MOX fuel fabrication) have <15% impact on all nonradioactive factors (see Figure 6). Radioactive releases are dominated by gaseous emissions (53% radon from mining, 45% noble gases from reprocessing), with tritium (~2% from reprocessing and reactors) dominating liquid emissions.
Comparisons of the actual French TTC to a hypothetical French OTC (calculated for the same nuclear energy base) showed that all environmental indicators are improved with the TTC, apart from gaseous and liquid discharges as well as ILW (Figure 7). Radioactive releases from the TTC though are calculated to be <1% of the natural background radioactivity, and the TTC leads to a large decrease in HLW. Therefore, while the volumes of higher activity (ILW and HLW) wastes are similar in the OTC and TTC, there is a significant predicted reduction in both repository surface area (factor of ~2) and excavated volume for the TTC (factor of ~2), see Figure 8. The French HLW “R7T7” glass has been assessed to have a lifetime of >300,000 years, making it a durable waste form that is positively configured for the repository environment.
The conclusion drawn is that in order to enhance sustainability and reduce the environmental impact of nuclear energy, efforts are needed in either improving front-end processes or reducing the drawdown (flux) of materials from the front end by recycling. Consequently, Poinssot et al. have assessed the impacts of replacing the French reactor fleet with (a) 100% Generation III EPRs and (b) 100% Generation IV SFRs for plutonium multi-recycling. An analysis of introducing americium-only P&T into scenario (b) was also considered. Whilst these are hypothetical cases, they are useful to illustrate the potential system-level changes on the environmental indicators. Comparisons were made against the French reference TTC rather than against the open OTC (which presumably would give even higher benefits). In terms of the environmental indicators, an improvement of ~20% in most indicators was found by moving to an EPR fleet compared with the current PWR fleet when utilising a TTC. This is due to the increased efficiency of the EPR (higher burnup, efficiency and availability than the current fleet and longer operating lifetime assumed) resulting in reductions in uranium usage and, therefore, mining activities. The hypothetical transition to a 100% FR fleet, however, leads to substantial reductions in the environmental indicators (20–99%), as the multi-recycling of plutonium and use of depleted uranium means front-end mining and enrichment activities are no longer required. The recycling of americium as part of a P&T strategy has very minor impacts on the environmental indicators in the LCA; the driver for this is the impacts on the repository (Section 2.3).
Impacts of mining on the environmental footprint of nuclear energy are clearly highlighted by these studies. It is also noted by Poinssot [50] that the mining of lower grade ores, potentially needed in a global expansion of nuclear energy, would increase GHG emissions from around 5 gCO2eq/kWhe to 20 or even 200 gCO2eq/kWhe; a point also made in other papers [18,56].
Similar LCA studies have been reported recently by Paulillo and coworkers [61,62], see Table 6 for the comparison. An initial study of the UK closed cycle, with the reprocessing of spent AGR fuel in Thorp but with the storage of products rather than recycling, came to several conclusions [61]. Firstly, many of the environmental impacts were attributable to the use of uranium as a process reagent in the Thorp process as well as copper in the disposal of canisters of HLW in the DGR. The effects are traceable to the environmental impacts of the mining activities. A recommendation was that reprocessing should either use reprocessed uranium as the source of the uranium reagent or eliminate the need for (tetravalent) uranium within the separation process. Atmospheric emissions are dominated by 129I and 36Cl, and the same radionuclides dominate doses from the repository in the long term. The GHG emissions from the back end of the fuel cycle (i.e., reprocessing and disposal) are demonstrated to be very small compared to the rest of the nuclear fuel cycle, especially front-end mining, milling, conversion and enrichment.
Of greater relevance to this review is an LCA comparison between the OTC and different reprocessing scenarios, again for the UK case of Thorp-style reprocessing of AGR fuels [62], the scenarios being:
- “Base line”—the nominal UK fuel cycle whereby SNF was reprocessed and products stored pending decisions on disposition [61].
- Scenario one—the products from the baseline are disposed of in a repository.
- Scenario two—SNF is reprocessed and RepU is recycled whilst Pu is disposed of in a repository.
- Scenario three—SNF is reprocessed and RepU and Pu are recycled as MOX fuel.
- Scenario four—SNF is reprocessed and RepU is recycled whilst Pu is mixed with depleted uranium and recycled as MOX fuel.
- Direct disposal—the OTC.
Scenario one, understandably, gave the worst environmental performance, as SNF is reprocessed but the useful products are not recycled. Apart from ionising radiations, all the recycle scenarios provide environmental benefits, with scenarios three and four clearly the best options based on having the lowest environmental footprint (see Table 7). This is a consequence of the reduced use of natural uranium and, therefore, a reduction in mining and enrichment activities in the recycle options. Moreover, it is the recycling of plutonium that enables large gains; this is attributed to a combination of the high environmental impact of and footprint required for plutonium disposal, plus the higher energy value of plutonium in displacing natural uranium as a fuel. Whilst the authors note concerns around proliferation risks and costs, their conclusion is that scenarios three and four (plutonium recycling) are the “most advantageous options from an environmental perspective”. Whilst a range of scenarios more representative of advanced fuel cycles would have been more interesting perhaps, it is useful that the results complement and corroborate those of the French LCA studies.
Tendall and Binder [63] apply multicriteria assessment methods to the European nuclear fuel cycle under scenarios of reprocessing with the recycling of MOX fuel (R1), changes to uranium enrichment practices (R2–R4) and replacement with an FR fleet (R5). Their model indicates some interesting material flows:
- Of the natural uranium requirement, 95% is from outside Europe, with the remainder primarily from Ukraine. Nearly half of the uranium is processed outside Europe, causing wastes and emissions outside their system boundaries. This leads to 1.1 × 10⁷ t/y of waste rock and 2 × 10⁶ t/y mill tailings outside Europe.
- In Europe 6.4 × 10⁵ t waste rock, 1.3 × 10⁵ t mill tailings, 6.4 × 10³ t depleted uranium and 2.5 × 10³ t SNF accumulate per year, and nearly 80% of the energy requirement for the European nuclear fuel cycle is due to front-end activities (e.g., enrichment, conversion and disposal of depleted uranium).
- Scenario R1 allows a reduction in natural uranium usage of 15%, and R5 reduces fresh uranium and waste production by over 99%; the environmental improvements require trade-offs with economic and proliferation risks.
Lastly, it is noteworthy that the JRC review [28] draws almost exclusively on the work of Poinssot et al. described above when considering the different effects of open and closed cycles on the environmental footprint, indicative of the need for further corroborating LCA studies. Their conclusion, however, is that the differences are not large, and the main concern is the grade of uranium ore extracted in the mining. Furthermore, they conclude that the closed cycle generally has lower environmental impacts than the open cycle, and with specific regards to the reprocessing of SNF that it does “not represent significant harm to human health or to the environment” and can meet the objectives of the EU Taxonomy. In fact, reprocessing was viewed to have a dominant contribution in only three out of the nineteen environmental indicators they looked at—related to liquid or solid radioactive wastes—with the nuclear plant or mining and milling stages dominating all other radiological and non-radiological indicators.
3.3. Fuel Cycle Impacts on the Waste Repository
In this section, firstly, the general impacts on the DGR will be introduced, and then these will be considered in more detail by reference to specific fuel cycle studies from the literature.
3.3.1. General Considerations
It has already been noted that the management of radioactive wastes is seen as the main environmental problem associated with nuclear power and an issue of public concern, but, as pointed out by UNECE, these are created in small volumes; carefully managed with rigorous standards for disposal; isolated from the environment; and potentially recyclable [24].
Taking SNF disposal in the OTC as the baseline, changes to the fuel cycle can impact the design and performance of DGRs in various ways, such impacts being also dependent on the type of repository environment [64]. These impacts include:
- Reduction in radionuclide inventory (and/or radiotoxicity) of HLW.
- Changes in volumes of radioactive wastes for disposal (ILW and HLW).
- Reduction in heat generation (thermal power) of HLW.
- Increase in waste form durability.
Recycling materials in closed fuel cycles will reduce the inventory of actinides sent to the DGR and, therefore, the long-term hazard. Commonly, this is represented in terms of the evolution of the radiotoxicity of the waste in the DGR compared to that of the original uranium ore. Figure 9 is a typical example of these calculations. It can be seen that the time taken for radiotoxicity to decrease to that of the uranium ore is reduced by about an order of magnitude from 105 to 104 years with plutonium recycle in the TTC, and a factor of 100 with MA P&T, i.e., a reduction in the “lifetime” of the waste from geological to historical timescales [5,22]. It should be noted that this is an idealised situation (some of the papers reviewed below provide calculations based on more realistic scenarios), but does indicate the theoretical benefits of closed cycles with respect to waste inventories and/or radiotoxicities. However, practically all credible fuel cycle concepts require a DGR for some wastes, and since the repository safety assessments are based on long-term dose impacts rather than inventory or radiotoxicity, the dominant influences are those radionuclides that are mobile in the environment. In reducing conditions, as proposed in most DGR concepts, this means species such as 129I, 79Se and 36Cl rather than the actinides (which are assumed to be immobile) [64,65]. Thus, these impacts relate primarily to benefits in optimisation (cost, design and engineering) and public acceptability of the DGR rather than for demonstrating long-term safety performance. Actinides are generally only considered a safety concern in low-probability human intrusion scenarios [22].
The reductions in heat generation and HLW volumes are illustrated quite clearly for three reference scenarios (the OTC, TTC and multi-recycling) in Figure 10. The decay heat is shown for 50 and 200 years storage of HLW after reprocessing—the longer timeframe enabling the high-heat-generating fission products (caesium and strontium) to have decayed substantially. This reduction in heat generation enables waste canisters to be packed more densely and, hence, can lead to a reduction in the surface footprint and excavated volumes of a DGR.
3.3.2. Specific Fuel Cycle Studies
The most recent study (2021) available to us is the report from Dungan et al. [15], who analysed five fuel cycles:
- SC1—OTC based on PWRs.
- SC2—OTC based on high-temperature reactors.
- SC3—TTC based on PWRs.
- SC4—as SC3 but spent MOX fuel is recycled in SFRs for burning TRU (Pu, Np and Am).
- SC5—closed cycle based on SFRs (iso-breeders, conversion ratio of 1).
Key results are listed in Table 8. The reduction in masses of heat-generating wastes across the scenarios due to recycling is evident. Despite the differences in the masses of wastes, the totalised decay heats after reprocessing (or 10 years post-irradiation of SNF) are actually fairly constant (between 3 and 6 kW/TWhe, data not shown), since this is dominated by the fission product HHR. At the DGR there is a substantial increase in the number of packaged canisters for disposal with SC2 due to the large volume of the spent HTR fuel (TRISO-pebble-bed-type), whereas SC3 is similar to SC1 due to the assumed disposal limit of only one spent MOX fuel assembly per canister. For FR-based scenarios SC4/5, canisters are reduced by about half. There is a strong reduction in decay heat with storage times due to radioactive decay of the HHRs, and for scenarios involving TRU recycling in FR large reductions are possible, up to ~99% at 500 years.
The French LCA studies discussed above also considered the impacts of the different fuel cycles on the repository. Figure 11 summarises their findings. It is seen that the total volume of waste is approximately constant between the OTC and TTC, decreases for the EPR-based TTC due to the higher efficiency of the EPR and increases with the SFR fuel cycles. More importantly, however, is that the HLW decreases substantially for the closed cycles with concomitant decreases in the repository surface area and excavated volume by factors of ca. two–seven compared to the OTC. This enables either a smaller geological repository for a specific reactor fleet or an expansion in nuclear energy generation without the need to increase repository size.
In line with this, Peters [66] used a densification factor of four when comparing a TTC with direct disposal in YM. An interesting observation is that processing higher proportions of long-cooled legacy fuels (blended with new UOX SNF) reduces the densification factor achievable due to increasing amounts of americium (no MA P&T) in the waste, whereas extending the interim storage of vitrified HLW to 60 years (from their reference of 25 years) increases the densification factor up to a factor of about eight.
In their fuel cycle study, the MIT team applied densification factors of one for spent UOX and 0.15 for spent MOX fuels, increasing to four for an FP/MA mix and five for a fission product (FP)-based HLW [54]. These data were based on a review of the literature, including [66]. The dramatic decrease in mass terms of HLW directed to the DGR with twice-through and multi-recycling compared to the OTC is shown in Figure 12, but it must be noted that the appropriate densification factors must be applied to calculate the DGR footprint.
A comprehensive evaluation and screening of nearly 4400 fuel cycle variations was carried out for the US-DOE in 2014 [67]. These variations were grouped into 40 evaluation groups and assessed against nine evaluation criteria, including how they impacted on the geological disposal, resource utilisation and environmental impacts. The four best performing groups (relative to the US baseline OTC) were those based around multi-recycling of U and Pu or U and TRU actinides in fast or fast and thermal reactors. Compared to the established US OTC strategy, on a per unit energy basis these options had the potential to:
- Reduce the wastes for disposal by a factor of 10 or more.
- Reduce long-term radioactivity by a factor of 10 or more.
- Reduce residual uranium wastes by a factor of 100 or more.
- Reduce use of uranium resources by a factor of 100 or more.
- Reduce carbon dioxide emissions by a factor of two.
González-Romero [41] summarised findings from influential OECD-NEA and EURATOM (RED-IMPACT project) studies. Scenarios compared were:
- The OTC.
- TTC and plutonium recycle in fast reactors.
- The P&T scenarios:
- ○
- Pu and MA recycle.
- ○
- A simplified double-strata concept with LWRs and accelerator-driven systems (ADS).
- ○
- A double-strata concept with LWR, FR and ADS.
The findings were that P&T can reduce the mass and radiotoxicity of HLW sent to a DGR both by a factor of 100, compared to a factor of 10 for plutonium-only recycle, but over a 400-year timescale. However, because of how the safety cases for deep geological repositories are constructed there would be no benefits to the calculated public doses, which are mainly due to long-lived fission and activation products such as 129I, except in low-probability human intrusion scenarios. Heat loading was dominated by MA, after about 100 years. The removal of Pu and MA from HLW, therefore, reduces heat loading by a factor of ~100 initially, so HHR (Cs, Sr) then dominate for ~300 years, leading to a slower reduction. Extending the interim storage from 50 to 200 years (or the separation of HHR, Cs and Sr) combined with Pu and MA recycling would, therefore, achieve large reductions in heat generation. This results in increasing capacity in the repository by a factor of 10–50 (with P&T and 100-year decay storage). Even without optimisation, factors of two–six in increased capacity are achievable. Their results are compared to similar studies on YM where repository capacity can be increased by factors of five with Pu and Am recycling, 40 with Pu, Am, Cs and Sr recycling and 91 with Pu, Am, Cs, Sr and Cm recycling. A caveat on these data is that recovery factors of 99.9% for U and Pu and 99% for MA are assumed and that there will be consequent increases in secondary LLW and ILW. Some key results from the RED-IMPACT study are shown in Figure 13, where the reductions in uranium consumption, gallery length in a DGR, dose and radiotoxicity for six advanced fuel cycle options are compared relative to the OTC with PWRs [28].
Salvatores and Palmiotti [68] reviewed the benefits of P&T in reducing the radiotoxicity of nuclear waste in a repository from over 100,000 years to a few hundred years (i.e., reduced by a factor of 1000), and the mass inventory by a factor of 10 if all plutonium was recycled. This is improved to a reduction by a factor of over 100 with MA burning, assuming TRU recoveries of > 99.8% in reprocessing. This provides benefits in reducing the proliferation interest in the repository and consequences of low-probability events such as intrusion into the repository, but since the actinides are considered immobile it (again) does not benefit the long-term repository radiological safety case, this being dominated by mobile elements such as 129I, 99Tc and 36Cl. When considering heat loading in the repository, Salvatores and Palmiotti quoted a Japanese study that suggested reductions in footprint by a factor of four–five would be obtained with MA transmutation, and over 100 if there was also the separation and long-term storage of Cs and Sr. Neptunium was noted as having minimal effect on radiotoxicity, dose and heat generation in the repository, though other authors [64,69] note potential concern due to the long half-life and mobility of the pentavalent state, which is accessible in oxidising conditions. The authors reviewed transmutation in thermal reactors with enriched uranium and 10% TRU content fuel, a deep burn modular helium-cooled reactor (a type of very high-temperature reactor, VHTR) and with inert matrix fuels as well as in fast reactors and accelerator-driven systems. An interesting point is made about the build-up of 252Cf following multiple recycling, particularly in the thermal reactor case. Table 9 summarises some of the impacts of multi-recycling on the fuel fabrication stage for the case of plutonium-only recycling and full TRU recycling. The authors note that the effects of TRU loading in the recycle fuel are a significant burden and a cause for industry reluctance in accepting the potential benefits of P&T. They also conclude that fuel fabrication and separation process development and demonstration are priority areas to enable the industrialisation of P&T.
Acar et al. [70] aimed to assess the impact of various types of fuel cycles on the area required for the geological disposal and lifetime of waste (as indicated by the radiotoxicity). They used Swedish and UK (NIREX) concepts for the geological disposal of SNF and vitrified HLW and, of the fuel cycle variations assessed, the most relevant are the OTC and TTCs, the TTCs being either:
- Conventional reprocessing, producing separate U and Pu products that are recycled as MOX by blending with natural uranium.
- Advanced reprocessing, in which a U and Pu product is obtained from reprocessing that can be directly converted into MOX without blending.
In both TTC options reprocessed uranium is assumed to be re-enriched and recycled. Acar et al. calculated decay heat profiles for 30, 40 and 50 GWd/t burnup with 5 years cooling before reprocessing and 50 years before geological disposal. Of U and Pu in reprocessing, 99.9% recovery is assumed with a waste loading of 10 wt% in the vitrified waste. A maximum temperature on the surface of waste canisters is set as 80 °C. Data are presented as total electricity (MWe-y) produced per m2 of disposal area. Focusing on the high-burnup case, which is more relevant to LWR operations today (Table 10), observations from their analysis were:
- Disposal area increases with burnup except for vitrified HLW, which is insensitive to burnup and has the smallest disposal area per ton at 50 GWd/t.
- MOX fuels require substantially larger disposal areas due to their heat loading, which limits only one assembly (instead of four) that can be placed in a disposal canister. This impacts the overall disposal area per ton of fresh uranium fuel that is calculated for the TTC.
- TTCs produce less HLW (~30%) and generate ~20% more electricity per ton of fresh U fuel, although it is calculated to require ~7% more disposal area (due to the low-density disposal of MOX fuel).
- The disposal area advantage factor is defined as the total electricity generated per m2 of disposal area normalised to a reference cycle (OTC with 33 GWd/t fuel). This factor goes down with increasing burnup, implying that disposal of once-through low-burnup UOX fuel is the most efficient use of disposal capacity. However, the TTC are close to the OTC at all burnups; the difference is due to the recycling of RepU, which has a disposal area of ~22 m2/tU.
- The times for the radioactive wastes to decay to levels of toxicity comparable to the natural fuel are lower in the TTC but still around 10,000 years. This is because vitrified HLW has the lowest decay period of < 1500 years, but some MOX fuel also must be disposed of (decay period of 60,000–80,000 years depending on burnup).
- Multi-recycling (in FRs) and the impacts of recycling MAs were not assessed.
The results of modelling several scenarios based on PWRs followed by the introduction of either CANDU or fast reactors are listed in Table 5. These data from Gao and Ko [71] broadly follow expected trends. The DUPIC cycle is interesting in that whilst SNF and HLW arisings actually increased, compared to the OTC, the excavation volume decreased by nearly a factor of two; this is due to the lower burnup and reduced heat from the spent CANDU fuel after DUPIC recycling. Conversely, in the TTC it is calculated that a volume saving of only 10% is achieved despite a nearly 80% reduction in HLW and 87% reduction in SNF: this is due to the high heat generation of spent MOX fuels. LILW-SL wastes are characterised as those suitable for near-surface storage and disposal, in contrast to LILW-LL wastes which require deep geological disposal. Pyroprocesses show a reduction in LILW in their analysis because the high-heat radionuclides (HHR) Cs and Sr are removed and conditioned as a separate ceramic waste stream for ~300-year decay storage. As expected, other fuel cycles show increases in these secondary LILW wastes due to reprocessing cycles. Additionally, as expected, HLW are strongly reduced for scenarios with multi-recycling in FRs, again noting that the pyro schemes also remove HHR from HLW; although even the TTC shows an 80% decrease in HLW compared to the OTC. The reductions in Pu inventories when either partially (TTC) or fully (FR) closing the fuel cycle are also quantified. The changes in waste volumes are converted into the effects on the excavated volumes of the geological repository, assuming the volume required for HLW after 50 years cooling is 20 m3/kW. The expected increases in capacity (or reductions in size) are observed for the closed cycles, but the values are somewhat low compared to other studies (e.g., 1.1 for TTC, ~2 for SFR cycles). This is presumably at least partly due to the assumptions made with respect to cooling before disposal, actinide losses, HHR, etc. The largest decreases are calculated for fully pyroprocessing-based systems pyro-SFR and breeder, again attributable to the assumptions made, such as the removal of HHR into a bespoke waste form for decay storage.
Further data from Park et al. [53] are summarized in Table 11. As this is an equilibrium model the results are idealised, but the strong impacts of the TTC and multi-recycling in the SFR on SNF and HLW are apparent. The pyro-SFR option assumes HHR are removed and immobilised in a ceramic waste form for storage as LILW-SL, but the predicted decreases for LILW-SL and LILW-LL compared to the OTC are difficult to understand. No substantial differences in HLW activity (Ci/TWh) or heat generation (W/TWh) were found except for the pyro-SFR cycle due to the TRU recycling in this option. The authors also calculated plutonium inventories for proliferation assessment (outside the scope of this paper) as well as the excavation volume for the DGR assuming a factor of 20 m3/kW of HLW/SNF. These data are in line with other studies where the TTC shows a reduction of ~2 and multi-recycling a much larger reduction (very high in this idealised example with removal of HHR, Pu and MA).
Nishihara [72] assessed the impact of storage time before geological disposal against different degrees of fission product and actinide P&T. Fission products considered for separation were heat-generating 90Sr and 137Cs plus Tc and platinum group metals (PGMs). Waste disposal assumes vitrification with a limit of 350 W per waste form to limit temperature rises in the repository buffer material to 100 °C after 50 years of storage. The transmutation of MA assumes an ADS cycle with pyro processing. They calculated that the number of waste forms produced per unit of electricity does not change much for the MA transmutation scenario as the waste loading is only increased when the fission products are also removed, and so heat loading reduced by a factor of nearly eight. The impact on the repository was analysed by considering different emplacement configurations that could be achieved depending on the heat generation of the waste. The reference was the OTC with 50 years storage pre-disposal. This could be disposed of in the vertical V0 configuration. To reach a fourfold decrease in repository area (V2) would require storage times of 120 years, but MA transmutation reduces this to 90 years, and with the addition of fission product partitioning it is reduced to 5 years. The densest (“compact”) configuration (C), with over 40 times reduction in area compared to the OTC, could hypothetically be achieved with storage times of 240 years before disposal if MA transmutation is employed. Table 12 lists the values used by Nishihara for different vertical (V) and compact (C) emplacement configurations. V−1 is a configuration for wastes with higher heat generation that require greater spacing, and V1 and V2 are vertical configurations where, due to lower heat generation, the wastes can be placed closer together. The C configuration is for wastes of the lowest heat generation originally designed for compressed waste forms of hulls and end pieces from SNF. Precise details are available in reference [73].
Nishihara and coworkers extended their calculations to HLW disposal from an FBR fuel cycle with (a) reprocessing, (b) partitioning of HHR as a separate waste form, (c) MA separation and transmutation, (d) partitioning of HHR and transmutation of MA [73]. Limitations of ≤35 wt% loading and 2.3 kW/package were placed on the HLW, and it was assumed a bespoke waste form for HHR was available. Results were also compared to the TTC with LWRs. The heat generation from HHR in the FBR system is 40% lower than the LWR system due to a lower fission yield of 90Sr in the fast spectrum leading to a 35% reduction in repository area for a slightly longer predisposal period of 65 years storage compared to 50 years in the LWR cycle. Partitioning scenario (a) did not have much impact on the repository, but MA transmutation reduced the repository area by a factor of five after a 95-year storage period. The coupled scenario (d) could reduce the area by a factor of up to 100 with 60 years of storage of HLW and 295 years of storage of the HHR waste form (i.e., Cs and Sr) prior to disposal. Nishihara also looked at the effects of process losses and calculated that 0.1–0.3% leakage of MA and HHR into the waste forms was an upper limit for scenario (d) if the compact (C) configuration was to be maintained for the waste emplacement. In other scenarios with vertical (V) configurations a leakage of 10% was permissible. This approach is interesting in that it starts to define the process efficiencies required for MA separation and fuel fabrication processes.
The impacts on repository radiotoxicity through actinide recycling have been analysed by Lindley et al. [74] for selected SFR and LWR scenarios using the ORION model. They highlight that it would take several generations of recycling Pu and MA in burner SFRs (~300 years) to achieve reductions in radiotoxicity close to the equilibrium performance, otherwise the final cores tend to dominate the radiotoxicity. Reductions in repository decay heat require >1 generation of SFRs. Their work implies that recycling, or decay storage, of curium, americium and plutonium is needed to achieve the optimum gains.
Hesketh et al. [75] calculated reductions in decay heat and radiotoxicity for a closed fast reactor cycle (of 75 GWe) compared to an OTC, and estimated a reduction in the overall footprint of the repository by a factor of three, quoting an earlier paper. Bunn and co-workers [17] cite a number of US studies where the increase in the YM repository capacity has been calculated to be factors of around three, but up to nine or even greater in some strategies. However, they caution that other approaches could also increase capacity and impacts of MOX disposal (as seen in other studies above) should be accounted for.
More recently, with regard to MA P&T, there is a trend towards the recovery of americium only to avoid the severe problems of incorporating curium into fuels (i.e., the high neutron emissions associated). Poinssot and co-workers [76] show that around 90% of the benefits in reducing repository space can be obtained with the recycling of americium without curium as it is the main contributor to heat generation after about a century or so (providing plutonium is already recycled) [77,78].
The recent JRC study, in reviewing the data more pessimistically, did not find any major reduction in the DGR footprint with the TTC due to the impacts of MOX disposal, and estimated a 40% reduction with a fully closed cycle [28].
3.4. Recycle and Reuse of Wastes
The exploitation of SNF or reprocessed products and wastes, other than actinides for return to the fuel cycle, has been proposed on occasion [79]. Extracting additional value from these materials could, hypothetically, lead to additional revenue streams for a reprocessing plant, reduce wastes for disposal or enhance public acceptability. However, such opportunities and activities are really “spinoff” benefits from recycling SNF and so will only have a small influence on fuel cycle decisions. Therefore, these opportunities are not considered in detail here, but a few significant examples and studies will be briefly considered to indicate potential impacts of a broader view of SNF recycling that could be considered in greater detail elsewhere.
Bourg and Poinssot [80] considered the recovery of “critical raw materials” from reprocessing SNF in France against the requirements of producing elements with ≥0.01% of world production and ≤100 Bq/g residual radioactivity. They concluded that only rare-earth elements Pr, Nd, Gd (after 10 years of decay storage) and Ce (after 20 years of storage), plus Ru and Rh of the platinum group metals (30 and 50 years storage, respectively) were relevant. Furthermore, they concluded that the recovery of the rare earths would not be economically viable, whereas Ru and Rh would both be very difficult to recover during reprocessing operations. Both the extraction of 241Am from the reprocessed plutonium product [81] or 237Np (to re-irradiate and generate 238Pu [82]) are being or have been reported to provide nuclear materials for radioisotope thermoelectric generators (RTGs) for space power applications. Indian teams have recovered caesium from HLW, followed by vitrification into pencils for use as blood irradiators in medical applications [83]. The IMPACT programme in Japan has considered the separation of various radionuclides from wastes with potential value, including 107Pd and 93Zr [84].
SNF is associated with a very significant quantity of cladding, which in future nuclear fuels is most likely to be made from Zircaloy®. The recovery and recycling of this material for new cladding could be a good option to minimise the volumes of waste for disposal. Process development trials have been undertaken in the US to recover and reuse zirconium from Zircaloy® fuel cladding using a process based on volatile chlorides [85,86]. As with other proposals for recycling non-fuel materials, the environmental or societal benefits would have to be balanced against the economics, which could be substantial, even prohibitive, for additional separations processes added onto the reprocessing plant.
4. Discussion
Whilst political and public perception may be different, quantitative LCA consistently shows that the environmental footprint of nuclear energy is comparable or even better than renewables when considering GHG emissions or a range of other defined key environmental indicators [28]. If desirable, further improvements in the global environmental footprint can be made by reducing the extent of uranium mining and other front-end activities. This leads to closed fuel cycles with the recycling of plutonium as the environmentally optimum fuel cycle solutions [22,23,49,50,59].
There is also a general consensus that the reductions in thermal loading achievable with radionuclide separations in a closed cycle enables closer packing of wastes in a repository [17,41,49,66,68,72,73,75]. This can be of utility by requiring a smaller size for the repository footprint, or by emplacing more waste in the same total area; both have the same consequence of more low-carbon nuclear electricity generated per m2 of repository space. As with the reduction in the inventory (as measured by radiotoxicity or volume) of HLW, the benefits to the DGR that can be obtained depend, in reality, on specific national situations; most models are equilibrium-based models that present hypothetical outcomes dependent on many initial assumptions. The potential optimisation of the DGR by adopting some degree of SNF recycling is not necessary from a technical perspective (since sufficient geological space can usually be found) or for the safety performance assessments (as mobile 129I dominates the calculated doses to the biosphere based on current approaches to DGR safety cases). However, it can assist in the public acceptance of the DGR, so that in countries where repository size is controversial or constrained the radioactive waste disposal does not limit the important contribution nuclear energy can make to reducing GHG emissions; this is a potentially significant benefit.
Regarding the development of future nuclear fuel cycles, the OECD-IEA and OECD-NEA in their technology roadmap [39] recommended that governments should:
- Recognize the long-term benefits of developing Generation IV (Gen IV) systems in terms of resource utilisation and waste management.
- Support R&D in advanced recycling technologies to reduce the volume and toxicity of high-level waste.
They also recommend that “…environmentally sustainable uranium mining should be developed…” As has been reported in this paper, recycling potentially offers a better alternative means of achieving the goal of improved environmental sustainability by reducing the amount of mining required.
5. Conclusions
In summary, this survey of the literature suggests some general conclusions regarding the nuclear fuel cycle that can be drawn; further conclusions incorporating economics will follow in part two of this review. It should be noted that scenario models of fuel cycles are usually under an equilibrium state rather than more realistic dynamic models. As this does not account for the effects during the periods to attain equilibrium or run down to the end state, this gives idealised views on fuel cycles’ performance, but does enable fairer comparisons between fuel cycle options to be made.
Quantitative evaluations based on concepts of sustainability, combining economic, environmental and societal factors, and using methods such as LCA, are now being applied to the nuclear fuel cycle and should underpin decision making. However, the eventual outcomes will still be influenced on what, if any, weightings are applied to the evaluated criteria based on national objectives. A new approach (generic feasibility assessment) has proposed a way around this by focusing on relative assessments to a baseline system [87]. Work to determine LCA shows that nuclear energy, even operating with the OTC, already has an environmental footprint that is competitive with renewable energy sources, and most studies do not consider economic uranium resources to be a limiting factor for the duration of this century.
Implementation of a TTC offers savings of 10–20% of natural uranium resources compared to the OTC, whereas advanced fuel cycles, with multiple recycling of SNF, can extend uranium resources for centuries. LCA shows that the concomitant reduction in uranium mining and other front-end activities means that closed cycles are always better than the OTC from an environmental footprint perspective. Increasingly advanced reactors and increased levels of materials recycling tends to increase the environmental “friendliness” and sustainability of nuclear energy.
Globally, around half a million tonnes of spent nuclear fuel (SNF) will be in dry or wet storage by around 2050 (see Section 2.4). Safe long-term storage is widely accepted as an interim solution, but progress in repositories or increased recycling is needed to fully deal with SNF. SNF in storage will likely continue to rise, at least to 2100, especially if there is a global increase in low-carbon nuclear energy.
There is a general consensus that actinide recycling can reduce the size (both surface footprint and volume) of the DGR by a factor of two, and perhaps up to 10. Larger factors are theoretically possible if MA and HHR are separated from the HLW and/or longer decay storage times are applied. The precise outputs of these calculations are dependent on the scenarios modelled. The separation and recycling of plutonium and MA can reduce the longevity of the waste in the DGR (usually measured as the time required for the radiotoxicity to return to that of natural uranium ore) to historical (hundreds to few thousand years) rather than geological (few hundred thousand to million years) timescales.
Some advanced fuel cycles with actinide recycling can reduce the waste burden on the DGR (through reduced thermal loading volume and radiotoxicity) and increase the waste form performance (through increased durability). However, all credible fuel cycle concepts require a DGR for some waste forms, and repository safety assessments are based on long-term dose impacts, which are dominated by mobile radionuclides. Therefore, these benefits do not improve the safety performance assessments of the DGR; instead, they enable the optimisation of the designs (in pursuit of reduced repository size and complexity) and a reduction in the radiotoxicity. This could potentially lead to improved public acceptance, which may be a critical factor in nuclear energy making a full contribution to net zero targets.
Author Contributions
Conceptualisation, R.T.; methodology, R.T. and W.B.; formal analysis, R.T., W.B., L.S. and G.B.; investigation, R.T. and W.B.; data curation, R.T. and W.B.; writing—original draft preparation, R.T. and W.B.; writing—review and editing, R.T., W.B., L.S. and G.B.; visualisation, R.T. and W.B.; supervision, R.T. and G.B.; project administration, R.T.; funding acquisition, R.T. All authors have read and agreed to the published version of the manuscript.
Funding
This research was funded by the GBP 46 million Advanced Fuel Cycle Programme as part of the UK Department for Business, Energy and Industrial Strategy’s (BEIS) GBP 505 million Energy Innovation Programme.
Acknowledgments
The authors acknowledge the contributions of P. Nevitt and M. Sarsfield (NNL) as well as F.R. Livens and C.A. Sharrad (The University of Manchester) in reviewing and checking the report this work was based upon, in addition to their contributions to discussions in the preparation of this paper.
Conflicts of Interest
The funders had no role in the design of the study; in the collection, analyses, or interpretation of data; in the writing of the manuscript; or in the decision to publish the results.
References
- Energy White Paper: Powering our Net Zero Future; BEIS (Department for Business Energy and Industrial Strategy): London, UK, 2020. Available online: https://assets.publishing.service.gov.uk/government/uploads/system/uploads/attachment_data/file/945899/201216_BEIS_EWP_Command_Paper_Accessible.pdf (accessed on 7 December 2021).
- Management of Spent Nuclear Fuel and Its Waste; EASAC (European Academies Science Advisory Council): Publications Office of the European Union: Luxembourg, 2014. [CrossRef]
- Netter, P. Reprocessing of spent oxide fuel from nuclear power reactors. In Nuclear Fuel Cycle Science and Engineering; Woodhead Publishing: Sawston, UK, 2012; pp. 459–500. [Google Scholar] [CrossRef]
- Behar, C. Energy for the future: Generation IV fast reactors and the closed fuel cycle. Nucl. Future 2014, 10, 23–25. [Google Scholar]
- Poinssot, C.; Rostaing, C.; Greandjean, S.; Boullis, B. Recycling the Actinides, The Cornerstone of Any Sustainable Nuclear Fuel Cycles. Procedia Chem. 2012, 7, 349–357. [Google Scholar] [CrossRef] [Green Version]
- Baron, P.; Cornet, S.M.; Collins, E.D.; DeAngelis, G.; Del Cul, G.; Fedorov, Y.; Glatz, J.P.; Ignatiev, V.; Inoue, T.; Khaperskaya, A.; et al. A review of separation processes proposed for advanced fuel cycles based on technology readiness level assessments. Prog. Nucl. Energy 2019, 117, 24. [Google Scholar] [CrossRef]
- Choi, S.; Lee, H.J.; Ko, W.I. Dynamic analysis of once-through and closed fuel cycle economics using Monte Carlo simulation. Nucl. Eng. Des. 2014, 277, 234–247. [Google Scholar] [CrossRef]
- Allibert, M.; Ault, T.; Baron, P.; Bergeron, A.; Bromley, B.; Butler, G.; Chauvin, N.; Collins, E.; Cornet, S.; Croff, A.; et al. Introduction of Thorium in the Nuclear Fuel Cycle: Short- to Long-Term Considerations; NEA (Nuclear Energy Agency OECD): Paris, France, 2015; Available online: https://www.oecd-nea.org/science/pubs/2015/7224-thorium.pdf (accessed on 7 December 2021).
- Sokolov, F.; Fukuda, K.; Nawada, H.P. Thorium Fuel Cycle-Potential Benefits and Challenges; IAEA (International Atomic Energy Agency): Vienna, Austria, 2005; Available online: https://www-pub.iaea.org/MTCD/Publications/PDF/TE_1450_web.pdf (accessed on 7 December 2021).
- Ekberg, C. Developments in reprocessing of spent nuclear fuels for the thorium fuel cycle. In Reprocessing and Recycling of Spent Nuclear Fuel; Taylor, R., Ed.; Woodhead Publishing: Sawston, UK, 2015; pp. 603–640. [Google Scholar] [CrossRef]
- Vijayan, P.; Shivakumar, V.; Basu, S.; Sinha, R. Role of thorium in the Indian nuclear power programme. Prog. Nucl. Energy 2017, 101, 43–52. [Google Scholar] [CrossRef]
- Wilson, P. (Ed.) The Nuclear Fuel Cycle: From Ore to Waste; Oxford University Press: Oxford, UK, 1997. [Google Scholar]
- Hyatt, N. Plutonium management policy in the United Kingdom: The need for a dual track strategy. Energy Policy 2017, 101, 303–309. [Google Scholar] [CrossRef] [Green Version]
- Gregg, R.; Hesketh, K. The benefits of a fast reactor closed fuel cycle in the UK. In Proceedings of the GLOBAL 2013: International Nuclear Fuel Cycle Conference-Nuclear Energy at a Crossroads, Salt Lake City, UT, USA, 29 September–3 October 2013; pp. 1235–1244. [Google Scholar]
- Dungan, K.; Gregg, R.; Morris, K.; Livens, F.; Butler, G. Assessment of the disposability of radioactive waste inventories for a IAEA range of nuclear fuel cycles: Inventory and evolution over time. Energy 2021, 221, 119826. [Google Scholar] [CrossRef]
- NNL (National Nuclear Laboratory); Burstall, R. FISPIN. 1979. Available online: https://www.answerssoftwareservice.com/fispin/ (accessed on 7 December 2021).
- Bunn, M.; Fetter, S.; Holdren, J.; van der Zwann, B. The Economics of Reprocessing vs. Direct Disposal of Spent Nuclear Fuel; Belfer Center for Science and International Affairs: Cambridge, MA, USA, 2003; Available online: https://www.belfercenter.org/sites/default/files/files/publication/repro-report.pdf (accessed on 7 December 2021).
- Butler, G. A Catalyst for Change? Nuclear Engineering International: London, UK, 2012; pp. 1–5. Available online: https://www.nsenergybusiness.com/features/featurea-catalyst-for-change/ (accessed on 7 December 2021).
- Waddington, I.; Thomas, P.; Taylor, R.; Vaughan, G. J-value assessment of relocation measures following the nuclear power plant accidents at Chernobyl and Fukushima Daiichi. Process Saf. Environ. Prot. 2017, 112, 16–49. [Google Scholar] [CrossRef]
- Butler, G.; Matthews, J.; Bodel, W. Nuclear Energy for Net Zero: A Strategy for Action; Dalton Nuclear Institute: Manchester, UK, 2021; Available online: https://documents.manchester.ac.uk/display.aspx?DocID=55791 (accessed on 7 December 2021).
- Resolution 42/187: Report of the World Commission on Environment and Development; UN (United Nations): New York, NY, USA, 1987; Available online: http://www.un-documents.net/a42r187.htm (accessed on 7 December 2021).
- Poinssot, C.; Boullis, B.; Bourg, S. Role of recycling in advanced nuclear fuel cycles. In Reprocessing and Recycling of Spent Nuclear Fuel; Taylor, R., Ed.; Woodhead Publishing: Sawston, UK, 2015; pp. 27–48. [Google Scholar] [CrossRef]
- Poinssot, C.; Bourg, S.; Boullis, B. Improving the nuclear energy sustainability by decreasing its environmental footprint. Guidelines from life cycle assessment simulations. Prog. Nucl. Energy 2016, 92, 234–241. [Google Scholar] [CrossRef]
- Use of Nuclear Fuel Resources for Sustainable Development—Entry Pathways. UNECE (United Nations Economic Commission for Europe): Geneva, Switzerland, 2021; Available online: https://unece.org/sites/default/files/2021-03/UNFC%26amp%3B UNRMS NuclearEntryPathwaysRevised.pdf (accessed on 7 December 2021).
- Stamford, L.; Azapagic, A. Sustainability indicators for the assessment of nuclear power. Energy 2011, 36, 6037–6057. [Google Scholar] [CrossRef]
- Stamford, L.; Azapagic, A. Life cycle sustainability assessment of UK electricity scenarios to 2070. Energy Sustain. Dev. 2014, 23, 194–211. [Google Scholar] [CrossRef]
- Benoît Norris, C.; Traverso, M.; Neugebauer, S.; Ekener, E.; Schaubroeck, T.; Garrido, S.R.; Valdivia, S.; Lehmann, A.; Finkbeiner, M.; Arcese, G. Guidelines for Social Life Cycle Assessment of Products and Organizations 2020; UNEP (United Nations Environment Programme): Nairobi, Kenya, 2020; Available online: https://www.lifecycleinitiative.org/wp-content/uploads/2021/01/Guidelines-for-Social-Life-Cycle-Assessment-of-Products-and-Organizations-2020-22.1.21sml.pdf (accessed on 7 December 2021).
- Technical Assessment of Nuclear Energy with Respect to the 'Do No Significant Harm’ Criteria of Regulation (EU) 2020/852 (‘Taxonomy Regulation’); JRC (Joint Research Centre): Ispra, Italy, 2021; Available online: https://ec.europa.eu/info/sites/default/files/business_economy_euro/banking_and_finance/documents/210329-jrc-report-nuclear-energy-assessment_en.pdf (accessed on 7 December 2021).
- Nuclear Technology Review 2019; IAEA (International Atomic Energy Agency): Vienna, Austria, 2019; Available online: https://www.iaea.org/sites/default/files/gc/gc63-inf2.pdf (accessed on 7 December 2021).
- Spent Fuel Reprocessing Options; IAEA (International Atomic Energy Agency): Vienna, Austria, 2008; Available online: https://www-pub.iaea.org/MTCD/Publications/PDF/TE_1587_web.pdf (accessed on 7 December 2021).
- Processing of Used Nuclear Fuel; WNA (World Nuclear Association): London, UK, 2018; Available online: https://world-nuclear.org/information-library/nuclear-fuel-cycle/fuel-recycling/processing-of-used-nuclear-fuel.aspx (accessed on 7 December 2021).
- Nuclear Technology Review; IAEA (International Atomic Energy Agency): Vienna, Austria, 2016; Available online: https://www.iaea.org/sites/default/files/16/08/ntr2016.pdf (accessed on 7 December 2021).
- Le, T. Spent Nuclear Fuel and Disposal: An Examination of Spent Nuclear Fuel Storage and Disposal Around the World; Stimson Centre, 2020; Available online: https://www.stimson.org/2020/spent-nuclear-fuel-storage-and-disposal/ (accessed on 7 December 2021).
- Transition towards a Sustainable Nuclear Fuel Cycle; NEA (Nuclear Energy Agency OECD): Paris, France, 2019; Available online: https://www.oecd-nea.org/upload/docs/application/pdf/2019-12/7133-transition-sustainable-fuel-cycle.pdf (accessed on 7 December 2021).
- Procedures for Expansion of Spent Nuclear Fuel Final Disposal Facility are Progressing; Posiva, 2008; Available online: https://www.posiva.fi/en/index/news/pressreleasesstockexchangereleases/2008/procedures_for_expansion_of_spent_nuclear_fuel_final_disposal_facility_are_progressing.181.html (accessed on 7 December 2021).
- A Repository for Nuclear Fuel that is Placed in 1.9 Billion Years Old Rock; SKB (Svensk Kärnbränslehantering), 2021; Available online: http://www.skb.com/future-projects/the-spent-fuel-repository/ (accessed on 7 December 2021).
- Lyons, P. Lessons Learned from the U.S. National Strategy-A Personal Perspective. Available online: http://www-pub.iaea.org/MTCD/Publications/PDF/SupplementaryMaterials/P1905_Proceedings_Series.zip (accessed on 7 December 2021).
- Bonano, E.J.; Kalinina, E.A.; Swift, P.N. The Need for Integrating the Back End of the Nuclear Fuel Cycle in the United States of America. MRS Adv. 2018, 3, 991–1003. [Google Scholar] [CrossRef] [Green Version]
- Technology Roadmap: Nuclear Energy; IEA (International Energy Agency) and NEA (Nuclear Energy Agency): Paris, France, 2015. Available online: https://www.oecd-nea.org/pub/techroadmap/techroadmap-2015.pdf (accessed on 7 December 2021).
- Climate Change and Nuclear Power 2020; IAEA (International Atomic Energy Agency): Vienna, Austria, 2020; Available online: https://www-pub.iaea.org/MTCD/Publications/PDF/PUB1911_web.pdf (accessed on 7 December 2021).
- González-Romero, E. Impact of Partitioning and Transmutation on the High Level Waste Management. Nucl. Eng. Des. 2011, 241, 3436–3444. [Google Scholar] [CrossRef]
- Cairns, M. Supporting NDA strategy development on spent oxide fuel management. Nucl. Future 2018, 14, 43–47. [Google Scholar]
- UK Radioactive Material Inventory; NDA (Nuclear Decommissioning Authority): Moor Row, UK, 2019. Available online: https://ukinventory.nda.gov.uk/wp-content/uploads/2020/01/2019-Materials-Report-Final.pdf (accessed on 7 December 2021).
- Hinkley Point C Pre-Application Consultation-Stage 2; Environmental Appraisal Volume 2; EDF Energy; Available online: https://www.edfenergy.com/sites/default/files/V2 C06 Spent Fuel and Radioactive Waste Management.pdf (accessed on 7 December 2021).
- Benedicic, J. Life without reprocessing—The end of an era. Nucl. Future 2017, 13, 34–39. [Google Scholar]
- Benchmark Study on Nuclear Fuel Cycle Transition Scenarios Analysis Codes; NEA (Nuclear Energy Agency OECD): Paris, France, 2012.
- Guérin, L.; Feng, B.; Hejzlar, P.; Forget, B.; Kazimi, M.S.; Van Den Durpel, L.; Yacout, A.; Taiwo, T.; Dixon, B.W.; Matthern, G.; et al. A Benchmark Study of Computer Codes for System Analysis of the Nuclear Fuel Cycle; MIT (Massachusetts Institute of Technology): Cambridge, MA, USA, 2009; Available online: https://dspace.mit.edu/handle/1721.1/75245 (accessed on 7 December 2021).
- The Effects of the Uncertainty of Input Parameters on Nuclear Fuel Cycle Scenario Studies; NEA (Nuclear Energy Agency OECD): Paris, France, 2017; Available online: https://www.oecd-nea.org/upload/docs/application/pdf/2020-01/dir1/nsc-r2016-4.pdf (accessed on 7 December 2021).
- Serp, J.; Poinssot, C.; Bourg, S. Assessment of the Anticipated Environmental Footprint of Future Nuclear Energy Systems. Evidence of the Beneficial Effect of Extensive Recycling. Energies 2017, 10, 1445. [Google Scholar] [CrossRef] [Green Version]
- Poinssot, C.; Bourg, S.; Ouvrier, N.; Combernoux, N.; Rostaing, C.; Vargas-Gonzalez, M.; Bruno, J. Assessment of the environmental footprint of nuclear energy systems. Comparison between closed and open fuel cycles. Energy 2014, 69, 199–211. [Google Scholar] [CrossRef] [Green Version]
- Nuclear Energy: Combating Climate Change; NEA (Nuclear Energy Agency OECD): Paris, France, 2015; Available online: https://www.oecd-nea.org/upload/docs/application/pdf/2019-12/7208-climate-change-2015.pdf (accessed on 7 December 2021).
- Gao, F.; Ko, W.I. Modeling and system analysis of fuel cycles for nuclear power sustainability (I): Uranium consumption and waste generation. Ann. Nucl. Energy 2014, 65, 10–23. [Google Scholar] [CrossRef]
- Park, B.H.; Gao, F.; Kwon, E.-H.; Ko, W.I. Comparative study of different nuclear fuel cycle options: Quantitative analysis on material flow. Energy Policy 2011, 39, 6916–6924. [Google Scholar] [CrossRef]
- Kazimi, M.; Moniz, E.J.; Forsberg, C.W. The Future of the Nuclear Fuel Cycle; MIT (Massachusetts Institute of Technology): Cambridge, MA, USA, 2011; Available online: https://energy.mit.edu/wp-content/uploads/2011/04/MITEI-The-Future-of-the-Nuclear-Fuel-Cycle.pdf (accessed on 7 December 2021).
- Strategies and Considerations for the Back End of the Fuel Cycle; NEA (Nuclear Energy Agency OECD): Paris, France, 2021; Available online: https://www.oecd-nea.org/upload/docs/application/pdf/2021-02/7469_best_report_2021-02-19_17-42-24_447.pdf (accessed on 7 December 2021).
- Warner, E.S.; Heath, G.A. Life Cycle Greenhouse Gas Emissions of Nuclear Electricity Generation: Systematic Review and Harmonization. J. Ind. Ecol. 2012, 16, S73–S92. [Google Scholar] [CrossRef]
- Lenzen, M. Life cycle energy and greenhouse gas emissions of nuclear energy: A review. Energy Convers. Manag. 2008, 49, 2178–2199. [Google Scholar] [CrossRef]
- Sovacool, B.K. Valuing the greenhouse gas emissions from nuclear power: A critical survey. Energy Policy 2008, 36, 2950–2963. [Google Scholar] [CrossRef]
- Santoyo-Castelazo, E.; Azapagic, A. Sustainability assessment of energy systems: Integrating environmental, economic and social aspects. J. Clean. Prod. 2014, 80, 119–138. [Google Scholar] [CrossRef]
- Cooper, J.; Stamford, L.; Azapagic, A. Environmental Impacts of Shale Gas in the UK: Current Situation and Future Scenarios. Energy Technol. 2014, 2, 1012–1026. [Google Scholar] [CrossRef]
- Paulillo, A.; Dodds, J.M.; Milliken, A.; Palethorpe, S.J.; Lettieri, P. The environmental impacts of reprocessing used nuclear fuels: A UK case study. Sustain. Mater. Technol. 2020, 25, e00186. [Google Scholar] [CrossRef]
- Paulillo, A.; Dodds, J.M.; Palethorpe, S.J.; Lettieri, P. Reprocessing vs direct disposal of used nuclear fuels: The environmental impacts of future scenarios for the UK. Sustain. Mater. Technol. 2021, 28, e00278. [Google Scholar] [CrossRef]
- Tendall, D.M.; Binder, C.R. Nuclear Energy in Europe: Uranium Flow Modeling and Fuel Cycle Scenario Trade-Offs from a Sustainability Perspective. Environ. Sci. Technol. 2011, 45, 2442–2449. [Google Scholar] [CrossRef]
- Swift, P.N.; Sassani, D.C. Impacts of Nuclear Fuel Cycle Choices on Permanent Disposal of High-Activity Radioactive Wastes. 2019. Available online: https://www.osti.gov/servlets/purl/1640197 (accessed on 7 December 2021).
- Greneche, D.; Boucher, L.; Gonzalez, E.; Cufiado, M.A.; Serrano, G.; Kuckshinrichs, W.; Wallenius, J.; Zimmerman, C.; Marivoet, J. Impact of Partitioning, Transmutation and Waste Reduction Technologies on the Final Nuclear Waste Disposal; Jülich Forschungszentrum: Jülich, Germany, 2008; Available online: https://inis.iaea.org/collection/NCLCollectionStore/_Public/39/117/39117966.pdf?r=1 (accessed on 7 December 2021).
- Peters, R.; Seshadri, P.; Aubert, G.; Barracco, T.; Billès-Garabédian, L. Economic Assessment of Used Nuclear Fuel Management in the United States; Boston Consulting Group: Boston, MA, USA, 2006; Available online: https://image-src.bcg.com/Images/BCG_Economic_Assessment_of_Used_Nuclear_Fuel_Management_in_the_US_Jul_06_tcm9-132990.pdf (accessed on 7 December 2021).
- Wigeland, R.; Taiwo, T.; Ludewig, H.; Todosow, M.; Halsey, W.; Gehin, J.; Jubin, R.; Buelt, J.; Stockinger, S.; Jenni, K.; et al. Nuclear Fuel Cycle Evaluation and Screening—Final Report; INL (Idaho National Laboratory): Idaho Falls, Idaho, 2014. Available online: https://fuelcycleevaluation.inl.gov/Shared Documents/ES Main Report.pdf (accessed on 7 December 2021).
- Salvatores, M.; Palmiotti, G. Radioactive waste partitioning and transmutation within advanced fuel cycles: Achievements and challenges. Prog. Part. Nucl. Phys. 2011, 66, 144–166. [Google Scholar] [CrossRef]
- Topin, S.; Aupiais, J. The pentavalent actinide solution chemistry in the environment. J. Environ. Radioact. 2016, 153, 237–244. [Google Scholar] [CrossRef]
- Acar, B.B.; Zabunoğlu, O.H. Impact assessment of alternative back-end fuel cycles on geological disposal of resultant spent fuels and high level wastes. Ann. Nucl. Energy 2019, 130, 452–472. [Google Scholar] [CrossRef]
- Ko, W.I.; Gao, F. Economic Analysis of Different Nuclear Fuel Cycle Options. Sci. Technol. Nucl. Install. 2012, 2012, 1–10. [Google Scholar] [CrossRef] [Green Version]
- Nishihara, K.; Nakayama, S.; Morita, Y.; Oigawa, H.; Iwasaki, T. Impact of Partitioning and Transmutation on LWR High-Level Waste Disposal. J. Nucl. Sci. Technol. 2008, 45, 84–97. [Google Scholar] [CrossRef]
- Nishihara, K.; Oigawa, H.; Nakayama, S.; Ono, K.; Shiotani, H. Impact of Partitioning and Transmutation on High-Level Waste Disposal for the Fast Breeder Reactor Fuel Cycle. J. Nucl. Sci. Technol. 2010, 47, 1101–1117. [Google Scholar] [CrossRef]
- Lindley, B.A.; Fiorina, C.; Gregg, R.; Franceschini, F.; Parks, G.T. The effectiveness of full actinide recycle as a nuclear waste management strategy when implemented over a limited timeframe—Part I: Uranium fuel cycle. Prog. Nucl. Energy 2015, 85, 498–510. [Google Scholar] [CrossRef] [Green Version]
- Hesketh, K.; Gregg, R.; Butler, G.; Worrall, A. Key conclusions from UK strategic assessment studies of fast reactor fuel cycles. Ann. Nucl. Energy 2017, 110, 330–337. [Google Scholar] [CrossRef]
- Poinssot, C.; Rostaing, C.; Baron, P.; Warin, D.; Boullis, B. Main Results of the French Program on Partitioning of Minor Actinides, a Significant Improvement Towards Nuclear Waste Reduction. Procedia Chem. 2012, 7, 358–366. [Google Scholar] [CrossRef]
- Boullis, B.; Chabert, C. Routes for Pu multi-recycling. Routes for Pu Multi-recycling. In Encyclopedia of Nuclear Energy; Greenspan, E., Ed.; Elsevier Science: Amsterdam, The Netherlands, 2021; Volume 2, pp. 510–522. [Google Scholar] [CrossRef]
- Modolo, G.; Geist, A.; Miguirditchian, M. Minor actinide separations in the reprocessing of spent nuclear fuels: Recent advances in Europe. In Reprocessing and Recycling of Spent Nuclear Fuel; Taylor, R., Ed.; Woodhead Publishing: Oxford, UK, 2015; pp. 245–287. [Google Scholar] [CrossRef]
- Bush, R.P. Recovery of Platinum Group Metals from High Level Radioactive Waste: Possibilities of Separation and Use Re-Evaluated. Platin. Met. Rev. 1991, 34, 202–208. Available online: https://www.technology.matthey.com/pdf/pmr-v35-i4-202-208.pdf (accessed on 7 December 2021).
- Bourg, S.; Poinssot, C. Could spent nuclear fuel be considered as a non-conventional mine of critical raw materials? Prog. Nucl. Energy 2017, 94, 222–228. [Google Scholar] [CrossRef] [Green Version]
- Brown, J.; Campbell, C.; Carrigan, C.; Carrott, M.; Greenough, K.; Maher, C.; McLuckie, B.; Mason, C.; Gregson, C.; Griffiths, T.; et al. Americium and Plutonium Purification by Extraction (the AMPPEX process): Development of a new method to separate 241Am from aged plutonium dioxide for use in space power systems. Prog. Nucl. Energy 2018, 106, 396–416. [Google Scholar] [CrossRef]
- Witze, A. Nuclear power: Desperately seeking plutonium. Nature 2014, 515, 484–486. [Google Scholar] [CrossRef] [Green Version]
- Kaushik, C.P.; Kumar, A.; Wadhwa, N.S.T.S.; Mehta, D.; Mishra, R.K.; Diwan, J.; Suresh Babu, S.K.; Marathe, A.P.; Jain, S.; Anand, G.; et al. Recovery of Cesium from High Level Liquid Radioactive Waste for Societal Application: An Important Milestone; BARC Newsletter: Mumbai, India, 2017; pp. 3–4. Available online: http://barc.gov.in/barc_nl/2017/20170304.pdf (accessed on 7 December 2021).
- Sasaki, Y.; Morita, K.; Suzuki, S.; Shiwaku, H.; Ito, K.; Takahashi, Y.; Kaneko, M. Extraction and Separation of Se, Zr, Pd, and Cs Including Long-Lived Radionuclides. Solvent Extr. Res. Dev. Jpn. 2017, 24, 113–122. [Google Scholar] [CrossRef] [Green Version]
- Collins, E.; Delcul, G.; Spencer, B.; Brunson, R.; Johnson, J.; Terekhov, D.; Emmanuel, N. Process Development Studies for Zirconium Recovery/Recycle from used Nuclear Fuel Cladding. Procedia Chem. 2012, 7, 72–76. [Google Scholar] [CrossRef] [Green Version]
- Regalbuto, M. INL HALEU Program: Advancing Tomorrow’s Nuclear Supply Chain; INL (Idaho National Lab): Idaho Falls, Idaho, 2019. Available online: https://gain.inl.gov/SiteAssets/Micro-ReactorWorkshopPresentations/Presentations/08-Regalbuto-INLHALEUProgramOverview_June2019.pdf (accessed on 7 December 2021).
- Bodel, W.; Hesketh, K.; McGlynn, G.; Matthews, J.; Butler, G. Generic Feasibility Assessment: Helping to Choose the Nuclear Piece of the Net Zero Jigsaw. Energies 2021, 14, 1229. [Google Scholar] [CrossRef]
Figure 1.
The nuclear fuel cycle.
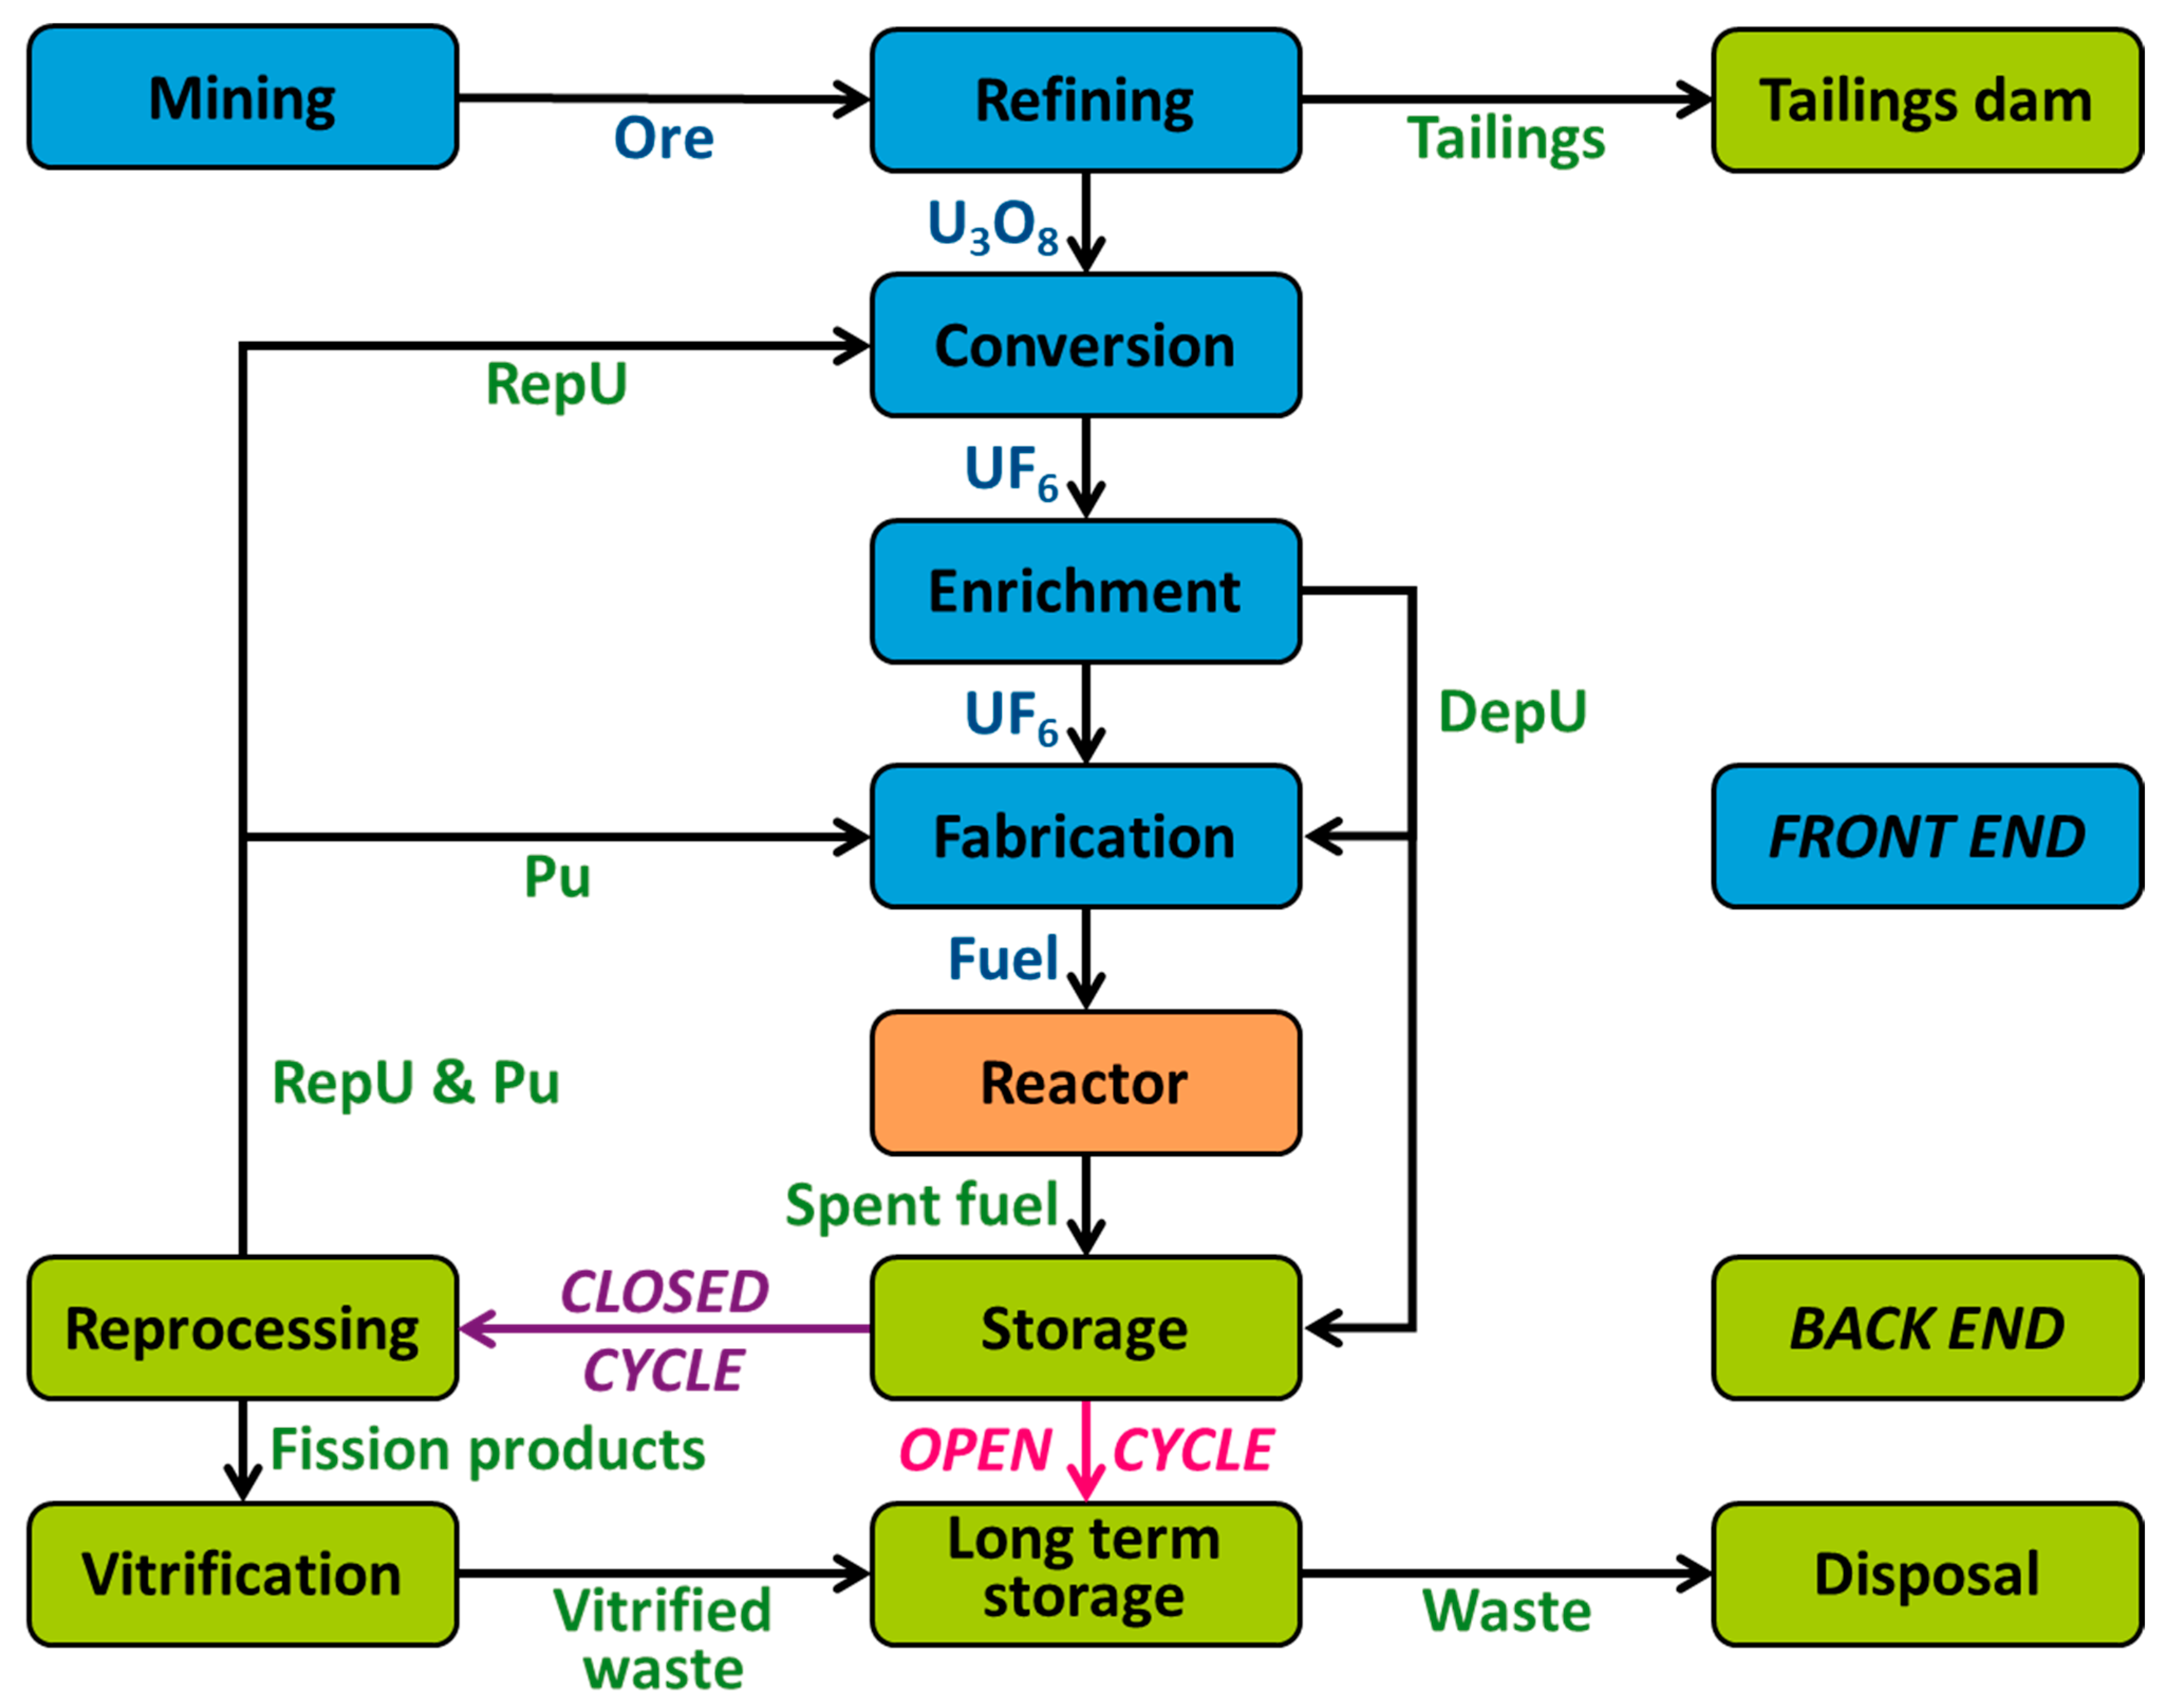
Figure 2.
Global spent fuel accumulation. Redrawn from data in [32].
Figure 2.
Global spent fuel accumulation. Redrawn from data in [32].
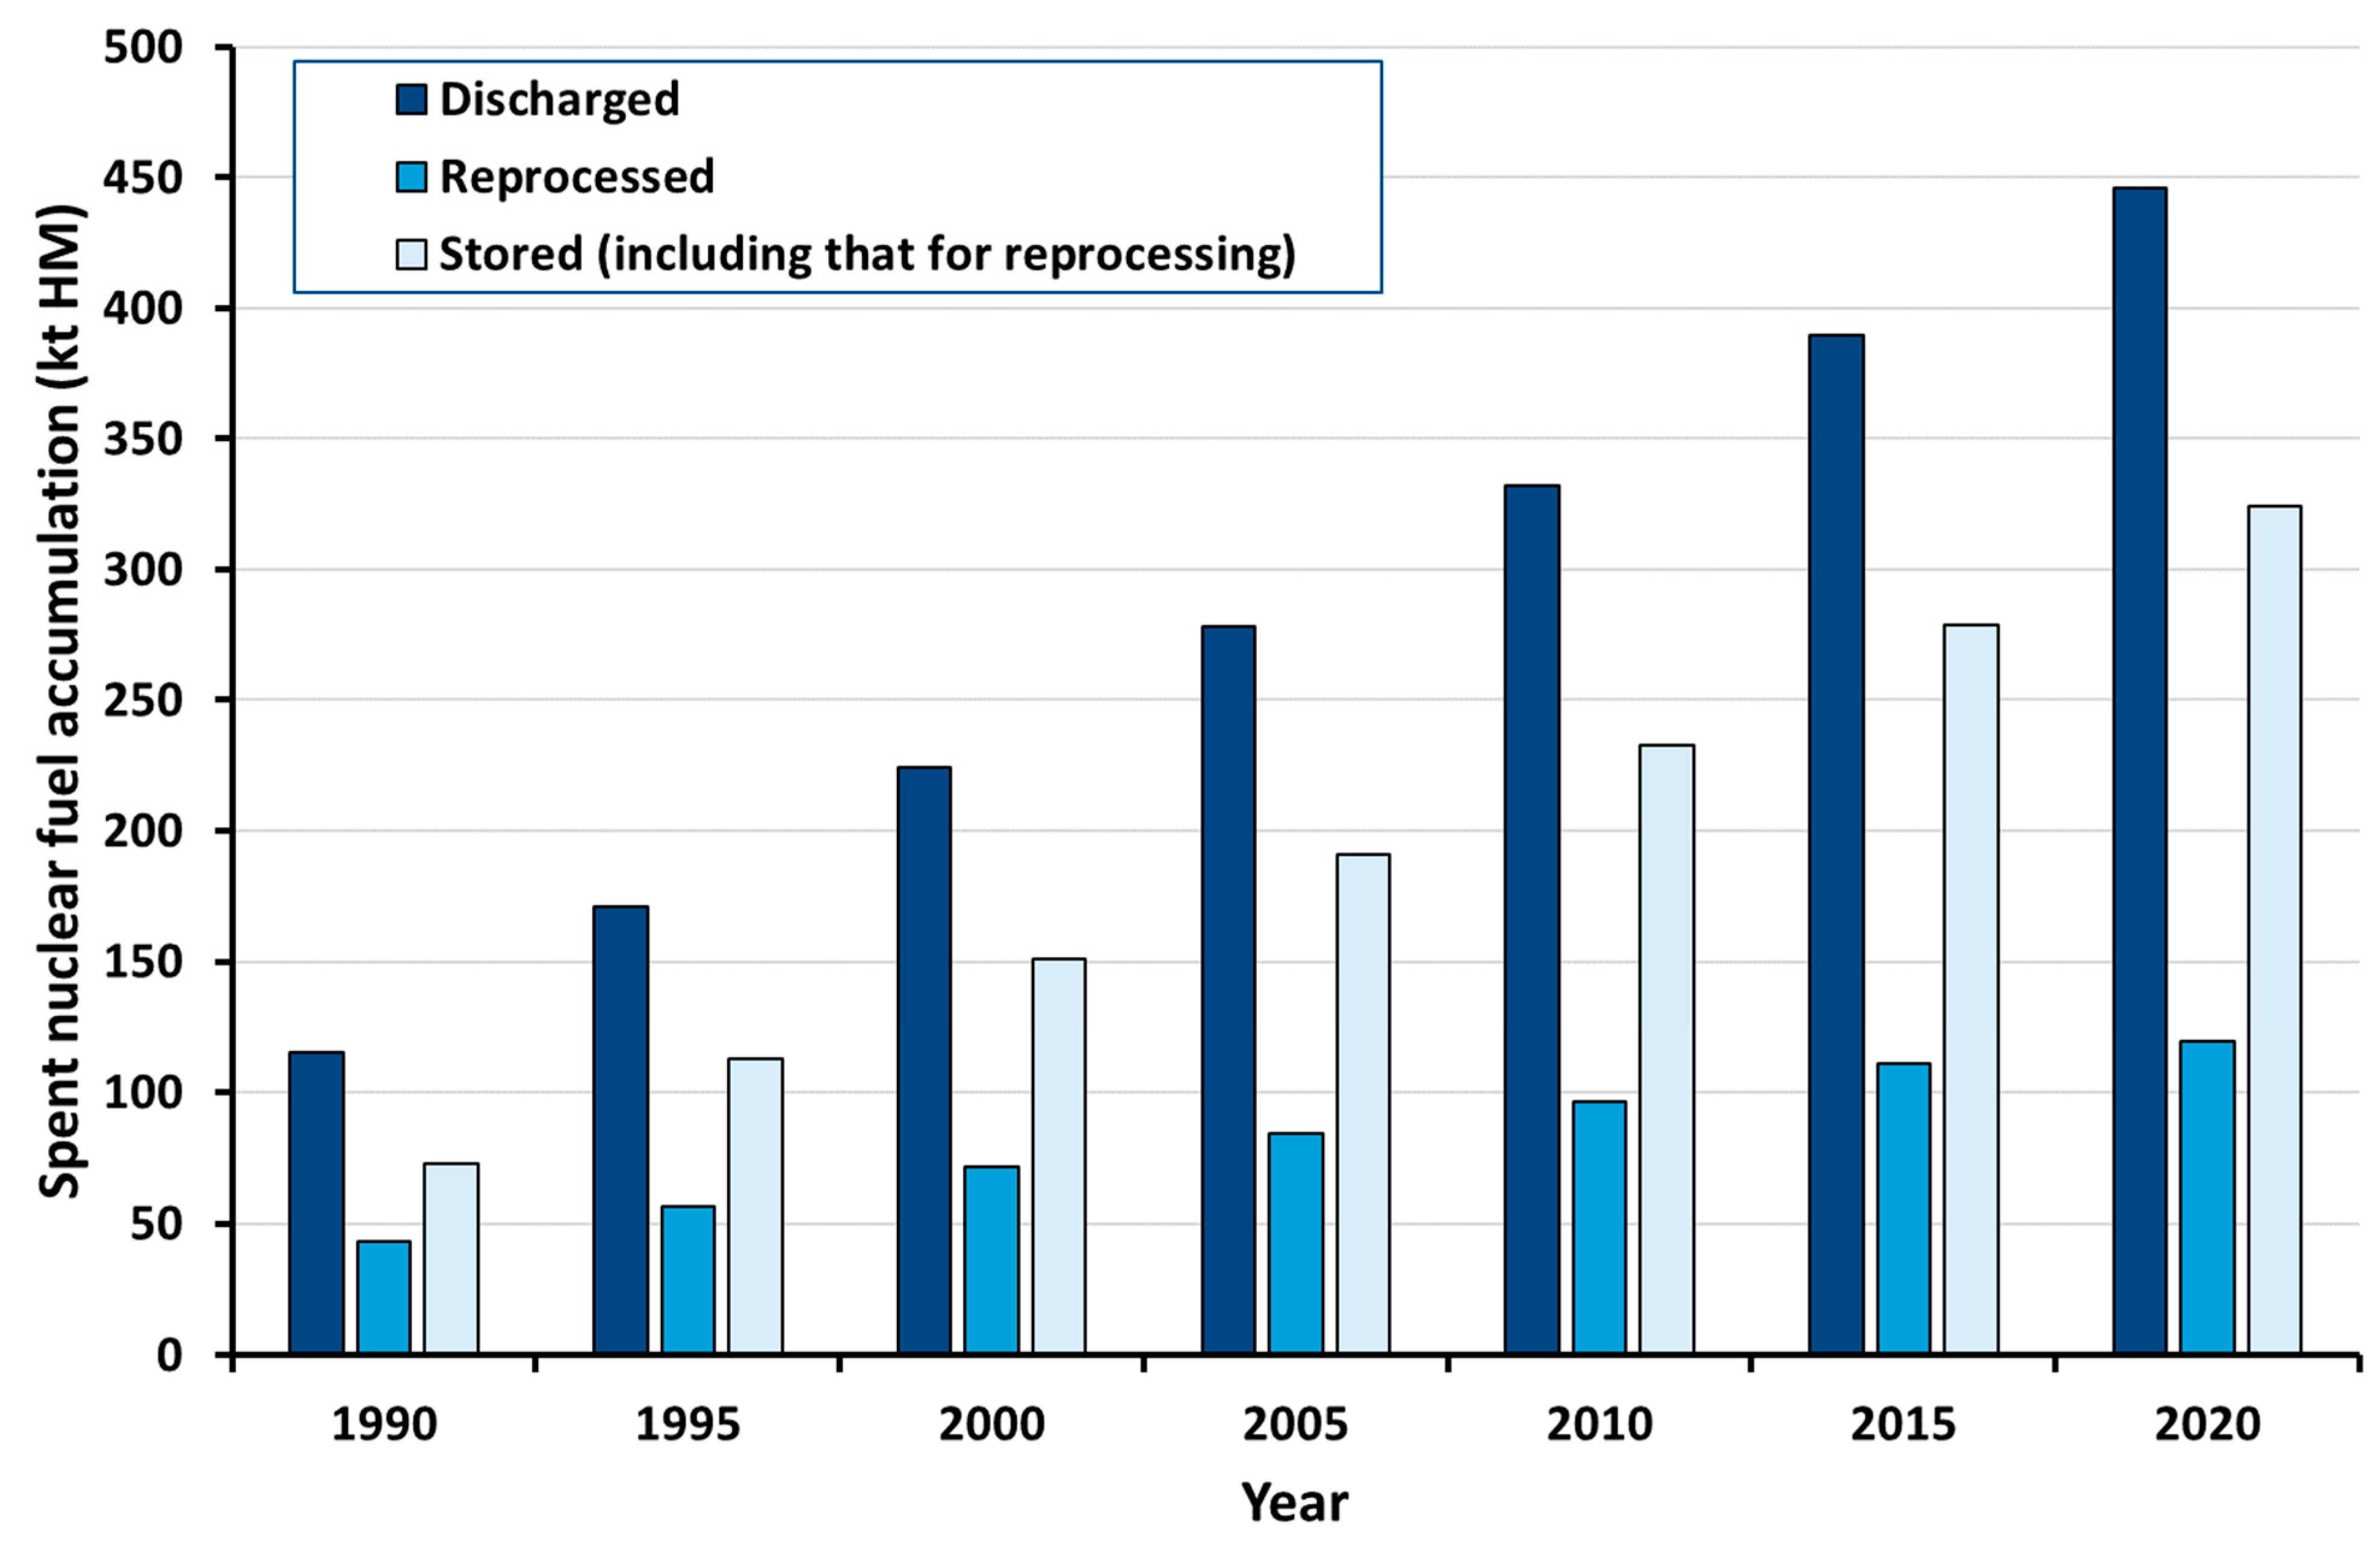
Figure 3.
Results of a sensitivity analysis of key output parameters to input parameters used in fuel cycle models, undertaken by the OECD-NEA. Red indicates a positive sensitivity coefficient, meaning that an increase of the input parameter induces an increase of the output parameter. Blue indicates a negative sensitivity coefficient, meaning that an increase of the input parameter induces a decrease of the output parameter. When r2 is lower than 0.9, the related sensitivity indicator is replaced by a question mark “?”. Redrawn from data in [48].

Figure 4.
Natural uranium consumption relative to the OTC. Redrawn from data in [55].
Figure 4.
Natural uranium consumption relative to the OTC. Redrawn from data in [55].
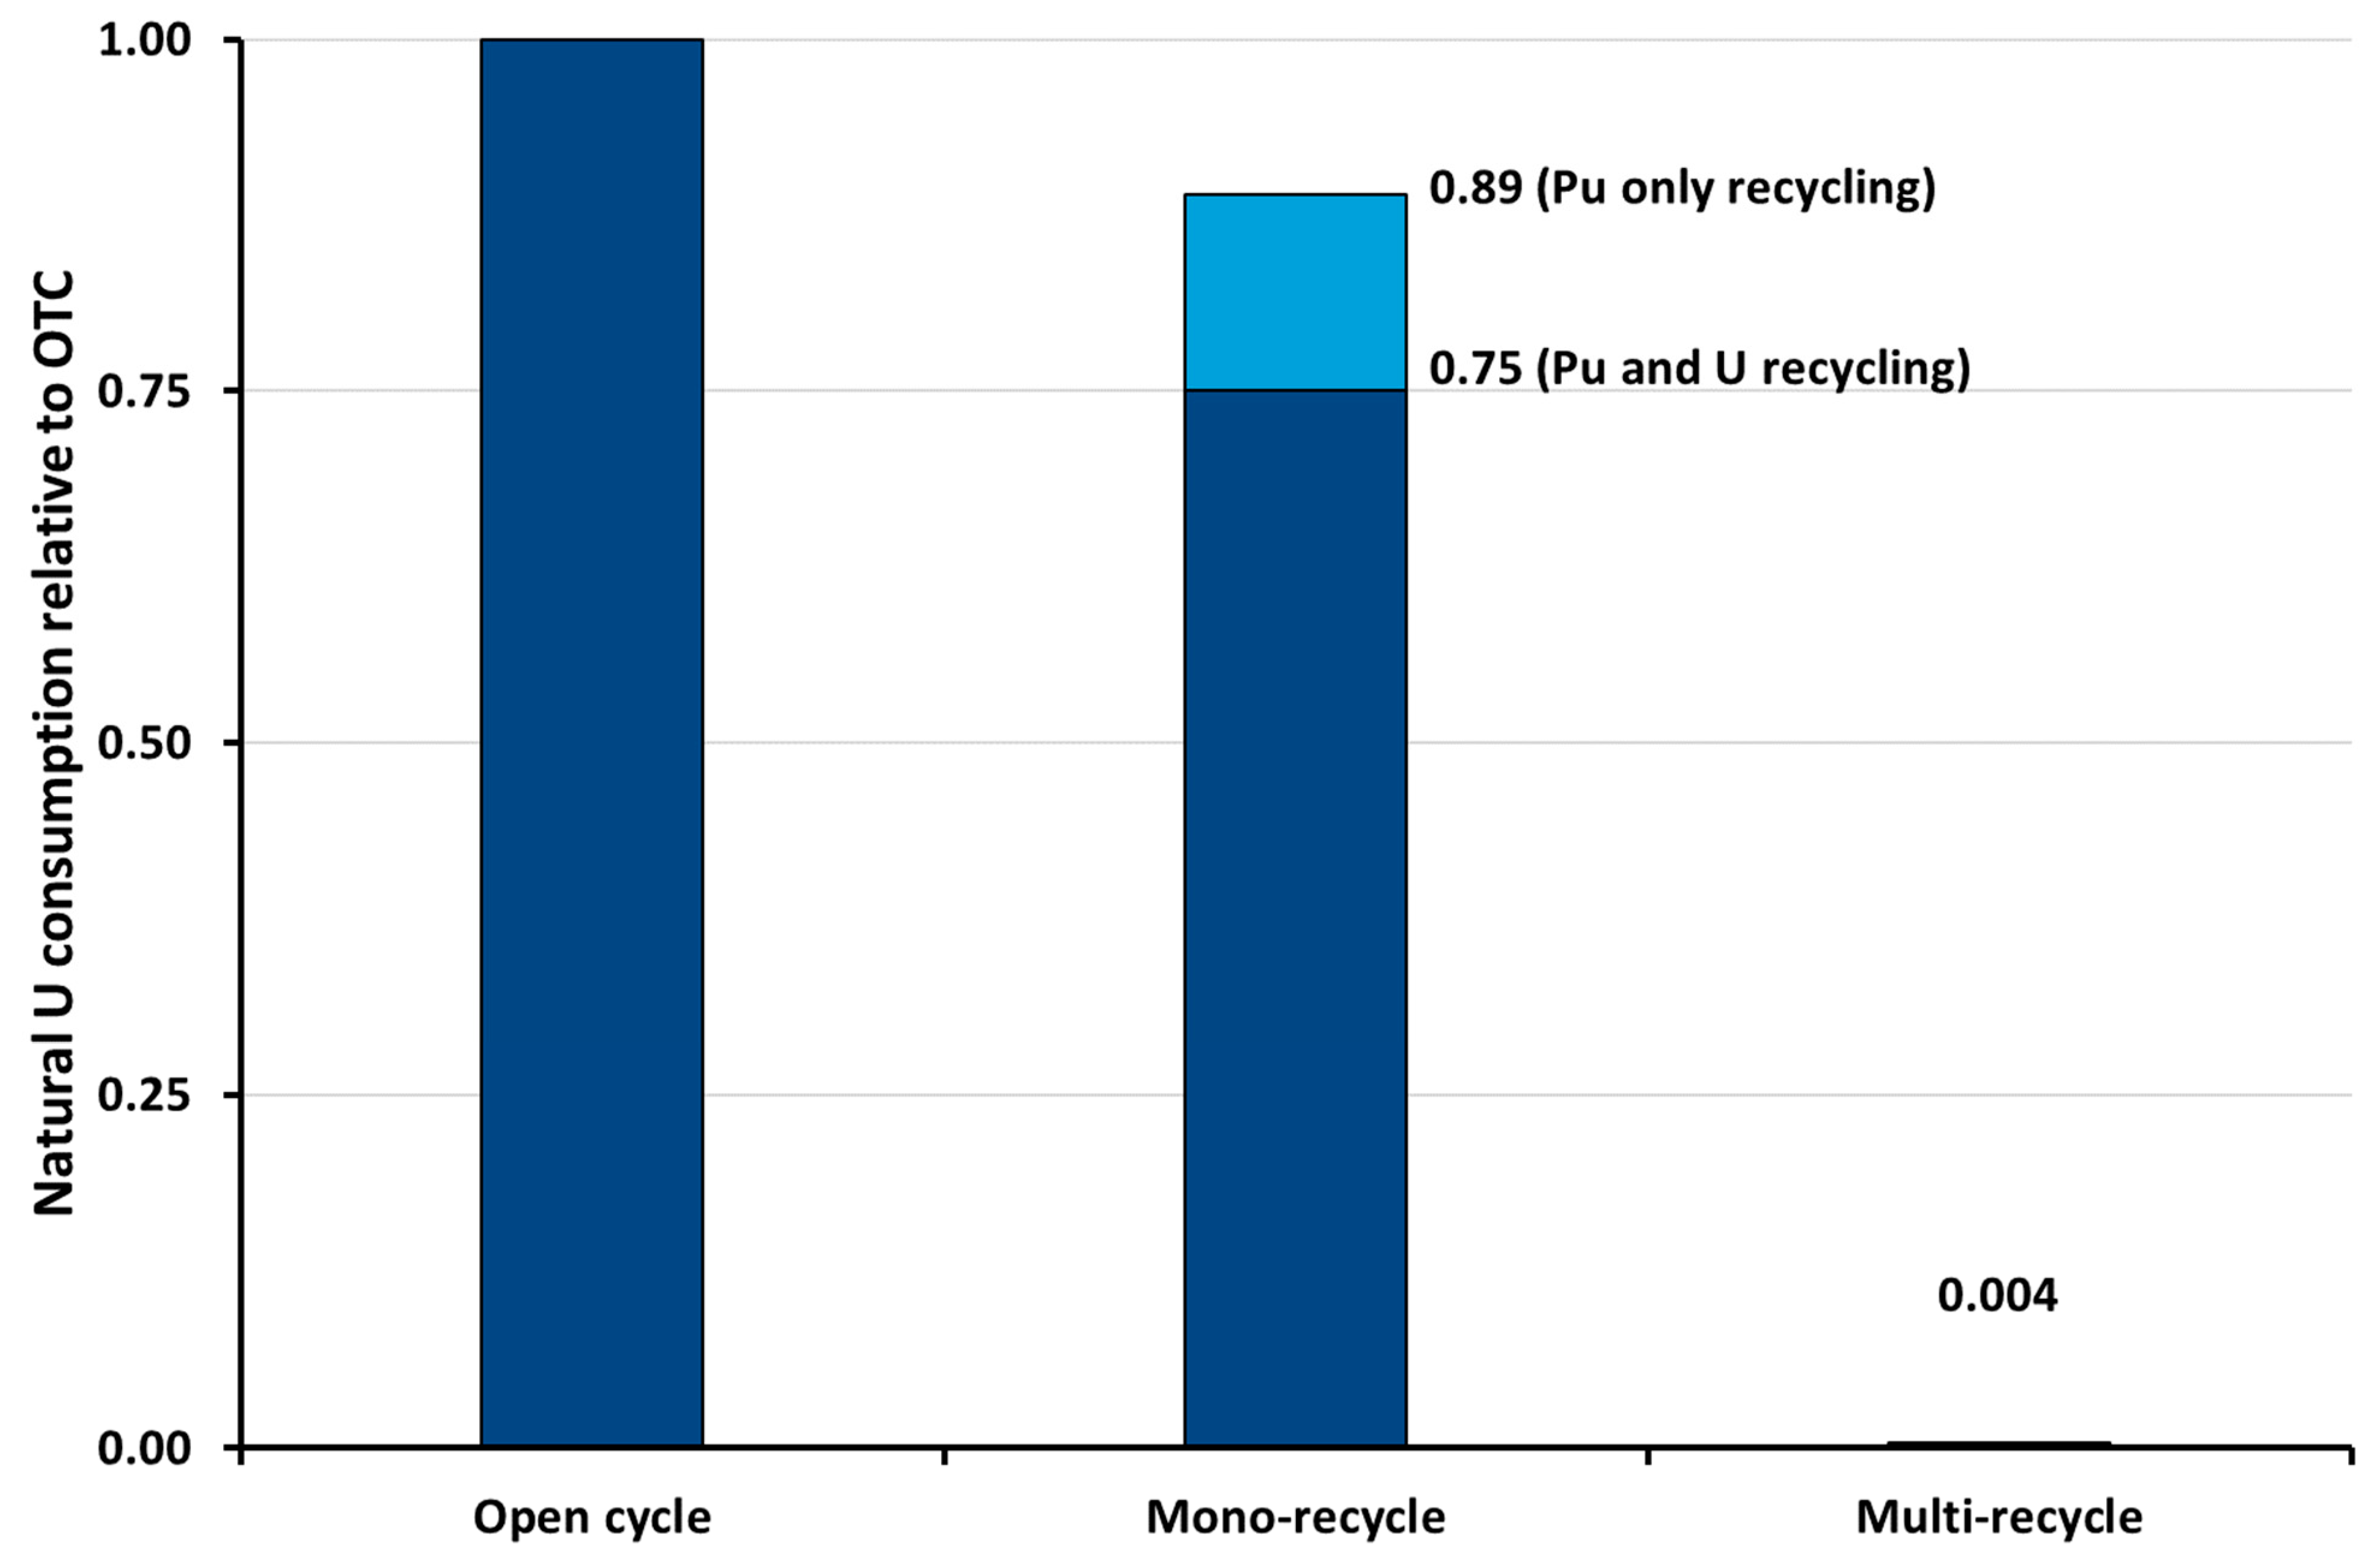
Figure 5.
Uranium reserves estimated by type and macro-region. Redrawn from data in [34].
Figure 5.
Uranium reserves estimated by type and macro-region. Redrawn from data in [34].
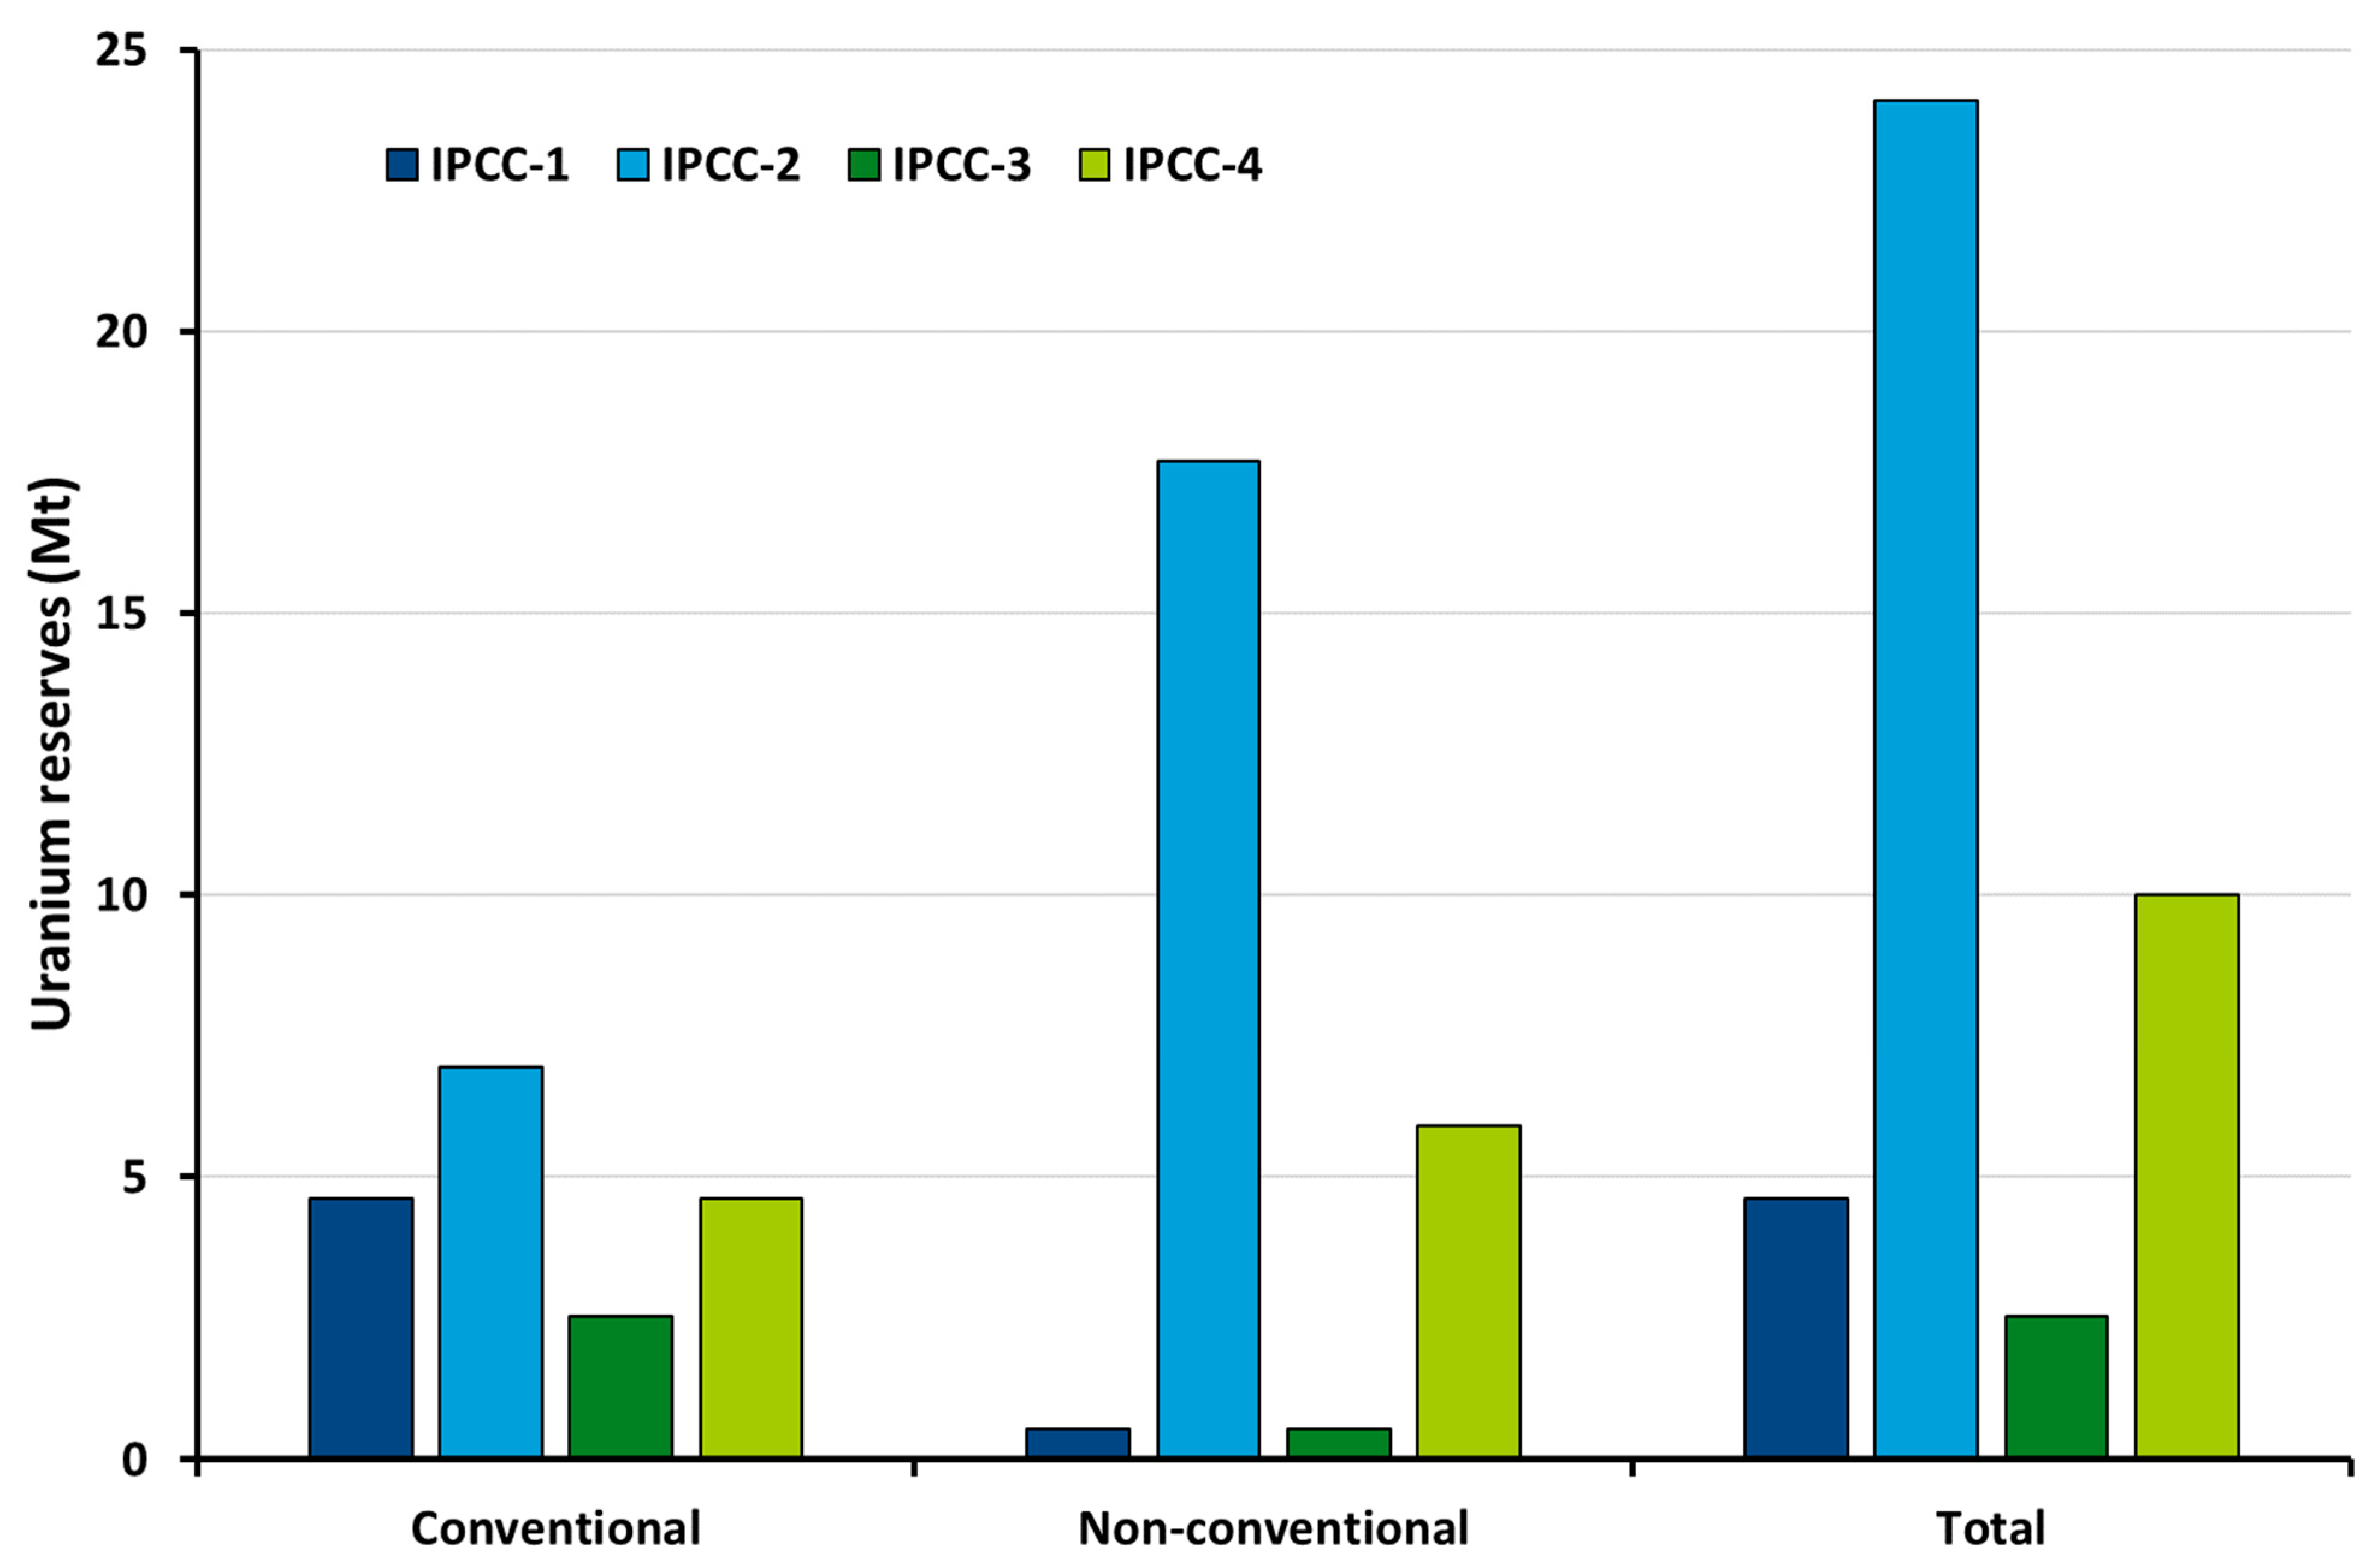
Figure 6.
Relative contribution of each step of the fuel cycle to the environmental and technological impact indicators calculated with NELCAS for the French TTC. Redrawn from data in [50].
Figure 6.
Relative contribution of each step of the fuel cycle to the environmental and technological impact indicators calculated with NELCAS for the French TTC. Redrawn from data in [50].
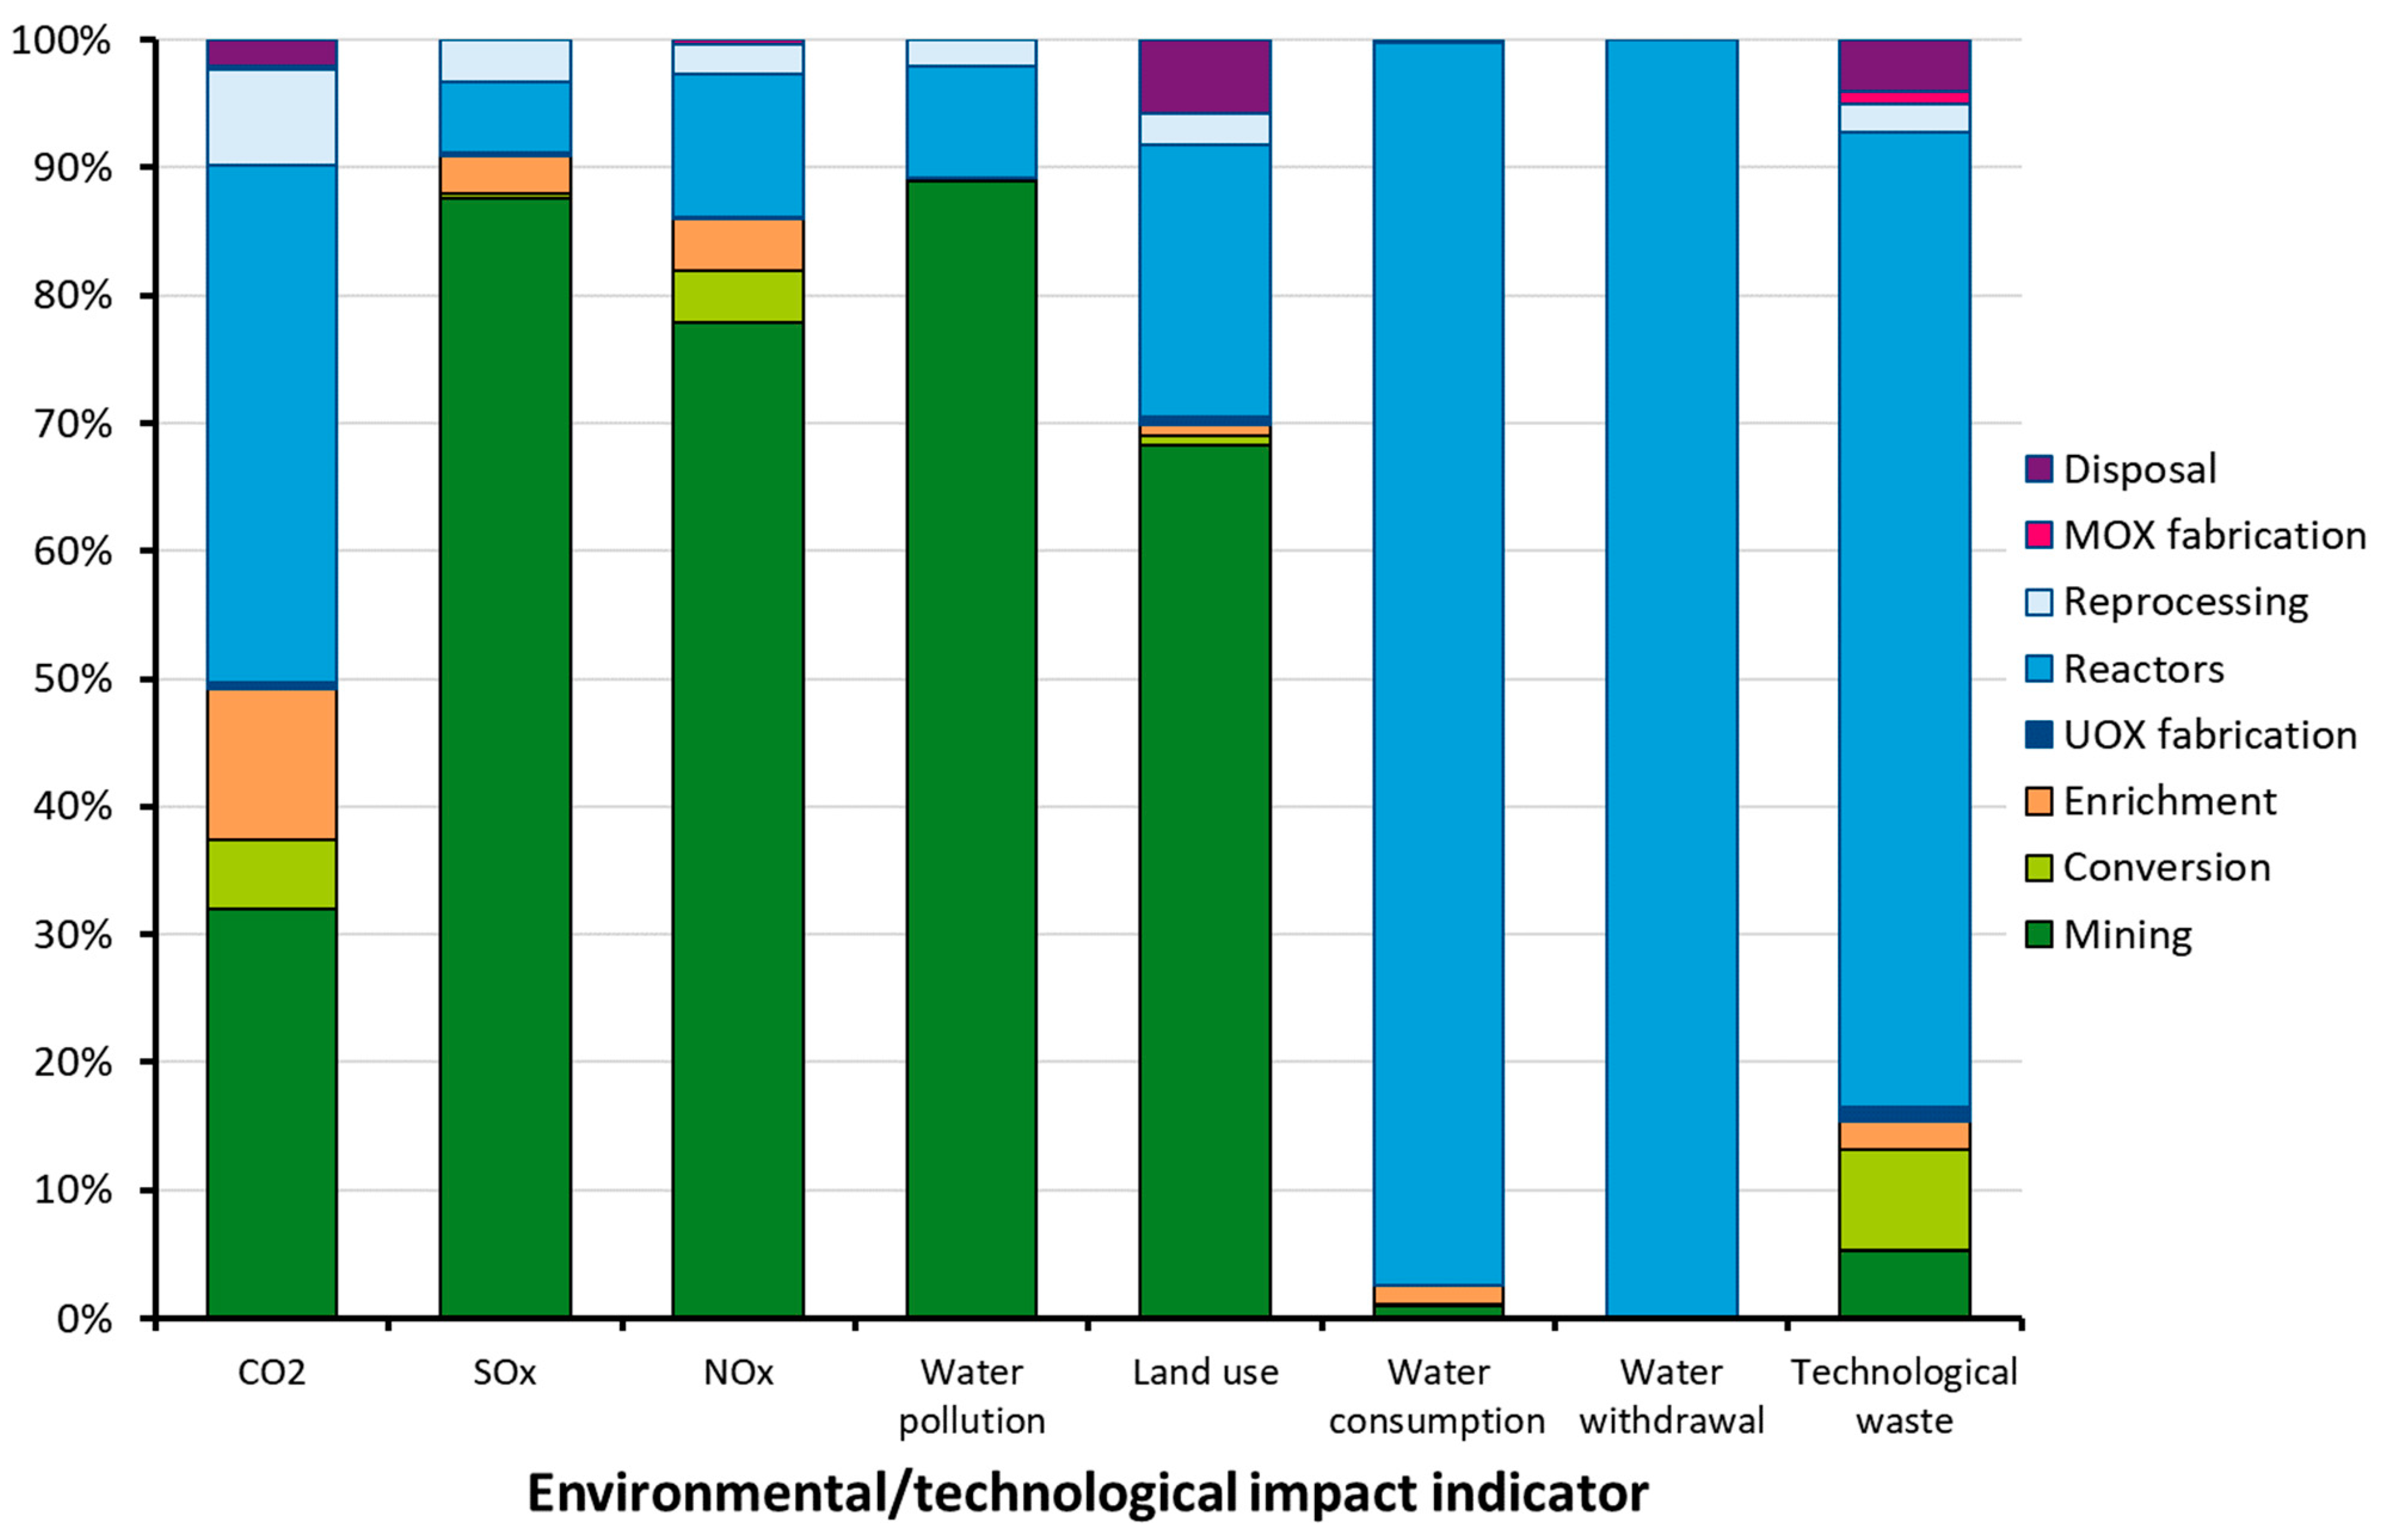
Figure 7.
Evolution of the impact indicators when going from the French TTC to an OTC producing the same amount of electricity with the same PWR fleet. Redrawn from data in [50].
Figure 7.
Evolution of the impact indicators when going from the French TTC to an OTC producing the same amount of electricity with the same PWR fleet. Redrawn from data in [50].
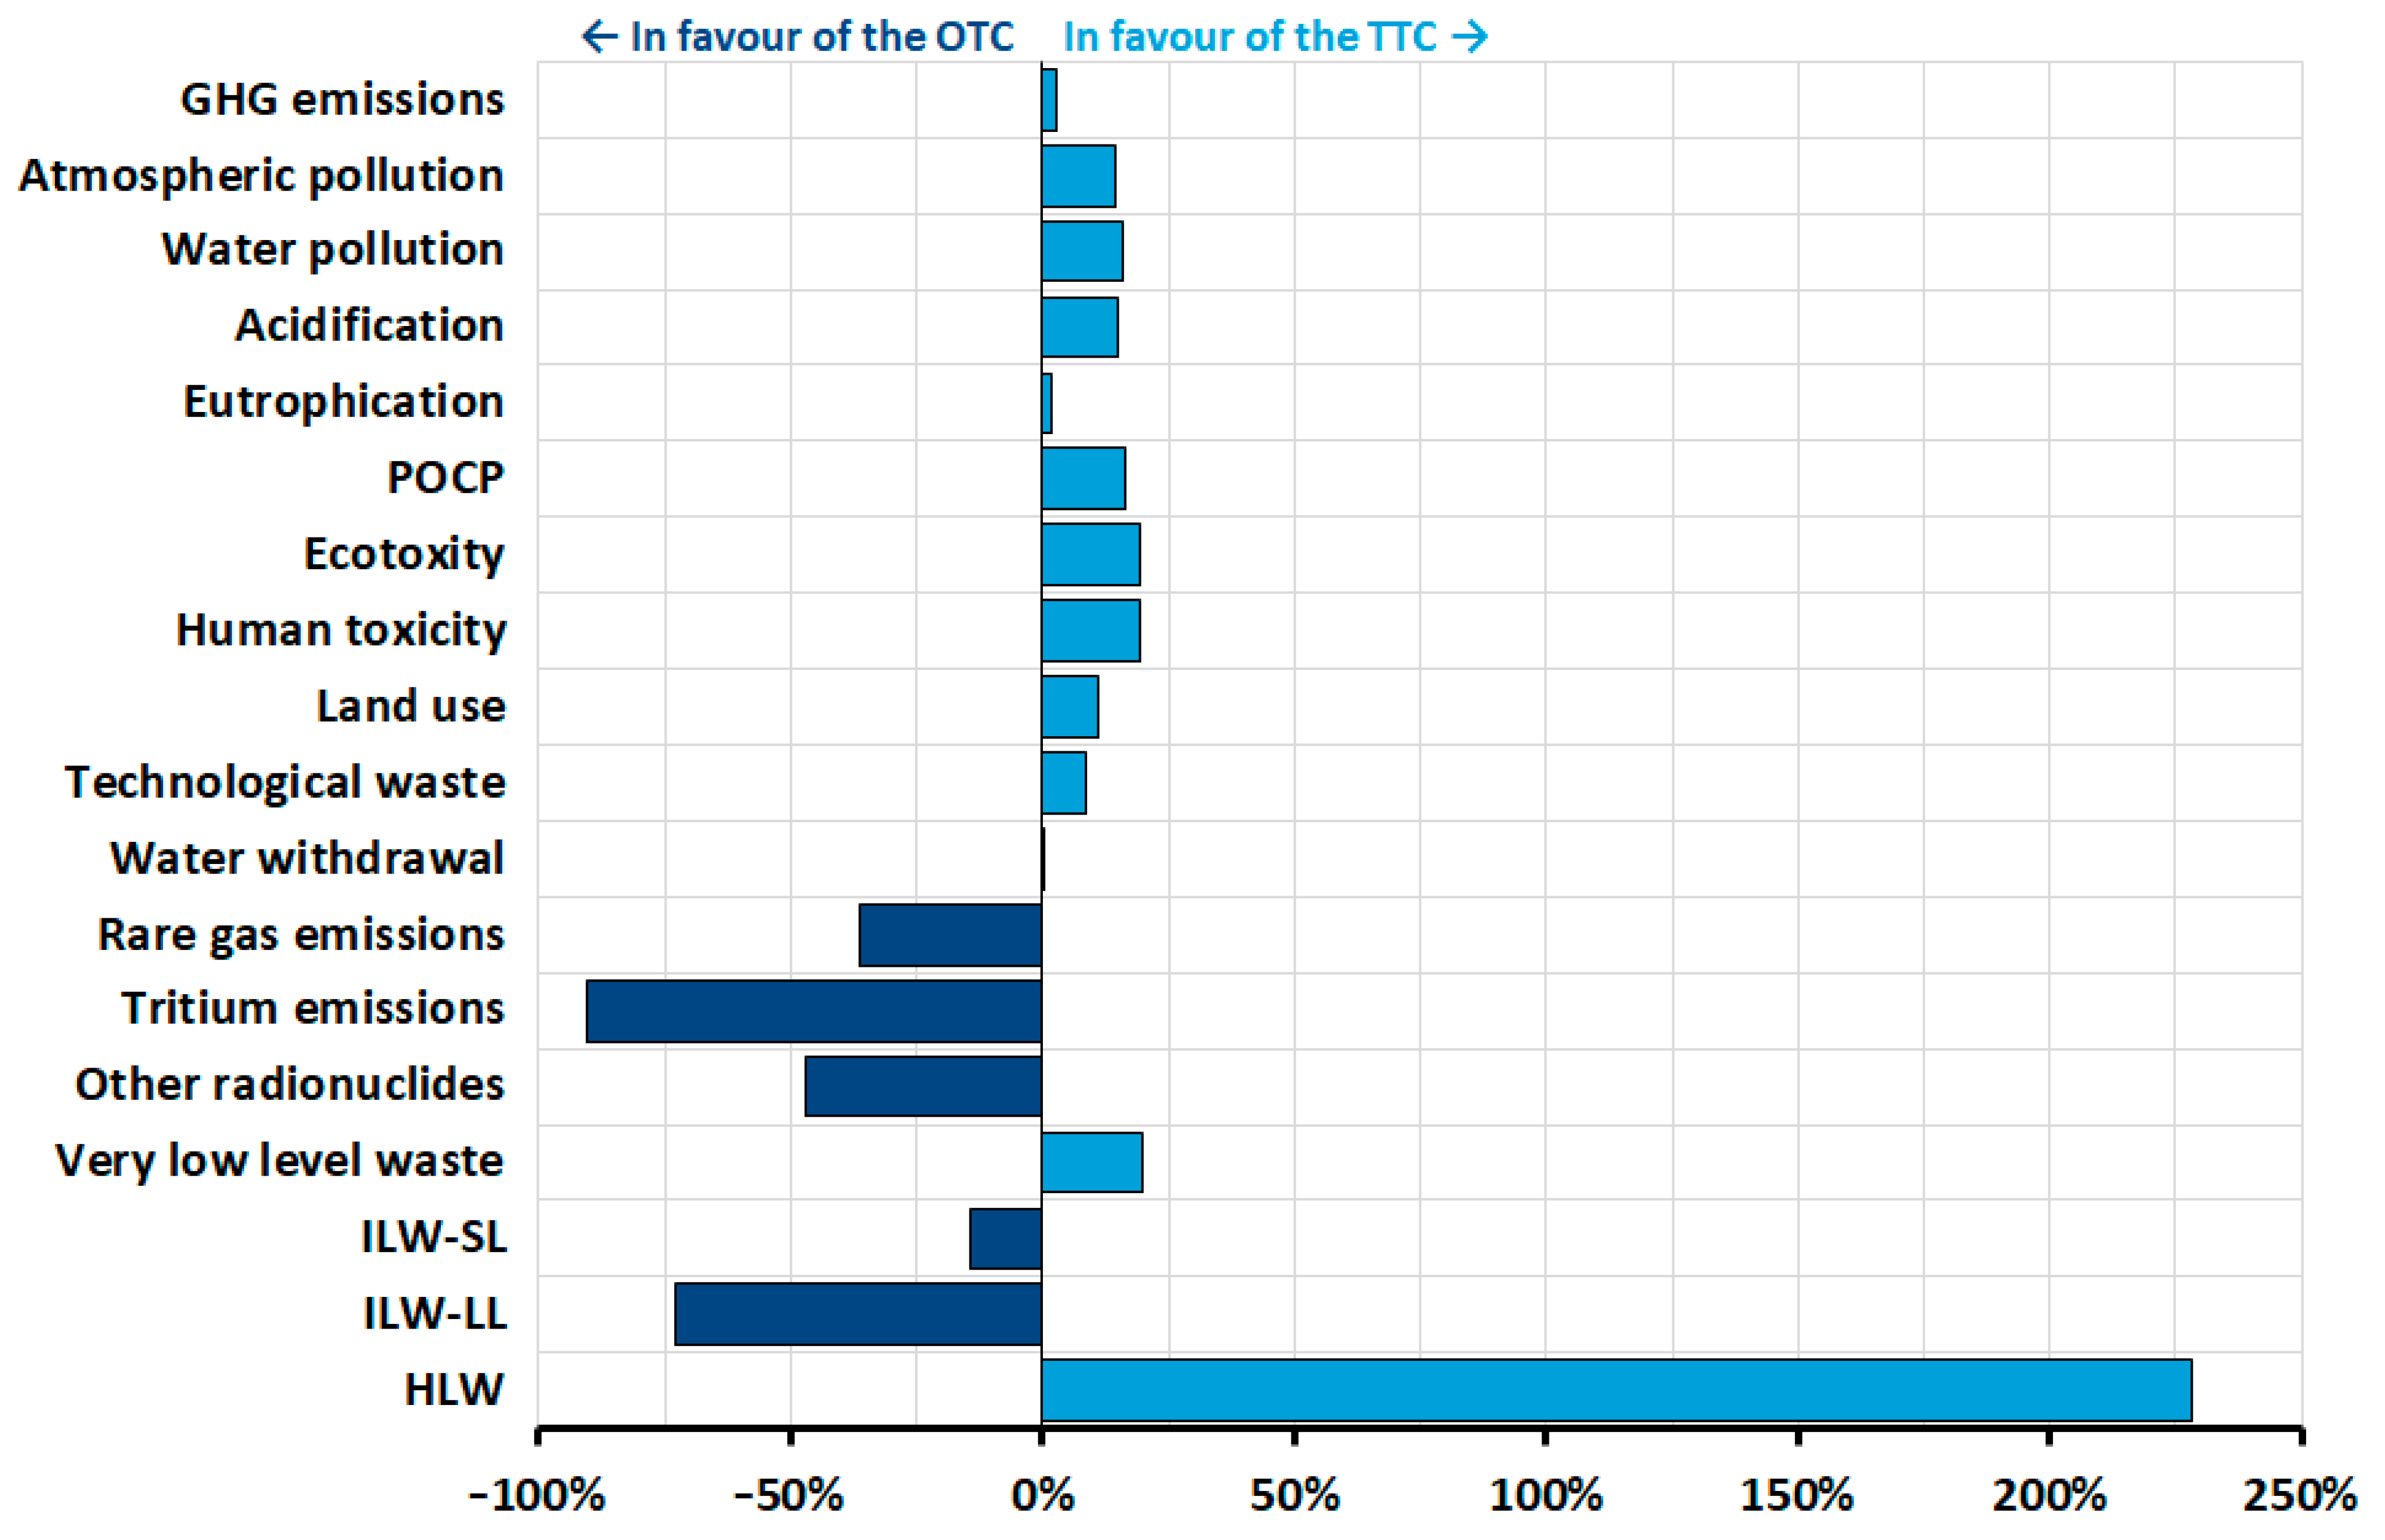
Figure 8.
Comparison of the waste volumes, waste disposal surface areas and waste disposal excavated volumes for the TTC and the OTC. Redrawn from data in [50].
Figure 8.
Comparison of the waste volumes, waste disposal surface areas and waste disposal excavated volumes for the TTC and the OTC. Redrawn from data in [50].

Figure 9.
Evolution of the ultimate waste long-term toxicity as a function of time for three different types of fuel cycles, normalised to that of the original uranium ore (redrawn from data in [22]).
Figure 9.
Evolution of the ultimate waste long-term toxicity as a function of time for three different types of fuel cycles, normalised to that of the original uranium ore (redrawn from data in [22]).
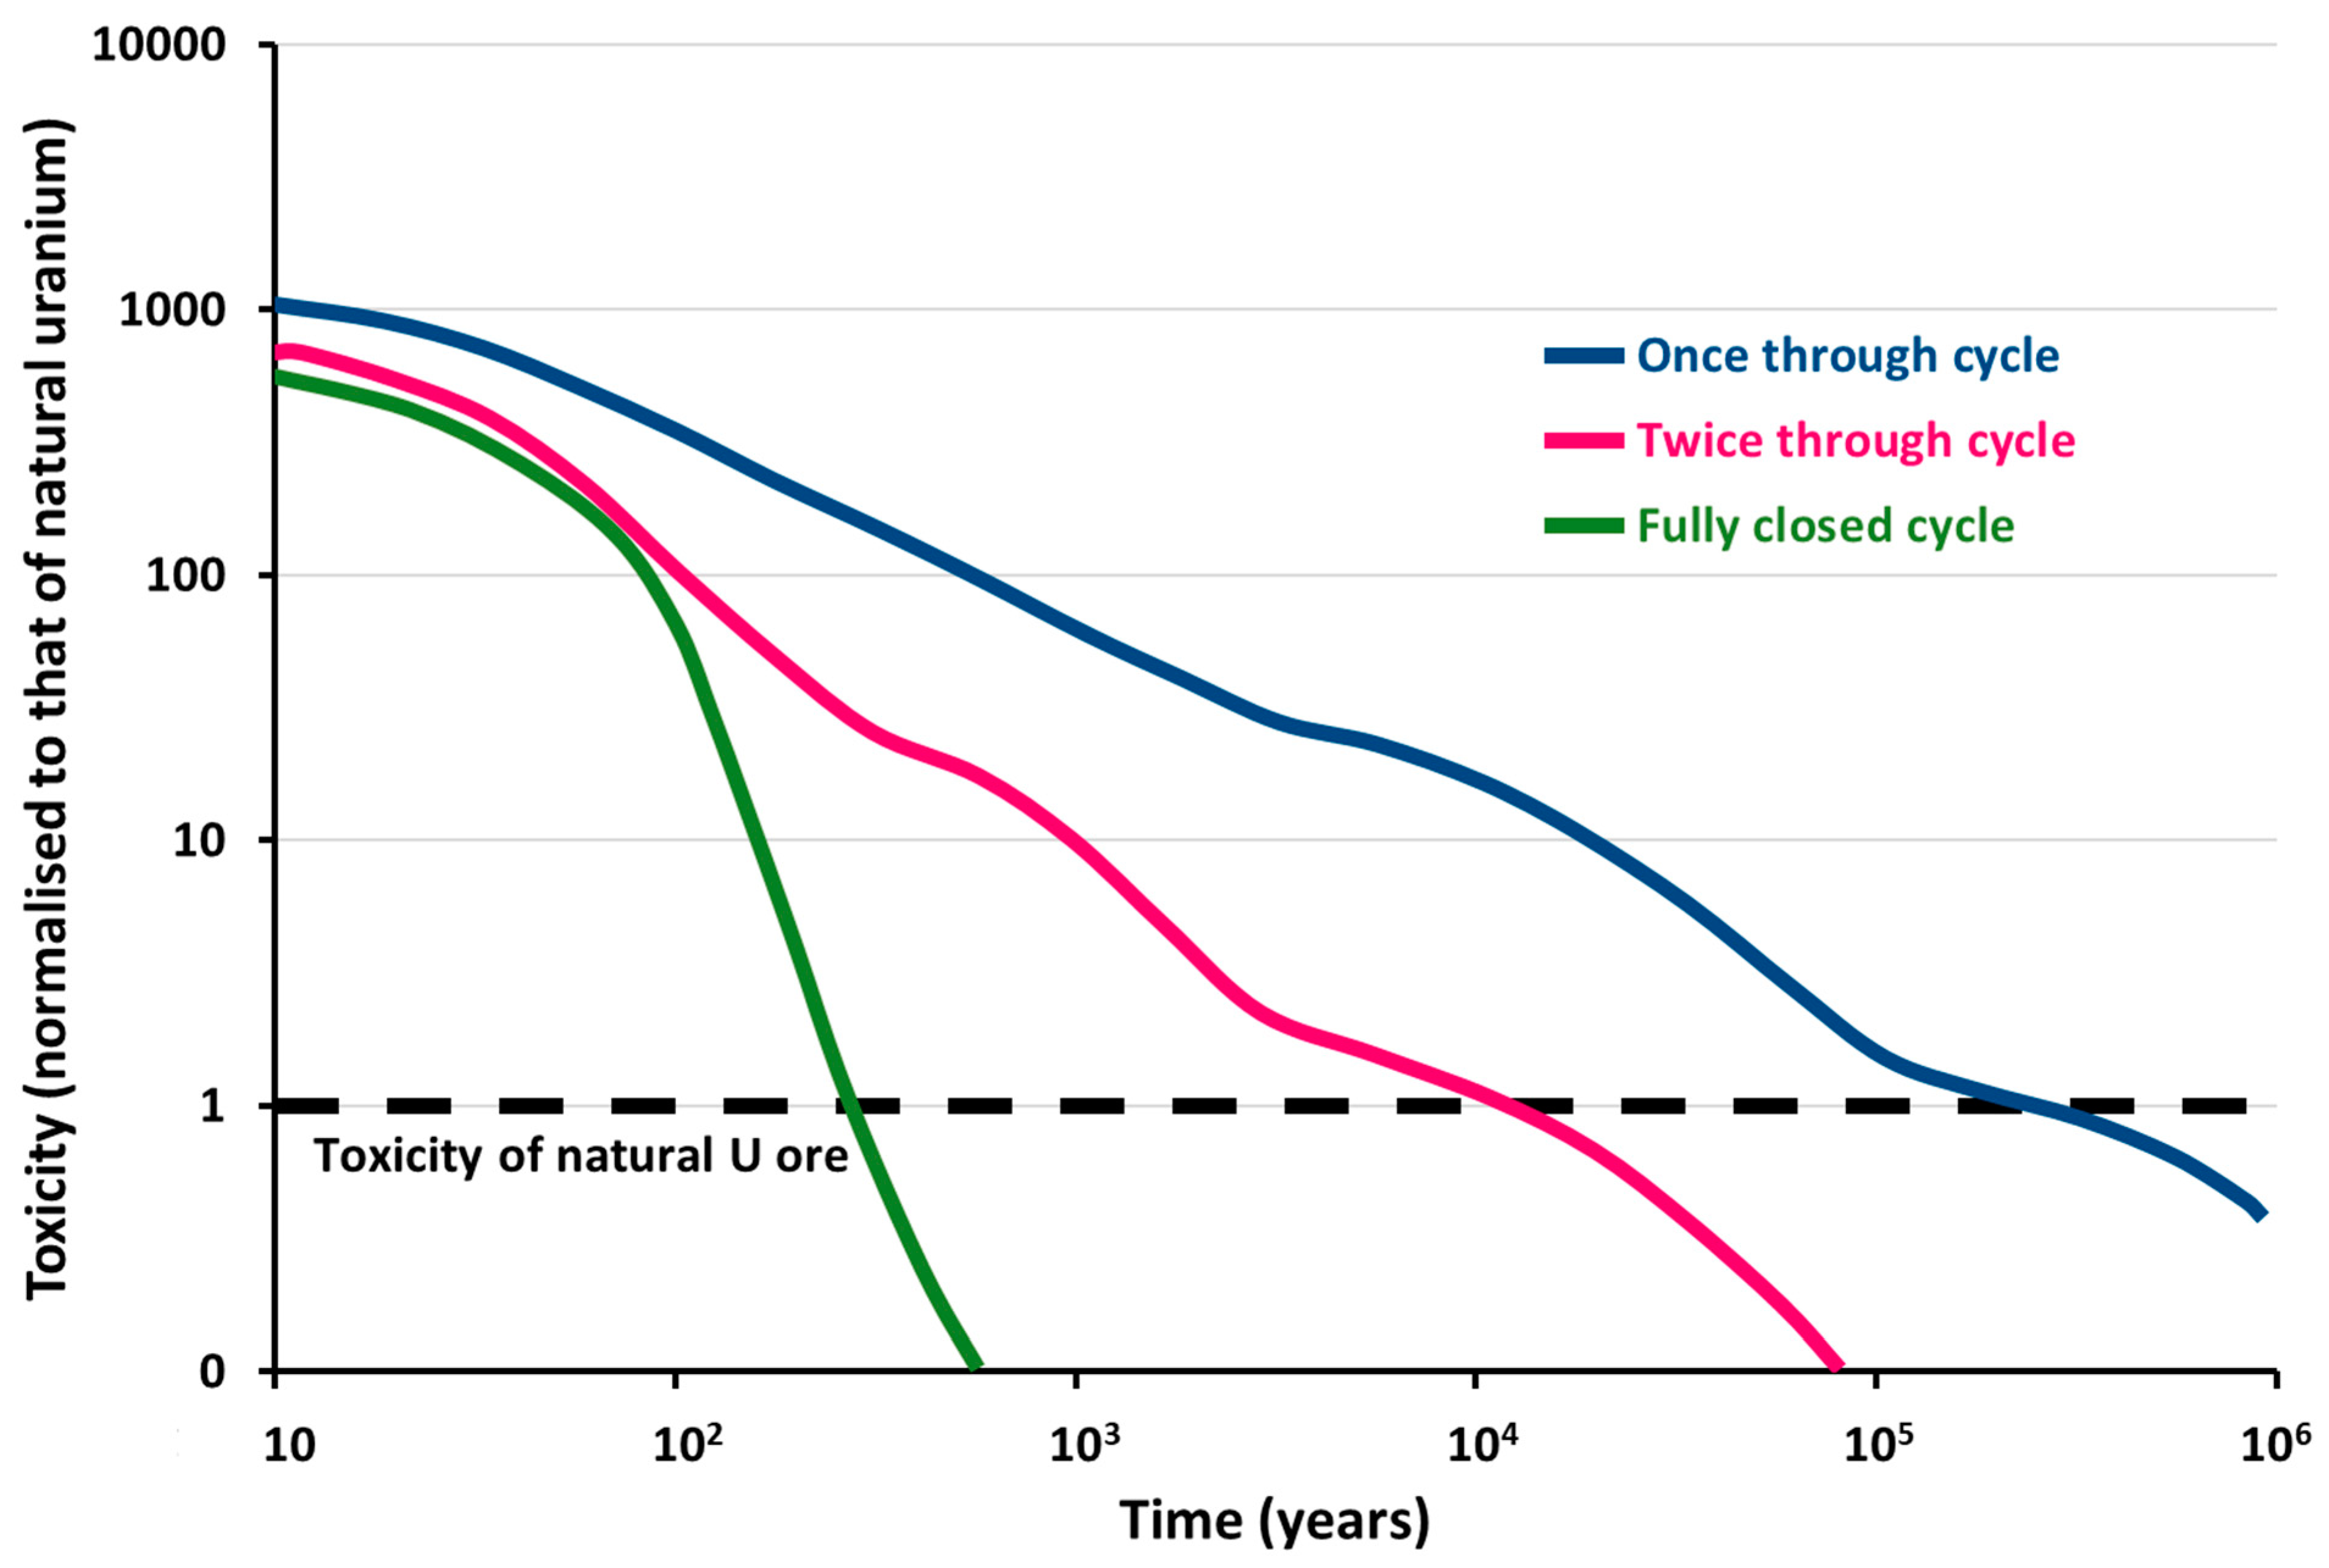
Figure 10.
Heat generation from and total volumes of HLW produced from the OTC, TTC and multi-recycling fuel cycle options. Redrawn from data in [55].
Figure 10.
Heat generation from and total volumes of HLW produced from the OTC, TTC and multi-recycling fuel cycle options. Redrawn from data in [55].
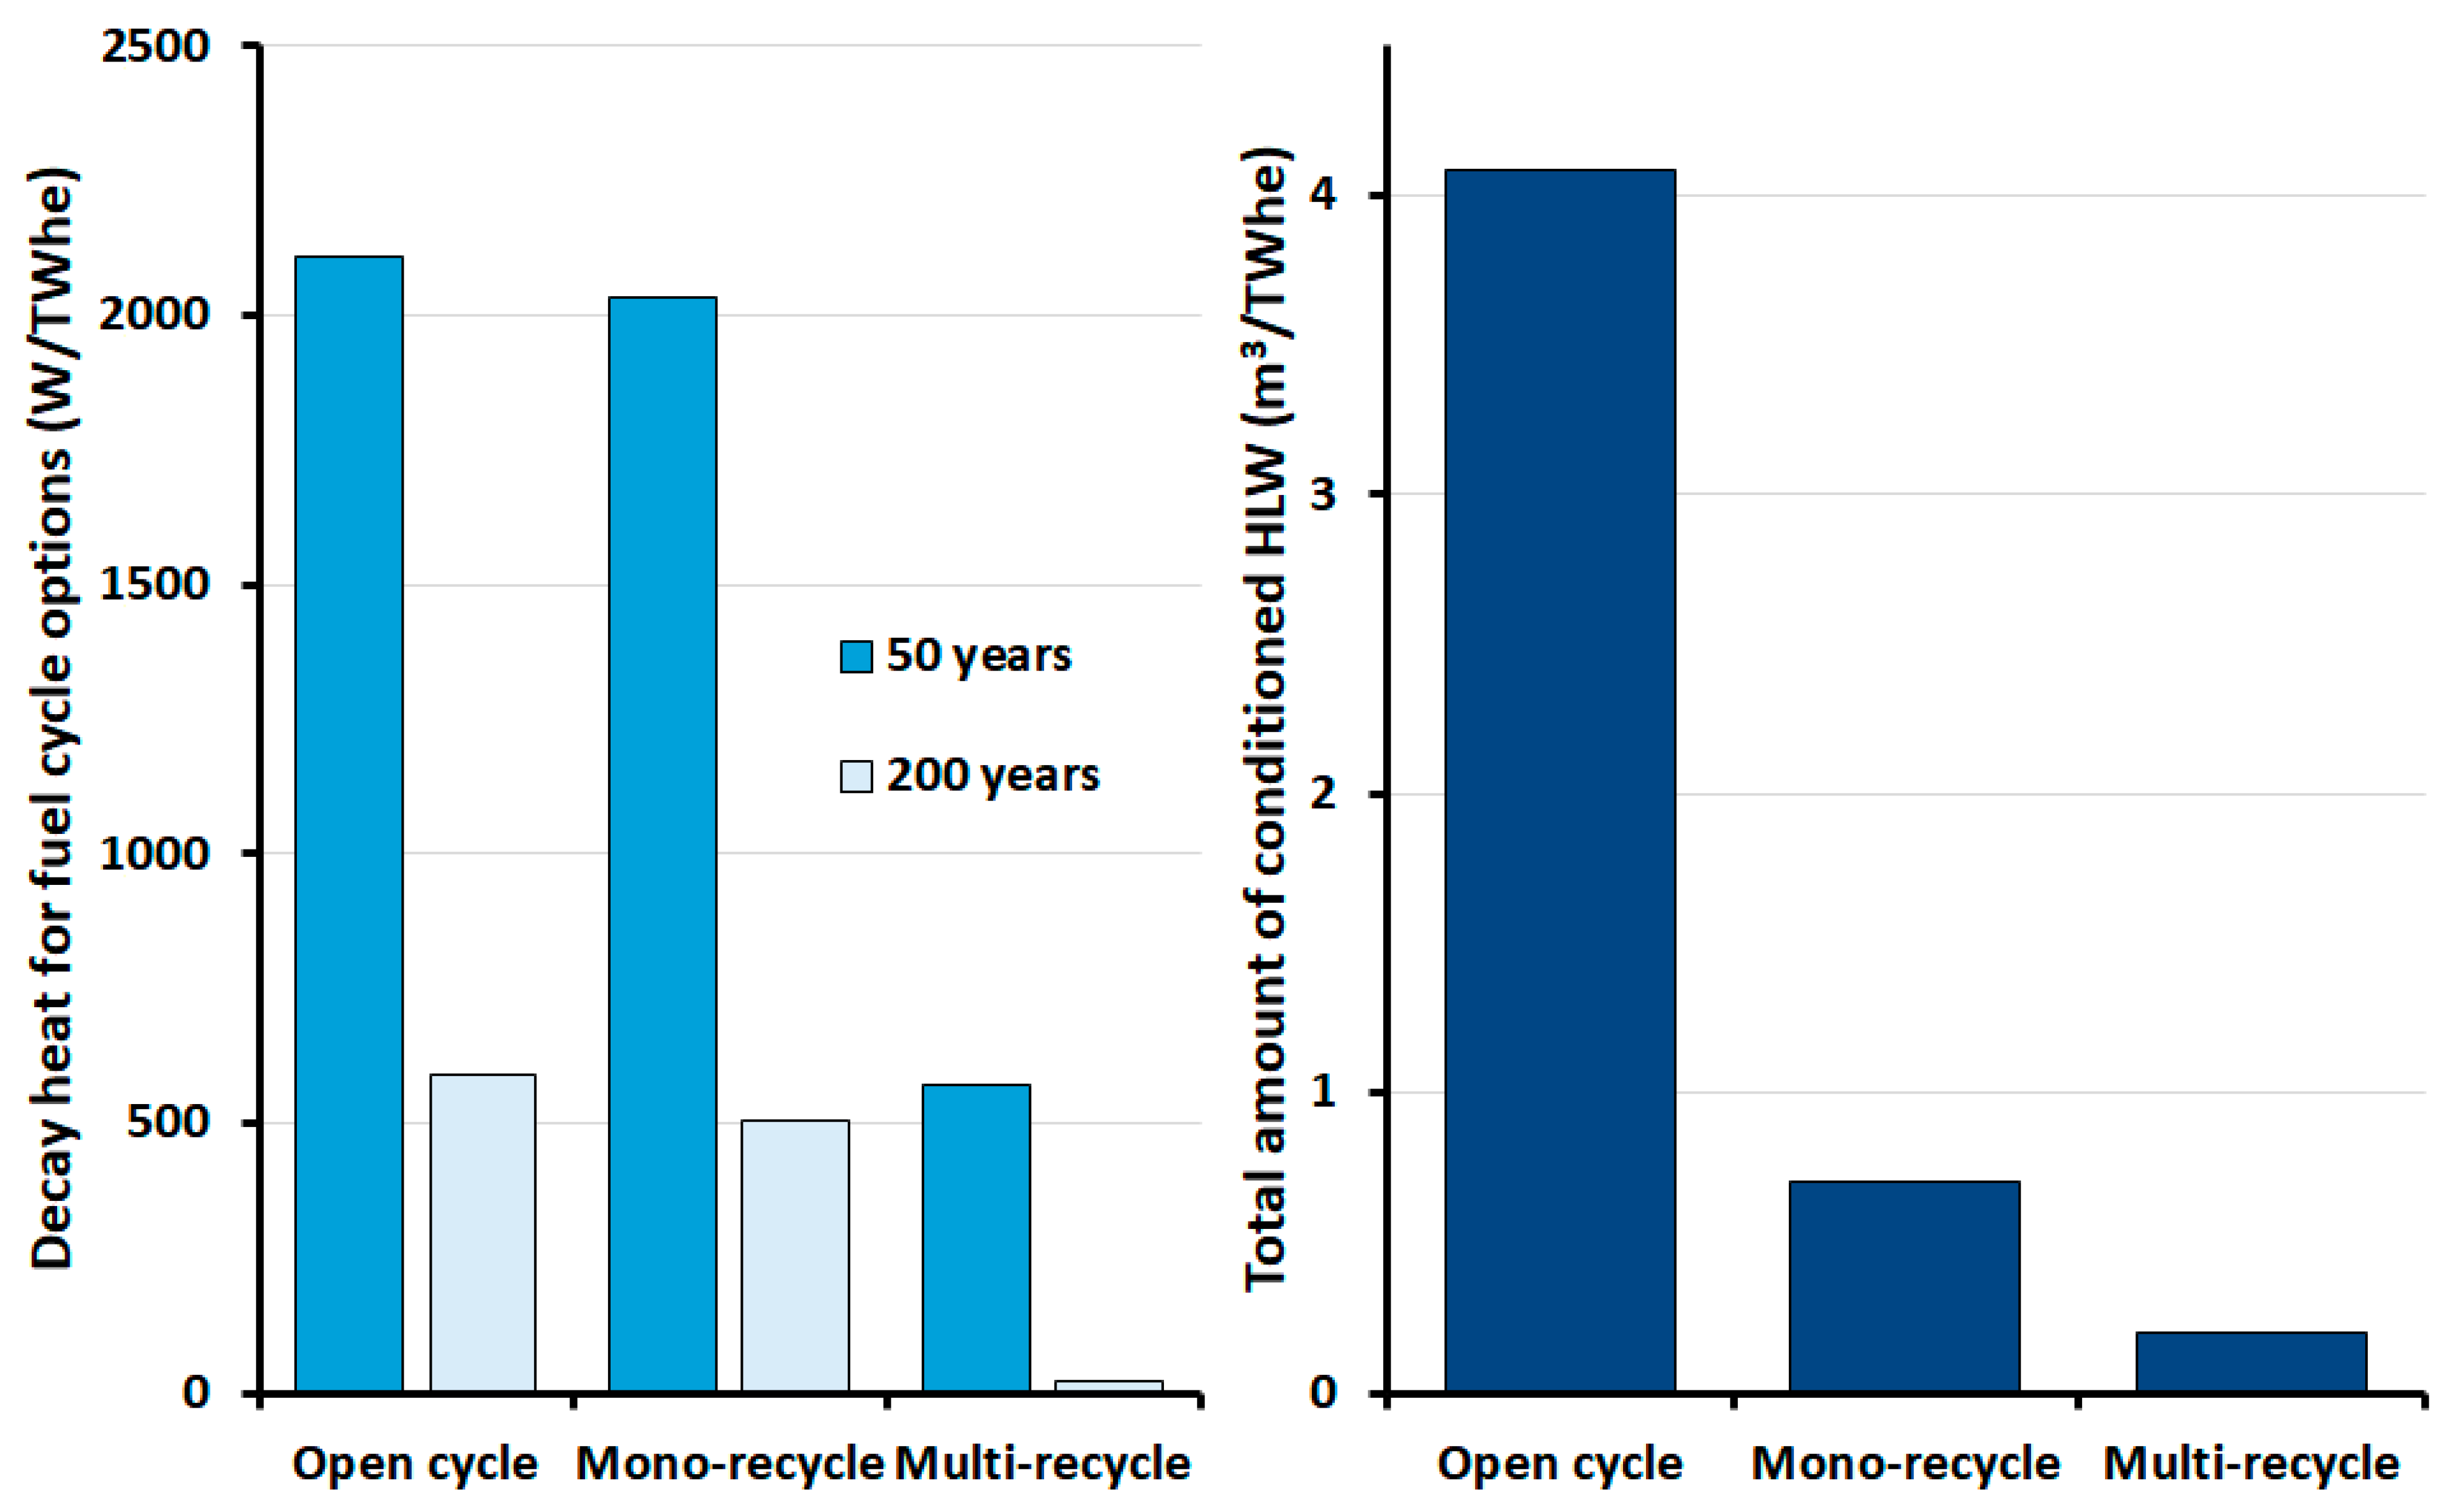
Figure 11.
Variation in HLW and long-lived ILW waste volumes and repository size for different French fuel cycle scenarios. Redrawn from data in [49].
Figure 11.
Variation in HLW and long-lived ILW waste volumes and repository size for different French fuel cycle scenarios. Redrawn from data in [49].
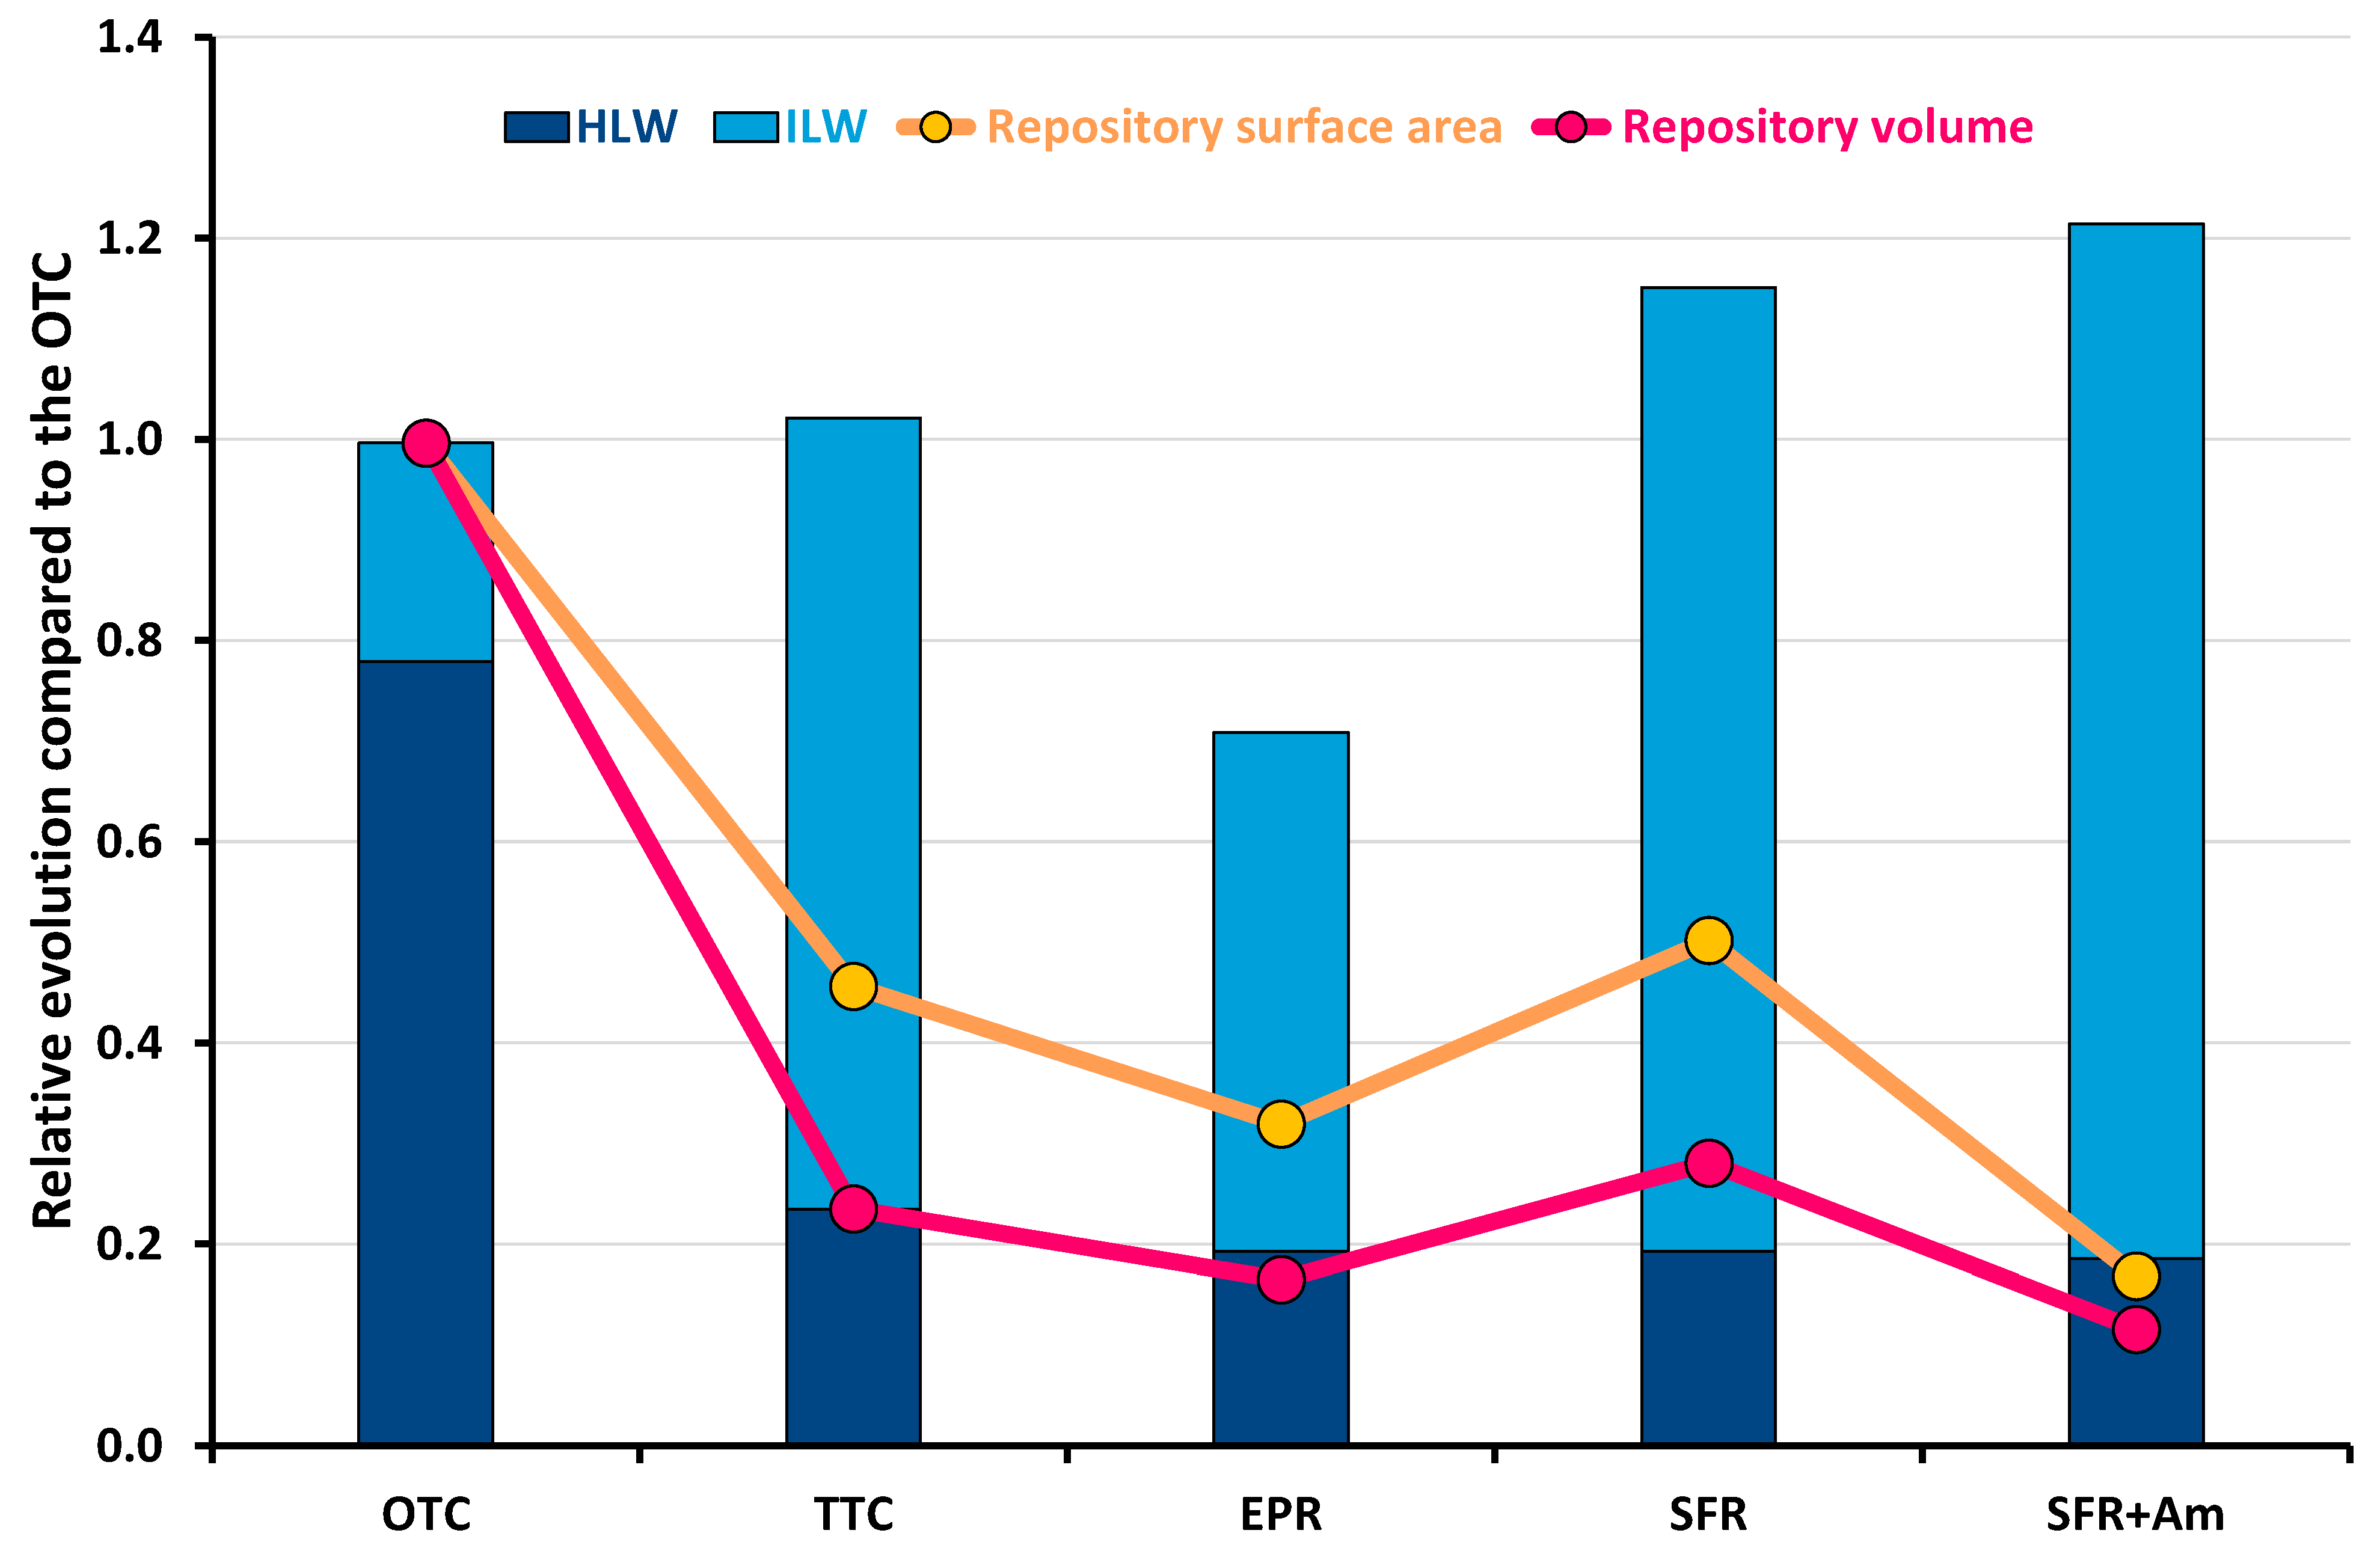
Figure 12.
Reduction in the mass of HLW (where tIHM is tonnes of initial heavy metal) for disposal in the DGR, comparing the OTC, TTC and fast reactor fuel cycles. Redrawn from data in [54]. The lines for the 0.5 and 1.23 conversion ratios are coincident.
Figure 12.
Reduction in the mass of HLW (where tIHM is tonnes of initial heavy metal) for disposal in the DGR, comparing the OTC, TTC and fast reactor fuel cycles. Redrawn from data in [54]. The lines for the 0.5 and 1.23 conversion ratios are coincident.
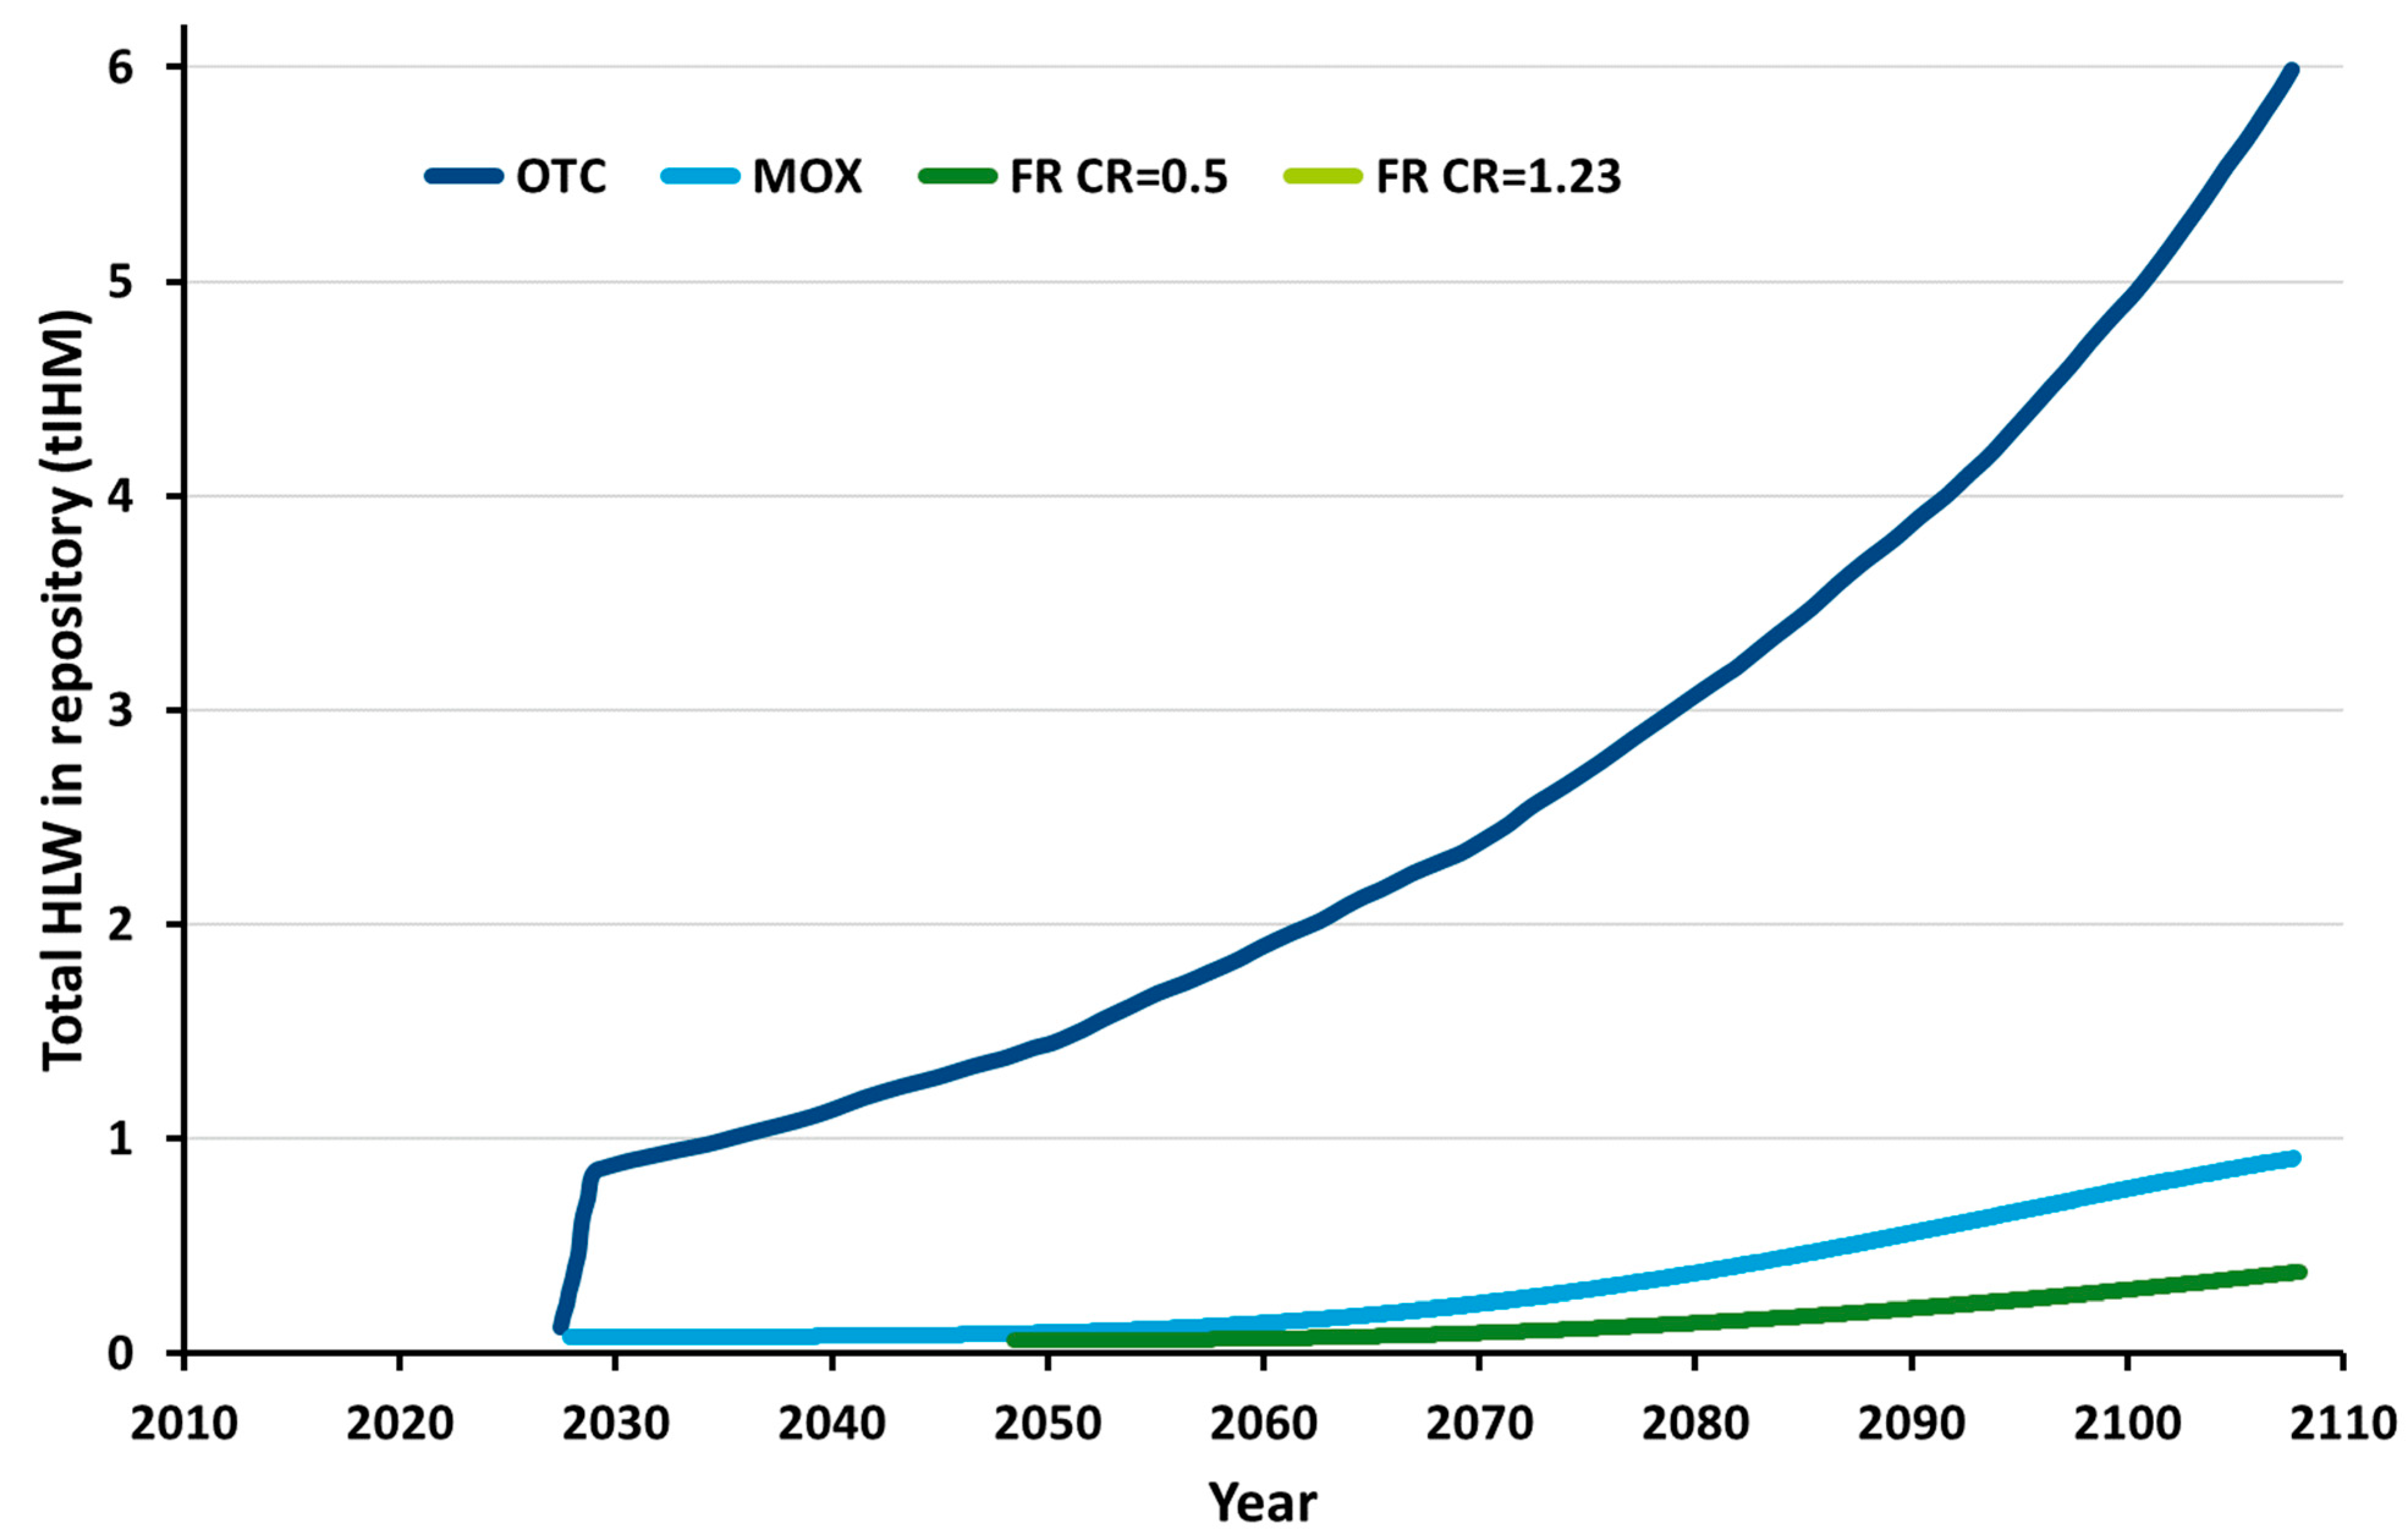
Figure 13.
Comparison of fuel cycles with differing degrees of recycling relative to the OTC (redrawn from [28] based on data from RED-IMPACT).
Figure 13.
Comparison of fuel cycles with differing degrees of recycling relative to the OTC (redrawn from [28] based on data from RED-IMPACT).
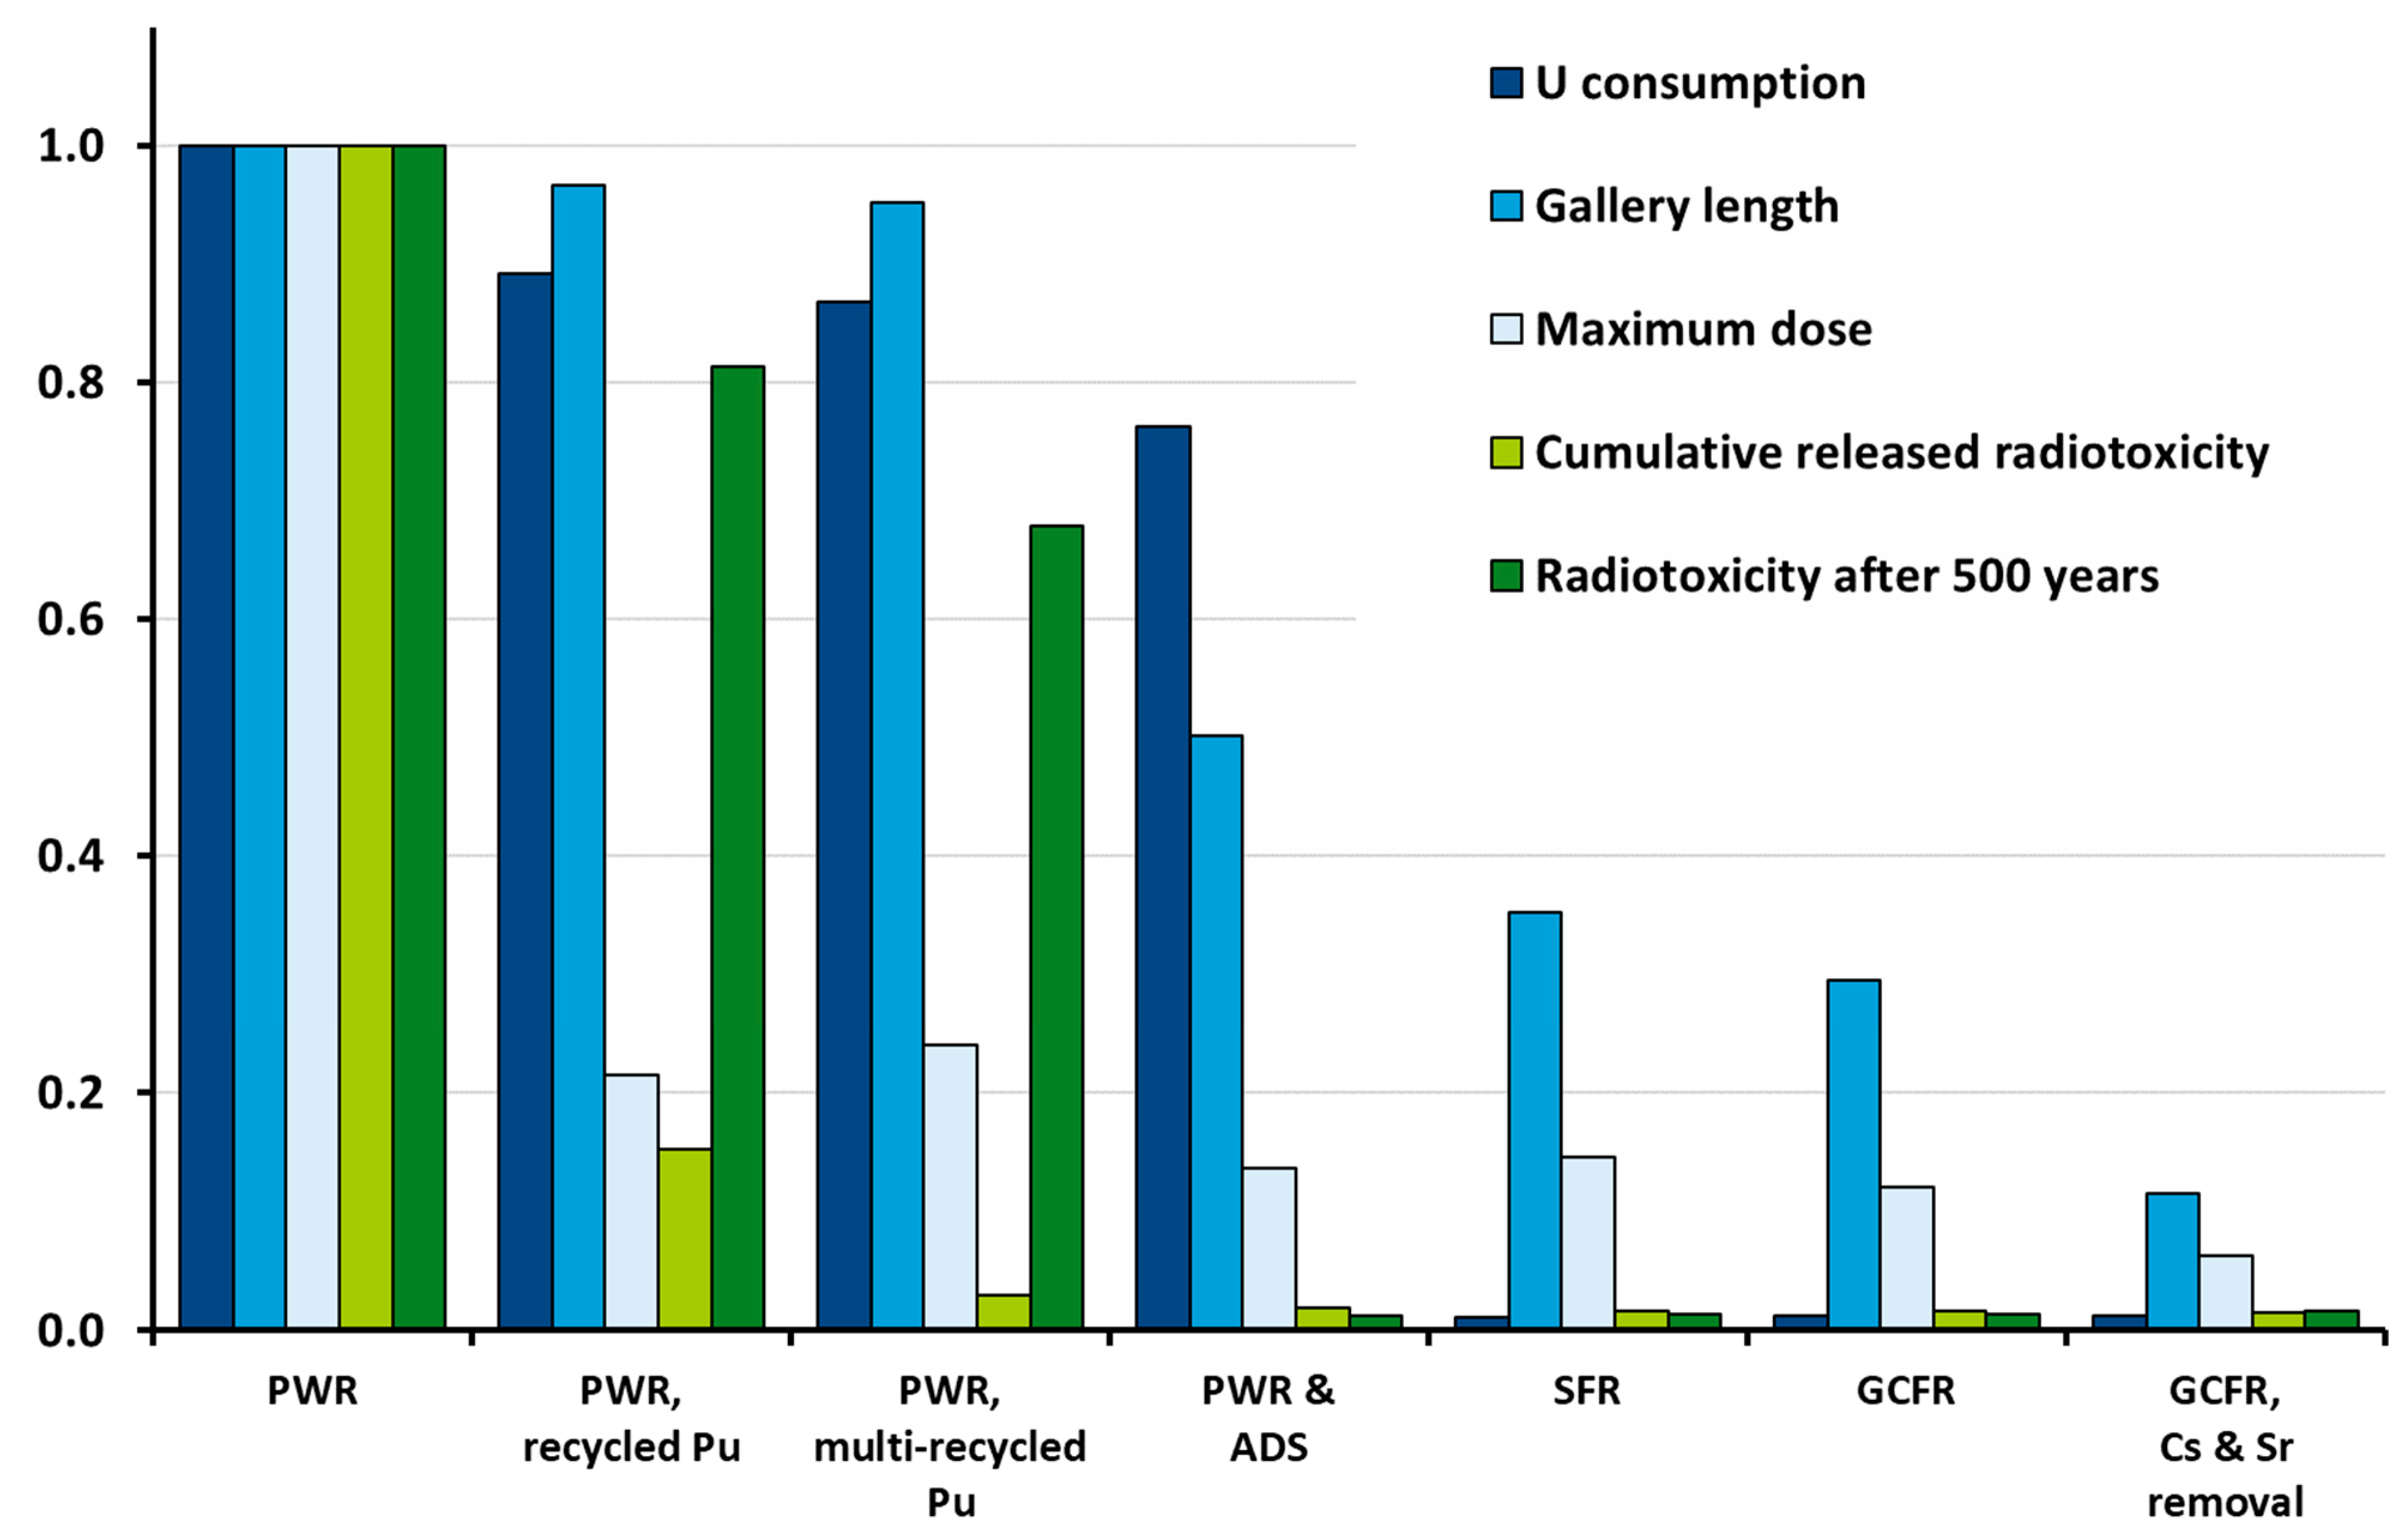

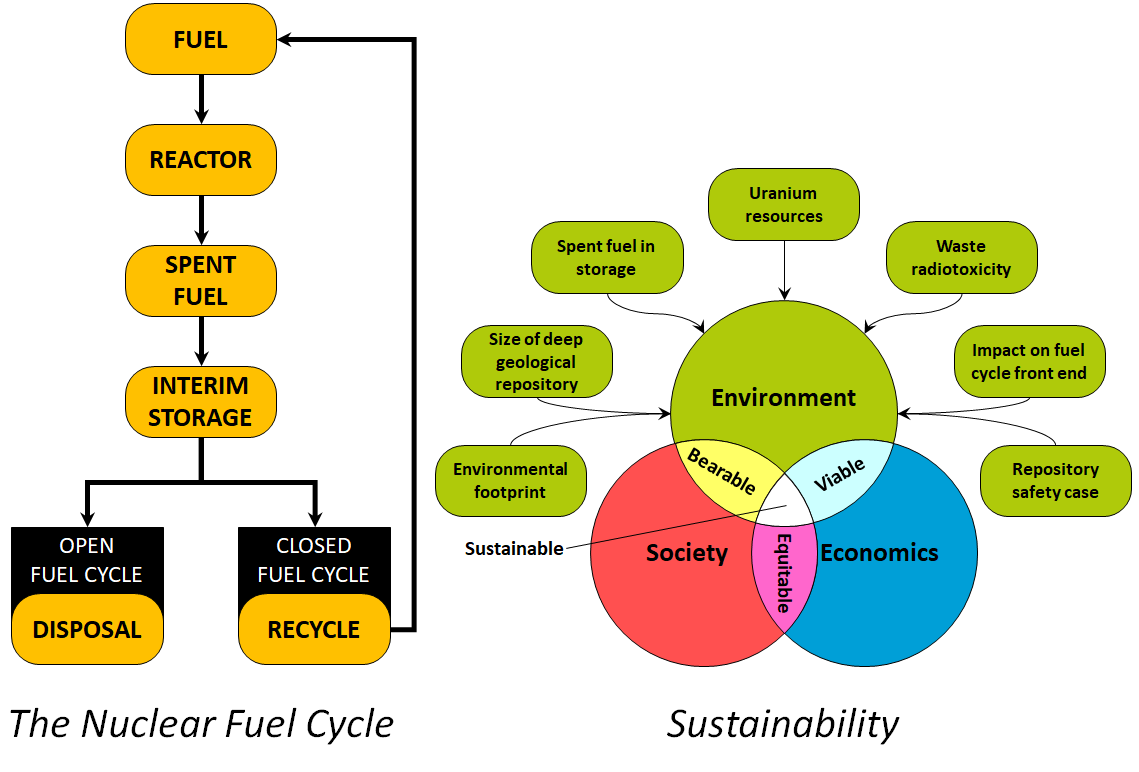
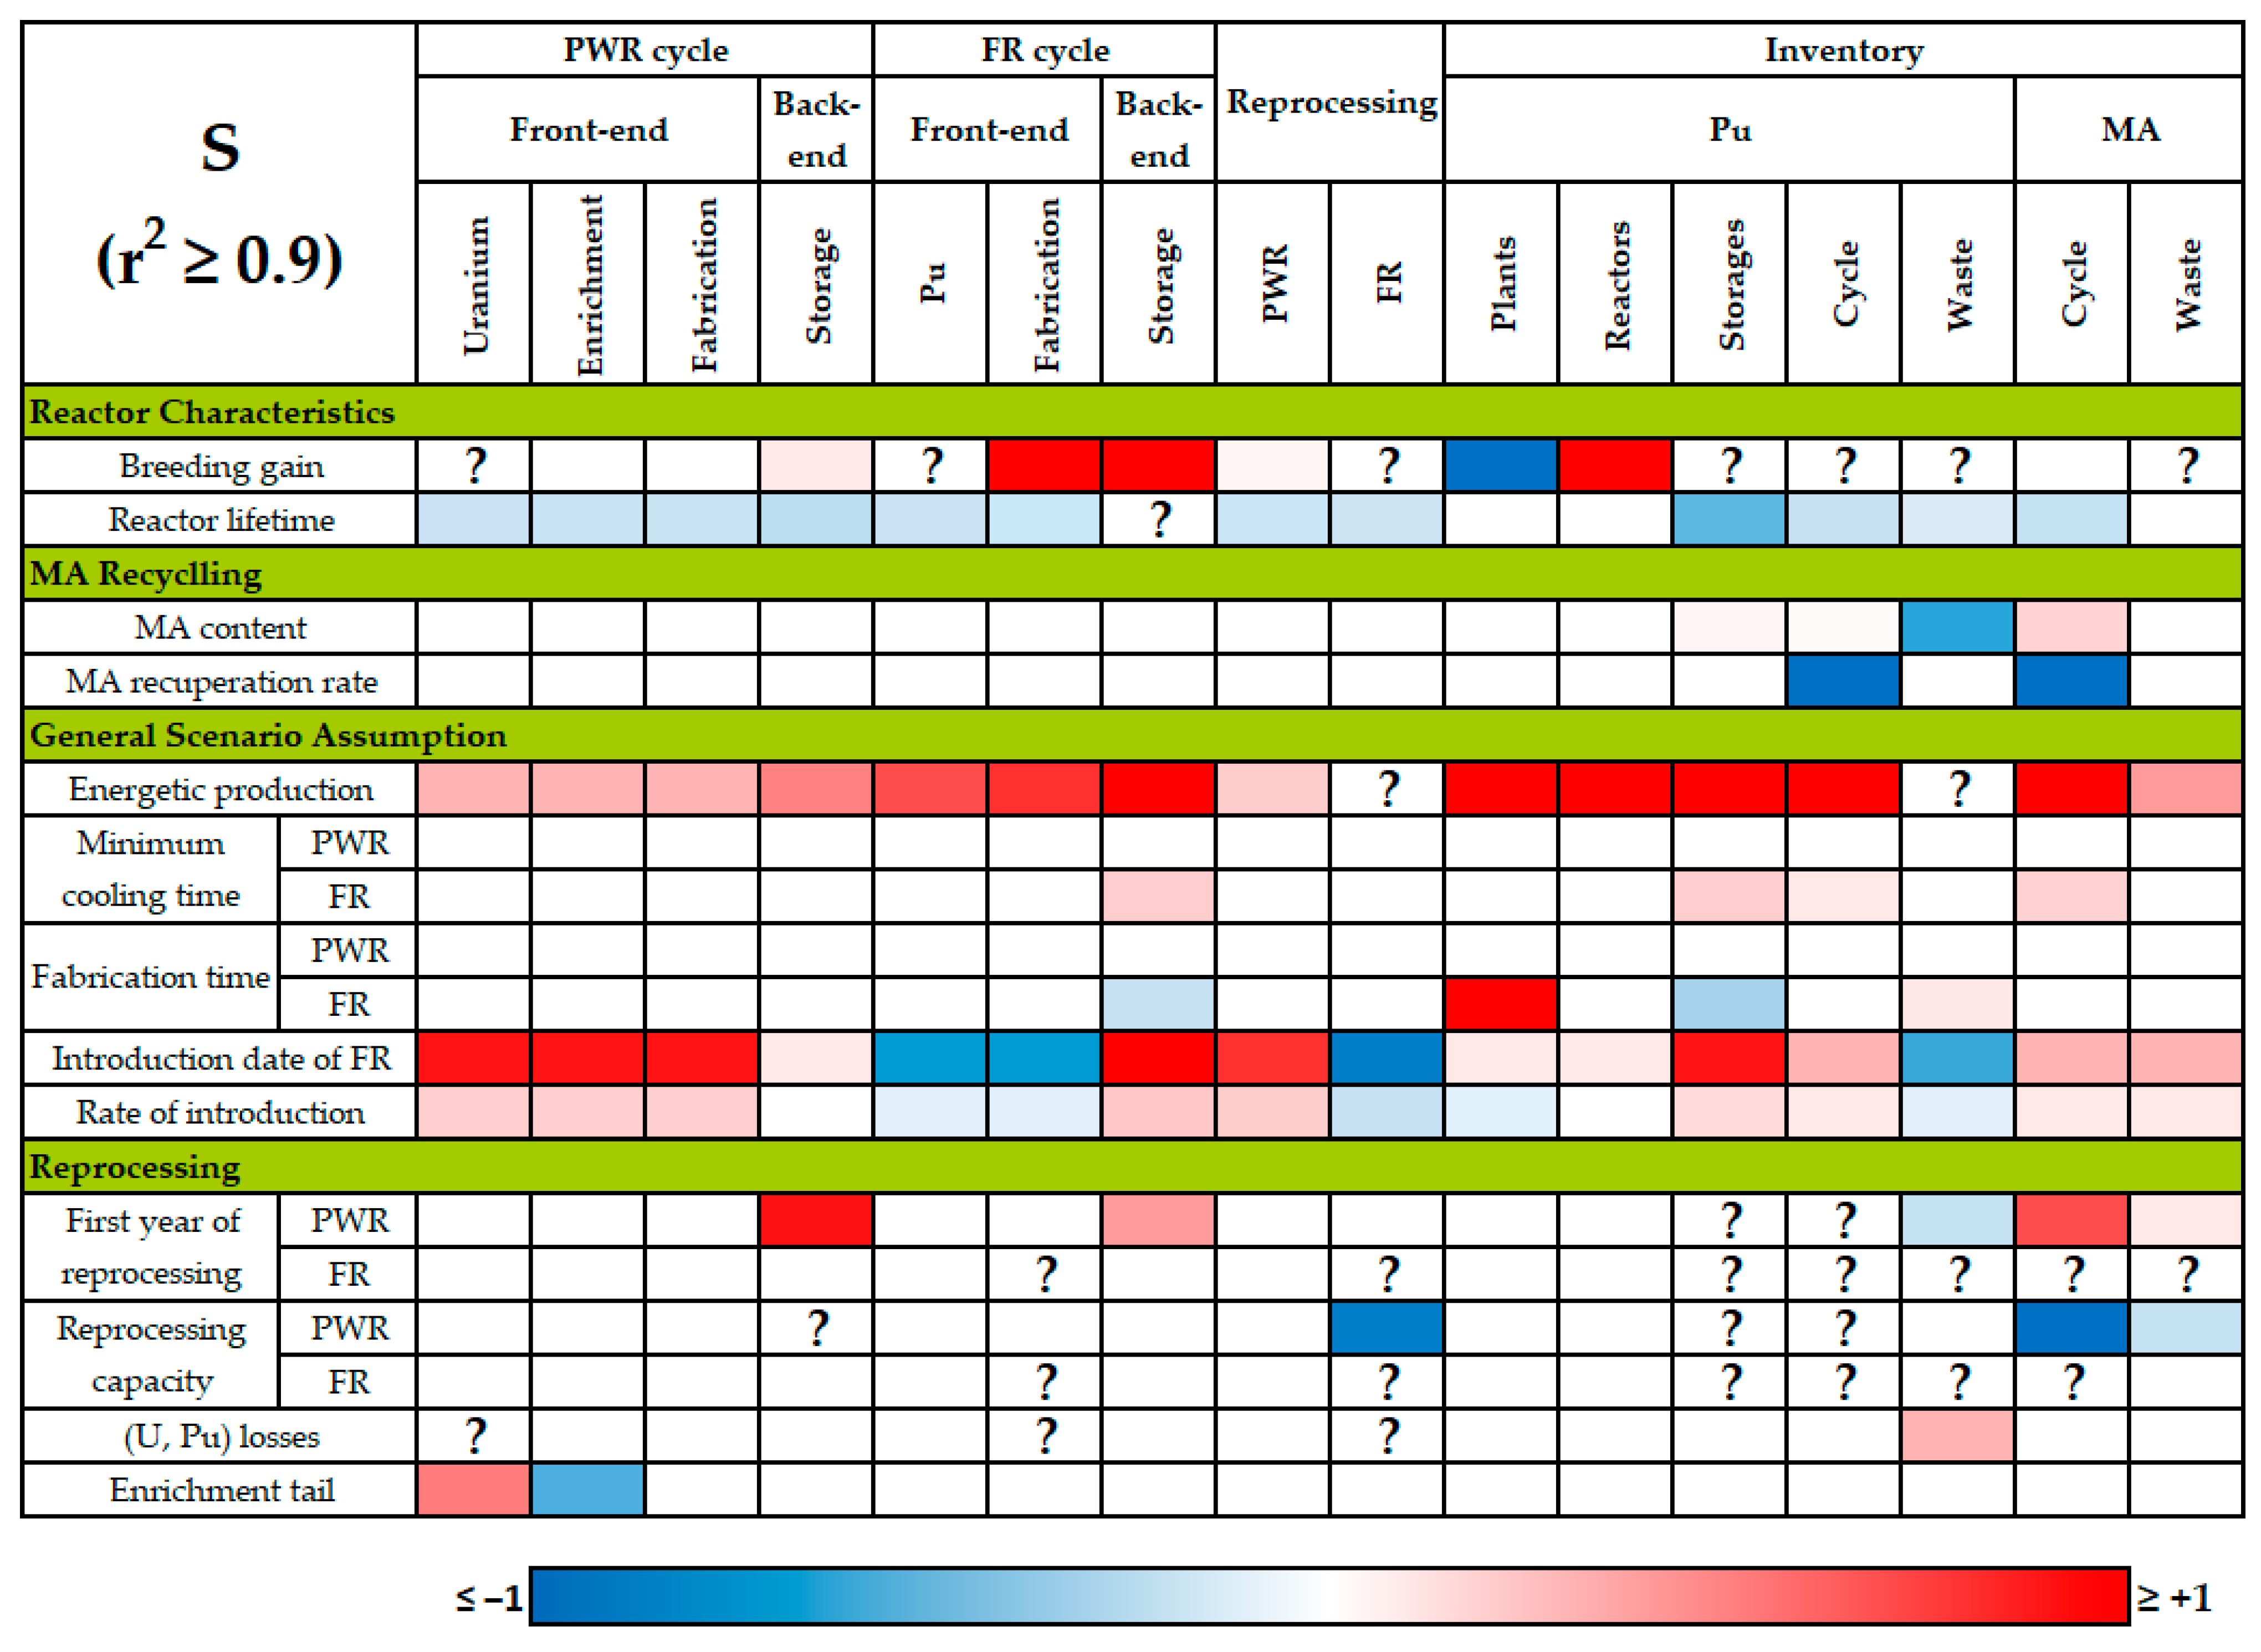
Table 1.
Categories of sustainability indicators proposed by Stamford and Azapagic [25] for energy systems.
Table 1.
Categories of sustainability indicators proposed by Stamford and Azapagic [25] for energy systems.
| Technoeconomic | Environmental | Social |
|---|---|---|
| Operability | Material recyclability | Provision of employment |
| Technological lock-in | Water ecotoxicity | Human health impacts |
| Immediacy | Global warming potential | Large accident risk |
| LCOE | Ozone layer depletion potential | Local community impacts |
| Cost variability | Acidification potential | Human rights and corruption |
| Financial incentives | Eutrophication potential | Energy security |
| Photochemical smog creation potential | Nuclear proliferation | |
| Land use and quality | Intergenerational equity |
| Country | Site | Plant | Fuels | Operations | Capacity (t/a SNF) | ||
|---|---|---|---|---|---|---|---|
| Start | Shutdown | Present | Future | ||||
| Belgium | MOL | Eurochemic | LWR | 1966 | 1975 | ||
| China | Jiuquan | RPP | LWR | * | 25 | ||
| Lanzhou | LWR | 800 | |||||
| France | Marcoule | APM | FBR | 1988 | 1996 | ||
| Marcoule | UP1 | GCR | 1958 | 1997 | |||
| La Hague | UP2 | LWR | 1967 | 1000 | 1000 | ||
| La Hague | UP3 | LWR | 1990 | 1000 | 1000 | ||
| Germany | Karlsruhe | WAK | LWR | 1971 | 1990 | ||
| India | Trombay | PP | Research | 1964 | 60 | 60 | |
| Tarapur | PREFRE 1 | PHWR | 1974 | 100 | 100 | ||
| Kalpakkam | PREFRE 2 | PHWR | 1998 | 100 | 100 | ||
| Kalpakkam | PREFRE 3A | PHWR | 2010 | 150 | |||
| Tarapur | PREFRE 3B | PHWR | 2012 | 150 | |||
| Japan | Tokai-mura | JAEA TRP | LWR | 1977 | 90 | 90 | |
| Rokkasho-mura | JNFL RRP | LWR | 2007 | 800 | |||
| Russia | Chelyabinsk | RT1 | WWER and BN | 1977 | 400 | 400 | |
| Krasnoyarsk | RT2 | WWER | 1500 | ||||
| Krasnoyarsk | Demonstration | VVER, RBMK | 2013 | 150 | |||
| UK | Sellafield | Magnox | GCR | 1967 | 2021 | ||
| Sellafield | THORP | LWR AGR | 1994 | 2018 | |||
| Dounreay | UKAEA RP | FBR | 1980 | 2001 | |||
| USA | West Valley | NFS | LWR | 1966 | 1972 | ||
| Hanford | Rockwell | U metal | 1956 | 1989 | |||
| Savannah River | SR | U metal | 1954 | 1989 | |||
| Sum total | 2750 | 6325 | |||||
| Corrected for maximum throughput at La Hague of 1700 t/a | −300 | −300 | |||||
| Total | 2440 | 6025 | |||||
Note: This accounts for the closure of reprocessing plants in the UK and the delayed commissioning of Rokkasho-mura. * Some data are unavailable.
Table 3.
Key feeds and outputs into various French fuel cycle scenarios from life cycle analysis (LCA) studies.
Table 3.
Key feeds and outputs into various French fuel cycle scenarios from life cycle analysis (LCA) studies.
| Cycle | Electricity (TWe) | Inputs | |||
| Fresh (Natural) U (t/y) | MOX * (t/y) | RepU Reused (t/y) | DepU Reused (t/y) | ||
| OTC (a) [50] | 408 | 9145 | 0 | 0 | 0 |
| OTC (b) [23] # | 430 | 9500 | 0 | 0 | 0 |
| TTC [50] | 408 | 7647 | 120 | 600 | 110 |
| EPR and TTC [49] | 453 | 6590 | 83 | 587 | 74 |
| SFR [49] | 453 | 0 | 448 | 356 | 49 |
| Cycle | Electricity (TWe) | Outputs | |||
| Tails U (t/y) | Total SNF (t/y) | SNF to Reprocessing (t/y) | SNF to Storage (t/y) | ||
| OTC (a) [50] | 408 | 7972 | 1173 | 0 | 1173 |
| OTC (b) [23] # | 430 | 8300 | 1200 | 0 | 1200 |
| TTC [50] | 408 | 7085 | 1173 | 1050 | 123 |
| EPR and TTC [49] | 453 | 6316 | 944 | 775 | 169 |
| SFR [49] | 453 | 0 | 448 | 448 | 0 |
Note: RepU and DepU denote reprocessed uranium and depleted uranium, respectively. * Pu content of 10.9% in LWR MOX and 15.5% in FR MOX. # The OTC in France is a hypothetical estimation, and two cases with slightly differing electrical generation capacities were used in LCA studies for comparisons against the closed cycles (labelled (a) and (b) here).
Table 4.
Fuel cycle variants modelled by Gao and Ko [52].
Table 4.
Fuel cycle variants modelled by Gao and Ko [52].
| System | Reactor One | Fuel Cycle One | Reactor Two | Fuel Cycle Two | Reactor Three | Fuel Cycle Three |
|---|---|---|---|---|---|---|
| OTC | PWR | Disposal | ||||
| DUPIC | PWR | OREOX | CANDU | Disposal | ||
| TTC | PWR | PUREX | PWR (MOX) | Disposal | ||
| Pyro-SFR | PWR | Pyro | SFR | Pyro | ||
| MA P&T | PWR | PUREX | PWR (MOX) | Pyro | SFR (TRU) | Pyro |
| Pu multi-recycle | PWR | PUREX | PWR (MOX) | Pyro | SFR (MOX) | Repro II |
| Breeder | PWR | LMBR * | Pyro |
* Liquid metal breeder reactor.
Table 5.
Results from fuel cycle studies of Gao and Ko [52].
Table 5.
Results from fuel cycle studies of Gao and Ko [52].
| System | CR | U Consumption | LILW-SL | LILW-LL | HLW | SF | Pu | EV | Factor |
|---|---|---|---|---|---|---|---|---|---|
| OTC | 100 | 100 | 100 | 100 | 100 | 100 | 100 | 1.0 | |
| DUPIC | 92 | 155 | 155 | 120 | 117 | 73 | 54 | 1.9 | |
| TTC | 87 | 125 | 178 | 21 | 13 | 62 | 90 | 1.1 | |
| Pyro-SFR | 0.36 | 82 | 101 | 91 | 1.9 | 0 | 0.1 | 14 | 7.1 |
| 0.71 | 60 | 87 | 72 | 1.7 | 0 | 0.3 | 31 | 3.2 | |
| 1.00 | 9 | 54 | 26 | 1.2 | 0 | 0.5 | 72 | 1.4 | |
| MA P&T | 0.35 | 72 | 111 | 173 | 7.6 | 0 | 0.2 | 58 | 1.7 |
| 0.70 | 70 | 106 | 165 | 7.4 | 0 | 0.3 | 54 | 1.9 | |
| 1.00 | 55 | 87 | 126 | 5.8 | 0 | 0.3 | 52 | 1.9 | |
| Pu multi-recycle | 0.35 | 78 | 106 | 161 | 7.0 | 0 | 0.3 | 50 | 2.0 |
| 0.70 | 72 | 104 | 159 | 7.0 | 0 | 0.3 | 49 | 2.0 | |
| 1.00 | 49 | 92 | 134 | 6.0 | 0 | 0.4 | 42 | 2.4 | |
| Breeder | 1.2 | 1 | 70 | 116 | 2.3 | 0 | 0.8 | 28 | 3.6 |
Note: All values in % relative to the OTC where CR is the conversion ratio, LILW-SL and LILW-LL are low- and intermediate-level waste, respectively (short-lived or long-lived, respectively), HLW is high-level waste, EV is excavated volume and factor denotes the increase in repository capacity cf. to the OTC.
Table 6.
Comparison of French and UK LCA studies.
| Indicator | Fr | UK | Fuel Cycle | Fr | UK |
|---|---|---|---|---|---|
| Greenhouse gas emissions | ✔ | ✔ | Once-through | [50] | [62] |
| Atmospheric pollution (SOx, NOx) | ✔ | ✔ * | Twice-through | [50] | [61,62] |
| Water pollution | ✔ | Plutonium multi-recycling | [49] | ||
| Land use | ✔ | MA P&T | [49] | ||
| Water consumption and withdrawal | ✔ | ✔ | |||
| Technological waste | ✔ | ||||
| Radioactive gaseous emissions | ✔ | ✔ ‡ | |||
| Radioactive liquid emissions | ✔ | ✔ ‡ | |||
| Solid radioactive waste | ✔ | ✔ ‡ | |||
| Repository footprint | ✔ | ||||
| Acidification | ✔ | ✔ | |||
| Eutrophication | ✔ | ✔ † | |||
| Photochemical ozone creation potential | ✔ | ✔ | |||
| Ecotoxicity | ✔ | ✔ | |||
| Human toxicity | ✔ | ✔ | |||
| Ozone depletion | ✔ | ||||
| Resource depletion, mineral, fossils and renewables | ✔ |
* Labelled as particulate matter/respiratory inorganics in UK study. † Split into freshwater, marine and terrestrial. ‡ Two categories of ionising radiations (IR) and ionising radiations, wastes (IRw).
Table 7.
Environmental impacts of reprocessing scenarios and direct disposal [62].
Table 7.
Environmental impacts of reprocessing scenarios and direct disposal [62].
| Area of Impact | Units | Scenario Number | Direct Disposal | |||
|---|---|---|---|---|---|---|
| 1 | 2 | 3 | 4 | |||
| Acidification | (mol H+ eq.) | 2680 | −2470 | −3940 | −3970 | 2480 |
| Climate change | (kg CO2 eq.) | 3.01 × 10⁵ | −1.88 × 10⁵ | −3.18 × 10⁵ | −3.18 × 10⁵ | 1.39 × 10⁵ |
| Ecotoxicity freshwater | (CTUe) | 1.42 × 10⁷ | 5.46 × 10⁶ | 6.40 × 10⁵ | 5.49 × 10⁵ | 1.75 × 10⁷ |
| Eutrophication freshwater | (kg P eq.) | 358 | −38.6 | −190 | −194 | 434 |
| Eutrophication marine | (kg N eq.) | 963 | −17,700 | −20,900 | −21,100 | 319 |
| Eutrophication terrestrial | (mol N eq.) | 4490 | −15,000 | −19,100 | −19,300 | 2900 |
| Human toxicity, cancer effects | (CTUh) | 5.01 × 10⁻² | 1.4 × 10⁻² | −2.8 × 10⁻³ | −3.2 × 10⁻³ | 6.08 × 10⁻² |
| Human toxicity, noncancer effects | (CTUh) | 0.656 | −0.212 | −0.511 | −0.520 | 0.812 |
| Ionising radiations | (Bq 235U air eq.) | 1.88 × 10⁹ | 1.83 × 10⁹ | 1.82 × 10⁹ | 1.82 × 10⁹ | 3.35 × 10⁶ |
| Ionising radiations, GDF | (Bq 238U ILLW eq.) | 7.1 × 10¹⁰ | 4.1 × 10¹⁰ | 3.5 × 10¹⁰ | 3.4 × 10¹⁰ | 7.9 × 10¹⁰ |
| Ozone depletion | (kg CFC-11 eq.) | 3.88 × 10⁻² | −3.7 × 10⁻² | −5.4 × 10⁻² | −5.4 × 10⁻² | 1.21 × 10⁻² |
| Particulate matter/respiratory inorganics, human health | (kg PM2.5 eq.) | 250 | −437 | −607 | −612 | 231 |
| Photochemical ozone formation, human health | (kg NMVOC) | 1290 | −3970 | −5090 | −5130 | 874 |
| Resource depletion, mineral, fossils and renewables | (kg Sb eq.) | 56.9 | −794 | −944 | −953 | 36.1 |
| Resource depletion water | (m3 eq.) | 2110 | −6260 | −8180 | −8180 | 1130 |
Note: The colour scale goes from red, highest, to green, lowest [62].
Table 8.
Key results from Dungan et al. [15].
Table 8.
Key results from Dungan et al. [15].
| Scenario | Decay Heat | ||||
|---|---|---|---|---|---|
| t/TWh | /TWh | W/TWh | |||
| SNF | HLW | Canisters | 50 y | 200 y | |
| SC1 | 2.24 | 0 | 1.06 | 1689 | 552 |
| SC2 | 0.91 | 0 | 8.85 | 1576 | 579 |
| SC3 | 0.41 | 0.10 | 0.93 | 1756 | 591 |
| SC4 | 0 | 0.12 | 0.48 | 1296 | 107 |
| SC5 | 0 | 0.10 | 0.45 | 935 | 28 |
Table 9.
Relative impacts of recycling strategies for handling materials in fuel fabrication [68].
Table 9.
Relative impacts of recycling strategies for handling materials in fuel fabrication [68].
| Parameter | PWR | FR | ADS | |||
|---|---|---|---|---|---|---|
| (U,Pu) MOX | Full TRU Recycle | Pu Only | Full TRU * | MA Target † | MA Dominated | |
| Decay heat | 1 | 3 | 0.5 | 2.5 | 20–80 | 90 |
| Neutrons | 1 | 8000 | ~1 | 150 | 1000–4000 | 20,000 |
Note: Values are normalized to thermal MOX fuel as the reference case. * Homogeneous recycling strategy. † Heterogeneous recycling strategy.
Table 10.
Key results from Acar et al. [70] for 50 GWd/t burnup fuels (top for OTC and TTC scenarios and below for characteristics of the wastes and SNF).
Table 10.
Key results from Acar et al. [70] for 50 GWd/t burnup fuels (top for OTC and TTC scenarios and below for characteristics of the wastes and SNF).
| Scenario | Acar Term | Disposal Area Advantage Factor | Waste Per Ton of Fresh U Fuel (t) | Disposal Area Per Ton of Fresh U Fuel (m2/t) | Electricity Per Ton of Fresh U Fuel (GWhe/t) | Decay Time (y) † |
| OTC | OT | 0.5909 | 1 | 207 | 0.390 | 30,200 |
| TTC (conventional) | SRNU | 0.6343 | 0.690 | 223.1 | 0.476 | 10,800 |
| TTC (advanced) | PC | 0.6240 | 0.683 | 225.5 | 0.473 | 12,500 |
| Waste | Acar Term | Disposal Area (m2/t) | Waste Per Ton of Fresh U Fuel (t) | Disposal Area Per Ton of Fresh U Fuel (m2/t) | Electricity Per Ton of Fresh U Fuel (GWhe/t) | Decay Time (y) |
| Spent UOX | SUOX | 207 | 1 | 207 | 0.390 | 30,200 |
| Spent RepU | SRcU | 207 | 0.107/0.103 | 22.3/21.3 | 0.042/0.04 | 30,200 |
| Vitrified HLW | VHLW | 195 | 0.47 | 79.4 | n/a | 1360 |
| Spent MOX (1) # | SMOXSRNU | 1076 | 0.113 | 121.6 | 0.044 | 76,000 |
| Spent MOX (2) # | SMOXPC | 1134 | 0.110 | 124.8 | 0.043 | 83,300 |
Note: RepU and DepU denote reprocessed uranium and depleted uranium, respectively. † Time taken for 1 tonne of waste to decay to ingestion toxicity level equivalent to 1 tonne of natural uranium (note this is significantly longer than time taken for radioactivity to decay to level of natural uranium). # Spent MOX (1) is produced from natural uranium as opposed to depleted or recycled uranium, and Spent MOX (2) is produced from a partial co-processing cycle where the (U,Pu) oxide is generated at the reprocessing stage in the correct proportions for MOX fuel manufacturing.
Table 11.
Results of Korean material flow and economic modelling studies [53,71] for four example systems.
| Waste | OTC | DUPIC | TTC | Pyro-SFR | |
|---|---|---|---|---|---|
| SNF | (t/TWh) | 2.088 | 2.469 | 0.259 | 0.000 |
| LILW-SL | (m3/TWh) | 13.409 | 19.644 | 15.549 | 10.784 |
| LILW-LL | (m3/TWh) | 1.629 | 2.883 | 2.930 | 1.192 |
| HLW | (m3/TWh) | 3.130 | 4.031 | 0.637 | 0.055 |
| Pu for disposal | (kg/TWh) | 24.990 | 20.250 | 13.997 | 0.028 |
| Excavation volume | (m3/TWh) | 40.500 | 22.010 | 19.800 | 0.093 |
| Costs | (Mills/kWh) * | 7.35 | 9.06 | 8.94 | 7.70 |
| Relative costs | (%) | 100 | 123 | 122 | 105 |
| U breakeven price | ($/kgU) | 800 | 215 | ||
* One Mill is equal to 1/1000 of a US dollar. Mills/kWh are therefore equivalent to $/MWh.
Table 12.
Areas and volumes used by Nishihara et al. [73] for different vertical (V) and compact (C) emplacement configurations.
Table 12.
Areas and volumes used by Nishihara et al. [73] for different vertical (V) and compact (C) emplacement configurations.
| Configuration | V−1 | V0 | V1 | V2 | C |
|---|---|---|---|---|---|
| Area (m2/waste form) | 88.8 | 44.4 | 22.2 | 11.1 | 0.95 |
| Volume (m3/waste form) | 214 | 115 | 64 | 38 | 1.77 |
Publisher’s Note: MDPI stays neutral with regard to jurisdictional claims in published maps and institutional affiliations. |
© 2022 by the authors. Licensee MDPI, Basel, Switzerland. This article is an open access article distributed under the terms and conditions of the Creative Commons Attribution (CC BY) license (https://creativecommons.org/licenses/by/4.0/).
Share and Cite
MDPI and ACS Style
Taylor, R.; Bodel, W.; Stamford, L.; Butler, G. A Review of Environmental and Economic Implications of Closing the Nuclear Fuel Cycle—Part One: Wastes and Environmental Impacts. Energies 2022, 15, 1433. https://doi.org/10.3390/en15041433
AMA Style
Taylor R, Bodel W, Stamford L, Butler G. A Review of Environmental and Economic Implications of Closing the Nuclear Fuel Cycle—Part One: Wastes and Environmental Impacts. Energies. 2022; 15(4):1433. https://doi.org/10.3390/en15041433
Chicago/Turabian StyleTaylor, Robin, William Bodel, Laurence Stamford, and Gregg Butler. 2022. "A Review of Environmental and Economic Implications of Closing the Nuclear Fuel Cycle—Part One: Wastes and Environmental Impacts" Energies 15, no. 4: 1433. https://doi.org/10.3390/en15041433
Note that from the first issue of 2016, this journal uses article numbers instead of page numbers. See further details here.