Article

Prediction Method for Surface Subsidence of Coal Seam Mining in Loess Donga Based on the Probability Integration Model

1
Energy College, Xi’an University of Science and Technology, Xi’an 710000, China
2
State Key Laboratory of Coal Resources in Western China, Xi’an University of Science and Technology, Xi’an 710000, China
3
Key Laboratory of In-Situ Property-Improving Mining of Ministry of Education, Taiyuan University of Technology, Taiyuan 030000, China
4
College of Mining Engineering, Taiyuan University of Technology, Taiyuan 030000, China
5
College of Coal Engineering, Shanxi Datong University, Datong 037000, China
*
Author to whom correspondence should be addressed.
Energies 2022, 15(6), 2282; https://doi.org/10.3390/en15062282
Submission received: 15 February 2022 / Revised: 5 March 2022 / Accepted: 19 March 2022 / Published: 21 March 2022
(This article belongs to the Topic Mining Safety and Sustainability)

Abstract

:
The accurate prediction of surface subsidence is a significant foundation for the damage assessment of coal seam mining and ecological environment reclamation in loess donga. However, conventional models are very problematic, and the reliability of prediction is usually low. Therefore, we propose a method for predicting surface subsidence of coal seam mining in loess donga that is based on the probability integration model, combined with the movement principle of rock and soil layers in the respective study area, and considering the influence of slope stability and additional mining slip on mining subsidence. The feasibility of our new method was verified by a case study in the N1114 working face of the Ningtiaota coal mine (China) that is situated in an area with abundant loess dongas. The results show that slope slippage is the source of error in the prediction of subsidence in loess donga. The prediction idea of “dividing the surface of loess donga into horizontal strata area and slope sub-area, and predicting the subsidence value of the two areas, respectively” is put forward. A method for predicting the subsidence value of two regions is established. First, based on the theory of probability integral and rock formation movement, the probability integral parameters of the horizontal stratum area are determined, and the subsidence basins in the area are superimposed and calculated. Secondly, according to the slope stability and slip principle, the additional displacement of subsidence in the slope area with mining instability coefficient Gcs > 0.87 is calculated. Finally, combined with the subsidence prediction results of the strata area and the slope sub-area, and the position of the slope, the accurate prediction of the surface subsidence in loess donga is realized. Our results show that the agreement between the curves predicted from our calculations and from the measured data are between 88.7–97.8%. The calculated error of the additional displacement of slope mining slip is between 1.0–9.8%. The excellent correlation between the modelled and measured data documents that our method provides, demonstrated a new efficient and valuable tool for the precise prediction of damages induced by mining of underground coal seams in loess donga.

1. Introduction

The Yushenfu coalfield [1] is the largest coalfield in China and one of the seven largest coalfields in the world. Loess dongas are widely distributed in this area. Major coal mining activity in this area has caused an increasing amount of subsidence areas. The subsidence has generated major damages to the cultivated land, water bodies, and buildings to varying degrees within the area affected by the mining, and also caused serious environmental problems [2], such as land desertification and soil erosion. An accurate prediction of surface subsidence is a prerequisite to reduce or even avoid such environmental problems. At present, among many surface subsidence prediction models, the probability integration model [3] is one of the most widely used methods for surface subsidence prediction in mining areas.
Although the model is sufficient several limitations exist: on the one hand, the parameter selection is the key to the probability integration method. However, the specific geological structure of loess donga may lead to large errors [4] in the predicted parameters, influencing the effective constraints of predicted parameters. On the other hand, the stability of the slope and the additional displacement [5] will deviate from the predicted results. We propose a prediction method of surface coal seam mining subsidence in loess donga by considering the essential causes of surface subsidence, i.e., the movement of underground rock layers and the stability of the slope [6], as important factors affecting the prediction accuracy, and combining the probability integral method model, the movement principles of rock and soil layers, and the influence of slope stability on mining subsidence.
The probability integration model [7] is a mining subsidence prediction method based on the random medium theory, with the predicted parameters as the key. Litwiniszyn [8] proposed the model in the 1950s and it has been further developed into a mature application model since then. The effective predicted parameters of the horizontal surface can be obtained in various ways. Therefore, the accuracy and reliability of the predicted results of the probability integral model are assured. However, concerning the prediction of the surface subsidence in donga areas, the model is affected by the probability integral parameters and the slope sliding effect [9], which leads to a decline of the application effect. Several studies have been conducted to solve this problem.
Field measurements [10] are a common method to obtain detailed and reliable predicted surface parameters. However, an accurate measurement is very time-consuming and requires a long period (at least 1 or 2 years), which squanders a lot of manpower and material resources. Moreover, the obtained parameters are only applicable to working faces under similar geological conditions, and the scope of application is limited [11]. Similarity simulation [12] is an effective method to acquire predicted parameters. A formation model, resembling the actual project, is constructed in the laboratory, according to the similarity principle, and the predicted parameters are inferred by monitoring the changes of the model. This method has major advantages, such as intuition, simplicity, and short experimental period. However, the complexity of mining geological conditions, material strength, and human factors have a significant influence on the experimental results [13]. Currently, predicted parameters can be acquired at low cost through numerical simulation [14,15] due to the rapid progress of the computer technology. However, the results are more random because of the influence of the simulation unit and value parameters of rock formation [16]. In addition, based on a large amount of measured field data, several further methods have been proposed to determine predicted parameters, including neural network method [17], support vector machine [18], and genetic algorithm [19]. These methods provide additional ideas for determining predicted parameters, but none of them consider the essential causes of mining subsidence, i.e., the movement of the subterranean strata, and the influence of the strata distribution on the predicted parameters in the donga areas. The stratum control theory [20] predicts that the surface subsidence will change periodically with the periodic breaking of the main key stratum in the overlying rocks. As the complex stratum distribution conditions, such as burial depth and soil layer thickness on the surface, vary in the donga area, a significant change of the parameters is expected [21]. Thus, studying the influence of the rock formation movement and formation distribution on the predicted parameters is of major significance for determining reasonable probability integral parameters in loess donga.
Mining operations below loess donga areas can easily induce geological disasters, such as loess slope slippage and collapse, which not only aggravates the destruction of the ecological environment, but also increases the difficulty of mining subsidence prediction and environmental disaster assessment. According to the topographic features in the special areas, Guo et al. [22] subdivided mining subsidence disasters into three types: collapse disasters, slump disasters, and landslide disasters. Stead, D et al. [23] used the theory of fracture mechanics and plastic mechanics to study the mechanical mechanism of landslides caused by mining. Wang et al. [24] applied numerical simulations to study the stability evaluation model of the mining slope body and to refine the influence principles of the slope stability. Luo et al. [25] established a mathematical model of slope stability under the influence of longwall mining subsidence and constrained a value of 1.5 as the critical value of slope stability. Instead of studying the influence of the slope stability in the loess donga on the prediction of mining subsidence, the previous studies mainly focused on the stability of the mining slope. However, the additional mining slip caused by slope instability in the loess donga is the main source for uncertainties in the subsidence prediction.
Considering findings from previous studies, we propose a method for predicting surface subsidence in loess donga based on a probability integration model, which resolves the deficiencies of the conventional probability integration model in predicting subsidence. The method combines the probability integral model with the influence of rock movement and stratum distribution on estimated parameters and considers the slope stability and the influence of the slip additional displacement on the subsidence results. The plausibility of the method is evaluated by a field test.

2. Prediction Method for Surface Subsidence of Coal Seam Mining in Loess Donga

Various subsidence prediction models have been proposed to predict surface subsidence, including the probability integration model [8], the Weibull distribution model [21], and the influence function model [7]. With the rapid development of computer technology, numerical simulation technology [14,15,16] became progressively used in mining subsidence prediction. The probability integration model is the numerical simulation with the longest application time and the widest application range. Moreover, the probability integration method is numerical simulation of the subsidence prediction models with the longest application time and the broadest scope of reasonable application. Unfortunately, it is not suitable for the application in loess donga and unsatisfactory results are expected due to the influence of strata distribution and topography. Considering these problems, we therefore improved the application of the traditional probability integral model in the donga area. Our study will expand the application range of the probability integral model and also has important significance for solving the limitations of the model.

2.1. The Probability Integration Model

The basic principle of the probability integration model is to superimpose the subsidence probability of countless mining units (ds) to form the surface subsidence curve w(x) and the horizontal movement curve u(x). The integration model of the coal seam unit mining is shown in Figure 1 [21].
Once the coal seam inclination attains full mining, the values of the subsidence and of the horizontal movement of any point on the main section in the strike direction can be calculated by Equation (1) [7].
w x = m η 2 erf π x r 0 erf π x l + 2 d r 0 u x = b m η e π x 2 r 0 2 e π x l + 2 d 2 r 0 2
m is the mining height, η the subsidence coefficient, erf the error integral function, r0 the mining influence radius, r0 = h/tanβ, h the buried depth of the coal seam, β the comprehensive moving angle, l the mining size, d the deviation of inflection point, and b is the horizontal movement coefficient.
Figure 1 and Equation (1) show that the subsidence coefficient, the horizontal movement coefficient, the comprehensive movement angle, and the deviation of inflection point are the four predicted parameters of the probability integration model. According to the calculation principle of Figure 1, the one-dimensional mining parameters are subjected to two-dimensional normalization processing. In order to simplify the calculation, based on the principle of two-dimensional lattice calculation, two-dimensional lattice calculation software of probability integration has been independently developed [26]. By inputting the predicted parameters and mining parameters into the calculation software, the predicted results of the subsidence basins of the traditional horizontal surface can be obtained. However, in loess donga, influenced by stratum structural factors, including burial depth, soil layer thickness, slope angle, and slope height, the predicted parameters of different areas of the surface are not only different, but also difficult to obtain. Furthermore, the predicted results often have large deviations, as they are affected by slope slippage.

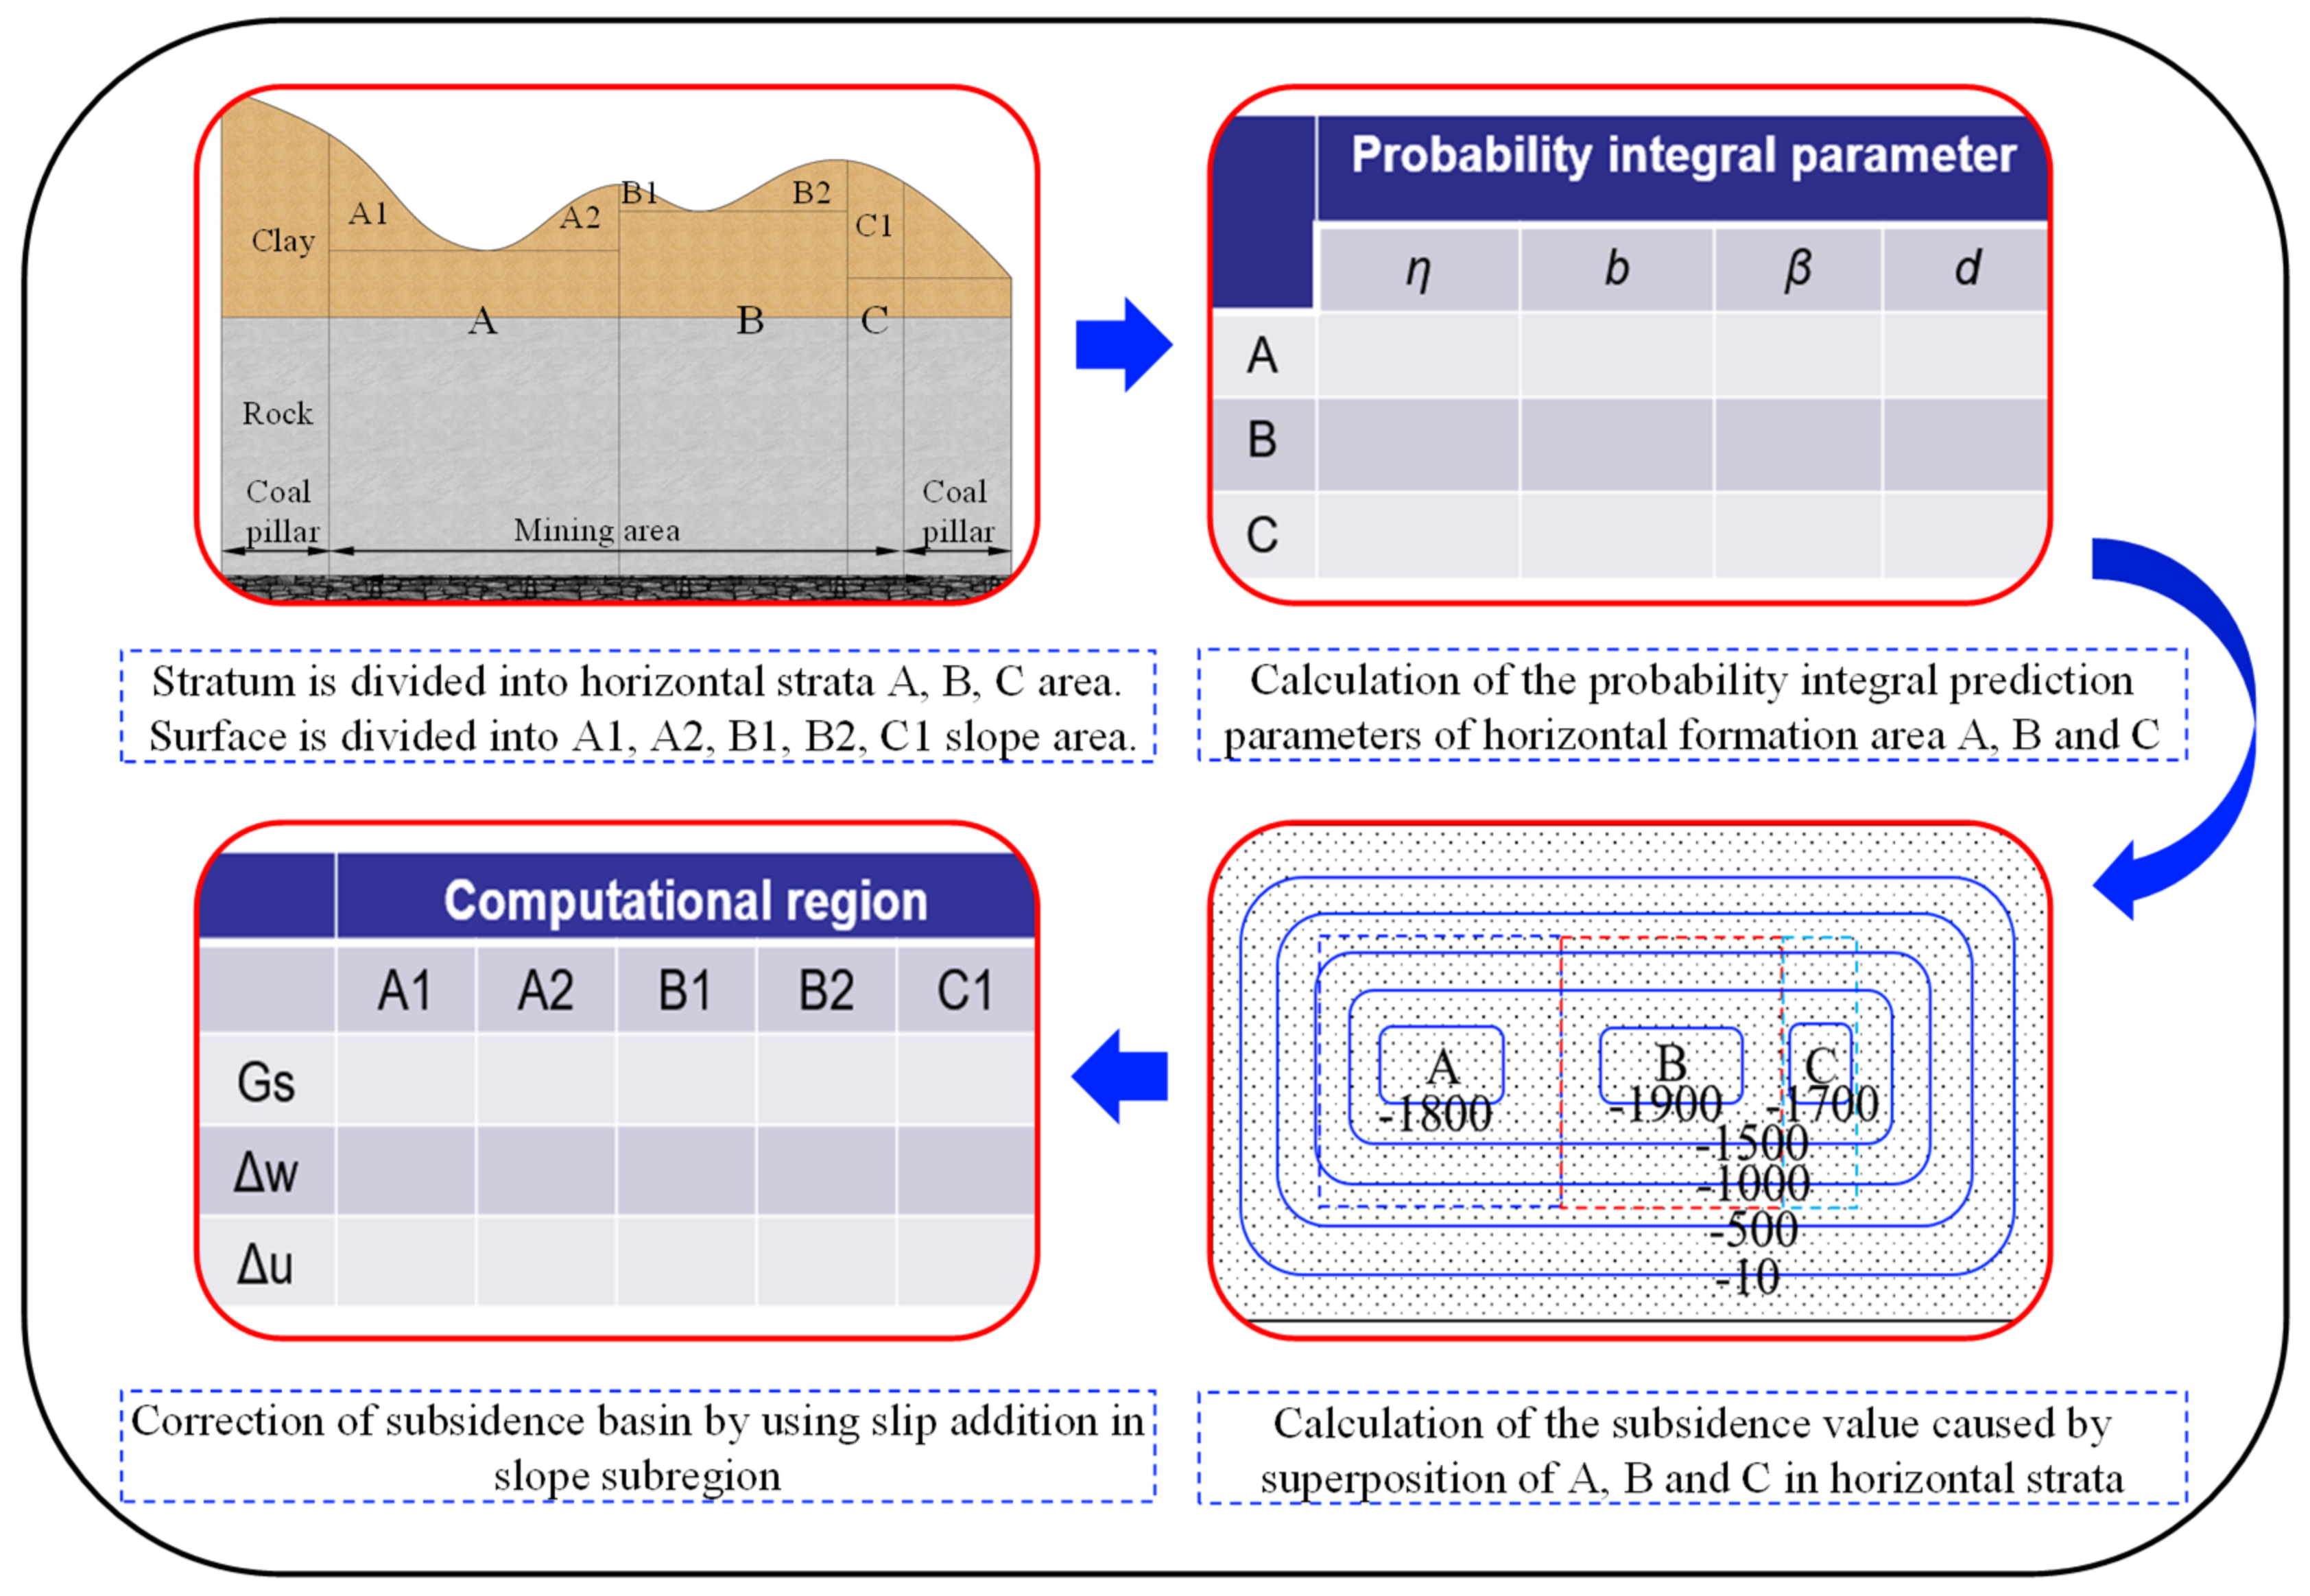
2.2. Prediction Process of Surface Subsidence in Loess Donga

Considering the characteristics of the probability integration model and the limitations of prediction process of surface subsidence in loess donga, we propose a prediction method of surface mining subsidence based on the probability integration model. Figure 2 illustrates the application of the method. At first, the loess donga is subdivided into several horizontal stratigraphic regions with the same characteristics, in light of the stratigraphic distribution, according to the stratigraphic histogram and the surface contour map. Among the horizontal stratigraphic area, slope sub-areas were separated according to the features of the slope (angle and height). The parameters of the stratigraphic structure determine the values of the predicted parameters. The movement of the subterranean strata is the critical cause for the movement of the surface. According to the stratum distribution and the movement principle of rock-soil layers, we calculated the probability integration parameters of different horizontal stratum regions. Based on the superposition calculation principle of the probability integration model, we subsequently calculated the subsidence basins formed by different horizontal strata regions. Finally, the subsidence basin formed by the superposition of the horizontal area is corrected according to additional displacement of slope sub-region mining slip.

3. Determination of Probability Integration Parameters in LDS

Various strata distribution and rock-soil movement principles lead to variations in the estimated subsidence parameters in differing regions. The subsidence coefficient is the key parameter of the probability integration model. The comprehensive movement angles, deviation of inflection points, and the horizontal movement coefficient control the influence range of the sinking basin and the horizontal movement value of the basin. The determination of the predicted parameters of the different regions is the main challenge of the coal seam mining in loess donga (LDS) prediction method. Previous studies have shown that the distribution and movement principles of rock-soil layers are closely related to the probability integration parameters [6]. Therefore, we studied the influences of the distribution and movement principles of the rock-soil layers on the probability integration parameters.

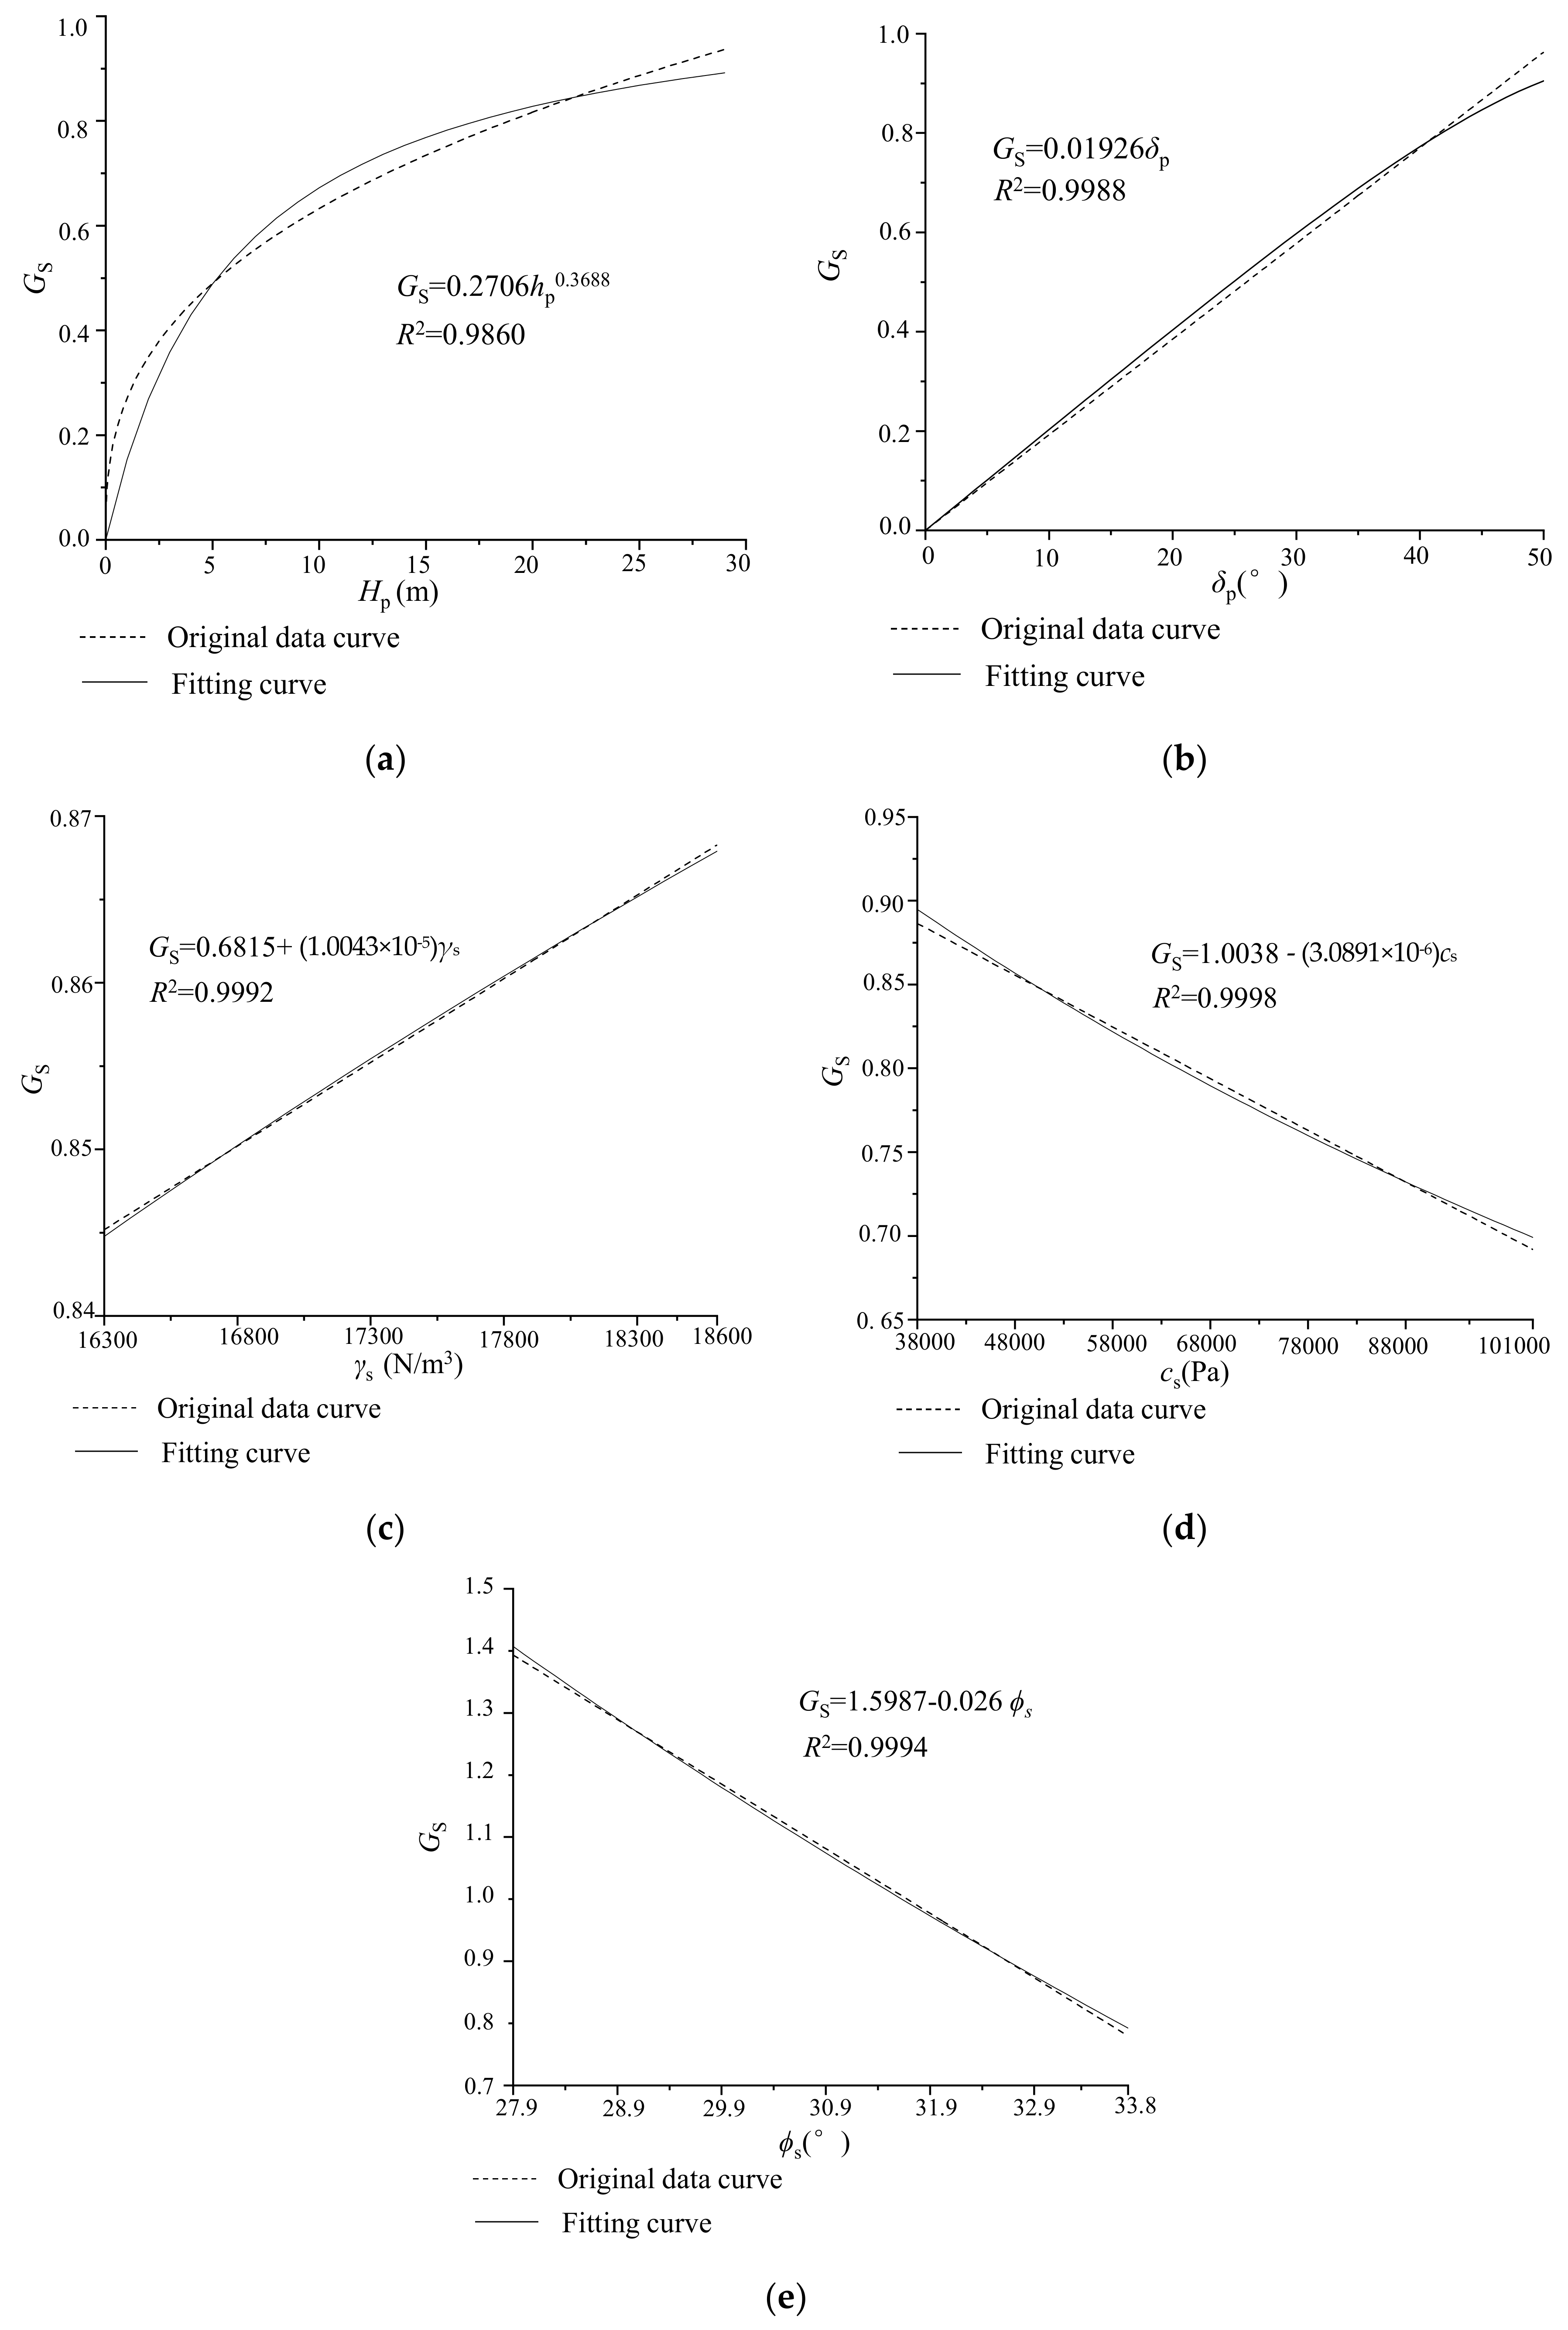
3.1. Calculation of Subsidence Coefficient

The key stratum theory in rock formation control implies that the movement of the underground rock formation is the critical cause of mining subsidence, and the mechanical state of the main key formation in the formation directly determines the migration principles of the overlying rock [20]. The main key stratum is located in the caving zone, the fracture zone or the bending subsidence zone of the mining overburden. The main stratum can be determined from the formation borehole histogram and the key stratum identification method [27]. The height of the caving zone (hc) and the height of the fracture zone (hf) of the mining overburden can be determined by various methods, including on-site measurement, empirical formula, engineering analogy, and theoretical calculations [28]. Based on the rock movement theory, we therefore propose a method for calculating the subsidence coefficient, according to the position of the main key stratum in the mining overburden.
Continuous deformation characteristics of the surface movement are the premise of predicting subsidence basins. If the height of the caving zone hc is larger than the height of the main key stratum Σh (hc ≥ Σh), the main key stratum is located in the caving zone. Figure 3 shows the discontinuous deformation characteristics of the surface when the main key layer is located in the caving zone. Under the influence of underground mining, the main key is completely broken, resulting in the loss of the support of the main key layer to the overlying rock and soil layer. Upward cracks formed by the rupture of rock and soil strata develop through the main key layers to the surface. Multiple vertical cracks cut the continuously deformed surface, showing the feature of stepped subsidence.
Therefore, we focus on the calculation method of the surface subsidence coefficient of continuous deformation for the condition that the main key layer is located in the curved subsidence zone or the fracture zone. Figure 4 illustrates the overlying strata movement principles of the continuous land surface deformation. In either of those cases, the main key stratum did not break, or was broken to form a stable masonry beam structure, which continued to undertake the supporting role of the overlying rock and soil strata. The upward cracks formed by the rupture of the rock and soil strata did not develop on the surface, and the surface curved and subsided to form a continuous subsidence basin. If the fracture zone height is smaller than h (hf ≤ Σh), the main key stratum is in the bending subsidence zone (Figure 4a). In this case, the development height of the overburden mining fracture zone is below the main key stratum, not affecting the soil layer, and the overlying soil layer has no effect on the crack development. Based on the data of field measurements, Geweltzmann established Equation (2), which describes the link between the height of the fracture zone and the subsidence coefficient for mining a single horizontal coal seam by fallen method [29].
h f 2 = 7.25 m η cot β r + cot ψ 2 K r
ψ is the full mining angle, which is related to the full mining degree (usually 55–59°) and Kr is the limit curvature of the top rock formation. The value of Kr is related to the ratio A of the clay rock (mudstone and argillaceous sandstone) in the rock formation [30]. According to the ratio of the thickness of the bedrock constituted by the two rock types, Kr is calculated by Equation (3).
K r = 0.002 + 0.04 A
If hc < Σh< hfh, the main key stratum is located in the fracture zone. Figure 4b shows that the fracture zone is well developed through the bedrock and continues upward. The development height of the fracture zone is influenced by the thickness and properties of the soil layer. Since the clay layer thickness is not considered in Equation (2), the ultimate curvature K0 (K0 = Kr + ΔKr) of the clay layer is introduced into Equation (4) to replace Kr in Equation (2), and the soil layer movement angle is used to calculate the height of crack development [31].
h f 2 = 7.25 m η cot β s + cot ψ 2 K r + Δ K r
In Equation (4), ΔKr is the ultimate curvature increment of the soil layer, ΔKr = 0.1 hs.
The calculation method of the subsidence coefficient, derived from Equation (2) and Equation (4), is shown in Equation (5) in Table 1 for the scenario when the main key stratum is located at different positions.

3.2. Comprehensive Movement Angle, Horizontal Movement Coefficient, and Deviation of Inflection Point

The size of the comprehensive movement angle is mainly related to the thickness of the rock (soil) layer and the rock movement parameters (Figure 1). The comprehensive moving angle is calculated from Equation (6):
β = arctan h tan β s tan β r h s tan β r + h r tan β s
with hs as the thickness of the soil layer, hr as the thickness of the rock layer, βs as the displacement angle of the soil layer, and βr as the displacement angle of the rock layer. βs and βr can be selected according to Table 2 and Table 3 [21].
For the horizontal movement, coefficient b values of 0.2–0.3 are usually applied for China’s coal mining fields. By relating the ratio of the thickness of the clay layer to the mining depth, b is calculated from Equation (7) [21].
b = 0 . 3 0 . 1 h s h
The deviation of inflection point d is related to f, l, and h, d of the near-horizontal ore seam is calculated by Equation (8) in Table 4 [21].
Combined with the regional strata occurrence characteristics and mining rock movement principles (development height of caving zone and fracture zone) in loess donga, probabilistic integration parameters can be calculated from Equations (5)–(8) for each horizontal stratigraphic region. Subsequently, input of the constrained block parameters and predicted parameters of the subdivided horizontal stratigraphic areas into a self-development probability integration calculation software [26] enables the recognition of subsidence basins in the horizontal stratigraphic area after calculation.

4. Slope Stability and Slip Principles in Loess Donga

The subsidence basin calculated according to the superposition of the regional probability integration parameters of different horizontal strata only considers the influence of the horizontal strata in dongas, but excludes the effect of the mining-slip of the slope body. The main characteristics of the Yushenfu mining field (China): a plenitude of nearly horizontal coal seams, thick loose layers, high mining height, thin rock layers, and widespread distribution on the land surface of loess dongas. In the loess donga, the height of the slope body is usually 10–20 m, and the angle 10–30° [1]. Under specific circumstances, coal seam mining can easily lead to mining slip and instability of slopes, resulting in the different principles between mining subsidence and horizontal surface [6]. We studied the stability of the slope body and the additional displacement of mining slip to decipher the principles of the influence of the slope body on the subsidence in the loess gully area.

4.1. Analysis of Slope Stability in Loess Donga

Currently, the limit equilibrium method, the basic method for stability analysis of soil slope, is realized by calculating the safety factor of the slope to analyze the stability of the slope. Based on the Swedish strip method of Fellenius, we extended a series of other methods, including the Bishop method, the Janbu method, the Morgenster-Price method, and the Spencer method for the calculations [22,23,32].
We combined the analysis of the stability of the slope in the loess donga with the characteristics of the strip method. The slope is regarded as a uniform soil slope and its shear strength follows the Mohr-Coulomb failure criterion. The influence of the force between the soil strips on the stability of the soil slope is excluded. To simplify the calculation, we assume that the slip line of the soil slope is an arc. Figure 5 shows the mechanical model of the loess donga slope.
Figure 5 shows that the sliding slope oAB is approximately divided into parallelogram abcd vertical soil strips with number n. The safety factor of the slope in loess donga is set as KS, which is the ratio of the sliding moment MS to the anti-sliding moment MT. The sliding moment is caused by the shear component induced by the gravity of the soil strip. The anti-slip strength of the soil strip generates anti-slip moments. According to the Mohr-Coulomb strength theory, KS can be calculated from Equation (9) [32].
K S = i = 1 n M Si M Ti = i = 1 n r γ si x i h p i tan ϕ s i cos α i + c s i l i r γ si x i h pi sin α i = i = 1 n γ si x i h i tan ϕ s i cos α i + c s i l i γ si x i h pi sin α i
with n as the number of soil strips, r as the radius of the slip line, γsi as the bulk density of the soil strip, xi as the width of the soil strip, hpi as the height of the soil strip, αi as the angle between the direction of the gravity of the soil strip and the normal force FNi, ϕsi as the internal friction angle of the soil strip, csi as the cohesive force of the soil strip, and li as the arc length of the soil strip slip line. Since the soil strip element is xili and the soil slope is a homogeneous soil mass, the soil strip parameters γsi, hpi, αi, ϕsi, and csi can be converted into the bulk density γs of the loess slope, the height of the loess slope hp, the angle of the loess slope δp, the internal friction angle ϕs, and soil cohesion cs. Therefore, Equation (9) is further simplified, and Equation (10) is obtained:
K S = 2 γ s h p cos 2 δ p tan ϕ s + c s γ s h p sin 2 δ p
Equation (10) documents for a height of the slope, a bulk density of the slope or an angle of the slope of 0, the denominator becomes 0 and the equation meaningless. To analyze the relationship between slope stability and influencing factors in the loess donga, the slope instability coefficient Gs was constrained in the experiment [6]. An increase in Gs reduces the stability of the slope, and the risk of slippage caused by the instability of the slope increases. Gs is calculated from Equation (11).
G S = 1 K S = γ s h p sin 2 δ p 2 γ s h p cos 2 δ p tan ϕ p + c p
Equation (11) shows that the slope height, slope angle, soil bulk density, soil cohesion and soil internal friction angle are the main influencing factors of slope stability. To analyze the extent of the influence of every factor on the slope stability, the five factors are assumed to be independent of each other. Previous studies have shown that for hp > 30 m or δp > 50°, the slope will show collapse-type failure [32]. Therefore, we studied a range of the slope height from 0–30 m and a range of slope angle from 0–50°. The test results show that the bulk density of the loess layer ranges from 16,300–18,600 N/m3, the cohesive force from 38,000–101,000 Pa, and the internal friction angle from 27.9–33.8° [29]. We studied the relationship between those factors and the stability of the slope by controlling the variable range of a single factor.
Figure 6a–c shows fitting degrees of 0.9860 for the G-hp power index function curve, of 0.9988 for the G-δp proportional curve, and of 0.9992 for the G-γs linear curve. G is positively correlated with hp, δp, and γs. With the increase in slope height, the slope angle, and the bulk density, the increasing speed of the slope sliding component force exceeds that of the anti-sliding component force, and the degree of the slope instability increases continuously. Figure 6d,e shows a fitting degree of 0.9998 for the G-cs linear curve, of 0.9994 for the G-ϕs linear, and negative correlation of G with cs and ϕs. With the increase in soil cohesion and internal friction angle, the shear strength of the soil slope, the anti-sliding component, and the stability of the slope increase. The results of grey correlation degree and orthogonal test analysis show that the sensitivity of the parameters affecting the slope stability in the loess donga is ranked from large to small, and the order is δp > hp > γs > ϕs > cs [1]. The main reason is that the slope angle and slope height in this area have a large variation range, while the fluctuation range of the soil physical and mechanical parameters is small, which has little influence on the slope stability [22].
In conclusion, the slope instability coefficient in loess donga is positively correlated with slope height, slope angle, and soil bulk density, but is negatively correlated with soil cohesion and internal friction angle. According to Equation (11), the extent of instability of the slope body in donga areas can be determined prior to the impact of the mining activity.

4.2. Additional Displacement of Slope Mining Slip

The reliable understanding of striking differences in the movement principles of the surface and the horizontal surface is critical for mining in donga areas. The main movement and deformation characteristics of surface mining subsidence are subsidence, horizontal movement, and the influence range of the mining activity. The model of the movement and deformation of the inclined surface in the horizontal mining seam is shown in Figure 7 [6].
Figure 7 indicates an asymmetry of the inclined surface subsidence curve w (x, z) and the horizontal movement curve u (x, z) for a horizontal mine with the size l. The surface movement deformation curve is related to the stability of the slope, but also to the mining direction of the coal seam [21]. Therefore, the research progress should be combined with the influence of the stability of the mining slope in loess donga on the surface movement and deformation. Assuming that the slope slip is R(x), the additional subsidence slip Δw(x) and the additional horizontal displacement slip Δu(x) caused by the slope slip can be expressed in Equation (12).
Δ w x = R ( x ) sin δ p Δ u x = R ( x ) cos δ p
The slippage of the slope is related to the mining instability degree of the slope. If the slope is unstable, it tends to slide. The higher the degree of instability, the higher the affinity for sliding. The slope can be subdivided into a first-class slope, a second-class slope, and a third-class slope according to the hazard degree of the slope body after sliding damage. The normative standards for the safety factor of slope stability are summarized in Table 5 [32].
The loess donga is a highly fragile ecological environment, which is attributed to the first-class slope, and mining in this area is regarded as an earthquake condition. According to Table 5, the safety factor KS in this area is 1.15, and GS = 0.87 as calculated by Equation (11).
The results of the numerical simulation and the field test show that, apart from the stability of the slope itself, mining has a larger impact on the stability of the slope. Compared with mining along the slope, the slope body is more prone to instability if mining occurs on the reverse slope. Taking KC as the influence coefficient of the slope mining direction on the slope instability coefficient for mining along the slope KC is 1.5, but for mining against the slope KC becomes 2.0 [24]. The mining instability coefficient GCS of the slope is expressed by Equation (13).
G CS = K C G S
To sum up, a value of 0.87 is constrained as the critical coefficient that defines the slip instability in loess donga. At GCS ≤ 0.87 the slope is stable, and no slip occurs. At 0.87 < GCS, the slope is slippery and unstable, and the slip displacement R(x) is calculated from Equation (14).
R ( x ) = G CS w x 0 sin δ p + u x 0 cos δ p
with w(x0) and u(x0) as the initial subsidence and initial horizontal movement, respectively. From Equations (12) and (14), Equation (15) for the additional displacement of slope slip is derived.
w x = w x 0 + G CS w x 0 sin δ p + u x 0 cos δ p sin δ p u x = u x 0 + G CS w x 0 sin δ p + u x 0 cos δ p cos δ p
To summarize, the mining instability coefficient of the slope is calculated according to the slope parameters and the mining direction of the coal seam in loess donga. For conditions with 0.87 < GCS the slope is slippery and unstable, and additional mining slip will be generated as the slope subsides. First, the predicted basin of horizontal formation subsidence is obtained according to the superposition calculation of the software, and the initial subsidence curve and initial horizontal movement curve of the surface are extracted from it. Secondly, combined with the initial subsidence value and horizontal movement value of the slope area that will generate slip, as well as δp and GCS, the additional displacement of slope mining slip is calculated by Equation (14). Finally, the movement and deformation curve of the initial horizontal stratum area is corrected by the additional displacement mining slip, and the prediction of the surface subsidence in the loess donga is finally realized.

5. Case Study

We selected the N1114 working face as a case study to verify the predicted effect of LDS on surface mining subsidence in loess donga. The methods of LDS and the field test were used to predict the subsidence basin.

5.1. Engineering Case

The Ningtiaota Coal Mine is a typical mine in the loess donga of the Yushenfu mining field in China. The N1114 working face mines 1–2 near-horizontal coal seams with an average thickness of 1.85 m. The working face has a width of 245 m and a recoverable length of 1922 m. The working face is limited to north and south by the unmined N1116 working face and the N1112 working face, respectively, and to the west by the 135 m stop-line coal pillar and to the east by the 60 m mine field boundary coal pillar. An overview of the strata occurrence of N1114 working face is summarized in Table 6, that is constrained by combining drilling data with physical and mechanical parameters [33]. The key layers of the overlying rock are determined from the key layer theory and the data in Table 6. A 13.70 m thick horizon of fine sandstone is the main key layer and an 8 m horizon of fine sandstone is the sub-key layer. A 16.10 m layer of fine sandstone is a thick hard rock stratum, which is broken along with the breaking of the main key layer.
To fulfill the complete mining demand, the actual measurement and LDS subsidence comparison area is the section of N1114 working face from west to east, 300 m distant from the mining stop line. Full extraction has been achieved prior to the mining of the target area. Therefore, we added an additional 150 m computing area for the LDS to simulate actual mining on site. According to the contour distribution of the N1114 working face in Figure 8a, the trend direction with obvious slope distribution in the study area is selected for research. The profile A–A is constructed along the direction of the center of the working face, as shown in Figure 8b.

5.2. LDS Prediction

We modelled the surface of loess donga according to the LDS application process that is subdivided into following steps:
Step 1: Figure 8b shows that the coal seam mining area and overlying strata are subdivided into four horizontal areas (A, B, C, and D), according to the distribution characteristics of geotechnical layers. According to the slope characteristics of dongas, the slope is further divided into six slope sub-areas: A1, B1, B2, C1, C2, and D1.
Step 2: The probability integration parameters of the A, B, C, and D horizontal formation regions are calculated, respectively.
Field measurement shows that hc is 7.5 m, hf is 24.5 m, and 24.5 m = hf < Δh = 25.5 m [33]. The main key layer is in the curved subsidence zone and the surface forms a continuously deformed subsidence basin. From Figure 8 and the data of Table 6 it follows that the ratio of clay rock to the rock layer is 0.236 and the average firmness coefficient of the rock layer is 3.56. The mining height m of the working face is 1.85 m, the width is 245 m, and the calculated length is 450 m. The calculated length of the working face is larger than 1.4 h and the full extraction angle is taken is 55°. The results of the probability integral parameters of the individual horizontal formation areas, calculated from Equations (5)–(8), are summarized in Table 7.
Step 3: Based on the probability integration model, we insert the parameters of the different regions and the coordinates of the inflection point of the block in the self-developed two-dimensional lattice probability integration calculation software [26] and calculated the value of the subsidence basin according to the mining order. The initial subsidence isoline cloud and horizontal movement cloud chart for the N1114 working face is shown in Figure 9.
Step 4: Subsequently, we calculated the slope instability coefficients of the six slope sub-regions (A1, B1, B2, C1, C2, and D1). According to Table 6 and Figure 8, the soil cohesion is 59 kPa, the friction angle in the soil is 28.2°, and the bulk density of the soil is 18,600 N/m3. The results of the calculations are shown in Table 8.
The GCS-B1 relationship of the B1 slope is 0.87 < GCS-B1 = 0.97 (Table 8) indicating that the B1 slope will generate instability and slip during the coal seam mining process. Therefore, we constructed a cross section along the strike direction in the center of the working face (Figure 9) and the surface curve of dongas is obtained in combination with Figure 9 Subsequently, we refined the sinking and horizontal movement curves according to the calculated data in Table 8, using Equation (15). Figure 10 shows the predicted surface movement curve in the strike direction of the N1114 working face.
Figure 10 shows that the trend of the surface subsidence and horizontal movement curve in loess donga essentially conforms to the principles of surface mining movement and deformation. The maximum subsidence value reaches 1096.23 mm, close to the middle of the goaf. The minimum value of the horizontal movement of the surface is in the center of the goaf. The surface subsidence values on both sides of the goaf are 505.86 mm and 566.81 mm, respectively, hence almost half the maximum subsidence. The maximum values of the horizontal movement of the ground surface are 270.25 mm and 274.09 mm, which are located above both sides of the goaf. Affected by loess dongas, the surface subsidence value in the center of the goaf ranges between 1039.62 mm to 1096.23 mm. The horizontal movement in the center of the goaf fluctuates around 0, and the floating range is 14.45 mm to 20.51 mm. The subsidence and horizontal movement correction curves of the dongas area show that the slope at B1 induces different degrees of additional slip. The additional displacement of subsidence and horizontal movement slip generated by the B1 slope are 16.97 mm to 33.88 mm and 0.64 mm to 5.97 mm, respectively.

5.3. The Field Test

A high-precision total station was used in the target research area for the field test to evaluate the application effect of LDS and refine the method. At first, two measurement control points were installed, and subsequently, the survey line A was arranged along the direction of the research area. From the west side, it was arranged 100 m away from the mining stop line of N1114 working face, including the 300 m research area. A total of 41 measuring points were arranged in the area. The distance between the measuring points was 10 m and the monitoring distance was 400 m. Since the mining speed of the working face was 20 m/d [33], until the mining of the working face was completed, the monitoring was performed five times once a week. After the mining stop of the working face, according to the change rate of the subsidence value, the monitoring time was 1 to 3 months and the monitoring time was five times until the surface movement stopped. The overall monitoring time was 1a, with a total of 10 monitoring times [21]. Figure 11 summarizes the measured curve of line A and the predicted curve of LDS in the target area.
Figure 11a shows that the interval between the 8th and 10th monitoring is more than 6 months. The fluctuation range of the subsidence value between the measuring points is 0.96–28.56 mm. The surface mobile basin is considered to be stable if the subsidence increment is less than 30 mm for six consecutive months [21]. The 10 monitoring results basically conform to the principles of surface movement and deformation, indicating that the monitoring is reasonable and effective. Comparing the measurement point data A11–A41 (Figure 11a) shows that the theoretically predicted subsidence value in the study area deviates from the actual subsidence value by 0.74–77.07 mm, with an average of 7.11 mm. The relative deviation is 0.1–12.9%, with an average of 1.6%. The deviation between the theoretical predicted horizontal movement value and the actual horizontal movement value is 0.14–17.07 mm (Figure 11b), with an average of 2.96 mm. The relative deviation ranged from 0.8% to 22.6%, with an average of 11.3%. Excluding the measurement errors of individual discrete points shows a high extent of agreement between the predicted curve and the actual subsidence curve. Hence, the requirements of the engineering are fulfilled.
The theoretically predicted additional subsidence slip in the study area A17–A25 is 16.97–33.88 mm and the theoretically predicted additional displacement of horizontal movement slip is 0.64–5.97 mm. Figure 11a shows that, based on the average maximum subsidence of 1075.26 mm in the center of the goaf, the actual subsidence value at A17–A25 increases between 3.51–71.16 mm, with an average of 30.59 mm, which is in line with the expected range. The relative deviation between the theoretically predicted subsidence curve and the actual subsidence curve is 0.2–4.4%, with an average of 1.0%. The actual sinking horizontal movement slip increment cannot be calculated since a benchmark for the horizontal movement is lacking, Figure 11b shows that the relative deviation between the theoretical predicted horizontal shift curve and the actual horizontal shift curve is 2.7–22.6% at A17–A25, with an average of 9.8%. The data document that LDS can effectively predict the subsidence and horizontal movement of the slope due to slip in loess donga.

6. Discussion

The study of surface subsidence in loess donga of coal mines is of significance for ecological reclamation and mining damage assessment. However, the probability integral model, which is widely used in the prediction of horizontal surface subsidence, is unsuitable because of the influence of the surface of the donga area. To acquire probability integration parameters with a high reliability is the main challenge. However, additional displacement of slip, caused by the instability in loess donga, reduces the prediction accuracy of the probability integration model. Therefore, previous studies have focused on the probability integral parameters of the horizontal surface and on the mining stability of the slope in the donga area. Implementing findings from previous studies, we here propose a new method for predicting coal seam mining subsidence in loess donga from the probability integration model that is based on the distribution and movement principles of rock-soil layers and considers the mining-slip effect of the slope. This predicting method is suitable for subsidence forecasting for mining of surface-level ore seams in most donga areas. Due to the thickness of the sloping ore seam, the mining depth, and the offset caused by the sloping ore seam, the surface mining movement deformation basin is asymmetrical. Under the superposition of the surface in the donga area, the LDS prediction method is no longer applicable. In the future, we will study the impact of sloping seam mining on LDS prediction that will further refine the LDS subsidence prediction method.

7. Conclusions

We improved the subsidence prediction process of the probability integration model in loess donga areas to solve the problem that surface mining subsidence in such areas is difficult to predict. The following main conclusions are drawn from our new data:
(1)
Slope slip can easily lead to large deviations in the prediction of subsidence in loess donga. In order to solve this long-standing problem, a solution of “regional subsidence prediction in loess donga” is put forward, and the subsidence prediction method for horizontal strata and slope area in loess donga is established.
(2)
Determine the probability integration parameters of the horizontal stratigraphic region based on the position of the main key stratum and the stratigraphic distribution. With the help of the probability integration software, the subsidence basin formed by the superposition of multiple horizontal stratigraphic regions can easily be obtained.
(3)
When the mining instability coefficient of the slope Gcs > 0.87, the slope produces slip instability. The additional displacement of subsidence generated in the landslide area is calculated by the mining instability coefficient.
(4)
Combined with the subsidence prediction results of the two regions in loess donga, the accuracy of the prediction of surface subsidence in the area is improved. Correlation of the calculated data with results of the field test document a 98.4% fit for the LDS subsidence curve and an 88.7% fit for the horizontal movement curve. In case of mining-slip instability of the slope, the estimated error of the subsidence curve is 0.96%, and the estimated error of the horizontal movement curve is 9.8%, thus fulfilling the requirements of engineering.

Author Contributions

The present article is addressed by the eight authors mentioned, each of whom were responsible for various aspects of the work. Conceptualization, Y.G. and B.Z.; methodology, Y.G. and B.Z.; software, B.Z.; validation, Y.G. and B.Z.; formal analysis, Y.G., Y.H. and B.Z.; investigation, Y.G., B.Z., X.M., D.Z. (Di Zhai) and J.W.; resources, B.Z.; data curation, Y.G., D.Z. (Defu Zhu) and B.Z.; writing—original draft preparation, Y.G. and B.Z.; writing—review and editing, Y.G., B.Z., X.M., D.Z. (Di Zhai), D.Z. (Defu Zhu), Y.H., Z.S. and J.W.; visualization, Y.G.; supervision, B.Z., X.M., D.Z. (Di Zhai), D.Z. (Defu Zhu), Y.H., Z.S. and J.W.; project administration, B.Z. and Y.G.; funding acquisition, B.Z., Y.G., D.Z. (Di Zhai), Y.H. and J.W. All authors have read and agreed to the published version of the manuscript.

Funding

This research was funded by the National Natural Science Foundation of China through (Grant No. 51874230 and 52074208). And Shanxi Applied Basic Research Programs, Science and Technology Foundation for Youths (Grant No. 202103021223073).

Data Availability Statement

Not applicable.

Conflicts of Interest

The authors declare no conflict of interest.

References

  1. Song, S.; Zhao, X.; Xie, J.; Guan, Y. Grey Correlation Analysis and Regression Estimation of Mining Subsidence in Yu-Shen-Fu Mining Area. Procedia Environ. Sci. 2011, 10, 1747–1752. [Google Scholar] [CrossRef] [Green Version]
  2. Jianjun, S.; Chunjian, H.; Ping, L.; Junwei, Z.; Deyuan, L.; Minde, J.; Lin, Z.; Jingkai, Z.; Jianying, S. Quantitative prediction of mining subsidence and its impact on the environment. Int. J. Min. Sci. Technol. 2012, 22, 69–73. [Google Scholar] [CrossRef]
  3. Fan, H.; Gu, W.; Qin, Y.; Xue, J.; Chen, B. A model for extracting large deformation mining subsidence using D-InSAR technique and probability integral method. Trans. Nonferrous Met. Soc. China 2014, 24, 1242–1247. [Google Scholar] [CrossRef]
  4. Tang, F.-Q. Mining subsidence prediction model in western thick loess layer mining areas. Meitan Xuebao J. China Coal Soc. 2011, 36, 74–78. [Google Scholar] [CrossRef]
  5. Curtaz, M.; Ferrero, A.M.; Roncella, R.; Segalini, A.; Umili, G. Terrestrial Photogrammetry and Numerical Modelling for the Stability Analysis of Rock Slopes in High Mountain Areas: Aiguilles Marbrées case. Rock Mech. Rock Eng. 2014, 47, 605–620. [Google Scholar] [CrossRef] [Green Version]
  6. Zhao, B.; Tong, C.; Liu, Z.; Liu, L.; Xueyi, Y.U. Characteristics of mining-induced surface damage in western ecological fragile region. J. Cent. South Univ. Technol. 2017, 48, 2990–2997. [Google Scholar]
  7. Luo, Y. An improved influence function method for predicting subsidence caused by longwall mining operations in inclined coal seams. Int. J. Coal Sci. Technol. 2015, 3, 1–7. [Google Scholar] [CrossRef] [Green Version]
  8. Guo, Y.; Zhu, G.; Jiang, X.; Dou, M. Study of Dynamic Coordinates Time Function in Mine Subsidence. Adv. Mater. Res. 2012, 594–597, 56–60. [Google Scholar] [CrossRef]
  9. Peng, S.S. Topical areas of research needs in ground control—A state of the art review on coal mine ground control. Int. J. Min. Sci. Technol. 2015, 25, 1–6. [Google Scholar] [CrossRef]
  10. Deguchi, T.; Kato, M.; Akcin, H.; Kutoglu, H.S. Automatic processing of interferometric SAR and accuracy of surface deformation measurement. SPIE Eur. Remote Sens. 2006, 6363, 47–54. [Google Scholar] [CrossRef]
  11. Saeidi, A.; Deck, O.; Marwan, A.; Verdel, T.; Rouleau, A. Adjusting the Influence Function Method for Subsidence Prediction. Key Eng. Mater. 2013, 553, 59–66. [Google Scholar] [CrossRef] [Green Version]
  12. Yanli, H.; Jixiong, Z.; Baifu, A.; Qiang, Z. Overlying strata movement law in fully mechanized coal mining and backfilling longwall face by similar physical simulation. J. Min. Sci. 2011, 47, 618–627. [Google Scholar] [CrossRef]
  13. Zheng, R.; Kan, W.; Ru, L. Study on Overburden’s Destructive Rules Based on Similar Material Simulation. Int. J. Mod. Educ. Comput. Sci. 2011, 3, 54–60. [Google Scholar] [CrossRef]
  14. Guo, W.; Hou, Q.; Zou, Y. Relationship between surface subsidence factor and mining depth of strip pillar mining. Trans. Nonferrous Met. Soc. China 2011, 21, s594–s598. [Google Scholar] [CrossRef]
  15. Zhang, B.; Ye, J.; Zhang, Z.; Xu, L.; Xu, N. A Comprehensive Method for Subsidence Prediction on Two-Seam Longwall Mining. Energies 2019, 12, 3139. [Google Scholar] [CrossRef] [Green Version]
  16. Zhang, X.; Yu, H.; Dong, J.; Liu, S.; Huang, Z.; Wang, J.; Wong, H. A physical and numerical model-based research on the subsidence features of overlying strata caused by coal mining in Henan, China. Environ. Earth Sci. 2017, 76, 705.1–705.11. [Google Scholar] [CrossRef]
  17. Kim, K.D.; Lee, S.; Oh, H.J. Erratum: Prediction of ground subsidence in Samcheok City, Korea using artificial neural networks and GIS. Environ. Geol. 2009, 58, 61–70. [Google Scholar] [CrossRef]
  18. Tan, Z.; Li, P.; Yan, L.; Deng, K. Study of the method to calculate subsidence coefficient based on SVM. Proced. Earth Planet. Sci. 2009, 1, 970–976. [Google Scholar] [CrossRef] [Green Version]
  19. Xiaofang, L.; Hui, S. Intelligent Planning of Tourism Scenic Routes Based on Genetic Algorithm in Coal WANBEI Mining Subsidence. TELKOMNIKA Telecommun. Comput. Electron. Control 2016, 14, 69. [Google Scholar] [CrossRef] [Green Version]
  20. Xu, J.L.; Lian, G.M.; Zhu, W.B.; Qian, M.G. Influence of the key strata in deep mining to mining subsidence. J. China Coal Soc. 2007, 32, 686–690. [Google Scholar] [CrossRef]
  21. Yu, X.; Zhang, E. Mining Damage Science; China Coal Industry Publishing House: Beijing, China, 2010. [Google Scholar]
  22. Guo, W.; Yu, X.; Liu, Z. Analysis of Mining Subsidence Disasters in Loess Gully Areas and its Control Countermeasures. Appl. Mech. Mater. 2015, 737, 456–460. [Google Scholar] [CrossRef]
  23. Stead, D.; Coggan, J.S.; Eberhardt, E. Realistic simulation of rock slope failure mechanisms: The need to incorporate principles of fracture mechanics. Int. J. Rock Mech. Min. Sci. 2004, 41, 563–568. [Google Scholar] [CrossRef]
  24. Wang, F.; Shi, C.; Chen, K.; Li, D.; Han, K. Numerical Simulation Analysis on the Collapse of Slope in Iron Mine. Adv. Mater. Res. 2014, 926–930, 593–596. [Google Scholar] [CrossRef]
  25. Luo, Y.; Cheng, J. An influence function method based subsidence prediction program for longwall mining operations in inclined coal seams. Min. Sci. Technol. China 2009, 19, 592–598. [Google Scholar] [CrossRef]
  26. Zhao, B.C.; Xue-Yi, Y.U.; Zhao, J.Z. Visual study on prediction evaluation system of mining damage. Coal Geol. Explor. 2006, 34, 61–64. [Google Scholar] [CrossRef] [Green Version]
  27. Changchun, H.; Xu, J. Subsidence Prediction of Overburden Strata and Surface Based on the Voussoir Beam Structure Theory. Adv. Civ. Eng. 2018, 2018, 2606108. [Google Scholar] [CrossRef]
  28. Zhang, C.; Tu, S.; Zhao, Y. Compaction characteristics of the caving zone in a longwall goaf: A review. Environ. Earth Sci. 2019, 78, 27. [Google Scholar] [CrossRef]
  29. Huang, Q. Research on roof control of water conservation mining in shallow seam. J. China Coal Soc. 2017, 42, 50–55. [Google Scholar] [CrossRef]
  30. He, M.; Zhang, Z.; Zhu, J.; Li, N. Correlation Between the Constant mi of Hoek–Brown Criterion and Porosity of Intact Rock. Rock Mech. Rock Eng. 2022, 55, 923–936. [Google Scholar] [CrossRef]
  31. Xie, X.; Hou, E.; Wang, S.; Sun, X.; Hou, P.; Wang, S.; Xie, Y.; Huang, Y. Formation Mechanism and the Height of the Water-Conducting Fractured Zone Induced by Middle Deep Coal Seam Mining in a Sandy Region: A Case Study from the Xiaobaodang Coal Mine. Adv. Civ. Eng. 2021, 2021, 6684202. [Google Scholar] [CrossRef]
  32. Li, L.I.; Wang, Y.X.; Wang, W.B. Effects of Mining Subsidence on Physical and Chemical Properties of Soil in Slope Land in Hilly-gully Region of Loess Plateau. Chin. J. Soil Sci. 2010, 41, 1237–1240. [Google Scholar] [CrossRef]
  33. Li, K. Research on the Roof Structure and Support Resistance of the Working Face under Close Coal Seam Goaf in Shallow Buried; Xi’an University of Science and Technology: Xian, China, 2020. [Google Scholar]
Figure 1. Coal seam unit mining integral model.
Energies 15 02282 g001
Figure 2. LDS application process.
Energies 15 02282 g002
Figure 3. The main key stratum is located in the caving zone.
Energies 15 02282 g003
Figure 4. Migration principles of overlying rock under continuous deformation: (a) the main key stratum is located in the curved subsidence zone; and (b) the main key stratum is located in the bending zone.
Energies 15 02282 g004
Figure 5. Mechanical model of slope body in loess dongas.
Energies 15 02282 g005
Figure 6. Relationship between different influencing factors and slope instability coefficient: (a) Slope height (hp), (b) Slope angle (δp), (c) Soil bulk density (γs), (d) Soil cohesion (cs), and (e) Internal friction angle of soil (ϕs).
Energies 15 02282 g006
Figure 7. Deformation model of inclined surface in horizontal seam mining.
Energies 15 02282 g007
Figure 8. Overview of the N1114 working face: (a) work surface layout; and (b) A–A stratigraphic profile.
Energies 15 02282 g008aEnergies 15 02282 g008b
Figure 9. Probability integration calculation result: (a) subsidence isoline cloud; and (b) horizontal movement isoline cloud.
Energies 15 02282 g009
Figure 10. Surface movement prediction curve in dongas: (a) sinking curve; and (b) horizontal displacement curve.
Energies 15 02282 g010
Figure 11. Surface movement deformation curve of mining under loess donga: (a) sinking curve, (b) horizontal movement curve, and (c) legend.
Energies 15 02282 g011
Table 1. The subsidence coefficient of the main key stratum at different positions.
Analyzing
Conditions
Main Key
Stratum Location
Subsidence Coefficient
Calculation Formula
hc ≥ Σhcurved subsidence zone η = h f 2 cot β r + cot ψ 2 K r 7.25 m (5)
hc < Σh < hfhFracture zone η = h f h r 2 cot β s + cot ψ 2 K r + Δ K r 7.25 m
Table 2. Displacement angle (βs) of loose layer.
Loose Layer Thickness (m)Loose Layer Features
Dry, Water-FreeStrong Water ContentQuick-Curing Ground Content
<4050°45°30°
40–6055°50°35°
>6060°55°40°
Table 3. Displacement angle (βr) of strata.
Average Rock Firmness Coefficient f
f < 33 ≤ f < 66 ≤ f
Rock displacement angle65°70°75°
Table 4. Displacement angle (βs) of loose layer.
fd
f > 6 d = 0.29 0.36 lg l h h if l/h > 2.2, l/h = 2.2(8)
3 < f < 6 d = 0.19 0.35 lg l h h if l/h > 1.4, l/h = 1.4
f < 3 d = 0.14 0.40 lg l h h if l/h > 0.9, l/h = 0.9
Table 5. Slope stability safety factor.
Security LevelFirst-Class SlopeSecond-Class SlopeThird-Class Slope
General condition safety factor1.351.301.25
Temporary condition safety factor1.251.201.15
Earthquake condition safety factor1.151.101.05
Table 6. Stratigraphy of the N1114 working face with physical and mechanical parameters.
StrataThickness
(m)
Physical and Mechanical Parameters
σc
(MPa)
σt
(Mpa)
c
(Mpa)
E
(Mpa)
γ
(N/m3)
μφ
(°)
Loess30.00–60.000.290.030.05933.4218,6000.3228.2
Fine sandstone16.1029.60.501.50125822,7000.2942.0
Sandy mudstone7.4034.70.540.26240025,6000.2438.5
Fine sandstone13.7045.60.7082.20211323,0000.2741.5
Sandy mudstone4.7035.30.560.27241526,1800.2438.8
Medium mudstone3.4040.60.561.50194923,3000.2844.0
Silty sandstone2.20360.2340.9099524,2000.3040.0
Fine sandstone8.0029.80.601.57202423,0500.2739.2
Sandy mudstone5.2036.20.560.30242325,7800.2438.5
Silty sandstone2.0032.90.270.9497922,7000.2739.3
1−2 Coal1.8515.70.291.1084512,9000.2837.5
Silty sandstone4.9036.40.281.0197723,0300.2740.2
Fine sandstone12.7034.10.521.55132023,1600.2740.4
Table 7. Calculated probability integration parameters of the individual areas.
Calculation Areas
ABCD
Parametershs (m)50.030.040.030.0
hr (m)62.762.762.762.7
βs (°)50.045.050.045.0
βr (°)70.070.070.070.0
Calculated resultsη0.580.580.580.58
δ (°)60.164.963.464.9
b0.2560.2730.2650.273
d (m)15.6515.6515.6515.65
Table 8. Slope instability coefficient of slope sub-regions.
Calculation Areas
A1B1B2C1C2D1
Parametershp (m)10.030.020.010.020.030.0
δp (°)10.117.621.88.512.910.3
mining directiondownward slopereverse slopedownward slopereverse slopedownward slopereverse slope
Calculated resultsGCS0.310.970.830.350.490.56
Publisher’s Note: MDPI stays neutral with regard to jurisdictional claims in published maps and institutional affiliations.

