
Optimizing Integration of Fuel Cell Technology in Renewable Energy-Based Microgrids for Sustainable and Cost-Effective Energy


1
Department of Interdisciplinary Courses in Engineering, Chitkara University Institute of Engineering & Technology, Chitkara University, Punjab 140401, India
2
Department of Computer Science, Shree Guru Gobind Singh Tricentenary University, Gurugram 122505, India
3
Department of Electrical Engineering, College of Electronics and Information Engineering, Sejong University, 209 Neungdong-ro, Gwangjin-gu, Seoul 05006, Republic of Korea
4
School of Electrical Engineering and Computer Science, University of Ottawa, 25 Templeton St., Ottawa, ON K1N 6N5, Canada
*
Authors to whom correspondence should be addressed.
Energies 2023, 16(11), 4482; https://doi.org/10.3390/en16114482
Submission received: 14 April 2023
/
Revised: 10 May 2023
/
Accepted: 31 May 2023
/
Published: 1 June 2023
(This article belongs to the Special Issue Application and Management of Smart Energy for Smart Cities)
Abstract
:This article presents a cost-effective and reliable solution for meeting the energy demands of remote areas through the integration of multiple renewable energy sources. The proposed system aims to reduce dependence on fossil fuels and promote sustainable development by utilizing accessible energy resources in a self-contained microgrid. Using the Hybrid Optimization Model for Electric Renewable (HOMER) software, the study examined the optimal combination of energy sources and storage technologies for an integrated hybrid renewable energy system (IHRES) in the Patiala location of Punjab. The total life cycle cost (TLCC) is the main objective of this manuscript. The HOMER result is taken as a reference, and the results are compared with the optimization hybrid algorithm (PSORSA). From this, it is clear that the proposed algorithm has less TLCC as compared to others. Two combinations of energy sources and storage technologies were considered, namely solar photovoltaic (PV)/battery and solar PV/fuel cell (FC). The results showed that the solar PV/FC combination is more cost-effective, reliable, and efficient than the solar PV/battery combination. Additionally, the IHRES strategy was found to be more economically viable than the single energy source system, with lower total life cycle costs and greater reliability and efficiency. Overall, the proposed IHRES model offers a promising solution for meeting energy demands in remote areas while reducing dependence on fossil fuels and promoting sustainable development.
Keywords:
solar photovoltaic; PV; FC; fuel cell; sustainable energy; green energy; energy harvesting; HOMER; battery; smart grids; TLCC1. Introduction
One of the essential components for a nation’s economic development is the availability of power. In many countries, 17% of people, particularly those in remote areas, still have no access to power [1]. The high costs of network transmission in remote regions often necessitate the use of diesel generators to meet load requirements. The high cost of diesel fuel, environmental pollution, and scarcity of fossil fuels make diesel power generation not always an affordable and effective option. The use of renewable energy has been investigated as a potential solution to this problem by many scholars in the past few years. The use of renewable energy systems, particularly solar PV systems, can be a viable alternative in isolated areas [2]. Solar PV systems can provide renewable and sustainable energy with minimum environmental impact. Furthermore, they are relatively easy to install, maintain, and operate. As a result, they are increasingly being adopted in rural and remote areas. Solar PV systems are also cost-effective and can reduce energy costs in the long run. Moreover, they are an important part of a clean energy future, helping to reduce carbon emissions and combat climate change. However, it is difficult to provide a steady load in remote regions since solar radiation is unpredictable, and solar systems depend on the climate. Therefore, for standalone locations, a PV system with an energy storage unit is a feasible approach. The battery is one of the most widely used forms of storage. In order to meet the demand for the load at the lowest possible cost and with the highest level of reliability, it is important to design the ideal configuration of the power scheme components for remote areas. In order to tackle these issues, effective modelling and an optimization technique are crucial.
Numerous studies have investigated the mathematical modeling, optimal size, and techno-economic analysis of hybrid energy designs based on solar energy. These studies have helped to identify cost-effective hybrid energy designs that can provide reliable energy supply. Additionally, they have led to an increased understanding of the potential of solar energy and its integration into existing energy systems. For a remote island, Javed et al. [2] optimized a hybrid solar/wind system with storage using a genetic algorithm. In comparison, the results were compared to those obtained using the software HOMER (hybrid optimization of multiple energy sources). This optimization showed significant improvement in energy efficiency, cost, and reliability. The study concluded that hybrid systems are more reliable and cost-effective than traditional energy systems. It also highlighted the potential of renewable energy sources to replace fossil fuels. In an Indian radio transmitter station, Das et al. [3] created a techno-economically ideal stand-alone hybrid solar/biogas/energy storage scheme using metaheuristic optimization.
The optimal sizing of hybrid solar energy systems has been investigated using a number of optimization techniques, such as HOMER software [4], genetic algorithms, tabu searches, simulated annealing, particle swarm searches, gray wolf searches, harmony searches, and global dynamic harmony searches. It has been studied that various theories and methods can be applied to power systems. A harmony search-based approach was suggested by Yu et al. [5] for determining the optimal capacity and location for off-grid PV/battery systems. An optimization algorithm based on harmony search performs better than one based on simulation annealing. The majority of renewable energy sources are not available 24 h a day in nature, so they cannot provide continuous power supply. Batteries are therefore essential to all renewable energy power generation and conversion systems [6]. The batteries available on the market today are lithium-based, which is heavy, toxic, and expensive to recycle. It is possible to solve all such problems by generating hydrogen from renewable energy sources (e.g., solar PVs), storing it, and using it as a fuel cell to create electricity when renewable sources are not available. However, current hydrogen technology is not efficient enough to be commercially viable. Research and development of a more efficient and cost-effective hydrogen generation and storage technology is needed to make hydrogen fuel cells a viable alternative to lithium-based batteries. Governments should invest in R&D to make hydrogen fuel cells and storage more affordable and efficient. This technology could then be used to power electronic devices and transportation with minimal environmental impact [7,8].
Prior studies have mostly concentrated on finding the most cost-effective hybrid solar energy system configurations. The effect of the reliability index (RI) on the hybrid energy system has also been studied in some research. In the past, studies typically performed techno-economic assessments using the HOMER software tool based on the input data of hybrid systems. Although changes in the modelling of the hybrid system’s components are limited, the HOMER software tools enable a fast assessment of hybrid energy systems. The HOMER tool has some limitations regarding the capacity to alter mathematical models and input data for various renewable energy systems. It is rare in earlier studies to examine the effects of important economic parameters and the reliability index when optimizing hybrid systems with a robust metaheuristic algorithm. This type of optimization can be used to improve the reliability and performance of hybrid systems. Furthermore, it can be used to reduce the cost of maintenance and operation of such systems. The main contribution of the manuscript is given below:
- A hybrid system configuration incorporating solar PV/battery energy storage and solar PV/fuel cell based methods is presented in this manuscript for an optimal hybrid system configuration.
- The optimization model presented in this article is used to accomplish a case study in Patiala.
- An altitude of 257 m places Patiala in southeastern Punjab, northwestern India at a position of 30.3398° N, 76.3869° E.
- The purpose of the paper is to minimize the total life cycle costs (TLCC).
- The TLCC is calculated by considering the cost of generation, installation, and operation of the system.
- The results show that the optimal hybrid system configuration can reduce the total cost as compared to the standalone solar PV system.
2. System Description
To analyze and quantify the cost of both systems, two models of HRES (Solar PV/Battery and Solar PV/FC) have been evaluated with HOMER (Version 3.14.0). The hourly electricity demand of the micro-grid was simulated for a period of twenty years, and the results were compared in terms of total life cycle cost (TLCC). Cost optimization was performed to identify the optimal configuration and evaluate the economic feasibility of both systems. For HOMER simulation to assess the optimization outcomes of these two models, additional input data is required, which is provided in the following section.
- Load Profile Data: As can be seen from Table 1, the baseline and scaled load on a daily basis has an average value of 175.47 kWh, the average (kW) load level with a scaled load level of 7.3 kW, the peak capacity load level with a scaled load level of 25.47 kW, and the load factor for the baseline, and scaled load level at 0.5 is assumed. Based on the annual load data presented in Table 2 and Table 3, the weekday and weekend loads are calculated.
- Battery Bank: The conventional approach to storing electrical energy is to use a battery bank. Assembling one or more batteries in order to store energy electrochemically is also considered electrochemical storage [9]. Using HOMER software, a battery is modelled as an energy storage system that can store a specified amount of direct current (DC) with a fixed energy efficiency round-trip. It determines whether a battery needs to be replaced based on the number of charge and discharge cycles [10]. The battery system can be used in various applications such as energy storage in renewable energy systems, power-grid support, uninterruptible power supply, and others. It is important to note that batteries have a finite lifespan and, thus, need to be replaced at regular intervals. To ensure batteries are replaced on time, a battery system can be used to monitor their condition. This system can also be used to alert when the battery needs to be replaced. Additionally, the system can be used to optimize battery performance. Table 4 represents the battery description which is used in the proposed model.
- Solar PV Panel: Electricity is generated by solar panels by absorbing sunlight. However, there are certain variables that affect the PV’s output, such as temperature and sunlight. Solar panel output is also affected by shading, dust, and dirt. To maximize the output, it is important to install the panels in a location that receives direct sunlight and is not affected by shade. Regularly cleaning the panels can help maintain their efficiency. Panels should also be angled correctly to maximize the amount of sunlight received. Additionally, panels should be installed in areas with low temperatures to ensure optimal performance.
- Fuel Cell: An electro-chemical device that converts chemical energy into electrical energy is called a fuel cell (FC). Fuel cells are available in a variety of configurations based on the types of electrodes, operating characteristics, and power ranges they operate at. Fuel cells can be used to generate power for a wide range of applications from home heating and cooling systems to electric vehicles. Additionally, fuel cells are clean and efficient sources of energy, producing no emissions and creating no waste. Among the variety of FCs available on the market, Proton Exchange Membrane Fuel Cells (PEMFCs) are the most commonly used due to their excellent start-up time and low operating temperature. PEMFCs are also known for their high energy efficiency and low emissions, making them an ideal choice for clean energy applications. Additionally, they are relatively compact and lightweight, making them suitable for powering vehicles, portable electronics, and other applications. PEMFCs are also relatively inexpensive compared to other types of fuel cells, making them a cost-effective option for many applications. Furthermore, they are relatively low-maintenance, making them an attractive option for many users.
- Electrolyzer: Carbon-free hydrogen can be produced from renewable energy sources by electrolysis. The electrolysis process involves splitting water into hydrogen and oxygen using electricity. During this reaction, an electrolyzer is used. An electrolyzer can range in size from a small appliance that can be used to manufacture hydrogen at a small scale to a large scale, central production facility that can be connected directly to renewable or non-greenhouse gas-emitting electricity sources. The hydrogen produced by electrolysis is considered to be a clean energy source, as there are no carbon emissions generated during the production process. This makes it an attractive alternative to traditional fossil fuels. Additionally, hydrogen can be stored and used as a fuel for transportation. Furthermore, hydrogen can be produced from renewable sources such as solar, wind, and water, making it an even greener option. Hydrogen also has a high energy density and can be used in stationary power plants.
- Hydrogen Storage Tank: Hydrogen is stored in hydrogen tanks and supplied to fuel cells for energy generation after it is produced by the electrolyzer [11]. During a day, hydrogen is produced by the electrolyzer and stored in the hydrogen tank, which is used when there is no PV generation. The stored hydrogen is then used as a source of renewable energy, which is converted into electrical energy by the fuel cell. This electrical energy can then be used to power the electric vehicle or stored in the battery for later use.
2.1. Methodology
The proposed system is optimized, simulated, and modeled using HOMER software. The results from this process allowed us to analyze the performance of the system. We then used this information to make adjustments and improve the system’s efficiency. Finally, we validated the system to ensure its accuracy and reliability. As discussed below, two cases are examined in this manuscript:
Case 1: Solar PV/Battery: Figure 1 shows the IHRES consisting of solar photovoltaics and a battery bank. In this case, solar PV is the primary source of supply, while batteries serve as a storage medium.
Case 2: Solar PV/Fuel Cell: As shown in Figure 2, IHRES consists of solar photovoltaic and a fuel cell. In this scenario, solar PV and fuel cells make up the majority of the supply. Fuel cells are also being used for energy storage.
2.2. System Modelling
- Solar PV Model: Based on Equation (1), a solar PV panel’s power output (depends on solar radiation) is proportional to the amount of sunlight it receives.
Solar PV panel rating is represented by ; loss factor or derating is represented by , due to dirt, shadows, temperature, etc.; the hourly solar radiation incident at the surface of solar PV panels (W/m2) is represented by ; and standard incident radiation (1000 W/m2) by .
Converter: When a system contains AC and DC components, DC to AC and AC to DC power converters are required. Fuel cells, solar PV panels, and batteries produce DC output while AC load is considered. Upon the peak load demand , converter size is taken. As shown in Equation (2), the inverter rating is calculated as follows:
where the efficiency of the inverter is denoted by .
- Battery Bank: During times when the power from renewable systems is insufficient or absent, a battery is used to store excess energy. An accurate estimation of the state of charge (SOC) can lead to the measurement of energy. Equation (3) can be used to calculate the SOC of a battery:
A battery’s input/output voltage is denoted by , the battery’s efficiency by , and its voltage by . A positive value indicates that the battery is charging, while a negative value indicates it is discharging. Equation (4) gives you the round-trip efficiency of a battery:
The charging efficiency and discharging efficiency of the battery are depicted in [12]. It is estimated that the battery has a round-trip efficiency of 92%. Additionally, discharging and charging efficiencies are assumed to be different and calculated as 100% and 85%, respectively. As shown in Equation (5), SOCmax is the maximum value of SOC and equals the aggregate capacity of the battery bank :
Single battery capacity should be denoted as , total battery number should be denoted as , and number of batteries connected in series should be denoted as . SOCmin is the minimum discharge limit that can be reached by the battery bank. System constraints can be applied according to the usage of the battery bank. Batteries are connected in series in order to achieve desired bus voltage. As shown in Equation (6), a series of batteries is calculated as follows:
An individual battery’s voltage is represented by . In battery modeling, the maximum charge or discharge power at any given time is also a major factor. Equation (7) calculates maximum charge current based on maximum charge current:
where the maximum charge current in amperes is denoted as .
- Fuel Cell: In hydrogen fuel cells, chemical energy is converted directly into electric power, while at the same time, heat and water are produced as by-products as long as fuel is available. Hydrogen fuel cells are considered to be a clean and renewable source of energy, as they do not emit any greenhouse gases [13]. They are also highly efficient, with some fuel cells achieving up to 80% efficiency. The anode and cathode chemical reactions are shown in equations 8 to 10. By combining reactions on both electrodes, the entire reaction may be obtained.
The anode’s chemical reaction is as follows:
The cathode’s chemical reaction is as follows:
The overall chemical reaction is as follows:
Across the membrane, hydrogen gas dissociates into protons and electrons at an anode on the left, forming the concentration gradient between the electrodes. The gradient causes protons to diffuse across the membrane while leaving electrons behind. In relation to the anode, the cathode becomes positively charged when protons drift towards it. Since the membrane prevents electrons from passing through, the remaining electrons are drawn to the positively charged cathode, causing current to flow the other way. According to Equation (11), fuel cells produce the following voltage:
Equation (12) shows the maximum voltage that can be generated by a cell given a reversible open circuit voltage, an ohmic voltage drop, an activation voltage drop, and a concentration voltage drop.
where is an electric work which is called Gibbs free energy; the number of moles is denoted by n; F is a Faraday’s constant; specific entropy is denoted by ; absolute temperature is denoted by T; is taken as 25 °C; are pressure of pure oxygen, hydrogen, and H2O as fuel; and R is gas constant, respectively. Equation (13) shows the total power output of a stack of fuel cells :
In a stack of fuel cells, and represent rating and current, respectively.
A major component of fuel cell modeling for power generation is hydrogen mass flow rate . According to Equation (14), 1 kW fuel cells consume hydrogen in kg/h at the following mass flow rate:
The intercept coefficient t , . and of a fuel cell is measured in kilograms per hour per kW, and its rated capacity is measured in kilowatts. In the case of a fuel cell rating of 1 kW, taking into account and to be 0.0003 and 0.58 kg/h/kW, calculated is 0.059 kg/h. For a fuel cell to generate 1 kW of power, 0.059 kg of hydrogen is required per hour [14].
- Electrolyzer: The electrolyzer converts the surplus electricity from the PV panels into hydrogen, which is stored in a hydrogen tank and used to power the fuel cell. Hydrogen production by the electrolyzer is the primary aspect to consider. Equation (15) shows the mass flow rate of hydrogen produced by a 1 kW electrolyzer in kilograms per hour:
The heating value of hydrogen in MJ/kg, and the efficiency of the electrolyzer , and are 1 kW, MJ/kg, and kWh/kg, respectively. Electrolyzers are estimated to be 90% efficient [15]. The mass flow rate of hydrogen in an electrolyzer with 142 MJ/kg heating value will be 0.02268 kg/h/kW. Based on this, 1 kW electrolyzers produce 0.02268 kg/h hydrogen.
- Hydrogen Tank: The electrolyzer produces hydrogen that is stored in hydrogen tanks for use in fuel cells. As the electrolyzer produces hydrogen during the day, the hydrogen tank stores it, as well as supplying hydrogen to the fuel cell when no PV power is generated. A decision variable for the proposed system was the size of the hydrogen tank, in kilograms. t is , the time at which hydrogen is available to flow. As shown in Equation (16), hydrogen is available at a given time after being produced by the electrolyzer.
In Equation (15), is the power consumed by the electrolyzer, and is the mass flow rate of hydrogen produced in kg/h by a 1 kW electrolyzer. Equation (17) calculates this available hydrogen stored in a hydrogen tank:
where is the hydrogen in the tank at the previous hour. Hydrogen is used to generate power in a fuel cell. Equation (18) represents the mass flow rate of hydrogen taken from hydrogen tank by a fuel cell at a particular time:
Based on Equation (14), the mass flow rate of hydrogen consumed by 1 kW fuel cell is calculated in kg/h. Equation (19) calculates the remaining hydrogen in the hydrogen tank after taking hydrogen:
The amount of hydrogen in the tank at the time is .
2.3. Proposed Algorithm
2.3.1. Rat Search Algorithm (RSA)
Various sizes and weights of rats belonging to two species are studied in this study, which provides insights into their behavior as intelligent and social rodents. Among the activities they engage in within their territorial communities are grooming, tumbling, hopping, boxing, and chasing. It is not uncommon for rats to exhibit violent behavior during competitions for prey, resulting in fatalities. Mathematically modeling the aggressive behavior of rats during chases and battles is the focus of this research.
- Mathematical Modeling:
Chasing:
Animals such as rats engage in social agonistic behaviors to pursue prey in groups. For math modeling, we assume the most effective search agent knows where the prey is, and other search agents adjust their positions based on the best agent. In order to explain this mechanism, Equation (20) is introduced.
The rat’s position is denoted by , while the best optimal solution is denoted by . The values of B and D are specified by Equations (21) and (22).
where, z = 0, 1, 2, …..,
D = 2. rand ()
A parameter S represents a random number, while a parameter D represents a random number, with values [0, 2] and [1, 5], respectively. In the iterative process, B and D are responsible for optimizing the performance of these parameters during exploration and exploitation.
Fighting:
Rats engage in battles with their prey using Equation (23) as a mathematical representation.
The rat search algorithm updates the next position of the rat by utilizing equation . As a result, the optimal solution is maintained, and the locations of other search agents are adjusted in relation to it. In order to facilitate exploration and exploitation, the parameters B and D have been adjusted. RSA proposes a solution that can be obtained with a minimum amount of operators. The pseudo-code of the rat search algorithm is presented in Algorithm 1, and the flow chart of that algorithm is shown in Figure 3.
| Algorithm 1 Rat search algorithm pseudo-code |
| Input: Population of rat Output: Optimal Search agent Initialize the parameter B, D, and S. Calculate the fitness value of all search agents. is the best search agent. While (x < Maxiter) do. For each search agent do. Update the position of current search agent. End for Update parameter B, D, and S. Check if there is any search agent which goes beyond the boundary condition. Calculate the fitness of each search agent. , if the solution is better than the previous one. End while , End |
2.3.2. Hybrid Particle Swarm Optimization and Rat Search Algorithm (PSORSA)
We propose a hybrid approach to combine two algorithms for increased efficiency. Our approach enhances the precision of results achieved by RSA by leveraging PSO, which is a precursor algorithm to the class of optimization algorithms known as swarm algorithms. As a result of our hybrid method, the system is not trapped in local minimums and is also enhanced in accuracy. This enhances the speed of the system and ensures the system finds the global optimum within reasonable time. The combination of RSA and PSO thus provides a powerful hybrid approach to optimize the system. The hybrid method is also extremely cost effective, since it does not require a large amount of computational power to achieve the desired result. The combination of RSA and PSO thus provides a powerful and cost-effective solution to optimize the system. The flow chart of that algorithm is shown in Figure 4.
2.4. Objective Function and Constraints
Objective Function: A value that minimizes the total life cycle cost (TLCC) is the objective function. Costs associated with ongoing operation and maintenance (C&R) and capital and replacement (O&M) will be included in the total life cycle cost of the project. These costs should be weighed against the expected benefits of the project to determine the optimal value of the objective function. A variety of techniques, such as cost-benefit analysis, can be used to ensure a thorough evaluation of the project, which is given in Equation (24):
TLCC = C&R + O&M
In a mathematical model, the capital recovery cost (CRF) is determined based on the interest rate (j) and system life span (m), which occur at the beginning and during the duration of the project. The CRF is used to calculate the value of the project by taking into account the amount of money needed to pay off the initial investment. It is a key factor in determining the profitability of a project and is given in Equation (25):
Constraints: The number of solar PV panel, fuel cell, electrolyzer, hydrogen tank, and battery constraints and storage units are given in Equation (26a)–(26e):
where maximum number of solar PV panel is denoted by , maximum rating of fuel cell is denoted by ; maximum rating of electrolyzer is denoted by ; maximum rating of size of hydrogen tank is denoted by ; and maximum rating of size of battery is denoted by .
3. Results and Discussion HOMER Based
A case study is presented in Patiala using the optimization model. In the south-eastern part of Punjab, northwestern India, Patiala has an altitude of 257 m and is situated at 30.3398° N, 76.3869° E. The work focuses on two case studies, namely Solar PV/Battery-based system and Solar PV/Fuel Cell-based system [16,17]. Table 5 lists the specifications of the components of hybrid systems. To develop and implement a renewable-based hybrid energy system, the TLCC reliability index is of the utmost importance. In this manuscript, some parts of the suggested IHRES are evaluated for their ability to fulfill a community’s AC (Alternating Current) and DC (Direct Current) primary load requirements. The size of the bi-directional plant is determined by its peak load. Bi-directional converters are assumed to be 90% efficient. The HOMER software is used to calculate the cost of all the system components. In this study, we used five main parameters, such as the rating of the solar PV panel, the fuel cell, the battery, the electrolyzer, and the size of the hydrogen tank. Inverter size was not considered as an optimization parameter; it was selected based on peak load demand. It was assumed that the project would last 20 years at a 5% interest rate. The two cases are considered as discussed below:
Case 1: Solar PV/Battery Based System: According to Figure 1, IHRES consists of a solar photovoltaic system and a battery bank. A battery serves as a storage device in this case, with Solar PV as the main source of supply. Table 6 and Figure 5 show the overall system component cost for this case. The total capital, replacement, and O&M cost are 252,251, 68,375, and 31,153. From Table 6, it is observed that the TLCC of battery, converter, and solar PV is 136,213, 67,682, and 147,884, respectively, but the overall TLCC of the system is 351,779. The Figure 6 shows the TLCC of all the system for case 1.
Using HOMER software, the costs of the entire component were calculated of the proposed system. These parameters were then compared with the proposed algorithm, as well as their parent algorithms, as previously mentioned. The feasible and optimal solution was determined by ranking the parameters based on TLCC, as shown in Table 7. Table 7 displays the results in TLCC format for HOMER, RAT, PSO, GWO, and HHO case studies. While the proposed hybrid system took hours to simulate with HOMER, the simulation time was significantly reduced with the help of developed algorithms. From the results, it was concluded that the proposed algorithm outperformed both the parent algorithms, compared algorithm, and the HOMER simulation.
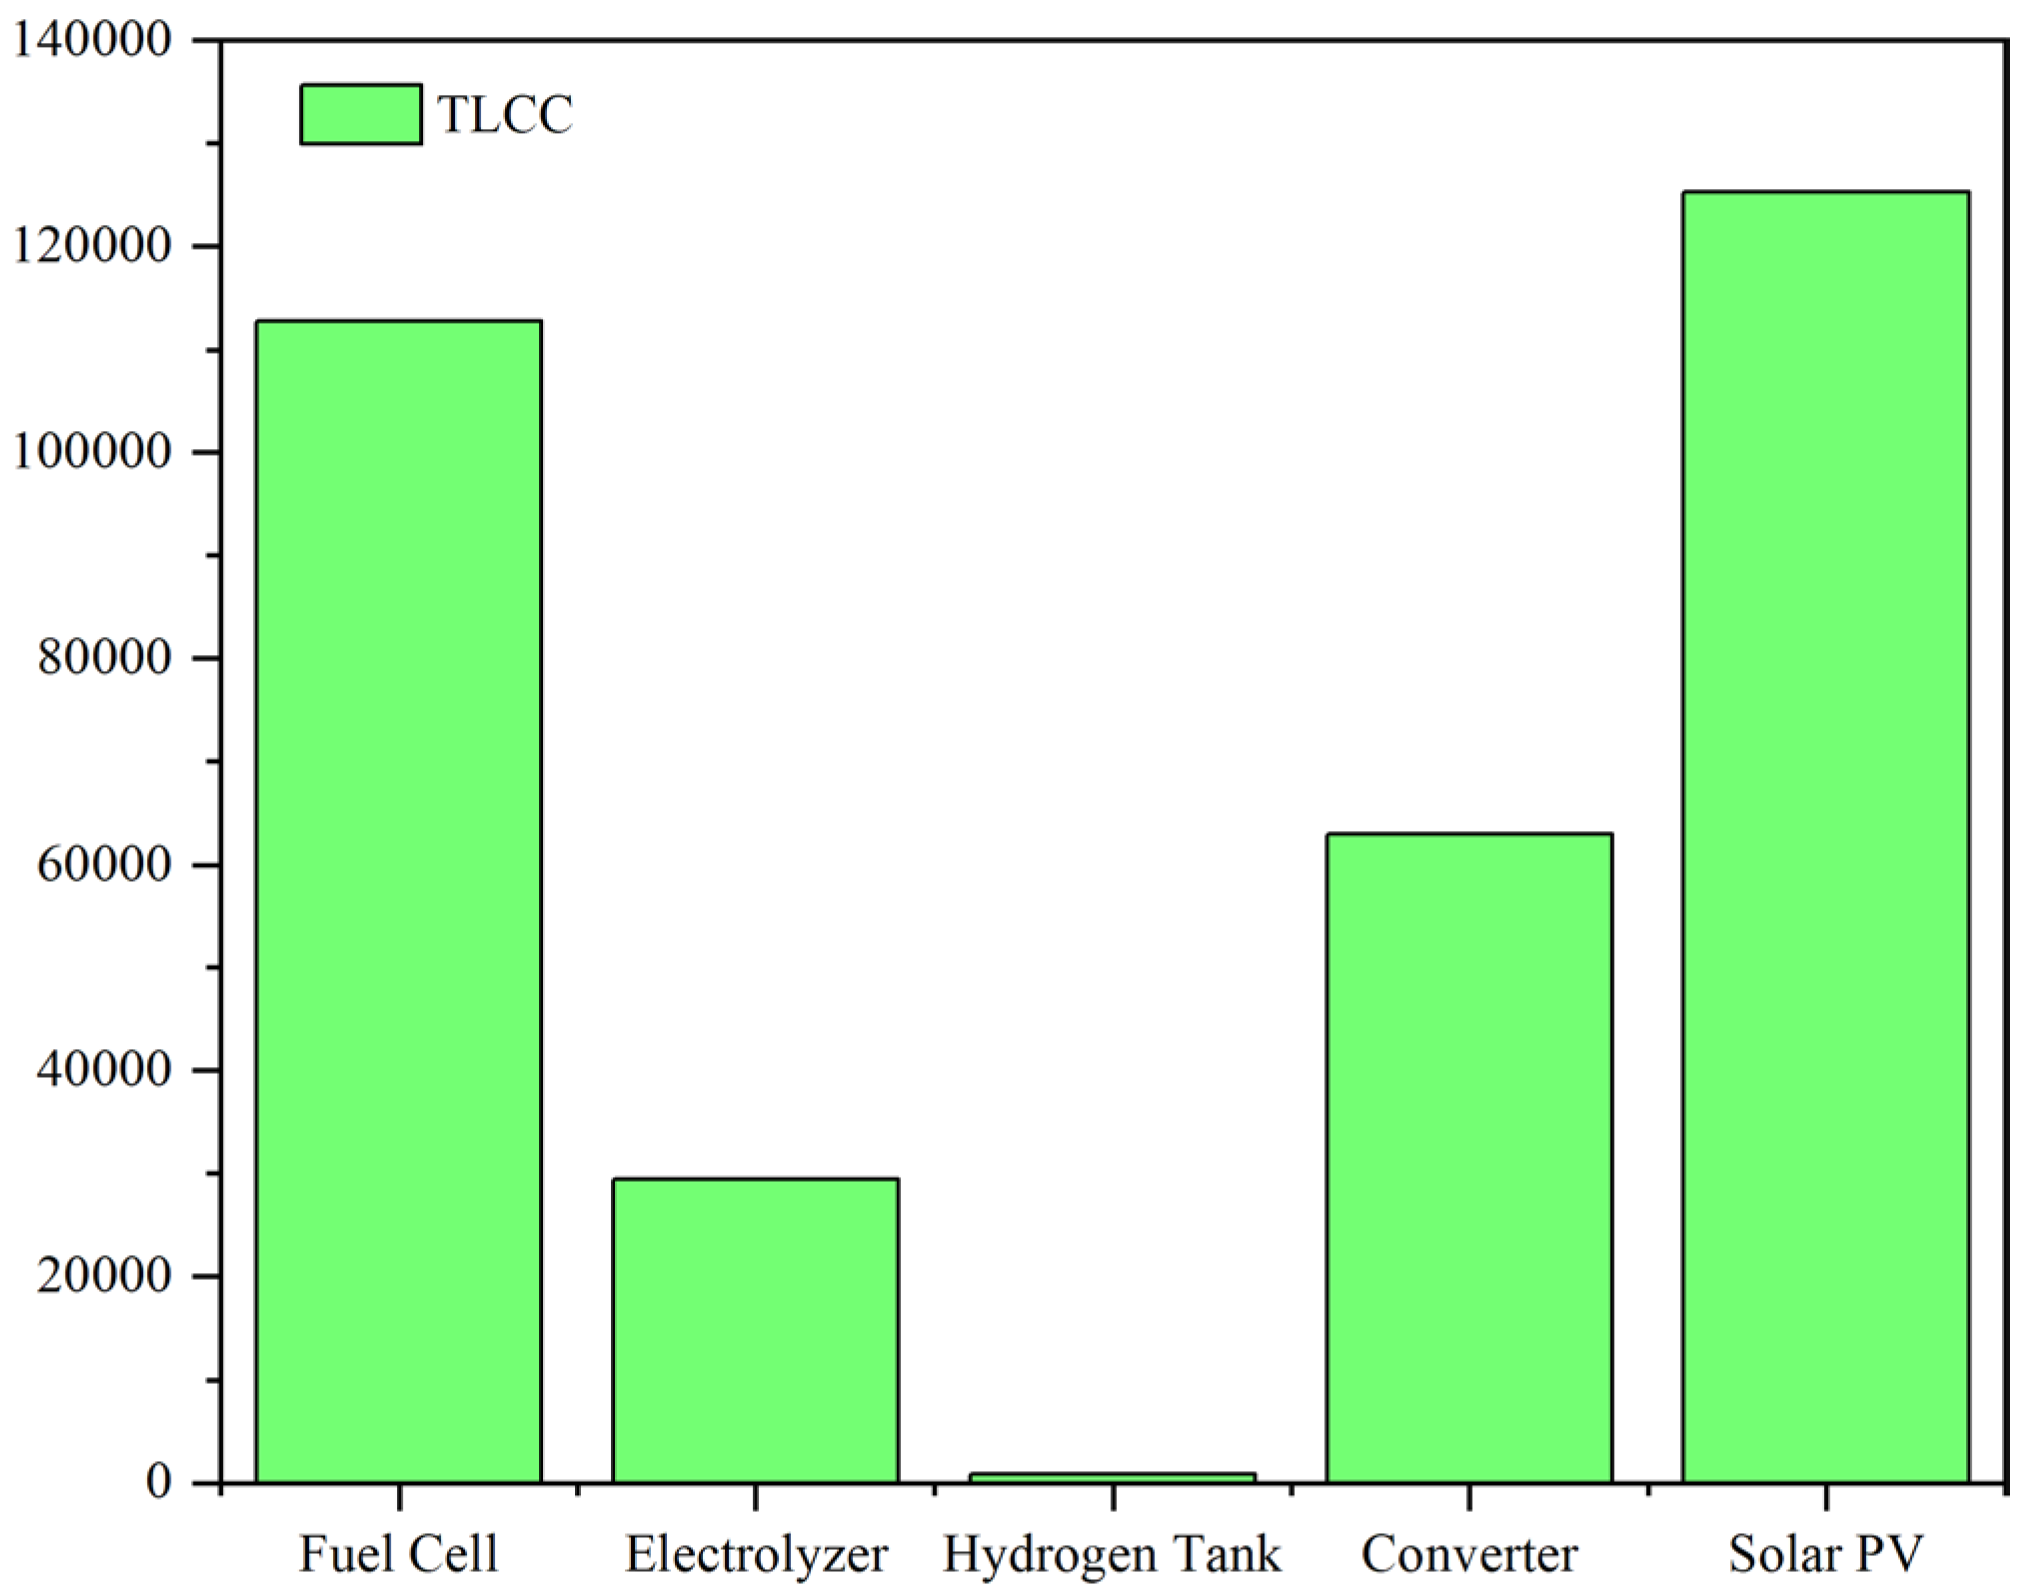
Case 2: Solar PV/Fuel Cell Based System: According to Figure 2, IHRES consists of solar photovoltaics and fuel cells. As a storage device, fuel cell is used in this case as a main source of supply in addition to Solar PV. Table 8 and Figure 7 show the overall system component cost for this case. The total capital, replacement, and O&M cost are 244,910, 62,569, and 23,893. From Table 8, it is observed that the TLCC of fuel cell, electrolyzer, hydrogen tank, converter, and solar PV is 112,825, 29,448, 890, 62,940, and 125,269, respectively, but the overall TLCC of the system is 331,372. Figure 8 shows the TLCC of all the system for Case 2.
Using HOMER software, the costs of the entire component were calculated for the proposed system. These parameters were then compared with the proposed algorithm, as well as their parent algorithms, as previously mentioned. The feasible and optimal solution was determined by ranking the parameters based on TLCC, as shown in Table 9. Table 9 displays the results in TLCC format for HOMER, RAT, PSO, GWO, and HHO case studies. While the proposed hybrid system took hours to simulate with HOMER, the simulation time was significantly reduced with the help of developed algorithms. From the results, it was concluded that the proposed algorithm outperformed both the parent algorithms, compared algorithm, and the HOMER simulation.
Based on the results obtained, the performance of the system presented in Case 2 is significantly better than that in Case 1. Based on the above comparison, the Case 2 is the more economical system. Case 2 has a lower cost of all the components, a lower TLCC overall, and a fuel cell instead of a battery, which is more economical.
Fuel cell systems with hydrogen as a fuel are gradually replacing lithium-ion batteries. It is possible for fuel cells to replace lithium-based batteries, which cause water and air pollution. It costs approximately five times more to produce a lithium-based battery that has been recycled than one that has been extracted from the ground. All battery manufacturing units are unconsciously extracting more and more lithium from the Earth, causing the Earth to become a ‘lithium dump’. There is real potential for fuel cells to qualify as technology that generates electricity with harmless byproducts. Hydrogen fuel cells have the advantages of scalability, low greenhouse gas emissions, and silent operation. Unlike a battery, the fuel cell does not self-discharge. It does not release any hazardous gases either. This makes it an ideal choice for powering electric vehicles, homes, and businesses. It can also be used in stationary applications such as backup power and grid-scale energy storage.
4. Conclusions and Outcomes
The aim of this manuscript is to provide an optimal configuration for stand-alone hybrid solar PV/battery systems and solar PV/fuel cell systems. According to the reliability index, the objective function is to minimize the total life cycle cost (TLCC). With the HOMER software, it has been possible to determine the optimal size of different components such as solar PV, fuel cells, converters, batteries, hydrogen tanks, and electrolyzers. It is obvious from the TLCC that Case 2 has a higher economic benefit than Case 1. Through proper sizing of components and efficient energy flow management between system components, a cost-effective AC/DC hybrid energy system can be designed. The HOMER software can help to identify the most cost-effective combination of components to meet the user’s energy needs. By optimizing the size and configuration of the system, the user can maximize the economic benefits and ensure a reliable energy supply. The HOMER software is an invaluable tool for designing AC/DC hybrid energy systems, as it can quickly analyze the various options and determine the most cost-effective solution. The HOMER software is used as a reference in the manuscript. The main disadvantage of HOMER software is that it takes lot of time to simulate the things to overcome that disadvantage optimization results are conducted. Here, it is seen that the proposed algorithm TLCC is lower than the rest of the compared algorithms as well as HOMER software. Furthermore, it can accurately predict the system’s performance and energy output.
Author Contributions
Conceptualization, M.K.S. and J.G.; methodology, M.K.S.; software, M.K.S. and J.G.; validation, M.H.A., A.J. and M.K.S.; formal analysis, M.H.A. and A.J.; investigation, A.J.; resources, M.K.S. and J.G.; writing—original draft preparation, M.K.S.; writing—review and editing, J.G., M.H.A. and A.J. All authors have read and agreed to the published version of the manuscript.
Funding
This research received no external funding.
Data Availability Statement
Not applicable.
Conflicts of Interest
The authors declare no conflict of interest.
References
- Ghasemi, A.; Enayatzare, M. Optimal energy management of a renewable-based isolated microgrid with pumped-storage unit and demand response. Renew. Energy 2018, 123, 460–474. [Google Scholar] [CrossRef]
- Javed, M.S.; Song, A.; Ma, T. Techno-economic assessment of a stand-alone hybrid solar-wind-battery system for a remote island using genetic algorithm. Energy 2019, 176, 704–717. [Google Scholar] [CrossRef]
- Das, M.; Singh, M.A.K.; Biswas, A. Techno-economic optimization of an off-grid hybrid renewable energy system using metaheuristic optimization approaches–case of a radio transmitter station in India. Energy Convers. Manag. 2019, 185, 339–352. [Google Scholar] [CrossRef]
- Mokhtara, C.; Negrou, B.; Settou, N.; Bouferrouk, A.; Yao, Y. Design optimization of grid-connected PV-Hydrogen for energy prosumers considering sector-coupling paradigm: Case study of a university building in Algeria. Int. J. Hydrogen Energy 2021, 46, 37564–37582. [Google Scholar] [CrossRef]
- Yu, X.; Li, W.; Maleki, A.; Rosen, M.A.; Birjandi, A.K.; Tang, L. Selection of optimal location and design of a stand-alone photovoltaic scheme using a modified hybrid methodology. Sustain. Energy Technol. Assess. 2021, 45, 101071. [Google Scholar] [CrossRef]
- Sawle, Y.; Gupta, S.C.; Kumar Bohre, A. PV-wind hybrid system: A review with case study. Cogent Eng. 2016, 3, 1189305. [Google Scholar] [CrossRef]
- Mahato, D.P.; Sandhu, J.K.; Singh, N.P.; Kaushal, V. On scheduling transaction in grid computing using cuckoo search-ant colony optimization considering load. Clust. Comput. 2020, 23, 1483–1504. [Google Scholar] [CrossRef]
- Rani, S.; Babbar, H.; Kaur, P.; Alshehri, M.D.; Shah, S.H.A. An optimized approach of dynamic target nodes in wireless sensor network using bio inspired algorithms for maritime rescue. IEEE Trans. Intell. Transp. Syst. 2022, 24, 2548–2555. [Google Scholar] [CrossRef]
- Hina, F.; Prabaharan, N.; Palanisamy, K.; Akhtar, K.; Saad, M.; Jackson, J.J. Hybrid-Renewable Energy Systems in Microgrids; Woodhead Publishing: Cambridge, UK, 2018. [Google Scholar]
- Lambert, T.; Gilman, P.; Lilienthal, P. Micropower system modeling with HOMER. Integr. Altern. Sources Energy 2006, 1, 379–385. [Google Scholar]
- Singh, S.; Chauhan, P.; Aftab, M.A.; Ali, I.; Hussain, S.S.; Ustun, T.S. Cost optimization of a stand-alone hybrid energy system with fuel cell and PV. Energies 2020, 13, 1295. [Google Scholar] [CrossRef]
- Singh, S.; Singh, M.; Kaushik, S.C. Feasibility study of an islanded microgrid in rural area consisting of PV, wind, biomass and battery energy storage system. Energy Convers. Manag. 2016, 128, 178–190. [Google Scholar] [CrossRef]
- Hemi, H.; Ghouili, J.; Cheriti, A. A real time fuzzy logic power management strategy for a fuel cell vehicle. Energy Convers. Manag. 2014, 80, 63–70. [Google Scholar] [CrossRef]
- Wu, K.; Zhou, H.; An, S.; Huang, T. Optimal coordinate operation control for wind–photovoltaic–battery storage power-generation units. Energy Convers. Manag. 2015, 90, 466–475. [Google Scholar] [CrossRef]
- Nehrir, M.H.; Wang, C.; Strunz, K.; Aki, H.; Ramakumar, R.; Bing, J.; Miao, Z.; Salameh, Z. A review of hybrid renewable/alternative energy systems for electric power generation: Configurations, control, and applications. IEEE Trans. Sustain. Energy 2011, 2, 392–403. [Google Scholar] [CrossRef]
- Nijhawan, P.; Singla, M.K.; Gupta, J. A proposed hybrid model for electric power generation: A case study of Rajasthan, India. IETE J. Res. 2021, 69, 1952–1962. [Google Scholar] [CrossRef]
- Nijhawan, P.; Singla, M.K.; Gupta, J. Site selection of solar PV power plant at Bathinda. Int. J. Recent Technol. Eng. 2020, 8, 5032–5038. [Google Scholar] [CrossRef]
Figure 1.
Proposed diagram for Case 1.

Figure 2.
Proposed diagram for Case 2.
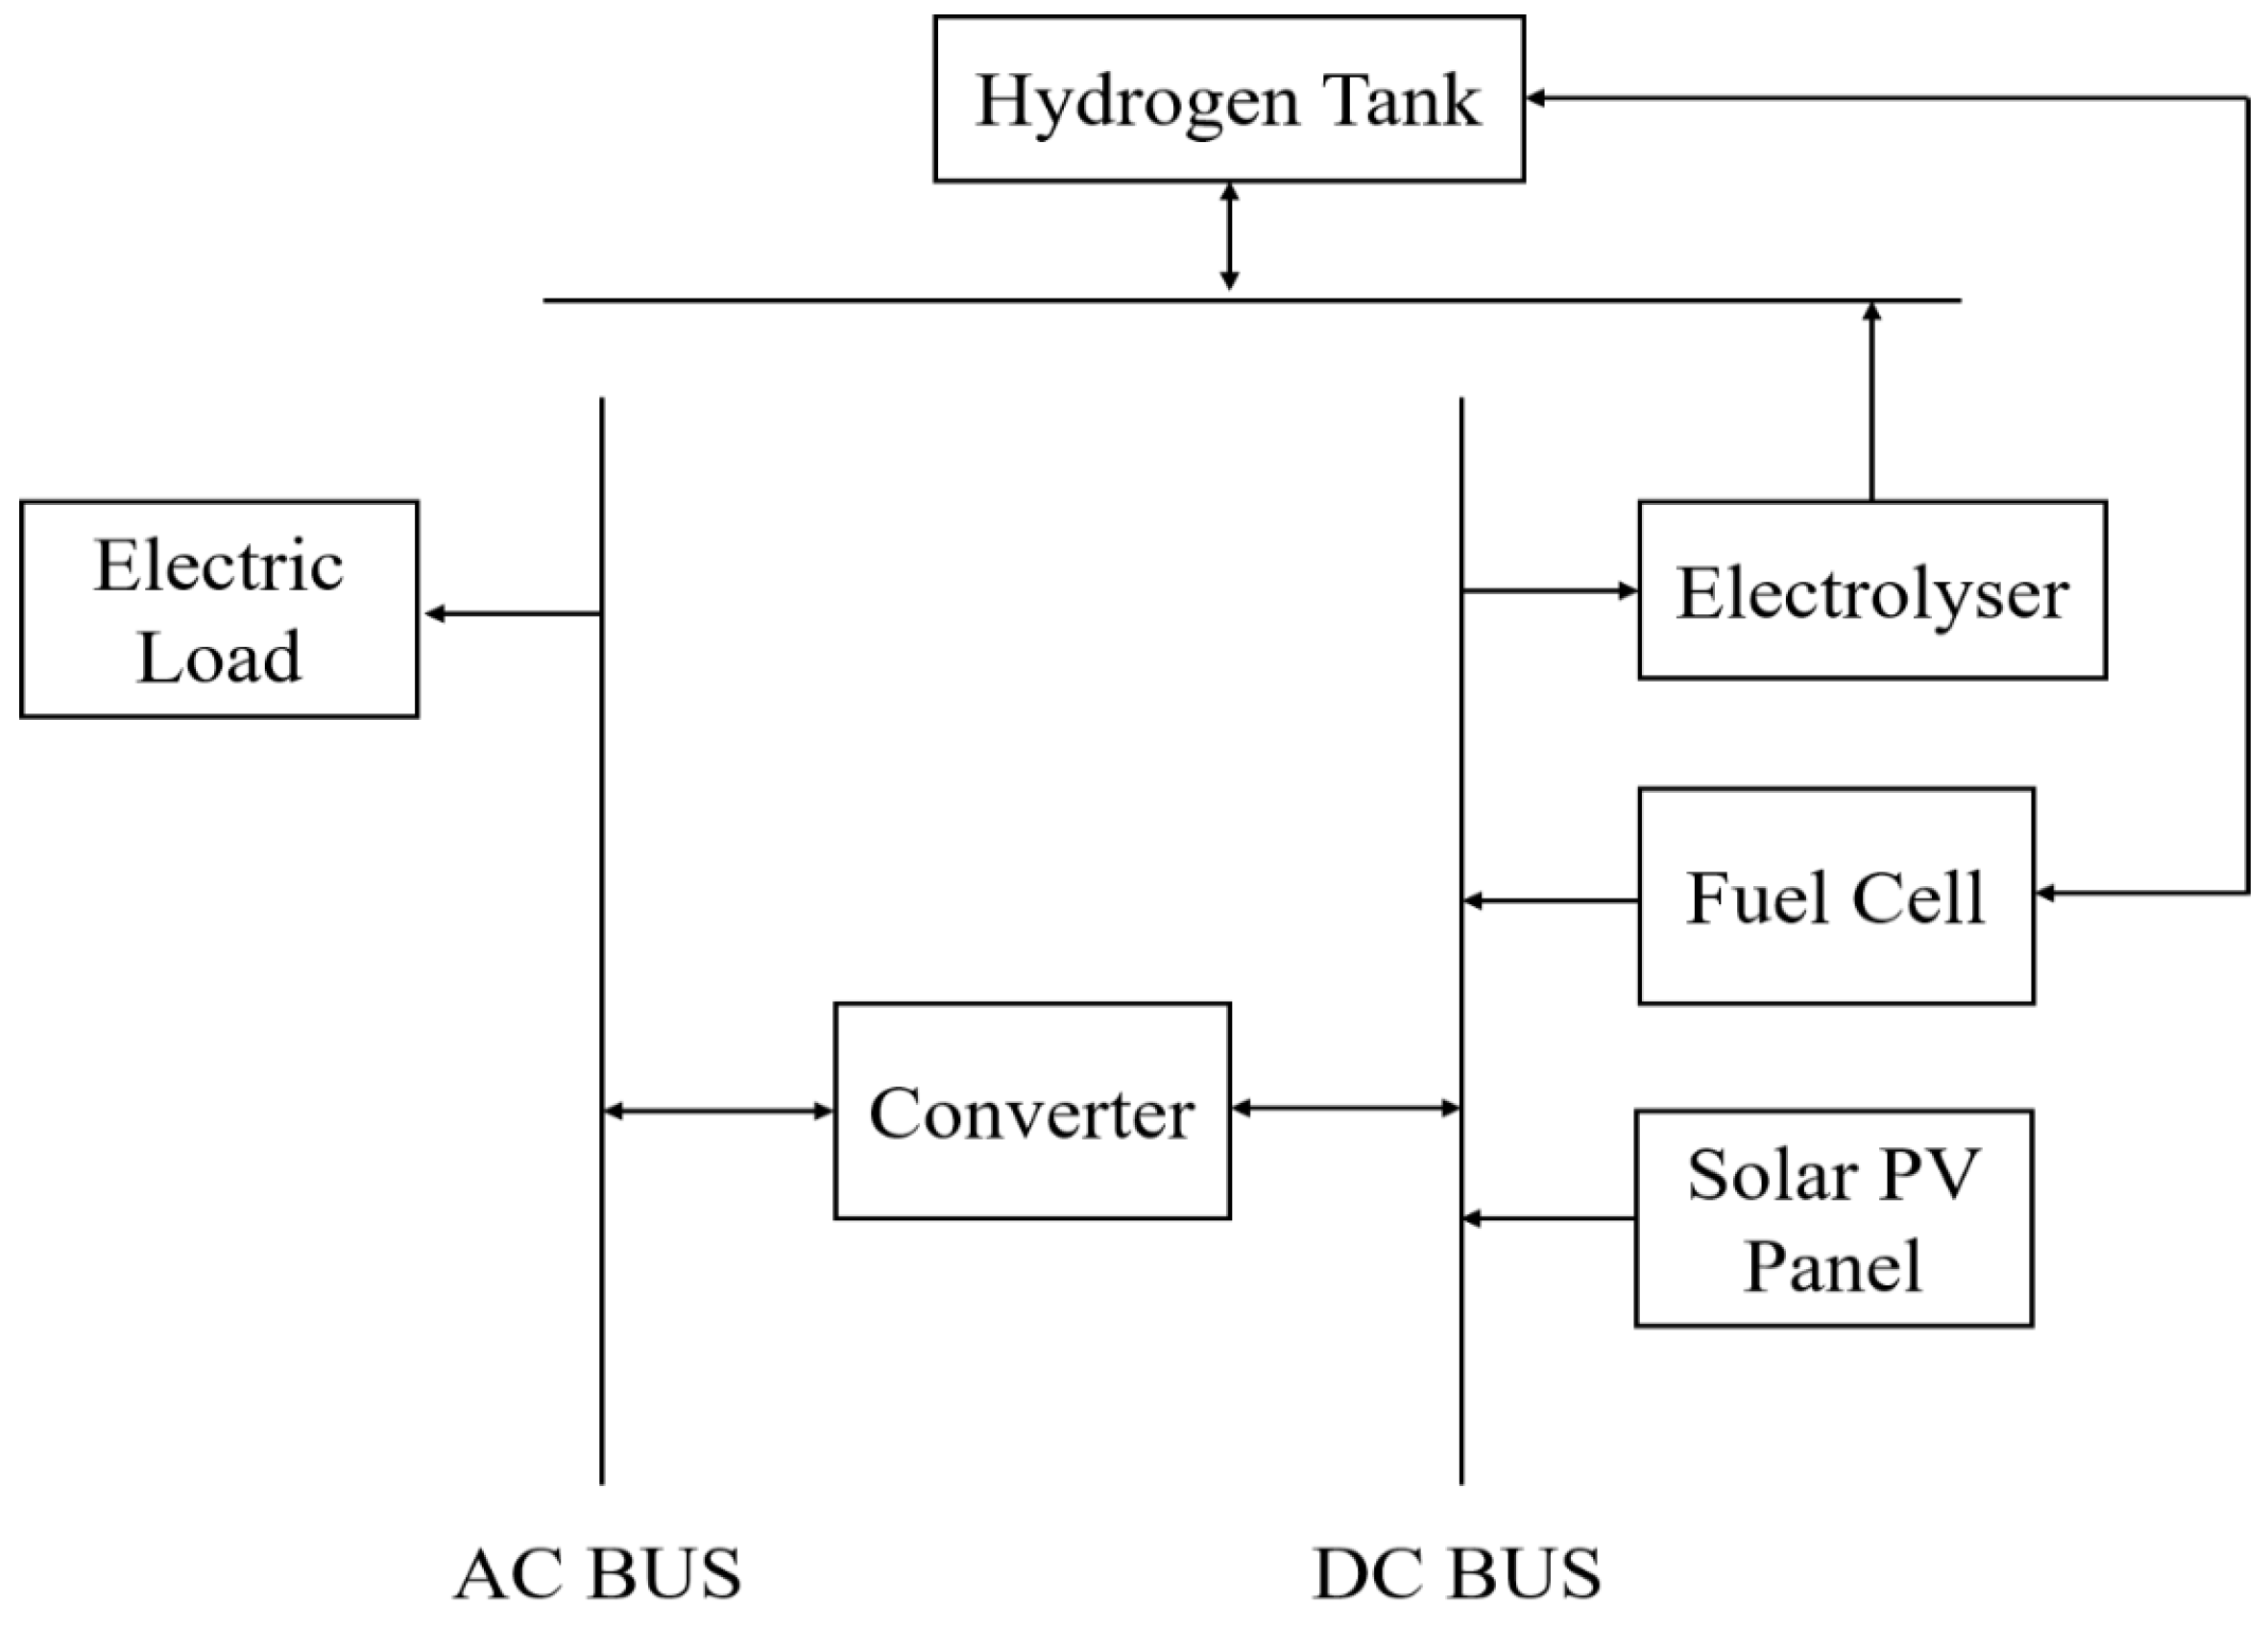
Figure 3.
Flow chart of RSA.
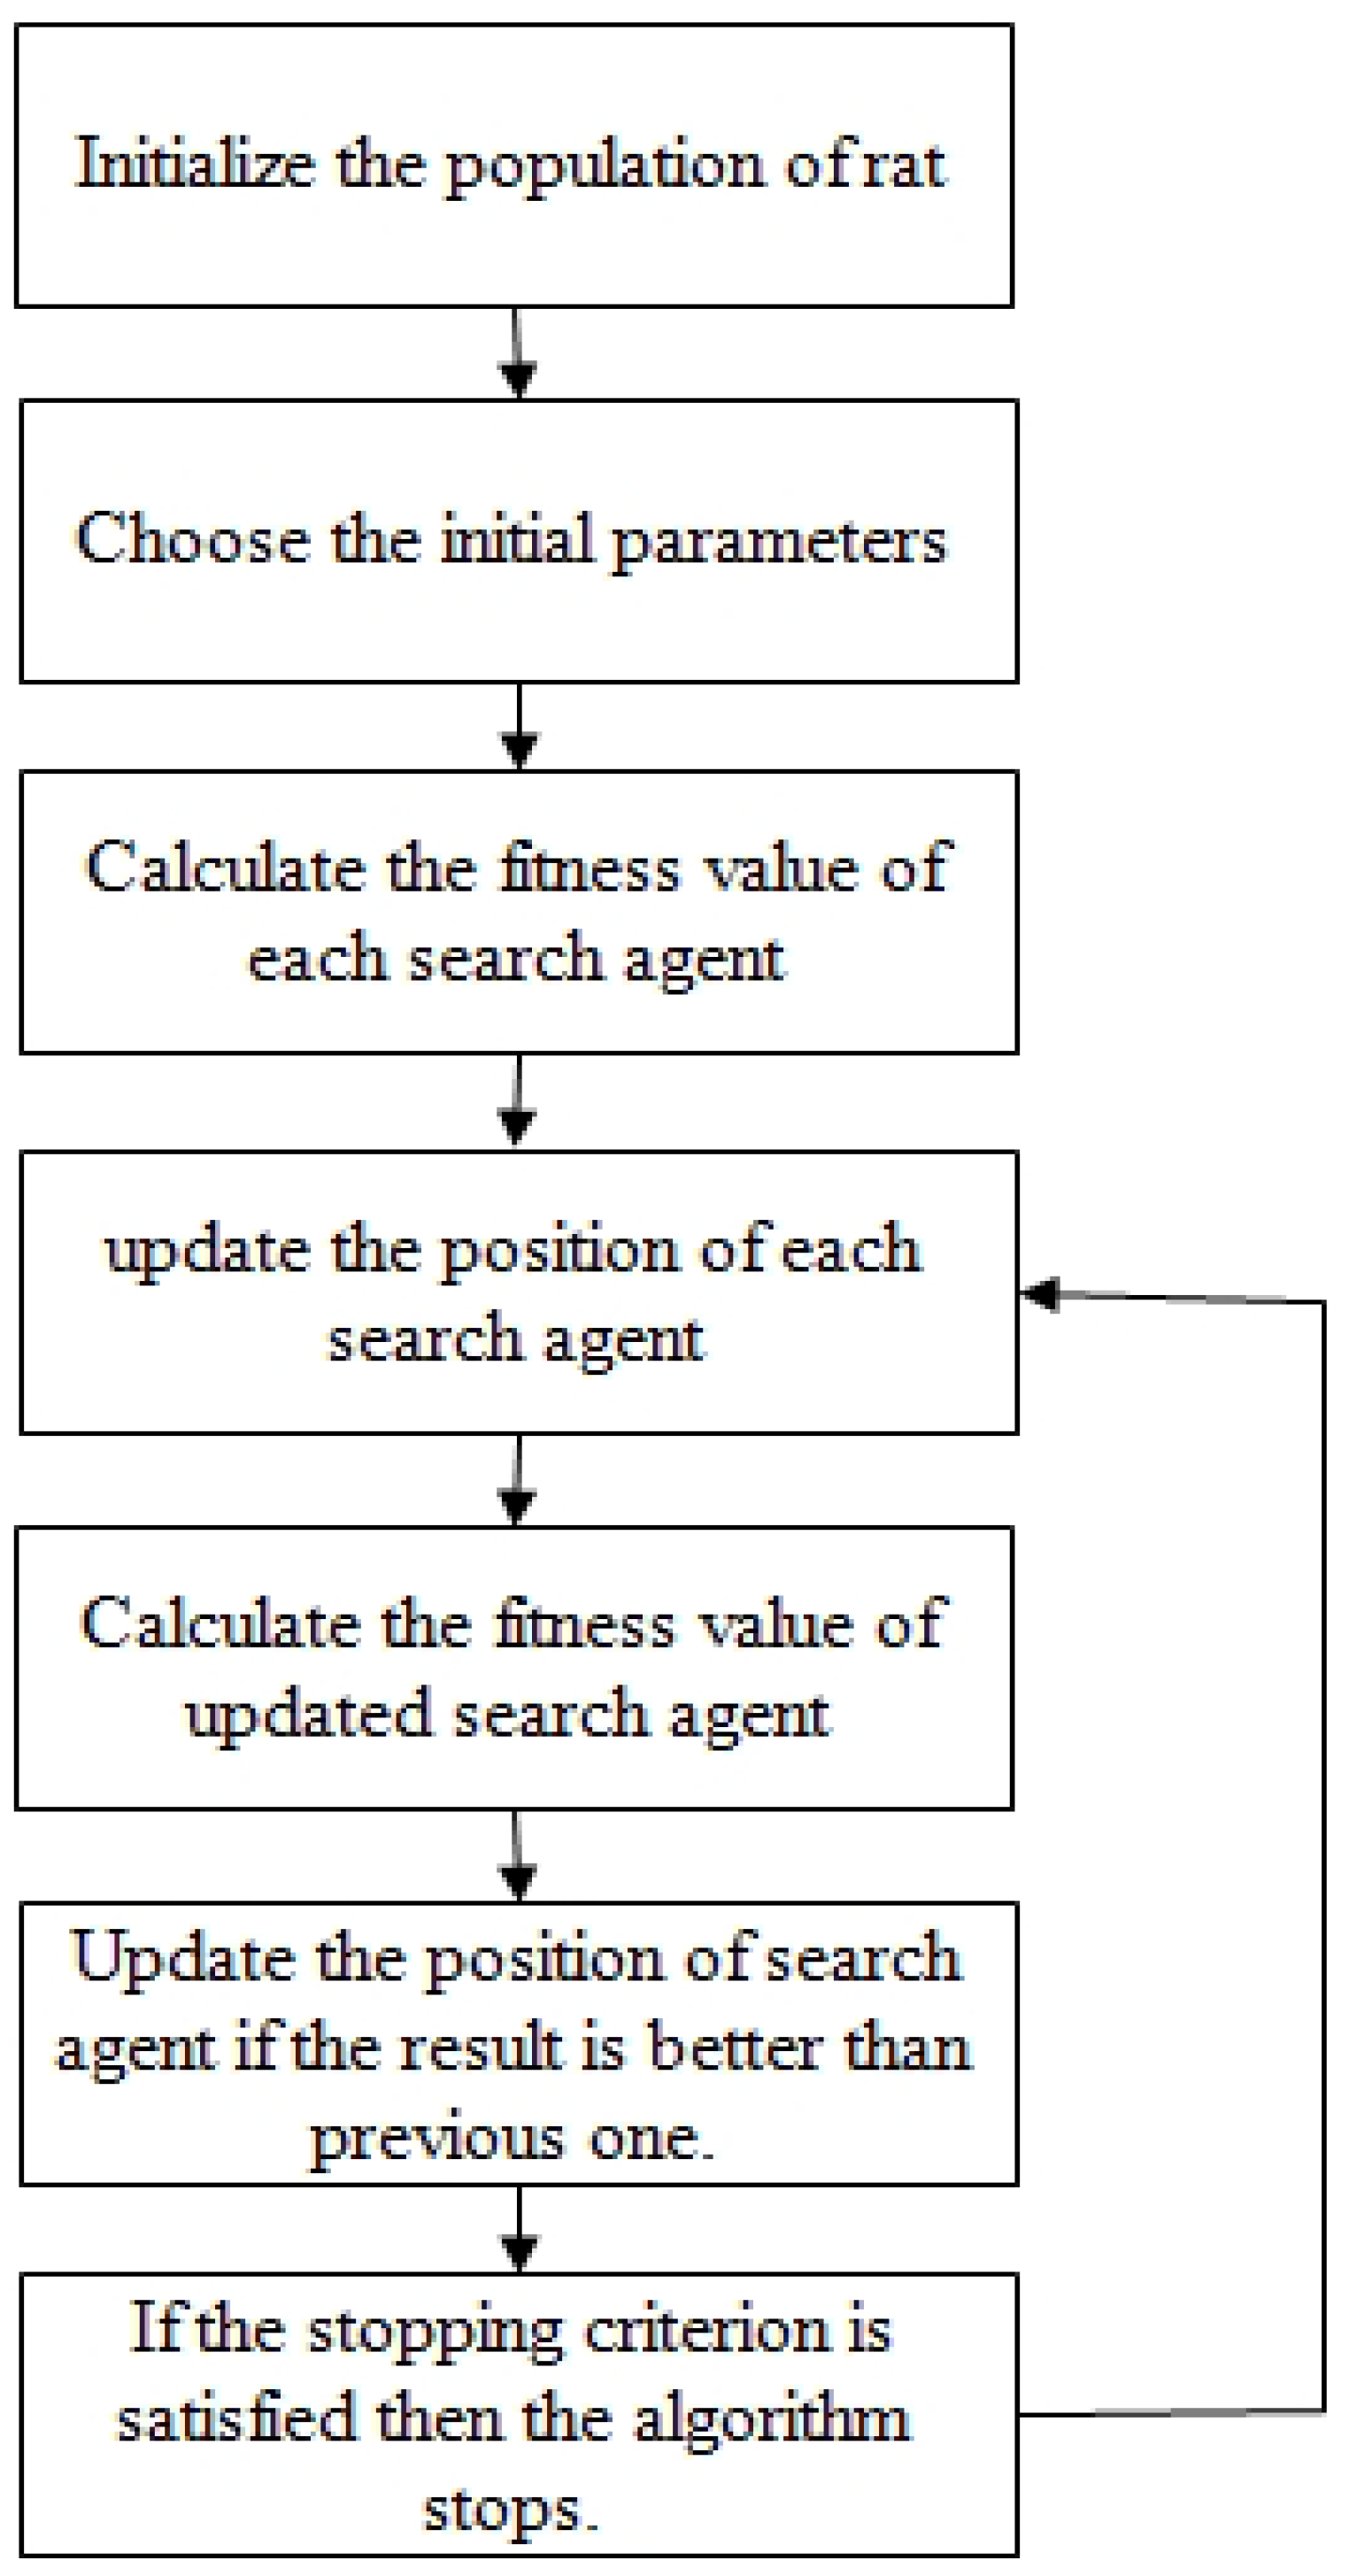
Figure 4.
Flow chart of PSORSA.
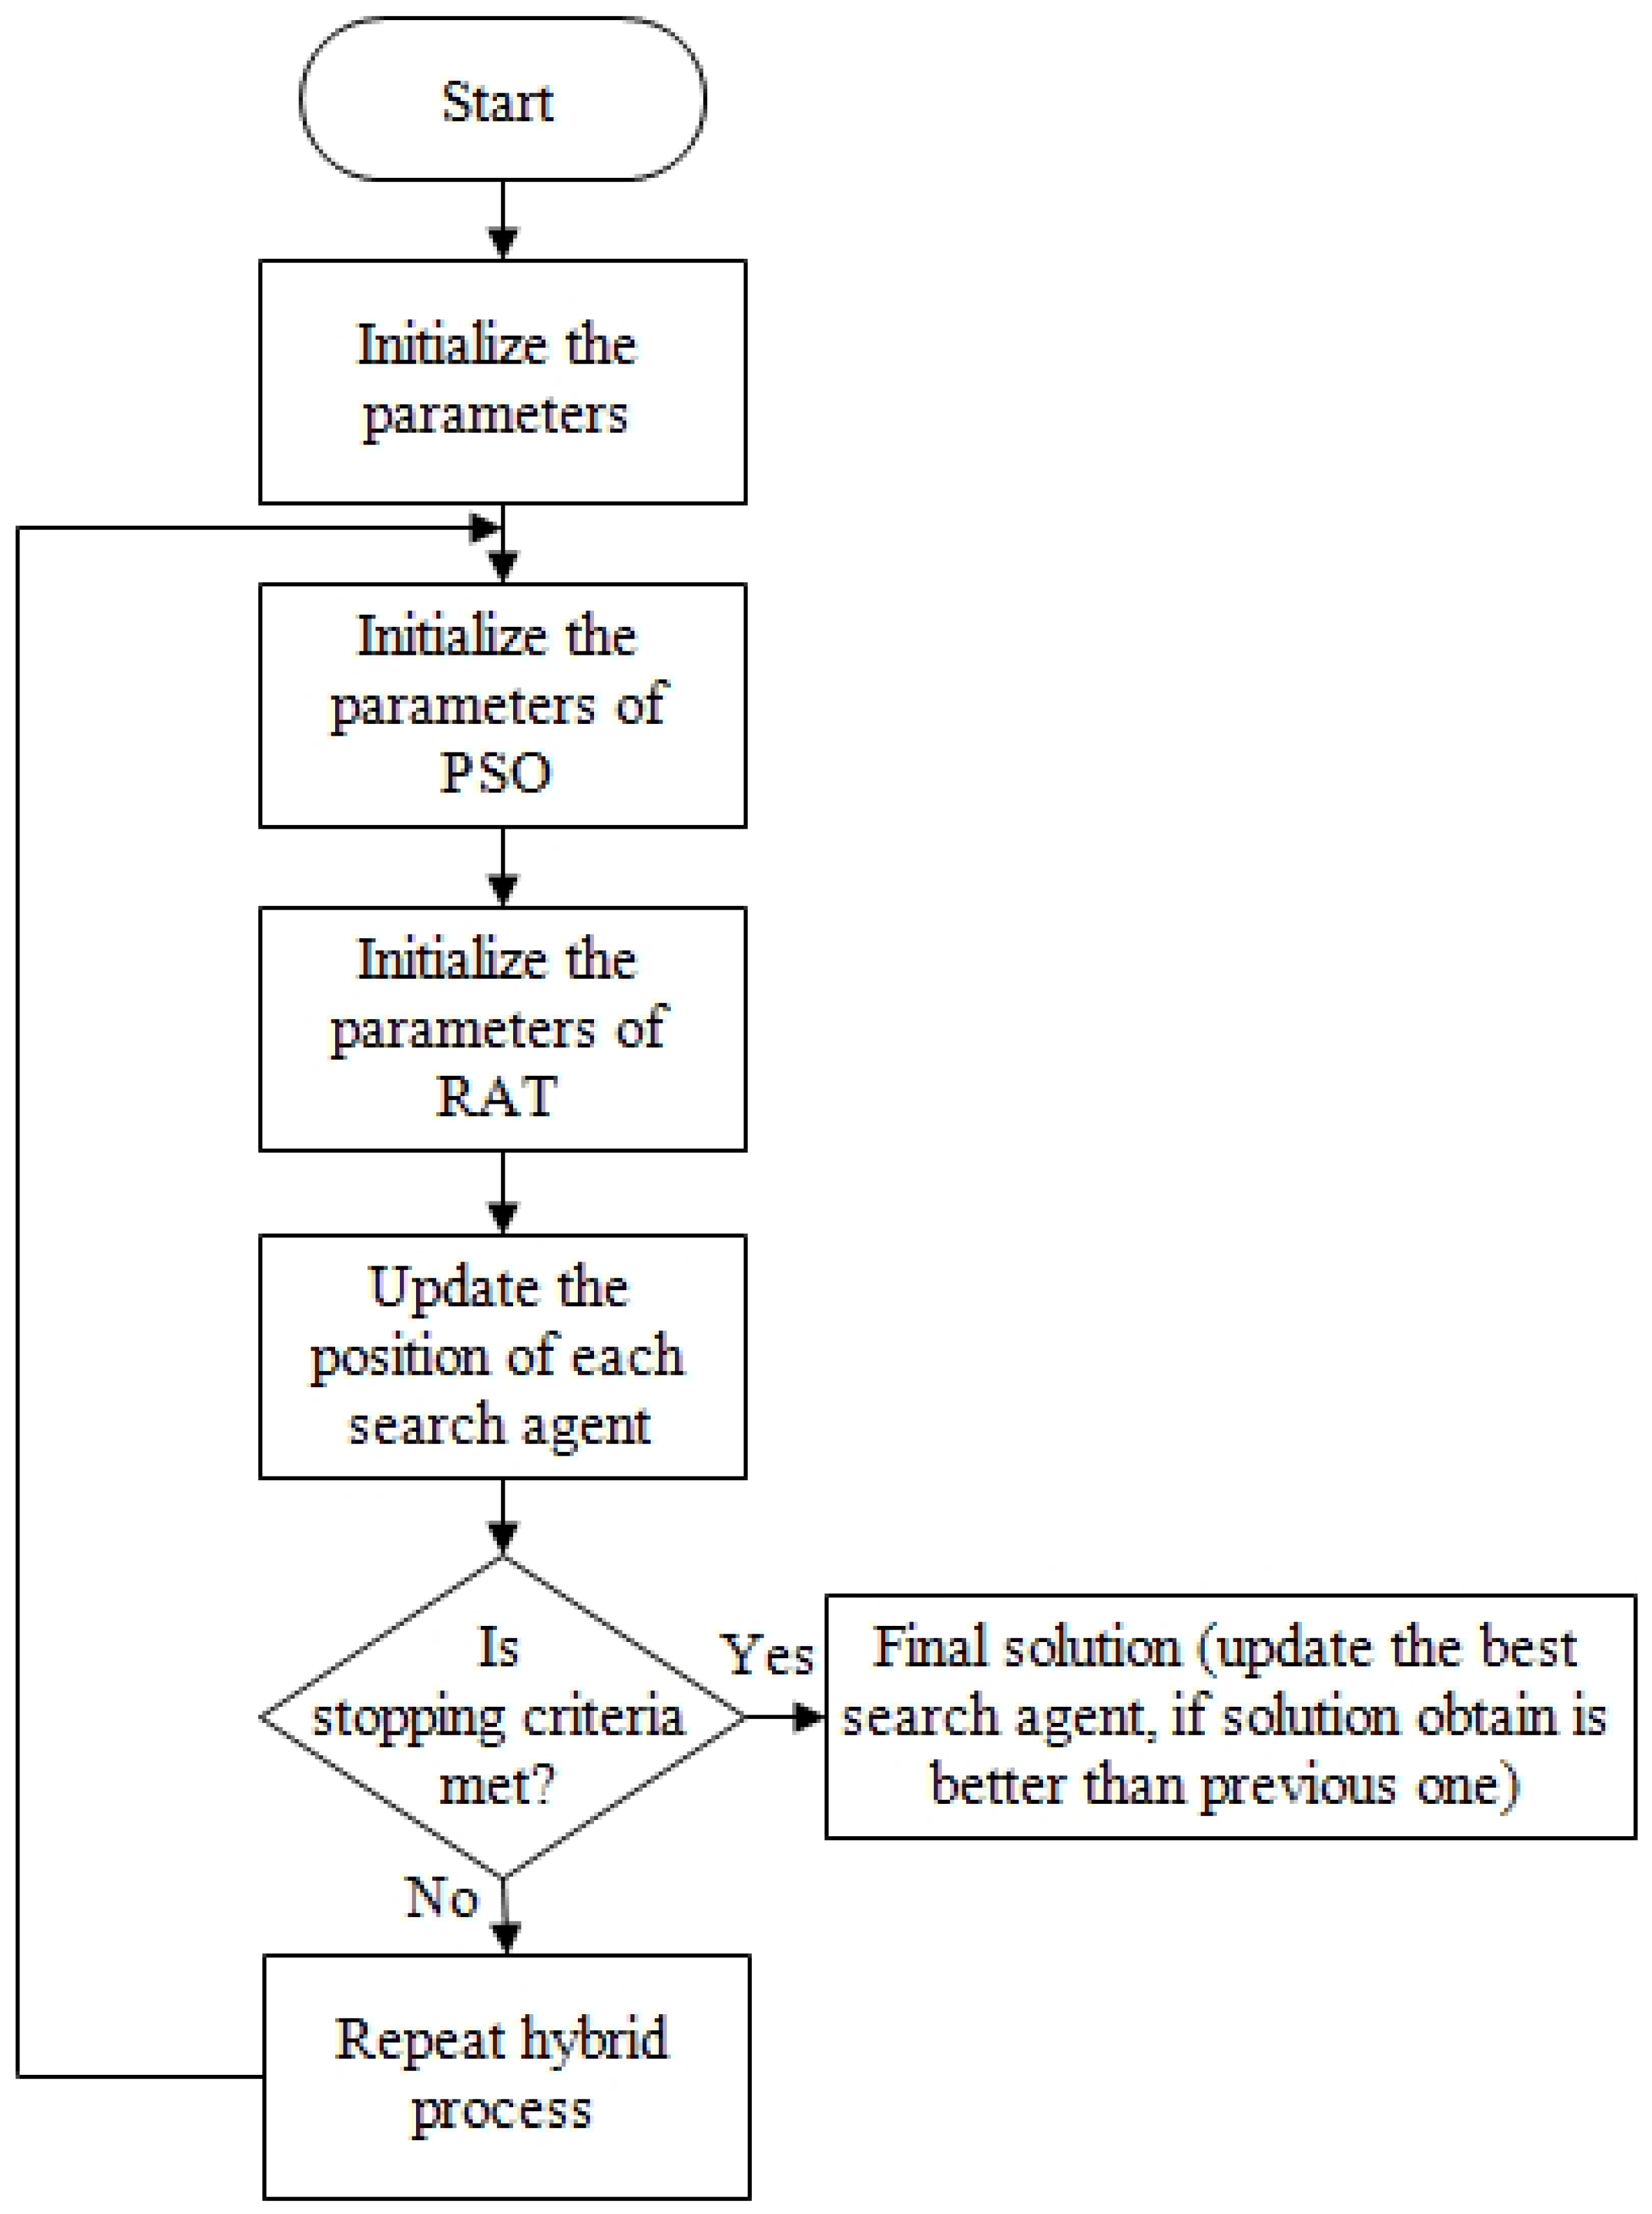
Figure 5.
Overall system component cost for Case 1.
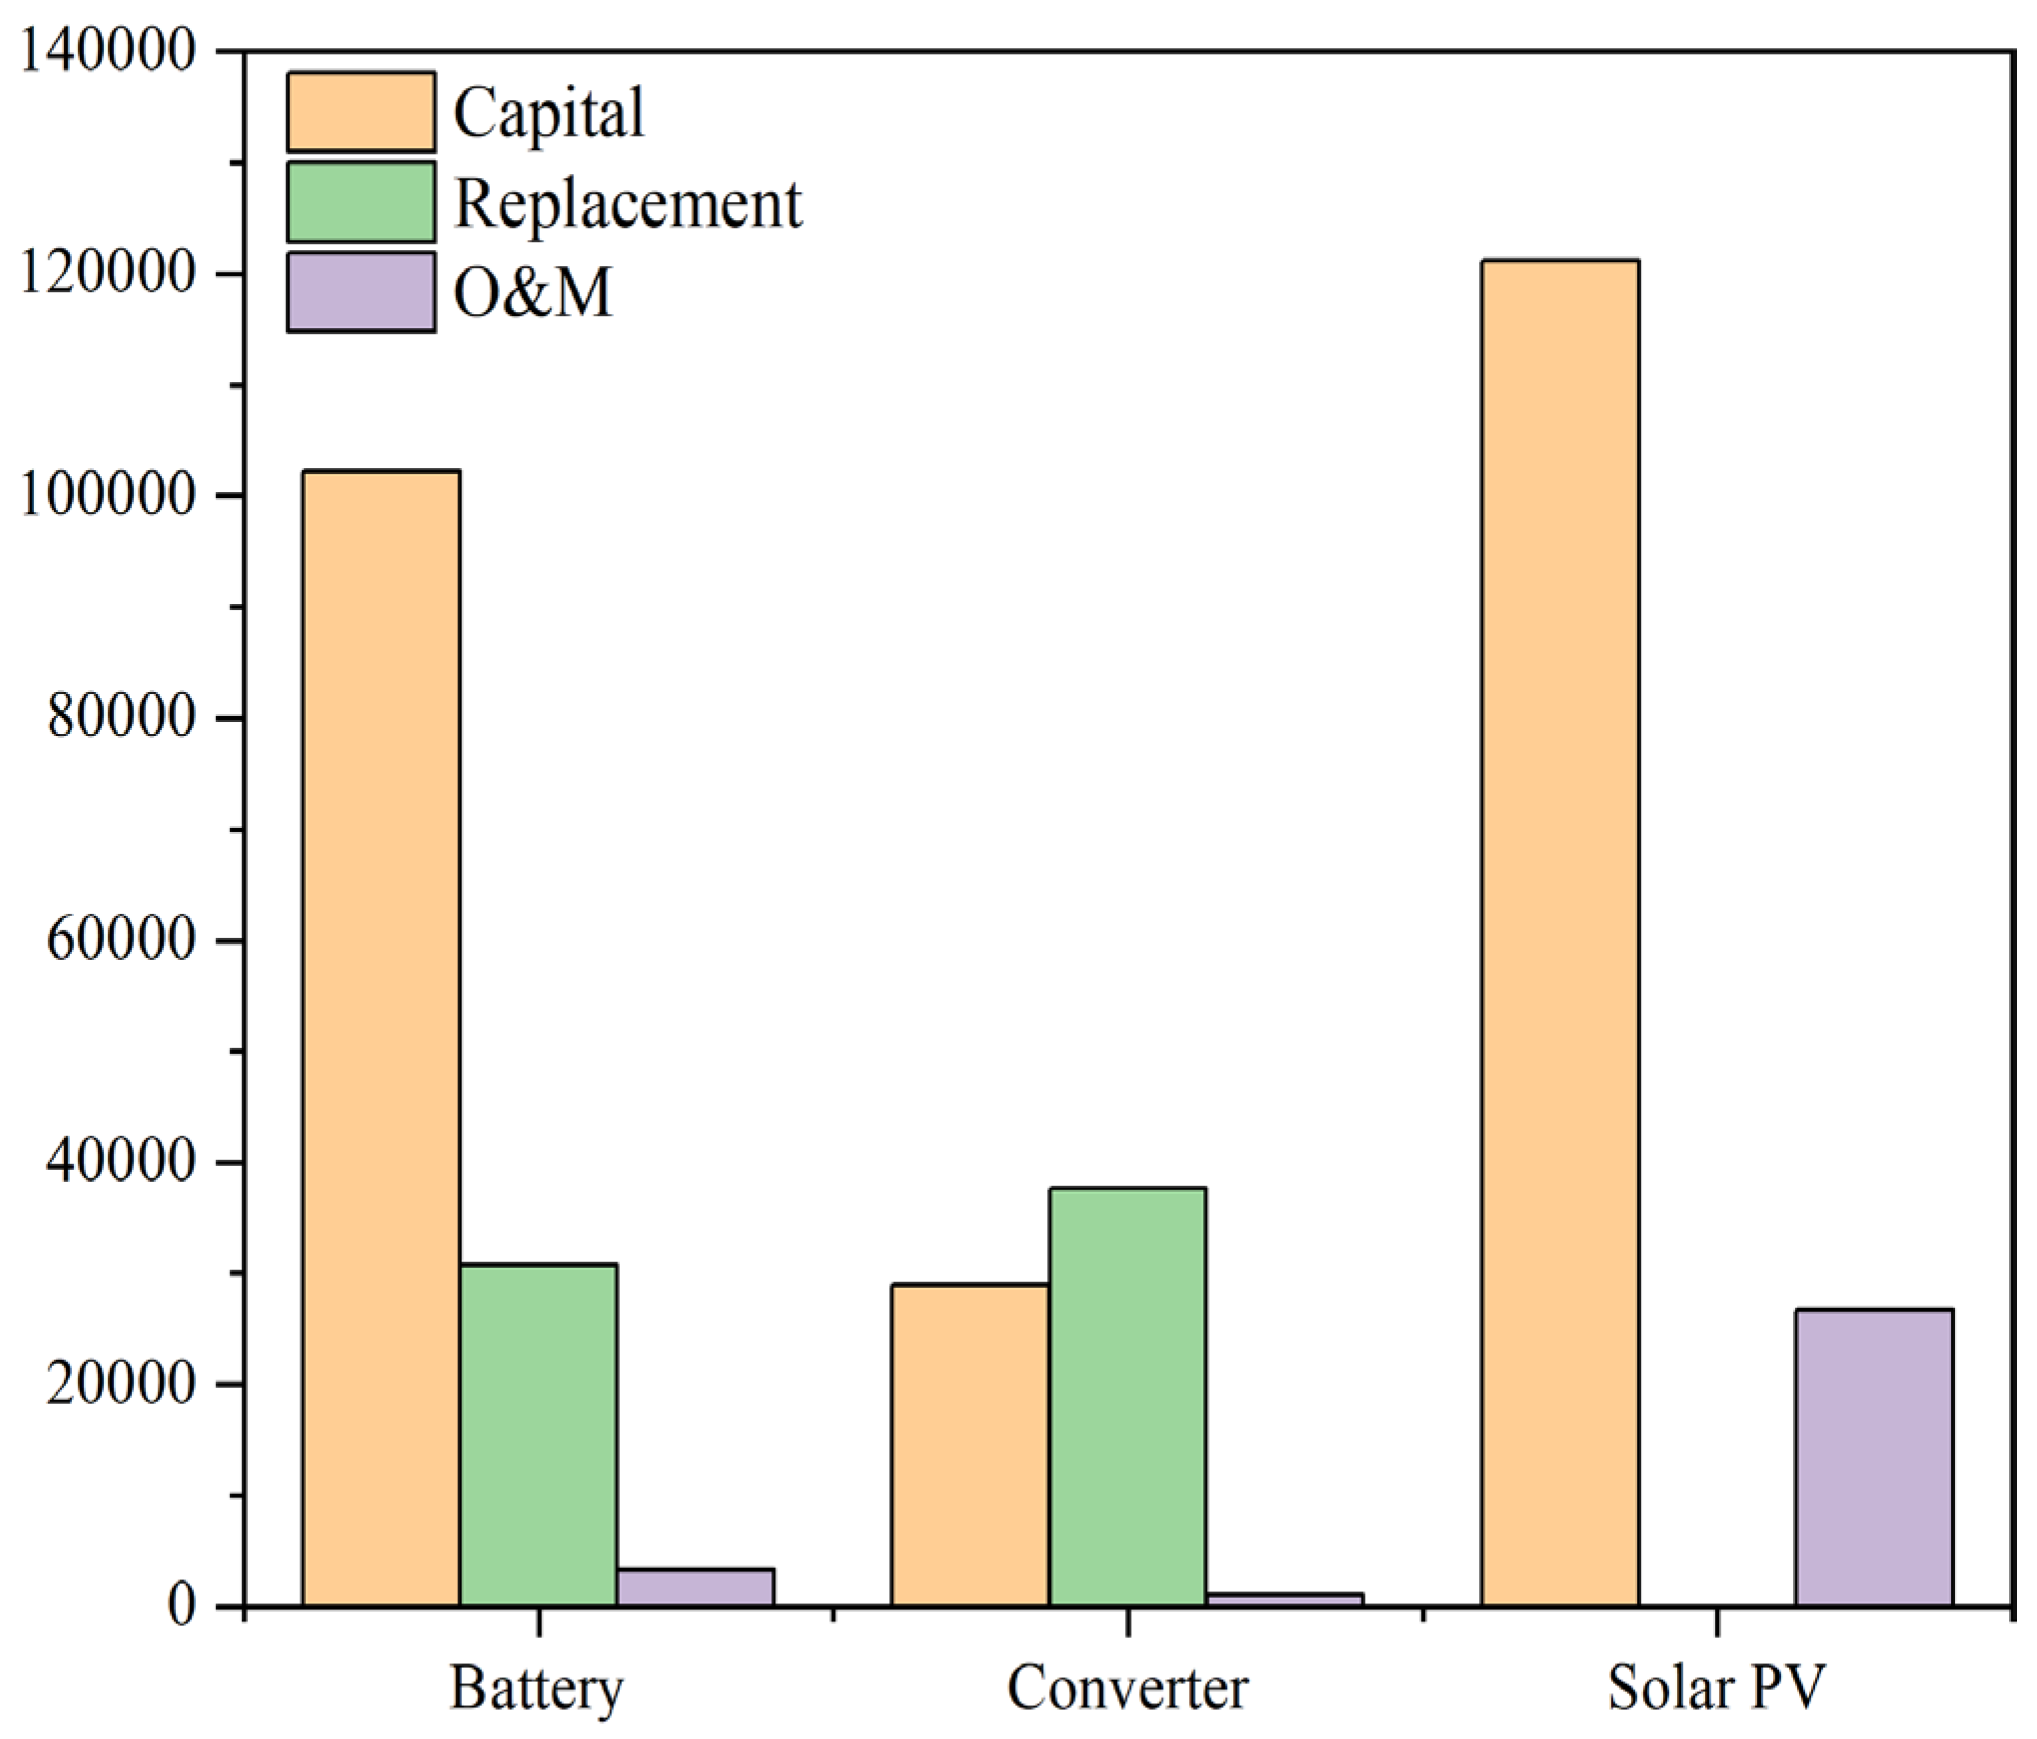
Figure 6.
Total life cycle cost for Case 1.
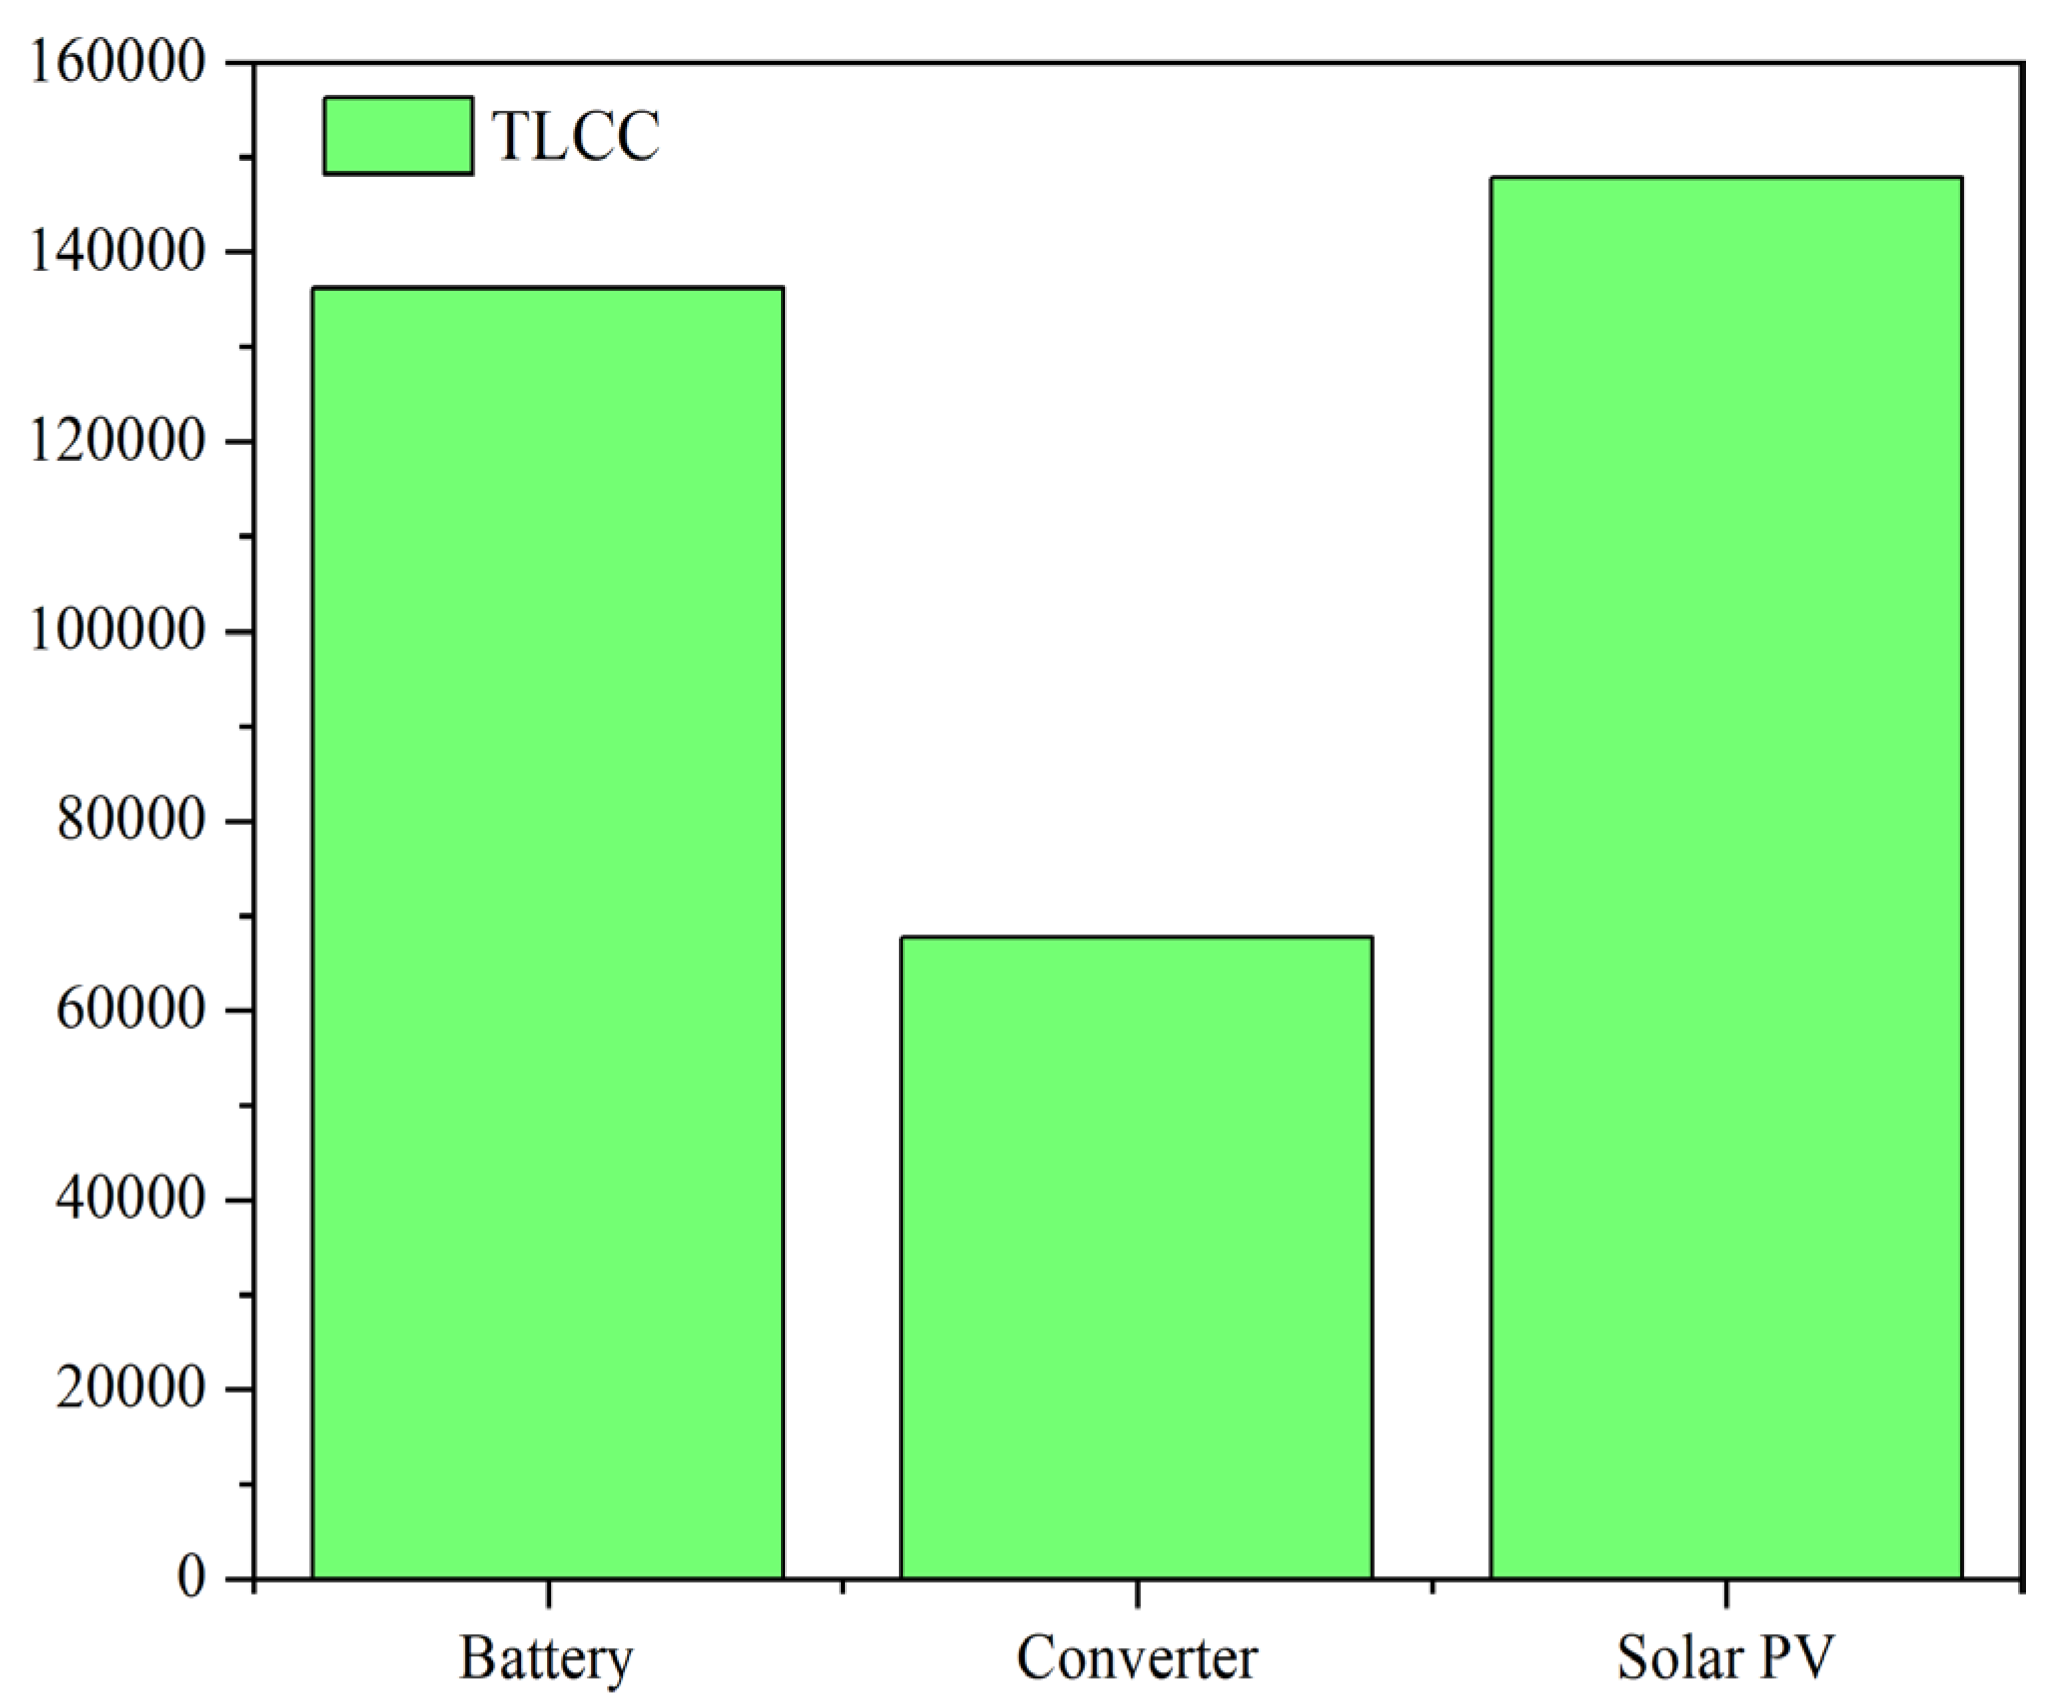
Figure 7.
Overall system component cost for Case 2.
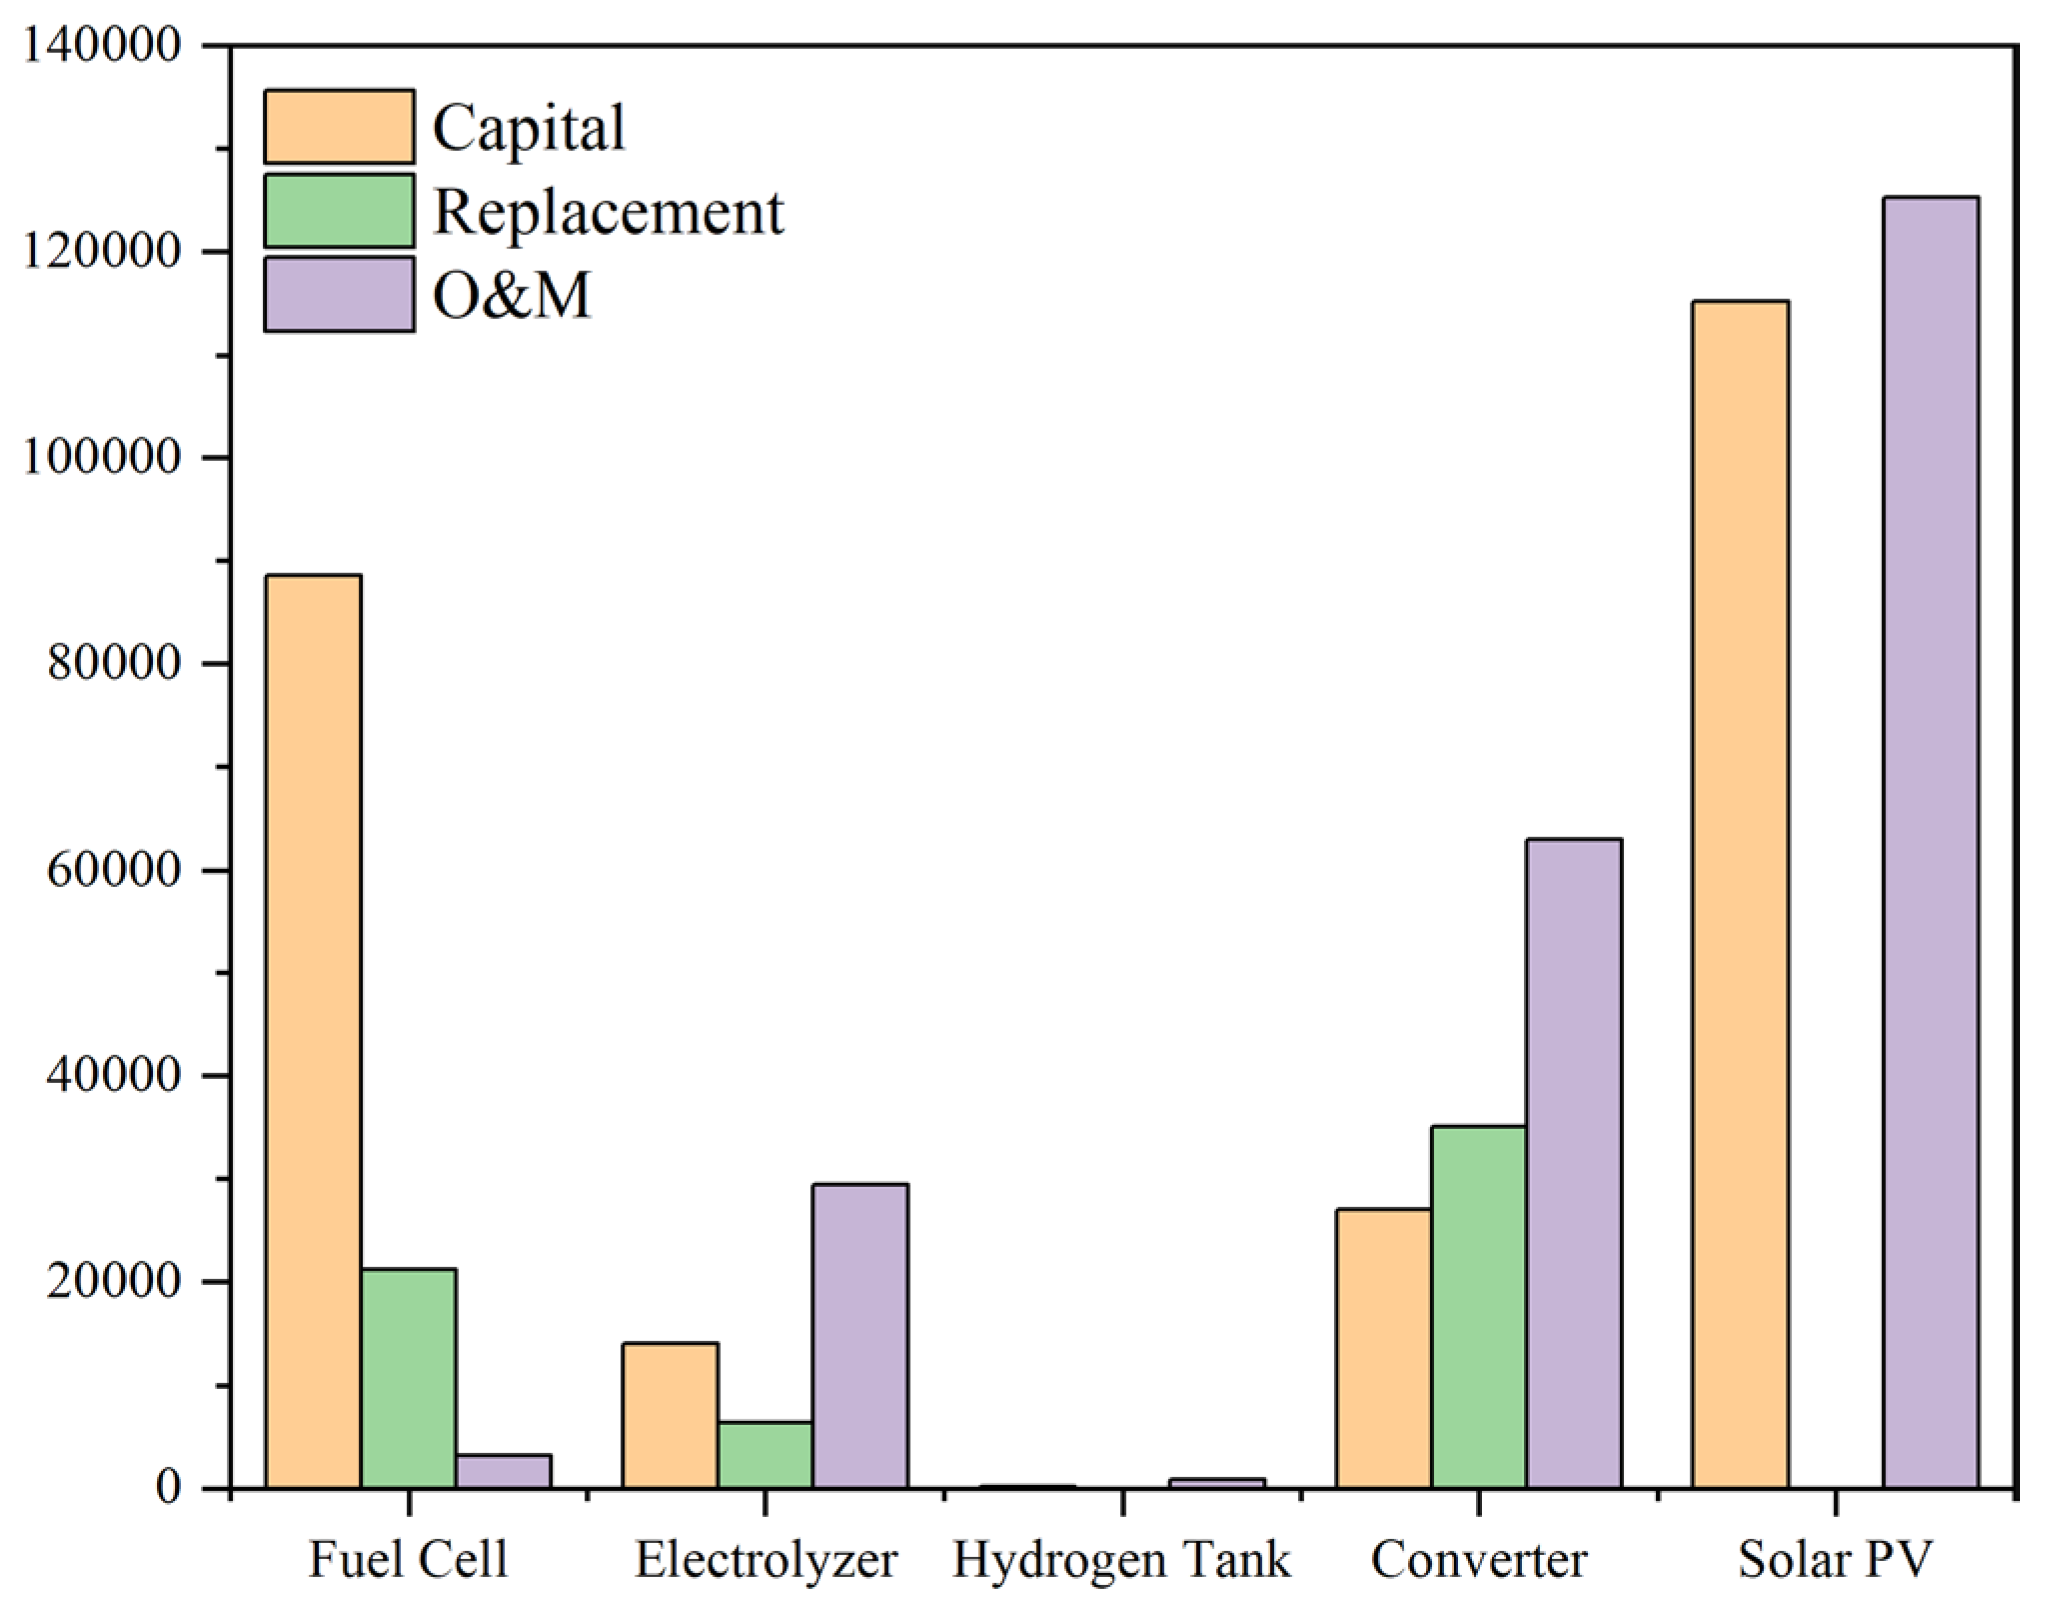
Figure 8.
Total life cycle cost for Case 2.

Table 1.
Baseline and scaled load data.
| Parameters | Baseline Load | Scaled Load |
|---|---|---|
| Average (kWh/day) | 175.47 | 175.47 |
| Average (kW) | 7.3 | 7.3 |
| Peak (kW) | 25.47 | 25.47 |
| Load Factor | 0.5 | 0.5 |
Table 2.
Weekdays load data profile.
| Hour | Jan | Feb | Mar | Apr | May | Jun | Jul | Aug | Sep | Oct | Nov | Dec |
|---|---|---|---|---|---|---|---|---|---|---|---|---|
| 0 | 0.109 | 0.109 | 0.109 | 0.109 | 0.109 | 0.109 | 0.109 | 0.109 | 0.109 | 0.109 | 0.109 | 0.109 |
| 1 | 0.095 | 0.095 | 0.095 | 0.095 | 0.095 | 0.095 | 0.095 | 0.095 | 0.095 | 0.095 | 0.095 | 0.095 |
| 2 | 0.095 | 0.095 | 0.095 | 0.095 | 0.095 | 0.095 | 0.095 | 0.095 | 0.095 | 0.095 | 0.095 | 0.095 |
| 3 | 0.095 | 0.095 | 0.095 | 0.095 | 0.095 | 0.095 | 0.095 | 0.095 | 0.095 | 0.095 | 0.095 | 0.095 |
| 4 | 0.327 | 0.327 | 0.327 | 0.327 | 0.327 | 0.327 | 0.327 | 0.327 | 0.327 | 0.327 | 0.327 | 0.327 |
| 5 | 0.500 | 0.500 | 0.500 | 0.500 | 0.500 | 0.500 | 0.500 | 0.500 | 0.500 | 0.500 | 0.500 | 0.500 |
| 6 | 0.550 | 0.550 | 0.550 | 0.550 | 0.550 | 0.550 | 0.550 | 0.550 | 0.550 | 0.550 | 0.550 | 0.550 |
| 7 | 0.500 | 0.500 | 0.500 | 0.500 | 0.500 | 0.500 | 0.500 | 0.500 | 0.500 | 0.500 | 0.500 | 0.500 |
| 8 | 0.420 | 0.420 | 0.420 | 0.420 | 0.420 | 0.420 | 0.420 | 0.420 | 0.420 | 0.420 | 0.420 | 0.420 |
| 9 | 0.430 | 0.430 | 0.430 | 0.430 | 0.430 | 0.430 | 0.430 | 0.430 | 0.430 | 0.430 | 0.430 | 0.430 |
| 10 | 0.495 | 0.495 | 0.495 | 0.495 | 0.495 | 0.495 | 0.495 | 0.495 | 0.495 | 0.495 | 0.495 | 0.495 |
| 11 | 0.533 | 0.533 | 0.533 | 0.533 | 0.533 | 0.533 | 0.533 | 0.533 | 0.533 | 0.533 | 0.533 | 0.533 |
| 12 | 0.691 | 0.691 | 0.691 | 0.691 | 0.691 | 0.691 | 0.691 | 0.691 | 0.691 | 0.691 | 0.691 | 0.691 |
| 13 | 0.519 | 0.519 | 0.519 | 0.519 | 0.519 | 0.519 | 0.519 | 0.519 | 0.519 | 0.519 | 0.519 | 0.519 |
| 14 | 0.418 | 0.418 | 0.418 | 0.418 | 0.418 | 0.418 | 0.418 | 0.418 | 0.418 | 0.418 | 0.418 | 0.418 |
| 15 | 0.397 | 0.397 | 0.397 | 0.397 | 0.397 | 0.397 | 0.397 | 0.397 | 0.397 | 0.397 | 0.397 | 0.397 |
| 16 | 0.409 | 0.409 | 0.409 | 0.409 | 0.409 | 0.409 | 0.409 | 0.409 | 0.409 | 0.409 | 0.409 | 0.409 |
| 17 | 0.658 | 0.658 | 0.658 | 0.658 | 0.658 | 0.658 | 0.658 | 0.658 | 0.658 | 0.658 | 0.658 | 0.658 |
| 18 | 1.231 | 1.231 | 1.231 | 1.231 | 1.231 | 1.231 | 1.231 | 1.231 | 1.231 | 1.231 | 1.231 | 1.231 |
| 19 | 1.003 | 1.003 | 1.003 | 1.003 | 1.003 | 1.003 | 1.003 | 1.003 | 1.003 | 1.003 | 1.003 | 1.003 |
| 20 | 0.676 | 0.676 | 0.676 | 0.676 | 0.676 | 0.676 | 0.676 | 0.676 | 0.676 | 0.676 | 0.676 | 0.676 |
| 21 | 0.480 | 0.480 | 0.480 | 0.480 | 0.480 | 0.480 | 0.480 | 0.480 | 0.480 | 0.480 | 0.480 | 0.480 |
| 22 | 0.300 | 0.300 | 0.300 | 0.300 | 0.300 | 0.300 | 0.300 | 0.300 | 0.300 | 0.300 | 0.300 | 0.300 |
| 23 | 0.204 | 0.204 | 0.204 | 0.204 | 0.204 | 0.204 | 0.204 | 0.204 | 0.204 | 0.204 | 0.204 | 0.204 |
Table 3.
Weekend Load Data Profile.
| Hour | Jan | Feb | Mar | Apr | May | Jun | Jul | Aug | Sep | Oct | Nov | Dec |
|---|---|---|---|---|---|---|---|---|---|---|---|---|
| 0 | 0.109 | 0.109 | 0.109 | 0.109 | 0.109 | 0.109 | 0.109 | 0.109 | 0.109 | 0.109 | 0.109 | 0.109 |
| 1 | 0.095 | 0.095 | 0.095 | 0.095 | 0.095 | 0.095 | 0.095 | 0.095 | 0.095 | 0.095 | 0.095 | 0.095 |
| 2 | 0.095 | 0.095 | 0.095 | 0.095 | 0.095 | 0.095 | 0.095 | 0.095 | 0.095 | 0.095 | 0.095 | 0.095 |
| 3 | 0.095 | 0.095 | 0.095 | 0.095 | 0.095 | 0.095 | 0.095 | 0.095 | 0.095 | 0.095 | 0.095 | 0.095 |
| 4 | 0.327 | 0.327 | 0.327 | 0.327 | 0.327 | 0.327 | 0.327 | 0.327 | 0.327 | 0.327 | 0.327 | 0.327 |
| 5 | 0.500 | 0.500 | 0.500 | 0.500 | 0.500 | 0.500 | 0.500 | 0.500 | 0.500 | 0.500 | 0.500 | 0.500 |
| 6 | 0.550 | 0.550 | 0.550 | 0.550 | 0.550 | 0.550 | 0.550 | 0.550 | 0.550 | 0.550 | 0.550 | 0.550 |
| 7 | 0.500 | 0.500 | 0.500 | 0.500 | 0.500 | 0.500 | 0.500 | 0.500 | 0.500 | 0.500 | 0.500 | 0.500 |
| 8 | 0.462 | 0.462 | 0.462 | 0.462 | 0.462 | 0.462 | 0.462 | 0.462 | 0.462 | 0.462 | 0.462 | 0.462 |
| 9 | 0.473 | 0.473 | 0.473 | 0.473 | 0.473 | 0.473 | 0.473 | 0.473 | 0.473 | 0.473 | 0.473 | 0.473 |
| 10 | 0.545 | 0.545 | 0.545 | 0.545 | 0.545 | 0.545 | 0.545 | 0.545 | 0.545 | 0.545 | 0.545 | 0.545 |
| 11 | 0.586 | 0.586 | 0.586 | 0.586 | 0.586 | 0.586 | 0.586 | 0.586 | 0.586 | 0.586 | 0.586 | 0.586 |
| 12 | 0.760 | 0.760 | 0.760 | 0.760 | 0.760 | 0.760 | 0.760 | 0.760 | 0.760 | 0.760 | 0.760 | 0.760 |
| 13 | 0.571 | 0.571 | 0.571 | 0.571 | 0.571 | 0.571 | 0.571 | 0.571 | 0.571 | 0.571 | 0.571 | 0.571 |
| 14 | 0.460 | 0.460 | 0.460 | 0.460 | 0.460 | 0.460 | 0.460 | 0.460 | 0.460 | 0.460 | 0.460 | 0.460 |
| 15 | 0.437 | 0.437 | 0.437 | 0.437 | 0.437 | 0.437 | 0.437 | 0.437 | 0.437 | 0.437 | 0.437 | 0.437 |
| 16 | 0.450 | 0.450 | 0.450 | 0.450 | 0.450 | 0.450 | 0.450 | 0.450 | 0.450 | 0.450 | 0.450 | 0.450 |
| 17 | 0.658 | 0.658 | 0.658 | 0.658 | 0.658 | 0.658 | 0.658 | 0.658 | 0.658 | 0.658 | 0.658 | 0.658 |
| 18 | 1.231 | 1.231 | 1.231 | 1.231 | 1.231 | 1.231 | 1.231 | 1.231 | 1.231 | 1.231 | 1.231 | 1.231 |
| 19 | 1.003 | 1.003 | 1.003 | 1.003 | 1.003 | 1.003 | 1.003 | 1.003 | 1.003 | 1.003 | 1.003 | 1.003 |
| 20 | 0.676 | 0.676 | 0.676 | 0.676 | 0.676 | 0.676 | 0.676 | 0.676 | 0.676 | 0.676 | 0.676 | 0.676 |
| 21 | 0.480 | 0.480 | 0.480 | 0.480 | 0.480 | 0.480 | 0.480 | 0.480 | 0.480 | 0.480 | 0.480 | 0.480 |
| 22 | 0.300 | 0.300 | 0.300 | 0.300 | 0.300 | 0.300 | 0.300 | 0.300 | 0.300 | 0.300 | 0.300 | 0.300 |
| 23 | 0.204 | 0.204 | 0.204 | 0.204 | 0.204 | 0.204 | 0.204 | 0.204 | 0.204 | 0.204 | 0.204 | 0.204 |
Table 4.
Battery Description.
| Nominal Voltage (V) | 55 |
| Nominal Capacity (kWh) | 3.26 |
| Nominal Capacity (Ah) | 63 |
| Roundtrip efficiency (%) | 94.9 |
| Maximum Charge Current (A) | 63 |
| Maximum Discharge Current (A) | 63 |
Table 5.
System component specifications and cost.
| Component | Parameter | Value | Unit |
|---|---|---|---|
| PV Panel | Maximum power (Pmax) | 100 | W |
| Maximum power voltage (Vmp) | 18 | V | |
| Maximum power current (Imp) | 5.56 | A | |
| Open circuit voltage (VOC) | 22.3 | V | |
| Short circuit voltage (IsC) | 6.1 | A | |
| Number of cells | 36 | - | |
| Nominal operating cell temperature | 45 | °C | |
| Capital cost and replacement cost | 1084 | USD/kW | |
| O&M cost | 5/kW | USD/yr | |
| Life time | 20 | yr | |
| Inverter | Rated power | 1 | kW |
| Inverter efficiency (ηinv) | 90 | % | |
| Capital and replacement cost | 127 | USD/kW | |
| O&M cost | 1 | USD/yr | |
| Life time | 20 | yr | |
| Fuel cell | Rated power | 1 | kW |
| Capital and replacement cost | 600 | USD/kW | |
| O&M cost | 0.01 | USD/h/kW | |
| Fuel cell coefficient | 0.0003 | USD/h/kW | |
| Hydrogen to electricity conversion by fuel cell (QH2 | 0.059 | USD/h/kW | |
| Life time of FC | 20 | yr | |
| Electrolyzer | Capital and replacement cost | 150 | USD/kW |
| O&M cost | 8 | USD/yr/kW | |
| Efficiency | 90 | % | |
| Life time | 20 | yr | |
| Hydrogen tank | Capital cost | 1.3 | USD/kg |
| Replacement cost | 0.5 | USD/kg | |
| O&M cost | 0.6 | USD/yr/kg | |
| Life time | 20 | yr | |
| Battery | Nominal capacity | 360 | Ah |
| Nominal voltage | 6 | V | |
| Maximum charging current | 18 | A | |
| Minimum state of charge | 30 | % | |
| Maximum state of charge | 100 | % | |
| Round trip efficiency | 92 | % | |
| Capital cost | 300 | USD | |
| Replacement cost | 200 | USD | |
| O&M cost | 3.67 | USD/yr | |
| Life-time | 20 | yr | |
| Others | Project life (N) | 20 | yr |
| Interest rate (i) | 5 | % |
Table 6.
Overall system component cost for Case 1.
| Component | Capital (USD) | Replacement (USD) | O&M (USD) | TLCC (USD) |
|---|---|---|---|---|
| Battery | 102,150 | 30,750 | 3313 | 136,213 |
| Converter | 28,958 | 37,625 | 1099 | 67,682 |
| Solar PV | 121,143 | 0 | 26,741 | 147,884 |
| System | 252,251 | 68,375 | 31,153 | 351,779 |
Table 7.
Optimization results.
| Algorithm | TLCC (USD) |
|---|---|
| PSO | 350,229 |
| RAT | 330,125 |
| GWO | 345,115 |
| HOMER | 351,779 |
| HHO | 343,451 |
| PSORSA | 320,224 |
Table 8.
Overall system component cost for Case 2.
| Component | Capital (USD) | Replacement (USD) | O&M (USD) | TLCC (USD) |
|---|---|---|---|---|
| Fuel Cell | 88,524 | 21,147 | 3154 | 112,825 |
| Electrolyzer | 14,000 | 6321 | 9127 | 29,448 |
| Hydrogen Tank | 140 | 0 | 750 | 890 |
| Converter | 26,989 | 35,101 | 850 | 62,940 |
| Solar PV | 115,257 | 0 | 10,012 | 125,269 |
| System | 244,910 | 62,569 | 23,893 | 331,372 |
Table 9.
Optimization results.
| Algorithm | TLCC (USD) |
|---|---|
| PSO | 325,152 |
| RAT | 306,124 |
| GWO | 323,522 |
| HOMER | 331,372 |
| HHO | 318,189 |
| PSORSA | 302,198 |
Disclaimer/Publisher’s Note: The statements, opinions and data contained in all publications are solely those of the individual author(s) and contributor(s) and not of MDPI and/or the editor(s). MDPI and/or the editor(s) disclaim responsibility for any injury to people or property resulting from any ideas, methods, instructions or products referred to in the content. |
© 2023 by the authors. Licensee MDPI, Basel, Switzerland. This article is an open access article distributed under the terms and conditions of the Creative Commons Attribution (CC BY) license (https://creativecommons.org/licenses/by/4.0/).
Share and Cite
MDPI and ACS Style
Singla, M.K.; Gupta, J.; Alsharif, M.H.; Jahid, A. Optimizing Integration of Fuel Cell Technology in Renewable Energy-Based Microgrids for Sustainable and Cost-Effective Energy. Energies 2023, 16, 4482. https://doi.org/10.3390/en16114482
AMA Style
Singla MK, Gupta J, Alsharif MH, Jahid A. Optimizing Integration of Fuel Cell Technology in Renewable Energy-Based Microgrids for Sustainable and Cost-Effective Energy. Energies. 2023; 16(11):4482. https://doi.org/10.3390/en16114482
Chicago/Turabian StyleSingla, Manish Kumar, Jyoti Gupta, Mohammed H. Alsharif, and Abu Jahid. 2023. "Optimizing Integration of Fuel Cell Technology in Renewable Energy-Based Microgrids for Sustainable and Cost-Effective Energy" Energies 16, no. 11: 4482. https://doi.org/10.3390/en16114482
Note that from the first issue of 2016, this journal uses article numbers instead of page numbers. See further details here.