Article

Experimental Study of the Heat Flow and Energy Consumption during Liquid Cooling Due to Radiative Heat Transfer in Winter

1
Department of Machines and Apparatus for Production Processes, Almaty Technological University, Almaty A05H0E2, Kazakhstan
2
School of Hospitality and Tourism, Almaty Management University, Almaty A15P2M5, Kazakhstan
*
Author to whom correspondence should be addressed.
Energies 2023, 16(13), 4865; https://doi.org/10.3390/en16134865
Submission received: 19 May 2023 / Revised: 13 June 2023 / Accepted: 15 June 2023 / Published: 22 June 2023
(This article belongs to the Topic Cooling Technologies and Applications)

Abstract

:
Radiation cooling is a passive energy saving cooling technology. The process of cooling heat transfer liquid due to the combined effect of night radiative cooling and convection of air at negative temperatures (in winter) is studied. The radiator used for cooling was built into the roof of the building. Its radiating plate was made of a steel sheet coated with zinc oxide. In it, heat dissipation was carried out both from the upper and lower sides of the radiating plate. The experimental values of the heat flux ranged from 20 to 80 W·m−2 at a temperature difference between heat transfer liquid and air from 5 to 15 °C and ambient air temperature from −17 to +5 °C. The correctness of the model for calculating the heat flux in winter conditions was confirmed. A theoretical calculation showed that, in winter, the heat flux removed by the radiator will be 15% less than the heat flux in summer. The amount of heat transferred per watt of electrical power of the refrigeration unit reached 8 W·W−1. To keep the refrigeration unit with radiative heat transfer more efficient than in a conventional vapor compression chiller, the heat transfer liquid temperature should be 6 °C above the atmospheric temperature air. The results of the study show that radiative cooling can be used in winter and may be useful for the development of energy-efficient cooling systems for various purposes (air conditioning, industrial cooling systems and fruit storage chambers).

1. Introduction

Refrigeration equipment is used in all industries, agriculture, trade enterprises and in everyday life. According to the data [1], refrigeration appliances consume up to 17% of the world’s electricity. At the same time, electricity production is accompanied by greenhouse gas emissions. From using fossil fuel power stations, in the production of 1 kW·h of electricity, up to 1 kg CO2 can be emitted [2]. The Kigali Amendment to the Montreal Protocol provides for the reduction of greenhouse gas emissions to reduce the greenhouse effect. It is also important to reduce the consumption of fossil fuels, due to the fact that their reserves are limited.
In connection with all the indicated trends, an important problem is to increase the energy efficiency of refrigeration equipment. Standard vapor compression refrigeration machines have basically reached the limits of energy efficiency growth. In this regard, alternative methods of cooling are being sought. One of these methods is radiative cooling (hereinafter RC), a method of lowering the temperature based on the transfer of heat into the surrounding outer space in the form of infrared radiation through the atmosphere of the planet [3,4]. The temperature of outer space is about 4 K. Cooling is possible by radiating heat through the atmospheric window (8–13 μm). The combined use of radiation and convection makes it possible to intensify heat transfer. At the same time, the consumption of electricity for heat transfer is reduced. Therefore, research in the field of the use of RC in refrigeration is relevant.
In many works, the possibility of using RC for air conditioning in the summer was investigated [3,5]. To do this, it was proposed to cool the liquid in the radiator due to radiative and convective heat transfer and accumulate it in a cold accumulator. Then, the liquid was used to cool the air. Thus, in a tropical or continental climate, RC can be used to cool the air to a comfortable temperature of about +20 °C. In summer, it is expected that the radiator will reject up to 70–80 W·m−2 at night when using conventional coatings of the radiating surface [6] and more than 100 W·m−2 when using coatings with a selective emission/absorption spectrum [3]. Coatings with a selective emission/absorption spectrum are expensive [7] and often degrade quickly [8] in the environment. Therefore, in this study, a simple and durable version of the radiating surface of a radiator coated with zinc oxide is investigated.
In regions with a continental climate (e.g., in Kazakhstan, Canada and in the northern part of the USA), for a significant part of the year (up to 6 months or more), atmospheric air temperatures are below 0 °C. Comfort air conditioning is not required during this period, but there are many facilities where cooling is required all year round. For example, year-round cooling is required in many food industry enterprises, in warehouses for storing vegetables and fruits, in server rooms and for electronics cooling [9]. At such facilities, the use of refrigeration machines in winter is associated with excessive energy consumption. There are also many problems with regulating the cooling capacity of refrigeration machines and starting them after the compressor is turned off. In this regard, various methods of free cooling are used here. Dry coolers are traditionally used to transfer heat to the environment. In them, heat transfer is carried out only due to convection. Accordingly, it can be expected that, at such low air temperatures, RC can also be used to intensify heat transfer. However, this possibility has not yet been fully explored.
In the works [10,11], for cooling the heat transfer liquid in winter, it was proposed to use a vacuum tube radiator. It has been experimentally established that, at an atmospheric air temperature of about −30 °C, the temperature of the surface of the radiator was 0.8–1.9 °C lower than the atmospheric air temperature. However, the exact values of the rejected heat flux were not determined in the work. Additionally, in this work, convective heat transfer was excluded due to vacuum thermal insulation. However, if the temperature of the heat transfer liquid entering the radiator is higher than the air temperature, the convective heat exchange should not be prevented.
In paper [12], a theoretical calculation of the amount of heat that can be dissipated due to radiation and convection from the surface of the radiator was made. In the coldest months of the year (January and February) in the climate of Astana City (Kazakhstan) at a temperature of the radiating surface of −10 °C, 39.7 W·m−2 was rejected, on average, from 1 m2. Comparable values, not exceeding 50 W·m−2, were obtained in the work for the climate conditions of the cities of Sodankylä and Helsinki [13]. Studies have shown that, in cities with a continental climate, RC can be used for a long time to maintain heat transfer liquid temperatures near 0 °C and below. However, the results obtained are based on mathematical models, the accuracy of which have not been confirmed for negative atmospheric air temperatures. Additionally, in these works, the influence of the design characteristics of the radiator on the heat flux was not taken into account in any way, and the energy efficiency of the cooling process was not evaluated.
In the work [14], the process of heat transfer liquid cooling from +37 to +4 °C due to RC and convection during the year in the climate of the city of Ust-Kamenogorsk (Kazakhstan) was theoretically studied. It was shown that cooling to the required temperature was possible for 152 days a year. The rest of the time, a vapor compression refrigeration machine was supposed to be used. However, the calculation of heat transfer in the radiator was carried out in a simplified manner without taking into account the characteristics of the radiator.
Since RC does not provide stable temperature maintenance, in recent works, it was used in conjunction with refrigeration machines [15]. However, when combining different cooling methods, it is necessary to determine the criteria by which one cooling method is switched to another.
In paper [16], a computer simulation of the RC refrigeration system used to maintain a temperature of 0 °C in fruit storage was carried out. In this system, the heat transfer liquid was cooled in the radiators, which was stored in the cold accumulator. If necessary, the heat transfer liquid was supplied to the air cooler. It theoretically showed that, in order to maintain a given temperature, it is necessary that the average daily temperature of the atmospheric air fall below −10 °C. Thereby, the RC system maintained the required temperature in the refrigerator compartment only 8.5% of the time of the year in the climate of Almaty and 28.2% of the time in Kostanay. The rest of the year, the required temperature was maintained by the operation of a vapor compression refrigeration machine. In this work, the characteristics of the radiator were also taken into account in a simplified way; the effect of precipitation in the form of snow was not taken into account. The exact criteria for turning on refrigeration machines or radiators in the work have not been defined. It was also shown in the work that radiators should cover the entire roof of the building. Therefore, the cost of radiators has a significant impact the overall cost of the refrigeration system. Because of this, it is necessary to reduce their cost when developing radiators. To do this, in this paper, it is proposed to make radiators part of the roof of the building, as well as to exclude the use of expensive materials and selective coatings of the radiating surface.
This work is a continuation of [16] and is necessary for the development of a refrigeration system for fruit storage. A review of the literature [5,6,7,8,9,10,11,12,13,14,15,16] showed that the study of RC heat transfer processes in winter is based on theoretical models, the correctness of which is confirmed only for the warm period of the year. In winter, however, there is a possibility that the process of ice formation on the surface of the radiator, an increased level of cloudiness and dust content in the air can have a significant impact on RC.
In this regard, in order to determine the possibility of using RC, experimentally confirmed data on the dissipation of heat in radiators in winter conditions are required. Given these data, it will be possible to better understand how certain environmental factors will affect the RC and the possibility of its practical use in winter. It will also become clearer how radiative cooling can be used for heat transfer liquid cooling in conjunction with refrigeration machines in winter conditions.
Objective of the work: to determine the influence of environmental parameters in winter on the specific heat flux of a radiator built into the roof of a building that removes heat due to night radiative cooling and convection.

2. Materials and Methods

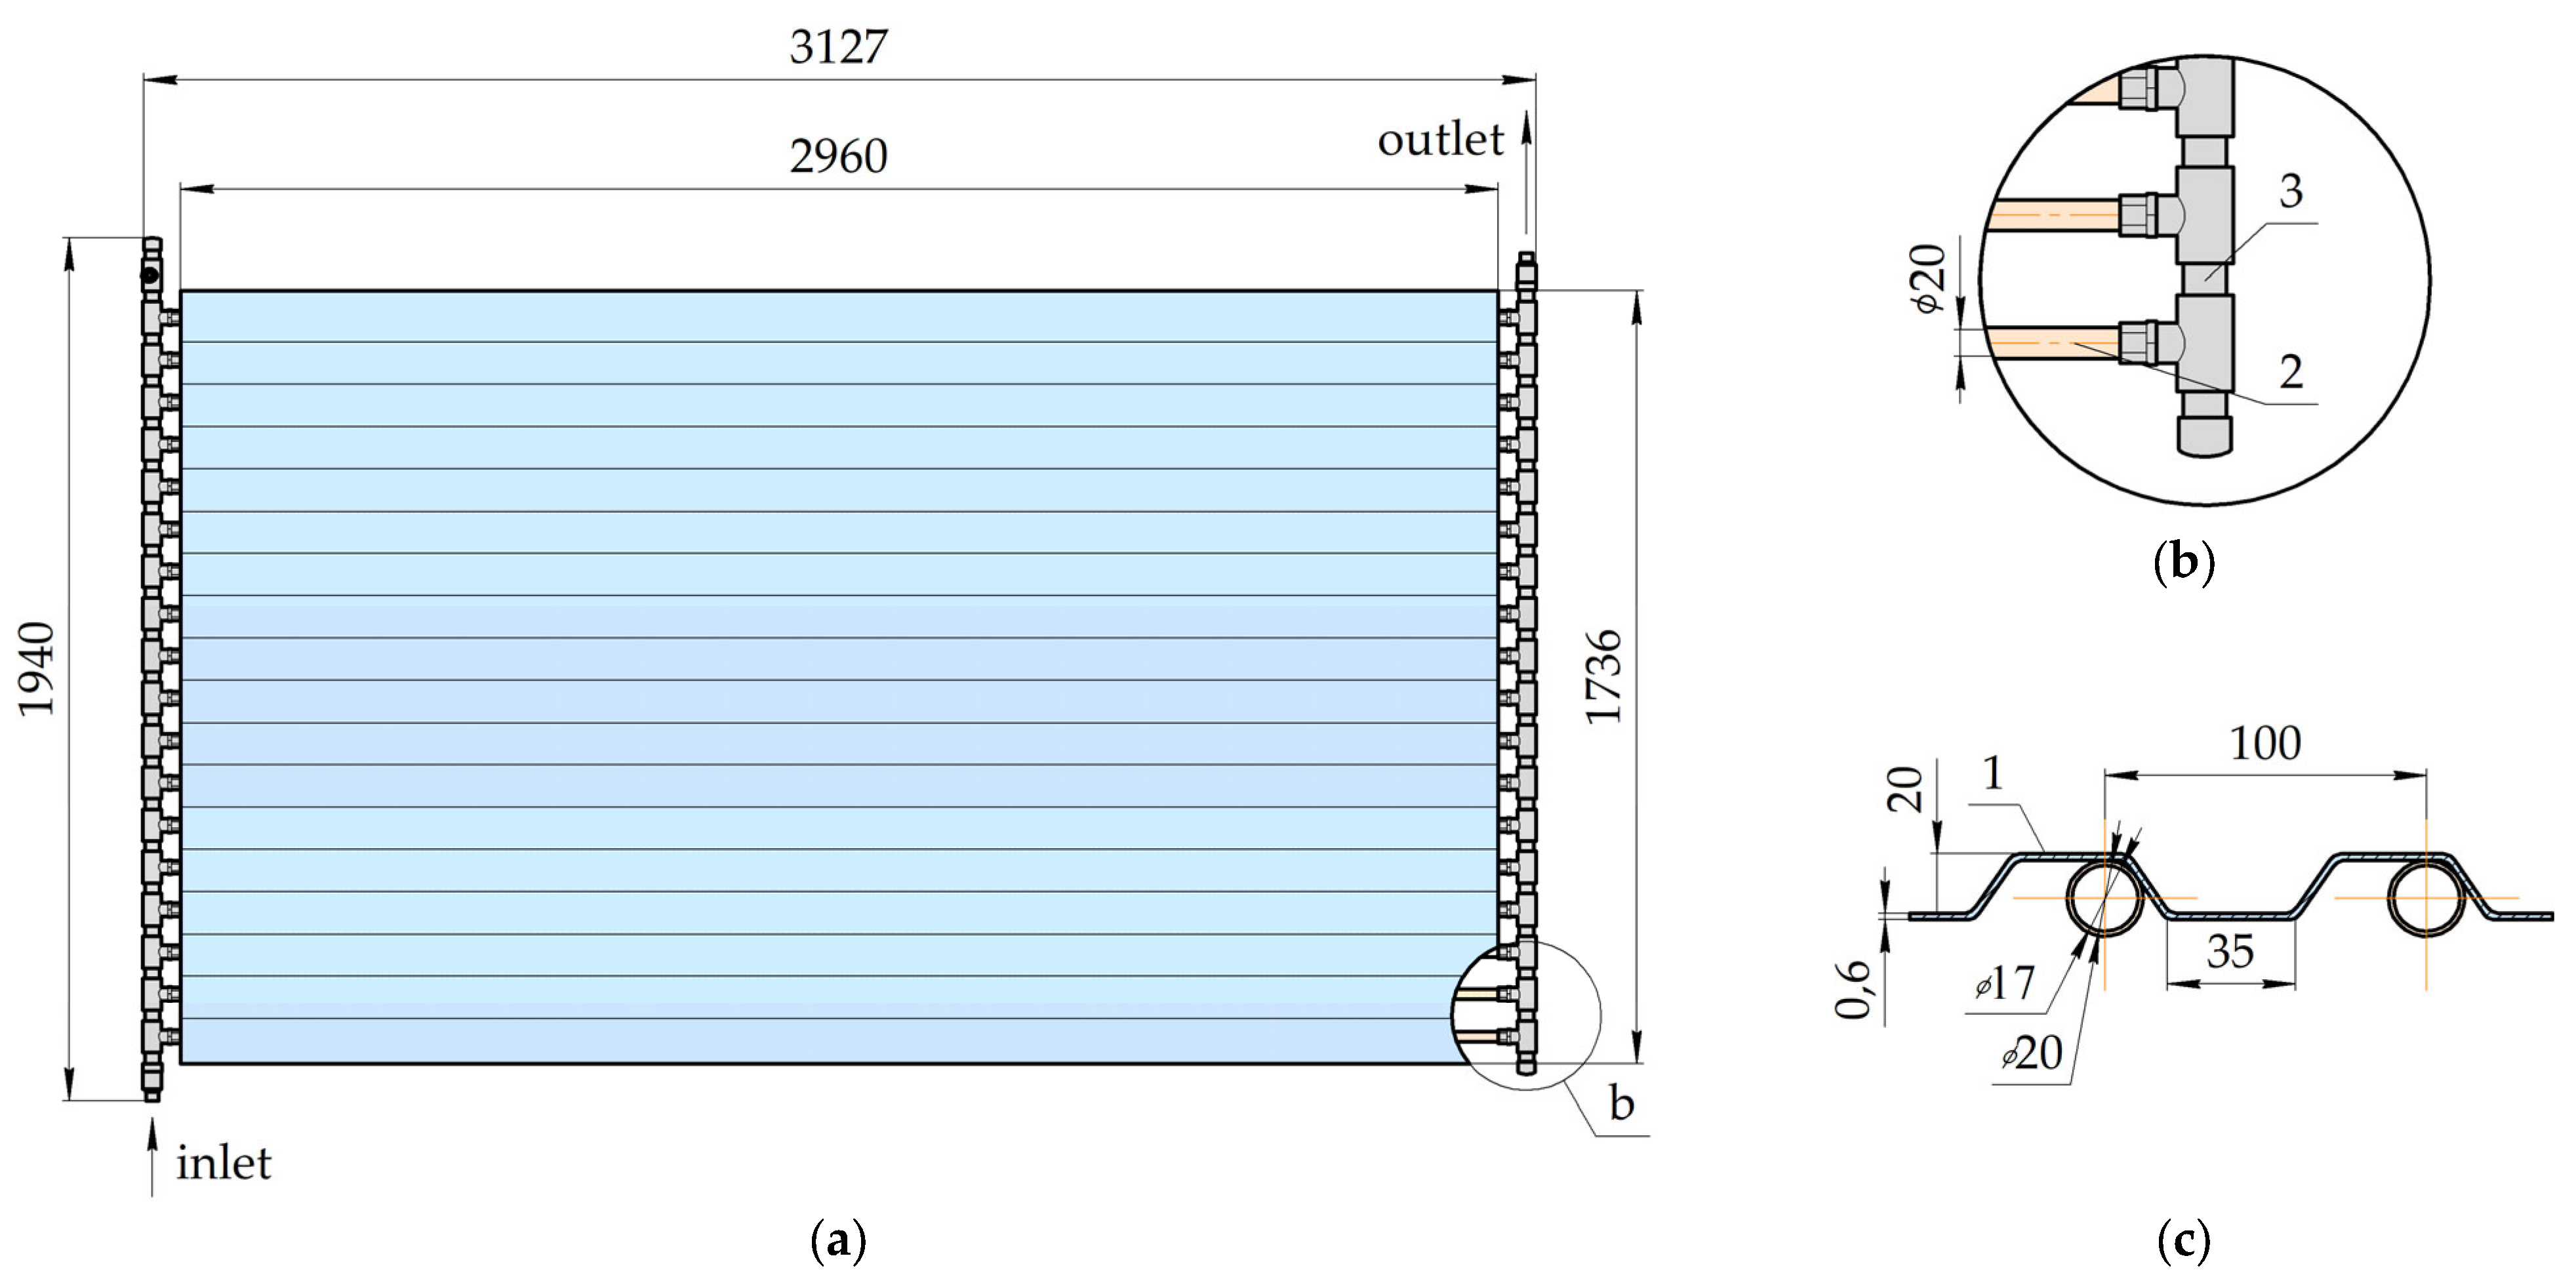
2.1. Experimental Refrigeration Unit

For the experiments, a refrigeration unit was developed, the schematic diagram of which is shown in Figure 1. It consists of a cold accumulator CA and two circuits. In the first hydraulic circuit, the heat transfer liquid is cooled in the RAD radiator at night. The heat transfer liquid is taken into this circuit from the upper point of the cold accumulator at a height of 900 mm from the bottom. The second hydraulic circuit is used in the daytime to preheat the heat transfer liquid. For this, an EH electric heater is used.
The radiator of the experimental unit is a heat exchanger consisting of a metal profile sheet made of galvanized steel (Figure 2a) and a bundle of aluminum pipes (Figure 2c). The pipes are laid in the bends of the sheet. The distribution of the heat transfer liquid through the pipes is carried out using two polypropylene collectors (Figure 2b). The radiator is not insulated. The emitting surface is an oxidized zinc layer with a high roughness. The choice of materials was determined from the condition of maximum reduction in the cost of construction. The radiator is designed in such a way that it can act as the roof covering of a building. It is not a supporting structure. It must be fixed to the frame. The main parameters of the radiator are presented in Table 1.
The radiating surface of the radiator is oriented to the north and has a slope of 10° to the horizontal plane. The radiator is fixed on the frame at a height of 1.5 m above the ground (Figure 3a). On the south side of the radiator, there is a building with a height of about 30 m.
The description of the design of the cold accumulator CA is presented in Table 1. The outside is covered with an aluminum sheet casing.
Pumps P1 and P2—circulation pumps with wet rotor Leo LRP 32-60/180 (China). Pumps were set to the minimum capacity.
For flow measurements of the heat transfer liquid used flow meters FIT1 and FIT2. The nominal measured flow Vn = 2.5 m3·hour−1. The accuracy rating was B, according to the standard [17]. At pump P1, the heat transfer liquid flow was 0.514 ± 0.027 m3·h−1, the pump head 2.1 m. The pump flow for P2 was 0.286 ± 0.027 m3·h−1 at 2 m pressure. The consumed power of P1 and P2 was 44 ± 3 W (according to the manufacturer).
The heat exchanger AC is made of freon air cooler Karyer EA-150AC7-C03.
The electric heater consists of two tubular electric heaters. The resistance of each at room temperature is 49.5 Ohm, the power at 1067 W (at a voltage of 237 V).
The accumulator CA, radiator and pumps of the experimental unit are located outside the building on the north side, where even in the daytime it is impossible for direct sunlight to hit the surface of the radiator (Figure 3).
Used temperature sensors: Dallas Semiconductor DS18B20 with an error ±0.5 °C. Temperature measurement resolution was 0.1 °C (11-bit precision). They measured the following parameters: TI1—ambient air; TI2—radiator surface between pipes; TI3—heat transfer liquid at the outlet of the radiator; TI4 and TI5—heat transfer liquid at the top and bottom of the cold accumulator; TI6—surface air cooler; TI7—air entering the air cooler; TI8—air in the room where the refrigerator is located. Temperatures are recorded automatically at 1-min intervals.
The experimental unit is located in Almaty (43°15′00″ N, 76°51′34″ E).

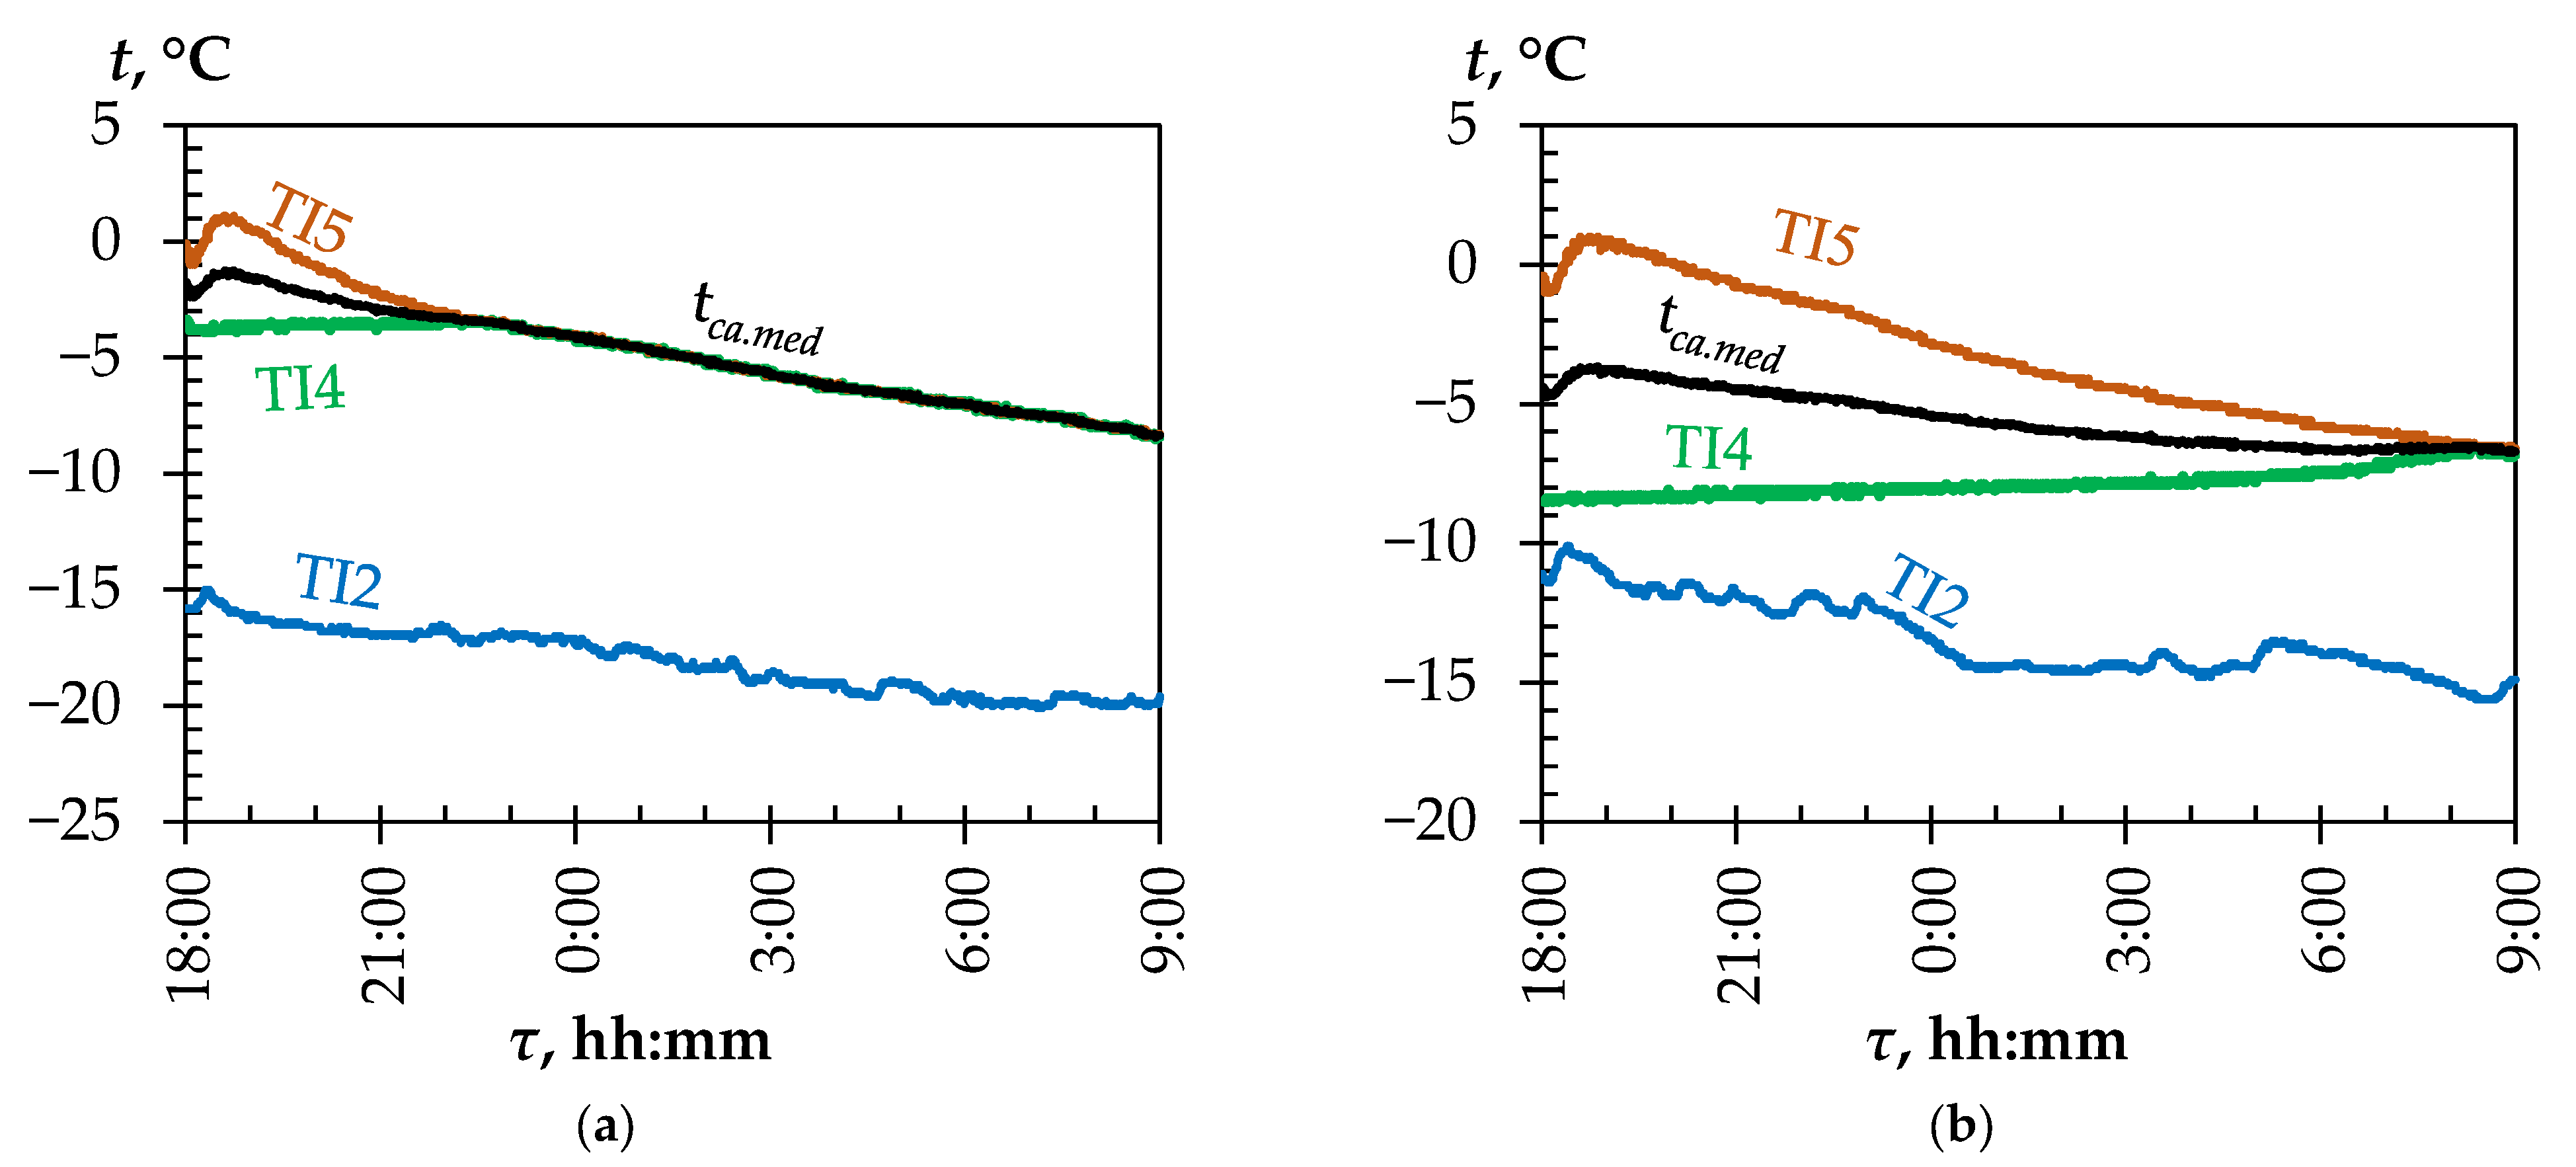
2.2. Method for Experimental Measurement of Heat Flux in a Radiator

Pump P1, by time relay, turns on in the evening at 18:00 and turns off in the morning at 9:00. There is a cycle of night cooling of the heat transfer liquid. Next, records are selected with an interval of 3 h, on the basis of which the calculations are made. Thermal power dissipated by the radiator [18] (W):
Q s u m . e = m h t l c h t l ( t h t l 1 t h t l 2 ) τ Q w Q p ,
where mhtl is mass of heat transfer liquid, kg; chtl is heat capacity of heat transfer liquid; thtl1 and thtl2 are the average temperatures of the heat transfer liquid in the volume of the accumulator at the beginning and end of the considered time interval, °C; τ is duration of the time interval between measurements in seconds; Qw is the theoretical heat gain through the wall of the cold accumulator, W; and Qp is thermal power transferred to the heat transfer liquid from the pump motor, W.
Taking into account the possible heat capacities, depending on the temperature and concentration of the solution, chtl = 3399 ± 132 J·kg−1·K−1.
The average temperature thtl is determined by averaging the readings of temperature sensors TI4 and TI5. The total absolute error in measuring changes in the heat transfer liquid temperature (thtl1thtl2) is estimated at 0.19 °C.
Given that the parameters are recorded once per minute, τ = 10,800 ± 120 s.
All the consumed electric power of the pump is converted into heat: Qp = P1.
The theoretical heat gain through the wall of the cold accumulator is calculated according to the standard method [19]. When calculating the heat transfer coefficients, it was assumed that there is no temperature gradient in the cold accumulator. It was also assumed that the heat transfer liquid convection occurs naturally. Considering the geometric dimensions of the cold accumulator, the thickness of the thermal insulation and its physical properties from Section 2.1, the heat gain through the wall was calculated for the air temperature and temperature of heat transfer liquid in the cold accumulator from −20 to +40 °C. Further, according to the calculation results, the dependence of the heat gain on the temperature difference was obtained (W):
Q w = 3.13 ( t a i r t h t l ) ,
where tair is the ambient air temperature, °C.
Considering the uncertainty of thermal insulation humidity, the absolute error in calculating the heat gain through the cold accumulator wall is:
Δ Q w = ± ( 0.33 | t a i r t h t l | + 2 ) .
To evaluate the operation of the radiator in this paper, it is proposed to use the following parameters. The experimental heat flux is removed by 1 m2 of the radiating surface [20] (W·m−2):
q s u m . e = Q s u m . e A r a d .
The relative error in calculating the qsum.e according to the instruments used changes in the range from 10 to 25%. It should be taken into account that a decrease in the heat flux in the radiators leads to a decrease in the temperature change in the cold accumulator. The relative error increases in this case. If it is necessary to measure heat fluxes less than 25 W/m2, more accurate temperature sensors should be used, the scale of which allows observing temperature changes of 0.05 °C.
The average temperature difference over a period of time on the radiator:
Δ t r a d = ( t h t l 1 t a i r 1 ) + ( t h t l 2 t a i r 2 ) 2 ,
where tair1 and tair2 is the air temperature at the beginning and at the end of the period under consideration, °C. The absolute error in calculating Δtrad does not exceed 0.77 K.
The radiator overall heat transfer coefficient (W·m−2·K−1):
k r a d . e = | q s u m . e Δ t r a d | .
The amount of heat transferred per watt of electrical power consumed:
η e = Q s u m . e N p ,
where Np is power consumption of the pump, W.

2.3. Theoretical Calculation of Heat Flux in the Radiator

To estimate the maximum amount of heat that can be rejected from the radiator under given conditions, the following method was used. The heat flux from the radiant plate:
q s u m . t . max = q c o n v . u p + q c o n v . d o w n + q r a d . u p + q r a d . d o w n .
where qconv.up is the convective heat flux from the upper side of the radiating plate facing the sky, W·m−2; qrad.up is the heat flux from the upper side of the radiating plate due to radiation, W·m−2; qconv.down is the convective heat flux from the lower side of the radiating plate, W·m−2; and qrad.down is the heat flux from the lower side of the radiating plate due to radiation, W·m−2.
In the calculations, it is assumed that the temperature at all points of the radiator is equal to the temperature of the heat transfer liquid trad = thtl [21].
The heat flux removed by radiation at night from the upper side of the radiating surface:
q r a d . u p = σ ε r a d [ ( t r a d + 273.15 ) 4 T s k y 4 ] .
where σ is the Stefan–Boltzmann constant, 5.67·10−8 W·m−2·K−4; εrad is the relative surface emissivity; trad is the radiating surface temperature, °C; Tsky is the assumptive sky temperature, K.
In this case, the zinc oxide layer is thin, and the radiating surface is highly oxidized and has a high roughness. Therefore, εrad = 0.9 was adopted in the calculations [22]. In this case, if an ice layer forms on the radiator surface, then its emissivity in the wavelength ranging from 8 to 13 μm can reach 0.98 [23].
The calculation of the assumptive temperature of the night sky Tsky is carried out according to the formula from the work [24]. The coefficient taking into account the effect of atmospheric pressure CFal and the coefficient taking into account the effect of cloudiness CFcl are calculated according to the formulas from [25].
The heat flux rejected by convection qconv from the upper and lower sides of the radiating plate is calculated according to experimental dependence on the whole domain for the case of natural air convection near a flat surface [19].
The heat flux rejected by radiation from the underside of the radiating plate is calculated using the standard formula for calculating radiative heat transfer between two parallel surfaces. In the calculations, the emissivity of the ground surface under the radiator εgr = 0.98.
The overall heat transfer coefficient of the radiator krad.t is calculated according to the method from [20]. This method assumes that the radiating plate has a low thermal resistance. When calculating, it is assumed that the gap between the aluminum tube and the galvanized steel sheet is 0.15 mm. The angle of coverage of the tube by the plate γ is 40°. Heat conductivity: tube material (aluminum alloy AD31 [26])—190 W·m−1·K−1 [27], radiating plate made of steel 08 [28]—88 W·m−1·K−1 [29] and air in the gap between the tube and the sheet—0.024 W·m−1·K−1. The change in thermal conductivity with the temperature was not taken into account. The remaining dimensions of the radiator parts are taken according to Figure 2. The formula for krad.t allows to determine the heat flux removed by the radiant plate of the radiator at a known temperature of the heat transfer liquid and environmental conditions for a given design of the radiator. It was developed for the calculation of radiators, in which the change in the temperature of the radiating surface can be neglected. In the radiator studied in this work, the temperature of the radiating surface is not the same and decreases significantly with distance from the axes of the pipes. In this regard, this formula may give overestimated values.
The theoretical heat flux rejected by the radiator (W·m−2):
q s u m . t = k r a d . t Δ t r a d .
The radiator efficiency is defined as the ratio of the experimental heat flux to the maximum theoretical one:
η r = q s u m . e q s u m . t . max .
In the calculations, qsum.t.max assumed that the relative emissivity of the surface is εrad = 1.

2.4. Characteristics of a Radiator with Increased Thermal Conductivity
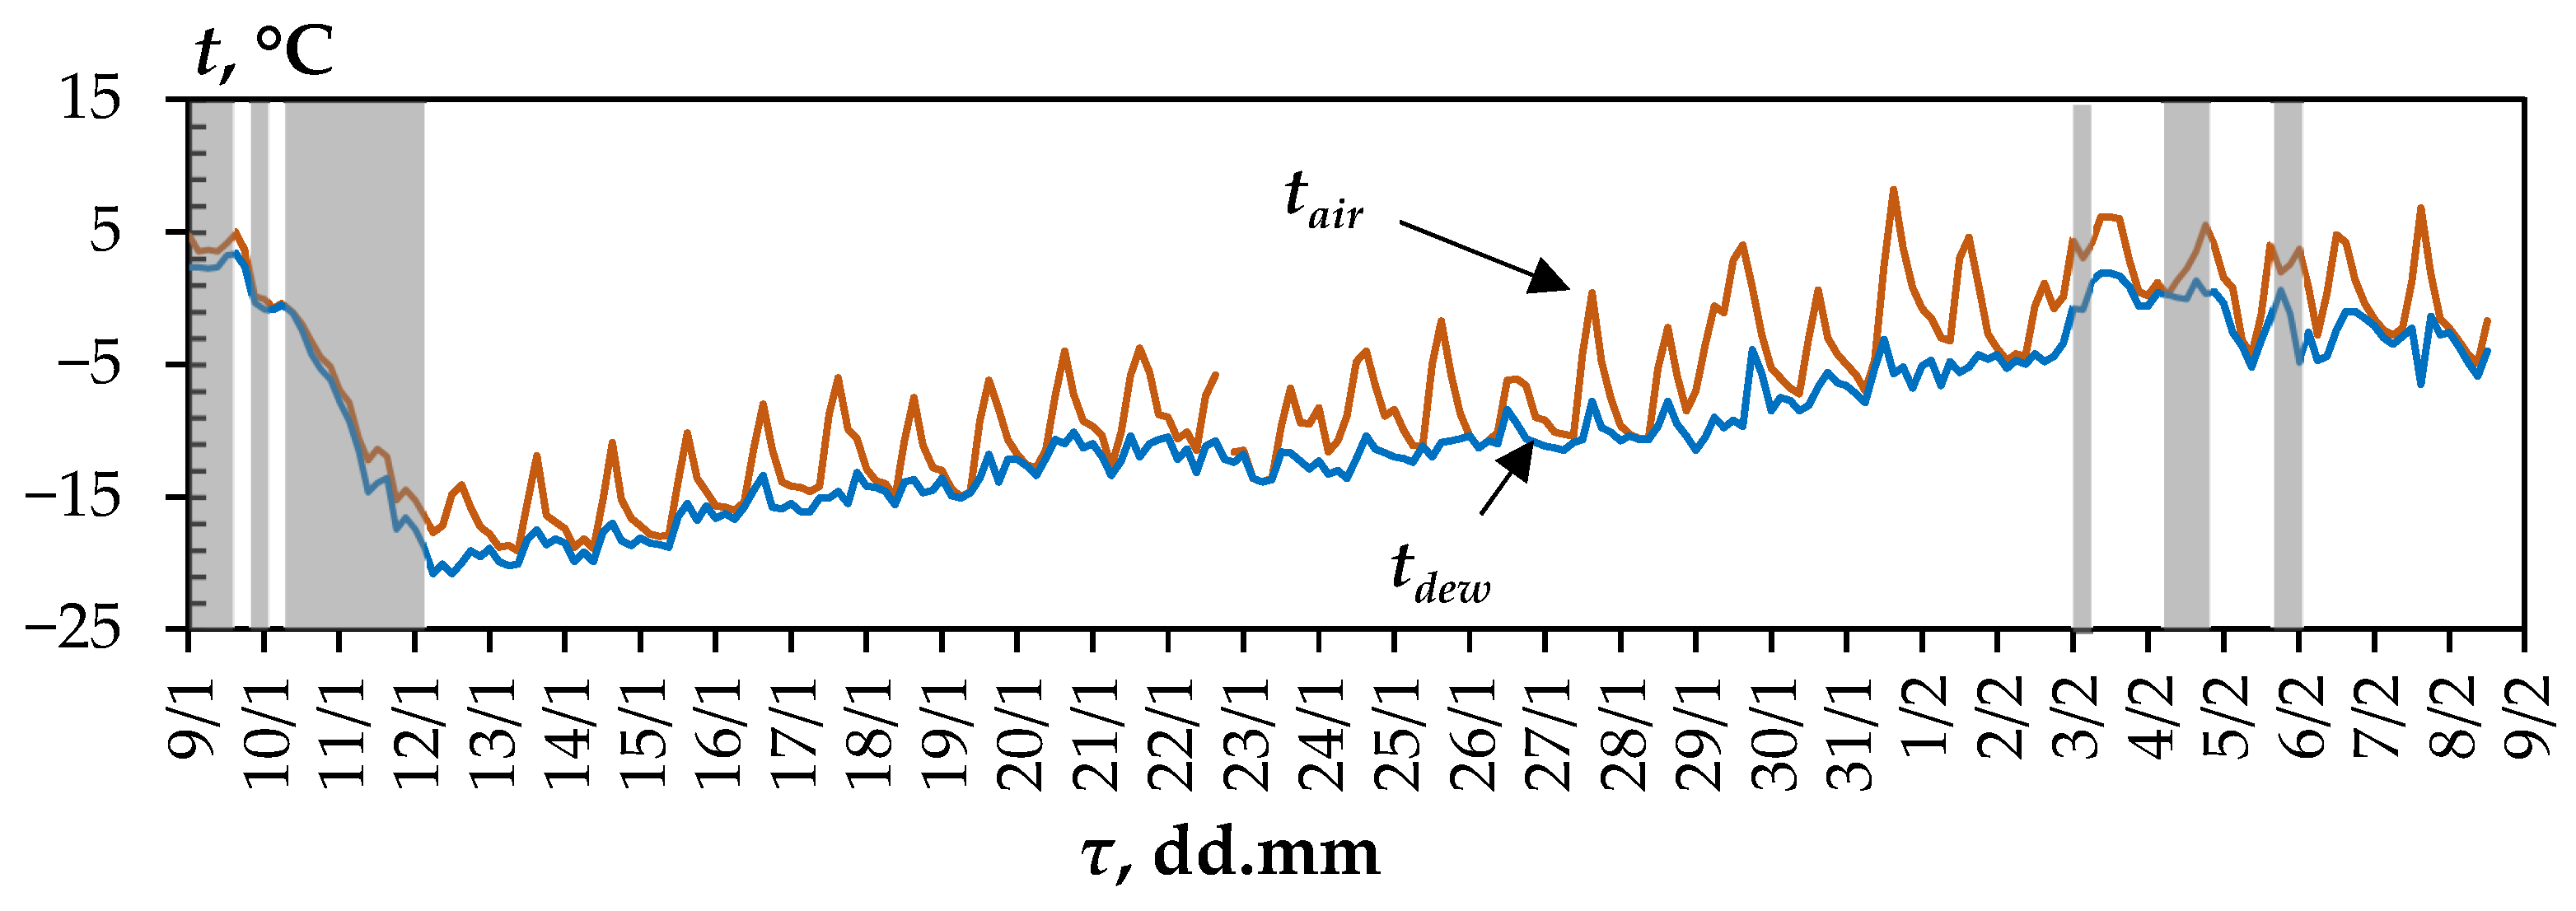
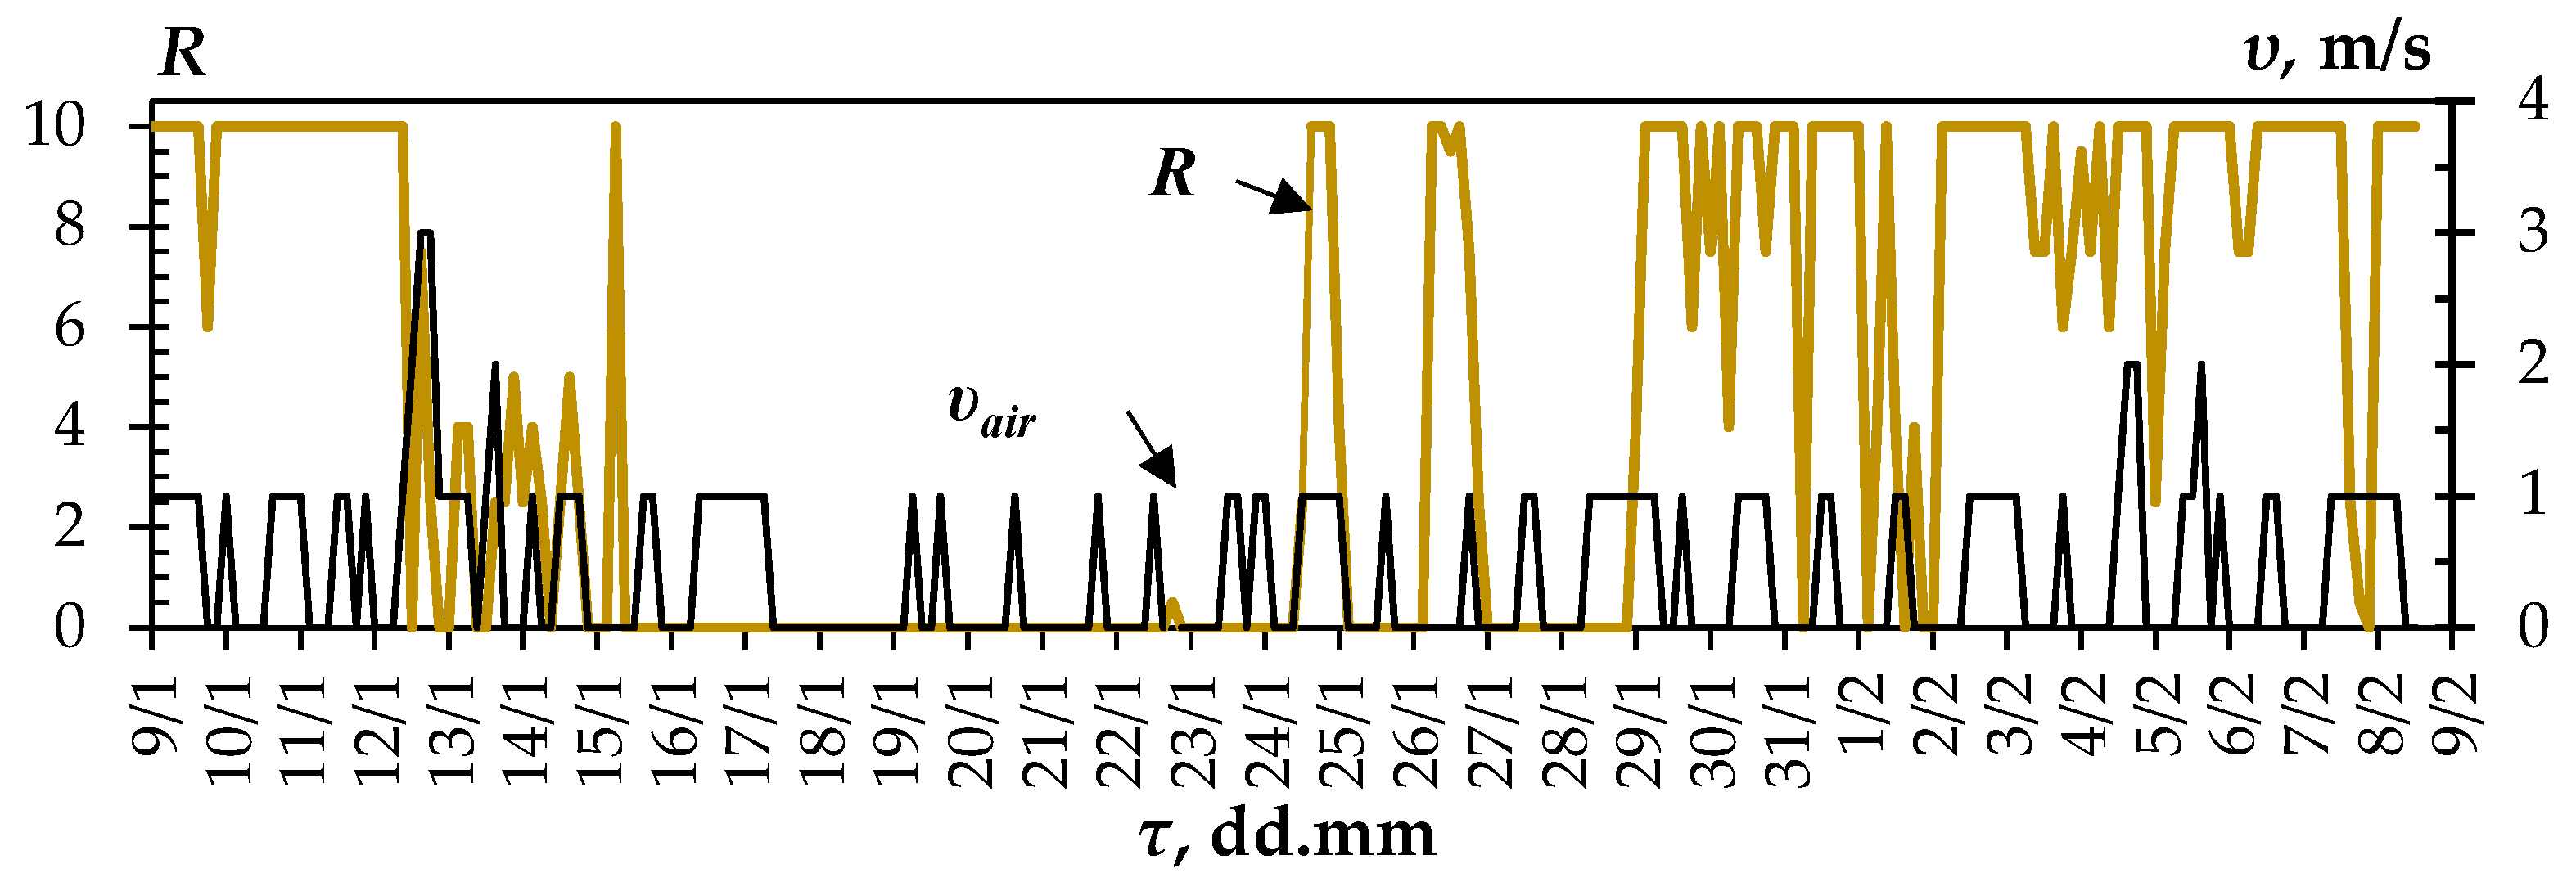
The radiator used in the experimental refrigeration unit has a low overall heat transfer coefficient. In this regard, for comparison, the heat transfer in the second radiator (with increased thermal conductivity) was theoretically studied. It has the same characteristics as the radiator discussed above. However, it differs in the following parameters: The radiant plate is made of aluminum sheet with a thermal conductivity of 190 W·m−1·K−1 and is 1 mm thick; the gap between the tube and the radiating plate is filled with thermal paste with a thermal conductivity of 1 W·m−1·K−1.

2.5. Weather Data

Experimental research was carried out from 9 January to 8 February 2023. It was the coldest period of the year. Data on the atmospheric air parameters from the meteorological station of the city of Almaty [30] are presented in Figure 4 and Figure 5. The atmospheric air temperature varied in the range from −20 to +5 °C. Experiments were not carried out at higher air temperatures, since the use of RC under such conditions has been widely studied earlier. It should also be noted that, during the selected period, there was a gradual change in the temperature of the atmospheric air. This made it possible to obtain data on the operation of the refrigeration unit under all possible conditions.
Figure 4 shows in gray the periods of time during which precipitation occurred in the form of rain and snow.
During the observation period at the location of the experimental unit, the average daily value of dust content with PM2.5 particles reached 85–100 µg·m−3.

3. Results of Experiments and Discussion

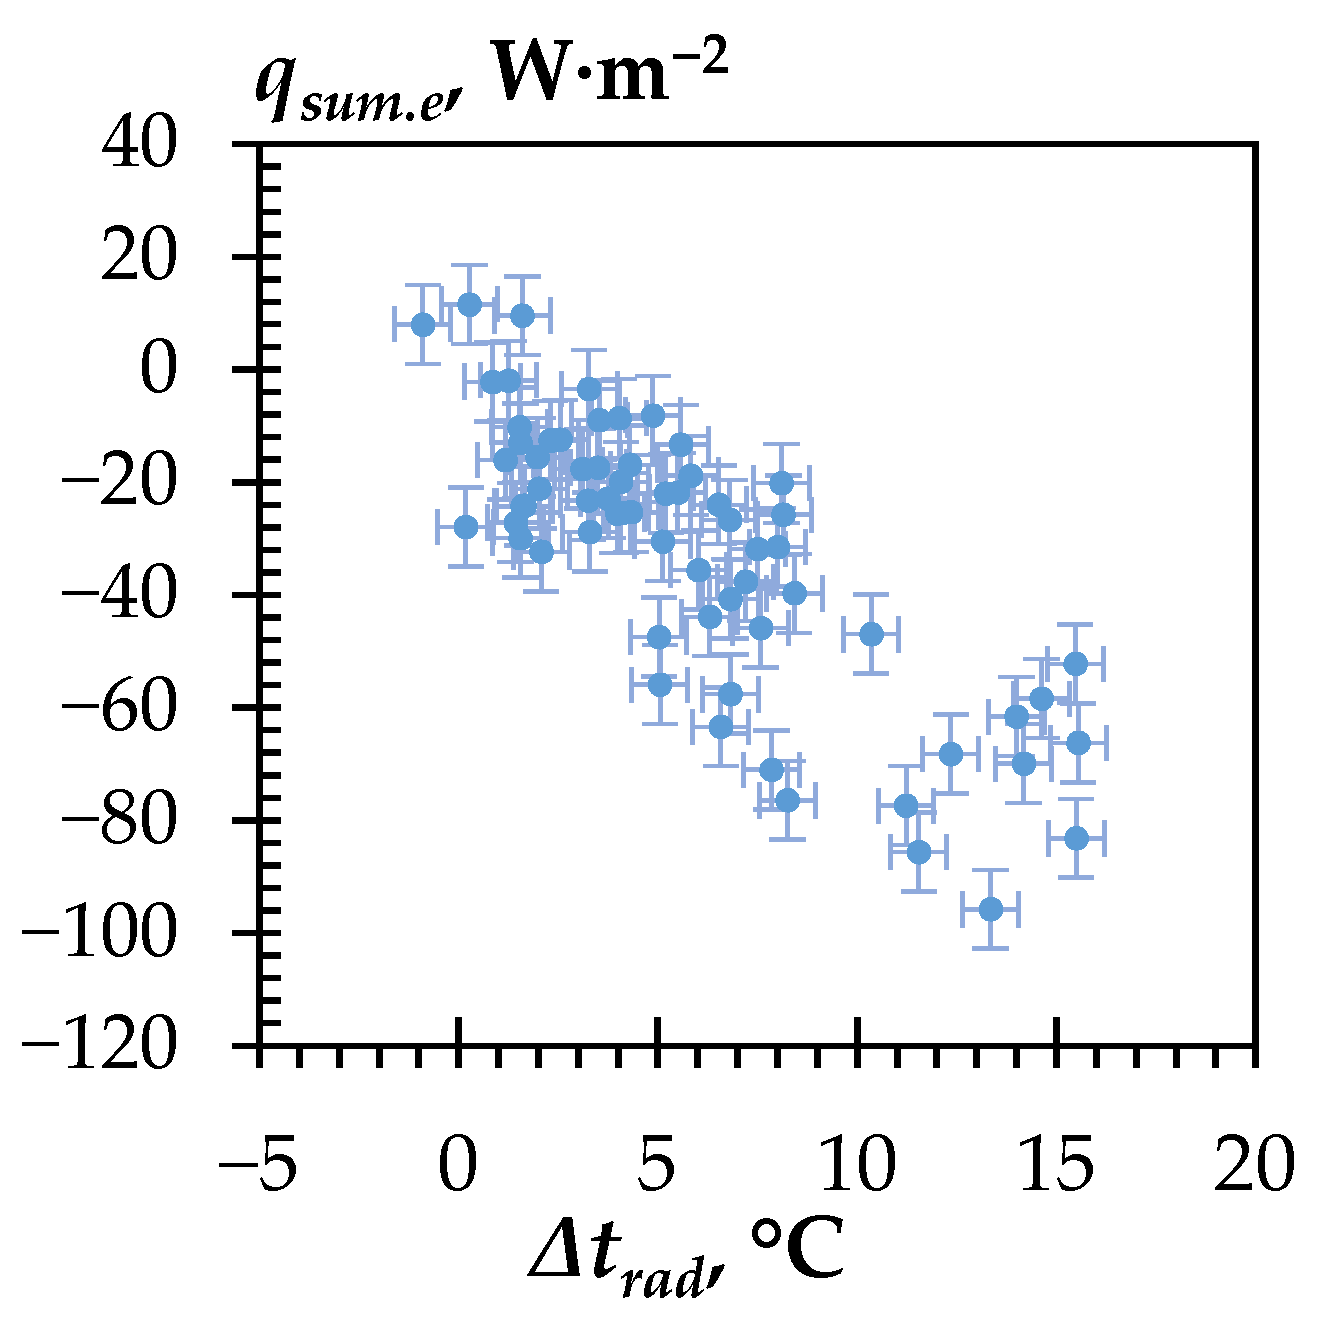
3.1. Heat Flow Calculation Results

The process of heat transfer liquid cooling in radiators occurred only at night from sunset to sunrise. In the daytime, the cooling process was not considered, since the used coating of the radiating surface poorly reflects sunlight.
Figure 6 shows a graph of temperature changes in the refrigeration unit during the night from 12 to 13 January. During this period, the atmospheric air temperature dropped from −15.8 to −19.1 °C. There were no clouds. The average dew point temperature was −19.7 °C. The temperature of the radiating surface between pipes of the radiator TI2 was equal to the air temperature. The radiating surface in the annular space did not warm up above the air temperature, which was due to the high thermal resistance of the radiator. In the cold accumulator at the initial moment of time, temperature stratification (3 °C) was observed. After turning on the pump for 3 h, the heat transfer liquid was mixed, due to which, the temperatures in the lower and upper parts were equal. After that, the temperature decreased linearly to −8.4 °C. The average temperature in the cold accumulator for 15 h decreased by 6.6 °C. The average temperature difference on the radiator was 13 °C.
Figure 6b shows temperature data on the night of January 17–18. In this case, the initial temperature in the cold accumulator was lower (−4.5 °C). The atmospheric air temperature varied from −9.9 to −15 °C. The temperature of the radiating surface was also equal to the temperature of the atmospheric air. The dew point temperature was −16 °C. At the initial moment, the temperature stratification in the cold accumulator reached 7.5 °C. It took all night to equalize the temperatures in the entire volume. The average temperature difference for the radiator was 7.1 °C. In this case, there was a decrease in the cooling rate as the temperature difference between heat transfer liquid and air decreased.
Data on the average temperature in the cold accumulator in all experiments are presented in Table 2. The table presents data on all experiments performed. In some days of the period under review, data are not available due to weekends and holidays and power failures.
For each three-hour period during the night, the heat flux in the radiator was determined qsum.e according to Equation (4) (Table 3). Over one night, the heat flux changed randomly. This may be due to the unpredictable influence of the wind and cloud levels.
On average, over the observation period, the heat flux from the radiator was about 31 W·m−2 at a temperature of the radiating surface of −5 °C. This was less than the theoretical maximum value [12,16], which, if heat was rejected only from the upper side of the radiator, could average about 80–90 W·m−2. Accordingly, the thermal resistance of the radiator had a significant impact on the outflowing heat flux.
In practice, to control the operation of a refrigeration unit, it is difficult to use parameters such as wind speed, cloudiness and humidity. When developing control algorithms, it is easier to use the temperature difference Δtrad. Therefore, we will consider the dependence of all the parameters on Δtrad.
The dependence of the heat flux rejected from 1 m2 of the surface on the temperature difference on the radiator Δtrad presented in Figure 7. Obviously, an increase in the difference between the coolant temperature and the air temperature leads to an increase in the amount of heat flux. At a temperature difference less than 3 °C, the radiator almost did not reject heat. Depending on the level of cloudiness, wind speed, air humidity and other parameters, the heat flux in the radiator varied by ±20 W·m−2. Because of this, based on the experimental data, it is impossible to determine the exact pattern describing the change in the heat flux.

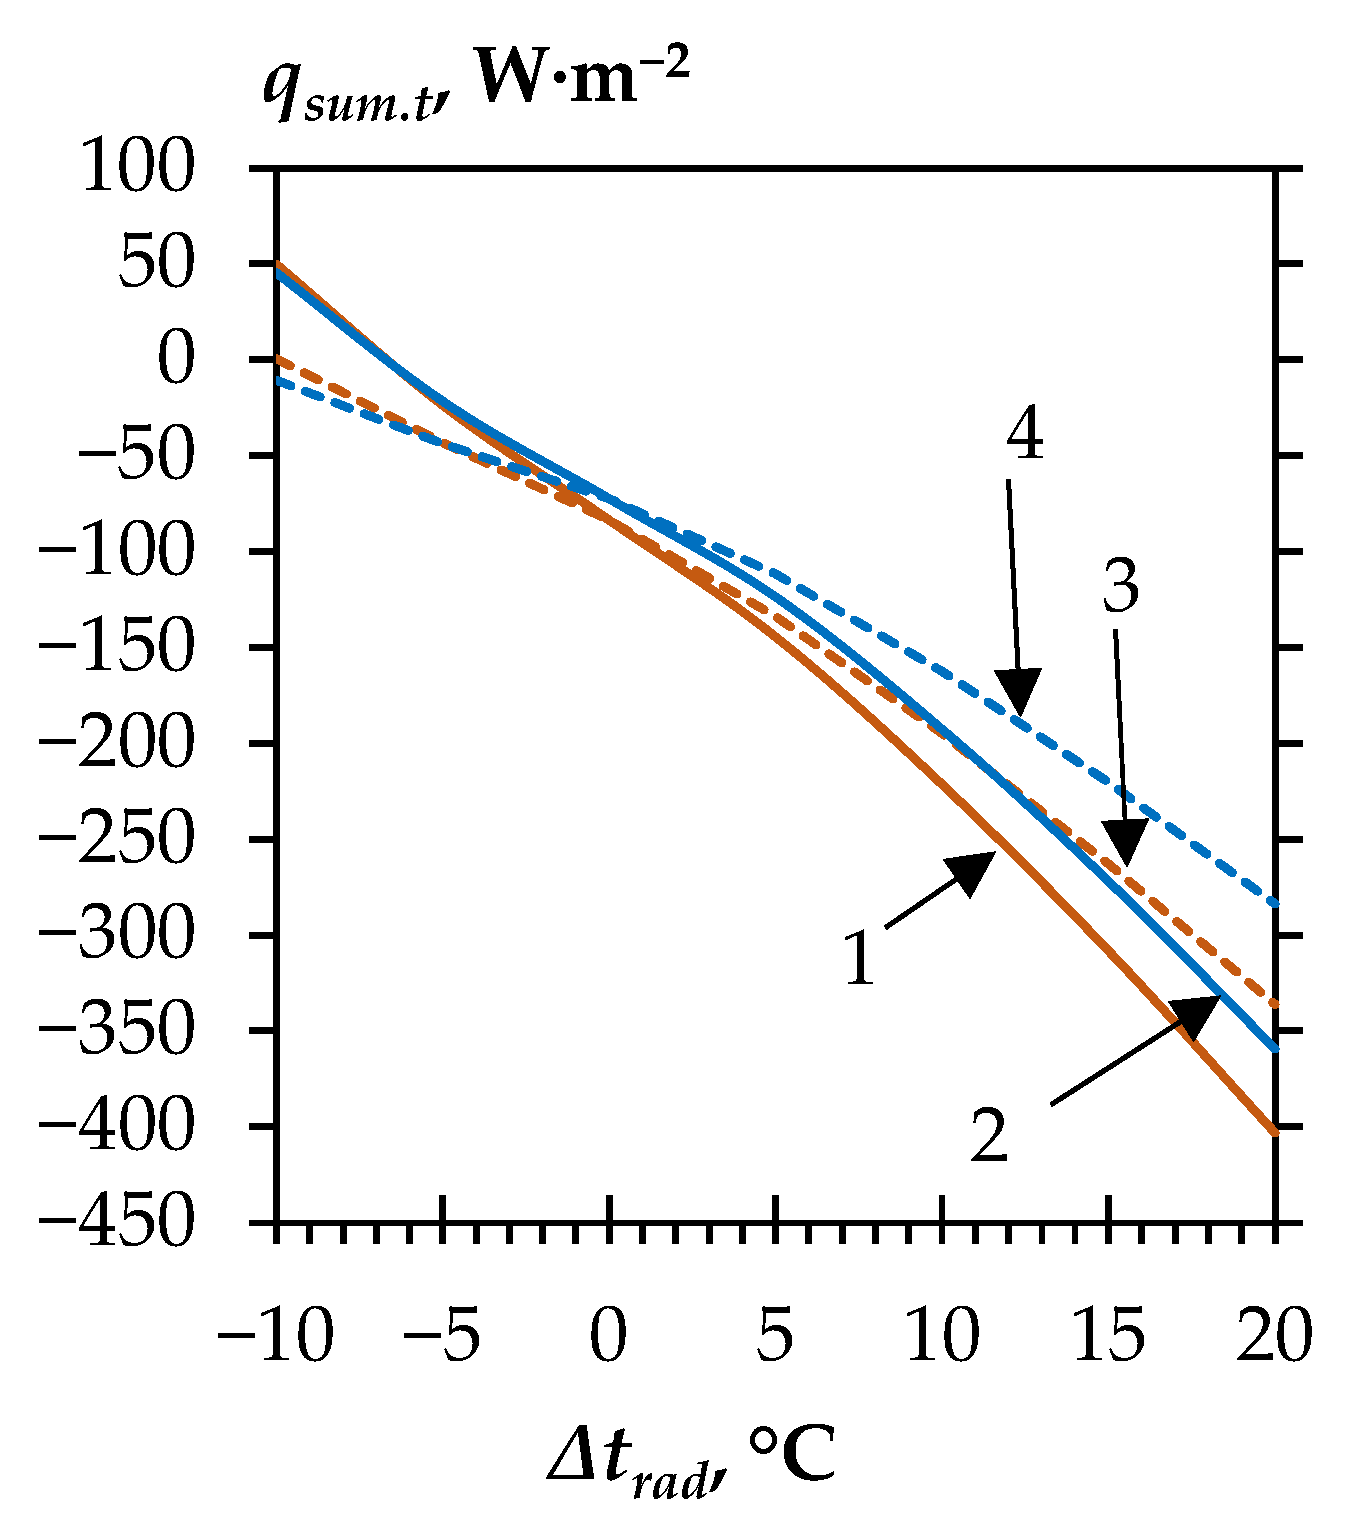
3.2. Comparison of Experimental and Theoretical Data

At the specified conditions in the experiments, for each moment of time, the heat flux is calculated qsum.t according to Equation (10) (Table 4).
The results of the comparison of the theoretical and experimental heat flux are presented in Figure 8. There is a satisfactory agreement between qsum.e and qsum.t, taking into account the measurement errors. Therefore, the theoretical model for calculating qsum.t can be used in further research.
The heat transfer coefficient of the radiator did not have any obvious dependence on the temperature difference, and its average value was krad = 5.6 ± 1.4 W·m−2·K−1.
In paper [21], the radiator rejected 40–60 W·m−2 from the upper radiating surface at a temperature difference of 15–27 °C and an ambient air temperature from +8 to +20 °C. Its underside was covered with thermal insulation. As a result, the average value of the overall heat transfer coefficient of the structure was about 3.5 W·m−2·K−1, which is less than the 6 W·m−2·K−1 in this work. Obviously, when the heat transfer liquid temperature is higher than the ambient temperature, the underside of the radiant plate should also be used for heat removal. In general, the results of [21] are close to the results of this study.

3.3. The Influence of Snow on the Operation of the Radiator

On some days (for example, from 9 to 13 January), snow accumulated on the radiator at night. However, even with a snow thickness of 100 mm, the experimental heat flux was consistent with the expected theoretical heat flux. In this case, this can be explained by the fact that the heat exchange from the underside of the radiative plate made a significant contribution to the total heat transfer. Additionally, a certain amount of heat could be spent on melting snow.
For a radiator that is thermally insulated from below, according to the theoretical model used, snowfall will lead to a significant reduction in heat flux. During the operation of such a radiator, snowfall can create difficulties, since its removal requires significant labor contribution. Even when a heat transfer liquid with a temperature above 0 °C was supplied to the radiator, snow removal was very slow (tens of hours) and was accompanied by the formation of an ice layer on the radiator. The effect of snowfall on heat transfer in the radiator should be studied in more detail in further studies.

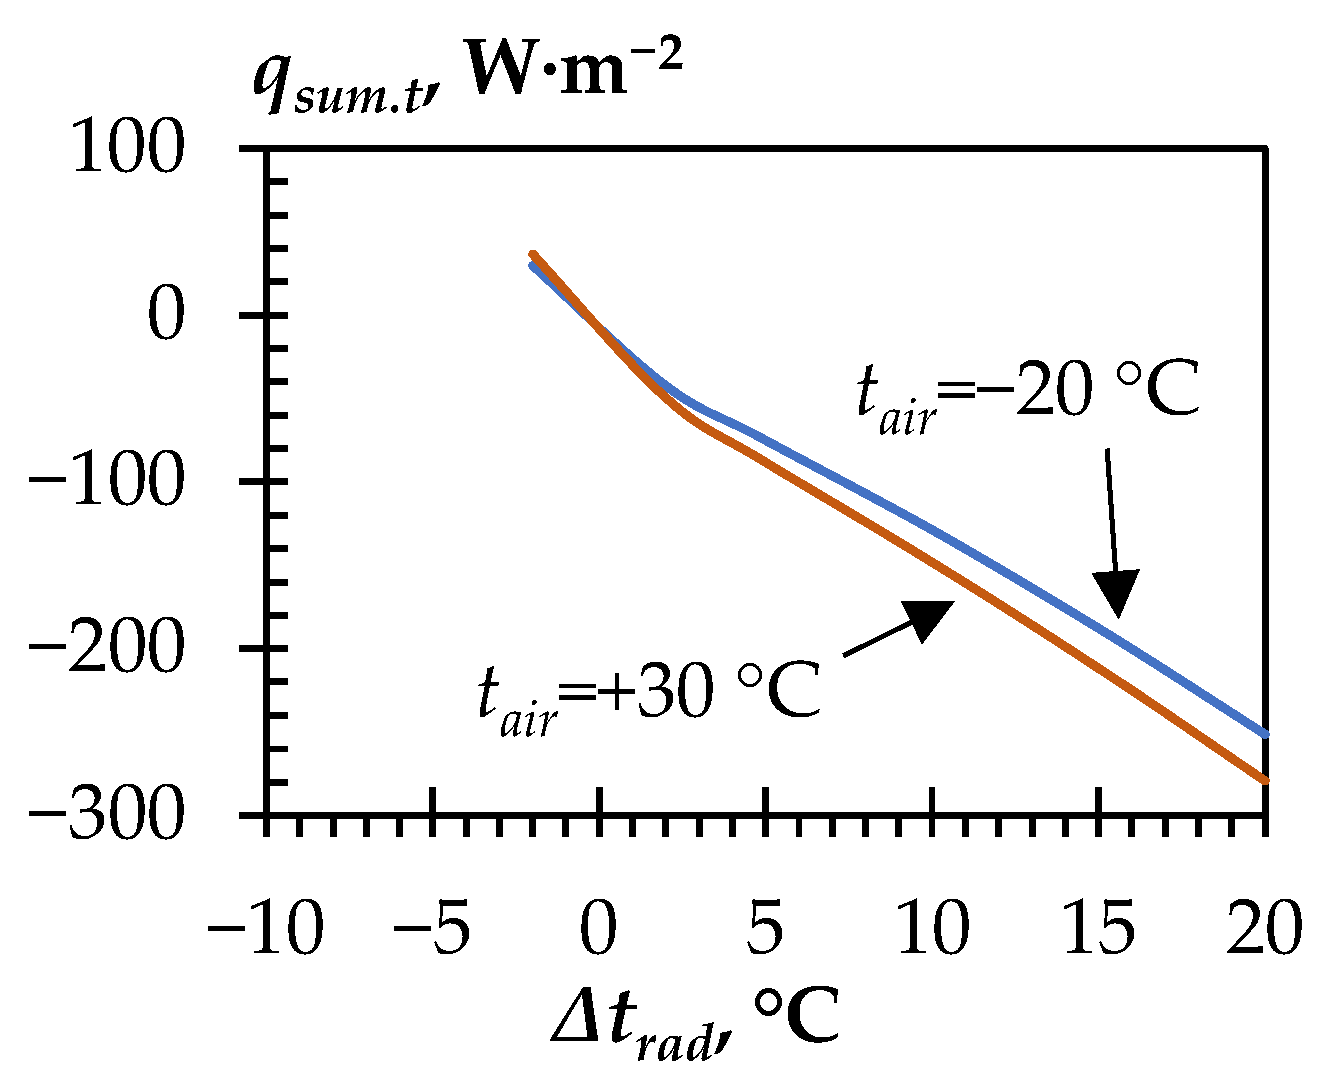
3.4. Estimation of the Maximum Possible Amount of Heat Transerred by the Radiator

To assess the quality of the resulting radiator, the theoretical maximum heat flux was calculated according to Equation (8). The results are shown in Figure 9. It was assumed that there were no clouds and no wind. For winter conditions (for curves 2 and 4), the air temperature is assumed to be −20 °C, and the relative humidity is 80%. Additionally, for reference, a calculation was made for the summer conditions (curves 1 and 3), at which the air temperature was assumed to be +30 °C and relative humidity 40%. With a decrease in the temperature of the radiating surface in winter, the heat flux can decrease by 15% compared to summer values at the same temperature difference. This is due to a decrease in the radiative heat transfer. It also follows from the calculations that the use of the lower side of the radiating plate increases the heat flux by about 20%.
The radiator efficiency ηr averaged 22 ± 10% over the observation period.
With a temperature difference of 5 °C, 74% of the heat is transferred by radiation, 16% is transferred by convection from the top side of the radiating plate and 10% due to convection from the underside of the radiating plate. With a temperature difference of 10 °C, 57% of the heat is transferred by radiation, 28% is transferred by convection from the top side of the radiating plate and 15% due to convection from the underside of the radiating plate.
Figure 10 shows the calculations of the heat flux in a radiator with increased thermal conductivity. Such a radiator with a temperature difference of 5 °C would reject 74 W·m−2 (15% less than in summer). This value was 2.5 times greater than the heat flux obtained in the experiments. Therefore, the efficiency of a radiator ηr with increased thermal conductivity could reach 51%. The overall heat transfer coefficient could be increased to around 12–15 W·m−2·K−1 at a temperature difference around 5 °C. This assumption is consistent with the data of [20], in which the value of the overall heat transfer coefficient reached 12 W·m−2·K−1.

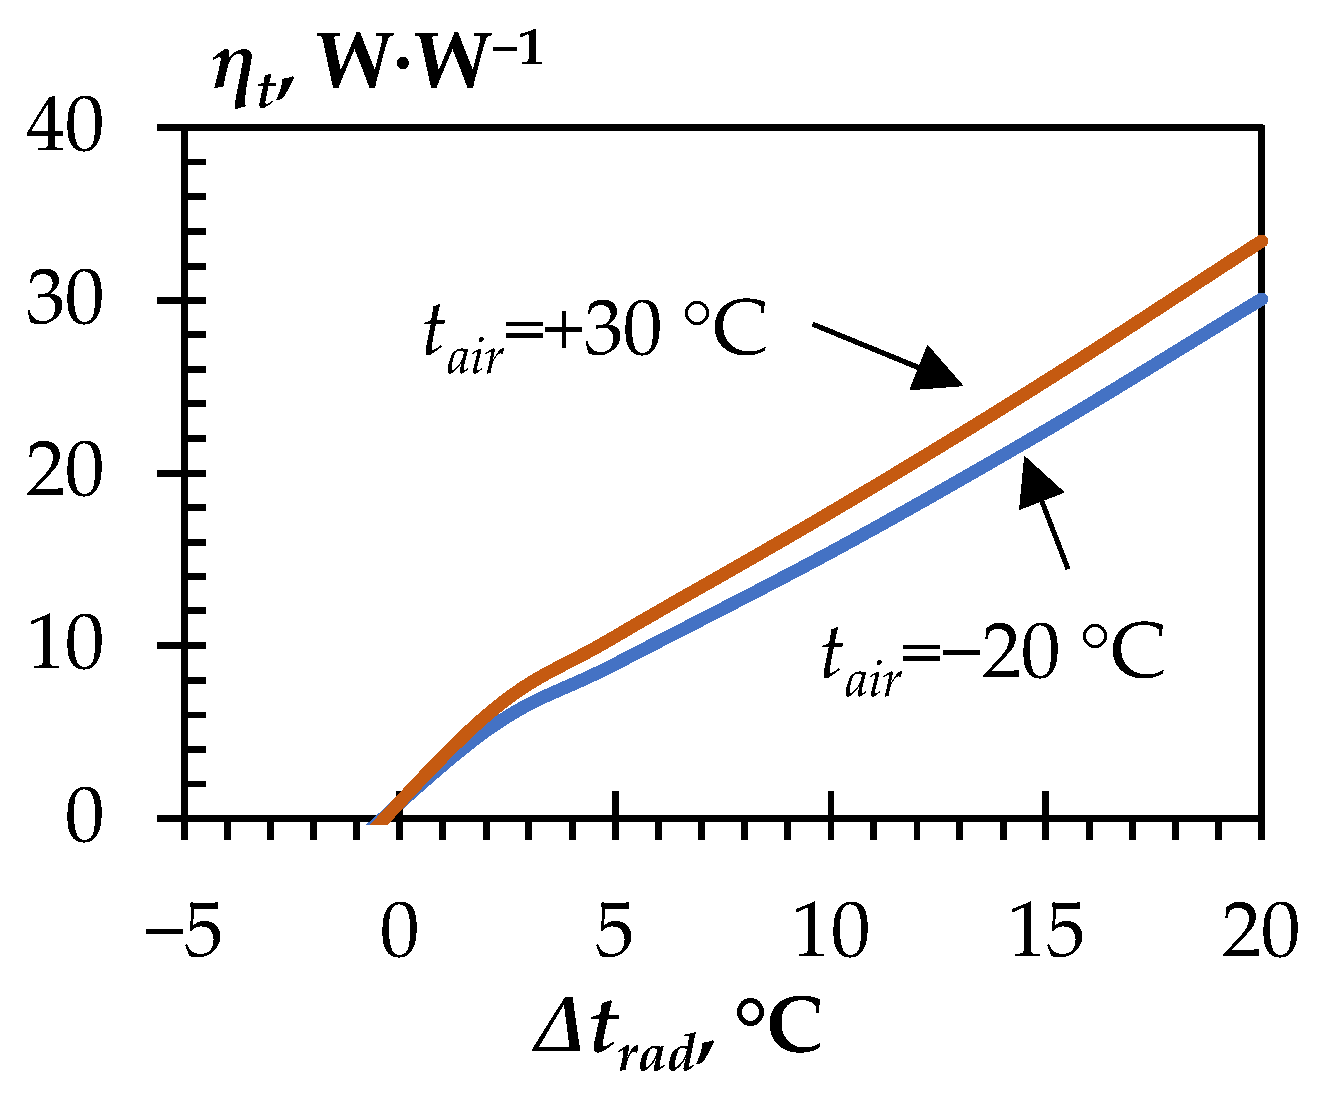
3.5. Experimental Specific Energy Consumption for Heat Dissipation

For each three-hour period, according to Equation (7), the experimental ηe was calculated (Figure 11). On average, over the observation period, it had a value of 3.7 W·W−1.
Further, it was investigated how the use of a radiator with increased thermal conductivity could affect the ηe. When calculating, it was assumed that the power consumption of the pump did not change. It was also assumed that there were no clouds and no wind. The calculation results are shown in Figure 12. With a temperature difference of 5 °C in winter, the ηe could reach 9 W·W−1 and, at 15 °C, 22.5 W·W−1.

3.6. Conditions for Switching on RC Instead of a Vapor Compression Refrigeration Machine (Chiller)

For the practical use of RC in a certain period of time, the energy efficiency of this process must be higher than the energy efficiency of the conventional cooling methods. Under the given environmental conditions, the ηe of the unit must be at least as large as the coefficient of performance (COP) of commonly used types of refrigeration systems.
For comparison, the operation of the following chiller was considered. It was filled with R290 refrigerant. An energy-efficient piston compressor Danfoss DLV4.0CN (Q0 = 300 W) with a single-phase electric motor was used. Overheating of the refrigerant at the inlet to the compressor happened at 20 °C. Subcooling of the refrigerant at the outlet of the condenser happened at 2 °C. A finned tube condenser was used to remove heat to the environment. Its fan consumed electricity in the amount of 5% of the rejected heat power. The chiller used a plate evaporator. Cooling of the heat transfer liquid in the evaporator reached 5 °C. The condensing temperature was +30 °C. The evaporation temperature was −10 °C. An aqueous solution of ethylene glycol with a mass concentration of 40% was used as a heat transfer liquid. The volume of the pumped heat transfer liquid was determined by the cooling capacity of the compressor and the given temperature change of the heat transfer liquid. The power consumption of the pump supplying the heat transfer liquid to the evaporator was theoretically calculated based on the data on the flow of the heat transfer liquid and the pump head. It was assumed that the pump head was equal to 8 m in all cases. The overall efficiency of the circulation pump was 30%.
The COPrm of a chiller is defined as the ratio of the cooling capacity of its compressor to the total electrical power input. The total electrical power consumption includes the power consumption of the motors of compressor, condenser fan and pump. Calculated, the COPrm = 2.15 W·W−1.
According to Figure 11, the experimental refrigeration unit was more efficient than the chiller when the temperature difference on the radiator exceeded 6 °C. At times when this condition was not met, it was not advisable to use radiators for cooling, and it was necessary to use an ordinary vapor compression refrigeration machine. From using a radiator with increased thermal conductivity (Figure 12), it is sufficient that the temperature of the heat transfer liquid be 2 °C higher than the ambient air temperature.

4. Conclusions

  • Experimental studies of a radiator integrated into the roof have shown that, in winter in a continental climate, it can discharge from 20 ± 6.8 to 80 ± 8 W·m−2 at temperature difference changes from 5 to 15 °C. Due to the removal of heat from both sides of the radiating surface, the heat transfer coefficient of the radiator reached 5.6 ± 1.4 W·m−2·K−1. An analysis of the results showed that the theoretical method used for calculating heat transfer processes in the radiator was applicable in the winter period, since it showed satisfactory agreement with the experimental data. A theoretical calculation showed that, in winter, the heat flux removed by the radiator will be 15% less than the heat flux in summer. The same theoretical methods can be used in the warm season. When heat was removed from both sides of the radiating plate of the radiator, precipitation in the form of snow did not cause a significant decrease in the heat flux.
    A steel surface coated with zinc oxide is an acceptable coating for a nonselective radiator. In wintertime, ice and snow accumulate on the radiating surface. Because of this, its optical properties will have little effect on the process of heat removal. However, the investigated construction of the radiator is not optimal, since it has a relatively low heat transfer coefficient. The rejected heat flux can be increased more than twice by increasing the thermal conductivity of the radiating plate. The radiator design studied in this work should not be used. However, a radiator with increased thermal conductivity can be applied. The proposed design cannot be used to obtain temperatures below the ambient air temperature. At the same time, it allows to minimize the cost of 1 m2 of the radiating surface.
    Even when using a radiator with increased thermal conductivity, the heat flow will not exceed 51% of the maximum possible theoretical value.
    In the presented work, the effect of wind on the operation of the radiator was not taken into account, which can be significant when placing the radiator on the roof of a building. The operation of the radiator during the daytime has not been studied.
  • The amount of heat transferred per watt of electrical power of a refrigeration unit with radiative and convective cooling of the heat transfer liquid has been estimated. It varied from 0 to 8 W·W−1 at a temperature difference from 0 to 15 °C. The investigated experimental refrigeration unit will be more efficient than a traditional vapor compression chiller, provided that the heat transfer liquid temperature is 6 °C higher than the ambient air temperature. When this condition is met, the radiator can be turned on. The use of a radiator with increased thermal conductivity of the radiating plate could increase the amount of heat transferred per watt of electrical power to 9–22.5 W·W−1 at a temperature difference of 5 to 15 °C. This result shows that RC can be used in winter instead of a vapor compression chiller.
    The results of the work can be used in the development of refrigeration systems with natural or radiative cooling of the heat transfer liquid used in winter to maintain the temperature in food storage chambers. Data on the dependence of the heat flow and energy efficiency can be used in the development of control schemes of such systems.
    Additionally, the results of this work can be indirectly used in the study of the thermal balance of engineering structures in winter conditions.
    A more detailed study of the effect of ice on the radiating surface of the radiator under an infrared radiation flux should be accomplished. Additionally, attention should be paid to reducing the energy consumption for the circulation of the heat transfer liquid. In further works, the possibility of cooling the air in radiators in winter should also be feasible. Conducting these studies can be aimed at comparing the advantages and disadvantages of using RC in comparison with traditional free cooling due to convection.

Author Contributions

Conceptualization, A.T., A.G. and D.K.; methodology, A.G., D.K. and A.M.; software, A.G.; validation, A.T.; formal analysis, A.G.; investigation, N.V., M.A. and A.M.; resources, R.J.; data curation, N.V., M.A. and A.M.; writing—original draft preparation, A.G., D.T.-D. and D.K.; writing—review and editing, A.T.; visualization, A.G. and D.K.; supervision, A.T. and I.K.; project administration, A.T. and R.J. and funding acquisition, A.T. and I.K. All authors have read and agreed to the published version of the manuscript.

Funding

This research was funded by the Science Committee of the Ministry of Science and Higher Education of the Republic of Kazakhstan, grant number AP09258901.

Data Availability Statement

The data are available from the corresponding author upon reasonable request.

Conflicts of Interest

The authors declare no conflict of interest. The funders had no role in the design of the study; in the collection, analyses or interpretation of the data; in the writing of the manuscript or in the decision to publish the results.

Nomenclature

Aradradiator area (m2)
cheat capacity (J·kg−1·K−1)
COPcoefficient of performance (W·W−1)
kradoverall heat transfer coefficient (W·m−2·K−1)
mmass (kg)
Nppower consumption of the pump (W)
ttemperature (°C)
tdewdew temperature (°C)
tradtemperature of the radiating surface (°C)
Δtradaverage temperature difference on the radiator (°C)
Tskyassumptive sky temperature (K)
υairwind speed (m·s−1)
Qsumtotal heat power rejected by the radiator (W)
Qpheat power released by the pump (W)
Qwheat power gained through the wall of the cold accumulator (W)
qheat flux (W·m−2)
qconv.up, qconv.downconvective heat flux from upper and under sides of plate (W·m−2)
qrad.up, qrad.downinfrared heat flux from upper and under sides of plate (W·m−2)
qsumtotal heat flux from radiator (W·m−2)
qsum.t.maxtotal maximum possible theoretical heat flux from radiator (W·m−2)
Vnnominal flow, m3·hour−1
εradrelative emissivity of surface
ηefficiency of radiator
σStefan-Boltzmann constant 5.67·10−8 (W·m−2·K−4)
γangel of contact of tube by plate (°)
τduration of time interval between measurements (s)
Subscript
1at the beginning of the period
2at the end of period
airambient air
convconvective
eexperimental value
medaverage value for period of time
htlheat transfer liquid in cold accumulator
radradiative
rcradiative cooling
rmrefrigeration machine
ttheoretical value

References

  1. Coulomb, D.; Dupon, J.-L.; Pichard, A. The Role of Refrigeration in the Global Economy: 29th Informatory Note on Refrigeration Technologies; International Institute of Refrigeration: Paris, France, 2015. [Google Scholar]
  2. Scarlat, N.; Prussi, M.; Padella, M. Quantification of the carbon intensity of electricity produced and used in Europe. Appl. Energy 2022, 305, 117901. [Google Scholar] [CrossRef]
  3. Suhendri; Hu, M.; Su, Y.; Darkwa, J.; Riffat, S. Implementation of passive radiative cooling technology in buildings: A review. Buildings 2020, 10, 215. [Google Scholar] [CrossRef]
  4. Li, H.; Zhang, K.; Shi, Z.; Jiang, K.; Wu, B.; Ye, P. Cooling benefit of implementing radiative cooling on a city-scale. Renew. Energy 2023, 212, 372–381. [Google Scholar] [CrossRef]
  5. Zhao, B.; Hu, M.; Ao, X.; Chen, N.; Pei, G. Radiative cooling: A review of fundamentals, materials, applications, and prospects. Appl. Energy 2019, 236, 489–513. [Google Scholar] [CrossRef]
  6. Mulik, P.V.; Kapale, U.C.; Kamble, G.S. Comparative study of experimental and theoretical evaluation of nocturnal cooling system for room cooling for clear and cloudy sky climate. Glob. Chall. 2019, 3, 1900008. [Google Scholar] [CrossRef] [PubMed] [Green Version]
  7. Taylor, S.; Long, L.; McBurney, R.; Sabbaghi, P.; Chao, J.; Wang, L. Spectrally-selective vanadium dioxide based tunable metafilm emitter for dynamic radiative cooling. Sol. Energy Mater. Sol. Cells 2020, 217, 110739. [Google Scholar] [CrossRef]
  8. Goldstein, E.A.; Raman, A.P.; Fan, S. Sub-ambient non-evaporative fluid cooling with the sky. Nat. Energy 2017, 2, 17143. [Google Scholar] [CrossRef]
  9. Meng, F.; Zhang, Q.; Lin, Y.; Zou, S.; Fu, J.; Liu, B.; Wang, W.; Ma, X.; Du, S. Field study on the performance of a thermosyphon and mechanical refrigeration hybrid cooling system in a 5G telecommunication base station. Energy 2022, 252, 123744. [Google Scholar] [CrossRef]
  10. Karagusov, V.I.; Goshlya, R.Y.; Serdyuk, V.S.; Kolpakov, I.S.; Nemykin, V.A.; Pogulyaev, V.I. Experimental stand for investigation of the radiation life—Support systems: First experiments. AIP Conf. Proc. 2018, 2007, 030014. [Google Scholar]
  11. Karagusov, V.I.; Serdyuk, V.S.; Kolpakov, I.S.; Nemykin, V.A.; Pogulyaev, V.I. Experimental determination of rate and direction of heat flow of the radiation life—Support system with vacuum heat insulation. AIP Conf. Proc. 2018, 2007, 030015. [Google Scholar]
  12. Tsoy, A.P.; Granovskiy, A.S.; Baranenko, A.V.; Tsoy, D.A. Effectiveness of a night radiative cooling system in different geographical latitudes. AIP Conf. Proc. 2017, 1876, 020060. [Google Scholar]
  13. Fält, M.; Zevenhoven, R. Radiative cooling in northern Europe for the production of freezer temperatures. In Proceedings of the 23rd International Conference on Efficiency, Cost, Optimization, Simulation, and Environmental Impact of Energy Systems, ECOS 2010, Coupole, France, 14 June 2010; pp. 413–419. [Google Scholar]
  14. Tsoy, A.P.; Alimkeshova, A.K.; Granovskiy, A.S. Cooling process modeling of a periodically incoming liquid, using night radiation cooling. AIP Conf. Proc. 2018, 2007, 030066. [Google Scholar]
  15. Yang, H.; Hu, Z.; Ge, F.; Liu, X. Analysis of cooling performance and energy consumption of nocturnal radiation and natural ventilation combined mechanical refrigeration system for outdoor prefabricated substation. Appl. Therm. Eng. 2023, 230 Pt A, 120650. [Google Scholar] [CrossRef]
  16. Tsoy, A.P.; Granovsky, A.S.; Tsoy, D.A. Modelling of the operation of a refrigeration unit using radiative cooling to maintain the storage temperature in the cold room. MATEC Web Conf. 2020, 324, 02006. [Google Scholar] [CrossRef]
  17. ISO 4064/1-77; Measurement of Water Flow in Closed Conduits—Meters for Cold Potable Water—Part 1: Specification. ISO (International Organization for Standardization): Geneva, Switzerland, 1977.
  18. Meir, M.G.; Rekstad, J.B.; LØvvik, O.M. A study of a polymer-based radiative cooling system. Sol. Energy 2002, 73, 403–417. [Google Scholar] [CrossRef]
  19. Mukhachev, G.A.; Shchukin, V.K. Thermodynamics and Heat Transfer: Textbook for Aviation Universities, 3rd ed.; Higher School: Moscow, Russia, 1991. (In Russian) [Google Scholar]
  20. Tsoy, A.; Granovskiy, A.; Nurakhmetov, B.; Koretskiy, D.; Tsoy-Davis, D.; Veselskiy, N. Condensation heat removal due to the combined impact of natural convection and radiative cooling. East. Eur. J. Enterp. Technol. 2023, 121, 6–21. [Google Scholar] [CrossRef]
  21. Zhuang, Z.; Xu, Y.; Wu, Q.; Liu, B.; Li, B.; Zhao, J.; Yang, X. Experimental Study on the Performance of a Space Radiation Cooling System under Different Environmental Factors. Energies 2022, 15, 7404. [Google Scholar] [CrossRef]
  22. Liebert, C.H. Spectral Emittance of Aluminum Oxide and Zinc Oxide on Opaque Substrates; NASA: Washington, DC, USA, 1965. Available online: https://ntrs.nasa.gov/api/citations/19660001050/downloads/19660001050.pdf (accessed on 11 May 2023).
  23. Warren, S.G. Optical properties of ice and snow. Philos. Trans. R. Soc. A Math. Phys. Eng. Sci. 2019, 377, 20180161. [Google Scholar] [CrossRef] [PubMed]
  24. Walton, G. Thermal Analysis Research Program; Report No NBSIR 83-2655; National Engineering Laboratory, Building Physics Division: Washington, DC, USA, 1983. [Google Scholar]
  25. Samuel, D.G.L.; Nagendra, S.M.S.; Maiya, M.P. Passive alternatives to mechanical air conditioning of building: A review. Build. Environ. 2013, 66, 54–64. [Google Scholar] [CrossRef]
  26. GOST 4789-97; Aluminum and Aluminum Alloys Deformable. Standartinform: Moscow, Russia, 1997.
  27. Solontsev, Y.P.; Ermakov, B.S.; Sleptsov, O.I. Materials for Low and Cryogenic Temperatures; Himizdat: Saint-Petersburg, Russia, 2008. (In Russian) [Google Scholar]
  28. GOST 1050-2013; Metal Products from Nonalloyed Structural Quality and Special Steels. General Specification. Interstate Council for Standardization, Metrology and Certification. Standartinform: Moscow, Russia, 2013.
  29. Babichev, A.P.; Babushkina, A.M.; Bratkovsky, A.M. Physical Quantities: Handbook; Energoatomizdat: Moscow, Russia, 1991. (In Russian) [Google Scholar]
  30. Weather Schedule rp5. Archive of Weather Data for Cities of the World. Available online: http://rp5.kz (accessed on 11 May 2023).
Figure 1. Hydraulic diagram of the refrigeration unit with temperature sensor locations: V1–V4—ball valves; P1 and P2—pumps; CA—cold accumulator; AC—heat exchanger; EH—electric heater; RAD—radiator; FIT1 and FIT2—flowmeters; TI1–TI8—temperature sensors.
Energies 16 04865 g001
Figure 2. Radiator of the experimental unit. (a) Top view. (b) Heat-exchange tubes and collector. (c) Radiator cross-section. 1—radiating plate. 2—pipe. 3—collector.
Energies 16 04865 g002
Figure 3. Refrigeration unit. (a) Cold accumulator and radiator; (b) cold room and control panel; P1—pump; CA—cold accumulator; AC—air cooler; SH—control panel; RAD—radiator; FIT1—flow meter.
Energies 16 04865 g003
Figure 4. Change in the ambient air temperature.
Energies 16 04865 g004
Figure 5. Total cloud level R and wind speed υair.
Energies 16 04865 g005
Figure 6. Temperatures in the refrigeration unit. (a) On the night of 12–13 January 2023; (b) on the night of 17–18 January. TI2—temperature of the upper radiating surface of the radiator between pipes; TI4—temperature at the bottom of the cold accumulator; TI5—temperature at the top of the cold accumulator; tca.med—average temperature in the cold accumulator.
Energies 16 04865 g006
Figure 7. Experimental dependence of the heat flux rejected from the radiator on the temperature difference on the radiator.
Energies 16 04865 g007
Figure 8. Comparison of the experimental and theoretical heat flux in the radiator.
Energies 16 04865 g008
Figure 9. The dependence of the theoretical maximum possible heat flux in the radiator due to radiation and convection on the temperature difference: 1—in summer when heat is rejected from the upper and lower surfaces; 2—in winter when heat is rejected from the upper and lower surfaces; 3—in summer when heat is removed only from the upper surface; 4—in winter when heat is removed only from the upper surface.
Energies 16 04865 g009
Figure 10. Dependence of the heat flux on the temperature difference in a radiator with increased thermal conductivity.
Energies 16 04865 g010
Figure 11. Experimental dependence of the heat transferred per watt of electrical power consumed on the temperature difference on the radiator.
Energies 16 04865 g011
Figure 12. Dependence of the heat transferred per watt of electrical power consumed on the temperature difference for radiators with high thermal conductivity.
Energies 16 04865 g012
Table 1. Parameters of the radiator, cold accumulator, and heat transfer liquid.
RadiatorCold Accumulator
ParameterValueParameterValue
Surface area, m25.14Formcylindrical
vertical
Material of radiating platesteel 08
GOST 1050
ModelKSC 40-203
Radiating plate thickness, mm0.6Dimensions
Sheet shapeC-21-1-000-06
GOST 24045-2016
Diameter, mm1220
Radiating surface coatingZnOHeight, mm1620
Pipes Inner volume, m31.5
Number18
Distance between pipe axes, mm100Thermal insulation
Outer diameter, mm20MaterialMineral wool
(Ursa GEO M-25F)
Wall thickness1.5Thermal insulation thickness, mm150
MaterialAluminum AD1 GOST 4784-2019Thermal conductivity λD, W·m−1·K−10.034
Heat transfer liquid
Materialaqueous solution of ethylene glycol
Mass concentration,%40
Mass, kg900 ± 20
Table 2. The average temperature in the cold accumulator in the experiments, °C.
Data18:0021:000:0003:0006:0009:00
09–10.011.701.350.950.900.80
10–11.012.901.601.600.80−0.70
11–12.011.350.15−0.80−2.30−3.35
12–13.01−1.75−3.00−4.10−5.80−7.00−8.35
17–18.01−4.504.45−5.40−6.15−6.65−6.70
18–19.01−5.65−6.20−6.55−7.20−7.80−8.20
19–20.01−6.95−7.05−7.30−7.35−7.65−8.00
23–24.01−8.00−7.707.60−7.70−8.10−8.40
24–25.01−6.95−6.85−7.15−7.30−7.25−7.55
25–26.01−6.00−6.15−6.45−6.65−6.85−7.05
26–27.01−5.65−5.90−6.10−6.15−6.20−6.55
01–02.026.255.204.003.504.053.83
02–03.025.004.554.103.754.104.40
06–07.024.754.403.653.353.102.95
07–08.025.604.704.004.454.153.50
Table 3. Experimental heat flux in the radiator.
Data18:00–21:0021:00–0:000:00–3:0003:00–6:0006:00–9:00
Δtradqsum.eΔtradqsum.eΔtradqsum.eΔtradqsum.eΔtradqsum.e
09–10.011.4−27.21.6−29.91.5−10.21.6−13.0
10–11.018.3−76.49.0−2.810.4−47.011.6−85.6
11–12.0115.6−66.215.5−52.215.5−83.214.6−58.4
12–13.0114.2−69.914.0−61.613.4−95.812.4−68.211.2−77.4
17–18.015.8−1.96.8−57.67.6−45.97.5−31.87.9−6.3
18–19.016.0−35.66.5−24.06.8−40.77.2−37.76.8−26.6
19–20.012.6−12.44.1−19.94.9−8.15.2−22.04.3−25.4
23–24.011.69.51.3−1.92.3−12.53.3−28.81.6−24.2
24–25.010.9−2.21.7−24.22.0−15.63.3−3.53.8−22.9
25–26.011.2−16.13.3−23.24.3−16.94.3−16.93.5−17.4
26–27.012.0−21.23.117.73.5−9.04.0−8.74.0−25.7
01–02.026.6−63.47.9−71.08.0−31.58.2−25.8
02–03.025.1−30.52.1−32.40.2−28.00.311.5−0.98.0
06–07.024.1−25.55.0−47.55.5−21.85.8−18.85.6−13.3
07–08.025.1−55.95.2−43.88.1−20.28.4−39.7
Table 4. Theoretical heat flux in the radiator, W·m−2.
Data18:00–21:0021:00–0:000:00–3:0003:00–6:0006:00–9:00
09–10.01−10.0−10.8−10.6−10.8
10–11.01−50.4−63.3−70.3
11–12.01−94.9−94.3−94.7−89.2
12–13.01−88.5−87.6−85.6−76.6−69.6
17–18.01−44.6−48.9−48.1
18–19.01−39.7−42.3−44.0−46.2−43.8
19–20.01−18.7−27.9−31.8−34.4−29.4
23–24.01−12.5−9.8−17.1−23.0−12.5
24–25.01−6.8−12.4−14.5−23.1−26.0
25–26.01−9.6−23.0−29.3−28.6−22.7
26–27.01−14.6−21.6−24.7−27.4−27.4
01–02.02−43.7−51.2−51.0−49.5
02–03.02−2.4−13.8−1.1−1.96.4
06–07.02−25.8−31.3−34.1−36.0−34.8
07–08.02−33.9−41.8−52.3−54.3
Disclaimer/Publisher’s Note: The statements, opinions and data contained in all publications are solely those of the individual author(s) and contributor(s) and not of MDPI and/or the editor(s). MDPI and/or the editor(s) disclaim responsibility for any injury to people or property resulting from any ideas, methods, instructions or products referred to in the content.

