
Composite Insulator Defect Identification Method Based on Acoustic–Electric Feature Fusion and MMSAE Network


1
School of Electrical Engineering and Automation, Fuzhou University, Fuzhou 350108, China
2
Fuzhou Power Supply Company, State Grid Fujian Electric Power Co., Ltd., Fuzhou 350009, China
3
Electric Power Research Institute, State Grid Fujian Electric Power Co., Ltd., Fuzhou 350007, China
*
Author to whom correspondence should be addressed.
Energies 2023, 16(13), 4906; https://doi.org/10.3390/en16134906
Submission received: 31 May 2023
/
Revised: 19 June 2023
/
Accepted: 20 June 2023
/
Published: 23 June 2023
(This article belongs to the Special Issue Insulating Materials for Future Power Systems: Performance Analysis, Defect Detection and Condition Assessment)
Abstract
:Aiming to solve the partial discharge problem caused by defects in composite insulators, most existing live detection methods are limited by the subjectivity of human judgment, the difficulty of effective quantification, and the use of a single detection method. Therefore, a composite insulator defect diagnosis model based on acoustic–electric feature fusion and a multi-scale perception multi-input of stacked auto-encoder (MMSAE) network is proposed in this paper. Initially, during the withstanding voltage experiment, the electromagnetic wave spectrometer and ultrasonic detector were used to collect and process the data of six types of composite insulator samples with artificial defects. The electromagnetic wave spectrum, ultrasonic power spectral density, and n-S map were then obtained. Then, the network architecture of MMSAE was built by integrating a stacked auto-encoder and multi-scale perception module; the feature extraction and fusion methods of the electromagnetic wave spectrum and ultrasonic signal were investigated. The proposed method was used to diagnose test samples, and the diagnostic results were compared to those obtained using a single input source and the artificial neural network (ANN) method. The results demonstrate that the detection accuracy of acoustic–electric feature fusion is greater than that of a single feature; the accuracy of the proposed method is 99.17%, which is significantly higher than the accuracy of the conventional ANN method. Finally, composite insulator defect diagnosis software based on PYQT5 and Keras was developed. Ten 500 kV aging composite insulators were used to validate the effectiveness of the proposed method and design software.
1. Introduction
Composite insulators are widely used in China due to their light weight, high strength, good resistance to pollution, and ease of operation and maintenance [1,2]. However, in the long-term operation process, the composite insulator will experience issues such as hydrophobicity decrease, mechanical strength decrease, insulation strength decrease, shed sheath fall, core rod fracture and degradation under the combined action of high field strength, high mechanical stress, air pollution, and other factors, which pose a threat to the safe operation of the power grid [3]. Under the influence of a strong electric field, partial discharge will occur when there are defects within the composite insulator, resulting in several physical and chemical effects, including an increase in leakage current, electric field distortion, electromagnetic wave, and ultrasonic radiation [4,5,6,7]. As a result, it is critical to investigate an effective composite insulator defect diagnosis method to improve operational reliability.
To solve the problem of composite insulator defect detection in operation, various detection methods have been studied at home and abroad [8,9,10,11]. In [12], the phase resolved partial discharge (PRPD) spectrum is used to determine the operating state of an insulator using the pulse current method. In [13], the 3D electric field of an insulator was simulated using finite element software, and the effect of surrounding air conductivity on the electric field was evaluated. In [14], an electric field sensor based on the Pockels effect was utilized to construct an insulator defect detection platform. In [15], the PD signals of six artificial insulation defect models were measured using the UHF method, which achieved the same accuracy as ANN and SVM, had a faster recognition speed, and was robust with respect to certain samples. A non-destructive ultrasonic phased array technology was utilized in [16] to detect defective silicone rubber composite insulator samples. In [17], an electrical equipment insulation defect detection system based on infrared and ultraviolet optoelectronics-sensing technology was developed. The insulation condition of the electrical equipment was evaluated comprehensively using the signals of infrared and ultraviolet optoelectronics sensors. However, most detection methods have drawbacks, such as expensive equipment and environmental sensitivity.
Pattern recognition is the study of how machines observe the environment, learn to extract useful features from the environment, and classify patterns rationally [18,19,20,21]. In [22], K-means clustering was applied to the PRPD spectrum, and different types of discharges were distinguished through feature extraction and data processing. Based on the support vector machine and probabilistic neural network, the authors of [23] extracted the probability density function of the mean, standard deviation, peak, and skewness of the wavelet packet coefficients by wavelet packet decomposition of PD signals and confirmed that the support vector machine is more precise. In [24], the wavelet packet decomposition of the PD signal was used to extract features, and the classification and regression tree algorithm, the bagging algorithm, and the regression random forest were used to locate the PD. In [25], a partial discharge pulse pattern recognition method based on a fuzzy decision tree was proposed. First, the C4.5 algorithm was used to extract fuzzy rules from the data, followed by the backpropagation training algorithm to fine-tune the fuzzy rules’ parameters. The authors of [26] proposed a CWD time–frequency spectrum based on variational mode decomposition and an optimized convolutional neural network with cross-layer feature fusion. In [27], a feature map produced by variational mode decomposition and the stacked sparse auto-encoder network were combined to determine the four discharge types. The authors of [28] proposed a method for separating and classifying pulse-shaped signals based on a fuzzy classifier that can identify and separate multiple PD sources. However, most current defect-recognition algorithms rely on a single physical signal, which is insufficient for a comprehensive evaluation of the detected target’s condition. The application of deep learning can remedy this deficiency.
The gaps left by previous studies to be filled include: (1) most of the detection methods of composite insulator defects have the subjectivity of human judgment, difficulty in effective quantification, and limitation of a single detection method; and (2) the composite insulator defect-recognition algorithm is mostly based on a single physical signal and various detection methods cannot achieve information sharing.
This paper proposes a composite insulator defect diagnosis model based on acoustic–electric feature fusion and deep learning. The main contributions of this paper are as follows:
- Electromagnetic wave and ultrasonic live detection tests of composite insulator defects are carried out. Six typical defect insulator samples are made in the laboratory, and a defect detection test platform is built. The electromagnetic wave spectrometer and ultrasonic detector are used to measure the electromagnetic wave and ultrasonic signal radiated by the unpressurized background noise, the intact insulator and the defective insulator in a certain distance. FFT is used to analyze the spectral characteristics of electromagnetic wave signals, and the ultrasonic signal is analyzed by a power spectrum and n-S map. Combining electromagnetic wave and ultrasonic detection methods can scientifically and effectively reflect different types of insulator defects.
- A composite insulator defect diagnosis algorithm based on acoustic–electric feature fusion and multi-scale perception multi-input of a stacked auto-encoder network is proposed. The peak and average value spectrum of electromagnetic waves, an ultrasonic power spectrum and n-S map are extracted by a stacked auto-encoder and are reduced to similar dimensions to avoid one signal occupying too much weight and weakening the influence of other signals on the results. The above data are fused as the input of the multi-scale perception multi-input network. By stacking multiple such structures, data information can be extracted on multiple scales without increasing the number of network parameters, avoiding overfitting caused by too many network layers and improving the accuracy of classification. By comparison, it is proven that the detection accuracy of the proposed method is obviously better than that of a single-feature input source and traditional ANN method.
- Composite insulator defect diagnosis software is developed, and the aging composite insulators replaced on-site are tested and verified. Based on the proposed acoustic–electric feature fusion and MMSAE network, a composite insulator defect diagnosis software is developed in PYQT5 and Keras environments. The software detection and dissection analysis of ten 500 kV aging composite insulators replaced on-site are carried out, which proves the accuracy of the proposed method and software. It is helpful to comprehensively study and judge the operation state and defect type of composite insulators on transmission lines, and this has practical engineering significance.
The remainder of the article is organized as follows. Section 2 describes the acoustic–electric feature test and results analysis of composite insulator defects. Section 3 describes the construction and analysis of the composite insulator defect identification model based on acoustic–electric feature fusion and the MMSAE network. In Section 4, examples and analyses of engineering applications are provided. Finally, the conclusions are given in Section 5.
2. Acoustic–Electric Features Test of Composite Insulator Defects
2.1. Test Circuit
Figure 1 depicts the test circuit diagram for the composite insulator defect acoustic–electrical feature test. The test circuit contains a power frequency test transformer, a composite insulator short sample, a protective resistance, and a ground electrode. The test insulator samples in this paper are all 1/10 short samples of DC ± 1100 kV, and the rated voltage is DC ± 110 kV. Therefore, under AC conditions, the peak voltage of the test insulator is set to 110 kV, and the effective value of the AC voltage applied to the test insulator by the test transformer is 77.8 kV.
During the test, data were collected from the front (0°), side (90°), and back (180°) of the defect, depending on the defect’s orientation. The data acquisition position is 3~4 m away from the measured insulator. The electromagnetic wave and ultrasonic data of background noise without pressurization, intact insulator, and various simulated degraded insulators are measured, respectively.
2.2. Composite Insulator Defect Simulation
The primary cause of the failure of composite insulators is the uneven field strength of the interface, which is a result of defects and an imperfect manufacturing process, resulting in long-term carbonization channels and gradually developing into interface breakdown discharge. Therefore, by embedding copper wire or a carbon rod between the high-voltage end metal fittings and the first umbrella skirt to simulate conductive or semi-conductive defects, the defects and high-voltage end metal fittings are equipotential to simulate conduction-type defects and non-equipotential to simulate suspension-type defects. Separating the interlayer between the umbrella skirt sheath and the core rod creates an air gap space, which is then filled with a salt solution to simulate water vapor entering the interlayer. By smearing carbon powder on the surface of the high-voltage umbrella skirt, the leakage tracking defect caused by a flashover on the surface of the umbrella skirt can be simulated. According to the failure mechanism of insulators [29,30,31,32], the following six kinds of defects are simulated, as shown in Table 1. Figure 2 depicts the actual simulation of various defects. The copper wire and carbon rod are embedded in the core rod and sheath interface, each measuring 3 mm in diameter and 10 cm in length, with the ends being sharply polished. The carbon powder weighs 5 g, and the coating is uniform.
2.3. Experiment Results and Analysis
2.3.1. Processing Method and Result Analysis of Electromagnetic Wave Data
The PDS100 electromagnetic wave spectrometer is used to record the RF signal emitted by partial discharge. During gating time, the signal within the center frequency’s bandwidth is detected, and the bandwidth of each band was 1.9 MHz. On the signals in the frequency band corresponding to each center frequency, an FFT transform is performed, and the spectrums corresponding to each frequency band are merged to form a complete spectrum. The experiment adopted S.P.A.M mode, which simultaneously records the spectrum’s peak and average values.
The frequency components of 50 MHz~1 GHz include a variety of continuous signals, such as AM radio, mobile phone, and other communication signals. The background wave without voltage is first recorded, then the background noise is subtracted from the spectrum with voltage, and the frequency band amplitude of less than 0 is set to 0. Each spectrum contains 501 detection center frequencies ranging from 50 MHz to 1 GHz. Figure 3 depicts the electromagnetic wave spectrum results for each composite insulator defect.
In this paper, four groups of electromagnetic wave characteristic detection experiments are carried out. The electromagnetic wave experimental results of conduction conductive composite insulators are shown in Figure 3. In the four groups of experiments, the peak value curve and the average value curve of the electromagnetic wave spectrum of the conduction conductive composite insulator have the same change trend. The situation of intact and other defect types of composite insulators is consistent with that of conduction conductive composite insulators. Therefore, in this paper, the electromagnetic wave spectrum of the first group of experiments is taken as an example to summarize the characteristics of intact and various types of defective composite insulators, as shown in Figure 4.
Figure 4 reveals that the intact insulator’s electromagnetic wave spectrum contains a discharge signal at 0~450 MHz, indicating that this is the electrical or corona signal of the line or metal fittings. Comparing the electromagnetic wave spectrum of intact insulators with each defect spectrum reveals the following characteristics.
- The peak spectrum and average spectrum of conduction defects have higher amplitude at 0~80, 120~200, and 450~550 MHz. The peak spectrum of 350~450 MHz is similar to that of an intact insulator, whereas the average spectrum is distinct.
- The peak spectrum and average spectrum of suspension defects in the range 0~80 MHz are not as high as those of conduction defects, but they are still relatively obvious. The peak spectrum and average spectrum of 150~200 MHz have higher signals. The peak spectrum of 350~450 MHz and the average spectrum of 150~400 MHz are obviously different from the intact insulator signal.
- Since there is little difference between the two types of frequency spectrums of the leakage tracking defect and that of the intact insulator, it is assumed that there is no obvious discharge in the defect.
- The average spectrum and peak spectrum of the water vapor entry defect exhibit intermittent discharge peaks at 40, 160, 360, and 450~550 MHz. The average spectrum generally has a richer signal distribution and higher amplitude in the 50~600 MHz band.
2.3.2. Processing Method and Result Analysis of Ultrasonic Data
Figure 5 shows the specific flow of the processing method and result analysis of ultrasonic data. The SUD-300 ultrasonic detector is able to record ultrasonic signals radiated by partial discharges with a frequency greater than 20 kHz. Because the ultrasonic signal generated by partial discharge contains a wealth of signals at approximately 40 kHz, and because the frequency band can effectively eliminate the interference signal, the detection center frequency of the detector is selected at 40 kHz. Through the ultrasonic detector, the signal is converted to a range of audible frequencies between 0 and 4 kHz.
The background noise of three locations devoid of voltage, the ultrasonic shapes of intact insulators under a working phase voltage of 77.8 kV, and the ultrasonic shapes of various fault-simulated insulators in the frequency range of 38~42 kHz are respectively measured. The sampling frequency is 8 kHz, and the duration of each recording is 10 s.
(1) Wavelet packet denoising.
Since the experimental data acquisition in this paper was conducted in a laboratory, it can be assumed that the data are nearly free of noise. However, ultrasonic equipment operating in the field will be subject to various types of field noise, including wire corona signal interference and instrument internal interference. In addition, in long-distance fault detection, due to the scattering and attenuation characteristics of ultrasonic waves in the measured object and air, the received signals cannot meet the application requirements. Therefore, the collected signal must be denoised. The method of wavelet packet transform threshold denoising is utilized in this paper.
White noise and background noise are superimposed with the original signal at signal-to-noise ratios of 2, 5, 10, and 20 dB to test the filtering effect of the wavelet packet denoising method. After many aspects of comparison, the final selection consists of soft threshold function, unbiased likelihood estimation rules, wavelet function bior 2.4, and decomposition layer 4.
(2) Improved n-S map based on the PRPD method.
This paper proposes a general n-S map method suitable for ultrasonic testing under AC and DC conditions, based on the PRPD method. In the pulse current method, due to the absence of phase information in the DC discharge, only the number of discharges n and the apparent discharge q are selected as the pulse current characteristic quantity. Let n represent the number of zero crossing points of the ultrasonic shape in the ultrasonic method. Then, n can be analogous to the number of discharges in PRPD. Between the two adjacent zeros, the area S bounded by the acoustic wave and the abscissa axis can be analogous to the discharge amount in PRPD, and the area of all packages can be determined. The frequency distribution histogram n-S spectrum and box diagram of different defects can be drawn by statistical method. On this basis, various characteristic parameters are extracted for the classifier’s input.
A box plot is a statistical graph used to display a set of scattered data. Box plot intuitively displays, from a statistical point of view, distribute characteristics of discrete data and are unaffected by outliers. They can also be used to clean data.
All enveloped areas S of the acoustic wave and the abscissa axis are calculated using the above method, and K at the upper and lower edges is 1.5. The data outside of this range are labeled as abnormal, and the statistical relationship between the number of zero crossings, n, and S is plotted, as shown in Figure 6. In the case of intact and leakage tracking, the position and median of the box are close to zero, and there is almost no discharge event, as shown in Figure 6. Water vapor entry defects discharge minimally, conduction defects discharge severely, and suspension defects discharge with lesser intensity than conduction defects.
Observing the received signal strength from various directions, the signal strength and density are greatest in front of the defect. This is due to the fact that the ultrasonic signal is received directly by the ultrasonic sensor through the air, rather than being blocked by the core rod sheath. The signal strength on the back of the defect is typically weak, especially for semi-conductive defects, which may be due to the fact that the core rod separates the direction of the received signal from the signal source and attenuates the ultrasonic signal. The outliers marked by red dots were removed and the box plot was redrawn, as shown in Figure 7.
To compare the n-S map of different defects under the same standard after excluding the outliers of S due to the large differences in amplitude and number of different types of discharges, the upper limit of the range of S is set as the global maximum, and all S are normalized to the range of (0, 1). As shown in Figure 8, this range was divided into 200 equal parts, and the n-S map was drawn with equal-spacing statistics.
As can be seen from the above figure, compared with the maximum envelope area S: conduction conductive > conduction semi-conductive > suspension conductive ≈ suspension semi-conductive ≈ water vapor entry > leakage tracking ≈ intact. From the perspective of the number n, the number n of suspension defects, leakage tracking defects, and water vapor entry defects in the small S region are relatively high, the number of conduction defects is relatively low, and the number of intact insulators in all S regions is low, confirming that leakage tracking defects and other defects are weak with discharge, but the number of discharges is greater.
The degree of data distribution skewness can be measured by the calculation of variance, skewness and kurtosis.
Variance is used to measure the degree of deviation between a random variable or a set of data and its mathematical expectation. The formula is as follow:
where X is the statistical sample, μ is the sample mean, σ is the sample variance, and E represents the mean. Variance can be used to accurately describe the degree of deviation between the statistical data and the mean.
Skewness is a measure of the direction and degree of skew of statistical data distribution, which is used to measure the asymmetry of statistical data distribution. It can be calculated as follows:
In the normal distribution Skewness = 0, positive bias distribution Skewness > 0, negative bias distribution Skewness < 0.
Kurtosis is also called the kurtosis coefficient. It is used to characterize the concentration of statistical data distribution near the mode. Intuitively reflected in the sharpness of the curve peak, the formula is as follows:
Normal distribution Kurt = 3, in the case of the same σ, Kurt > 3 is the leptokurtic state, corresponding to a thick tail; Kurt < 3 is the platykurtic state, corresponding to a thin tail. Table 2 displays the results of calculating the skewness and kurtosis of the envelope area S distribution for the seven types of ultrasonic signals listed above.
The frequency distribution of area S exhibits an evidently positive skewness distribution close to an exponential distribution and Skewness > 0, Kurtosis > 3. Consequently, the size of the adjacent interval of the frequency distribution histogram is selected in a specific manner:
where xi is the selected abscissa point, [0,1] is the value range, and N is the number of statistical histograms or the number of regions divided into S. The unequal interval statistical method enables different defects to achieve good discrimination in areas with dense S distribution and to expand the statistical range in areas with sparse S distribution, thereby minimizing redundant data information. The value range of parameter a is (0,1) (1,+∞), which is related to the distribution pattern of data. When Skewness > 0, a > 0 is taken; when Skewness < 0, 0 < a < 1 is taken, and the specific value is determined by specific needs.
In this paper, the n-S map is drawn by special spacing statistics, as shown in Figure 9, where a = 1.03, N = 200. The abscissa represents the statistical range sequence of the area S, that is, the number of intervals in the series [xi, xi+1]. The n-S map of special spacing demonstrates that special spacing can effectively avoid the situation in which data concentration in a particular region leads to low regional resolution. Consequently, it also has a good distinction effect on the skewness distribution, allowing it to more accurately reflect the distinction between various defects in the ultrasonic signal.
From the distribution range of S, conduction defect > suspension defect > water vapor entry > leakage tracking > intact, which verifies the intensity of different defect discharge intensities. According to the number n, the conduction and water vapor entry defects have greater values in the region with a higher S sequence, the numerical fluctuation of suspension defects in the entire sequence region is small, and the n of the intact insulator and leakage tracking defects are predominantly distributed in the region with lower S sequence.
(3) Power spectral density estimation.
The power spectral density function, also known as the power spectrum, is a function that represents the variation of signal power with frequency in each unit frequency band, or the signal power distribution in the frequency domain. The Blackman–Tukey method and Welch method are used to generate two power spectra. Compared to the Blackman–Tukey method, the spectral estimation of the Welch method is smoother, and the selection of the window function reduces the possibility of modal mixing, thereby improving the resolution of power density spectral estimation.
The following frequencies are based on the actual frequency of the converted signal because the ultrasonic instrument converts the ultrasonic signal to the human ear to identify the acoustic wave, which is equivalent to reducing the frequency of the acoustic wave from 18~22 kHz to 0~4 kHz. All power spectral density estimation results are shown in Figure 10.
Comparing the power spectral density estimations of the Blackman−Tukey method and the Welch method reveals that their amplitudes and graphs are similar. The Welch method is smoother, which is the result of piecewise averaging. Compared to the Blackman−Tukey method, the Welch method suppresses noise but also loses some signal detail components.
Comparing different defect signals, all exhibit the shape of high before and low after, with the maximum power density of the conductive defect being the highest, reaching −60 dB, the amplitude of the suspension defect being slightly lower, followed by water vapor entry, and the maximum power density of the intact insulator and the leakage tracking being the smallest, approximately −80 dB, which can be interpreted as signal interference caused by corona. Intact insulators, leakage tracking, and water vapor entry defects exhibit a partial rising edge in the frequency range of 0 to 100 Hz.
3. Composite Insulator Defect Identification Method Based on Acoustic–Electric Feature Fusion and MMSAE Network
3.1. Overall Network Architecture
This paper presents a method for diagnosing composite insulator defects based on acoustic–electric feature fusion and multi-scale perception multi-input of a stacked auto-encoder network. Figure 11 depicts the overall network architecture and feature dimensions of the method. The multi-input feature data are combined via their respective feature extraction layers and are fed into the classification layer.
The feature data include the electromagnetic wave peak spectrum, electromagnetic wave average spectrum, special spacing n-S map, and power spectral density calculated using the Blackman–Tukey method.
The feature extraction layer is constructed based on the MMSAE network. This paper first designs an auto-encoder-based multi-scale perception module and then realizes feature extraction and dimension reduction by stacking and connecting the encoding portions of multiple improved auto-encoders.
The classification layer consists of the fusion layer, the hidden layer, and the output layer. The supervised feature extraction layer is optimized, the entire network is trained using the backpropagation algorithm, and the optimal training results are stored. The entire network uses the Adam optimizer, the output layer activation function is softmax, the loss function is categorical cross-entropy, and the output is seven dimensions. The remaining layer activation functions are RELU, and the loss function is MSE.
3.2. MMSAE Network
This paper proposes a multi-scale perception module based on an auto-encoder, whose structure is shown in Figure 11. The improved auto-encoder consists of three hidden layers. After inputting the data Xi, the output of the first hidden layer Encoder_layer1 and the second hidden layer Encoder_layer2 are combined by the batch normalization Dense_BN layer and the Dropout layer, and then by output data Xi+1 after passing through the third hidden layer Encoder_layer3, Dense_BN layer, and Dropout layer. Among them, the batch normalization of the input of each layer can accelerate the convergence speed of the model. The Dropout layer is appropriately added to each layer, and the parameter is set to 0.3, improving the robustness and generalization ability of the network and preventing overfitting.
Finally, a complete MMSAE network is constructed by cascading the encoding parts of the aforementioned multiple improved auto-encoders, which can fully utilize the feature information of different complexities of deep and shallow layers without increasing the number of network parameters and obtaining richer multi-scale features. At the same time, it can prevent overfitting caused by too many network layers and improve classification accuracy.
3.3. Acoustic–Electric Feature Fusion Method
3.3.1. Electromagnetic Wave Spectrum Feature Extraction
Subtracting their respective background waves from the peak spectrum and average spectrum of all electromagnetic waves yields a matrix containing 2 × 501 × 1 corresponding data samples. Signal features are extracted using a stacked auto-encoder, and the network for feature extraction is pretrained. Each sample has two input variables and is entered separately into the SAE, each AE has four hidden layers, and each SAE contains three AEs. Thus, three decoding processes are formed. Finally, two feature extraction networks with six hidden layers are generated to reduce the input from 2 × 501 × 1 to 2 × 100 × 1.
3.3.2. Ultrasonic Feature Extraction
(1) n-S map.
After the signal is denoised by wavelet packet and the outliers of S are removed by box diagram, considering the influence of the recorded audio length on the number of envelope area S, the maximum and minimum values of its own data are used instead of the global maximum and minimum values when normalizing the n of the n-S map, so as to express the frequency distribution relationship of S with different sizes without considering the absolute number. The data dimension of the n-S map described previously is 200 × 1, and the data in each sample are also input into the SAE containing two AEs by the stacked auto-encoder. As a result, two decoding processes are generated, as well as an extraction network with four hidden layers. The input of 200 × 1 is reduced to 50 × 1.
(2) Power spectral density.
The power spectral density is calculated by the Blackman–Tukey method. The frequency domain is subdivided into 4000 intervals, and the input data for the stacked auto-encoder is 4000 × 1. Each SAE is composed of four AEs, resulting in four decoding processes. Finally, a network for feature extraction with eight hidden layers is generated, and the input is reduced from 4000 × 1 to 150 × 1.
3.3.3. Feature Fusion and Classification
Intact insulators and six kinds of defects are represented by 0~6. The sample number, type, and data quantity are shown in Table 3. The sample number is converted to one-hot encoding as a label. The dataset is disordered, and the training set, validation set, and test set are divided at a ratio of 6:2:2. Through the aforementioned stacked auto-encoder, the four signal features are reduced to similar sizes to prevent one signal from occupying an excessive amount of weight and weakening the effect of the other signals on the results. In addition, the feature extraction method and classification network can fuse more diagnostically relevant data and ensure the detection’s comprehensiveness and precision by combining the benefits of various detection methods.
3.4. Diagnostic Results and Analysis
3.4.1. Fusion Diagnosis Results and Analysis
Figure 12 depicts the accuracy and loss-value of the algorithm during the training process. After 500 generations of training, the accuracy of the training set and the validation set converges to 1, and the loss-value curve indicates that the model training effect is satisfactory.
The accuracy of the final test set obtained from the confusion matrix of Figure 13 reaches 99.17%. With strong discharge, the algorithm can accurately distinguish between conduction and suspension defects, and with weak discharge, it can distinguish between leakage tracking, water vapor entry, and an intact insulator.
3.4.2. Comparison and Analysis of MMSAE and ANN Results
As a mainstream artificial intelligence algorithm, ANN has been widely used in the field of insulator defect classification and recognition and has a high recognition accuracy [33,34]. Therefore, under the condition of keeping the parameters of the hidden layer dimension, the number of hidden layers, the number of iterations, the optimizer, the activation function, and the objective function consistent, the ANN and the MMSAE network proposed in this paper are used to diagnose ultrasonic, electromagnetic wave spectrum and acoustic–electrical fusion, respectively. Table 4 provides the results. Among them, reasonable model evaluation metrics can quantify the classification model’s performance. The main evaluation indexes are recall, precision, F1 score, and total accuracy.
The following conclusions can be obtained from the above table:
- The training effects of the two networks are compared. As training sample sets, the fusion, ultrasonic, and electromagnetic wave data are utilized. The total accuracy obtained by training on the MMSAE model was 99.17%, 80.83%, and 97.5%, respectively, and that on the ANN was 96.67%, 73.30%, and 95.83%, respectively. It demonstrates that the training effect of MMSAE using any data is superior to that of ANN when using the same data.
- Comparing the classification results of different training data, the fusion method shows the best effect on the two models, MMSAE and ANN, with 99.17% and 96.67% accuracy, respectively. The electromagnetic wave method is 97.5% and 95.83%, respectively. The ultrasonic method has the lowest effect, which is 80.83% and 73.3%, respectively. The classification results indicate that acoustic–electrical joint detection can combine the benefits of the two individual detection methods to achieve superior detection results.
- Using the F1 score to compare the recognition of various defects, MMSAE trained with fusion data has a good recognition effect on all defects. In the detection of electromagnetic wave data, type 0 and type 5 are difficult to identify. The F1 score in MMSAE is 92.31% and 89.66%, respectively, and the F1 score in ANN is 87.18% and 82.76%, respectively. Nonetheless, the electromagnetic wave spectrum method can achieve an overall superior classification effect. In the detection of ultrasonic data, type 0, type 4, type 5, and type 6 were difficult to identify, and the F1 score in MMSAE is 77.78%, 62.50%, 75%, and 53.33%, respectively. The F1 score in ANN is 38.71%, 62.86%, 48.65%, and 55.17%, respectively. This indicates that the F1 score is correlated positively with the discharge intensity of each defect type.
4. Engineering Cases
This paper develops a composite insulator defect diagnosis software based on PYQT5 and Keras. The software utilizes the MMSAE network-based multi-source feature fusion diagnosis method. In order to verify the effectiveness of the proposed composite insulator defect identification method and the developed diagnostic software, ten 500 kV aging composite insulators that were replaced on-site were subjected to testing, as shown in Figure 14.
The electromagnetic wave spectrum and ultrasonic data for the three composite insulators listed above were collected. The processed data were entered into the software for diagnosing defects in composite insulators, and the acoustic–electric fusion method was selected. The software diagnosis results are shown in Table 5.
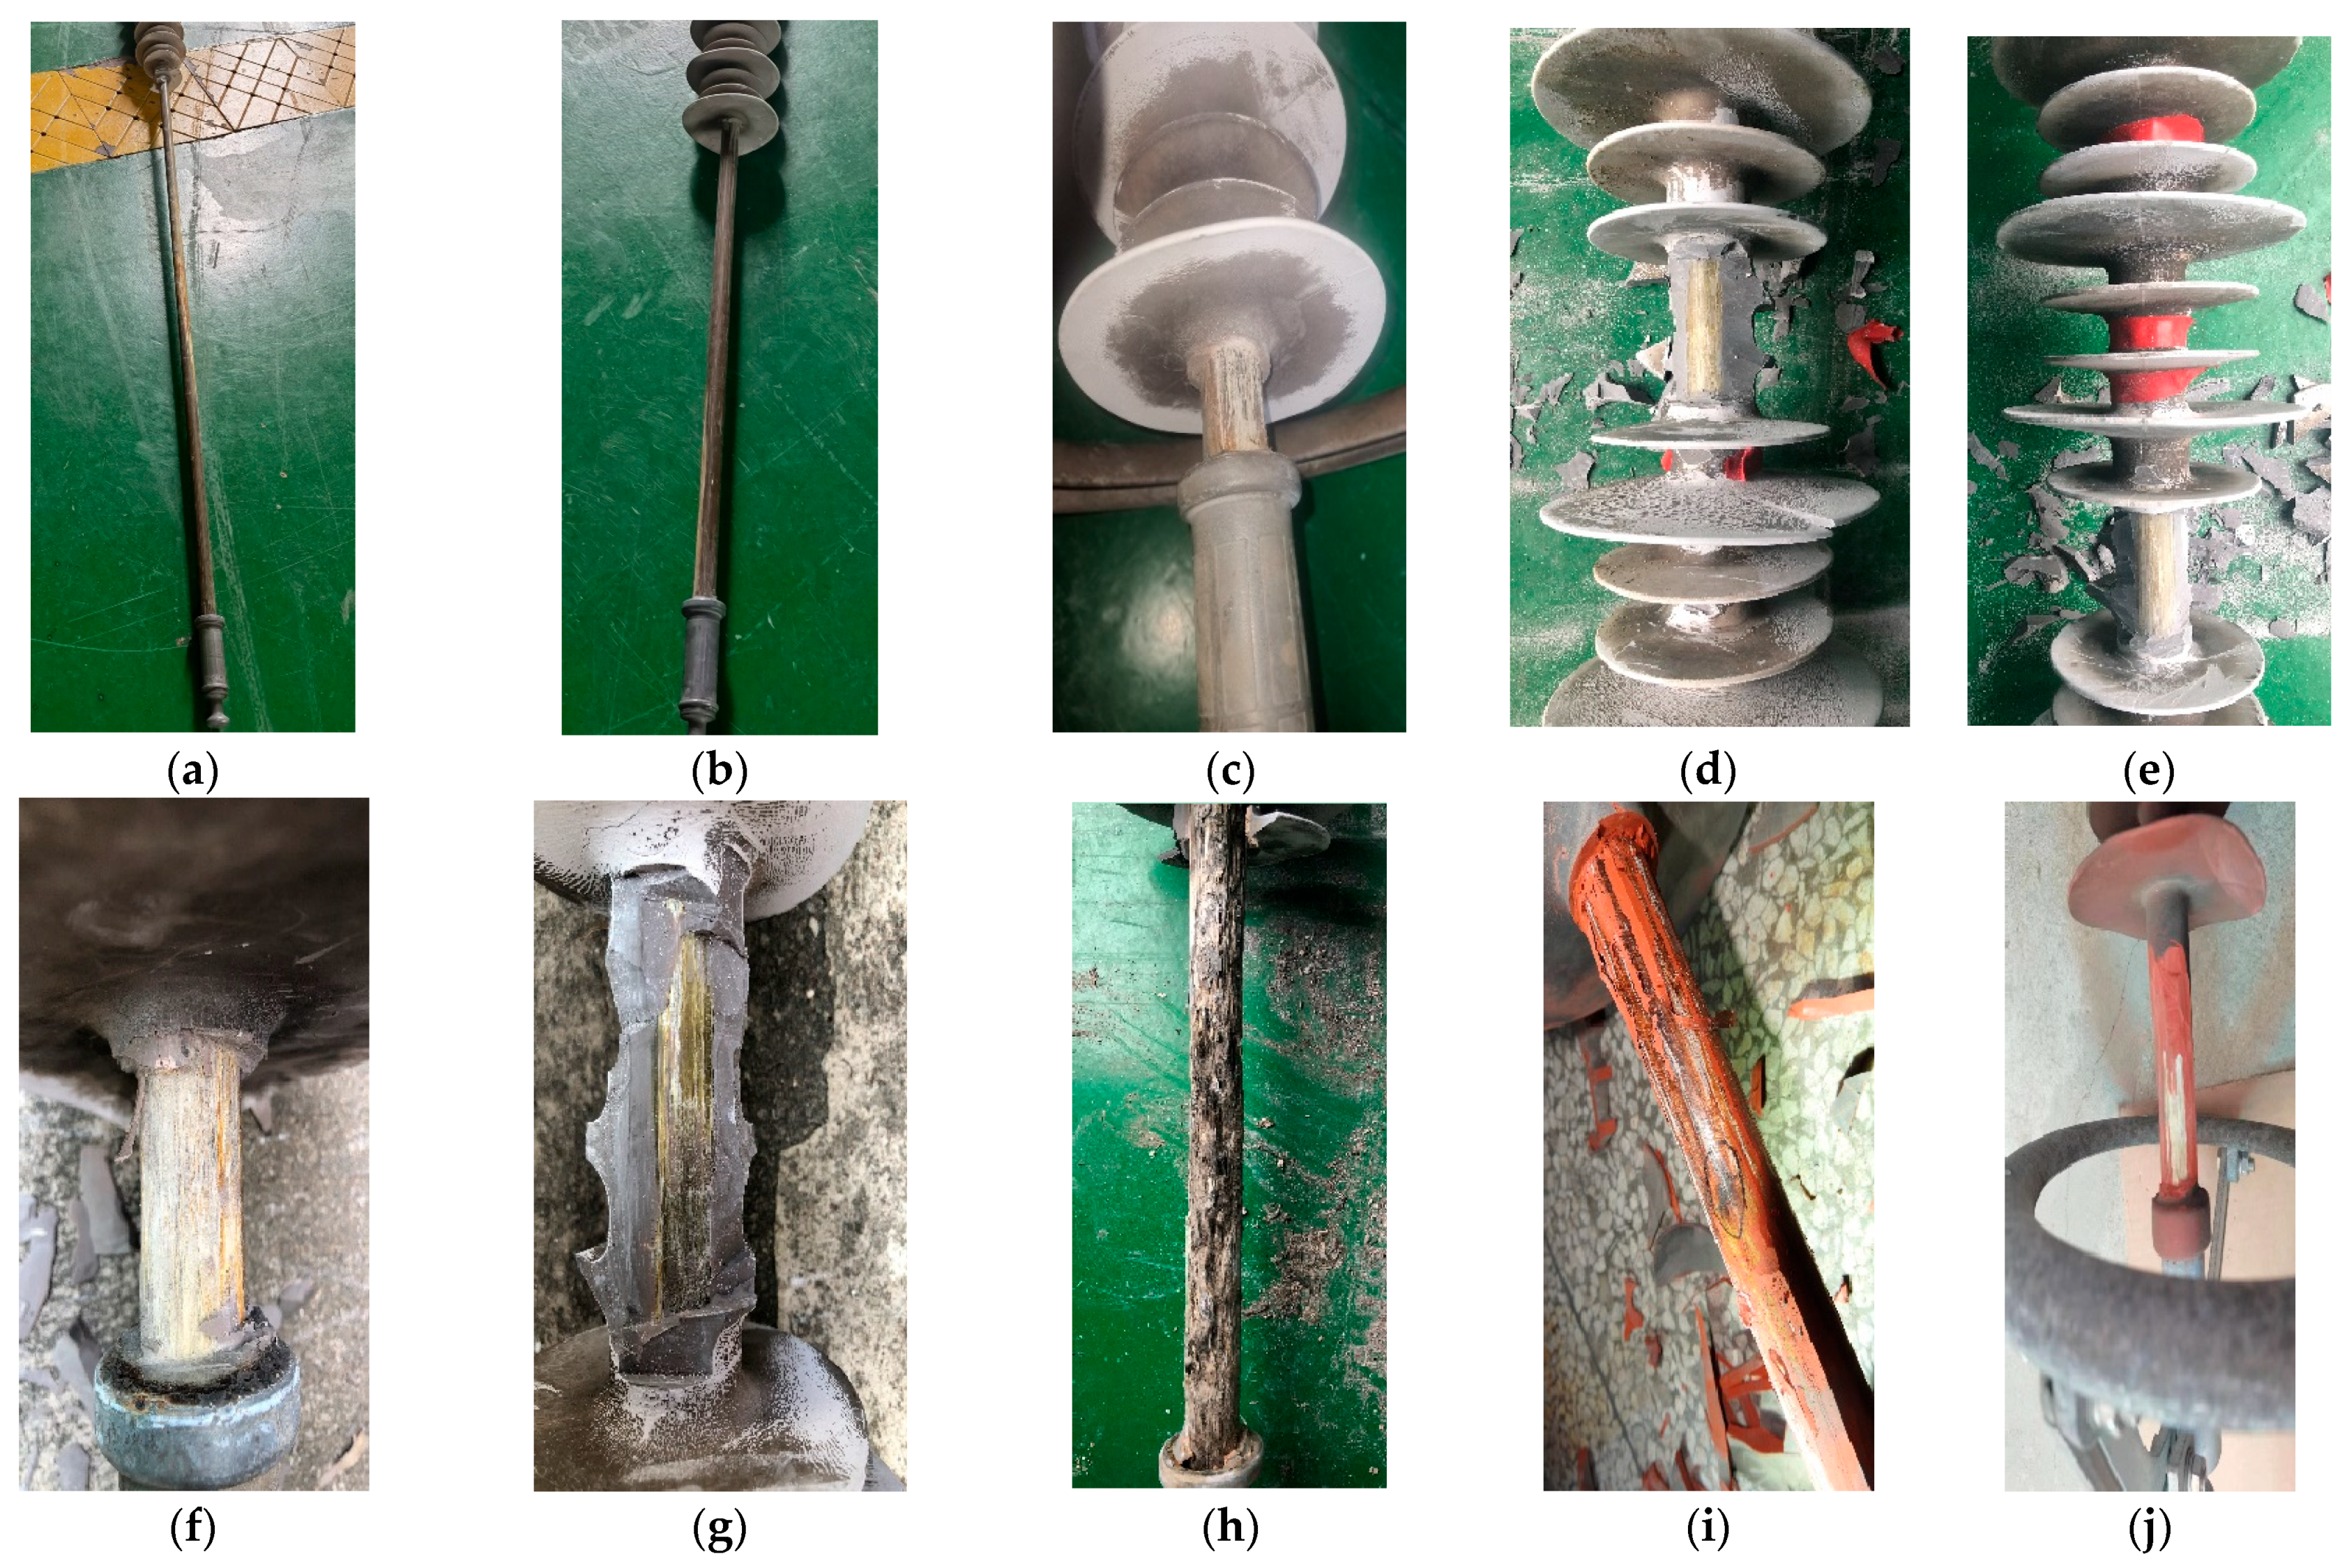
To verify the accuracy of the software’s diagnostic results, the insulators were dissected, and the core rod’s surface sheath was removed. Figure 15 depicts the details of the core rod of each insulator. The dissection verification results are shown in Table 5.
In Figure 15, there is no adhesion between the sheath and the core rod of composite insulators No. 1, No. 2, No. 8, and No. 10, the umbrella skirt sheath is severely pulverized, and the surface of the core rod defect is yellow-white. Cutting the surface of the core rod at the defect, the glass fiber used to make the core rod immediately fractured and pulverized. The defect extends from the high-voltage end metal fittings to the low-voltage end and is located on the side of the core rod. The defects are spirally extended around the mandrel, and the extension length is No. 8 > No. 10 > No. 1 > No. 2, indicating that the longer the extension, the more serious the defects. After analysis, it is determined that composite insulators No. 1 and No. 8 have a conduction conductive defect, and No. 2 and No. 10 have a conduction semi-conductive defect.
The sheath of No. 3, No. 6, and No. 7 composite insulators closely adheres to the core rod, and the core rod defect only appears between the high-voltage end metal fittings and the first umbrella skirt. There is no obvious pulverization on the surface of the defect, which proves that the discharge is relatively weak. It has been determined that composite insulators No. 3, No. 6, and No. 7 have a water vapor entry defect.
The interface adhesion between the sheath and the core rod of composite insulators No. 4 and No. 5 is weak, the powdering of the shed sheath is more serious, and the surface of the core rod defect also shows yellow-white. The defects are located in the middle area of the mandrel and extend to both sides. The extension length of No. 4 is greater than that of No. 5, indicating that the defect is more serious. After analysis, it is determined that composite insulator No. 4 has a suspension conductive defect, and No. 5 has a suspension semi-conductive defect.
The surface of the shed sheath at the defect of composite insulator No. 9 is cracked and seriously pulverized. Under the combined action of electric field and electrolyte, the surface of the core rod is partially carbonized, and finally, a conductive path is formed. After analysis, it was determined that composite insulator No. 9 has a leakage tracking defect. The consistency between software diagnosis and anatomical analysis results validates the effectiveness of the MMSAE algorithm and defect-recognition software.
5. Conclusions
In view of the limitations of existing live defect-detection methods for composite insulators, this paper proposes a multi-scale perception multi-input deep learning network and develops a composite insulator defect diagnosis model based on acoustic–electric joint detection. The following are the conclusions:
- Based on the discharge characteristics of defective composite insulators, six common defects are simulated artificially. The electromagnetic wave peak spectrum, electromagnetic wave average spectrum, ultrasonic n-S map, and power spectral density of various defects can distinguish composite insulators with various defects.
- The network architecture of MMSAE is proposed based on acoustic and electrical information. First, the multi-source input data are pre-trained, then the output is fused, and finally, the final fine-tuning is performed to solve the problem that different types of field-based detection methods cannot share information. At the same time, the feature extraction method and classification network are extensible, allowing for the fusion of additional diagnostically useful data. By combining the benefits of various detection methods, the comprehensiveness and accuracy of detection are ensured.
- Based on the model evaluation index’s total accuracy and F1 score, it is demonstrated that acoustic–electric fusion is more effective than the use of two detection methods separately. In the ultrasonic method, electromagnetic wave spectrum method, and acoustic–electric fusion method, it is demonstrated that MMSAE achieves greater accuracy than conventional ANN networks.
- The composite insulator defect diagnosis software is used to identify the defects of the aging composite insulator on site. The consistency between the software diagnosis results and the anatomical analysis results validates the efficacy and applicability of the MMSAE algorithm and the defect identification software.
The method proposed in this paper can fully serve the state detection of transmission lines. In future research, improvement and in-depth mining analysis of the technology can be carried out from the following two aspects: on the one hand, with the emergence of more detection methods, the algorithm structure and label categories can be expanded. On the other hand, by adding more environmental factors to the training samples, the feature set can be continuously expanded to improve the sample library. Finally, it provides ideas for the multi-source feature fusion composite insulator online diagnosis system with more perfect functions, more accurate identification and diversification.
Author Contributions
Conceptualization, X.W.; methodology, J.X.; software, C.C.; validation, X.W., J.X. and C.F.; formal analysis, C.C. and S.S.; investigation, B.Z.; writing—original draft preparation, B.Z.; writing—review and editing, S.S.; visualization, J.X.; supervision, C.F. All authors have read and agreed to the published version of the manuscript.
Funding
This work was supported by the National Natural Science Foundation of China (no. 52207150).
Data Availability Statement
Not applicable.
Conflicts of Interest
The authors declare no conflict of interest.
References
- Liang, X.; Gao, Y.; Wang, J.; Li, S. Rapid development of silicone rubber composite insulator in China. High Volt. Eng. 2016, 42, 2888–2896. [Google Scholar] [CrossRef]
- Chen, C.; Shu, S.; Dong, Y.; Wang, J.; Jin, M. Partial discharge pattern classification of composite insulators by electromagnetic spectrum and stacked autoencoder network. In Proceedings of the 22nd International Symposium on High Voltage Engineering (ISH), Xi’an, China, 21–25 November 2021; pp. 1124–1129. [Google Scholar] [CrossRef]
- Xia, Y.; Song, X.; He, J.; Jia, Z.; Wang, X. Evaluation method of aging for silicone rubber of composite insulator. Trans. China Electrotech. Soc. 2019, 34, 440–448. [Google Scholar] [CrossRef]
- Fu, P.; Zhao, Z.; Li, X.; Cui, X.; Wen, T.; Yang, Z.; Mo, S.; Zhang, P. Partial discharge measurement and analysis in PPIs. IET Power Electron. 2019, 12, 138–146. [Google Scholar] [CrossRef]
- Phillips, A.; Kuffel, J.; Baker, A.; Burnham, J.; Carreira, A.; Cherney, E. Electric fields on AC composite transmission line insulators. IEEE Trans. Power Delivery 2008, 23, 823–830. [Google Scholar] [CrossRef]
- Amin, M.; Amin, S.; Ali, M. Monitoring of leakage current for composite insulators and electrical devices. Rev. Adv. Mater. Sci. 2009, 21, 75–89. [Google Scholar]
- Tian, F.; Hao, Y.; Zou, Z.; Zheng, Y.; He, W.; Yang, L.; Li, L. An ultrasonic pulse-echo method to detect internal defects in epoxy composite insulation. Energies 2019, 12, 4804. [Google Scholar] [CrossRef] [Green Version]
- Li, S.; Li, J. Condition monitoring and diagnosis of power equipment: Review and prospective. High Volt. 2017, 2, 82–91. [Google Scholar] [CrossRef]
- Raymond, W.; Illias, H.; Bakar, A.; Mokhlis, H. Partial discharge classifications: Review of recent progress. Measurement 2015, 68, 164–181. [Google Scholar] [CrossRef] [Green Version]
- Li, J.; Han, X.; Liu, Z.; Li, Y. Review on partial discharge measurement technology of electrical equipment. High Volt. Eng. 2015, 41, 2583–2601. [Google Scholar] [CrossRef]
- Yaacob, M.; Alsaedi, M.; Rashed, J.; Dakhil, A.; Atyah, S. Review on partial discharge detection techniques related to high voltage power equipment using different sensors. Photonic Sens. 2014, 4, 325–337. [Google Scholar] [CrossRef] [Green Version]
- Li, X.; Meng, F.; Ji, S.; Wang, S.; Wang, F.; Li, Y. On-line detecting system for composite insulator based on pulse current method. High Volt. Eng. 2006, 32, 44–47. [Google Scholar] [CrossRef]
- Uckol, H.; Karaca, B.; Ilhan, S. DC and AC electric field analysis and experimental verification of a silicone rubber insulator. Electr. Eng. 2020, 102, 503–514. [Google Scholar] [CrossRef]
- Li, C.; Niu, B.; Zeng, R.; Yu, Z.; Zhang, F. Detection of internal insulation defects of composite insulator based on electro-optic electric field sensor. High Volt. Eng. 2014, 40, 2422–2428. [Google Scholar] [CrossRef]
- Li, J.; Jiang, T.; Harrison, R.; Grzybowski, S. Recognition of ultra high frequency partial discharge signals using multi-scale features. IEEE Trans. Dielectr. Electr. Insul. 2012, 19, 1412–1420. [Google Scholar] [CrossRef]
- Yuan, C.; Xie, C.; Li, L.; Zhang, F.; Gubanski, S. Ultrasonic phased array detection of internal defects in composite insulators. IEEE Trans. Dielectr. Electr. Insul. 2016, 23, 525–531. [Google Scholar] [CrossRef]
- Gao, K.; Lyu, L.; Huang, H.; Fu, C.; Chen, F.; Jin, L. Insulation defect detection of electrical equipment based on infrared and ultraviolet photoelectric sensing technology. In Proceedings of the IECON 2019-45th Annual Conference of the IEEE Industrial Electronics Society, Lisbon, Portugal, 14–17 October 2019; pp. 2184–2189. [Google Scholar] [CrossRef]
- Jain, A.; Duin, R.; Mao, J. Statistical pattern recognition: A review. IEEE Trans. Pattern Anal. Mach. Intell. 2002, 22, 4–37. [Google Scholar] [CrossRef] [Green Version]
- Abramson, N.; Braverman; Sebestyen, G. Pattern Recognition and Machine Learning; IEEE: Piscataway, NJ, USA, 1963; Volume 9, pp. 257–261. [Google Scholar]
- Orriols-Puig, A.; Casillas, J.; Bernadó-Mansilla, E. Genetic-based machine learning systems are competitive for pattern recognition. Evol. Intell. 2008, 1, 209–232. [Google Scholar] [CrossRef]
- Bulgarevich, D.; Tsukamoto, S.; Kasuya, T.; Demura, M.; Watanabe, M. Pattern recognition with machine learning on optical microscopy images of typical metallurgical microstructures. Sci. Rep. 2018, 8, 2078. [Google Scholar] [CrossRef] [PubMed] [Green Version]
- Jing, X.; Peng, X.; Jiang, W.; Zhou, W.; Zhou, C.; Tang, Z. Phase resolved partial discharge pattern recognition method for online cable condition monitoring system based on K-Means clustering. High Volt. Eng. 2012, 38, 2437–2446. [Google Scholar]
- Hunter, J.; Hao, L.; Lewin, P.; Evagorou, D.; Kyprianou, A.; Georghiou, G. Comparison of two partial discharge classification methods. In Proceedings of the 2010 IEEE International Symposium on Electrical Insulation, San Diego, CA, USA, 6–9 June 2010; pp. 1–5. [Google Scholar] [CrossRef]
- Iorkyase, E.; Tachtatzis, C.; Glover, I.; Lazaridis, P.; Upton, D.; Saeed, B.; Atkinson, R. Improving RF-based partial discharge localization via machine learning ensemble method. IEEE Trans. Power Delivery 2019, 34, 1478–1489. [Google Scholar] [CrossRef] [Green Version]
- Abdel-Galil, T.; Sharkawy, R.; Salama, M.; Bartnikas, R. Partial discharge pattern classification using the fuzzy decision tree approach. IEEE Trans. Instrum. Meas. 2005, 54, 2258–2263. [Google Scholar] [CrossRef]
- Gao, A.; Zhu, Y.; Cai, W.; Zhang, Y. Pattern recognition of partial discharge based on VMD-CWD spectrum and optimized CNN with cross-layer feature fusion. IEEE Access 2020, 8, 151296–151306. [Google Scholar] [CrossRef]
- Gao, J.; Zhu, Y.; Zheng, Y.; Jia, Y. Pattern recognition of partial discharge based on VMD-WVD and SSAE. Proc. CSEE 2019, 39, 4118–4129. [Google Scholar] [CrossRef]
- Contin, A.; Cavallini, A.; Montanari, G.; Pasini, G.; Puletti, F. Digital detection and fuzzy classification of partial discharge signals. IEEE Trans. Dielectr. Electr. Insul. 2002, 9, 335–348. [Google Scholar] [CrossRef]
- Ardila-Rey, J.; Ortiz, J.; Creixell, W.; Muhammad-Sukki, F.; Bani, N. Artificial generation of partial discharge sources through an algorithm based on deep convolutional generative adversarial networks. IEEE Access 2020, 8, 24561–24575. [Google Scholar] [CrossRef]
- Liu, L.; Wang, L.; Mei, H.; Guo, C. Defects detection methods for composite insulators based on shearing speckle interferometry. Proc. CSEE 2019, 39, 4599–4606. [Google Scholar] [CrossRef]
- Ramesh, M.; Cui, L.; Gorur, R. Impact of superficial and internal defects on electric field of composite insulators. Int. J. Electr. Power Energy Syst. 2019, 106, 327–334. [Google Scholar] [CrossRef]
- Lv, F.; Liu, J.; Shi, P.; Wang, F.; Xiong, J.; Li, C. Experimental research on composite insulator fault detection. High Volt. Appar. 2013, 49, 95–100. [Google Scholar] [CrossRef]
- Polisetty, S.; El-Hag, A.; Jayram, S. Classification of common discharges in outdoor insulation using acoustic signals and artificial neural network. High Volt. 2020, 4, 333–338. [Google Scholar] [CrossRef]
- Ferrah, I.; Chaou, A.K.; Maadjoudj, D.; Teguar, M. Novel colour image encoding system combined with ANN for discharges pattern recognition on polluted insulator model. IET Sci. Meas. Technol. 2020, 14, 718–725. [Google Scholar] [CrossRef]
Figure 1.
Test circuit.

Figure 2.
Actual simulation of various defects: (a) conduction conductive; (b) conduction semi-conductive; (c) suspension conductive; (d) suspension semi-conductive; (e) leakage tracking; (f) water vapor entry.
Figure 2.
Actual simulation of various defects: (a) conduction conductive; (b) conduction semi-conductive; (c) suspension conductive; (d) suspension semi-conductive; (e) leakage tracking; (f) water vapor entry.
Figure 3.
Four groups of electromagnetic wave spectrums of conduction conductive defect composite insulators: (a) peak value; (b) average value.
Figure 3.
Four groups of electromagnetic wave spectrums of conduction conductive defect composite insulators: (a) peak value; (b) average value.
Figure 4.
Electromagnetic wave spectrum of various insulator defects.
Figure 5.
Flow of processing method and result analysis of ultrasonic data.
Figure 6.
n-S box plot.

Figure 7.
n-S box plot after excluding outliers.

Figure 8.
Equal-spacing n-S map.
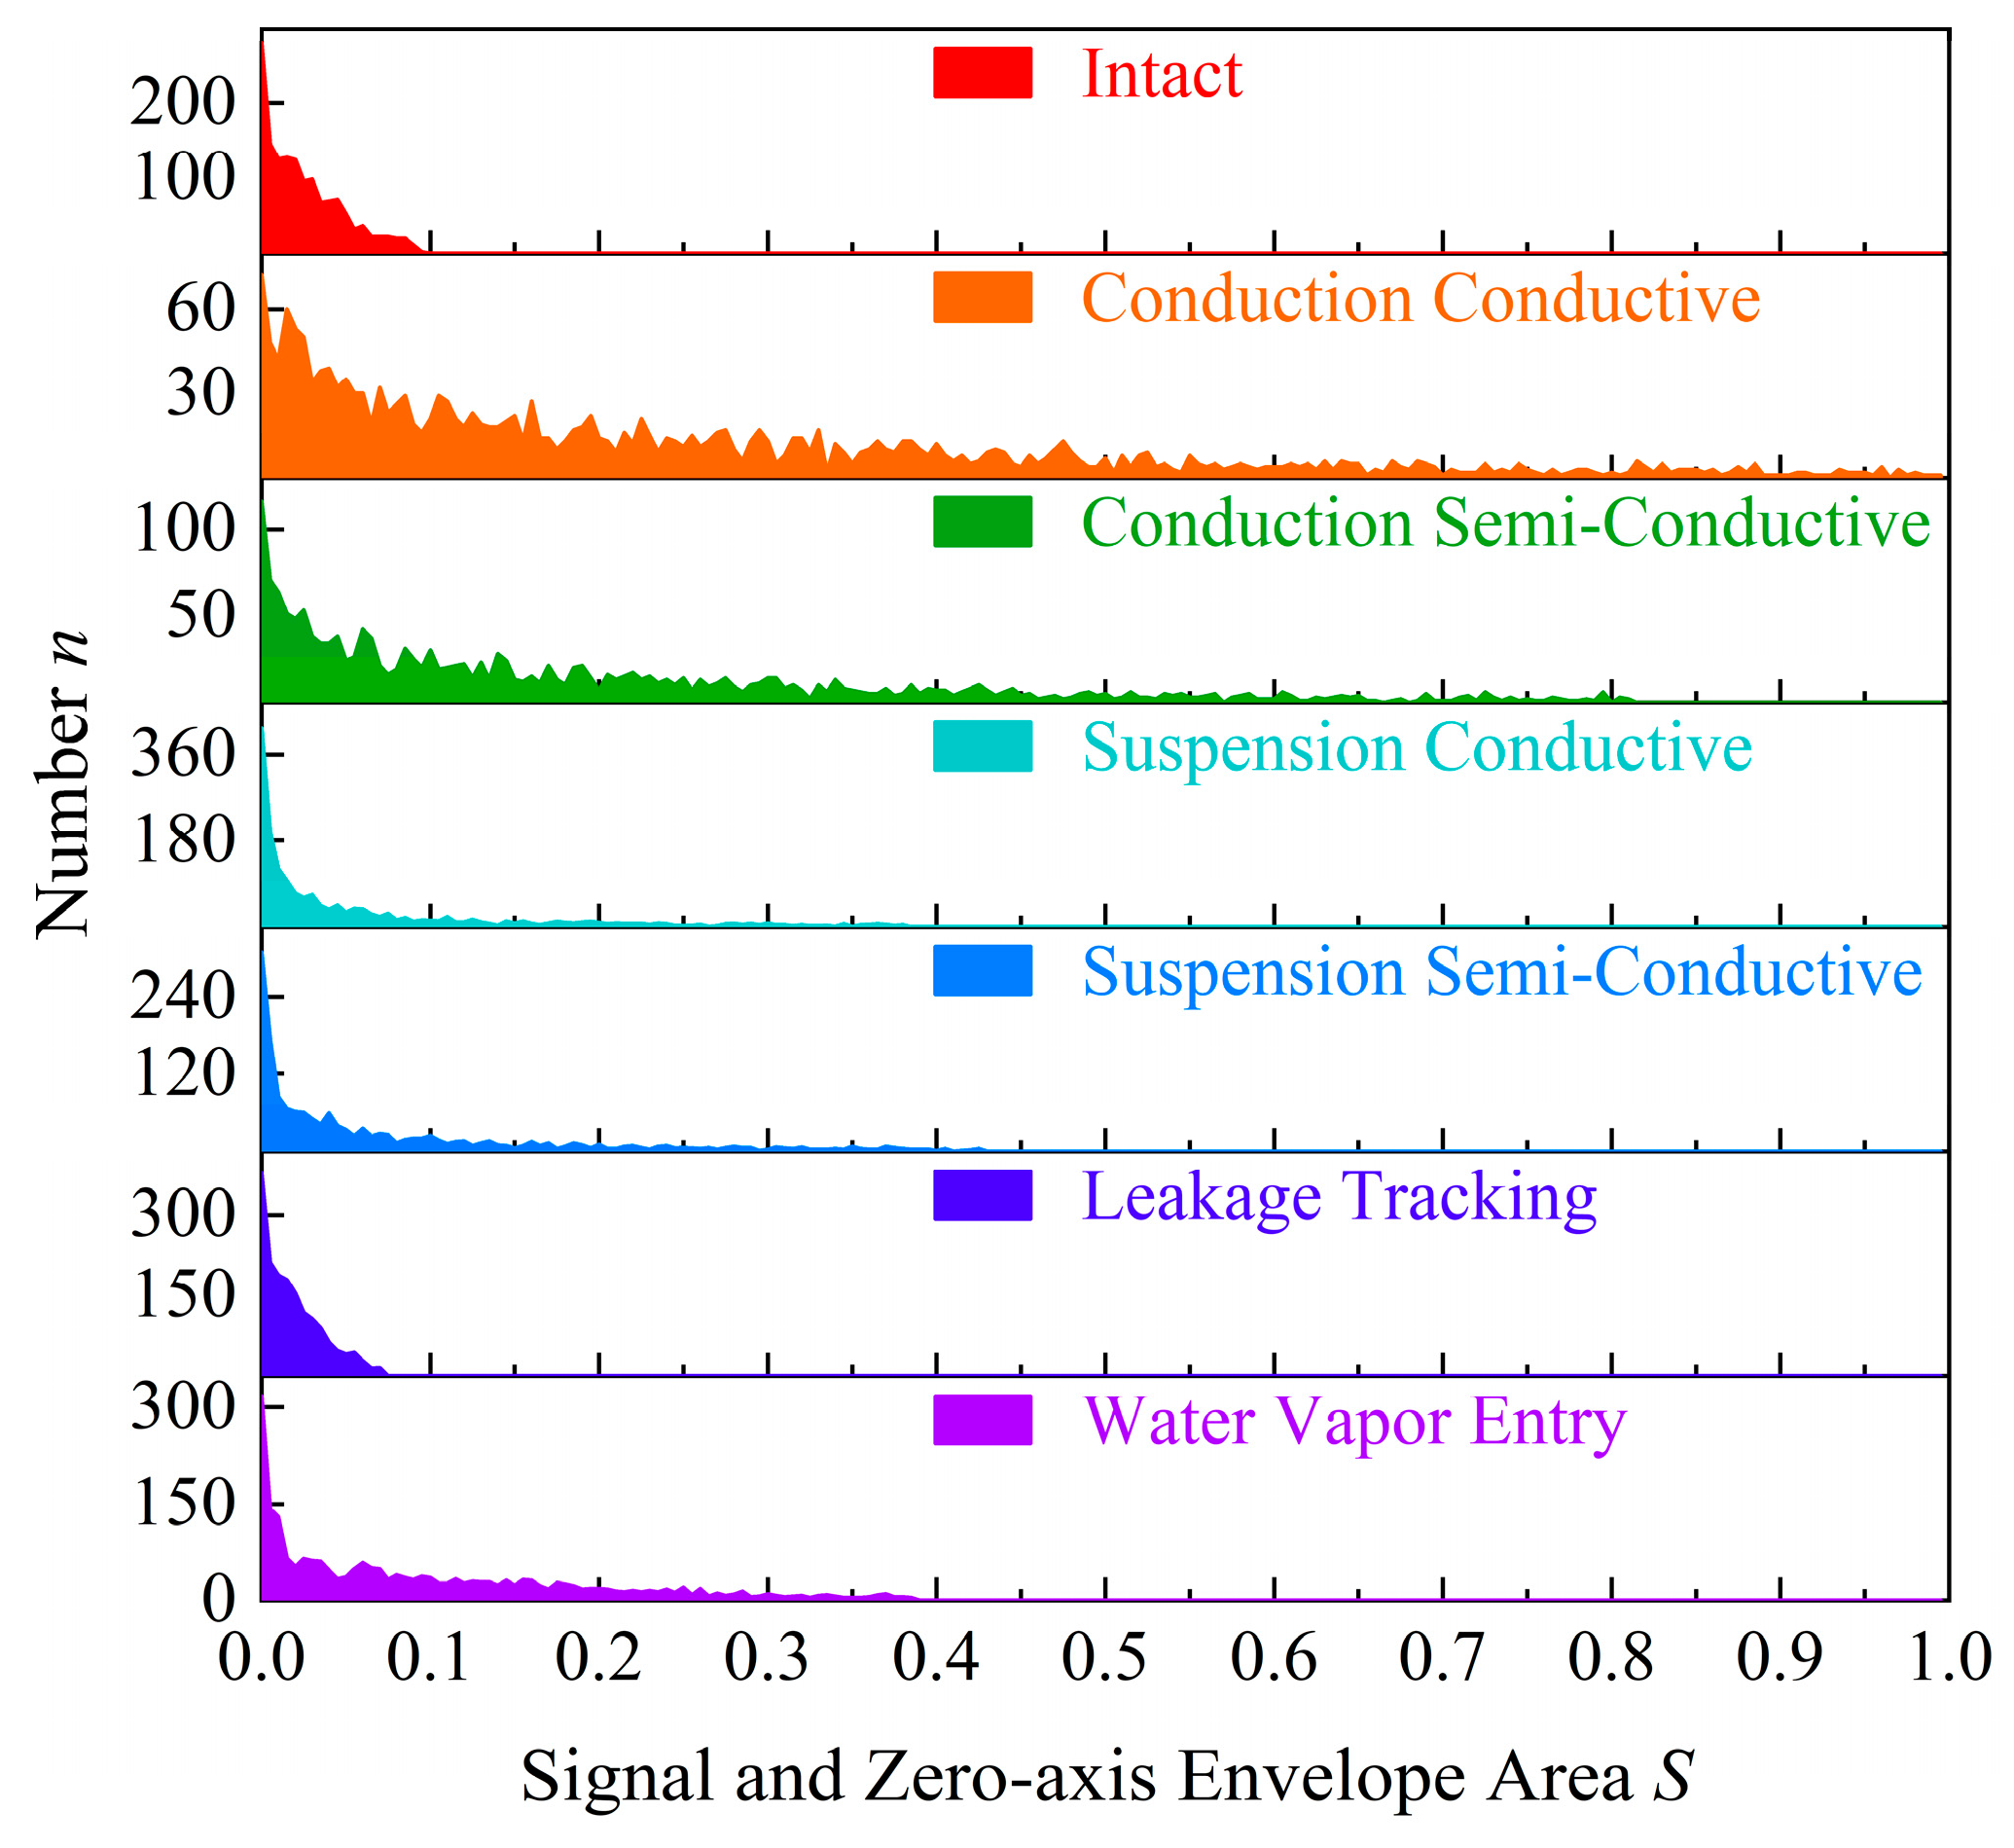
Figure 9.
Special spacing n-S map.

Figure 10.
Power spectral density estimation: (a) Blackman−Tukey method; (b) Welch method.

Figure 11.
Overall network architecture of the proposed method.
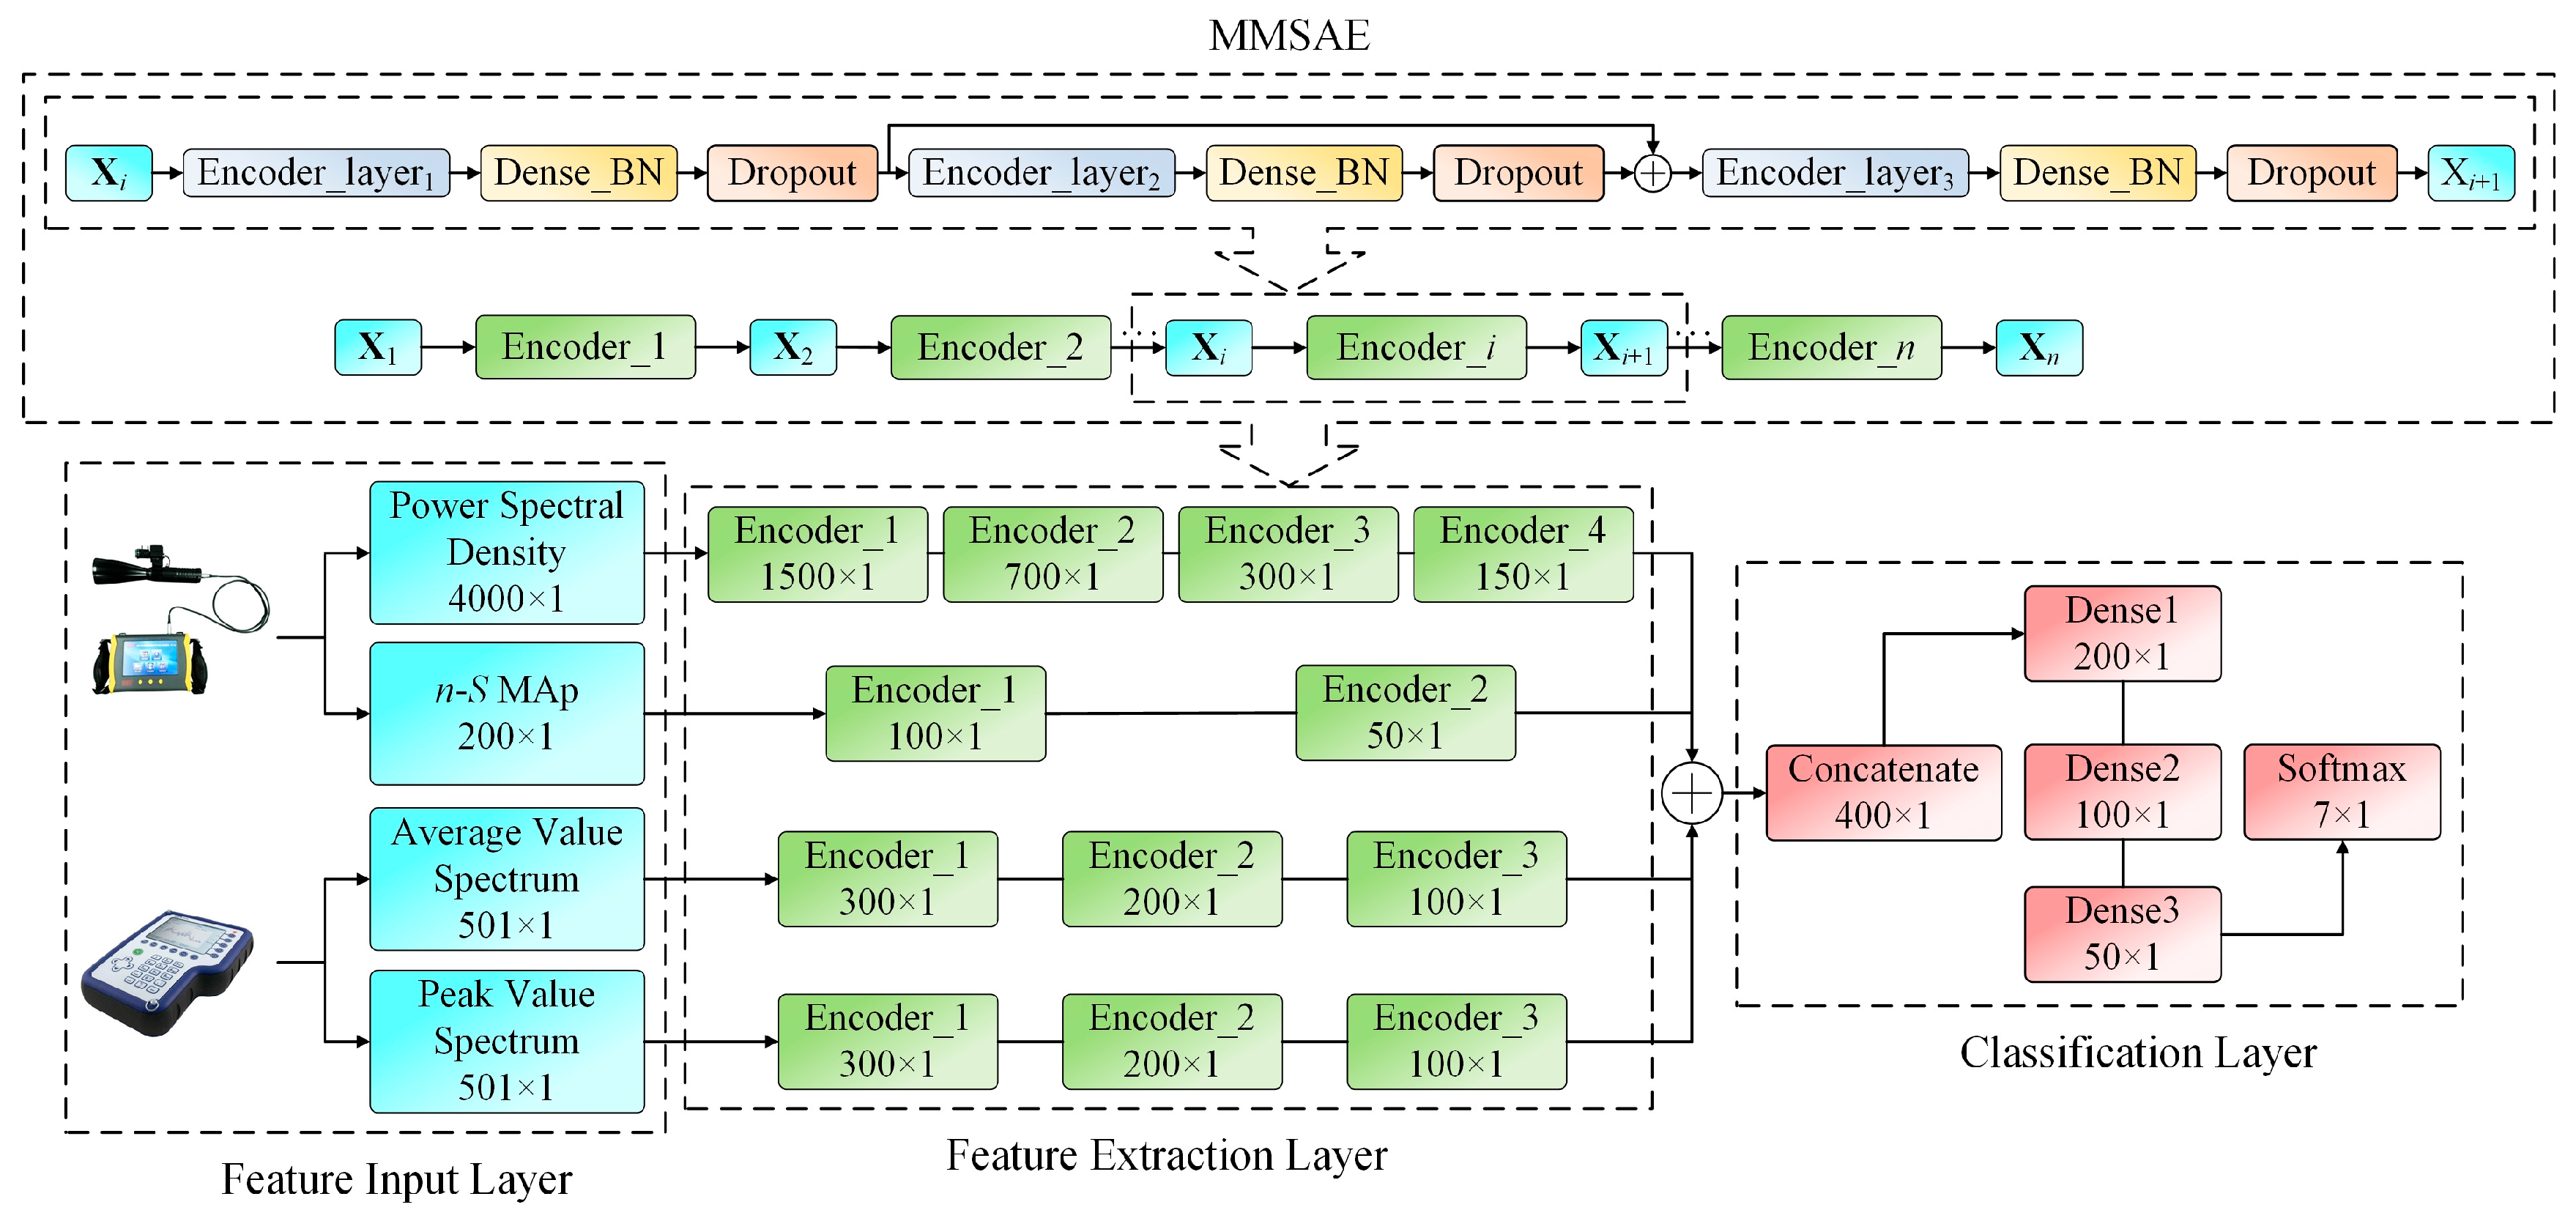
Figure 12.
Accuracy and loss-value of fusion data training set and validation set.
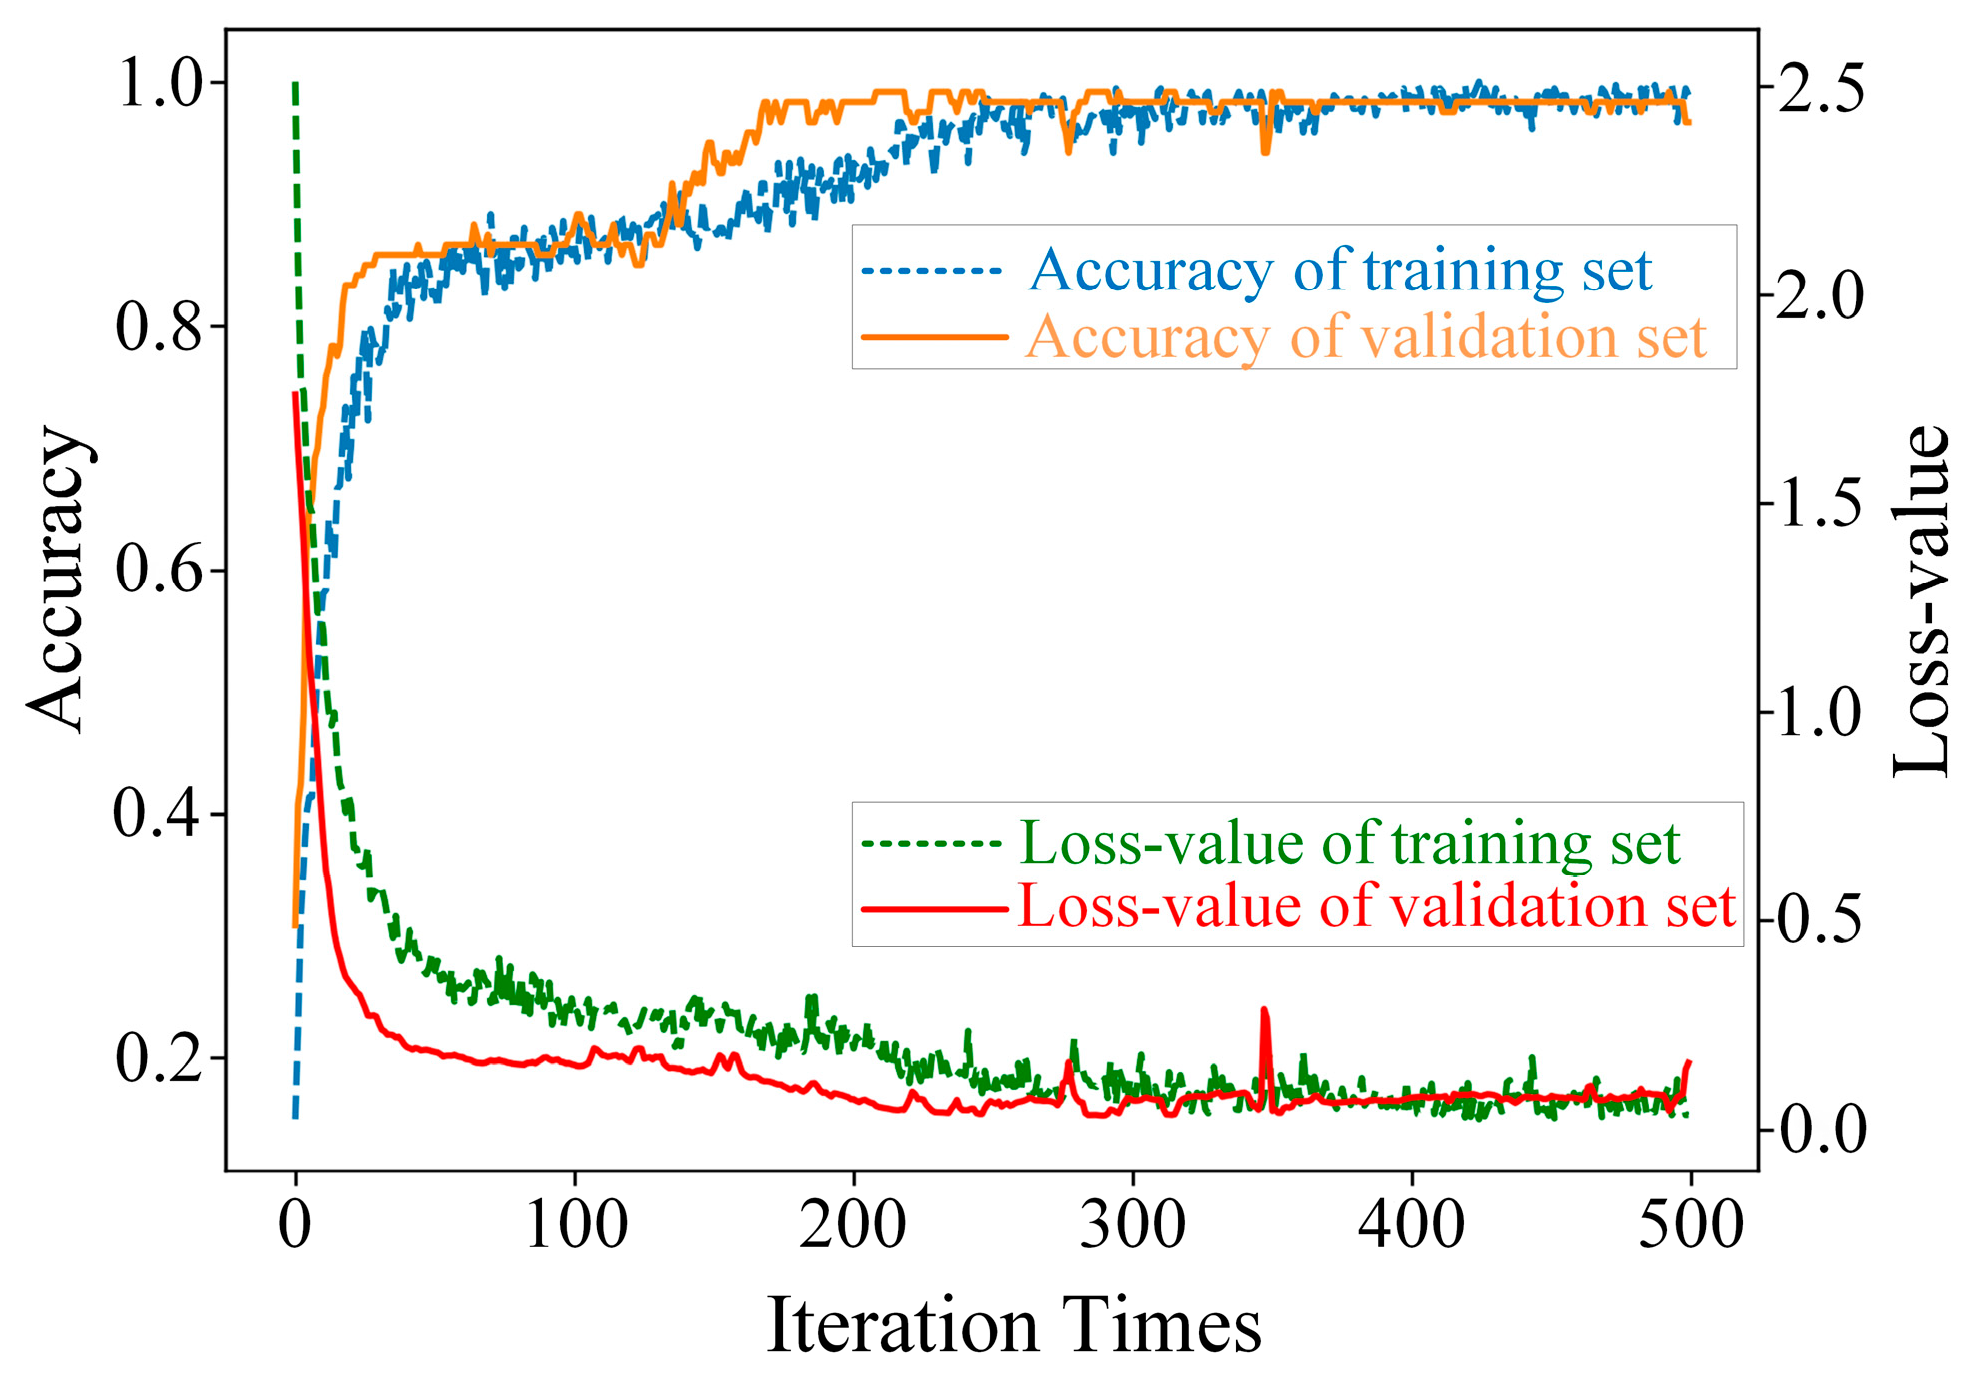
Figure 13.
Confusion matrix of fusion data.
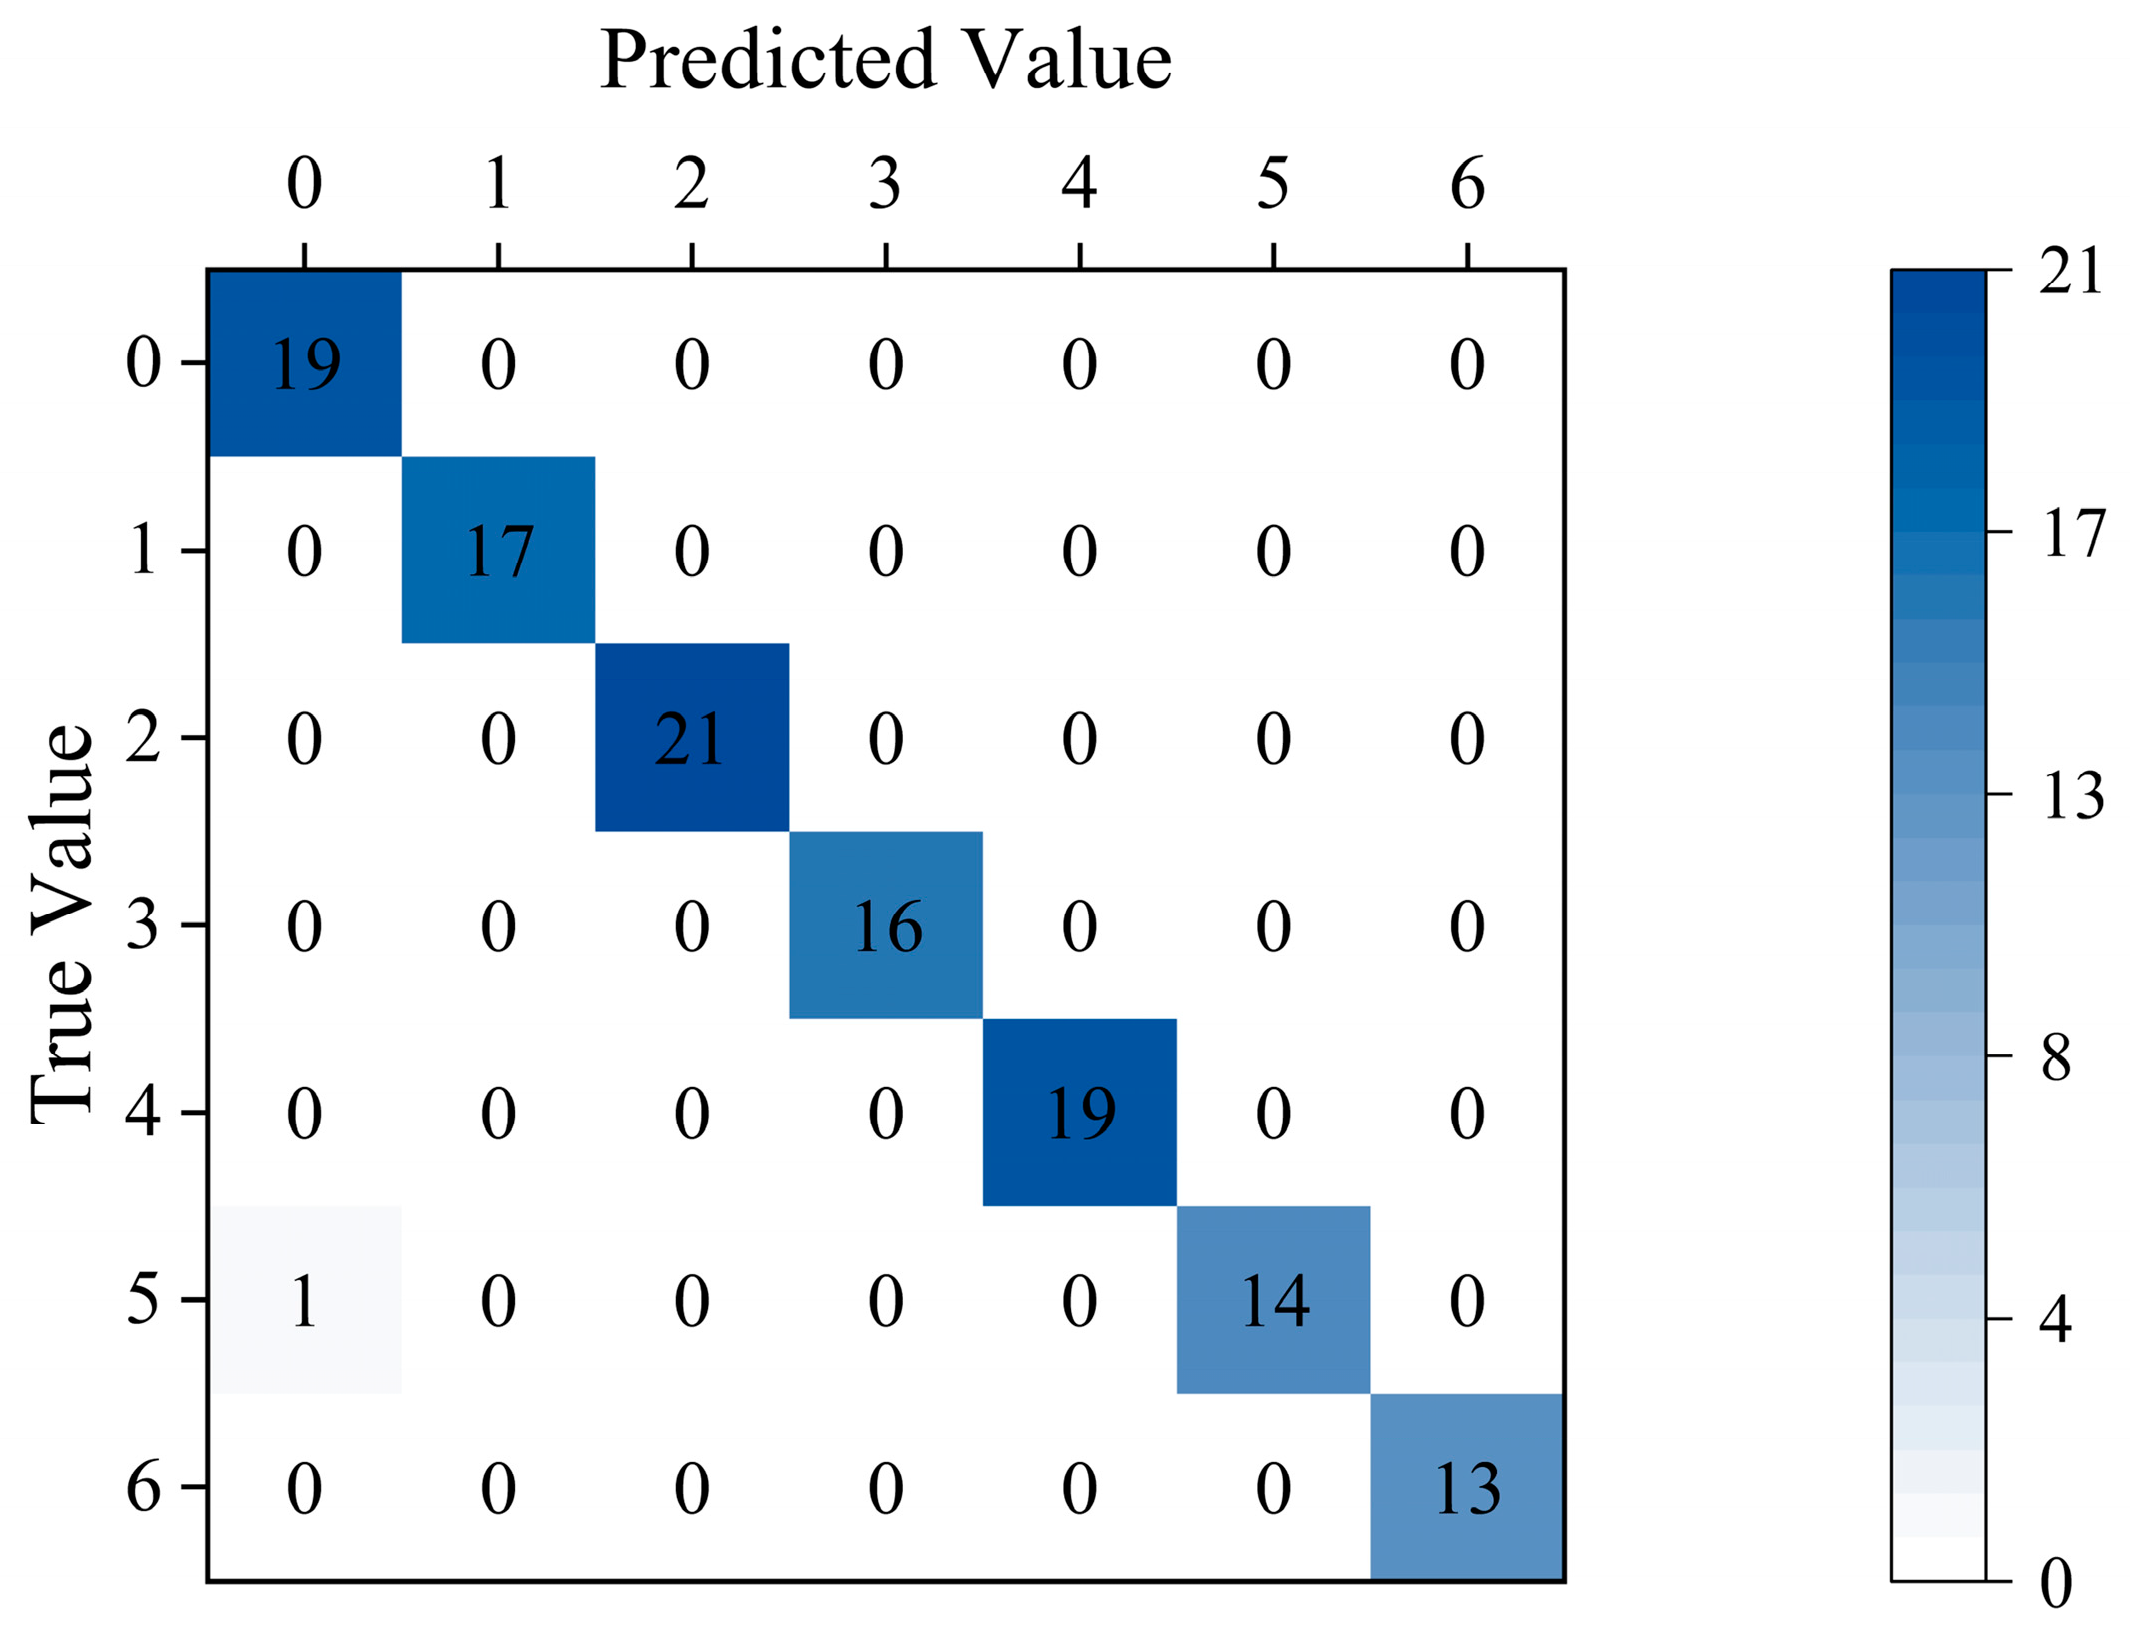
Figure 14.
Field aging composite insulators: (a) No. 1; (b) No. 2; (c) No. 3; (d) No. 4; (e) No. 5; (f) No. 6; (g) No. 7; (h) No. 8; (i) No. 9; (j) No. 10.
Figure 14.
Field aging composite insulators: (a) No. 1; (b) No. 2; (c) No. 3; (d) No. 4; (e) No. 5; (f) No. 6; (g) No. 7; (h) No. 8; (i) No. 9; (j) No. 10.

Figure 15.
Aging composite insulators after dissection: (a) No. 1; (b) No. 2; (c) No. 3; (d) No. 4; (e) No. 5; (f) No. 6; (g) No. 7; (h) No. 8; (i) No. 9; (j) No. 10.
Figure 15.
Aging composite insulators after dissection: (a) No. 1; (b) No. 2; (c) No. 3; (d) No. 4; (e) No. 5; (f) No. 6; (g) No. 7; (h) No. 8; (i) No. 9; (j) No. 10.

Table 1.
Types and methods of defect simulation.
| Defect Type | Starting Position | Simulated Material |
|---|---|---|
| Intact | ||
| Conduction conductive | High-voltage end metal fittings | Copper wire |
| Conduction semi-conductive | Carbon rod | |
| Water vapor entry | Salt solution | |
| Suspension conductive | High-voltage end first umbrella skirt | Copper wire |
| Suspension semi-conductive | Carbon rod | |
| Leakage tracking | Carbon powder |
Table 2.
The skewness and kurtosis of data S.
| Area S | Variance | Skewness | Kurtosis |
|---|---|---|---|
| Intact | 0.0005 | 0.90 | 3.10 |
| Conduction conductive | 0.0561 | 1.14 | 3.55 |
| Conduction semi-conductive | 0.0362 | 1.27 | 3.97 |
| Suspension conductive | 0.0076 | 1.85 | 5.72 |
| Suspension semi-conductive | 0.0100 | 1.61 | 4.77 |
| Leakage tracking | 0.0003 | 0.92 | 3.13 |
| Water vapor entry | 0.0092 | 1.04 | 3.26 |
Table 3.
Sample list.
| Number | Type | Data Quantity |
|---|---|---|
| 0 | Intact | 72 |
| 1 | Conduction conductive | 120 |
| 2 | Conduction semi-conductive | 120 |
| 3 | Suspension conductive | 72 |
| 4 | Suspension semi-conductive | 72 |
| 5 | Leakage tracking | 72 |
| 6 | Water vapor entry | 72 |
Table 4.
Identification results of MMSAE and ANN.
| Defect Type | Index | MMSAE | ANN | ||||
|---|---|---|---|---|---|---|---|
| Fusion (%) | Ultrasonic (%) | Electromagnetic Wave (%) | Fusion (%) | Ultrasonic (%) | Electromagnetic Wave (%) | ||
| 0 | Recall | 95 | 82.35 | 90 | 86.36 | 50 | 85 |
| Precision | 100 | 73.68 | 94.74 | 100 | 31.58 | 89.47 | |
| F1-score | 97.44 | 77.78 | 92.31 | 92.68 | 38.71 | 87.18 | |
| 1 | Recall | 100 | 100 | 100 | 100 | 100 | 100 |
| Precision | 100 | 94.12 | 100 | 100 | 100 | 100 | |
| F1-score | 100 | 96.97 | 100 | 100 | 100 | 100 | |
| 2 | Recall | 100 | 100 | 100 | 100 | 100 | 100 |
| Precision | 100 | 100 | 100 | 100 | 100 | 100 | |
| F1-score | 100 | 100 | 100 | 100 | 100 | 100 | |
| 3 | Recall | 100 | 84.21 | 100 | 100 | 100 | 100 |
| Precision | 100 | 100 | 100 | 100 | 100 | 100 | |
| F1-score | 100 | 91.43 | 100 | 100 | 100 | 100 | |
| 4 | Recall | 100 | 76.92 | 100 | 100 | 68.75 | 100 |
| Precision | 100 | 52.63 | 100 | 100 | 57.89 | 100 | |
| F1-score | 100 | 62.50 | 100 | 100 | 62.86 | 100 | |
| 5 | Recall | 100 | 70.59 | 92.86 | 92.31 | 40.91 | 85.71 |
| Precision | 93.33 | 80 | 86.67 | 80 | 60 | 80 | |
| F1-score | 96.55 | 75 | 89.66 | 85.71 | 48.65 | 82.76 | |
| 6 | Recall | 100 | 47.06 | 100 | 100 | 50 | 100 |
| Precision | 100 | 61.54 | 100 | 92.31 | 61.54 | 100 | |
| F1-score | 100 | 53.33 | 100 | 96 | 55.17 | 100 | |
| Total accuracy | 99.17 | 80.83 | 97.5 | 96.67 | 73.30 | 95.83 | |
Table 5.
Diagnosis and dissection results of engineering cases.
| No. | Software Diagnostics | Dissection Verification |
|---|---|---|
| 1 | Conduction conductive | Conduction conductive |
| 2 | Conduction semi-conductive | Conduction semi-conductive |
| 3 | Water vapor entry | Water vapor entry |
| 4 | Suspension conductive | Suspension conductive |
| 5 | Suspension semi-conductive | Suspension semi-conductive |
| 6 | Water vapor entry | Water vapor entry |
| 7 | Water vapor entry | Water vapor entry |
| 8 | Conduction conductive | Conduction conductive |
| 9 | Leakage tracking | Leakage tracking |
| 10 | Conduction semi-conductive | Conduction semi-conductive |
Disclaimer/Publisher’s Note: The statements, opinions and data contained in all publications are solely those of the individual author(s) and contributor(s) and not of MDPI and/or the editor(s). MDPI and/or the editor(s) disclaim responsibility for any injury to people or property resulting from any ideas, methods, instructions or products referred to in the content. |
© 2023 by the authors. Licensee MDPI, Basel, Switzerland. This article is an open access article distributed under the terms and conditions of the Creative Commons Attribution (CC BY) license (https://creativecommons.org/licenses/by/4.0/).
Share and Cite
MDPI and ACS Style
Zhang, B.; Shu, S.; Chen, C.; Wang, X.; Xu, J.; Fang, C. Composite Insulator Defect Identification Method Based on Acoustic–Electric Feature Fusion and MMSAE Network. Energies 2023, 16, 4906. https://doi.org/10.3390/en16134906
AMA Style
Zhang B, Shu S, Chen C, Wang X, Xu J, Fang C. Composite Insulator Defect Identification Method Based on Acoustic–Electric Feature Fusion and MMSAE Network. Energies. 2023; 16(13):4906. https://doi.org/10.3390/en16134906
Chicago/Turabian StyleZhang, Bizhen, Shengwen Shu, Cheng Chen, Xiaojie Wang, Jun Xu, and Chaoying Fang. 2023. "Composite Insulator Defect Identification Method Based on Acoustic–Electric Feature Fusion and MMSAE Network" Energies 16, no. 13: 4906. https://doi.org/10.3390/en16134906
Note that from the first issue of 2016, this journal uses article numbers instead of page numbers. See further details here.