
Airflow Resistance of Solid-Separated Dairy Waste for Drying and Storage


1
Biological and Agricultural Engineering, Texas A & M University, College Station, TX 77843, USA
2
Frontier Bioenergy Systems, Austin, TX 78723, USA
*
Author to whom correspondence should be addressed.
Energies 2023, 16(13), 5038; https://doi.org/10.3390/en16135038
Submission received: 27 April 2023
/
Revised: 12 June 2023
/
Accepted: 26 June 2023
/
Published: 29 June 2023
(This article belongs to the Special Issue Advances in Biomass for Energy Technologies)
Abstract
:The resistance of solid-separated solid wastes (SSDWs) to moderate airflow ranging from 0.05 to 0.30 m3/s-m2 was measured at various bed depths and moisture levels. The pressure drop across a loose-fill fixed bed column was observed to increase more rapidly with increasing airflow rates than with increasing bed depths. An increase in the moisture content (10 percentage points) caused a decrease in the pressure drop by an average of 13.2–17.0%, evaluated within a 10–40% moisture content (MC) range. A full-factorial model analysis using standard least squares was used to describe the main effects and interactions of the test parameters in predicting the pressure drop. The Hukill and Ives nonlinear model was able to accurately describe the airflow resistance data of SSDWs at various MCs. Empirical curves describing the SSDW resistance to airflow were developed to aid in the preliminary design of ventilation systems for drying and storage.
1. Introduction
Industrial-sized livestock operations, such as the concentrated animal feeding operation (CAFO), are often associated with a range of public health and environmental concerns due to the massive quantities of animal wastes [1]. In CAFOs, hundreds to several thousands of cattle are confined in relatively small spaces that generate very large volumes of manure that are kept in small areas until disposed of. Animal waste is traditionally valued in agriculture as an organic source of nutrients, particularly at a time when livestock and poultry facilities produce excreta at sustainable levels [2]. However, as CAFOs become more intensive, the adverse effects of manure land disposal eventually outweigh its benefits [3], resulting in the spread of pathogens, elevated levels of greenhouse gas emissions, and contaminated groundwater sources [4]. Confined dairy operations rely on water-based slurry systems to flush wastes from the floors of animal housings and channel the liquid slurry into large storage ponds, while most of the solids are separated and left on the open field for sun-drying.
The drying of dairy wastes improves handling and storage conditions and discourages bacteriological degradation—a precursor mechanism of greenhouse and odorous gases [5]. Once the solid-separated dairy waste (SSDW) is dried, it becomes a potential cheap source of energy, with an estimated heating value of 8500 British thermal units per pound (Btu/lb) or 19.7 Megajoules per kilogram (MJ/kg) dry ash-free basis [6]. The energy that could be generated can be used to support local farm operations and potentially reduce the cost of fuel and energy, which accounts for 15% of the total production cost of livestock facilities in the United States [7]. Animal wastes must be dried to a moisture content (MC) of about 10% and undergo particle size reduction prior to bioenergy conversion [8]. Drying is an important pre-treatment step before dairy solid wastes can effectively be converted into energy via thermo-chemical processes such as direct combustion and gasification [9].
Hot-air convection drying is routinely used in large-scale applications, while open-air drying is usually preferred in rural areas [10]. Convective dryers involve forcing heated air into a bed of biomass. The heated air must travel across floor openings and through the narrow spaces between particles. These limited air paths cause resistance to flow (typically measured as pressure drops, or P drops) due to energy lost from friction and turbulence [11]. Predicting how much resistance a certain biomass will exert against airflow is fundamental to any dryer system, particularly systems with forced convection designs. Airflow resistance prediction is a common practice for grains and storage applications. The American Society of Agricultural Engineers provides data on common grains, seeds, and other agricultural products for perforated metal sheet aeration and drying systems [12]. However, published data on the airflow resistance of biomass wastes, as potential bioenergy feedstocks, are sparse.
A common approach in estimating P drops through grains or other biomass materials is to develop empirical curves that relate airflow and P drop. The Ergun model is the fundamental equation used to calculate superficial air velocity across packed beds [13]. The Ergun model is simply the sum of both laminar and turbulent flow equations, requiring information about air properties, bulk porosity, and particle equivalent diameter (de). However, evident problems are encountered when accurately measuring de and porosity due to variations in the shape and size of materials [11]. For many years, several variations of the Ergun model have been developed to include different airflow properties of various agricultural materials [11,14]. In 1953, Shedd [15] proposed a simplified model relating airflow (Q) and pressure drop (ΔP) in a fixed bed of grains (shown in Equation (1)). The constants a and b are for a particular type of grain.
Q = a(ΔP)b
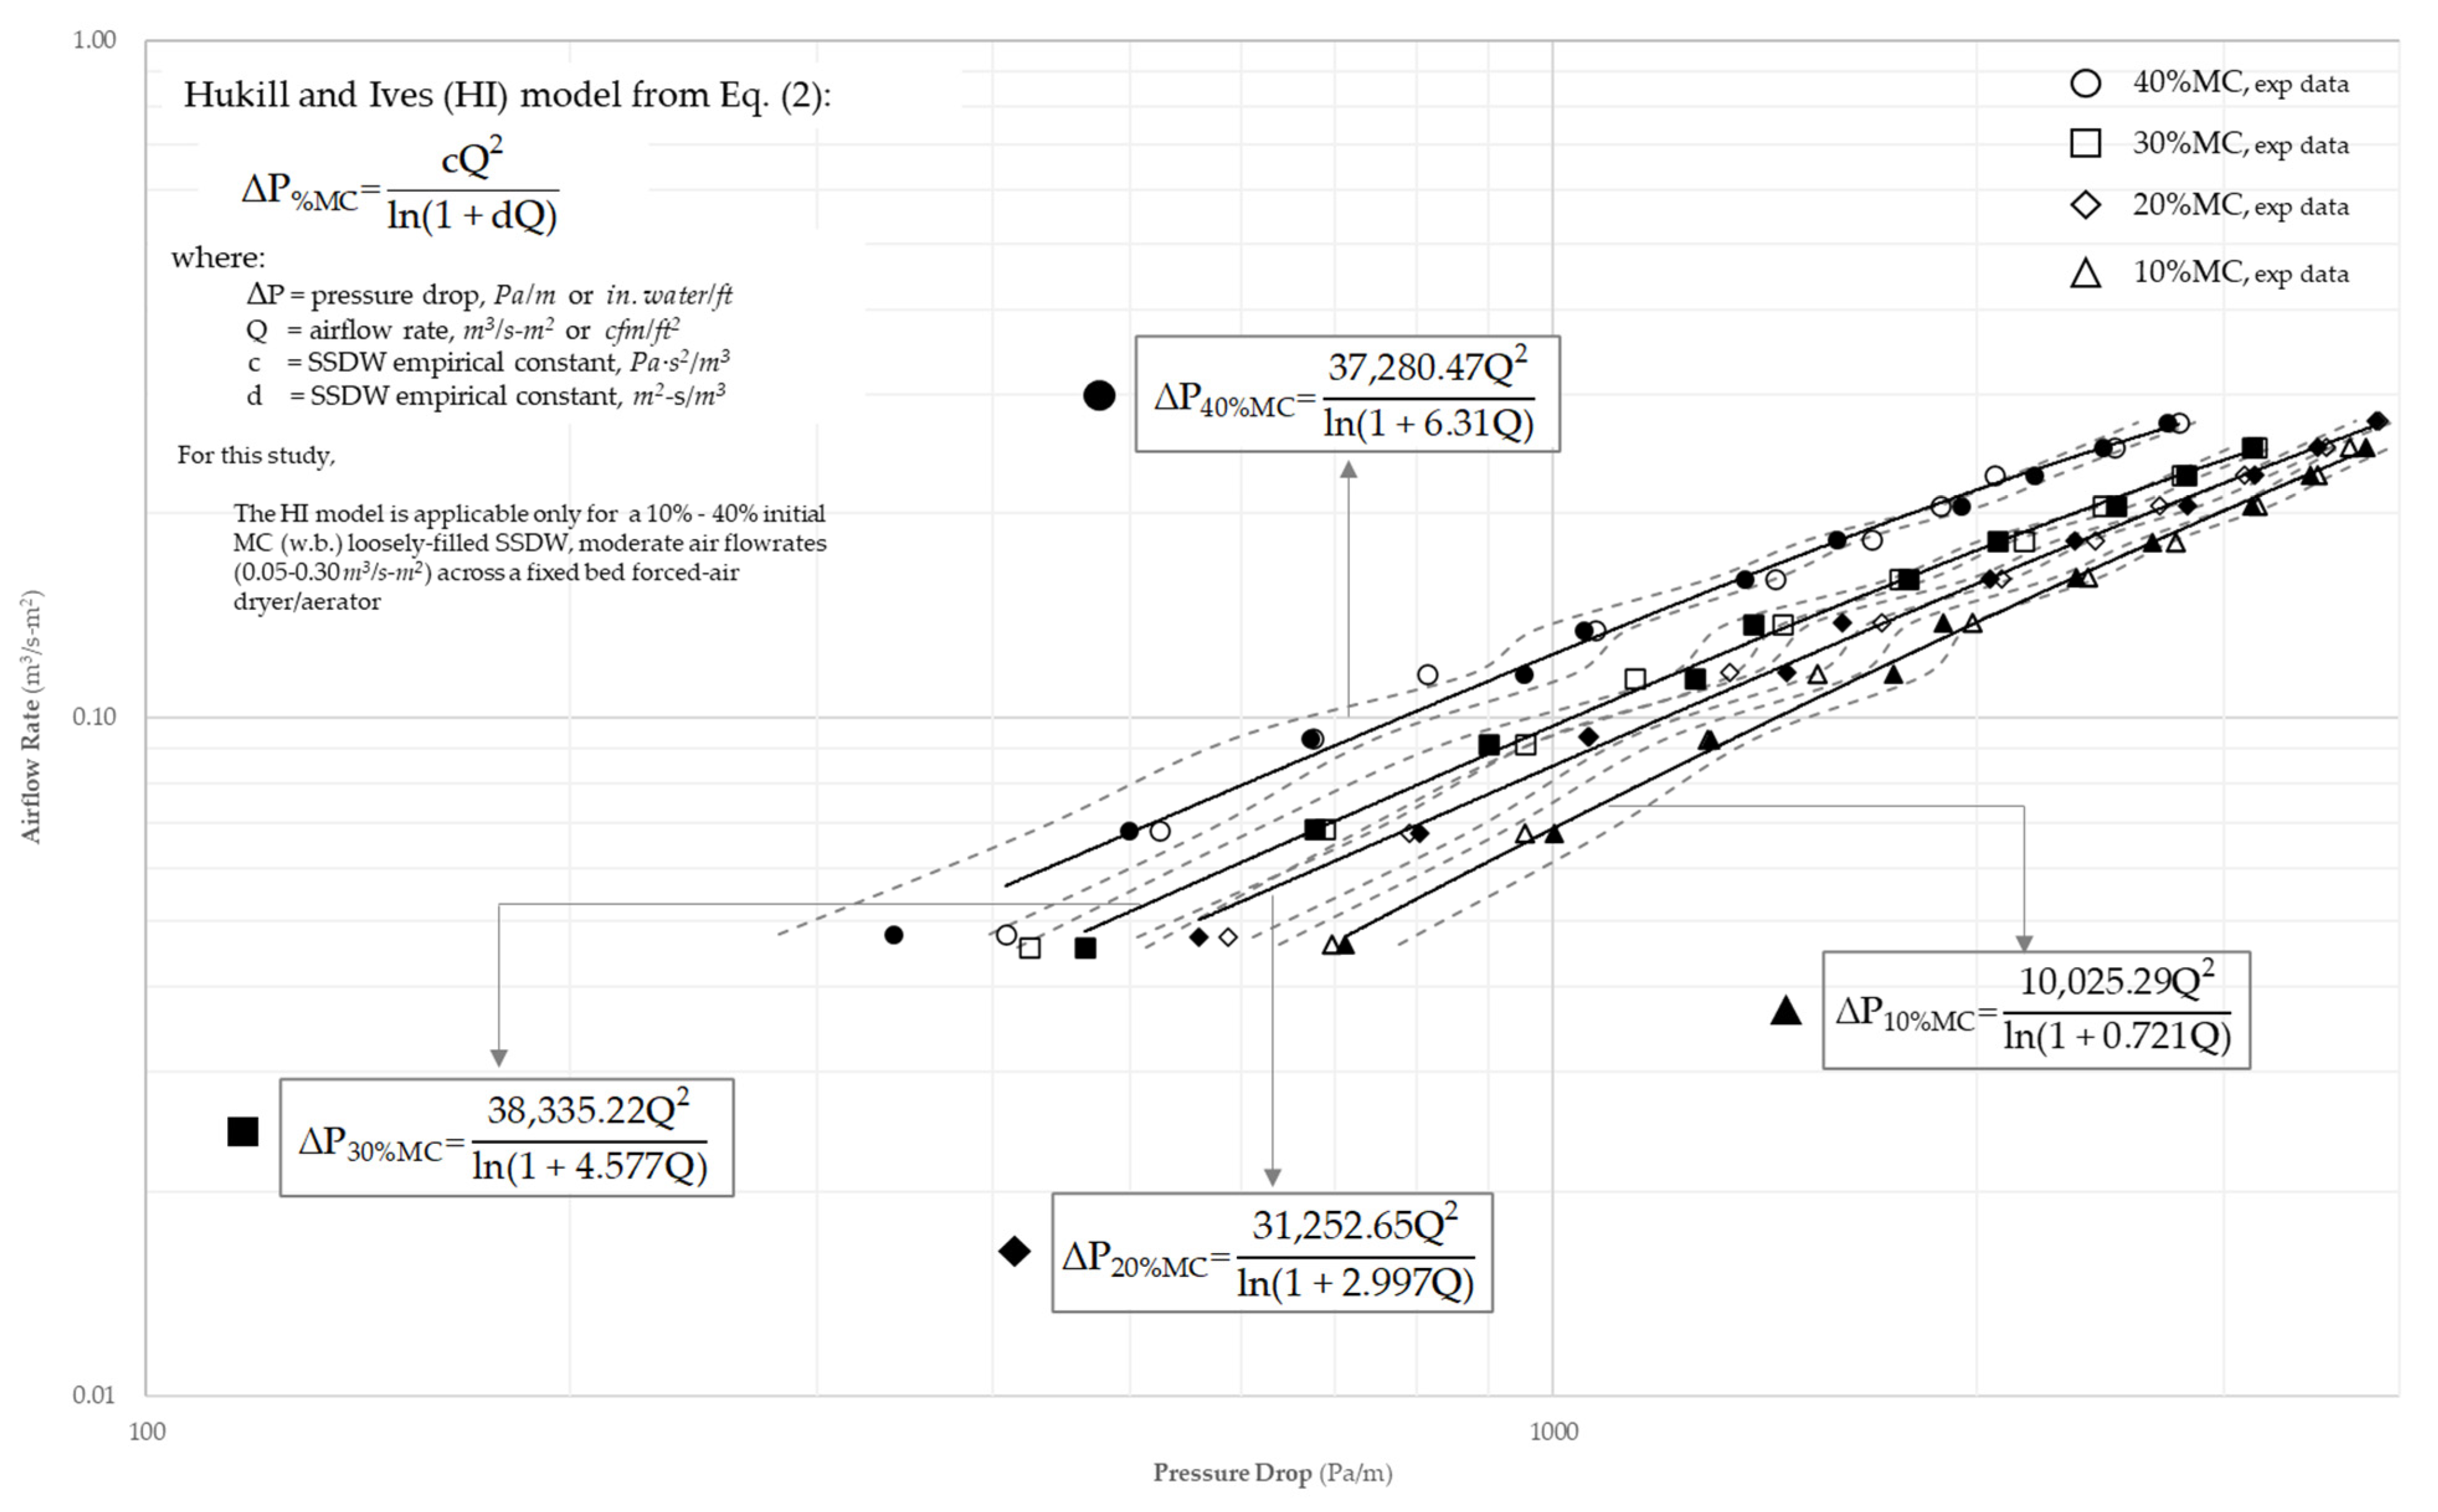
Equation (1) is usually presented in logarithmic plots known as Shedd’s curves. These curves are available and widely used in the ASAE Standard Data D272.3 [12]. Many designers adopt Shedd’s curves to estimate airflow resistance across grain bulks due to their simplicity and ease of use [16]. Shedd’s equation is only applicable over a narrow range of airflow rates due to the non-linearity of Shedd’s curves at higher flowrates. As a follow-up to Shedd’s model, Hukill and Ives proposed an empirical model (shown in Equation (2)) to account for the non-linear nature of resistance to a wider range of airflow rates [14]. In Equation (2), the constants for a particular grain (c and d) are obtained from airflow resistance experiments. The ASAE D272.3 adopted this model to represent airflow P drop data for selected grains and other agricultural products.
ΔP = c Q2/[ln (1 + dQ)]
To the knowledge of the authors, no data on the resistance to airflow through bulk dairy waste have been reported elsewhere or compiled in the ASAE Standard Data. Fan selection is crucial to any convective dryer design, and this step requires fundamental information of how much airflow resistance will be developed in a particular bed of material [11]. The correct size and type of fan are essential to predict the drying times of specific biomass, as they affect the cost and energy required for drying. The shorter the drying time, the lower the energy demand, which ultimately translates into cost savings for fan operations. The goal of this study is to generate fundamental, quantitative information on the airflow resistance of solid-separated dairy wastes for drying applications prior to bioenergy conversion. Specifically, this investigation aims to present the effects of bed depth, airflow rate, and moisture content on the resistance to flow of solid-separated dairy wastes obtained from a local farm in Hereford, TX. The resulting empirical curves and MC-specific SSDW constants (as presented in Equation (2)) will be beneficial to both manufacturers and local farm owners, especially with the growing interest in integrating bioenergy into livestock operations.
2. Materials and Methods
2.1. Material Collection and Preparation
Dairy farms typically use mechanical separation and sedimentation basins to remove a portion of the solids from the waste slurry flushed from the housing floors. Separating the waste slurry into two fractions (liquids and solids) is inherently more manageable. The separated solids are then moved to the open lots for natural drying. A typical SSDW mainly consists of dairy manure, with small portions of sand, feed residues, and fibrous straw/bedding debris. For this study, the SSDW was obtained from a dairy facility in Hereford, TX. The samples were placed in polyethylene heavy duty bags and transported to the laboratory for immediate moisture determination.
The sun-dried SSDW collected from an open field was determined to have an average MC of 30.67% (as-received) following the standard MC test described in ASTM D3173-11 [17]. To determine the general size distribution of the collected SSDW particles, six (6) 150 g random samples were separated into five fractions using a set of Tyler sieves (Figure 1). In this paper, the fraction of particles smaller than 3.30 mm (Tyler Sieve #6) in size were considered “fines”. In most gasification and pyrolysis applications, biomass particles undergo size reduction to achieve the fine size range in order to optimize both conversion and thermal efficiencies [8,18]. Overall, the sieved samples contained an average of 26.98 ± 1.69% fines, of which 17.16 ± 2.72% were within the 1.2–3.33 mm particle size, while the rest had a particle size smaller than 1.2 mm.
A portion of the collected SSDW was dried in a convection oven, maintained at 105 °C to 110 °C, through a current of dry air. The drying of the SSDW took place for several days until the MC was reduced to 10%. Subsequent moisture contents of 20% and 40% were obtained by adding appropriate amounts of water (Mw) to rewet the SSDW. The amount of water (Mw) to be added to the 10% MC SSDW (Mssdw, 10%) to reach each moisture level (Xw) was determined using Equation (3).
Mw = (Mssdw, 10%)(Xw − 0.10)/(1 − Xw)
The rewetted SSDW was kept inside closed containers in a cold room for one week to equilibrate. The samples were carefully stirred at regular intervals to ensure uniform rewetting. All moisture content levels were expressed on a wet basis. Three random samples were obtained from each container to determine the moisture content. The MC values were averaged to report actual Xw after one week of equilibration. Bulk density values were also estimated at these moisture contents by weighing a known volume of the sample.
2.2. Experimental Test Apparatus
The airflow test unit used to measure the SSDW flow resistance is shown in Figure 2. The vertical test column was constructed using 5 mm thick clear plexiglass with the following dimensions: 150 mm diameter × 1200 mm height. The column was connected to a 150 mm × 200 mm stainless steel plenum with a 610 mm-long air inlet duct. The SSDW material was supported by a perforated floor with an open area of 30.2%. A flow straightener, consisting of 12.7 mm diameter copper tubing soldered together in a honeycomb-like configuration, was installed between the plenum and the test chamber to ensure uniform air distribution in the column. Polyethylene tubes (50 mm long, 6 mm diameter) were used as pressure taps located at different points along the test chamber. To minimize the wall effects on P drop measurements, the taps were inserted 25 mm from the inside of the column wall (distance equal to 1/4 of the column diameter), as described in another airflow study [14]. Pressure taps were located at various depths: 75 mm, 150 mm, 225 mm, 300 mm, 450 mm, and 600 mm from the surface of the SSDW bed.
Airflow to the column chamber was delivered using a variable-flow blower system (Cadillac HP33 P, 115-V, 60 Hz, 1.5 hp) capable of delivering up to 196 cfm (333 m3/h) with a max. static pressure tolerance of 48 in. of a water gauge (11.944 kPa). The flowrate was controlled via a dial-type controller and manually fine-tuned using an in-line valve. An air digital flowmeter (Aalborg, NY, USA) was installed in-line in the air duct to measure and record airflow (accuracy ± 1.5%). The P drops (accuracy ± 1.5% full scale) across the depth of the SSDW column were measured using differential pressure transducers (Model PX277, Omega Engineering, Norwalk, CT, USA).
2.3. Airflow Tests
The test chamber was filled by freely pouring the material directly above the column and manually levelled (by slight tapping and adding more SSDW) to the desired bed height. The duct system was designed to provide an upward airflow through the column. Static pressures across 610 mm (24 in.) of the SSDW bed were measured at different pressure taps for each of 10 airflow rates between 0.05 and 0.30 m3/m2-s (9.0 to 59 cfm/ft2), a range considered to represent low to moderate airflows for most agricultural drying applications [12]. After a complete set of measurements for all flowrates, the column was completely emptied and cleaned. The test chamber was then refilled, and measurements were repeated to obtain three replications. A similar measurement protocol was followed for determining the resistance to moderate airflows of the SSDW at three moisture levels considered in this investigation. All tests were carried out in the Bioenergy Testing and Analysis (BETA) Laboratory, Texas A&M University, where the room temperature and relative humidity were maintained at 21.67 °C (71 °F) and 50 ± 5%, respectively.
2.4. Pressure Drop Analysis
The airflow resistance data for the SSDW at different MCs were fitted to the empirical equations of Shedd and Hukill and Ives using a Gauss–Newton algorithm, a technique used to solve non-linear least square problems integrated in JMP Statistical Software v.16 (SAS Institute Inc., Cary, NC, USA). Furthermore, a two-degree full-factorial model analysis using standard least squares was used to investigate the main effects and interactions of the airflow and MC on the pressure drop in a fixed bed, loosely filled column. All statistical evaluations were conducted at a 5% significance level (α).
3. Results and Discussion
3.1. Depth vs. Pressure Drop
The pressure drop (P drop) of different bed depths at 30% MC (as-received moisture level) is shown in Figure 3. The P drop lines for the different bed depths resulting from the regression analysis showed that the P drop experienced by the system increased with bed depth. The almost parallel fitted lines suggest a fairly constant slope within the range of the airflow rates. An even closer look at Figure 3 reveals that a change in the airflow rate causes a greater P drop in the aeration system compared with a change in the bed depth for the same airflow rate. For example, the dotted lines in Figure 3 illustrate that doubling the airflow rate from 0.10 to 0.20 m3/m2-s at a 305 mm (12 in.) bed depth increases the P drop from 345 to 790 Pa. However, doubling the bed depth from 305 mm to 610 mm (24 in.) only increases the P drop from 345 to 600 Pa. In general, it can be stated that the P drop increases more rapidly with increasing air flow than with increasing bed depth, which is in agreement with several similar studies on a wide variety of agricultural crops [14,15,19,20].
3.2. Comparative Airflow Resistance of SSDW
The ASABE has published the airflow characteristics of several agricultural materials, excluding residues and other waste products that can be potentially used as bioenergy feedstock such as SSDWs. The experimental data from Figure 3 were converted to pressure drop per unit depth of column height to be consistent with how data are presented in the ASAE Standards D272.3 [12]. The SSDW airflow resistance data (expressed as Pa/m), loosely filled into a column at 30.67% MC, were compared to the D272.3 data of some loosely filled common crop beds.
At lower airflows (<0.10 m3/s-m2), the average variation (reported as the standard deviation) of the SSDW data is 5%, while at airflows greater than 0.10 m3/s-m2, the variation is 8.8% (shown as broken lines in Figure 4). The airflow resistance of the SSDW was about 8 times the resistance of shelled corn at an airflow of 0.05–0.10 m3/s-m2 and 6 times at an airflow of 0.10–0.25 m3/s-m2. For the full range of airflows tested, the SSDW exhibited higher airflow resistance than rough rice (3.3 times), wheat (2.4 times), and canola seeds (1.08 times). Alfalfa seeds, which usually have a 1–2 mm particle size, showed 1.8 times more resistance to airflow than the SSDW. With the same filling method and degree of compaction, larger particles create enough void spaces for the air to flow with less resistance compared to materials having smaller particles such as canola and alfalfa. For the SSDW, although the majority of its particles are >4.7 mm in size, more than 20% are still considered fines (<3.3 mm). The presence of fine materials tends to increase the resistance to airflow [15]. Fine materials can fill up the void spaces and hence block the air passages that initially existed [20]. For corn ventilation systems, the relationship of fine materials (broken grains and other matter that passed through a 4.76 mm round hole) to P drop is available in the ASAE Standard D272.3. It shows that having at most 20% fines will result in a 4-fold increase in the P drop through shelled corns subjected to 0.08–0.20 m3/s-m2 airflow [12]. For paddy or rough rice fixed bed dryers, the presence of 10% and 15% fines by weight can increase the average P drop on an average by 177% and 457%, respectively [19]. In a separate study on the effects of fines on fan power, it was reported that 7.31% fines can increase the fan power requirement by 110% for aerator systems and by 364% for low-temperature bin dryers [21].
Based on the empirical curves presented in Figure 4, the aeration and drying system intended for shelled corn, rice, and wheat will not be adequate to fully aerate or dry an equal depth of SSDW. On the other hand, similar systems designed for alfalfa could be satisfactory, but over-designed to some extent.
3.3. Airflow Resistance at Different Moisture Levels
Figure 5 shows the airflow resistance SSDW data (averages of triplicates) at four different nominal levels of the moisture content (10%, 20%, 30%, and 40%). The actual average MCs are also presented in Table 1. Slight variations (3–5%) in the actual MCs within replicate can be attributed to the non-uniform SSDW composition and precision of the manual MC analysis. These small variations were assumed to not affect the nominal trends in the airflow resistance upon varying the MC levels. The general behavior of each airflow resistance curve remained unchanged (Figure 5), but a comparison between each curve indicated that an increase in the MC by 10 percentage points caused a decrease in the P drop by an average of 13.2–17.0%. Furthermore, it was observed that increasing the MC lowered the bulk densities of the SSDW (Table 1). This reduction in P drop was also extensively observed in several studies on different grains and seeds [15,19,22,23,24].
By maintaining a constant method of filling, previous studies on cereals (MC range of 11.4–39.4%) and lentils (MC range of 10.4–19.9%) reported with higher MC levels often result in higher porosity of the column bed [19,22]. Porosity can be described as the fraction of the void spaces to that of the total bed volume. The decrease in bulk density was indicative of the apparent increase in the porosity attributed to the fact that the volume increase in the SSDW particles related to both the absorption and adsorption of moisture is greater than the corresponding weight gained. As a result, the same mass of material occupies more volume of the column, thereby lowering the bulk density [25]. Reductions in the bulk density suggest that more void spaces are available than what initially existed, which allows for more air passages.
These empirical-based observations can only be used as a guide to airflow resistance, as the changes in P drop across a fixed bed is affected not only by MC but also by some important factors such as the degree of packing, particle size distribution and shape, and the amount of fines [21,22]. The development of theoretical equations involving all of these factors can be complex and would require more tedious measurements. In this experiment, the effect of the MC on the void space was not intended to be isolated. Instead, the void space was allowed to vary naturally with the SSDW moisture level for a loose bin-filling method since that is the type of situation often encountered in an actual drying or storage practice. The farmers often have control over the bin-filling method and not the void fraction. Hence, if the filling method and airflow rates are kept constant for a similar SSDW material with different MCs, the changes in P drop caused by the changes in the void fraction and surface characteristics as the MC varies may be attributed to a single variable—moisture.
3.4. Airflow Resistance Model Fitting
The airflow resistance data were subjected to full factorial analysis using least square fitting to determine the main effects and interaction effects of moisture and airflow rate in predicting the P drop across an SSDW bed. The analysis of variance (ANOVA) of the full-factorial model was determined to be significant at α = 0.05 (F = 720.21, p ≤ 0.00001). A standardized log-worth chart (defined as −log10 (p-value)), is typically useful to compare the relative magnitude of highly significant individual model effects (at very low p-values). The two main effects of Q and MC and their interactions were statistically significant (α = 0.05). In addition, the largest effect on the variability of the response (P drop) was airflow, followed by the moisture content and Q–MC interaction, in that order (Figure 6). In Figure 6, a prediction equation was developed including all parameter estimates of both the main and interaction effects. To determine whether the association between the P drop response and each model term was statistically significant, Student’s t-test was conducted to test the null hypothesis that this association did not exist (the term’s coefficient is equal to zero). All model coefficients were found to be highly significant, i.e., intercept (t Ratio = 7.32, p ≤ 0.00001), MC term (t Ratio = −15.88, p ≤ 0.00001), Q term (t Ratio = 44.03, p ≤ 0.00001), and its interaction term represented as (MC-0.25238) * (Q-0.155) with t-ratio = −5.99, p ≤ 0.00001. The coefficient of determination (R2) and the adjusted R2 both indicated that almost 95% of the variance in the P drop experienced by the SSDW could be explained by these terms in the prediction expression. All assumptions of normality (randomly distributed residual plot) and multicollinearity (reported variance inflation factor = 1 ± 0.001) were satisfied, implying that the model was adequate. The prediction expression was used to create resistance to airflow curves to validate the experimental data and interpolate/extrapolate data for other MC levels as shown in Figure 6.
A simpler approach to creating an empirical airflow resistance profile of the loosely filled SSDW bed is the adoption of the established Q vs. ΔP models of Shedd (Equation (1)) and of Hukill and Ives (Equation (2)). The Shedd and the Hukill and Ives constants were determined by fitting the airflow resistance data to each of the models as shown in Table 2 and Table 3. Both of these models were deemed acceptable with R2 greater than 0.99. However, the Hukill and Ives model yielded higher R2 values and lower root mean square error (RMSE, a measure of the difference between the predicted value and the observed value) for all MC levels tested. Therefore, the Hukill and Ives equation was considered to provide better quality in predicting the P drop for a loosely filled SSDW bed in all cases. The airflow resistance curves were developed for the SSDW at various MCs based on the Hukill and Ives model as shown in Figure 7. The full-factorial equation and the Hukill and Ives equation results exhibited good agreement based on predicted P drops. An average 3.96% predicted P drop variation was determined when both model results were compared to each other at MC levels of 10–30% and in an airflow range of 0.05–0.30 m3/m2-s. This variation increased to 7.76% at 40%MC.
4. Conclusions
Within the limits of the test parameters used in this investigation, the pressure drops of a loosely filled SSDW fixed bed were approximated at various moisture levels and in a moderate airflow range of 0.05–0.30 m3/m2-s using experimentally determined airflow resistance curves. The resistance to airflow of the SSDW was positively correlated with the airflow rates and inversely correlated with moisture levels. The non-linear interaction of the variables was significant in understanding the main effects of airflow and the moisture content. Simpler models such as that of Hukill and Ives were proven to be useful in predicting P drops with up to 7.8% average variation compared to a more complex full-factorial prediction model. Further investigation is needed to improve the accuracy of P drop predictions due to insufficient consideration of other operation variables (e.g., fill method and porosity) and surface characteristics (e.g., particle shape) beyond the scope of this study. As it stands, the use of empirical curves developed from this investigation offers a definite advantage in practicality and simplicity and can be used as a starting point in the design of ventilation systems for SSDW aeration and drying.
Author Contributions
Conceptualization, S.C.C. and C.I.M.; Methodology, C.I.M.; Formal analysis, E.J.N.B.; Resources, C.I.M.; Writing—original draft, E.J.N.B.; Writing—review & editing, S.C.C.; Visualization, E.J.N.B.; Supervision, S.C.C. and C.I.M. All authors have read and agreed to the published version of the manuscript.
Funding
This study was financially supported by the Frontier Bioenergy Systems, Austin, TX and the Bioenergy Testing and Analysis (BETA) Laboratory, TAMU, College Station, TX.
Data Availability Statement
The data that support the findings of this study are available from the corresponding author, [E.J.N.B.], upon reasonable request.
Conflicts of Interest
The authors declare no conflict of interest.
References
- US Environmental Protection Agency. Risk Assessment Evaluation for Concentrated Animal Feeding Operations; EPA/600/R-04/042; US Environmental Protection Agency: Washington, DC, USA, 2004.
- Graham, J.; Nachman, K. Managing wastes from confined animal feeding operations in the United States: The need for sanitary reform. J. Water Health 2010, 84, 646–670. [Google Scholar] [CrossRef] [PubMed]
- Chapin, A.; Rule, A.; Gibson, K.; Buckley, T.; Schwab, K. Airborne multi-drug resistant bacteria isolated from a concentrated swine feeding operation. Environ. Health Perspect. 2005, 113, 137–142. [Google Scholar] [CrossRef] [PubMed] [Green Version]
- Gerba, C.; Smith, J. Sources of pathogenic microorganisms and their fate during land. J. Environ. Qual. 2005, 34, 42–48. [Google Scholar] [PubMed]
- Alcaraz, J.; Baticados, E.; Capareda, S.; Maglinao, A.; Nam, H. Drying and Pellet Characterization of Sand-Separated Dairy Manure from Stephenville, Texas, USA. Appl. Ecol. Environ. Res. 2017, 16, 29–38. [Google Scholar] [CrossRef]
- Mukhtar, S. Dairy Biomas as a Renewable Fuel Source. Agrilife Extension, Texas A&M System.L-5494. 2008. Available online: https://core.ac.uk/reader/4275426 (accessed on 20 February 2023).
- Schiavone, D. Understanding Farm Energy. University of Maryland Extension. 2020. Available online: https://extension.umd.edu/resource/understanding-farm-energy-fs-1138 (accessed on 22 February 2023).
- Capareda, S.C. Introduction to Biomass Energy Conversions, 1st ed.; CRC Press: Boca Raton, FL, USA, 2013. [Google Scholar]
- Sapariya, D.; Patdiwala, U.; Panchal, H.; Ramana, P.; Makwana, J.; Sadasivuni, K. A review on thermochemical biomass gasification techniques for bioenergy production. Energy Sources Part A Recovery Util. Environ. Eff. 2021, 1–34. [Google Scholar] [CrossRef]
- El-Mesery, H.; El-khawaga, S. Evaluation of the drying performance and energy analysis of different dryers. Case Stud. Therm. Eng. 2005, 33, 101953. [Google Scholar] [CrossRef]
- Gornicki, K.; Kaleta, A. Resistance of bulk grain to airflow—A review. Part I: Equations for airflow resistance. Ann. Wars. Univ. Life Sci. —SGGW Agric. 2015, 65, 31–41. [Google Scholar] [CrossRef]
- ASAE D272.3; Resistance to Airflow of Grains, Seeds, Other Agricultural Products, and Perforated Metal Sheets. ASABE: St. Joseph, MI, USA, 1996.
- Ergun, S. Fluid flow through packed columns. Chem. Eng. Prog. 1952, 48, 89–94. [Google Scholar]
- Gunasekaran, S.; Jackson, C. Resistance to Airflow of Grain Sorghum. Trans. ASAE 1988, 31, 1237–1240. [Google Scholar] [CrossRef]
- Shedd, C. Resistance of grains and seeds to airflow. Agric. Eng. 1953, 34, 616–619. [Google Scholar]
- Al-yahya, S.; Moghazi, H. Static pressure drop through barley grain. Can. Agric. Eng. 1998, 40, 213–217. [Google Scholar]
- ASTM D3173-11; Standard Test Method for Moisture in the Analysis Sample of Coal and Coke. ASTM International: West Conshohocken, PA, USA, 2011. [CrossRef]
- Karaeva, J.; Timofeeva, S.; Kovalev, A.; Kovalev, D.; Gilfanov, M.; Grigoriev, V.; Litti, Y. Co-pyrolysis of agricultural waste and estimation of the applicability of pyrolysis in the integrated technology of biorenewable hydrogen production. Int. J. Hydrogen Energy 2022, 47, 11787–11798. [Google Scholar] [CrossRef]
- Nalladurai, K.; Alagusundaram, K.; Gayathri, P. Airflow Resistance of Paddy and its Byproducts. Biosyst. Eng. 2002, 83, 67–75. [Google Scholar] [CrossRef]
- Dairo, O.; Ajibola, O. Resistance to airflow of bulk sesame seeds. J. Agric. Engng Res. 1994, 58, 99–105. [Google Scholar] [CrossRef]
- Grama, S.; Bern, C.; Hurburgh, C., Jr. Airflow resistance of mixtures of shelled corn and fines. Trans. ASAE 1984, 27, 268–272. [Google Scholar] [CrossRef] [Green Version]
- Sokhansanj, S.; Falacinski, A.; Sosulski, F.; Jayas, D.; Tang, J. Resistance of bulk lentils to airflow. ASABE Trans. 1990, 33, 1281–1285. [Google Scholar] [CrossRef]
- Kenghe, R.; Nimkar, P.; Shirkole, S.; Shinde, K. Airflow resistance in soybean. Int. Agrophysics 2012, 26, 137–143. [Google Scholar] [CrossRef]
- Dairo, O.; Oyenusi, A.; Aderinlewo, A.; Adetunji, O.; Adeleke, E. Modeling the airflow resistance of bulk sponge gourd (Luffa Cylindrica) seeds. LAUTECH J. Eng. Technol. 2018, 12, 1–9. [Google Scholar]
- Aderinlewo, A.; Raji, A.; Olayanju, T. Effect of moisture content on some physical properties of cowpea (Vigna unguiculata). J. Nat. Sci. Eng. Technol. 2011, 10, 133–145. [Google Scholar]
Figure 1.
Particle size distribution of the SSDW (30.67% MC) determined using a 150 g randomized sample in six trials.
Figure 1.
Particle size distribution of the SSDW (30.67% MC) determined using a 150 g randomized sample in six trials.
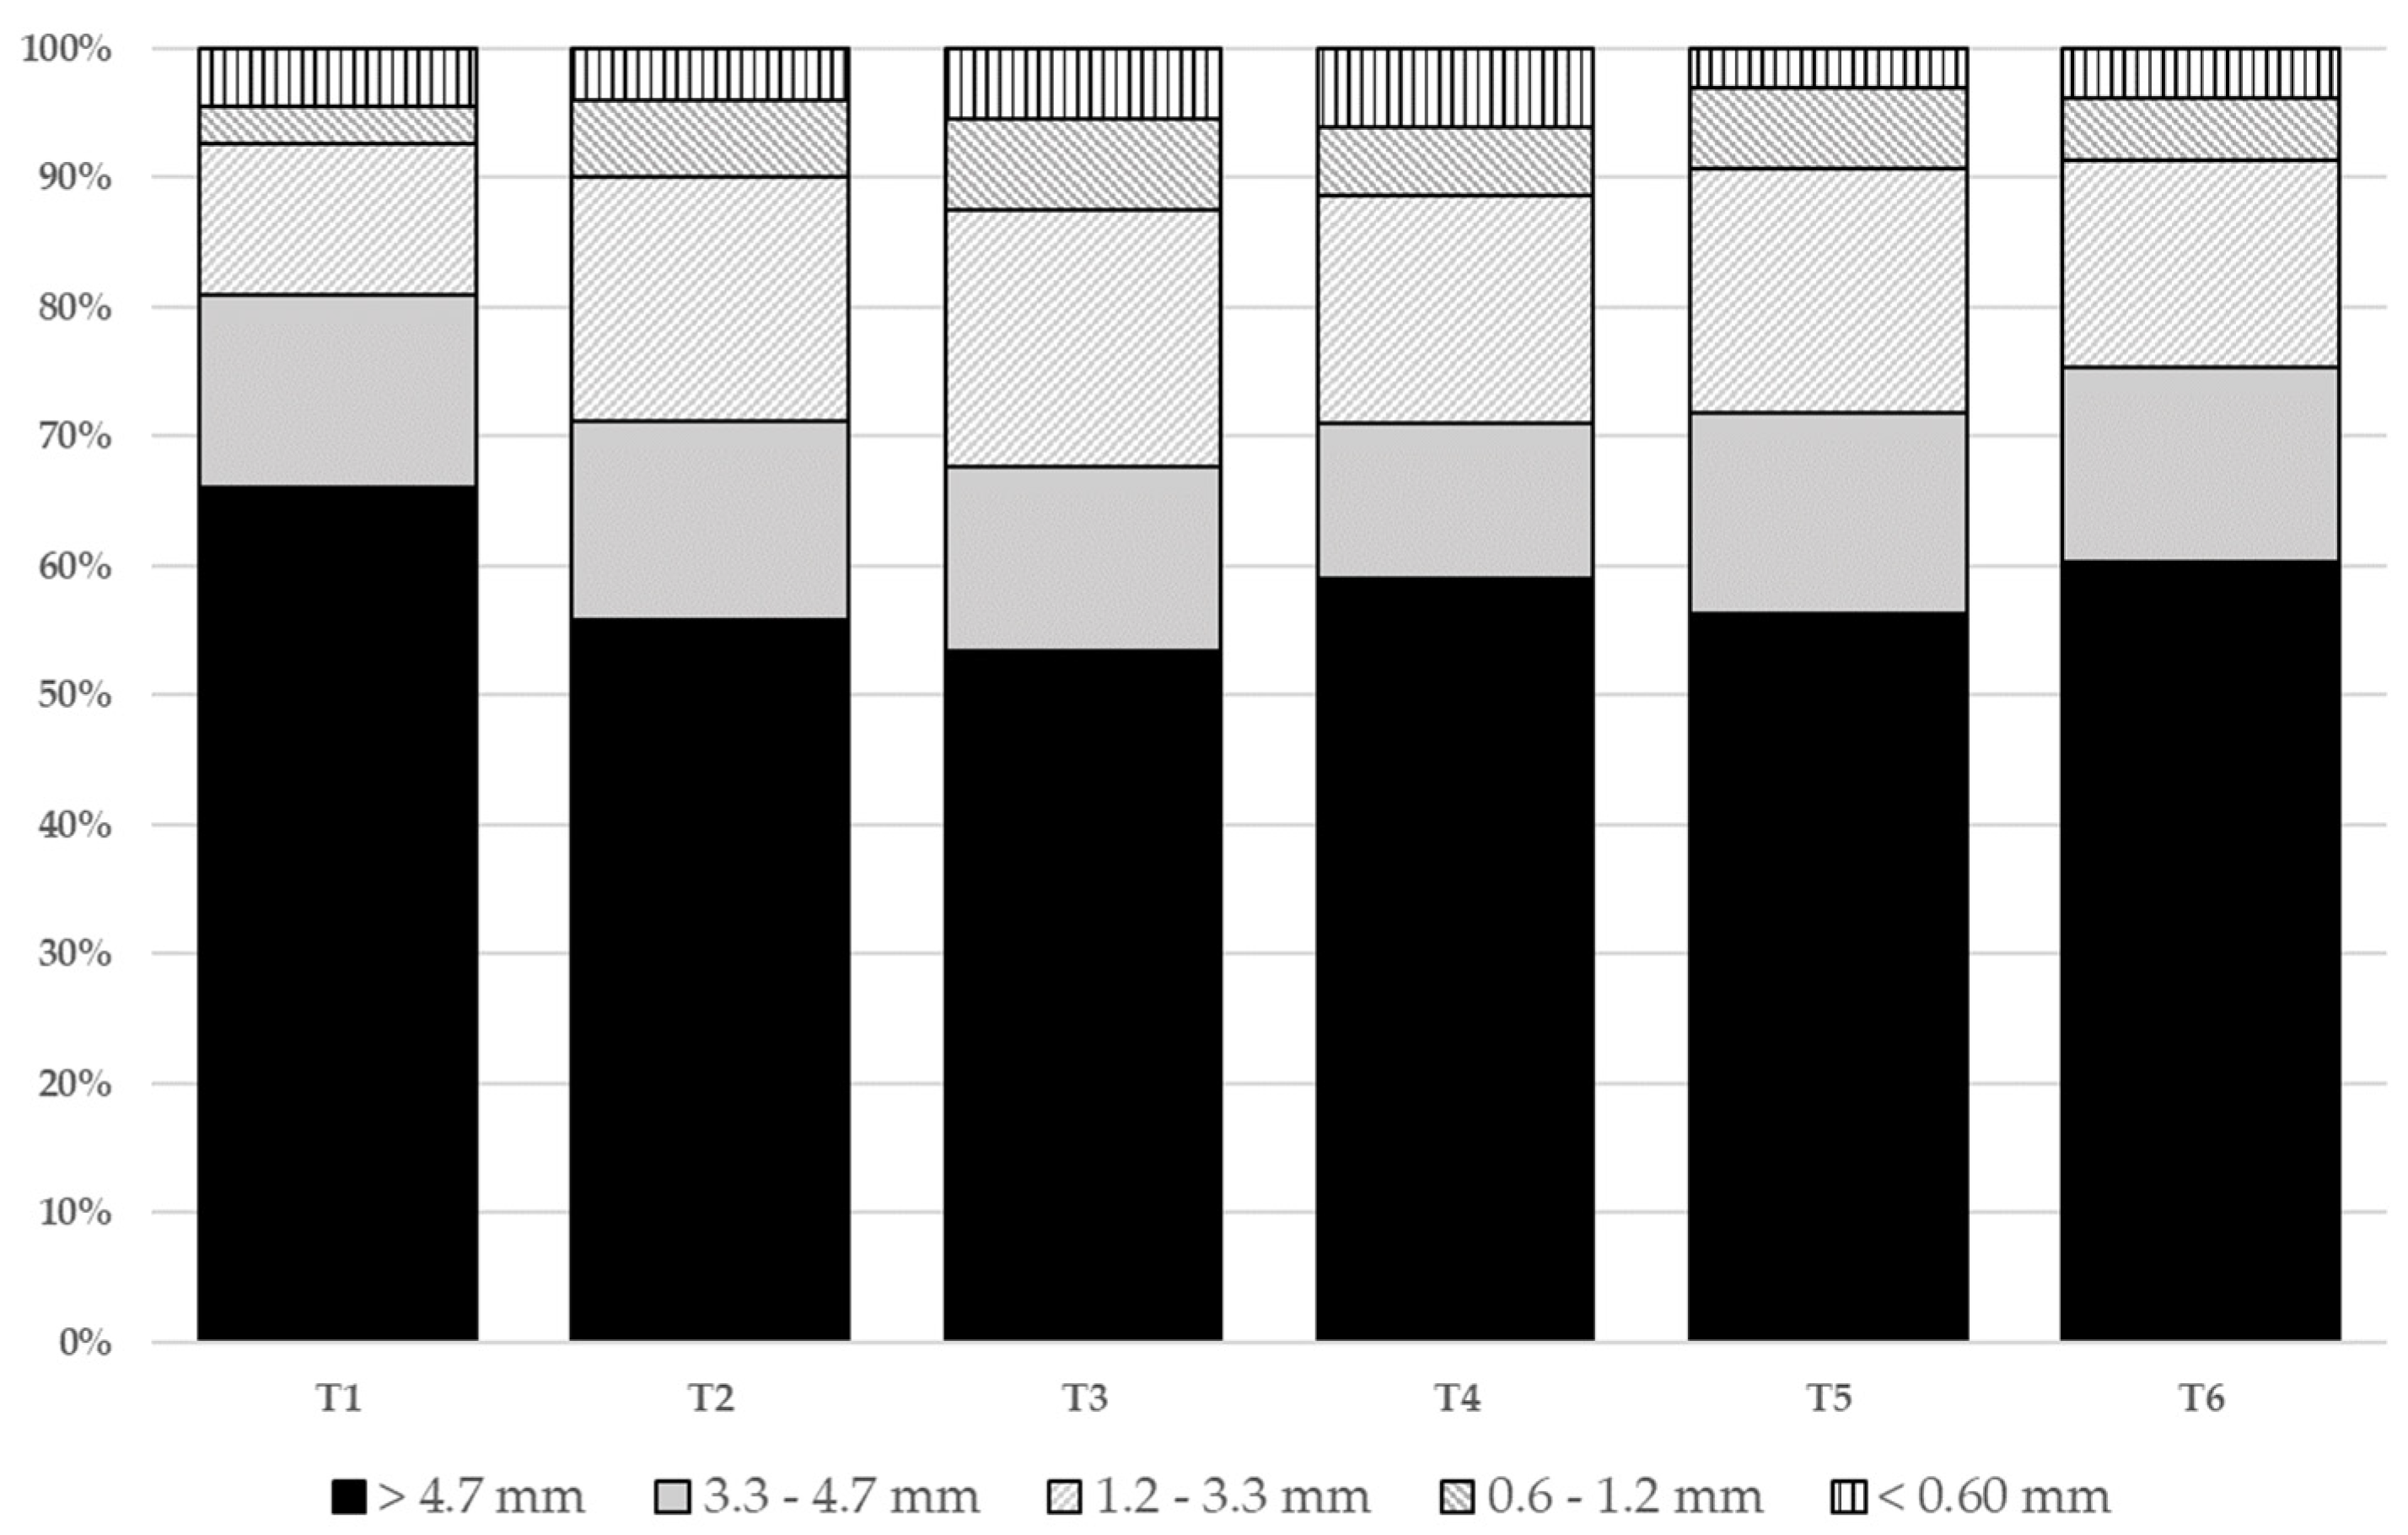
Figure 2.
Airflow resistance test set-up.

Figure 3.
Airflow vs. pressure drop for a 40% MC, loose-fill SSDW at various bed depths.

Figure 4.
Comparisons of the pressure drops across loose-fill SSDW at 30.67% MC with the pressure drops across selected seeds from the ASAE Standard D272.3.
Figure 4.
Comparisons of the pressure drops across loose-fill SSDW at 30.67% MC with the pressure drops across selected seeds from the ASAE Standard D272.3.

Figure 5.
Airflow resistance of the SSDW at 10%, 20%, 30%, and 40% moisture levels.
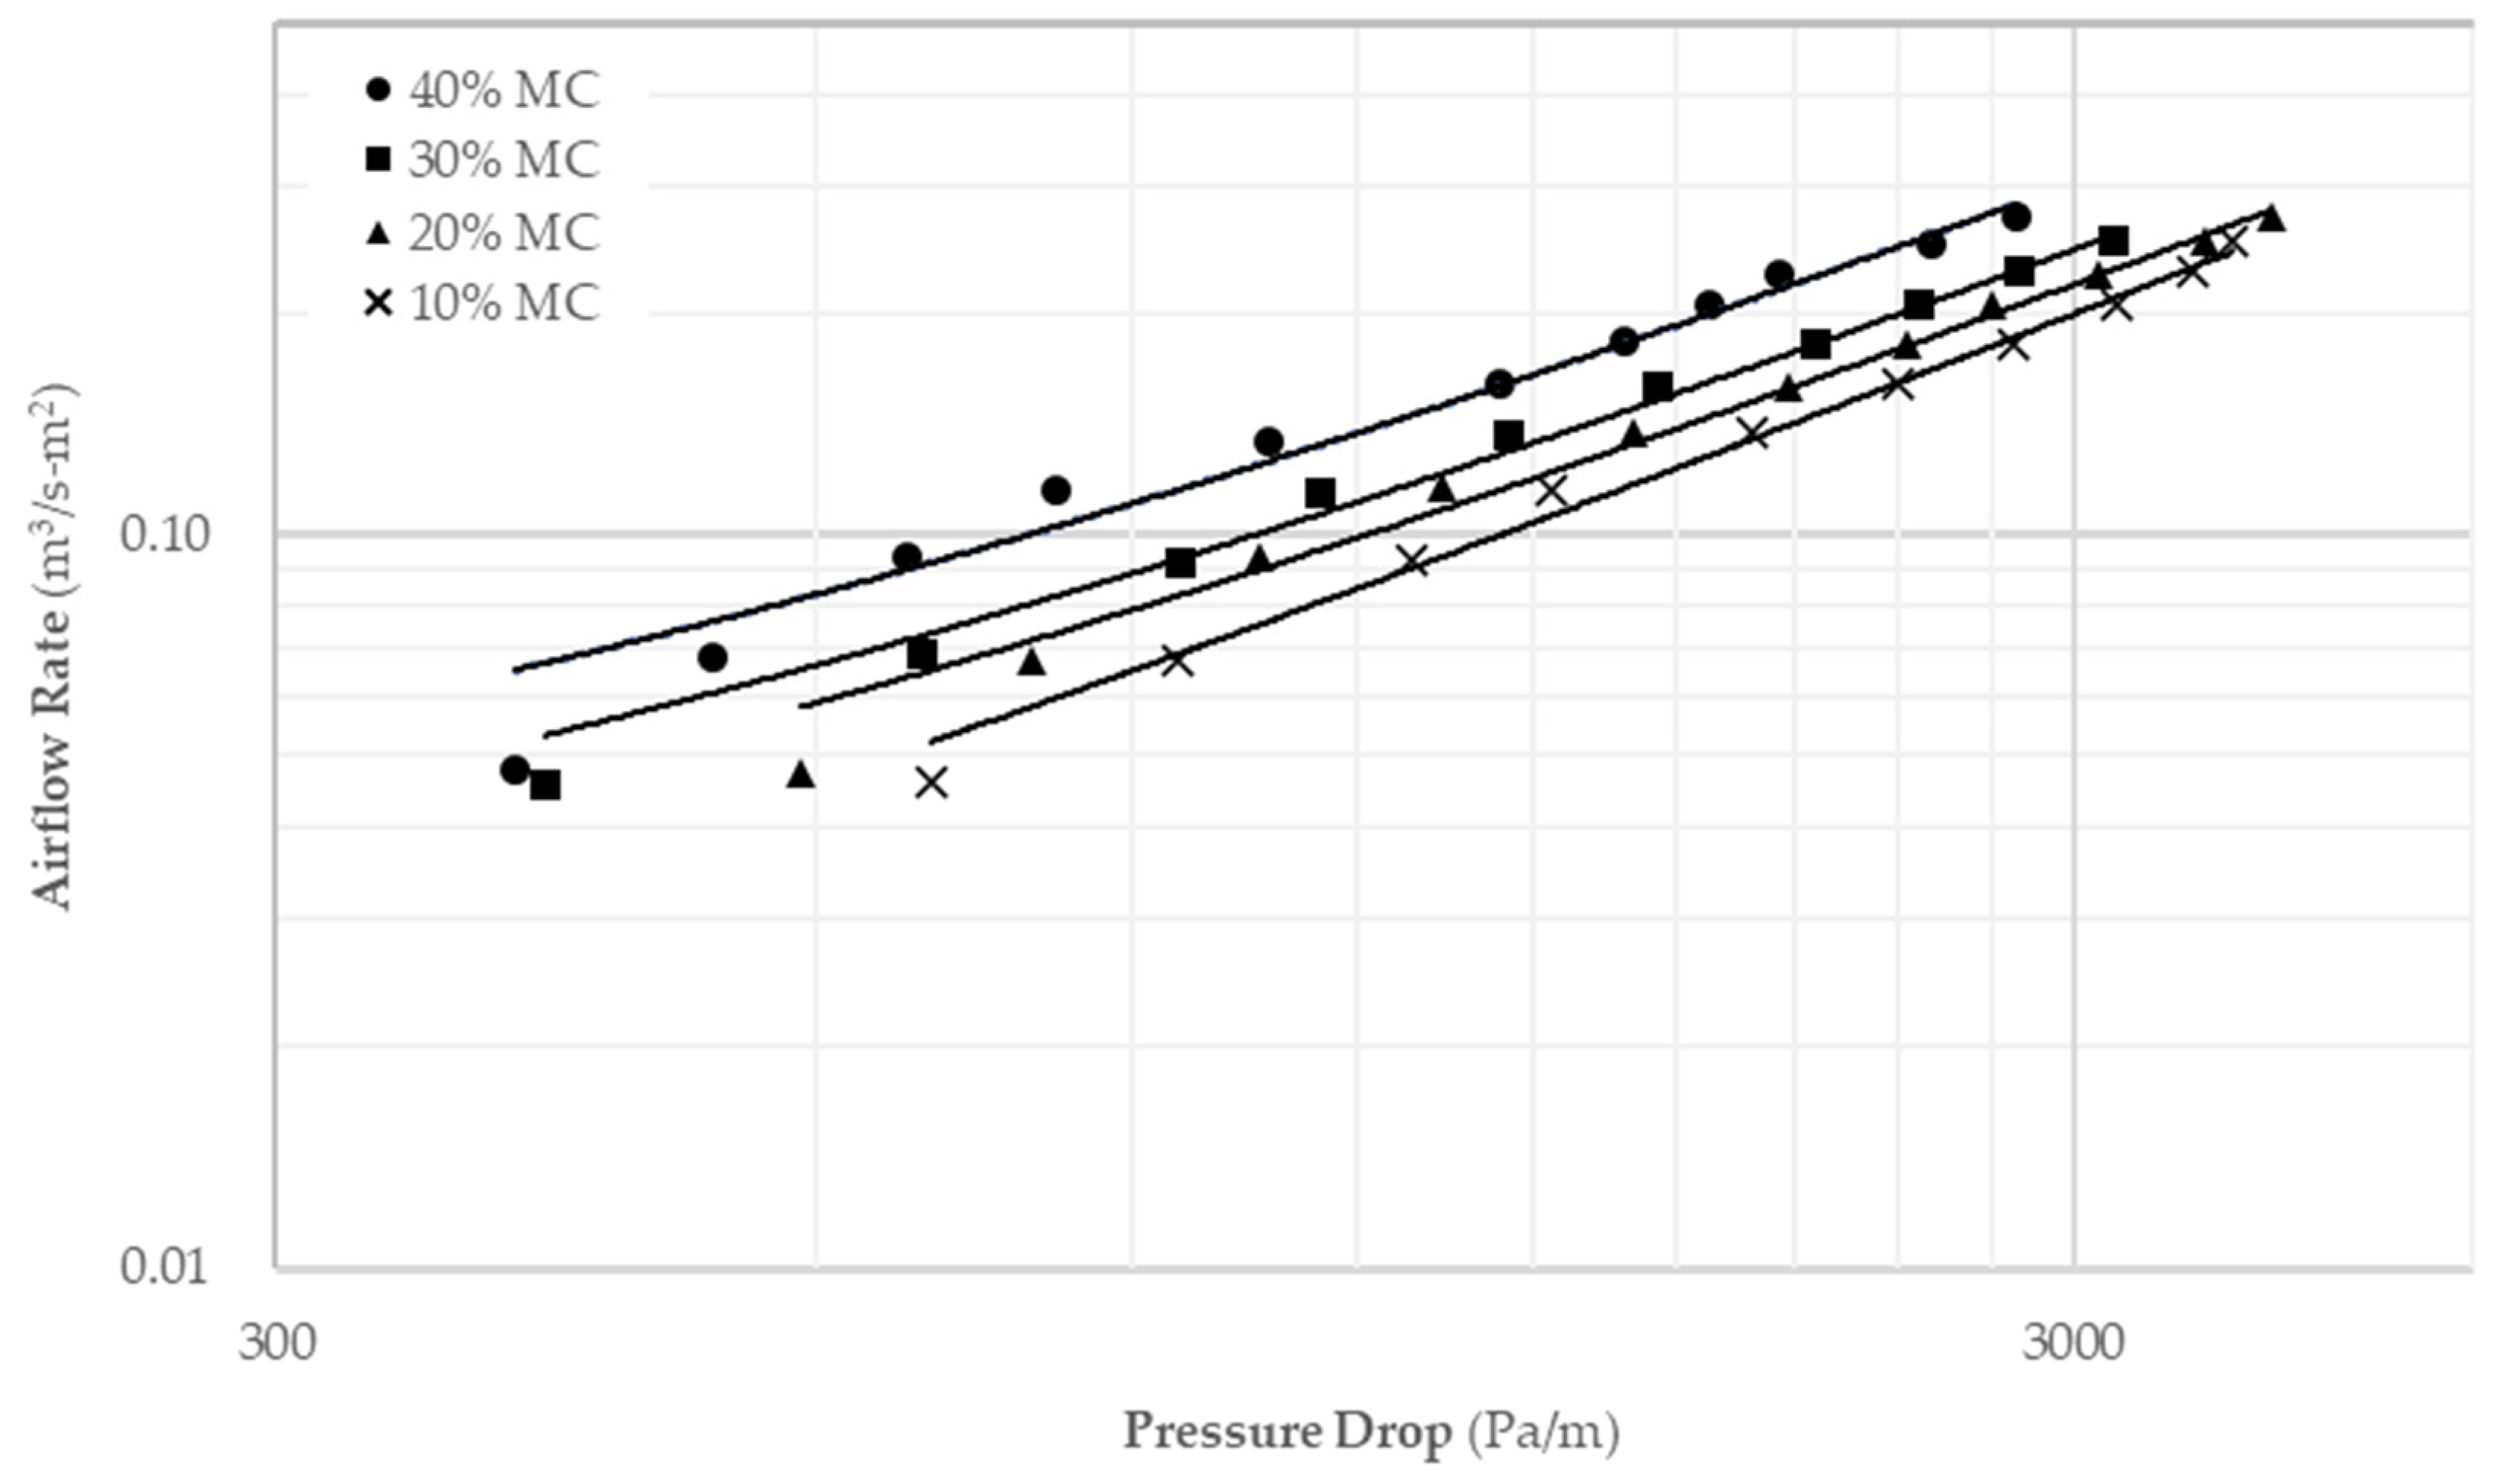
Figure 6.
Airflow resistance profile of the SSDW at various moisture contents using a full-factorial prediction model.
Figure 6.
Airflow resistance profile of the SSDW at various moisture contents using a full-factorial prediction model.
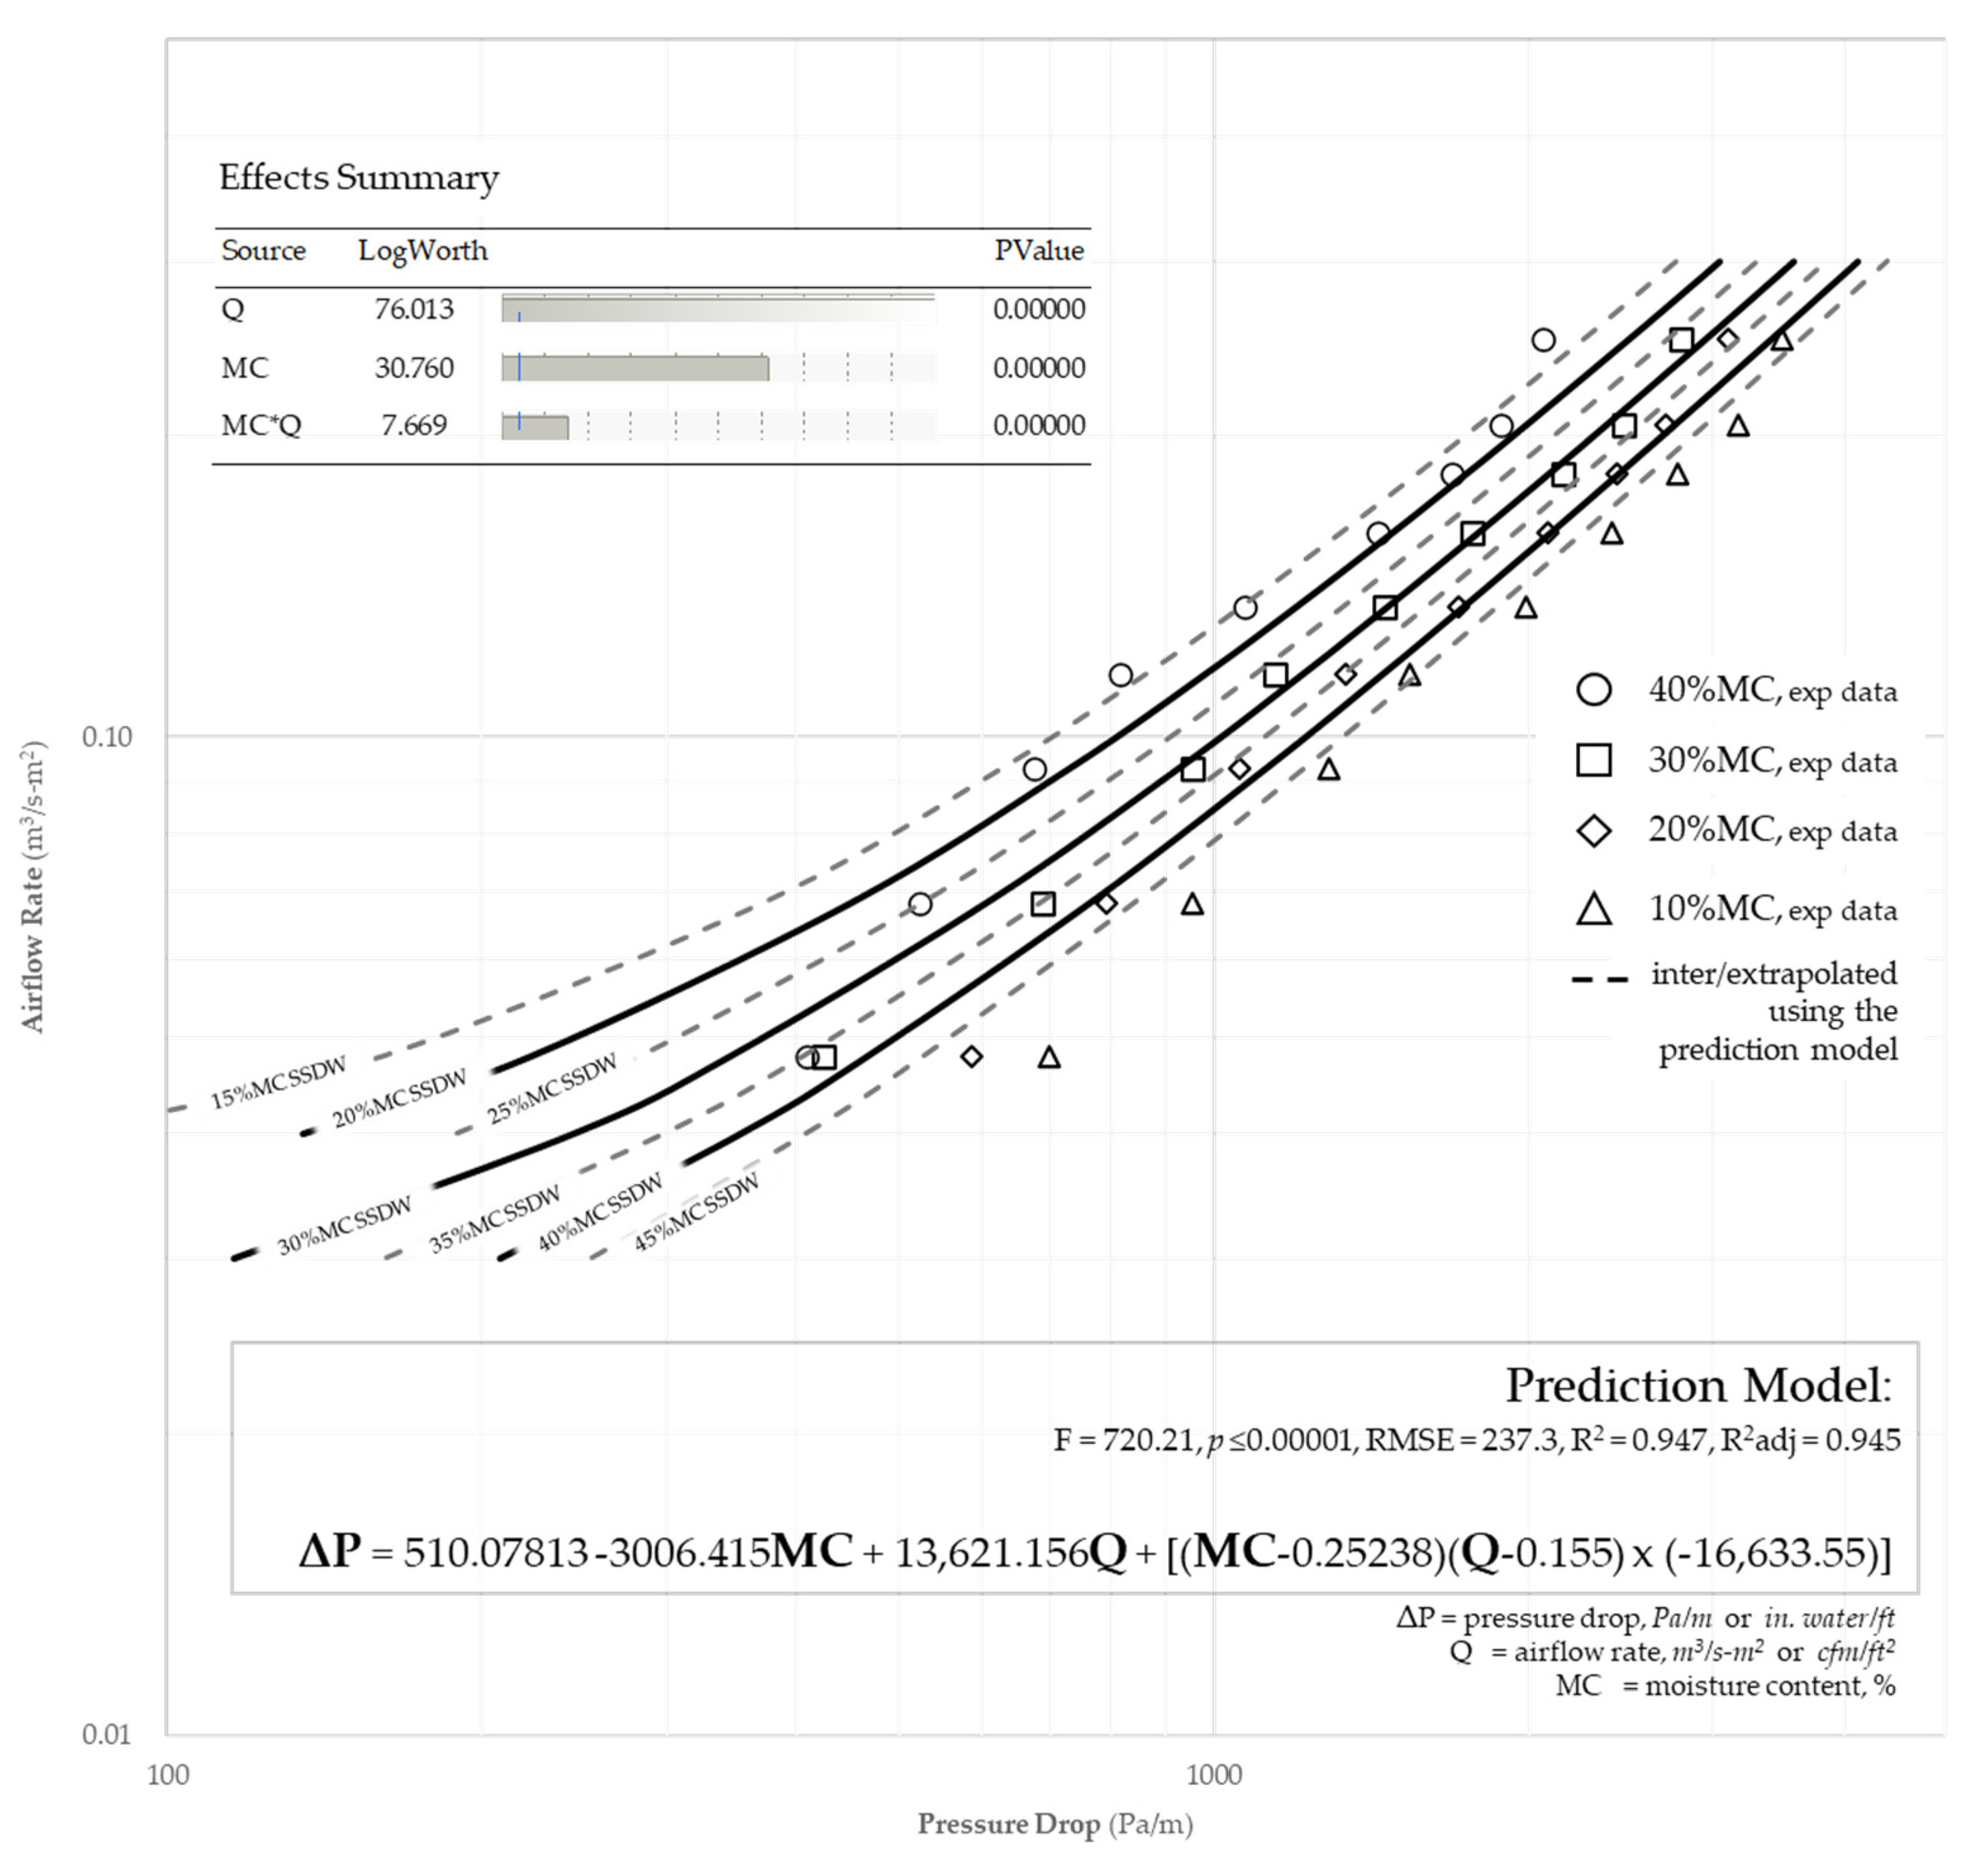
Figure 7.
Airflow resistance profile of the SSDW at various moisture contents based on the Hukill and Ives model.
Figure 7.
Airflow resistance profile of the SSDW at various moisture contents based on the Hukill and Ives model.

Table 1.
Actual moisture content and bulk density of the SSDW used in this study.
| MC Level | Actual MC (%) | Bulk Density, kg/m3 | Bulk Density, lb/ft3 |
|---|---|---|---|
| 10% | 9.60 ± 0.65 | 419.68 ± 29.95 | 26.20 ± 1.87 |
| 20% | 19.74 ± 1.17 | 381.71 ± 21.74 | 23.83 ± 1.18 |
| 30% | 30.99 ± 0.92 | 344.14 ± 23.18 | 21.48 ± 1.45 |
| 40% | 41.70 ± 1.55 | 296.40 ± 10.86 | 18.50 ± 0.068 |
Table 2.
Estimated parameters and comparison criteria of the Shedd model (Equation (1)) at various moisture contents.
Table 2.
Estimated parameters and comparison criteria of the Shedd model (Equation (1)) at various moisture contents.
| Moisture Content (% w.b.) | Shedd Parameters | R2 | RMSE | ||
|---|---|---|---|---|---|
| Nominal | Actual | a | b | ||
| 10% | 9.60 ± 0.65 | 0.0001044 | 0.945 | 0.997 | 95.555 |
| 20% | 19.74 ± 1.17 | 0.0002431 | 0.850 | 0.997 | 84.470 |
| 30% | 30.99 ± 0.92 | 0.0003538 | 0.815 | 0.997 | 67.752 |
| 40% | 41.70 ± 1.55 | 0.0005757 | 0.778 | 0.993 | 91.886 |
Table 3.
Estimated parameters and comparison criteria of the Hukill and Ives model (Equation (2)) at various moisture contents.
Table 3.
Estimated parameters and comparison criteria of the Hukill and Ives model (Equation (2)) at various moisture contents.
| Moisture Content (% w.b.) | Hukill and Ives Parameters | R2 | RMSE | ||
|---|---|---|---|---|---|
| Nominal | Actual | c | d | ||
| 10% | 9.60 ± 0.65 | 10,025.290 | 0.721 | 0.997 | 93.173 |
| 20% | 19.74 ± 1.17 | 31,252.654 | 2.997 | 0.997 | 80.447 |
| 30% | 30.99 ± 0.92 | 38,335.218 | 4.577 | 0.997 | 66.729 |
| 40% | 41.70 ± 1.55 | 37,280.474 | 6.313 | 0.998 | 85.955 |
Disclaimer/Publisher’s Note: The statements, opinions and data contained in all publications are solely those of the individual author(s) and contributor(s) and not of MDPI and/or the editor(s). MDPI and/or the editor(s) disclaim responsibility for any injury to people or property resulting from any ideas, methods, instructions or products referred to in the content. |
© 2023 by the authors. Licensee MDPI, Basel, Switzerland. This article is an open access article distributed under the terms and conditions of the Creative Commons Attribution (CC BY) license (https://creativecommons.org/licenses/by/4.0/).
Share and Cite
MDPI and ACS Style
Baticados, E.J.N.; Capareda, S.C.; Mitchell, C.I. Airflow Resistance of Solid-Separated Dairy Waste for Drying and Storage. Energies 2023, 16, 5038. https://doi.org/10.3390/en16135038
AMA Style
Baticados EJN, Capareda SC, Mitchell CI. Airflow Resistance of Solid-Separated Dairy Waste for Drying and Storage. Energies. 2023; 16(13):5038. https://doi.org/10.3390/en16135038
Chicago/Turabian StyleBaticados, El Jirie N., Sergio C. Capareda, and Cole I. Mitchell. 2023. "Airflow Resistance of Solid-Separated Dairy Waste for Drying and Storage" Energies 16, no. 13: 5038. https://doi.org/10.3390/en16135038
Note that from the first issue of 2016, this journal uses article numbers instead of page numbers. See further details here.