


Effect of Temperature on Morphologies and Microstructures of Soot Particles in the Diesel Exhaust Pipe
1
Hubei Key Laboratory of Advanced Technology for Automotive Components, Wuhan University of Technology, Wuhan 430070, China
2
Hubei Collaborative Innovation Center for Automotive Components Technology, Wuhan University of Technology, Wuhan 430070, China
*
Author to whom correspondence should be addressed.
Energies 2023, 16(14), 5488; https://doi.org/10.3390/en16145488
Submission received: 11 May 2023
/
Revised: 6 July 2023
/
Accepted: 14 July 2023
/
Published: 20 July 2023
(This article belongs to the Special Issue Low-Emission Combustion Techniques: Latest Advances and Prospects)
Abstract
:Insulating cotton was used to change the airflow temperature in the exhaust pipe of a diesel engine, and soot particles at different positions in the exhaust pipe under different operating conditions were collected. The morphologies and microstructures of soot particles were observed by high-resolution transmission electron microscopy (HRTEM). The characteristic parameters, including the mean primary particle diameter (dp), radius of gyration of soot aggregate (Rg), fractal dimension of soot particle (Df), carbon layer spacing (Ds), and carbon layer torsion resistance (Tf), were statistically analyzed. The changes in each characteristic parameter before and after adding insulating cotton were compared. After installing the cotton, soot particles still grew through surface chemical reactions and physical processes in the diesel exhaust pipe, the agglomeration becomes more and more prevalent, the particle size increased, and Df increased. The increase in the airflow temperature in the exhaust pipe promoted the surface growth of primary soot particles and enhanced the turbulence, which made the chain-like soot particles more likely to reunite under the action of turbulent eddies. Consequently, Rg decreased and Df increased. Furthermore, the average Ds and Tf of primary soot particles deceased, especially under high loads. This indicated that the increase in the temperature of the exhaust pipe was conducive to the graphitization of primary soot particles.
1. Introduction
The soot particles emitted by diesel engines not only produce haze [1], but they also can enter the human body through the respiratory system and cause harm [1]. Traditional particle measurement devices, such as electronic low-pressure impactors (ELPIs) [2,3], scanning mobility particle sizers (SMPSs) [4,5], and differential mobility spectrometers (e.g., DMS500) [6,7], can be used to measure the number concentration and size distribution of soot particles in diesel exhaust. For better understanding the complex formation and oxidation mechanisms of soot particles, morphological properties and nanostructure of particles have become research hotpots.
The structure of soot particles is very complex, as they are fractal-like agglomerates of tens to hundreds of primary particles 10–50 nm in diameter [8,9,10]. Soot particles have a variety of different shapes, such as: spheroidal, ellipsoidal, linear, and branched [11]. A primary soot particle usually consists of the disordered inner core and the outer shell of orderly fringes [12,13]. The morphological properties and microstructure of soot particles sampled by thermophoresis can be observed by transmission electron microscopy (TEM) and high-resolution transmission electron microscopy (HRTEM) [12,13,14]. The diameter of primary soot particles, the diameter of soot particles, fractal dimension, etc., can be measured directly from the TEM and HRTEM images using an image analysis algorithm [15]. Besides TEM and HRTEM, atomic force microscopy (AFM) [16,17] and helium ion microscopy (HIM) [18] are also used for nanoscale study of soot particles and suggest that freshly formed soot particles exhibit liquid-like features and contain structural inhomogeneity [19].
The generation of soot is a very complicated process, including not only the very complex gas phase reaction, but also the transition process from gas phase to liquid phase and then to solid phase, and the subsequent growth, agglomeration, and oxidation of soot particles [8,20]. The transition from gas phase molecules (polycyclic aromatic hydrocarbons, PAHs) to a condensed phase, represents the nucleation process of soot particles in flames [21]. Soot particles’ nuclei have two types of structures: cross-linked structures [22] and fullerene-like structures [23]. The freshly formed nucleation of soot particles exhibit liquid-like structures [18,24]. These particles undergo coagulation, agglomeration and surface growth leading to particle size and mass increase, that is, immature primary particles were carbonized into the larger soot aggregates with the more matured structure [25]. At present, soot particles are mainly sampled from laminar diffusion flame [14,26], constant volume combustion chamber (CVCC) [27,28], and engine cylinder [29,30], etc.
Soot particles sampled from either the engine cylinder [31] or the engine exhaust pipe [29,30] are almost all formed from mature primary particles. Fractal dimensions can be used to evaluate the morphology of highly complex soot particles in fractal analysis. The larger fractal dimension implied that soot particles aggregates were more likely spherical in shape, and the smaller fractal dimension implied a chain-like stretched shape of particles [32]. From the comparison of different soot particle samples, the size of primary particles directly sampled in diesel spray flame was relatively smaller than that of primary particles sampled from the exhaust gas stream [33]. Factors such as engine operating conditions [34,35], in-cylinder injection strategies [36,37,38], fuel properties [39,40], and in-cylinder temperature [41,42] have a very important impact on the formation of mature soot particles. Temperature is one of the direct factors affecting the formation of soot particles. Temperature has two possible effects on crystallite size of soot particles: on the one hand, graphitization increases crystallite size; on the other hand, oxidation reduces crystallite size. Although the temperature in the engine cylinder is very high, the former effect is dominant. Therefore, the crystallite size in the engine-out soot was increased compared to the soot originally produced in the spray flame [30]. Sanghoon kook et al. [23] directly sampled the soot particles from the diesel engine cylinder. The results showed that the primary particle size and radius of gyration were slightly smaller than those of the samples from the exhaust pipe.
In conclusion, the size, fractal dimension, and mean primary particles diameter of soot particles sampled from the engine exhaust pipe were bigger than those from the cylinder. It has been shown that physical growth process, such as collision and coagulation, is one of important factors that affects the sizes and morphologies of soot particles [43]. Therefore, in the process from the end of the diesel engine combustion to the discharge of soot particles into the air, soot particles must undergo physical growth processes, such as collision, coagulation, deposition, and break-up, which are affected by the flow parameters of the exhaust gas, such as the flow velocity and temperature. The residence time and furnace temperature have a great influence on the mean primary particle diameter and the aggregate shapes [44]. With a high furnace temperature and short residence time, the mean primary particle diameter decreased and the aggregated shapes were complexed. Otherwise, the result was opposite. In the diesel engine, the particle size and exhaust gas temperature increased with the increase in the diesel engine load [45]. In summary, temperature has an important effect on the morphologies and microstructures of diesel soot particles.
In this paper, the airflow temperature of the exhaust pipe was changed by wrapping it with insulating cotton. Soot particles at different positions of the diesel exhaust pipe were sampled before and after the installation of the cotton. The morphologies and microstructures of soot particles were observed by HRTEM. The various property parameters of soot particles in the TEM images were statistically analyzed, and the mean primary particle diameter (dp), radius of gyration of soot aggregate (Rg), fractal dimension of soot particle (Df), carbon layer spacing (Ds), and carbon layer torsion resistance (Tf) were calculated. The effects of temperature on the final morphologies, microstructures, and sizes of the diesel soot particles were analyzed based on these parameters.
2. Experimental Description
2.1. Engine and Sampling Devices
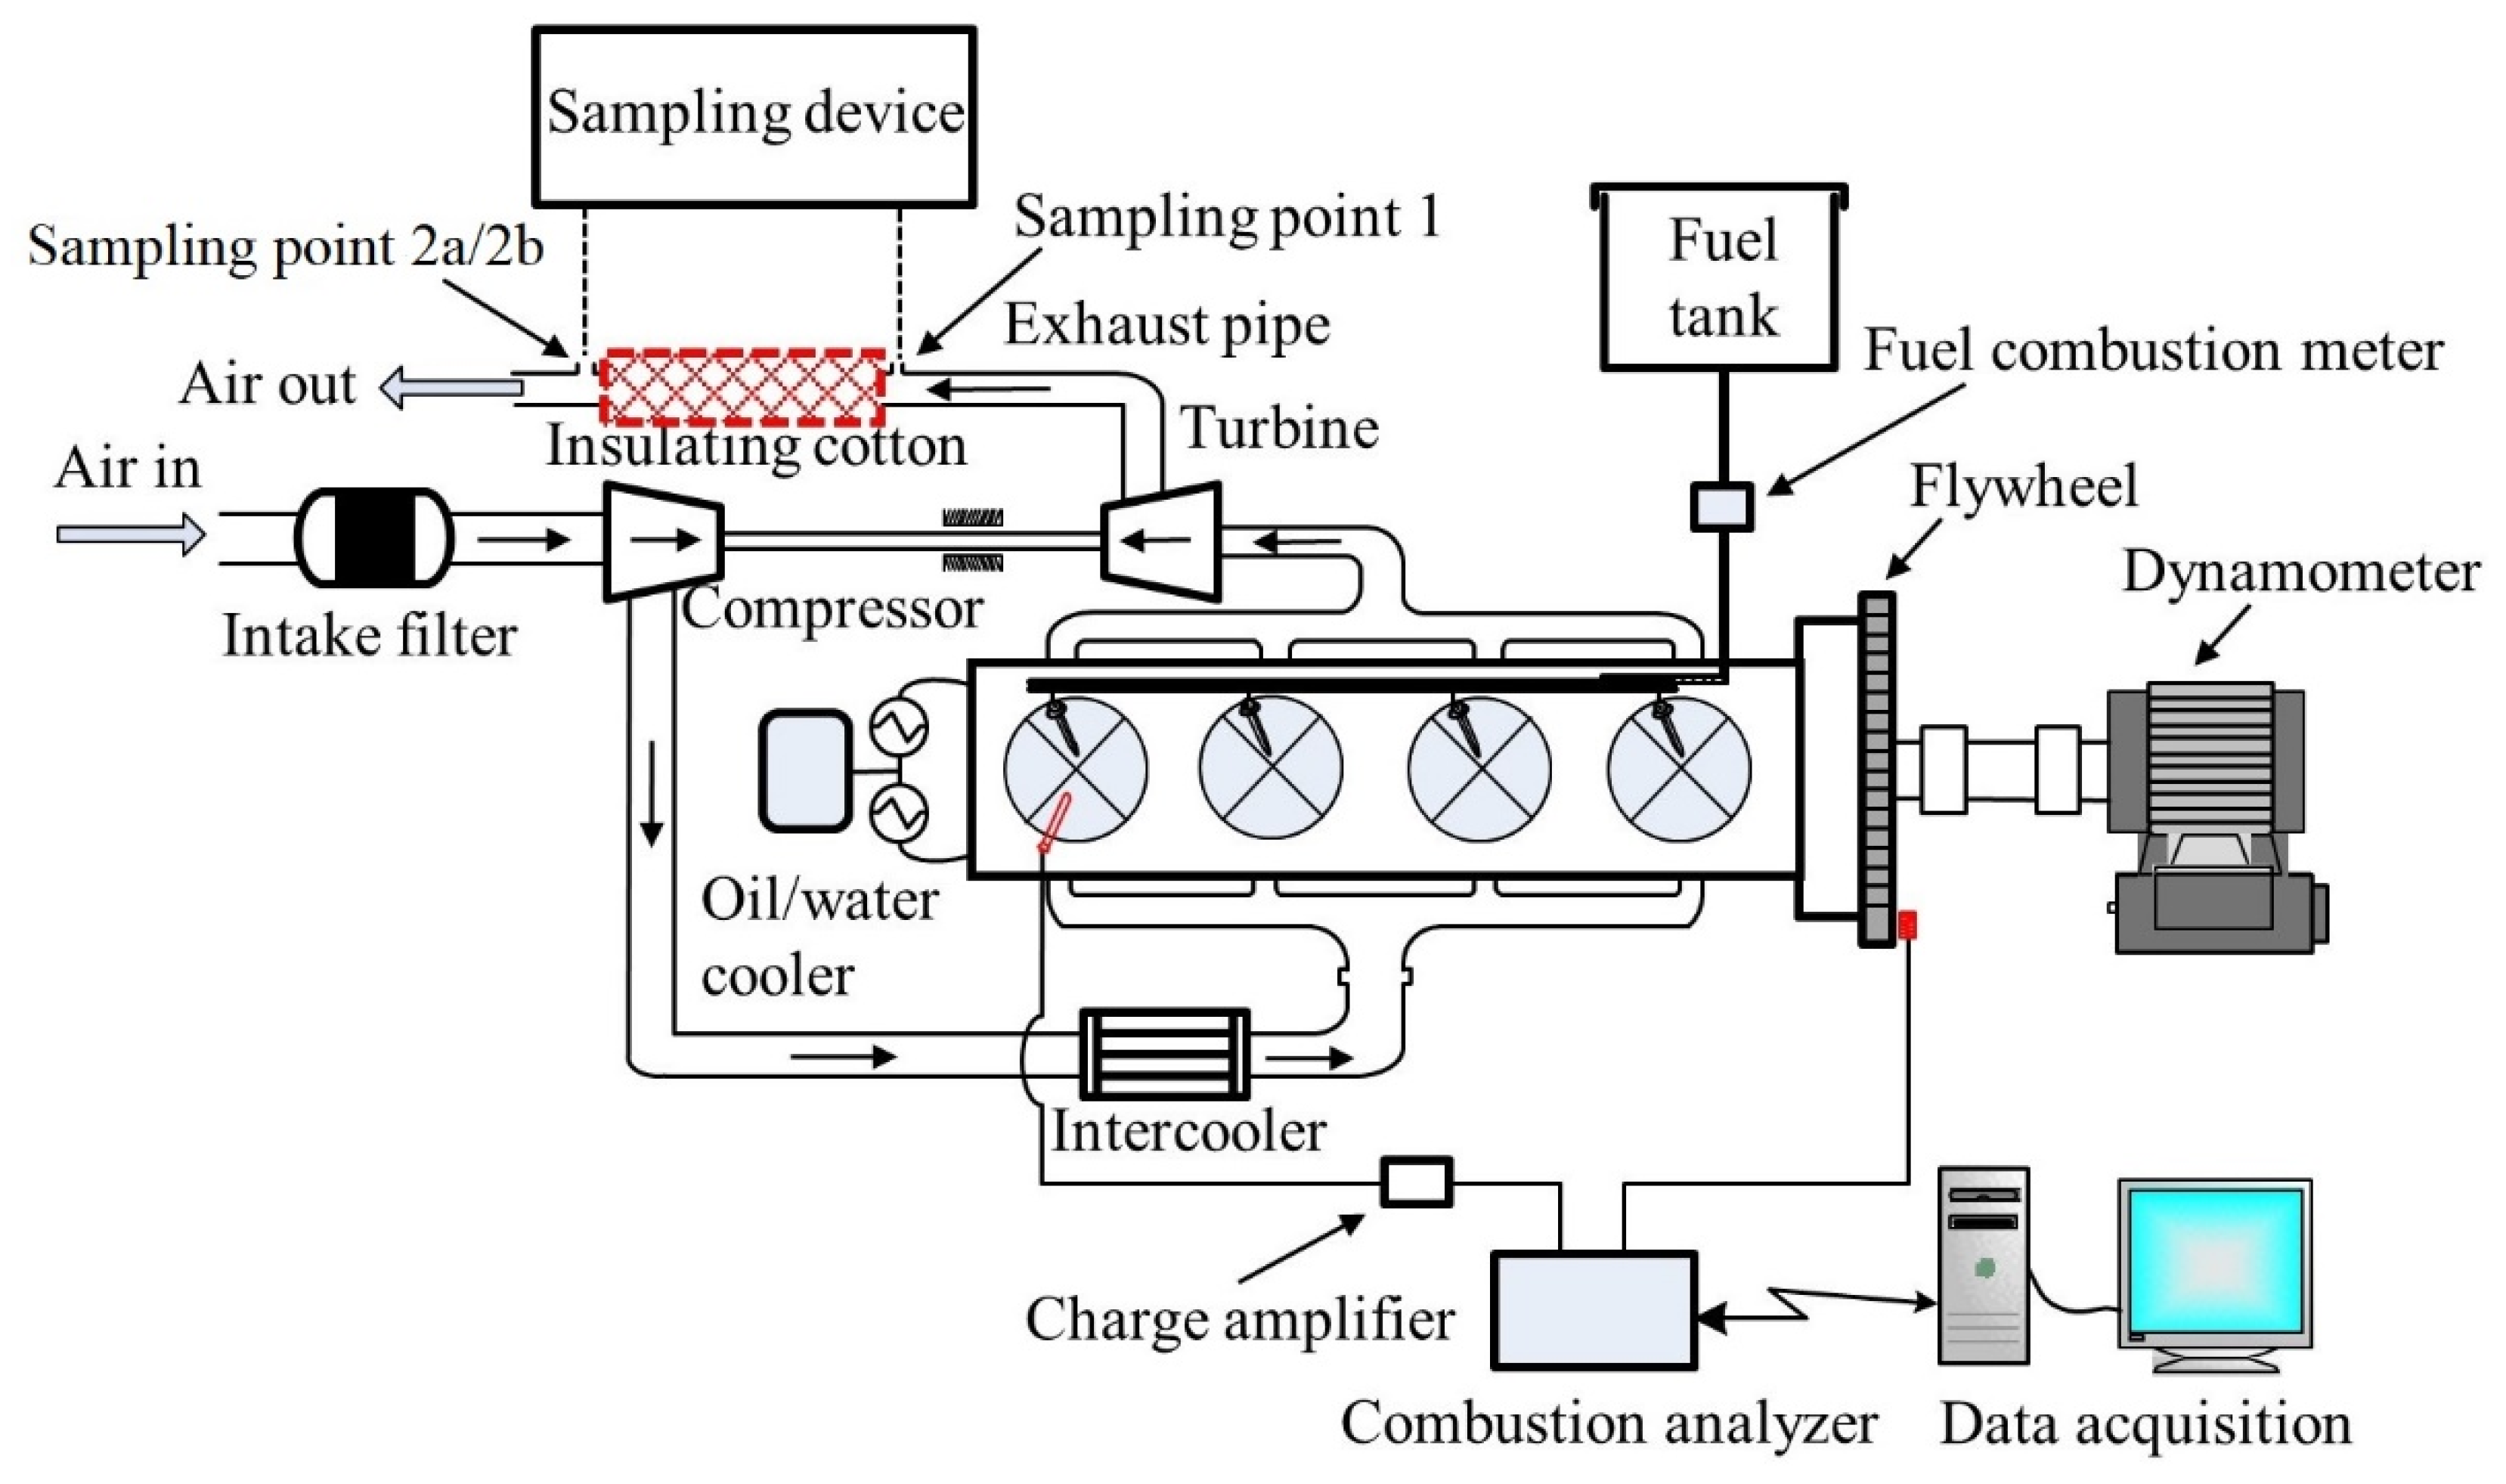
The experimental platform consisted of a diesel engine bench and a soot particle sampling device. The diesel engine bench (Figure 1) consisted of a diesel engine, engine control unit (ECU), dynamometer, and combustion analyzer. The diesel engine was a four-cylinder, four-stroke, water-cooled, direct-injection compression ignition (DICI) engine coupled with a common rail fuel injection system. The primary specifications of the diesel engine are given in Table 1. Two holes with a diameter of 12 mm and a spacing of 4 m were drilled on the exhaust pipe to collect soot particles. The hole closest to the engine and 4 m downstream were named sampling points 1 and 2, respectively. The exhaust pipe between the two sampling points was wrapped with a layer of insulating cotton to change the airflow temperature. The highest heat resisting temperature of the insulating cotton is 1260 °C. Thus, the influence of the airflow temperature in the exhaust pipe on the morphologies and microstructures of soot particles could be examined, as shown in Figure 1. For convenience, sampling point 2 before and after wrapping with insulating cotton is referred to as sampling point 2a and sampling point 2b, respectively.
The sampling device consisted of four parts: the controller, spindle axis, clamp (self-closing tweezers), and positioning base, as shown in Figure 2. Before experiment, the position of the sampling device should be fixed to ensure that no offset will occur due to the vibration of the diesel engine bench in the experiment. The travel destination of the piston rod in the spindle axis and the stay time at the travel destination were determined to ensure that samples could be taken at the center of the exhaust pipe under each condition and the sampling time was consistent. A super-thin carbon film with a thickness of less than 5 nm was used to collect soot particles. The carbon film was easily damaged by airflow shock and uneven heating at high temperatures. Therefore, during sampling, the carbon film was not placed in a strong airflow or at high temperatures for a long time. The sampling times of 50 ms, 100 ms, 500 ms, 1 s, 5 s, 10 s, 15 s, 20 s, 25 s, and 30 s were determined. The carbon film was parallel to the flow direction of exhaust gas. Three carbon films were sampled at each sampling time. It was found that when the sampling time was less than 10 s, there were almost no soot particles on the carbon film. When the sampling time exceeds 30 s, the carbon film is easy to break, especially at high loads. So, it was determined that the sampling time in the experiment should not exceed 30 s.
2.2. Experimental Scheme and Method
The morphologies and microstructures of soot particles under different brake mean effective pressures (BMEPs = 0.38, 0.63, 0.88, and 1.13 MPa) were studied at a diesel engine speed of 1800 rpm. First, soot particles were sampled at sampling points 1 and 2a (with no insulating cotton present), and then the engine was stopped. After the diesel engine was cooled completely, insulating cotton was wrapped on exhaust pipe between sampling point 1 and 2a. Then the diesel engine was started, so as to sample soot particles at sampling point 2b (with insulating cotton present). When the BMEP was changed, the samples must be taken after the temperature was stable in the exhaust pipe. The sampling temperatures of different sampling points were recorded at different BMEPs, as summarized in Table 2.
A JEM-2100F HRTEM was used to observe the morphologies and microstructure of soot particles. The point resolution was 0.23 nm, the lattice resolution was 0.102 nm, and the magnification was 50–11,000k×. The time interval between soot particle sampling and the TEM observations should be controlled within 24 h to retain the original shapes of the soot particles.
Katsufumi et al. [46] found that the change in the observed area of the sampling support membrane would lead to differences in the data results. To reduce the error, four observation areas with uniformly distributed soot particles were selected on the carbon film, and 40 soot particles were selected to statistically analyze the parameters in each observation area; these soot particles included more than 10 primary soot particles. Limiting the observation area could reduce the error caused by changes of the observation position on the soot distribution, so that the obtained data could more objectively reflect the actual soot particles under various operating conditions. In addition, based on the research results of Katsufumi et al. [46], the statistical measurements of the soot particle parameters were obtained by the same experienced operator to reduce human error. In the TEM images, the statistical method used to determine the diameter of primary soot particles (d) was the “cross method” [47]. That is, a large number of primary soot particles and aggregate particles were selected with clear contours in the TEM images, the lengths in two directions of these primary soot particles were drawn and measured. In addition, the maximum projection length (L) and the projected area (Aa) of soot particles were calculated [30], as shown in Figure 3. The above data were statistically analyzed in Image-Pro Plus 6.0 software.
3. Morphologies of Soot Particles
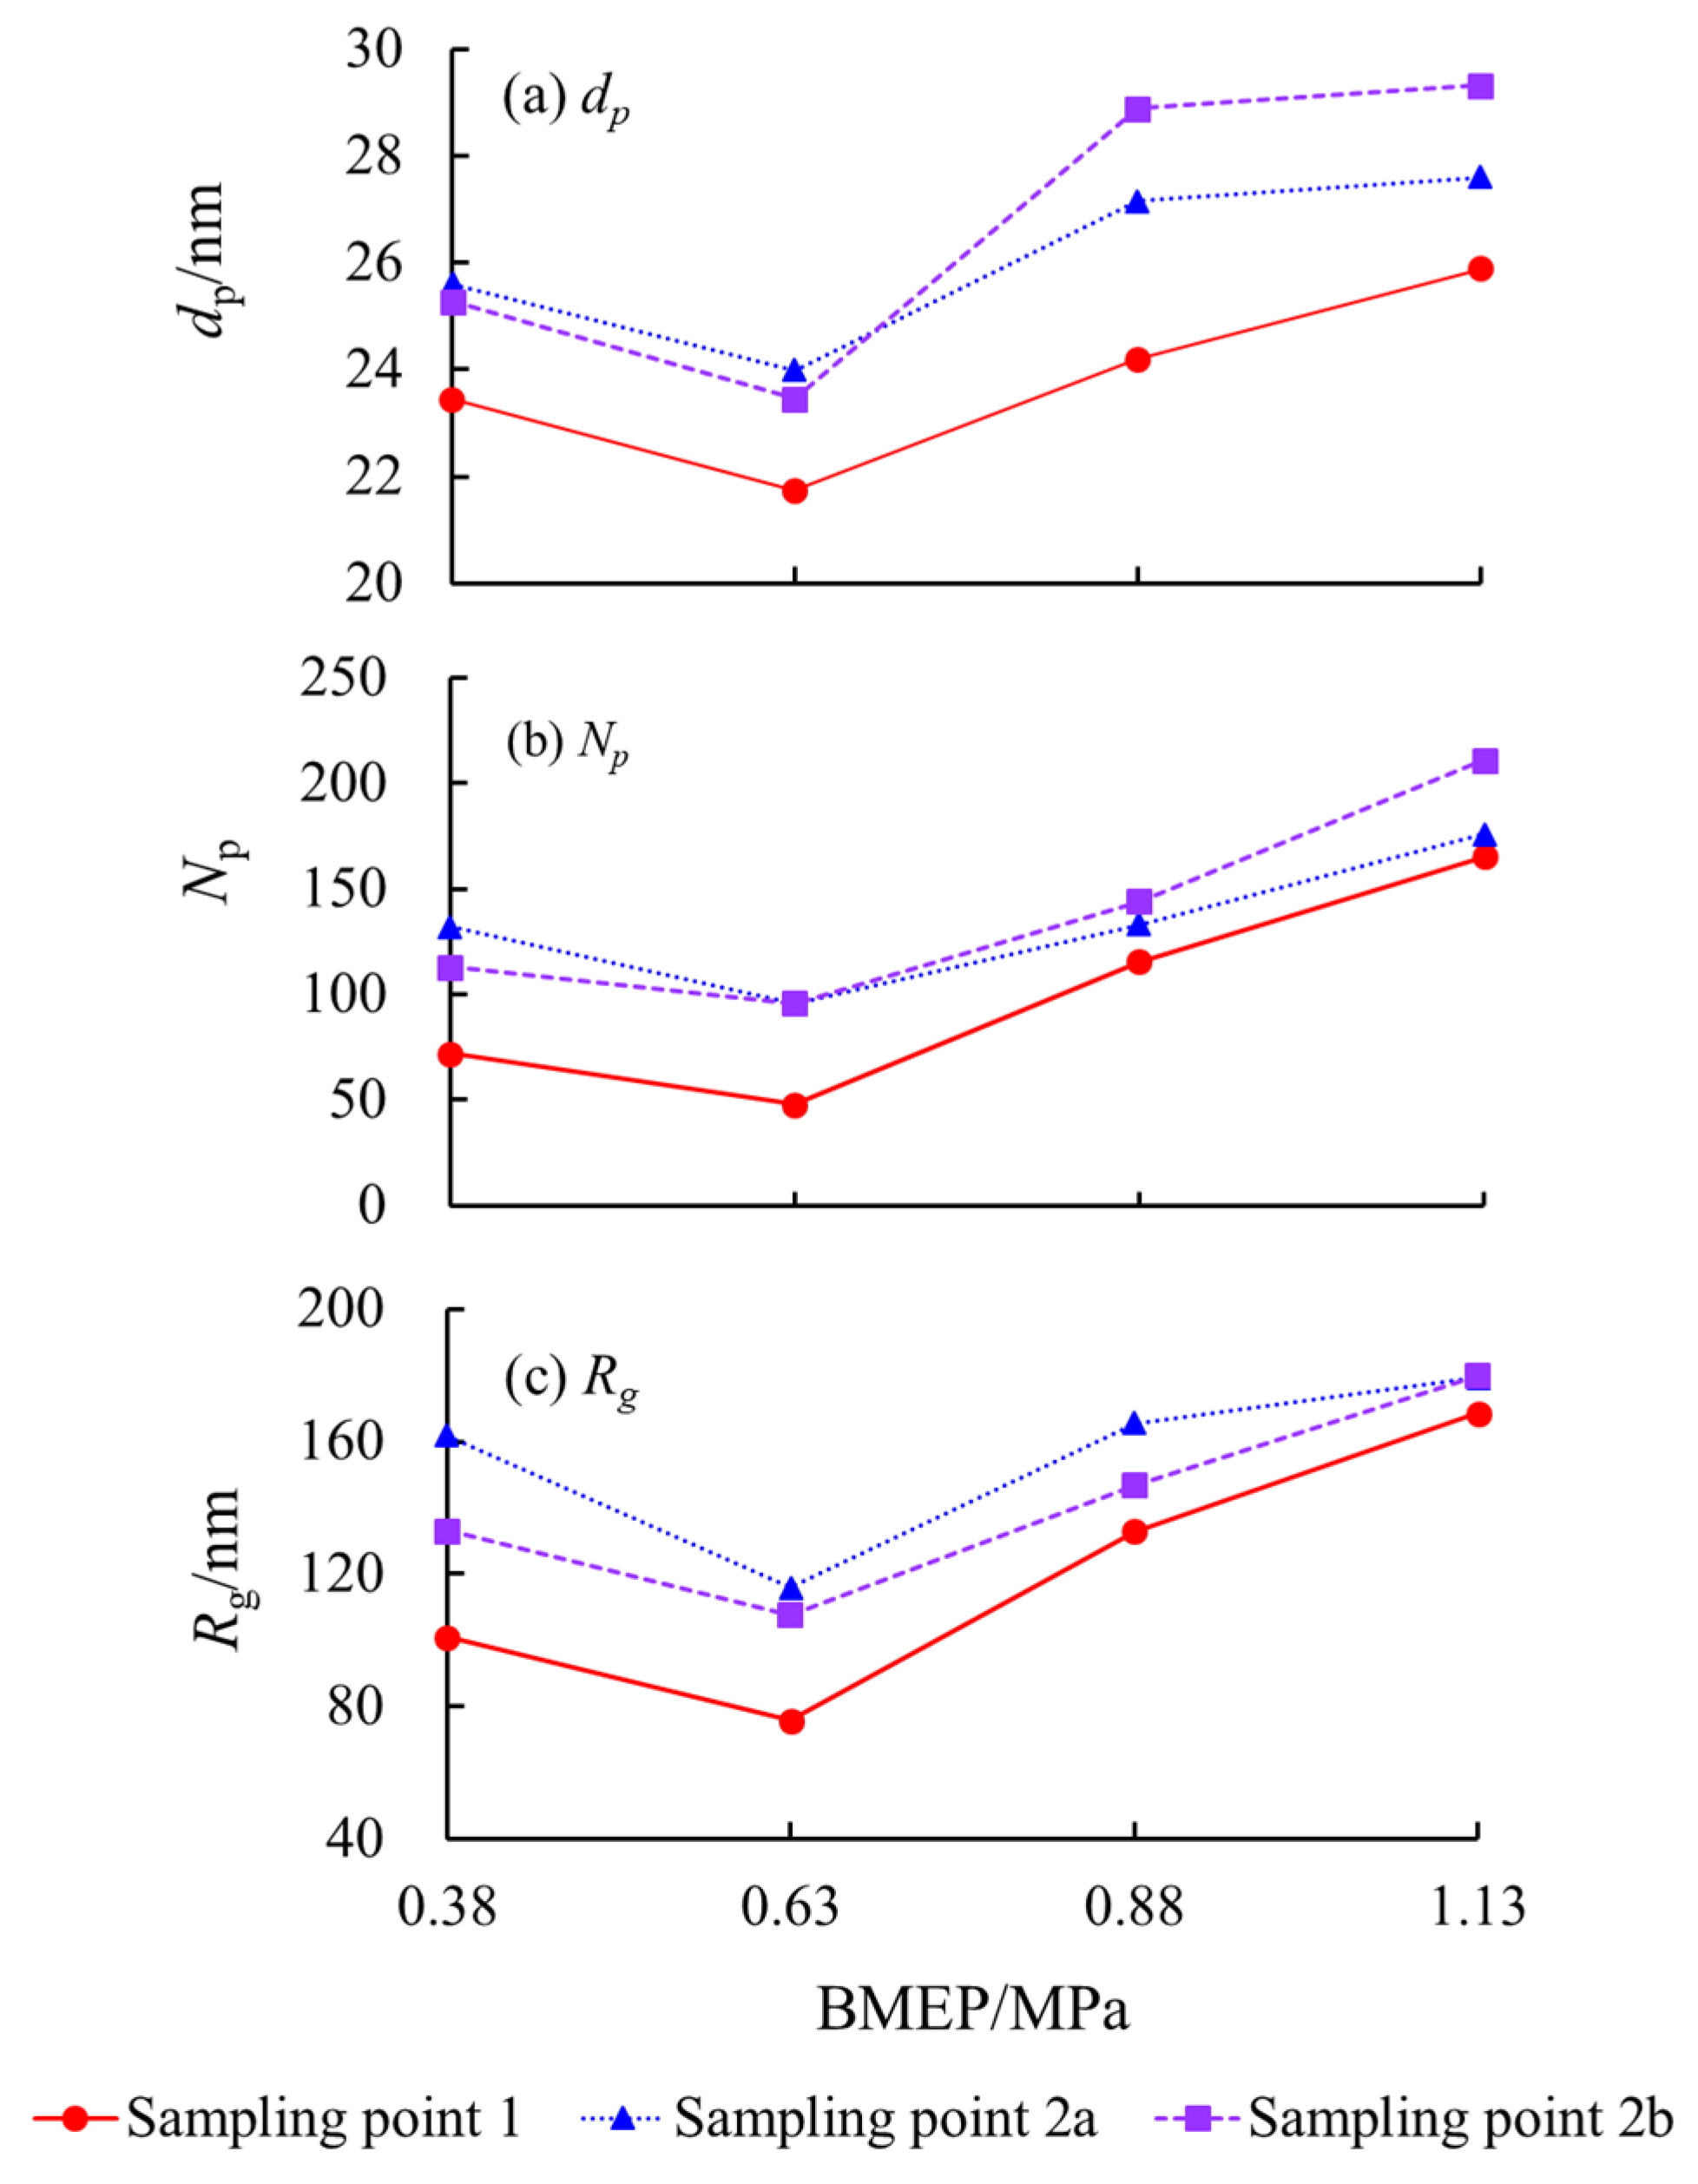
Figure 4 shows the size distributions of primary soot particles for different loads. Percentage is the ratio of primary soot particle number of each size range and statistics total number of primary soot particles. The size range of d was 5–55 nm, and the size distribution of primary soot particles was unimodal, as shown in Figure 4. As BMEP increased, d at sampling point 2 increased regardless of whether the insulating cotton was present or not. Under medium- and low-load conditions (BMEPs = 0.38 and 0.63 Mpa), the size distributions of primary soot particles did not significantly differ at sampling points 2a and 2b. However, under high-load conditions (BMEPs = 0.88 and 1.13 Mpa), the proportion of primary soot particles with particle sizes in the range of 25–40 nm increased significantly at sampling point 2b, and the peaks shifted to the right. This was because the insulating cotton caused the temperature drop rate of the exhaust pipe to be small under the four BMEPs. The temperature at sampling point 2b was about 20–22% higher than that at sampling point 2a. The temperatures of sampling point 1 were larger under high-load conditions, so the temperature differences between sampling points 2a and 2b were larger, as shown in Table 2. The temperature of the airflow in the exhaust pipe increased, which accelerated the chemical reactions on the soot particle surface. The chemical reactions taking place on the soot particle surface mainly include oxidation reactions with O2, OH, etc., and surface growth reactions with polycyclic aromatic hydrocarbons (PAHS). Due to the lack of oxygen in the exhaust pipe, the surface growth rate of primary soot particles was greater than the oxidation rate, so the proportion of large-sized primary soot particles increased, and dp increased, as shown in Figure 5a.
Figure 5 shows the variations of dp, Np, and Rg with the loads. With the increase in the BMEPs, the dp, Np, and Rg curves formed “V” shapes, and the values were the smallest when the BMEP was 0.63 MPa. This was because the diesel and air were evenly mixed in the cylinder and the pressure and temperature were appropriate. Consequently, the fuel was fully burned, and the amount of generated soot particle precursors was reduced. The decrease in the amount of soot particle precursors inhibited the growth of primary soot particles and the subsequent soot particle dynamic evolution process.
As shown in Figure 5, the dp, Np, and Rg at sampling points 2a and 2b were all greater than those at sampling point 1, regardless of whether the insulating cotton was present or not. This indicated that soot particles were still growing through dynamic events in the exhaust pipe, such as collision, coagulation, and deposition.
When the BMEPs were 0.38 and 0.63 MPa, dp and Np at sampling point 2b were basically consistent with those at sampling point 2a. However, when the BMEPs were 0.88 and 1.13 MPa, dp and Np at sampling point 2b were both larger than those at sampling point 2a. However, Rg at sampling point 2b under each load condition was less than that at sampling point 2a. This was because the insulating cotton was wrapped on the exhaust pipe to increase the temperature of the airflow at the same load, which increased the surface growth of soot particles. Meanwhile, oxygen content in the exhaust pipe is not high, which is not conducive to the oxidation of soot particles. The dynamic viscosity of soot particles increased with the increase of airflow temperature. According to the Reynolds number formula, the Reynolds number at sampling point 2b was bigger than that at sampling point 2a, which enhanced the turbulence kinetic energy. Turbulent eddies caused the chain-like soot particles to exhibit tortuosity more easily. Meanwhile, the turbulence accelerated soot particles and increased the probability of collision and coagulation of the particles, thereby decreasing Rg.
Figure 6 shows the TEM image of a soot particle at sampling points 1, 2a, and 2b magnified 50,000 times. Compared with sampling point 1, the accumulation of soot particles at sampling points 2a and 2b is more serious, and the sizes of soot particles were also relatively larger. However, the difference on soot particle size between the sampling points 2a and 2b was small. To further compare the effects of temperature on the morphologies of soot particles, the measurement method proposed by Brasil et al. [10,11] was used to calculate the fractal dimensions of soot particles.
Figure 7 shows the change in the soot particle fractal dimension with the loads. The fractal dimension of soot particles at sampling point 1 increased as the loads increased. This was because the amount of injection fuel, temperature, and pressure in the cylinder of the diesel engine increased with the increase in the load, and more soot particle precursors were generated. Under high pressures and high temperatures, the precursors grew into a large number of primary soot particles, which undergo dynamic events, such as collision, coagulation, breaking, and deposition, to form larger, denser soot particles.
As can be seen from Figure 7 and Figure 5b, Df and Np of soot particles at sampling points 2a and 2b were always greater than those at sampling point 1, regardless of whether insulating cotton was installed or not. This indicated that soot particles of different sizes in the exhaust pipe still underwent chemical reactions and dynamic events to further accelerate the growth of soot particles.
The fractal dimensions of soot particles at sampling point 2b were always larger than those at sampling point 2a. Because the insulating cotton increased the temperature of the exhaust pipe between sampling points 1 and 2, the dynamic viscosity of the exhaust in the exhaust pipe increased, and the Reynolds number decreased. According to the k-ε equation, the turbulent kinetic energy and turbulence dissipation rate also increased. Therefore, under the action of turbulent eddies, chain-like and branched particles were more likely to deform and develop agglomerated particles. However, the smaller the Stokes number of the particles was, the stronger the ability of the particles to follow the fluid became [48]. According to the Stokes number formula, since the temperature at sampling point 2b was higher than that at sampling point 2a, the Stokes number of the particles decreased, the ability of the particles to follow the airflow was enhanced, and the frequency of particle collision and coagulation increased. Therefore, soot particles at sampling point 2b were more closely aggregated, and the fractal dimension was higher.
Across all loads of 1800 r/min, the dp of primary soot particles is measured in the range of 21.73 to 25.89 nm, the Rg is measured in the range of 75.72 to 168.60 nm, and the Df is measured in the range of 1.59–1.91 at sampling point 1. The dp and Rg decrease first and then decrease with the loads, and the Df increase. This is inconsistent with the variation of soot particle parameters with loads reported in reference [45]. The possible reason is that exhaust gas was introduced into a sampling chamber by opening a shutter valve connected to the exhaust manifold [45]. The physical growth process of soot particles was blocked by a dilution system to study the morphology of soot particles just leaving the cylinder. However, sampling point 1 was set at a distance of 2 m from the exhaust valve, and the soot particles experienced physical growth processes such as collision, condensation, and surface growth in the exhaust pipe in this paper.
In summary, the dp of primary soot particles increases, the number of large-sized soot particles increases, the number of small-sized soot particles decreases, the Df of soot particles is bigger, and the aggregation enhances at sampling point 2b. The particle size of soot particles produced by combustion in the diesel engine cylinder is between several nanometers and hundreds of nanometers [1]. However, the particle size of soot particles sampled in the exhaust pipe is between tens of nanometers and tens of microns [2]. By changing the temperature of the exhaust pipe, the dynamic evolution process of soot particles is strengthened, so that the agglomeration is enhanced, the particle diameter is increased, and it is easier for particles to be captured by the diesel particulate filter (DPF).
4. Microstructures of Soot Particles
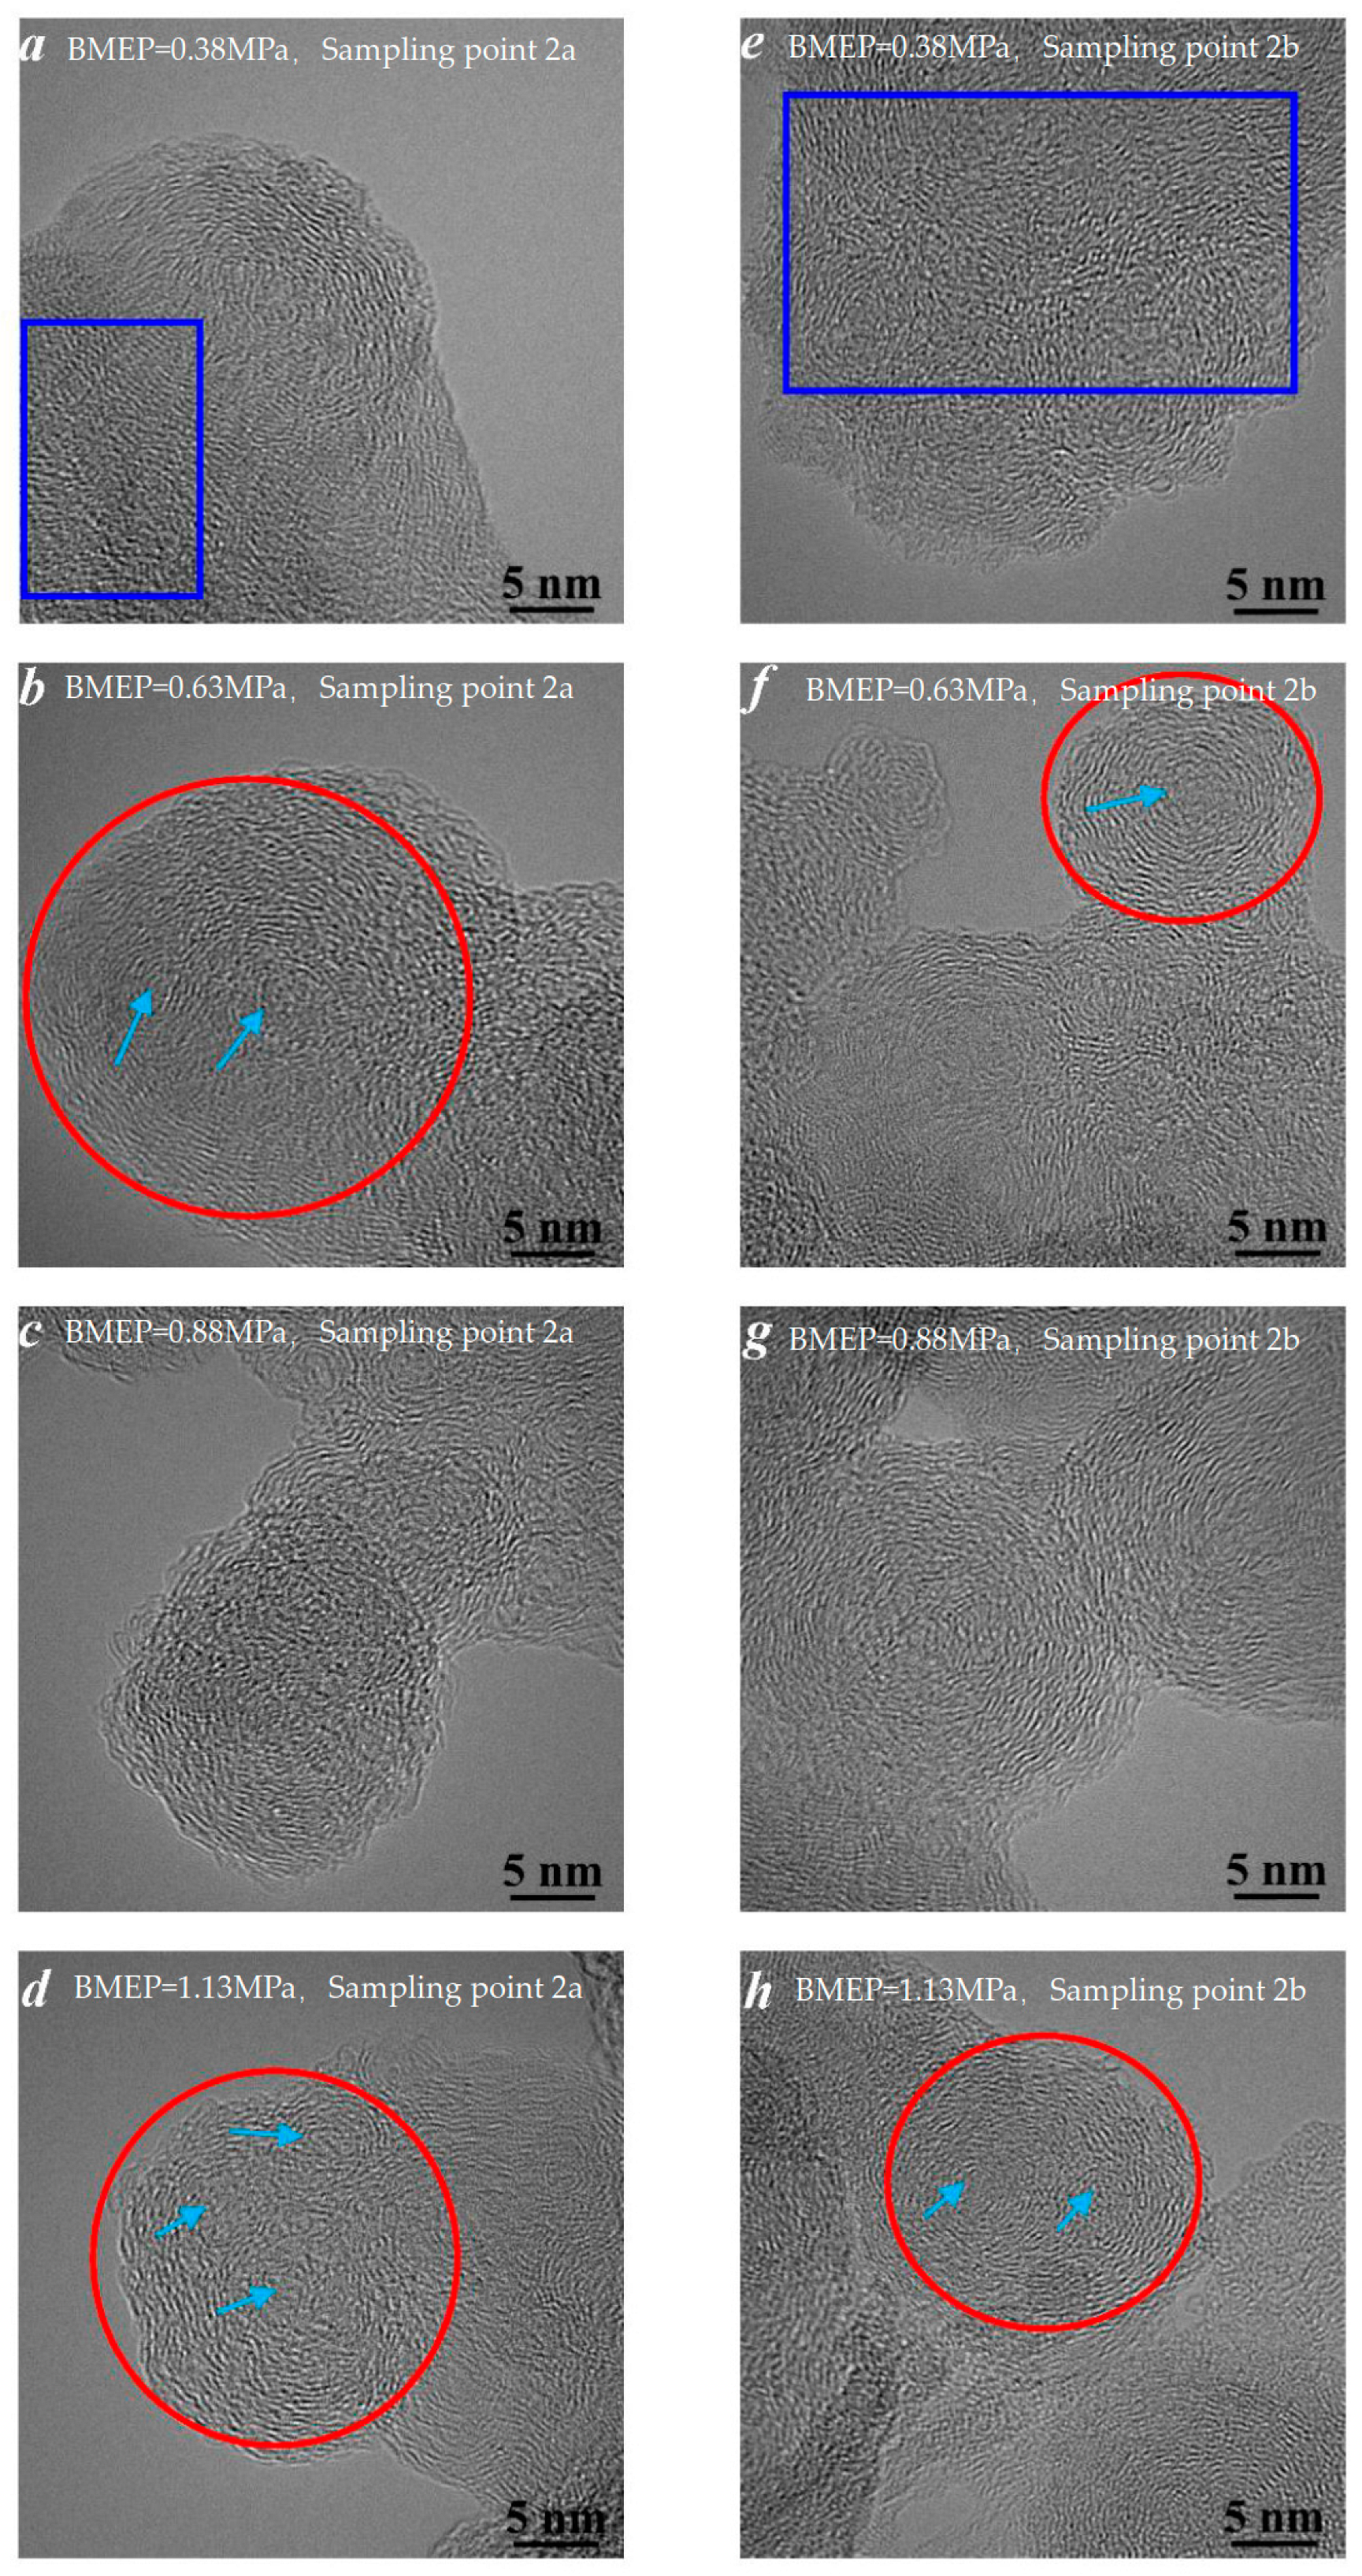
Primary soot particles are the basic units that make up soot particles. The internal microstructures of primary soot particles are affected by factors such as the fuel characteristics, combustion temperature, combustion duration, and air–fuel ratio [49]. In general, the internal microstructures of primary soot particles are divided into two types: a disordered carbon layer and a typical core–shell structure [12,19]. The disordered carbon refers to carbon materials possessing some noticeable long-range order but without crystallite structure, as shown in the blue rectangle of Figure 8. A primary soot particle with the core–shell structure has two distinct parts: an inner core and an outer shell. The inner core is composed of 1–3 fine particles, and the outer shell is graphite crystallites formed by surface reaction and condensation of small chemical species, as shown in the red circle of Figure 8. Fine particles were marked by the arrows in Figure 8.
Figure 8 shows HRTEM images of soot particles magnified 800,000 times at sampling points 2a and 2b. The collected soot particles contained both primary soot particles with disordered carbon layers and primary soot particles with core–shell structures. However, at low load (BMEP = 0.38 MPa), primary soot particles with disordered carbon layers were in the majority, while at medium and high loads (BMEPs = 0.63, 0.88, 1.13 Mpa), primary soot particles with the core–shell structure were in the majority. This was because more fuel was injected in the cylinder as the loads increased to increase in-cylinder pressure and temperature, which generate more soot precursors. Precursors generated nuclei through chemical reactions under high in-cylinder temperature conditions [4]. The nucleus is located in the center of fine particles. The inner core is formed after 1–3 fine particles coagulated [12]. Therefore, the nucleus is the key to forming primary soot particles with the core–shell structure. According to reference [40,41], primary soot particles in the exhaust pipe had matured. Therefore, the structures of primary soot particles were basically unchanged, but the micro-parameters of the carbon layer would change.
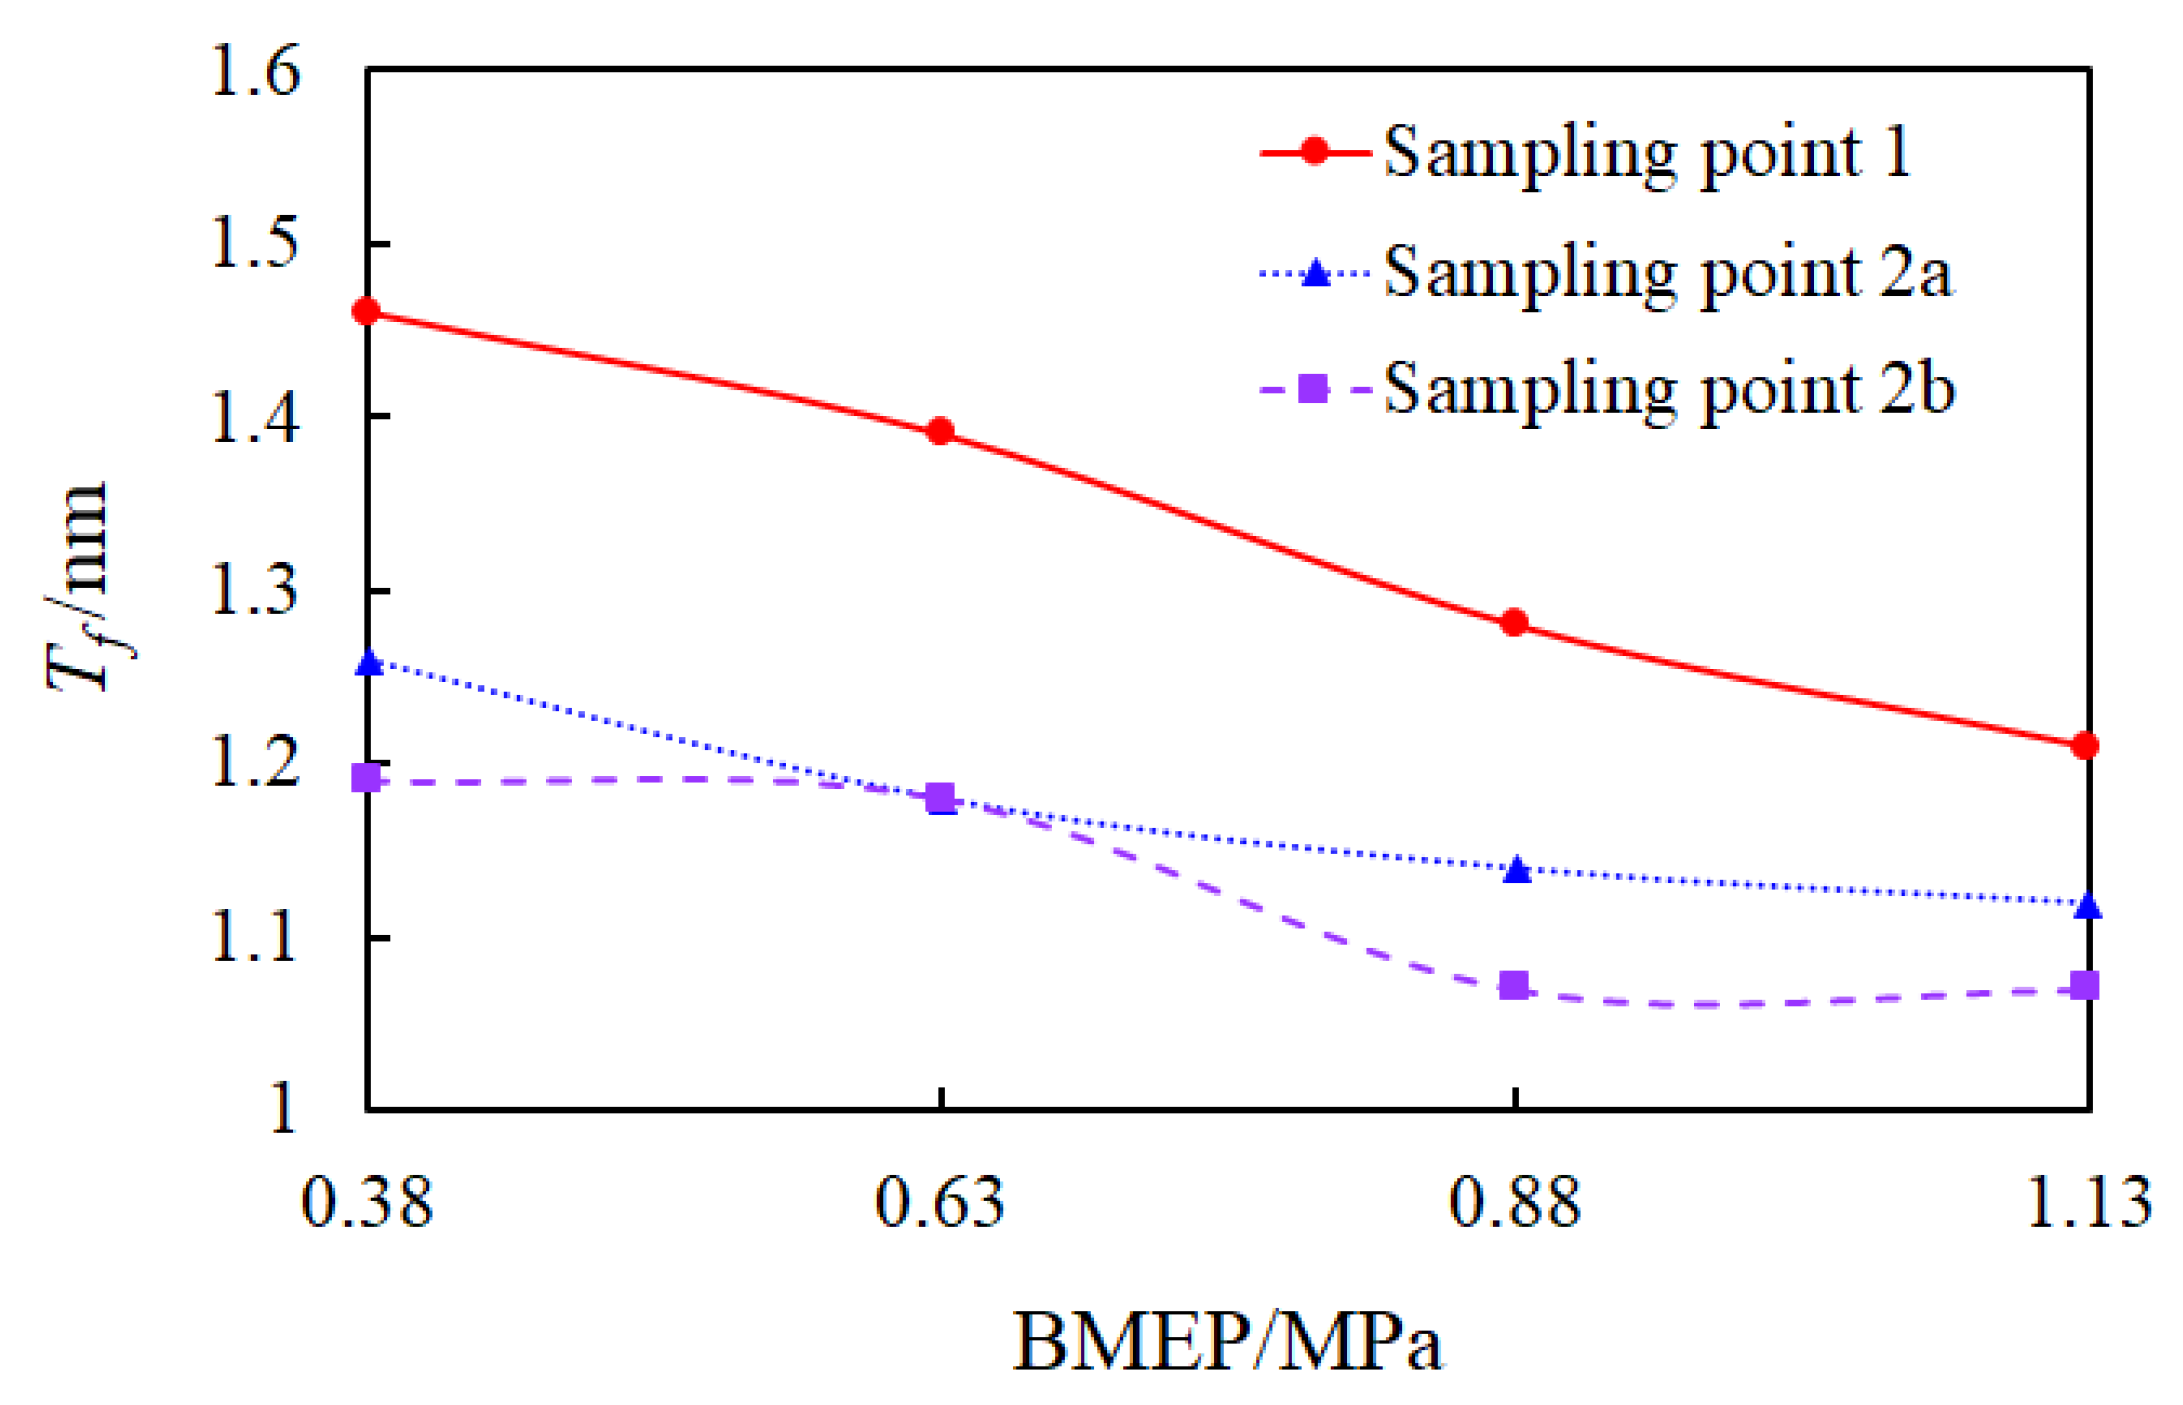
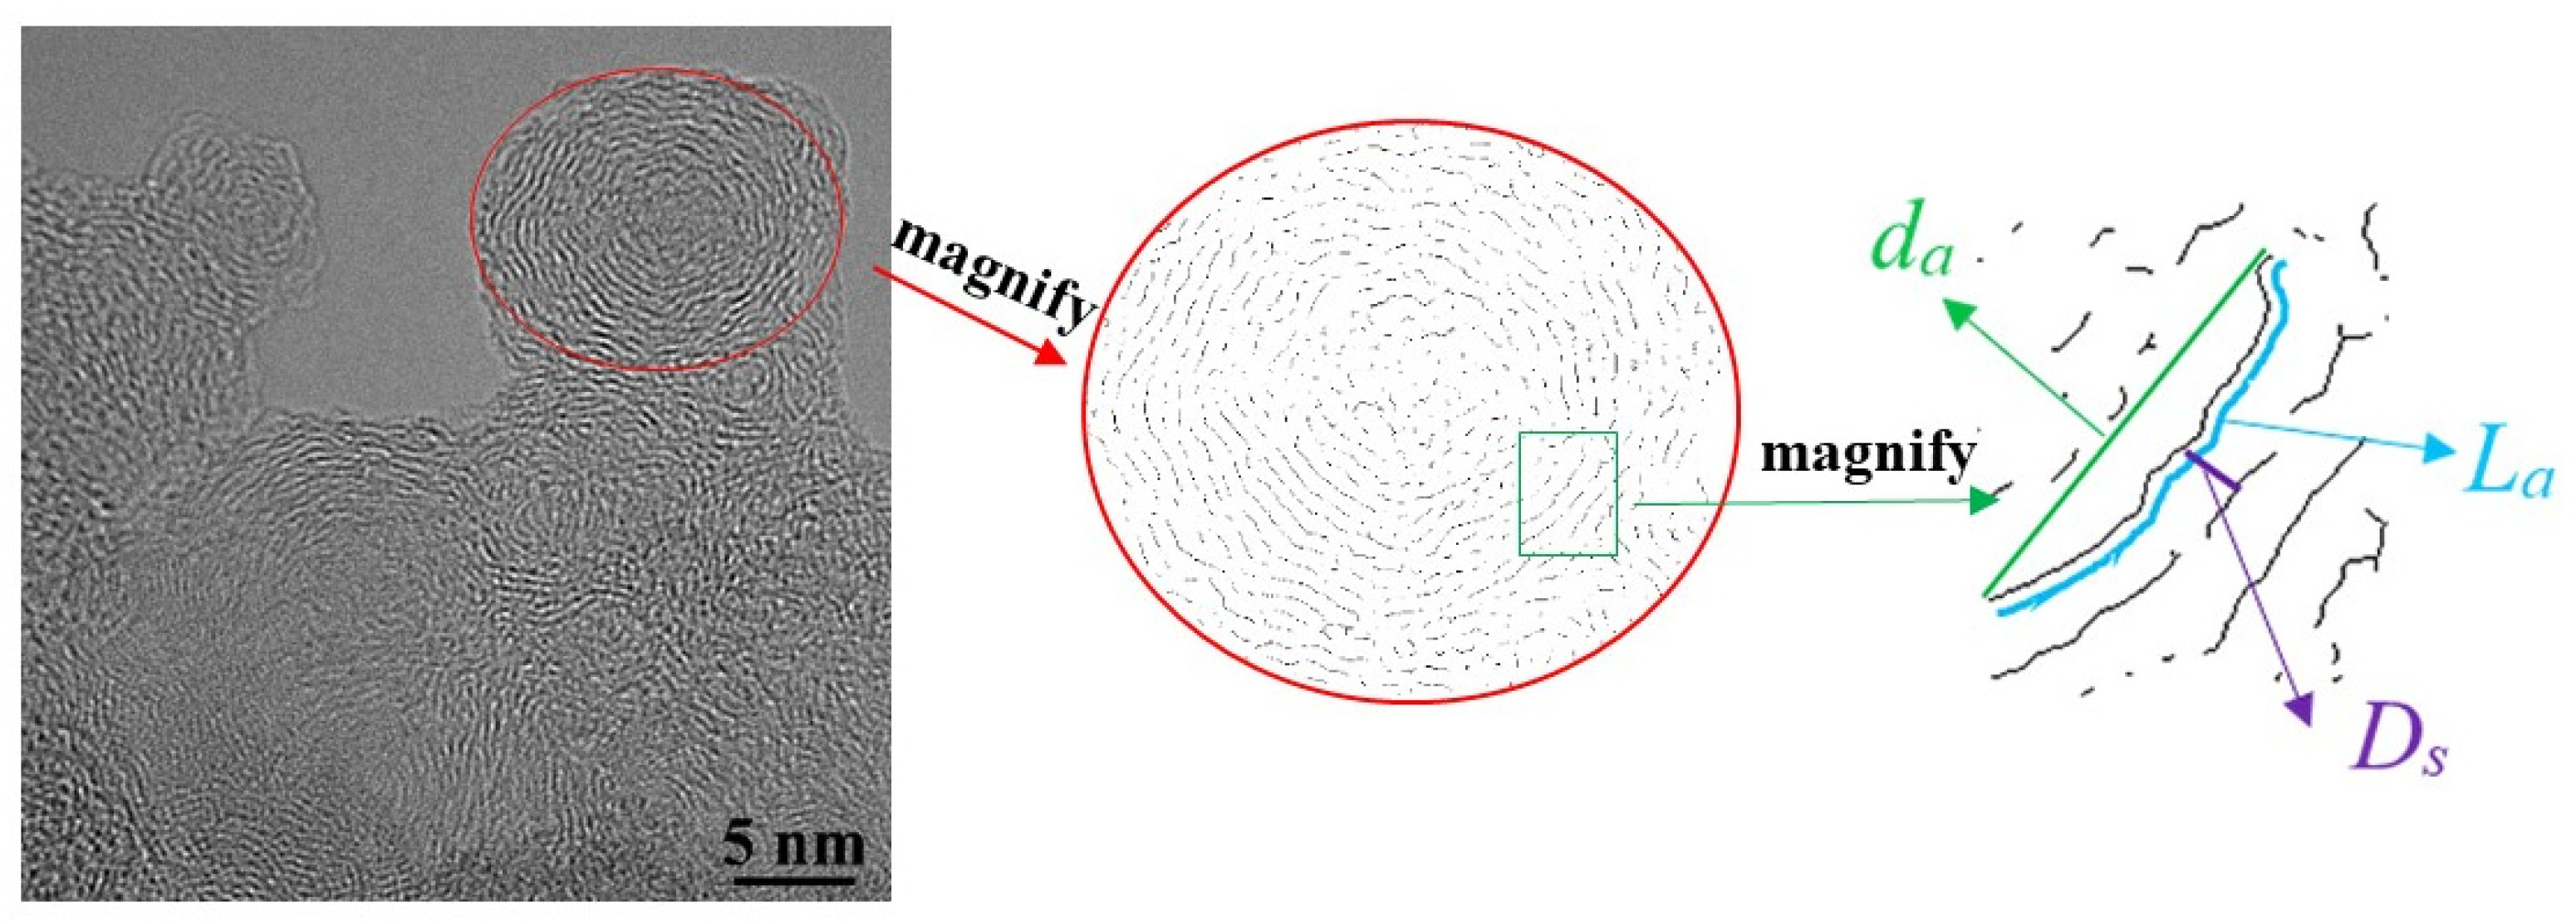
Ds and Tf were statistically analyzed to further compare the carbon layer structures of primary soot particles at different sampling points and temperatures. The HRTEM images were processed using a Fourier transform, filtering, inverse Fourier transform, image binarization, and image skeletonization procedure, and the micro-parameters of primary soot particles are shown in Figure 9. Tf could not be directly measured, but it could be calculated using the ratio of the length of the carbon layer (La) and the distance between the ends of the carbon layer (da) [34].
Figure 10 and Figure 11 show the changes in the average Ds and Tf of primary soot particles with the loads, respectively. As the loads increased, the average Ds and Tf decreased. Under high loads, the diffusion–combustion time of the diesel engine increased, and the temperature was higher. It was found previously that diffusion–combustion and high temperature were conducive to the formation of mature primary soot particles with core–shell structure [49]. Therefore, under heavy-load conditions, there were more mature primary particles with core–shell structures, and the carbon layers were tighter and smoother.
Figure 10 and Figure 11 show that the average values Ds and Tf, respectively, of primary soot particles at sampling point 2b were lower than those at sampling point 2a under each load, especially under high loads (BMEPs = 0.88 and 1.13 MPa). The concentric structure was the most stable arrangement of the carbon layer under high-temperature conditions, which was the result of the full graphitization of soot particles [50]. After the insulating cotton was installed, the airflow temperature in the exhaust pipe increased to promote the surface reaction of small molecules, radicals, or ions with the outer surface of the carbon layer of primary soot particles, so graphitization of the carbon layer was improved.
5. Conclusions
Soot particles were sampled at different sampling points in a diesel engine exhaust pipe, and insulating cotton was wrapped on the exhaust pipe between the two sampling points to slow the airflow temperature drop of the exhaust pipe. The morphologies and microstructures of soot particles were observed using a HRTEM, the growth of soot particles in the exhaust pipe was studied, and the influence of temperature on the morphologies and microstructures of soot particles was analyzed. The conclusions were as follows:
- (1)
- Under all load conditions, dp, Rg, and Np of soot particles at sampling point 2a were greater than those at sampling point 1. At BMEP = 1.13 MPa, the increases in dp, Rg, and Np were the least, as they only increased by 6.64%, 6.27%, and 6.44%, respectively. This meant that when soot particles in the exhaust pipe moved with the exhaust gas to the atmosphere, soot particles still grew through surface chemical reactions and physical processes, such as collision, coagulation, and breakage.
- (2)
- As the loads increased, Df increased from 1.59 to 1.91, and simple chain-like and branched soot particles developed into complex cluster-like and mesh-like soot particles. When the load was the same, the fractal dimension of soot particles at sampling point 2a was larger than that at the sampling point 1, and soot particles agglomerated more and more as the exhaust gas moved through the exhaust pipe.
- (3)
- The increase in the airflow temperature in the exhaust pipe promoted the surface growth of primary soot particles and enhanced the turbulence, which made the chain-like soot particles more likely to exhibit tortuosity under the action of turbulent eddies, that is, Rg decreased and Df increased. Compared to Df at sampling point 2a, Df at sampling point 2b increased by 1.16%, 0.47%, 1.44%, and 2.21%, respectively, as a function of BMEPs.
- (4)
- The average Ds and Tf of primary soot particles at sampling point 2b deceased, especially under BMEP = 1.13 MPa as Ds and Tf decreased by 4.46% and 6.0%, respectively. This showed that the increase in the temperature of the exhaust pipe was conducive to the graphitization of primary soot particles.
Author Contributions
Conceptualization, H.J. and M.W.; methodology, H.J.; software, F.B. and Y.Z.; validation, M.W.; writing—original draft preparation, F.B.; writing—review and editing, H.J. and Y.Z.; supervision, H.J.; project administration, M.W.; funding acquisition, H.J. All authors have read and agreed to the published version of the manuscript.
Funding
The National Natural Science Foundation of China, grant number 51706163.
Data Availability Statement
The data presented in this study are available on request from the corresponding author.
Conflicts of Interest
The authors declare no conflict of interest. The funders had no role in the design of the study; in the collection, analyses, or interpretation of data; in the writing of the manuscript, or in the decision to publish the results.
References
- Robert, H.H.; Gregory, P.C.; Hong-shig, S. Equilibrium nanostructure of primary soot particles. Proc. Combust. Inst. 2000, 28, 2539–2546. [Google Scholar]
- Robert, A.K. Recent changes in winter PM2.5 contributions from wood smoke, motor vehicles, and other sources in the Northwest U.S. Atmos. Environ. 2020, 237, 117724. [Google Scholar]
- Feiyang, Z.; Wenming, Y.; Wenbin, Y.; Han, L.; Yu, Y.S.; Teng, L.; Kun, L.T. Numerical study of soot particles from low temperature combustion of engine fueled with diesel fuel and unsaturation biodiesel fuels. Appl. Energy 2018, 211, 187–193. [Google Scholar]
- Pavan, P.D.; Sujith, S.; Rajesh, K.S.; Sheshadri, S. Modeling soot particle size distribution in diesel engines. Fuel 2019, 243, 70–78. [Google Scholar]
- Suhonen, H.; Laitinen, A.; Kortelainen, M.; Koponen, H.; Kinnunen, N.; Suvanto, M. Novel fine particle reduction method for wood stoves based on high-temperature electric collection of naturally charged soot particles. J. Clean. Prod. 2021, 312, 127831. [Google Scholar] [CrossRef]
- Xiao, Z.; Tang, Y.; Zhou, J.; Yao, Q. Effect of the interaction between sodium and soot on fine particle formation in the early stage of coal combustion. Fuel 2017, 206, 546–554. [Google Scholar] [CrossRef]
- Chowdhury, S.; Boyette, W.; Roberts, W.L. Time-averaged probability density functions of soot nanoparticles along the centerline of a piloted turbulent diffusion flame using a scanning mobility particle sizer. J. Aerosol Sci. 2017, 106, 56–67. [Google Scholar] [CrossRef]
- De Falco, G.; El Helou, I.; de Oliveira, P.M.; Sirignano, M.; Yuan, R.; D’Anna, A.; Mastorakos, E. Soot particle size distribution measurements in a turbulent ethylene swirl flame. Proc. Combust. Inst. 2021, 38, 2691–2699. [Google Scholar] [CrossRef]
- Xiao, H.; Xiaolong, Y.; Beibei, H.; Wang, R.; Xue, Q.; Ju, H. Combustion performance and pollutant emissions analysis of a diesel engine fueled with biodiesel and its blend with 2-methylfuran. Fuel 2019, 237, 1050–1056. [Google Scholar] [CrossRef]
- Lee, Y.; Lee, Y.; Moon, S.; Lee, S.; Roh, Y.; Min, K. Development of semi-empirical soot emission model for a CI engine. Sci. Total Environ. 2022, 820, 153327. [Google Scholar] [CrossRef]
- Michelsen, H.A. Probing soot formation, chemical and physical evolution, and oxidation: A review of in situ diagnostic techniques and needs. Proc. Combust. Inst. 2017, 36, 717–735. [Google Scholar] [CrossRef]
- Tian, R.; Zhang, Y.; Kook, S.; Kim, K.S.; Kweon, C. Effect of jet fuel aromatics on in-flame soot distribution and particle morphology in a small-bore compression ignition engine. Fuel 2021, 305, 121582. [Google Scholar] [CrossRef]
- Wei, J.; Zeng, Y.; Pan, M.; Zhuang, Y.; Qiu, L.; Zhou, T. Morphology analysis of soot particles from a modern diesel engine fueled with different types of oxygenated fuels. Fuel 2020, 267, 117248. [Google Scholar] [CrossRef]
- Kiminori, O.; Miki, Y.; Sho, T.; Yasuhiro, S.; Hideyuki, A.; Okiteru, F.; Takayuki, A.; Togo, Y. Influence of furnace temperature and residence time on configurations of carbon black. Chem. Eng. J. 2012, 200–202, 541–548. [Google Scholar]
- Wang, X.; Wang, Y.; Bai, Y.; Wang, P.; Wang, D.; Guo, F. Effects of 2, 5-dimethylfuran addition on morphology, nanostructure and oxidation reactivity of diesel exhaust particles. Fuel 2019, 253, 731–740. [Google Scholar] [CrossRef]
- Liu, Y.; Xu, Y.; Zhang, K.; Zhang, P.; Cheng, X. Effects of ammonia addition on soot formation in ethylene laminar diffusion flames. Part 3. The morphology and nanostructure of soot particles. Fuel 2023, 332, 126082. [Google Scholar] [CrossRef]
- Amin, H.M.F.; Bennett, A.; Roberts, W.L. Morphology of soot sampled from N2-diluted methane/air counterflow flames at elevated pressures via TEM imaging. Combust. Flame 2020, 216, 92–99. [Google Scholar] [CrossRef] [Green Version]
- Sipkens, T.A.; Frei, M.; Baldelli, A.; Kirchen, P.; Kruis, F.E.; Rogak, S.N. Characterizing soot in TEM images using a convolutional neural network. Powder Technol. 2021, 387, 313–324. [Google Scholar] [CrossRef]
- Schulz, F.; Commodo, M.; Kaiser, K.; Falco, G.D.; Minutolo, P.; Meyer, G.; D’Anna, A.; Gross, L. Insights into incipient soot formation by atomic force microscopy. Proc. Combust. Inst. 2019, 37, 885–892. [Google Scholar] [CrossRef]
- Commodo, M.; Kaiser, K.; De Falco, G.D.; Minutolo, P.; Schulz, F.; D’Anna, A.; Gross, L. On the early stages of soot formation: Molecular structure elucidation by high-resolution atomic force microscopy. Combust. Flame 2019, 205, 154–164. [Google Scholar] [CrossRef]
- Schenk, M.; Lieb, S.; Vieker, H.; Beyer, A.; Gölzhäuser, A.; Wang, H.; Kohse-Höinghaus, K. Morphology of nascent soot in ethylene flames. Proc. Combust. Inst. 2015, 35, 1879–1886. [Google Scholar] [CrossRef]
- Veronesi, S.; Commodo, M.; Basta, L.; Falco, G.D.; Minutolo, P.; Kateris, N.; Wang, H.; D’Anna, A.; Heun, S. Morphology and electronic properties of incipient soot by scanning tunneling microscopy and spectroscopy. Combust. Flame 2022, 243, 111980. [Google Scholar] [CrossRef]
- Yu, W.; Suk, H.C. Soot formation in laminar counterflow flames. Prog. Energy Combust. Sci. 2019, 74, 152–238. [Google Scholar]
- Michelsen, H.A.; Colket, M.B.; Bengtsson, P.; D’Anna, A.; Desgroux, P.; Haynes, B.S.; Miller, J.H.; Nathan, G.J.; Pitsch, H.; Wang, H. A Review of Terminology Used to Describe Soot Formation and Evolution under Combustion and Pyrolytic Conditions. ACS Nano 2020, 14, 12470–12490. [Google Scholar] [CrossRef]
- Martin, J.W.; Pascazio, L.; Menon, A.; Akroyd, J.; Kaiser, K.; Schulz, F.; Commodo, A.; D’Anna, A.; Gross, L.; Kraft, M. π-Diradical Aromatic Soot Precursors in Flames. J. Am. Chem. Soc. 2021, 143, 12212–12219. [Google Scholar] [CrossRef]
- Wei, M.; Wu, S.; Mao, Q.; Wang, Y.; Guo, G.; Zhang, D. The oxidation mechanism investigation of benzene catalyzed by palladium nanoparticle: A ReaxFF molecular dynamics. Fuel 2020, 275, 117989. [Google Scholar] [CrossRef]
- De Falco, G.; Commodo, M.; Minutolo, P.D.; Anna, A. Flame-Formed Carbon Nanoparticles: Morphology, Interaction Forces, and Hamaker Constant from AFM. Aerosol Sci. Technol. 2015, 49, 281–289. [Google Scholar] [CrossRef]
- Schaefer, D.W. Fractal Models and the Structure of Materials. MRS Bull. 1988, 13, 22–27. [Google Scholar] [CrossRef]
- Liang, B.; Wang, C.; Zhang, Y.; Liu, B.; Zeng, F.; Shadrack, A.T.; Paitoon, T. Effect of CO2/H2O addition on laminar diffusion flame structure and soot formation of oxygen-enriched ethylene. J. Energy Inst. 2022, 102, 160–175. [Google Scholar]
- Jiang, H.; Li, T.; Wang, Y.; He, P.; Wang, B. The evolution of soot morphology and nanostructure along axial direction in diesel spray jet flames. Combust. Flame 2019, 199, 204–212. [Google Scholar] [CrossRef]
- Felix, S.H.; Joonsik, H.; Choongsik, P.; Tarun, G.; Avinash, K.A. Nanostructure characterization of soot particles from biodiesel and diesel spray flame in a constant volume combustion chamber. Fuel 2019, 235, 130–149. [Google Scholar]
- Liu, X.; Liu, J.; Zhao, L.; Ma, Z.; Li, J.; Wang, X.; Chen, W.; He, C. Effects of operating conditions on the morphology and internal structure of soot particles emitted from an agricultural tractor. Biosyst. Eng. 2020, 198, 280–290. [Google Scholar] [CrossRef]
- Behzad, R.; Choongsik, B. Morphology and nano-structure of soot in diesel spray and in engine exhaust. Fuel 2017, 203, 47–56. [Google Scholar]
- Sanghoon, K.; Zhang, R.; Kevin, S.; Lyle, M.P.; Tetsuya, A. In-Flame Soot Sampling and Particle Analysis in a Diesel Engine. SAE Int. J. Fuels Lubr. 2013, 6, 80–97. [Google Scholar]
- Teruo, Y.; Katsufumi, K.; Hiroki, N.; Satoshi, T.; Tetsuya, A. Direct Sampling, TEM Analysis and Optical Measurement of Soot Particles at Different Axial Locations in a Transient Spray Flame. SAE Int. J. Fuels Lubr. 2012, 5, 316–328. [Google Scholar]
- Chen, H.; Wang, X.; Pan, Z. Effect of operation conditions on the chemical composition, morphology, and nano-structure of particulate emissions in a light hydrocarbon premixed charge compression ignition (PCCI) engine. Sci. Total Environ. 2021, 750, 141716. [Google Scholar] [CrossRef] [PubMed]
- Pfau, S.A.; Rocca, A.L.; Haffner-Staton, E.; Fay, M.W.; Cairns, A. Linking operating conditions of a GDI engine to the nature and nanostructure of ultrafine soot particles. Combust. Flame 2022, 245, 112315. [Google Scholar] [CrossRef]
- Liang, X.; Zhao, B.; Wang, K.; Lv, X.; Wang, Y.; Liu, J.; Wang, Y. Impact of multi-injection strategies on morphology, nanostructure and oxidation reactivity of diesel soot particles. Combust. Flame 2022, 237, 111854. [Google Scholar] [CrossRef]
- Ge, J.C.; Wu, G.; Choi, N.J. Comparative study of pilot-main injection timings and diesel/ethanol binary blends on combustion, emission and microstructure of particles emitted from diesel engines. Fuel 2022, 313, 122658. [Google Scholar] [CrossRef]
- Ge, J.C.; Wu, G.; Yoo, B.; Choi, N.J. Effect of injection timing on combustion, emission and particle morphology of an old diesel engine fueled with ternary blends at low idling operations. Energy 2022, 253, 124150. [Google Scholar] [CrossRef]
- Di, Y.; Zhang, J.; Cheung, C.S.; Miao, X.; Zheng, J.; Peng, H.; Wu, T. Comparative study on combustion and particulate emissions for diesel-biodiesel and diesel –diglyme blends. Fuel 2022, 313, 122710. [Google Scholar]
- Zhou, Q.; Wang, Y.; Wang, X.; Bai, Y. Experimental investigation into the oxidation reactivity, morphology and graphitization of soot particles from diesel/n-octanol mixtures. J. Environ. Sci. 2022, 11, 218–230. [Google Scholar] [CrossRef]
- Verma, P.; Jafari, M.; Zare, A.; Pickering, E.; Guo, Y.; Osuagwu, C.G.; Stevanovic, A.; Brown, R.; Ristovski, Z. Soot particle morphology and nanostructure with oxygenated fuels: A comparative study into cold-start and hot-start operation. Environ. Pollut. 2021, 275, 116592. [Google Scholar] [CrossRef] [PubMed]
- Hagen, F.P.; Bockhorn, H.; Störmer, H.; Loukou, A.; Suntz, R.; Trimis, D. Nanostructural and morphological characteristics of single soot aggregates during low-temperature oxidation. Proc. Combust. Inst. 2021, 38, 1153–1161. [Google Scholar] [CrossRef]
- Koch, W.; Friedlander, S.K. The effect of particle coalescence on the surface area of a coagulating aerosol. J. Colloid Interface Sci. 1990, 140, 419–427. [Google Scholar] [CrossRef]
- Adam, N.; Umit, O.K. Effect of operating conditions on the size, morphology, and concentration of submicrometer particulates emitted from a diesel engine. Combust. Flame 2006, 146, 142–154. [Google Scholar]
- Katsufumi, K.; Tetsuya, A.; Sanghoon, K.; Lyle, P. Uncertainty in Sampling and TEM Analysis of Soot Particles in Diesel Spray Flame; SAE Technical Paper; SAE: Warrendale, PA, USA, 2013. [Google Scholar] [CrossRef]
- Fangqin, Y.; Xiaobei, C.; Liang, Q.; Ronghua, H.; Sheng, H.; Bei, L. Spray flame soot sampling and morphology analysis of butanol-diesel blends. J. Energy Inst. 2017, 90, 855–863. [Google Scholar]
- Chi, A.H.; Martin, S. Modelling of micro-particle agglomeration in turbulent flows. Chem. Eng. Sci. 2002, 57, 3073–3084. [Google Scholar]
- Tian, L. Physicochemical Characteristics of Particulate Emission from Compression Ignition Engines and Its Influence on Atmospheric Environment; Shanghai Jiao Tong University: Shanghai, China, 2012. [Google Scholar]
Figure 1.
Schematic of engine test bench.

Figure 2.
Schematic of soot sampling device.

Figure 3.
Schematic of soot particle parameters.
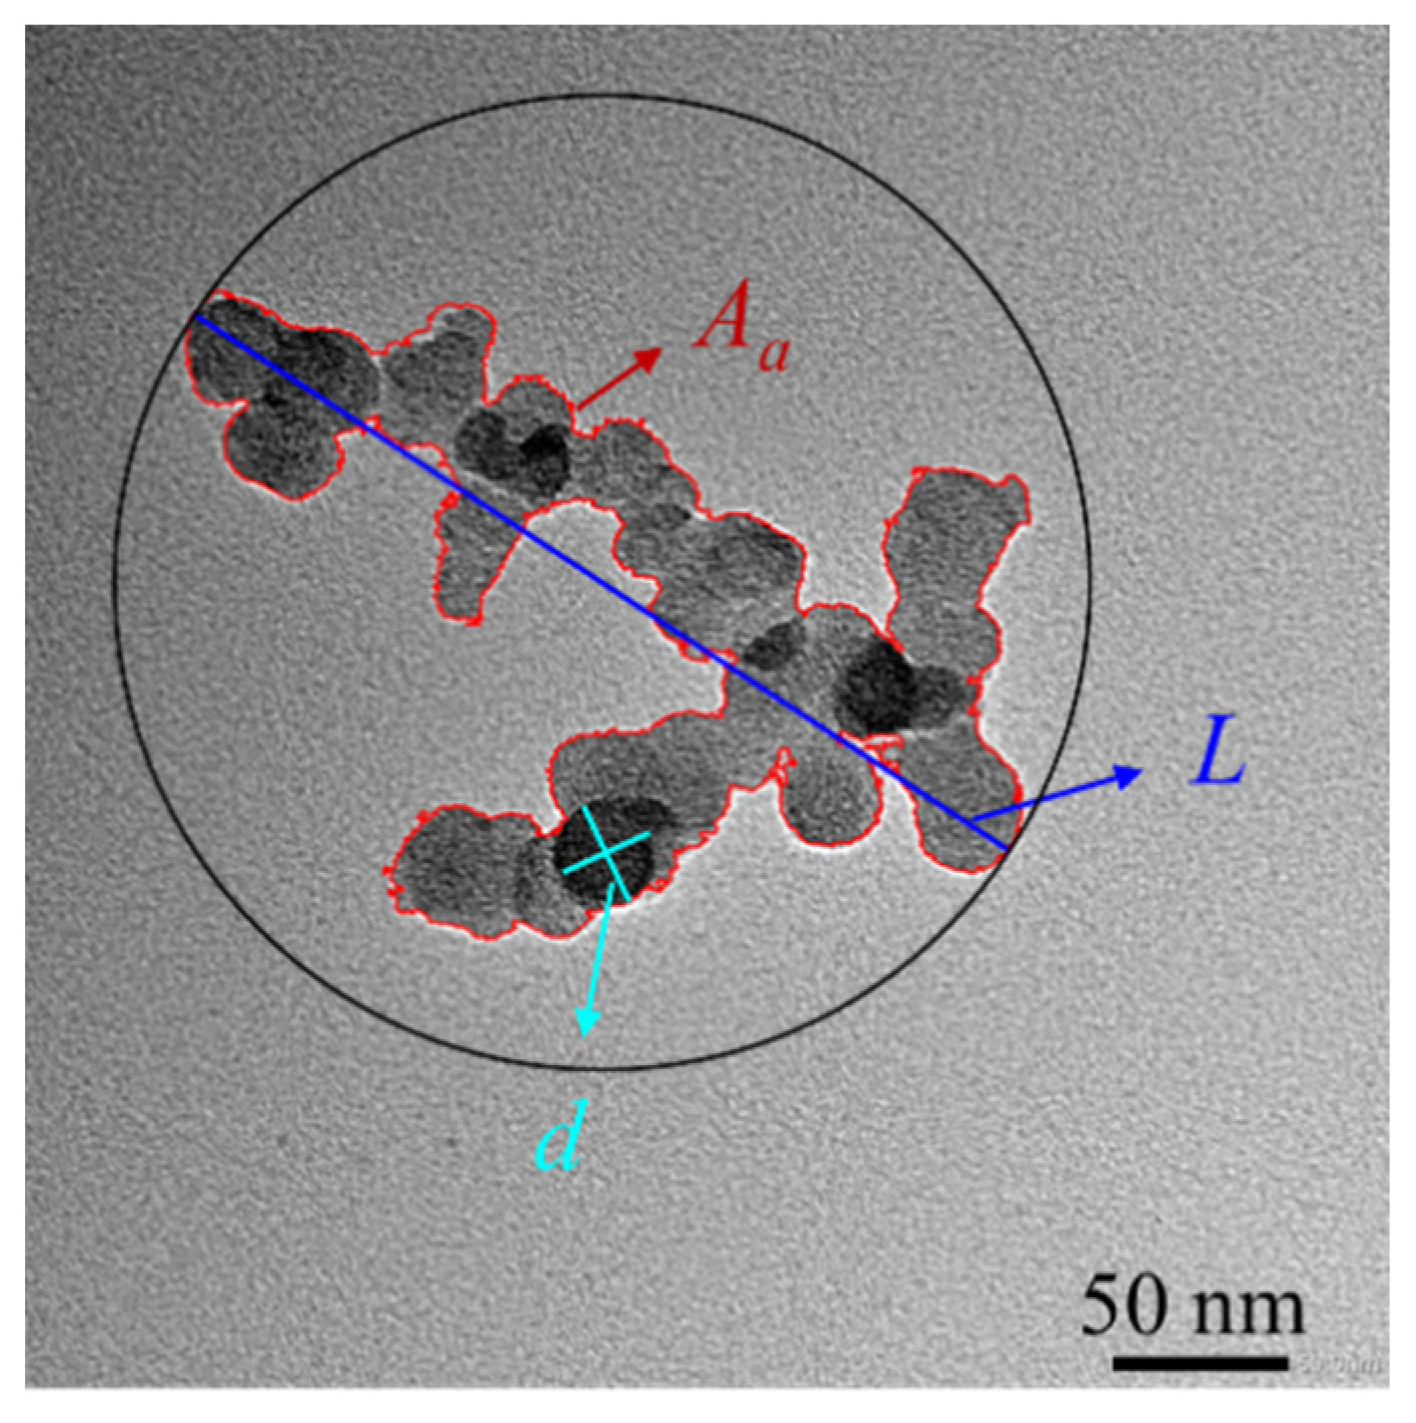
Figure 4.
Size distributions of primary soot particles for different load conditions.
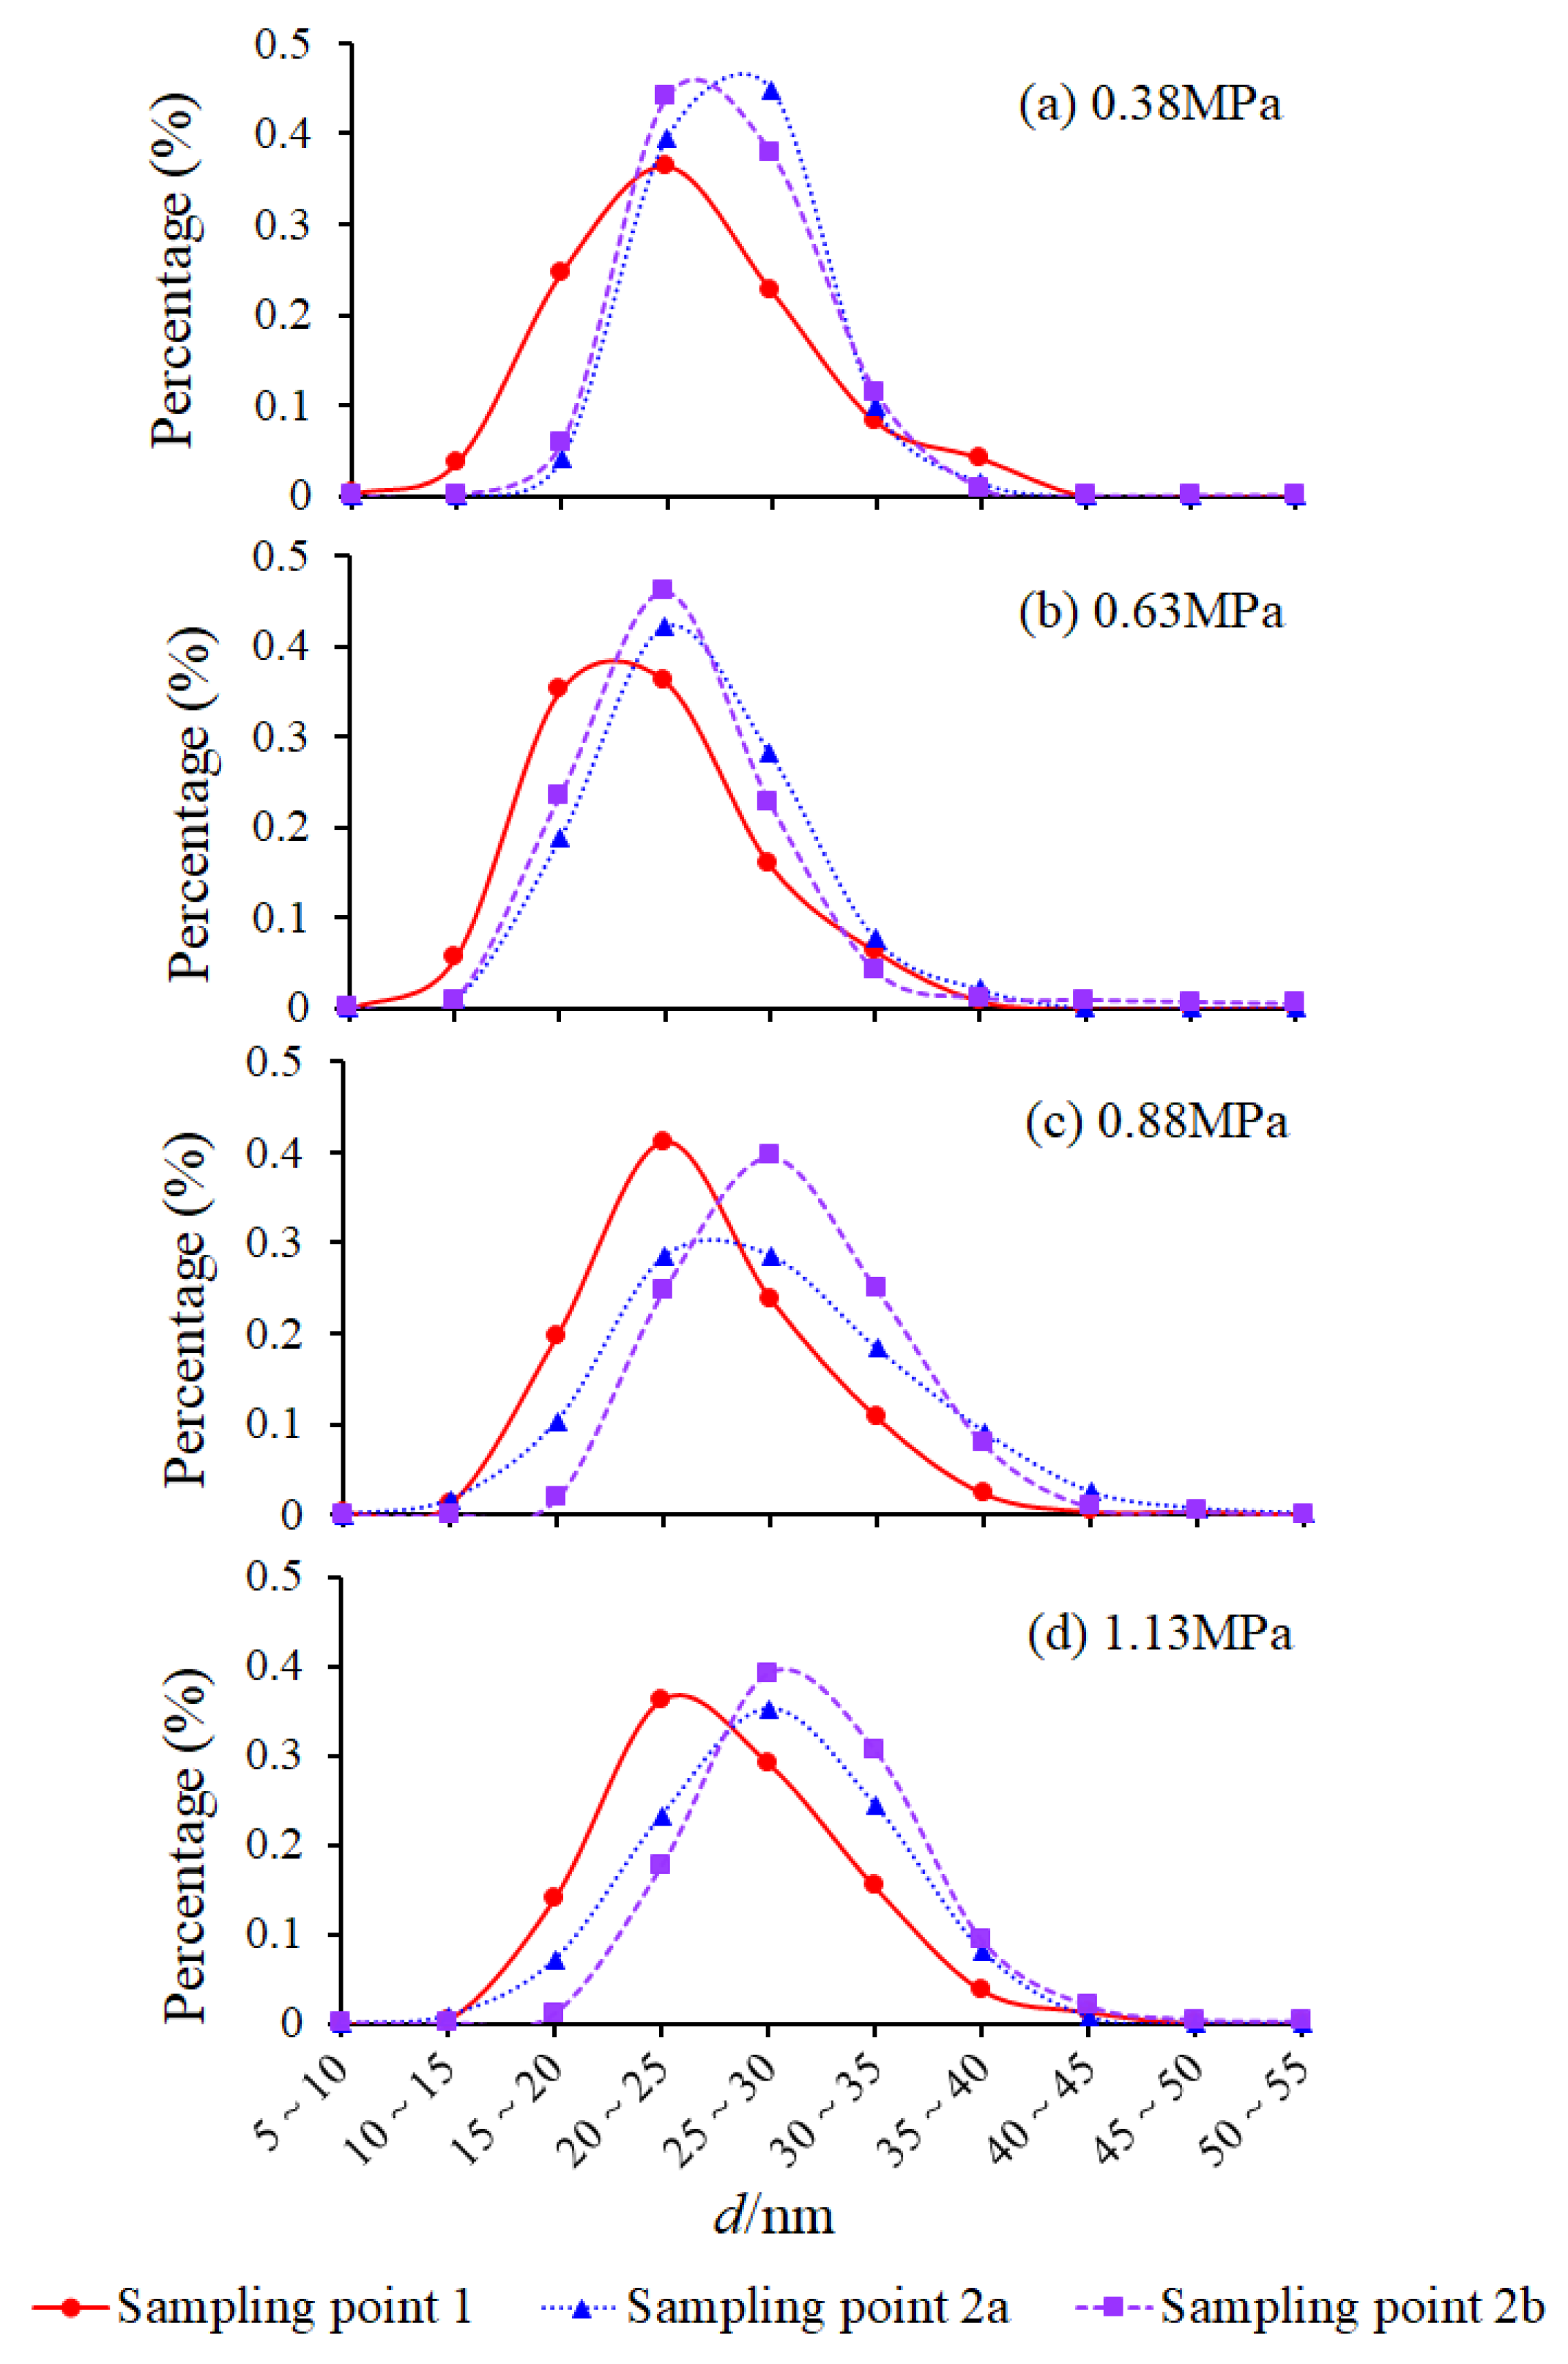
Figure 5.
Variations of dp, Np, and Rg with loads at different sampling points.

Figure 6.
Morphologies of soot particles at different sampling points and loads.
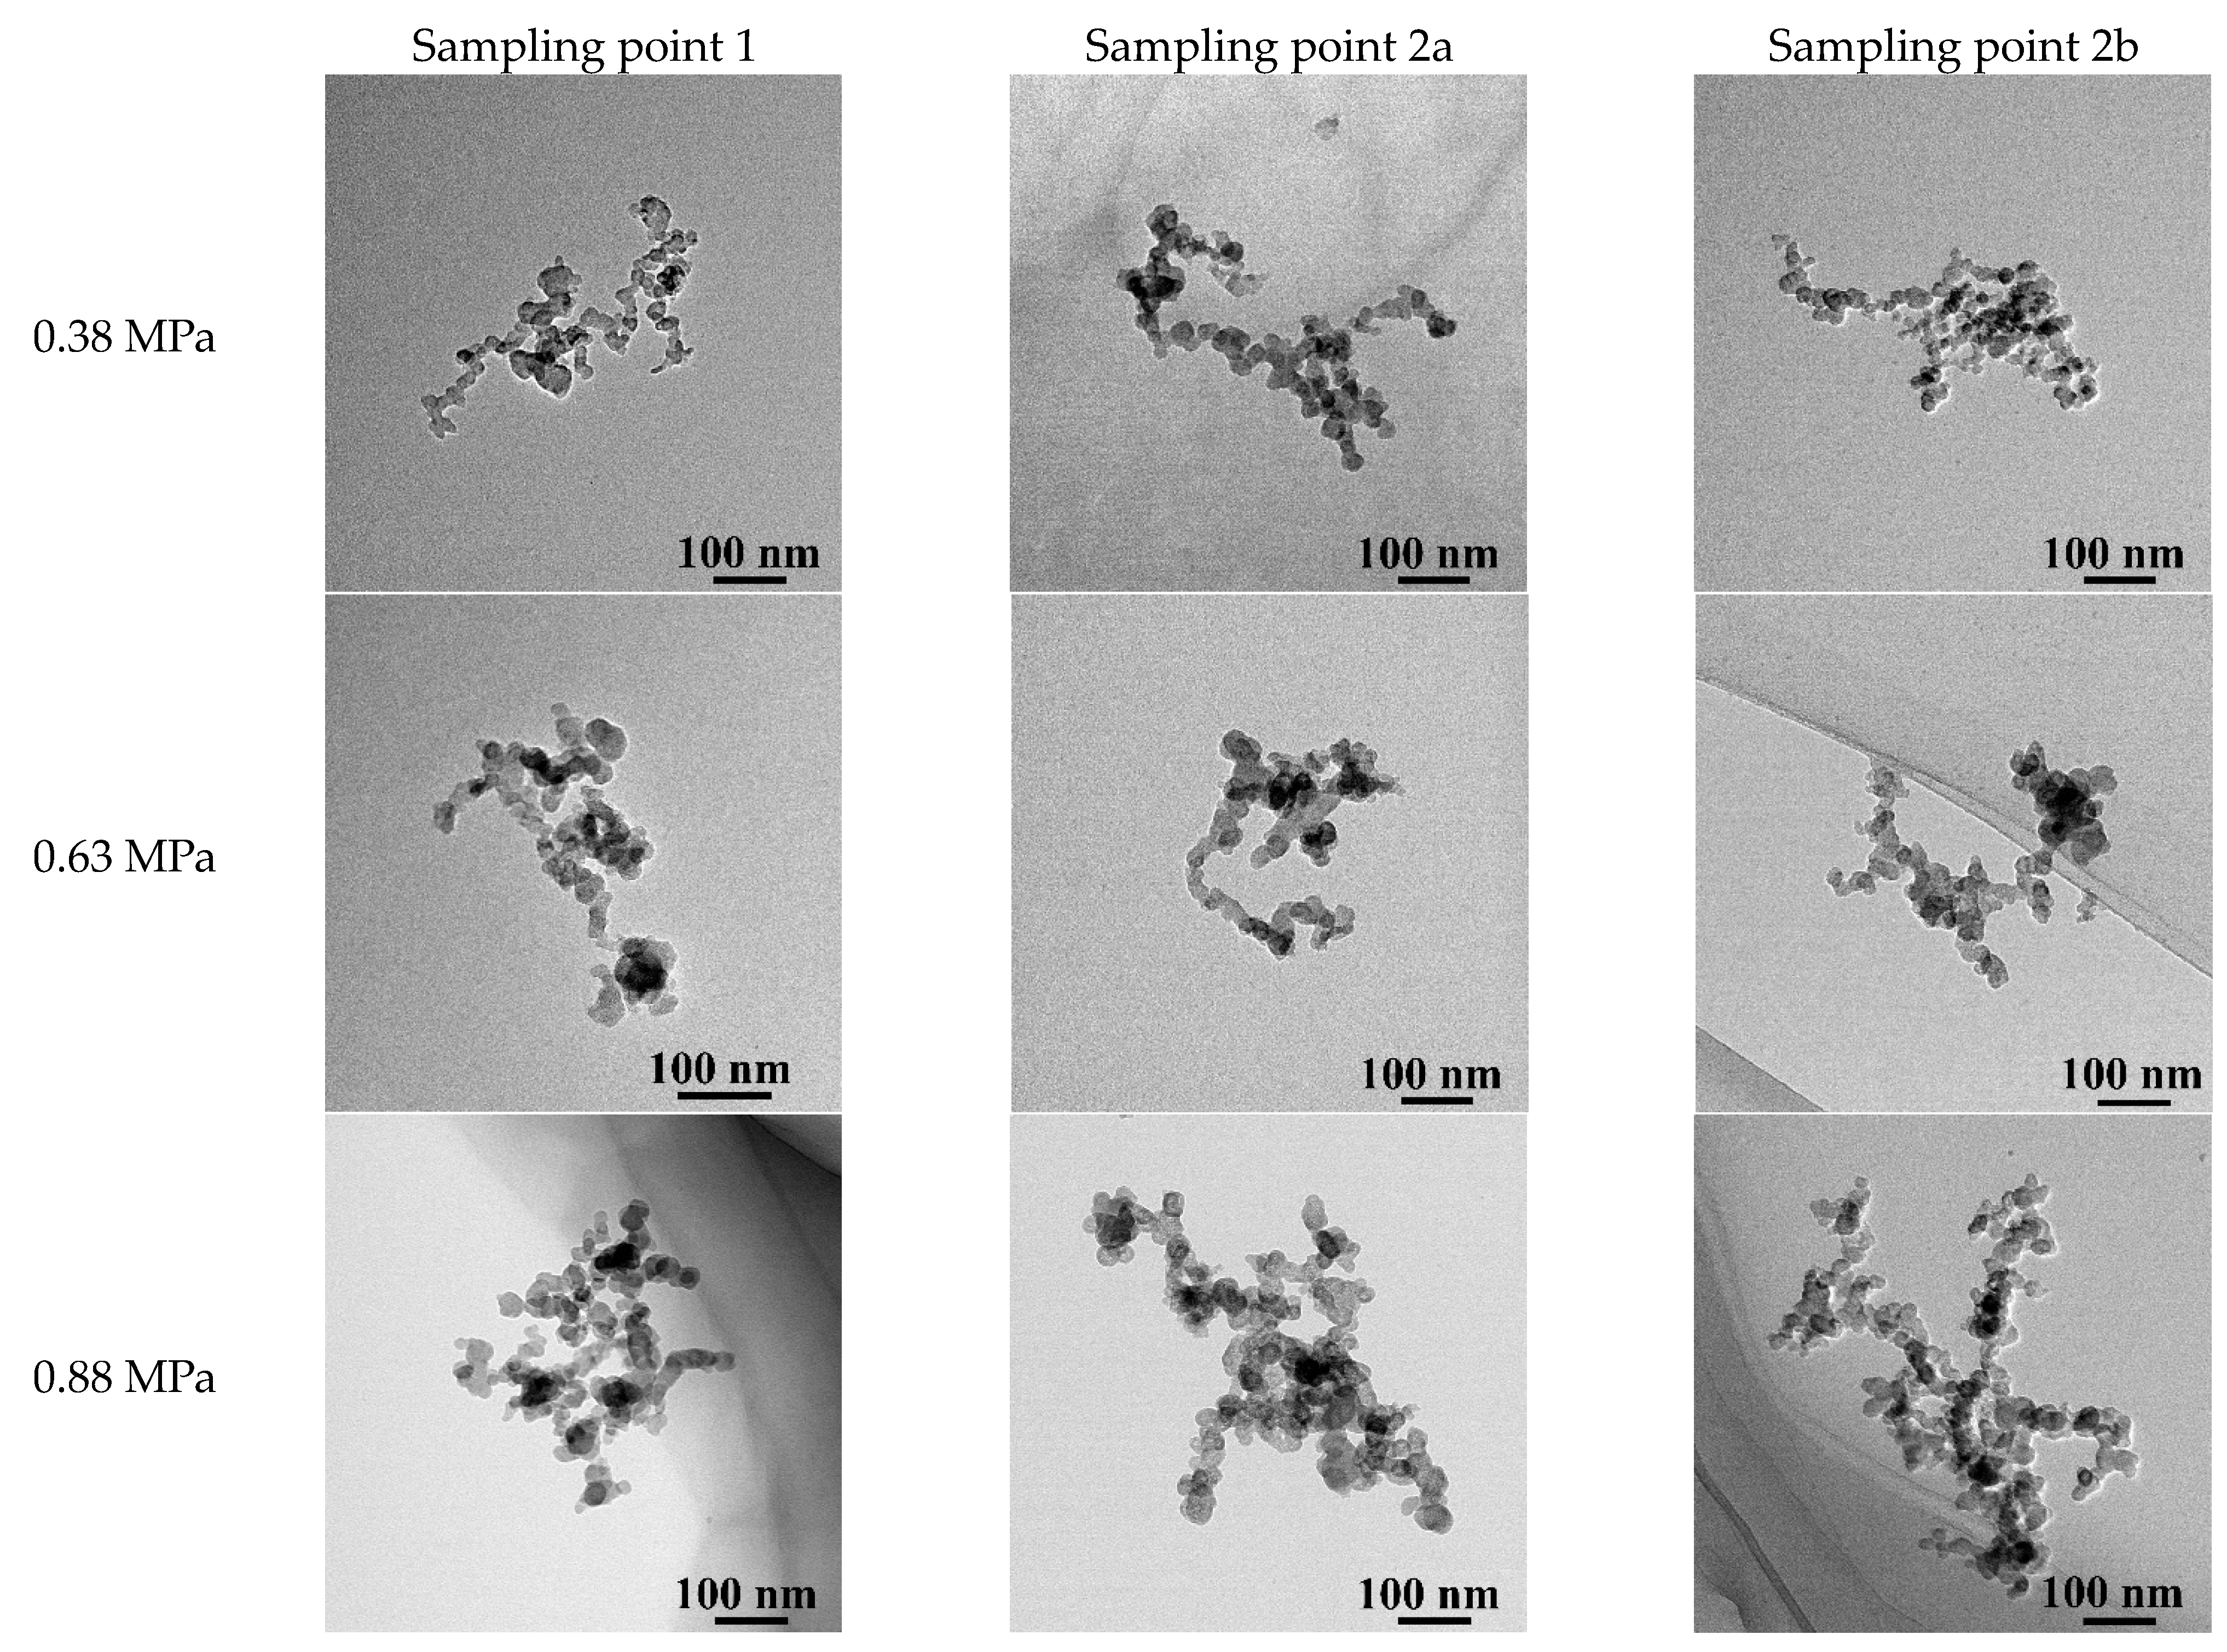

Figure 7.
Fractal dimensions of soot particles varied with loads.
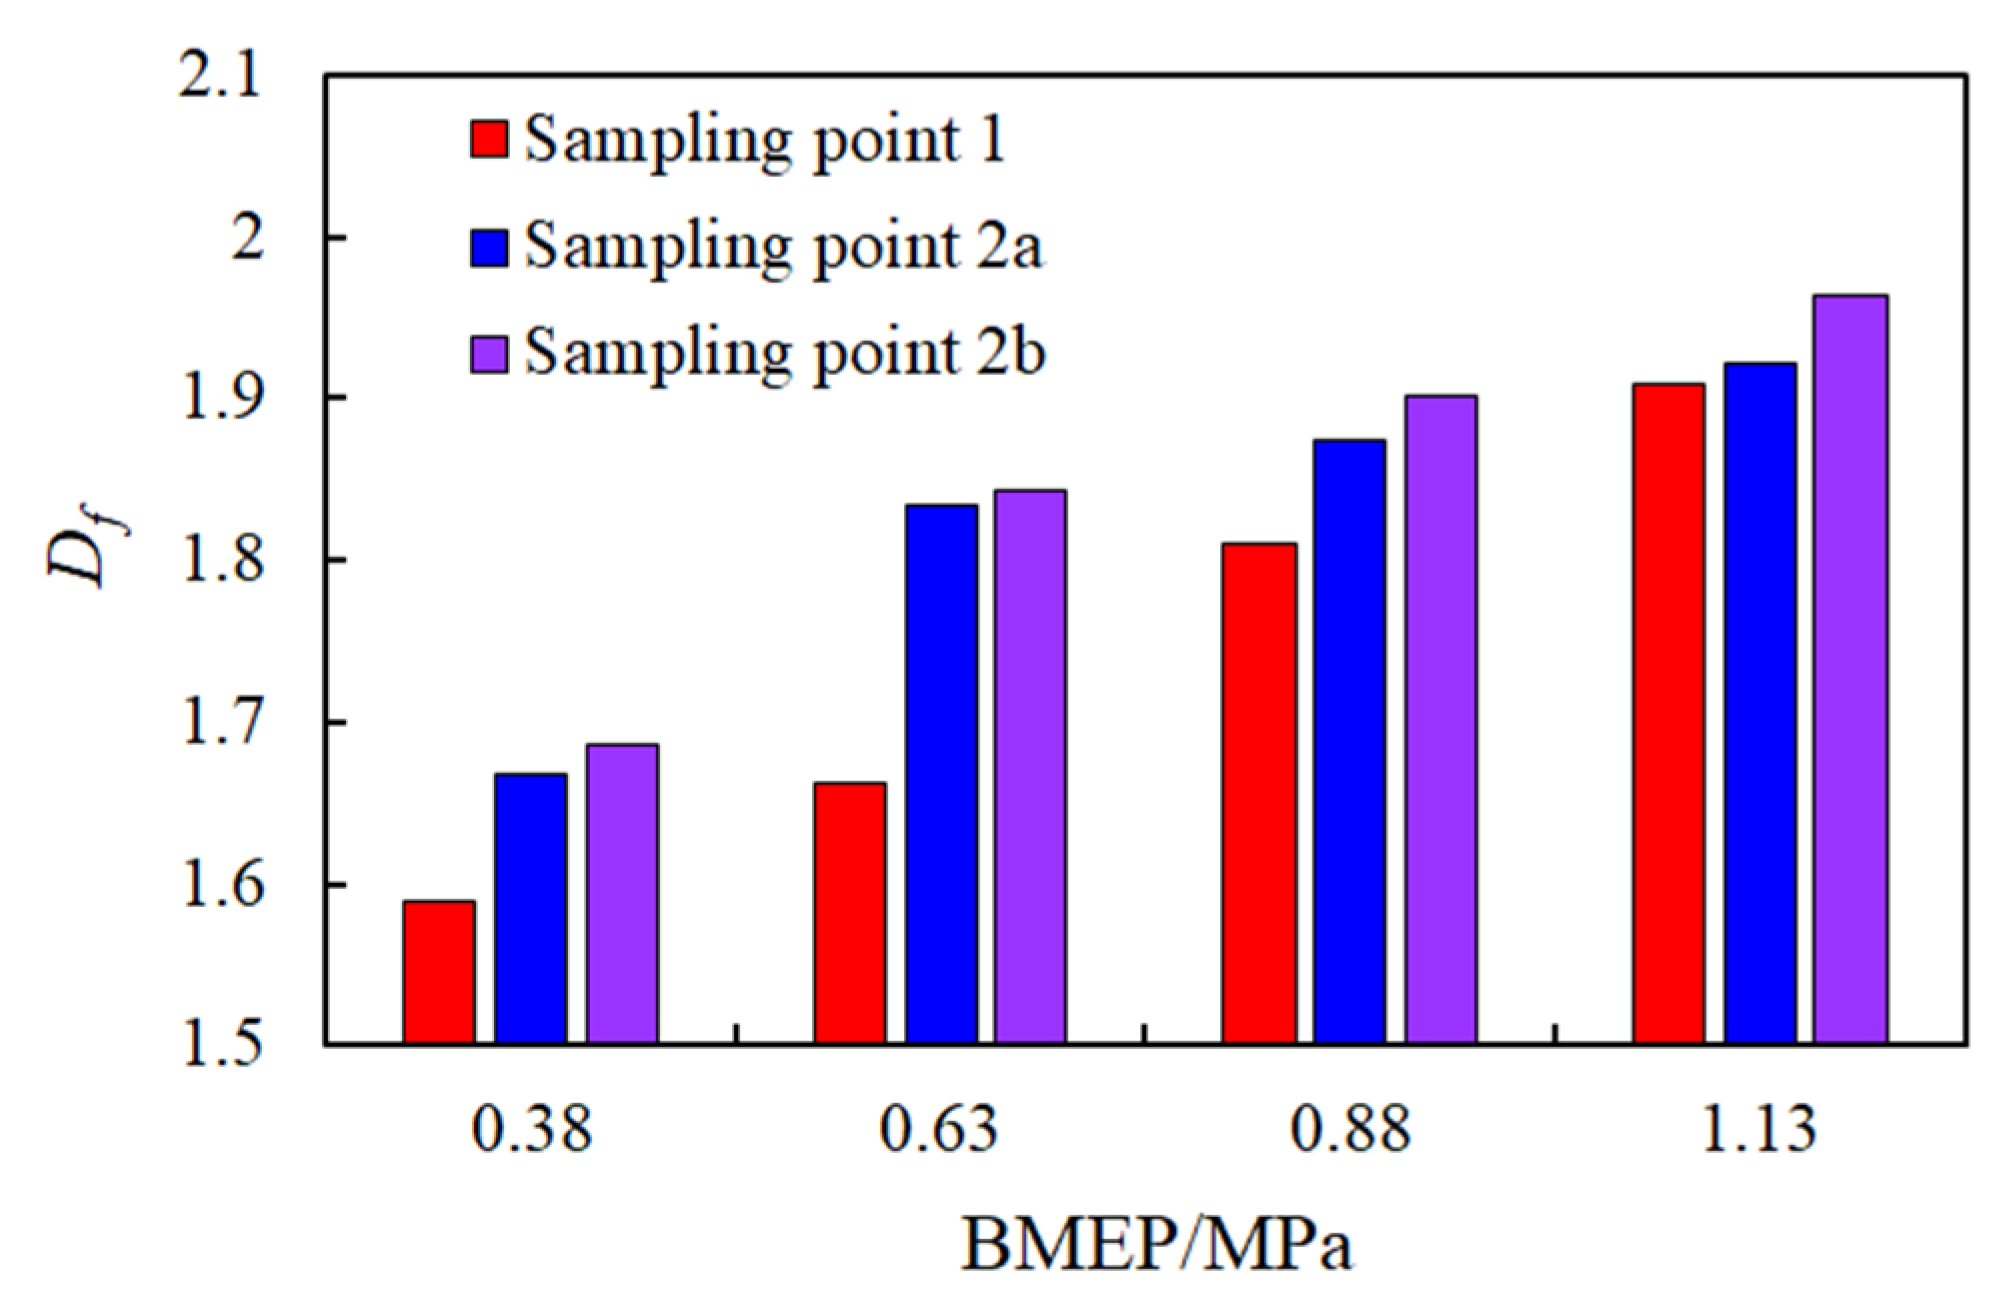
Figure 8.
Microstructures of primary soot particles at sampling points 2a and 2b.

Figure 9.
Schematic of micro-parameters of primary soot particles.

Figure 10.
Average Ds of primary soot particles at different loads.
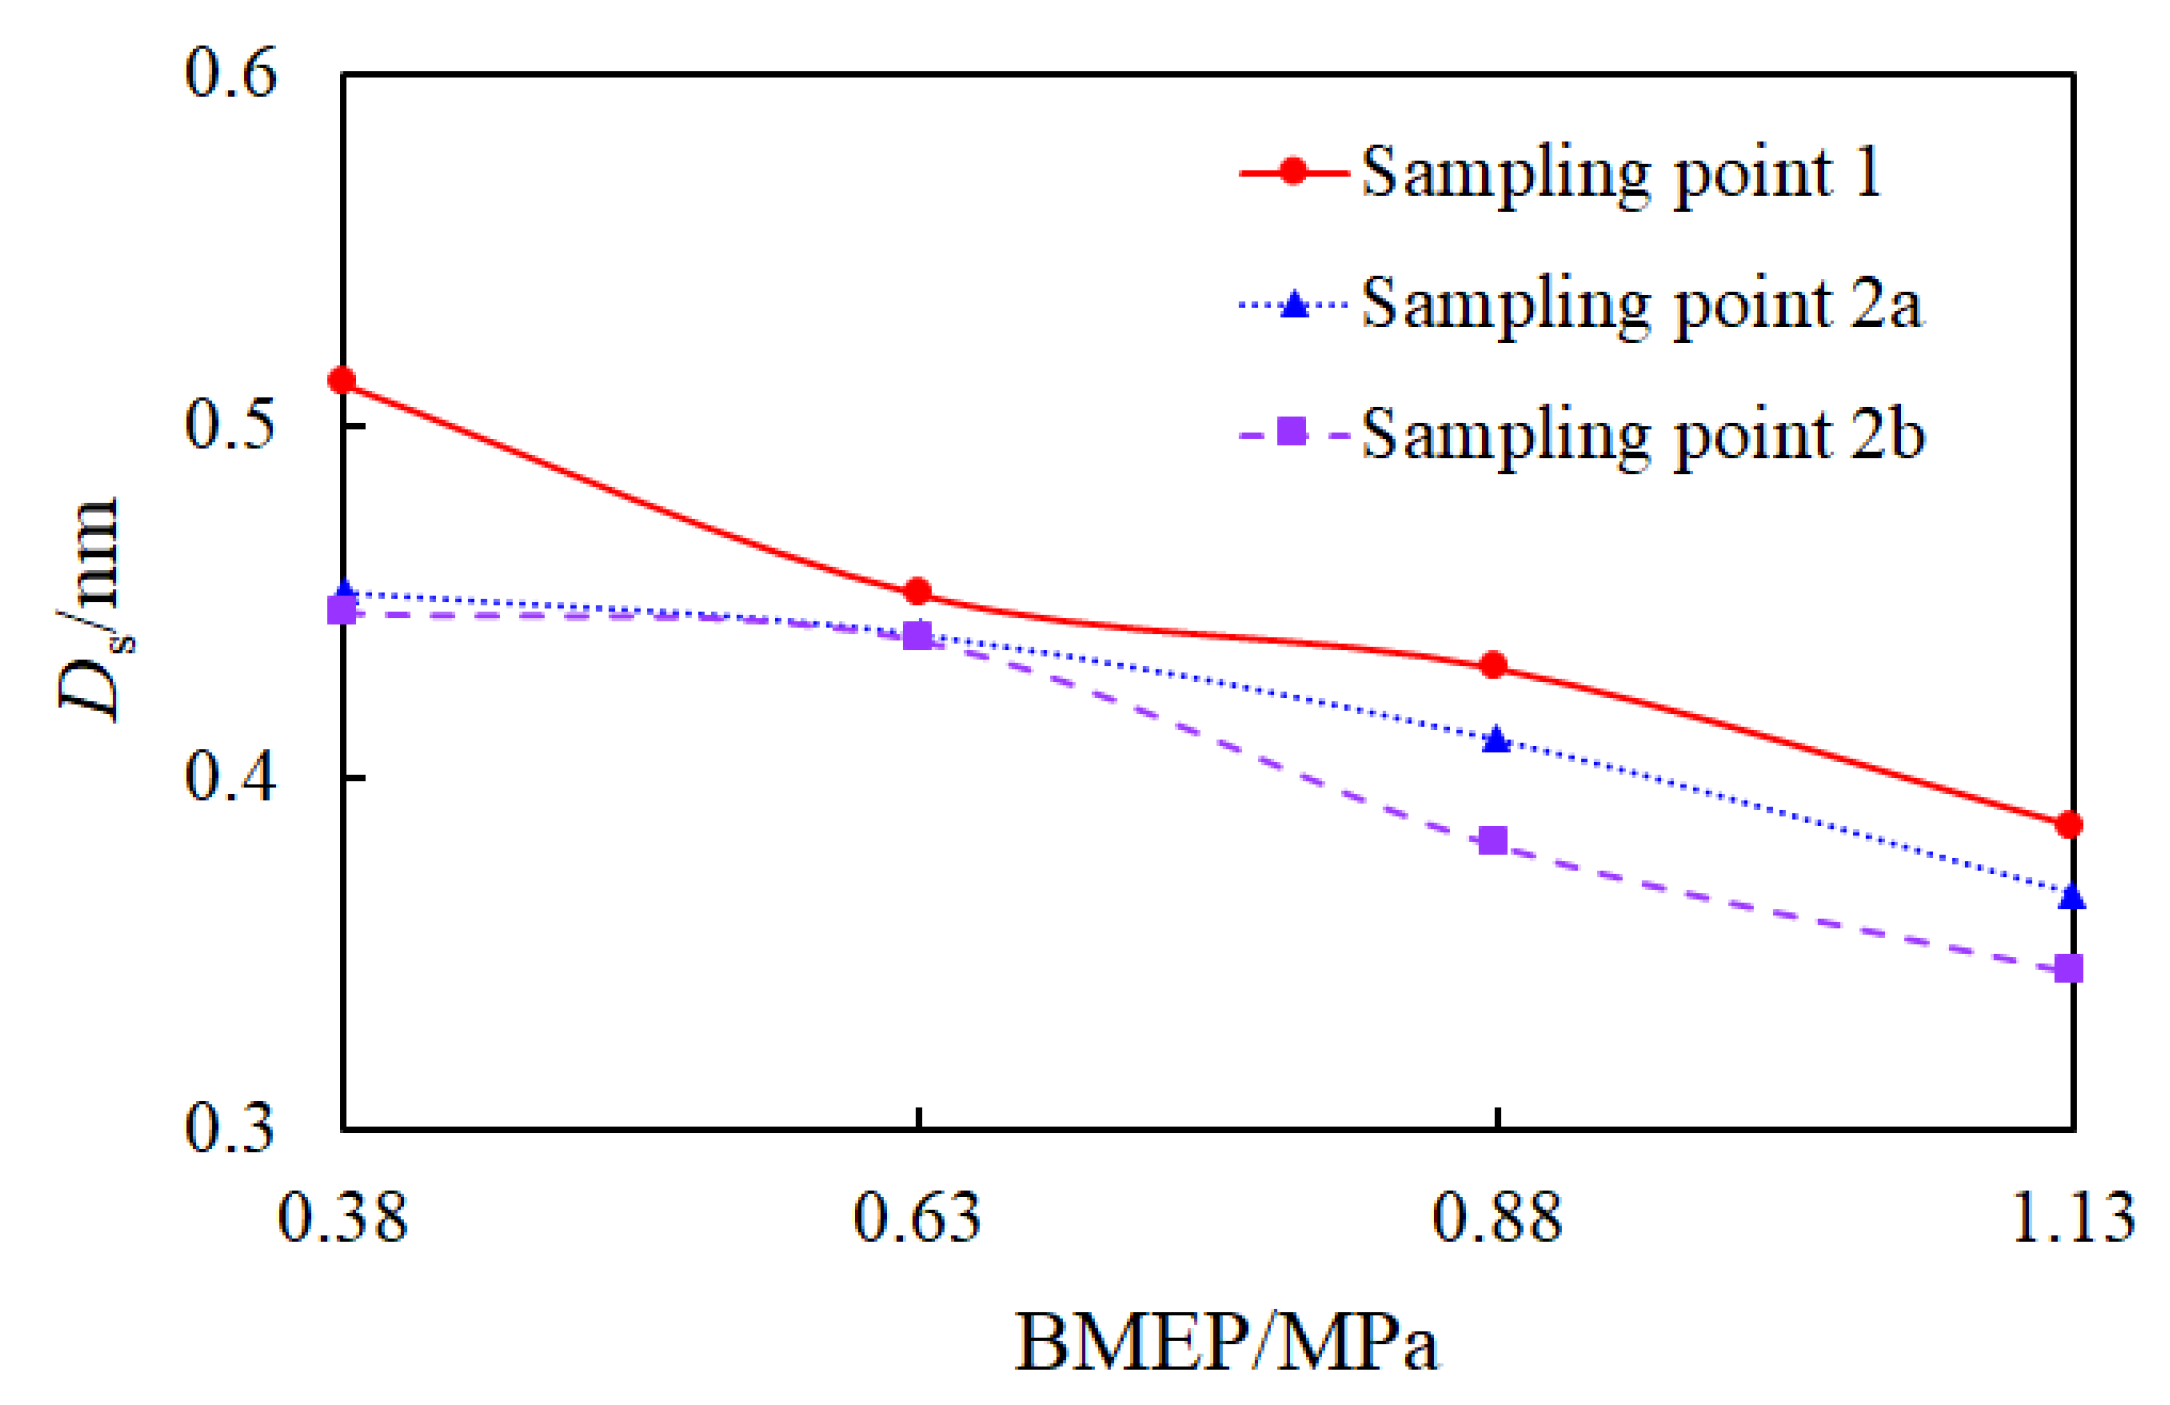
Figure 11.
Average Tf of primary soot particles at different loads.

Table 1.
Engine specifications.
| Characteristics | Value | Characteristics | Value |
|---|---|---|---|
| Type of engine | Four-cylinder, four-stroke | Displacement/L | 2.982 |
| Type of ignition | Compression ignition | Compression ratio | 17.5 |
| Initial injection | 7.5° CA BTDC | Rated power/kW | 85 |
| Bore/mm | 96 | Rated speed/rpm | 3200 |
| Stroke/mm | 103 | - | - |
Table 2.
Temperatures of different sampling points for different BMEPs.
| BMEPs /MPa | Temperature/°C | Temperature Rise Ratio (T2b − T2a)/T2a | Exhaust Gas Velocity /m·s−1 | ||
|---|---|---|---|---|---|
| Sampling Point 1 (T1) | Sampling Point 2a (T2a) | Sampling Point 2b (T2b) | |||
| 0.38 | 146.8 | 89.6 | 119.7 | 20.5% | 2.8 |
| 0.63 | 197.3 | 125.4 | 158.8 | 22.0% | 3.28 |
| 0.88 | 259.7 | 159.6 | 217.9 | 22.4% | 3.83 |
| 1.13 | 354.9 | 249.6 | 332.4 | 20.1% | 4.71 |
Disclaimer/Publisher’s Note: The statements, opinions and data contained in all publications are solely those of the individual author(s) and contributor(s) and not of MDPI and/or the editor(s). MDPI and/or the editor(s) disclaim responsibility for any injury to people or property resulting from any ideas, methods, instructions or products referred to in the content. |
© 2023 by the authors. Licensee MDPI, Basel, Switzerland. This article is an open access article distributed under the terms and conditions of the Creative Commons Attribution (CC BY) license (https://creativecommons.org/licenses/by/4.0/).
Share and Cite
MDPI and ACS Style
Ju, H.; Bian, F.; Wei, M.; Zhang, Y. Effect of Temperature on Morphologies and Microstructures of Soot Particles in the Diesel Exhaust Pipe. Energies 2023, 16, 5488. https://doi.org/10.3390/en16145488
AMA Style
Ju H, Bian F, Wei M, Zhang Y. Effect of Temperature on Morphologies and Microstructures of Soot Particles in the Diesel Exhaust Pipe. Energies. 2023; 16(14):5488. https://doi.org/10.3390/en16145488
Chicago/Turabian StyleJu, Hongling, Fanquan Bian, Mingrui Wei, and Yi Zhang. 2023. "Effect of Temperature on Morphologies and Microstructures of Soot Particles in the Diesel Exhaust Pipe" Energies 16, no. 14: 5488. https://doi.org/10.3390/en16145488
Note that from the first issue of 2016, this journal uses article numbers instead of page numbers. See further details here.