Article

Liquid Water Characteristics in the Compressed Gradient Porosity Gas Diffusion Layer of Proton Exchange Membrane Fuel Cells Using the Lattice Boltzmann Method

1
School of Automotive Studies, Tongji University, Shanghai 201804, China
2
School of Electrical Engineering & Automation, Harbin Institute of Technology, Harbin 150001, China
*
Author to whom correspondence should be addressed.
Energies 2023, 16(16), 6010; https://doi.org/10.3390/en16166010
Submission received: 26 July 2023 / Revised: 14 August 2023 / Accepted: 15 August 2023 / Published: 16 August 2023

Abstract

:
The mitigation of water flooding in the gas diffusion layer (GDL) at relatively high current densities is indispensable for enhancing the performance of proton exchange membrane fuel cells (PEMFCs). In this paper, a 2D multicomponent LBM model is developed to investigate the effects of porosity distribution and compression on the liquid water dynamic behaviors and distribution. The results suggest that adopting the gradient GDL structure with increasing porosity along the thickness direction significantly reduces the breakthrough time and steady–state total water saturation inside the GDL. Moreover, the positive gradient structure reaches the highest breakthrough time and water saturation at 10% compression ratio (CR) when the GDL is compressed, and the corresponding values decrease with further increase of the CR. Considering the breakthrough time, total water saturation and water distribution at the entrance of the GDL at the same time, the gradient structure with continuously increasing porosity can perform better water management capacity at 30% CR. This paper is useful for understanding the two–phase process in a gradient GDL structure and provides guidance for future design and manufacturing.

1. Introduction

Proton exchange membrane fuel cells (PEMFCs) have emerged as highly promising alternative vehicle power sources and attracted widespread attention owing to their notable strengths such as zero pollution, high energy density, and low noise [1,2,3,4]. As one of the essential components, the gas diffusion layer (GDL) plays the role of draining water out of the catalyst layer (CL) and providing enough gas pathways [5,6,7]. The large–scale commercialization of PEMFCs requires higher power and current densities [8,9]; however, at high operating current densities, the massive accumulation of liquid water in the GDL will lead to flooding and impede the gas diffusion, resulting in rapid degradation of cell performance [10,11]. Accordingly, improving the water management ability of GDL is imperative for pursuing better cell output performance.
Multiple visualization experiments have been carried out in order to comprehensively understand the transportation mechanism of liquid water inside the GDL. Combining in–situ radiography and tomography, Markötter et al. [12] observed that liquid water flow in an operating fuel cell is facilitated by the large pores in the GDL and cracks on the micro porous layer (MPL) that act as preferential pathways towards the flow channel (FC). Similarly, Deevanhxay et al. [13] observed the dynamic process of liquid water transporting from MPL cracks by using high–resolution soft X–ray imaging. Flückiger et al. [14] investigated the liquid water saturation in a Toray GDL utilizing X–ray tomography (XTM) and the results revealed that the liquid water transport process was significantly influenced by the capillary resistance of the GDL. Moreover, Ko et al. [15] observed and quantified the water content inside the GDL and at the GDL/FC interface using X–rays, and the results suggested that the liquid water inside the GDL increased at the beginning with the continuous production of water and, once the liquid water accumulated to a certain level, the internal water content remained constant. In addition, neutron radiography was also applied to reveal the water distribution inside the GDL [16,17]. It is evident that the transfer of liquid water through GDL microstructures is a complex process, and conducting experimental investigations to understand the underlying mechanisms can be both time–consuming and expensive. Therefore, in recent decades, there has been an increasing interest in utilizing modeling and simulation techniques to study multiphase flows.
In contrast to continuum–scale models [18,19], pore–scale models are outstandingly suitable for investigating the interaction between dynamic processes and microstructure since they directly resolve the microscopic structures of GDL [20]. Shahraeeni et al. [21] and Carrere et al. [22] developed pore network models (PNMs) to investigate the liquid water transport process inside the GDL, and considered the impacts of different flow patterns and working mechanisms, respectively. Niu et al. [23] further investigated the water dynamics and acquired the interface between liquid and air within the GDL by employing the volume of fluid (VOF) method. Additionally, Zhou et al. [24,25] utilized the VOF method to further examine the dynamic behavior of liquid water under the influence of compression and PTFE distribution.
In comparison with the above two methods, the lattice Boltzmann method (LBM) has earned increasing attention because of its numerical stability, applicability to large–scale parallelization, and applicability to arbitrary geometries [20,26,27,28]. Kim et al. [29] analyzed the distribution and transport process of liquid water considering the structure of MPL and GDL, and they observed that increasing the MPL thickness or enhancing the hydrophobicity of the solid surface led to a decline in liquid saturation. Jinuntuya et al. [30] investigated the liquid dynamic behavior among three GDL structures obtained from X–ray computed tomography (XCT), adopting a single–component two–phase Shan–Chen model, and the results indicated two different water transport behaviors within the GDL due to differences in contact angles, as well as the divergences in liquid flow trends under the individual structures. Furthermore, Deng et al. [31] proposed an enhanced stochastic model to generate a three–dimensional model containing the actual GDL and MPL structures and conducted a thorough investigation of the impact of MPL cracks on water transport and the redistribution of liquid water at the GDL/MPL interface; the findings demonstrated that the introduction of MPL reduced the incidence of water flooding. In addition, Sepe et al. [32] examined the impact of pore size on liquid water transport by utilizing XCT and concluded that the water saturation inside the GDL highly depends on its own geometry. It can be clearly derived that the structural properties of the GDL significantly affect interior water dynamics and distribution.
In practical applications, to prevent gas leakage and mitigate contact resistance, PEMFCs are commonly assembled with compressive loads, which lead to deformations in their microstructure and consequently affect the transport and distribution of water within the GDL [33,34]. Bazylak et al. [35] investigated the influence of compression on the transport of liquid water through GDLs utilizing fluorescence microscopy, and they suggested that the local hydrophilic pathways generated by the shedding of PTFE provide a preferential pathway for water drainage. Zenyuk et al. [36] tested the impact of compression ratio (CR) on water saturation under the ribs and flow channel using XTM and discovered that there were significant distinctions in local distribution of water at elevated compression levels. Further, Jeon and Kim [37] conducted a study on the influence of compression on liquid water transport by employing a two–phase Shan–Chen model and a simplified 2D GDL structure. The results revealed that low CR was favorable for water management, and once the CR was excessively increased, liquid films tended to form in the rib–channel interface, which inevitably retarded the gas transport, and the removal of liquid water became extremely difficult. Additionally, Moslemi [38] and Ira [39] demonstrated that compression certainly altered the breakthrough time and the dynamic behaviors of the water, respectively.
Additionally, it has been found that the inhomogeneous porosity distribution has a prominent impact on the liquid water behavior inside GDL [32,40]. Both experiments [41,42,43] and models [44,45,46,47] demonstrated that the gradient structure facilitates water transport and thus enhances output performance. Ko et al. [43] experimentally observed that the porosity gradient significantly promoted water drainage, and the output performance was also advanced by comparing the polarization curves. Shangguan et al. [40] reconstructed the three–dimensional GDL structure by employing the stochastic parameter method to explore the water behaviors inside the GDL under five diverse porosity distributions by VOF model. Yang et al. [48] built a 2D GDL model based on experimental data and demonstrated that the porosity distribution has a profound impact on the dynamic behavior of water within the GDL. Habiballahi et al. [49] developed a 2D model of a cathode GDL with varying linear porosity gradients to simulate the liquid water invasion process. The results demonstrated that a positive through–plane (TP) porosity gradient is crucial for enhancing water management capability in the GDL. Moreover, by proposing a pore–scale model based on the LBM method, Guo et al. [50] investigated the impact of porosity distribution on water saturation, oxygen concentration and current density, and found that a gradual increase in porosity from the bottom of the GDL to the top of the GDL can effectively diminish water saturation at both the inlet region and the entire model, and consequently acquired higher current density.
Based on previous literature, it can be found that the LBM method has been broadly used in two–phase studies of GDL and is highly suited to further investigate the effects of structural changes in GDL. However, there is still a lack of sufficient reports on the impact of diverse gradient distribution of porosity with respect to the thickness direction, as well as on the variations of liquid water dynamic migration processes inside GDL for different gradient porosity structures at certain CR. Accordingly, in this paper, a two–dimensional model combining GDL and FC is reconstructed under several reasonable assumptions, whose porosity distribution can be devised as homogeneous, positive gradient and negative gradient structure using homemade code. In the meantime, a 2D two–phase multicomponent LBM model is established to explore the impact of porosity distribution under various compression ratios on liquid water dynamics and distribution.

2. Methods

2.1. LBM Model

The present investigation utilizes the pseudopotential multicomponent model with D2Q9 scheme, employing the single relaxation time collision operator (commonly known as BGK model) to establish a 2D lattice Boltzmann method (LBM) model for simulating liquid–air two–phase flow within a 2D computational domain. The density distribution function evolution equation for various fluids is presented as follows:
f i k ( x + e i Δ t , t + Δ t ) = f i k ( x , t ) 1 τ k [ f i k ( x , t ) f i k ( eq ) ( x , t ) ]
where k represents the kth component (1 is assigned to liquid phase and 2 is designated for gas phase) and e i is the discrete velocity in the ith direction, which is defined in D2Q9 model as:
e i = { ( 0 , 0 ) i = 0 c ( cos [ π 2 ( i 1 ) ] , sin [ π 2 ( i 1 ) ] ) i = 1 , 2 , 3 , 4 2 c ( cos [ π 2 ( i 1 ) ] , sin [ π 2 ( i 1 ) ] ) 2 i = 5 , 6 , 7 , 8
τ k denotes the dimensionless relaxation time, calculated by:
τ k = ν k c s 2 Δ t + 1 2
where ν k represents the kinematic viscosity, Δ t denotes the time step, c s is the lattice sound speed and c s 2 equals to ( 1 / 3 ) Δ x 2 / Δ t 2 . Additionally, Δ x is the lattice unit.
The equilibrium distribution function, denoted as f i k ( eq ) , is defined as:
f i k ( eq ) = w i ρ k [ 1 + e i · u eq c s 2 + ( e i · u eq ) 2 2 c s 4 u eq 2 c s 2 ]
where w i is called weight factor and equals to 4/9 for i = 0 , 1/9 for i = 1 4 and 1/36 for i = 5 9 , respectively. The equilibrium velocity u eq is determined as:
u eq = ρ k u + τ k F k ρ k
The average velocity of different components (liquid phase and gas phase) u is defined as:
u = k ρ k u k / τ k k ρ k / τ k
F k represents the force term, which is utilized to describe the muti–phase flow in porous medium, is presented as:
F k = F coh k + F ads k
where F coh k is the cohesion acting on various fluid components, and F ads k is the interaction force between fluid and solid phases. These two forces are denoted as follows:
F coh k = ψ k ( ρ k ( x ) ) x k G kk ( x , x ) ψ k ( ρ k ( x ) ) ( x x )
F ads k = ψ k ( ρ k ( x ) ) x G s ( x , x ) s ( x ) ( x x )
where ψ k ( ρ k ( x ) ) denoted the effective mass (also called pseudopotential), which is described as a function of density, and is equal to ρ k ( x ) in this work. The coefficient G kk ( x , x ) determines the intensity of interaction between the two fluids. G s ( x , x ) represents the solid–fluid interaction strength. Therefore, the surface tension and various contact angles can be attained by adjusting the above parameters appropriately. s ( x ) is an indicator function that takes the value of 0 for fluid nodes and 1 for solid nodes.

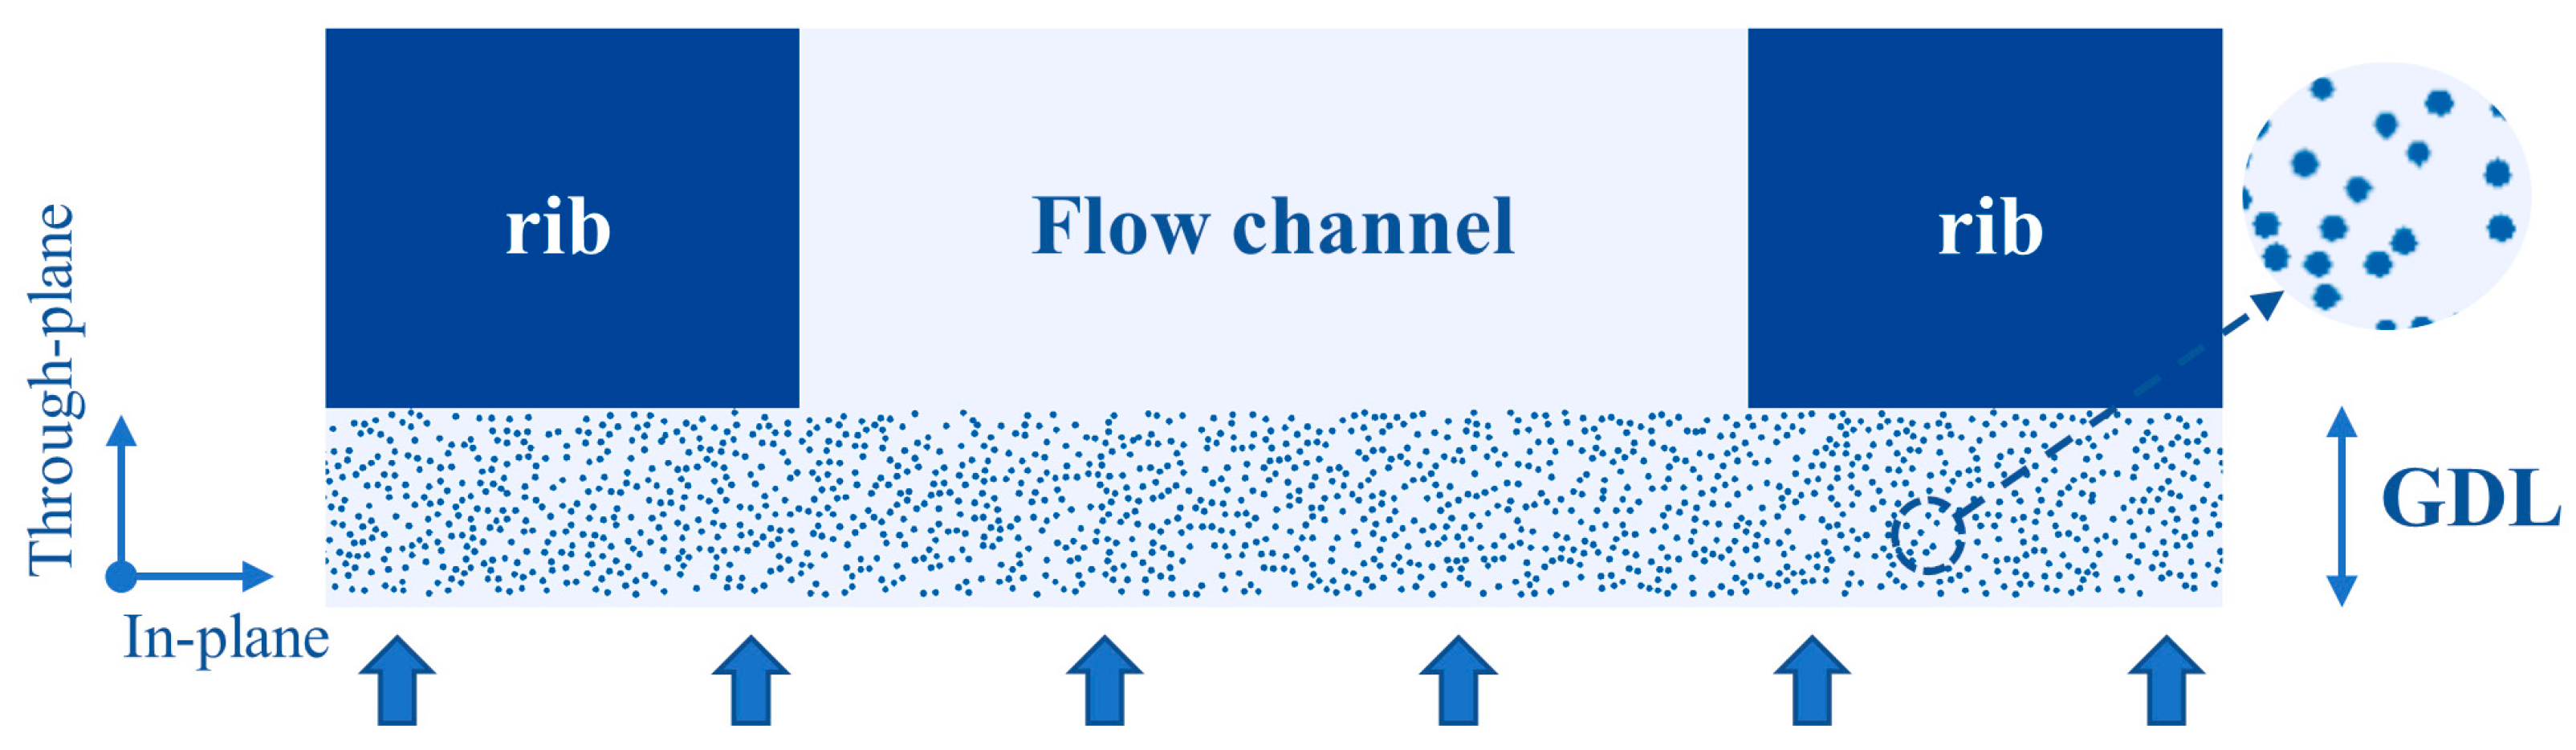
2.2. Computational Domain and Boundary Condition

Since the 2D computation domain could significantly save computing resources while accurately reflecting the structure of GDL and FC, a 2D model is employed in the following research. The rebuild of the computational domain is established on the following premises:
  • As the GDL beneath the channel does not have direct contact with the bipolar plate, the porosity change after compression in that region has not been included in the analysis [37,48]; however, the microstructure changes of GDL intruded into the channel are considered [51];
  • Under the compression of the flow–field plate, the strain in the GDL only occurs in the TP direction. Previous studies have indicated that the Poisson’s ratio of GDL in the TP direction is negligible [52,53];
  • According to previous research [54], compression affects only the pore volume of the GDL, while the volume of the GDL fiber remains unchanged. As a result, the correlation between compression ratio and porosity is derived as follows:
ε comp = ε CR 1 CR
where the ε is the initial porosity, CR represents the compression ratio (which is calculated as the ratio of GDL thickness before and after compression), and ε comp means the porosity after compression. Furthermore, to realize the variation of porosity across the TP direction, the GDL is divided into 24 layers in this work, and the correlation between the overall porosity and local porosity is built as:
ε total = 1 N i = 0 i = N ε i
where ε total represents the total porosity of the GDL, e i denotes the porosity of the ith layer, and N means the total layer number of GDL.
According to the above assumptions, the complete computation domain is built as shown in Figure 1. The rectangular domain consists of the buffer zone, GDL, FC and two ribs with dimensions of 2000 lu × 610 lu (lattice unit). The height of the buffer zone, GDL and the channel are 10 lu, 200 lu and 400 lu, respectively. The width of the channel and a single rib are 1000 lu and 500 lu. The GDL fiber possesses a diameter of 8 lu. The total average porosity is 0.8. To model the process of liquid water invasion within the GDL, the inlet boundary at the bottom side is subjected to the Zou–He velocity boundary, and the water generation velocity is maintained at 1.0 × 10⁻⁴ lu, and the value corresponding to the real unit is 2.184 × 10⁻⁴ m/s [44]. Moreover, the top boundary is configured as an outflow boundary, while the remaining sides exhibit periodic boundaries. Additionally, the bounce–back boundary is implemented to all solid surfaces.

2.3. Numerical Procedure

The infiltration of liquid water inside the GDL performs the characteristic capillary fingering process, which can be characterized by three dimensionless quantities: Reynolds number, capillary number and Bond number. The Reynolds number Re = ud / ν ( u , ν and d are velocity, the fluid kinematic viscosity and pore diameter, respectively), expressing the proportion of inertial force relative to viscous force, is equal to 0.06 in the model. The Capillary number Ca = u μ / γ ( μ and γ represent the fluid dynamic viscosity and surface tension, respectively), denoting the proportion of surface tension with respect to viscous force, equals 5.2 × 10⁻⁵ under the simulation condition, which closely resembles the actual capillary number (10−9–10−6) in GDL. And the Bond number Bo = g Δ ρ d 2 / γ (g and Δ ρ represent the acceleration of gravity and density differential between liquid and gas, respectively), signifying the relationship between gravitational and surface tension, exhibits on the order of 10−5. Accordingly, it can be deduced from the analysis of dimensionless numbers that surface tension exerts a predominant influence on the simulation of flow within a porous medium. In addition, to specify the initial liquid and gas density fields, values of ρ liquid = 1 and ρ gas = 10 8 are assigned in the buffer zone, while the corresponding values are set vice versa in the void region.
In the present study, dimensionless lattice units are commonly employed for the conduction of LBM simulations, which can subsequently be converted to their corresponding physical units through the application of several conversion factors. To differentiate between physical and lattice units, the subscripts P and L are employed, respectively. Accordingly, to calculate the length scale C l = Δ x P / Δ x L , three distinct resolutions are adopted in the mesh independence test, which are 1 lu = 0.5 μm, 1 lu = 1 μm and 1 lu = 2 μm. And the results demonstrated that the resolution of 1 lu = 1 μm can meet the requirements of accuracy and computation resources and, therefore, C l equals to 1 μm. Moreover, since the PEMFC normally operates at 353 K, the properties of water including density, kinematic viscosity and surface tension at 353 K are utilized in the simulation, which are 978.1 kg/m3, 3.64 × 10⁻⁷ m2/s and 0.06257 N/m, respectively. The time scale can be calculated as C t = c s 2 ( τ 0.5 ) C 1 / ν p , since the relaxation time τ is set to 1.0 in the model, C t equals to 4.5788 × 10⁻⁷ s.
Additionally, in the present study, water saturation is characterized as the ratio of liquid water volume relative to the total pore volume within the GDL, both quantities can be derived through directly quantifying the regions occupied by liquid water and the entire pore space within the GDL model. In addition, to determine steady–state conditions for the flow of liquid water, a total saturation variation of less than 0.001 over a time period of about 100,000 lattice steps was specified as the criterion. To reduce the impact of random error arising from the regenerated computational domain, each case was reconstructed a minimum of five times. The self–developed LBM code is written in C++, and OpenMP is used to realize the remarkable parallelism between muti–processors. The computational cost for each LBM model is approximately 25 h on 64 Intel Xeon @2.1 GHz processors.

3. Results and Discussion

3.1. Model Validation
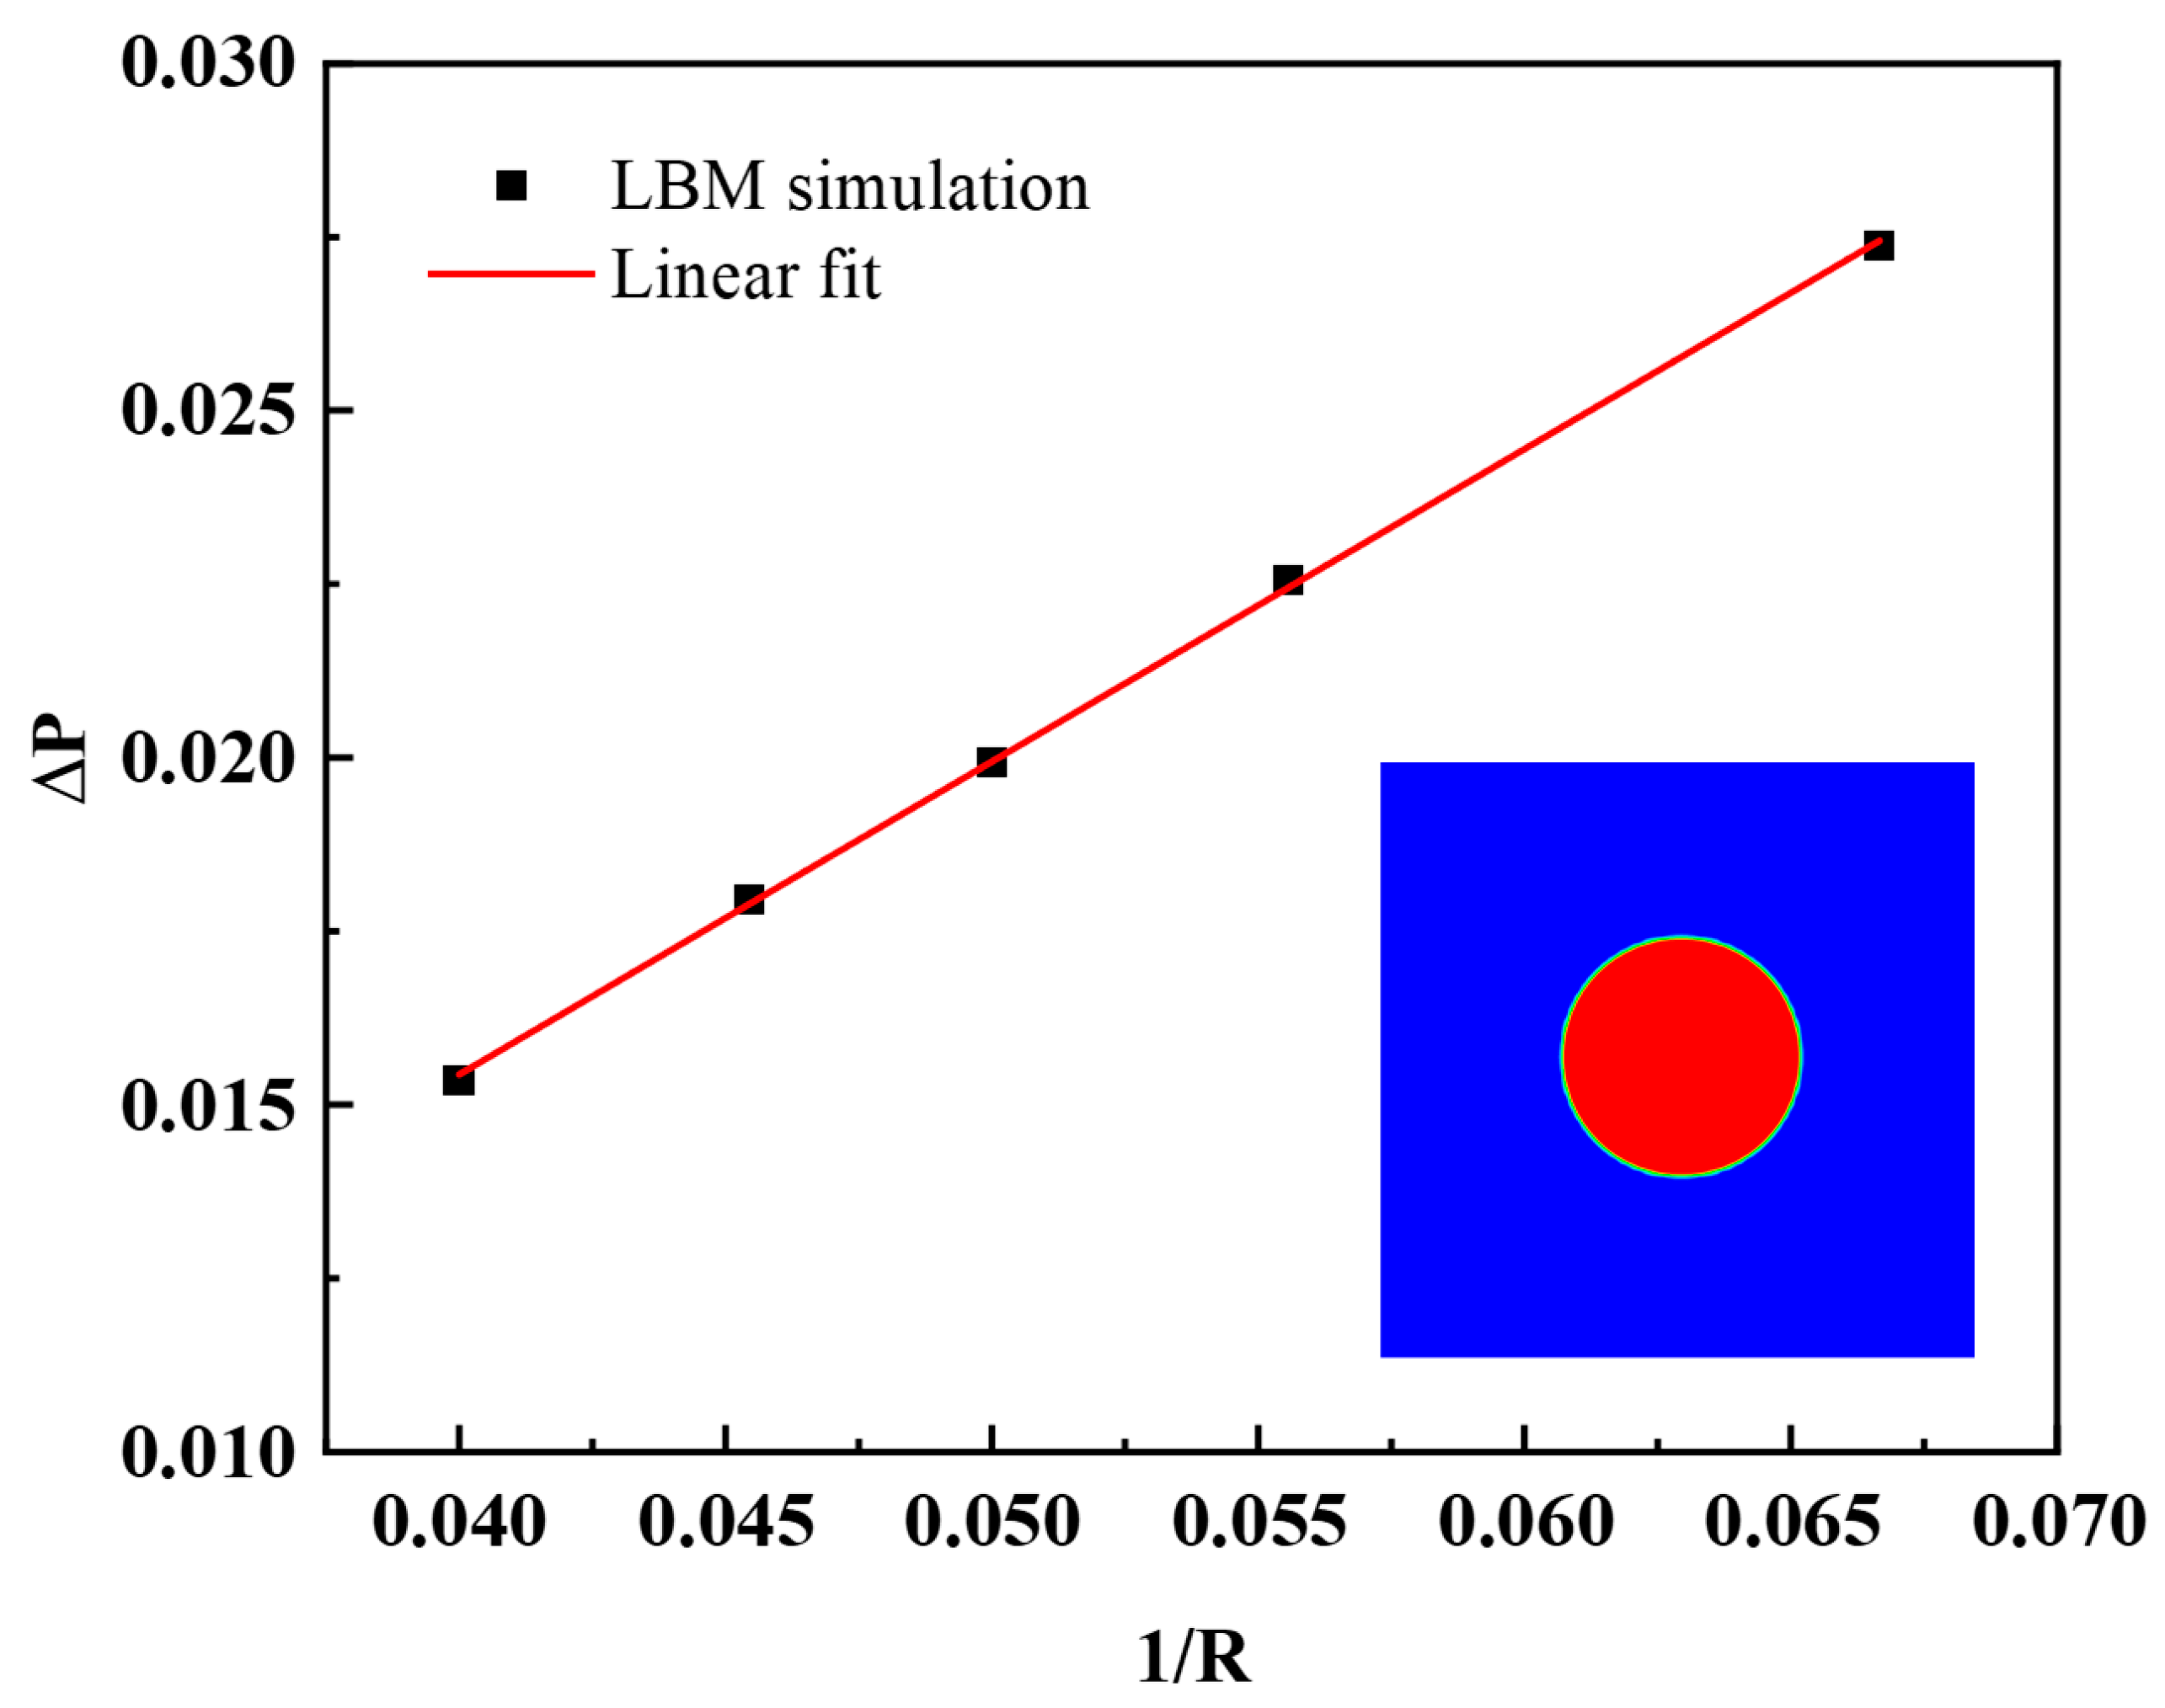
In this section, to further validate the developed LBM model, the Laplace test and static droplet contact angle test are performed, respectively.

3.1.1. Laplace Test

The Laplace test is principally associated with phase separation and the interplay between liquid and gas, leading to the emergence of surface tension. In accordance with Laplace law, the pressure differential Δ P across a droplet varies directly with the surface tension γ and inversely with the bubble’s radius R, as described by the following equation:
Δ P = γ R
Initially, a droplet of circular configuration possessing a particular radius is located at the center of a lattice domain comprising 100 × 100 lattice units. The density of the liquid phase within the droplet is established at 2, while that of the gas phase is set to 1 × 10⁻⁵, and conversely outside the droplet. Moreover, the parameter G kk = G k k = 0 . 2 is carefully adjusted to ensure a clear demarcation between the gas and liquid phases. Figure 2 depicts that the modification in pressure differential is linearly dependent on 1/R, which evidently concurs with the Laplace equation.

3.1.2. Static Contact Angle Test

The contact angle is a crucial parameter in the context of multiphase flow, exerting a notable impact on the flow pattern within the porous medium. In this investigation, the equilibrium contact angle simulation of a semicircular droplet placed on a uniform horizontal solid wall is conducted. Once the droplet reaches a static state above the horizontal surface, it attains an equilibrium state with an unaltered shape owing to the impact of surface tension, as depicted in Figure 3. The contact angle is evaluated using the methodology proposed in ref [50]. A contact angle θ less than 90° indicates a hydrophilic solid surface, while it implies a hydrophobic surface vice versa. In addition, the fluid–fluid interaction coefficient remains fixed at 0.2, while the interaction strength between the fluid and solid varies between −0.06 to 0.08.
The findings are presented in Figure 3. The segment highlighted in red signifies the liquid droplet, while the blue region represents the gas phase. By specifying Gs, diverse levels of solid surface wetting (or non–wetting) characteristics can be attained.

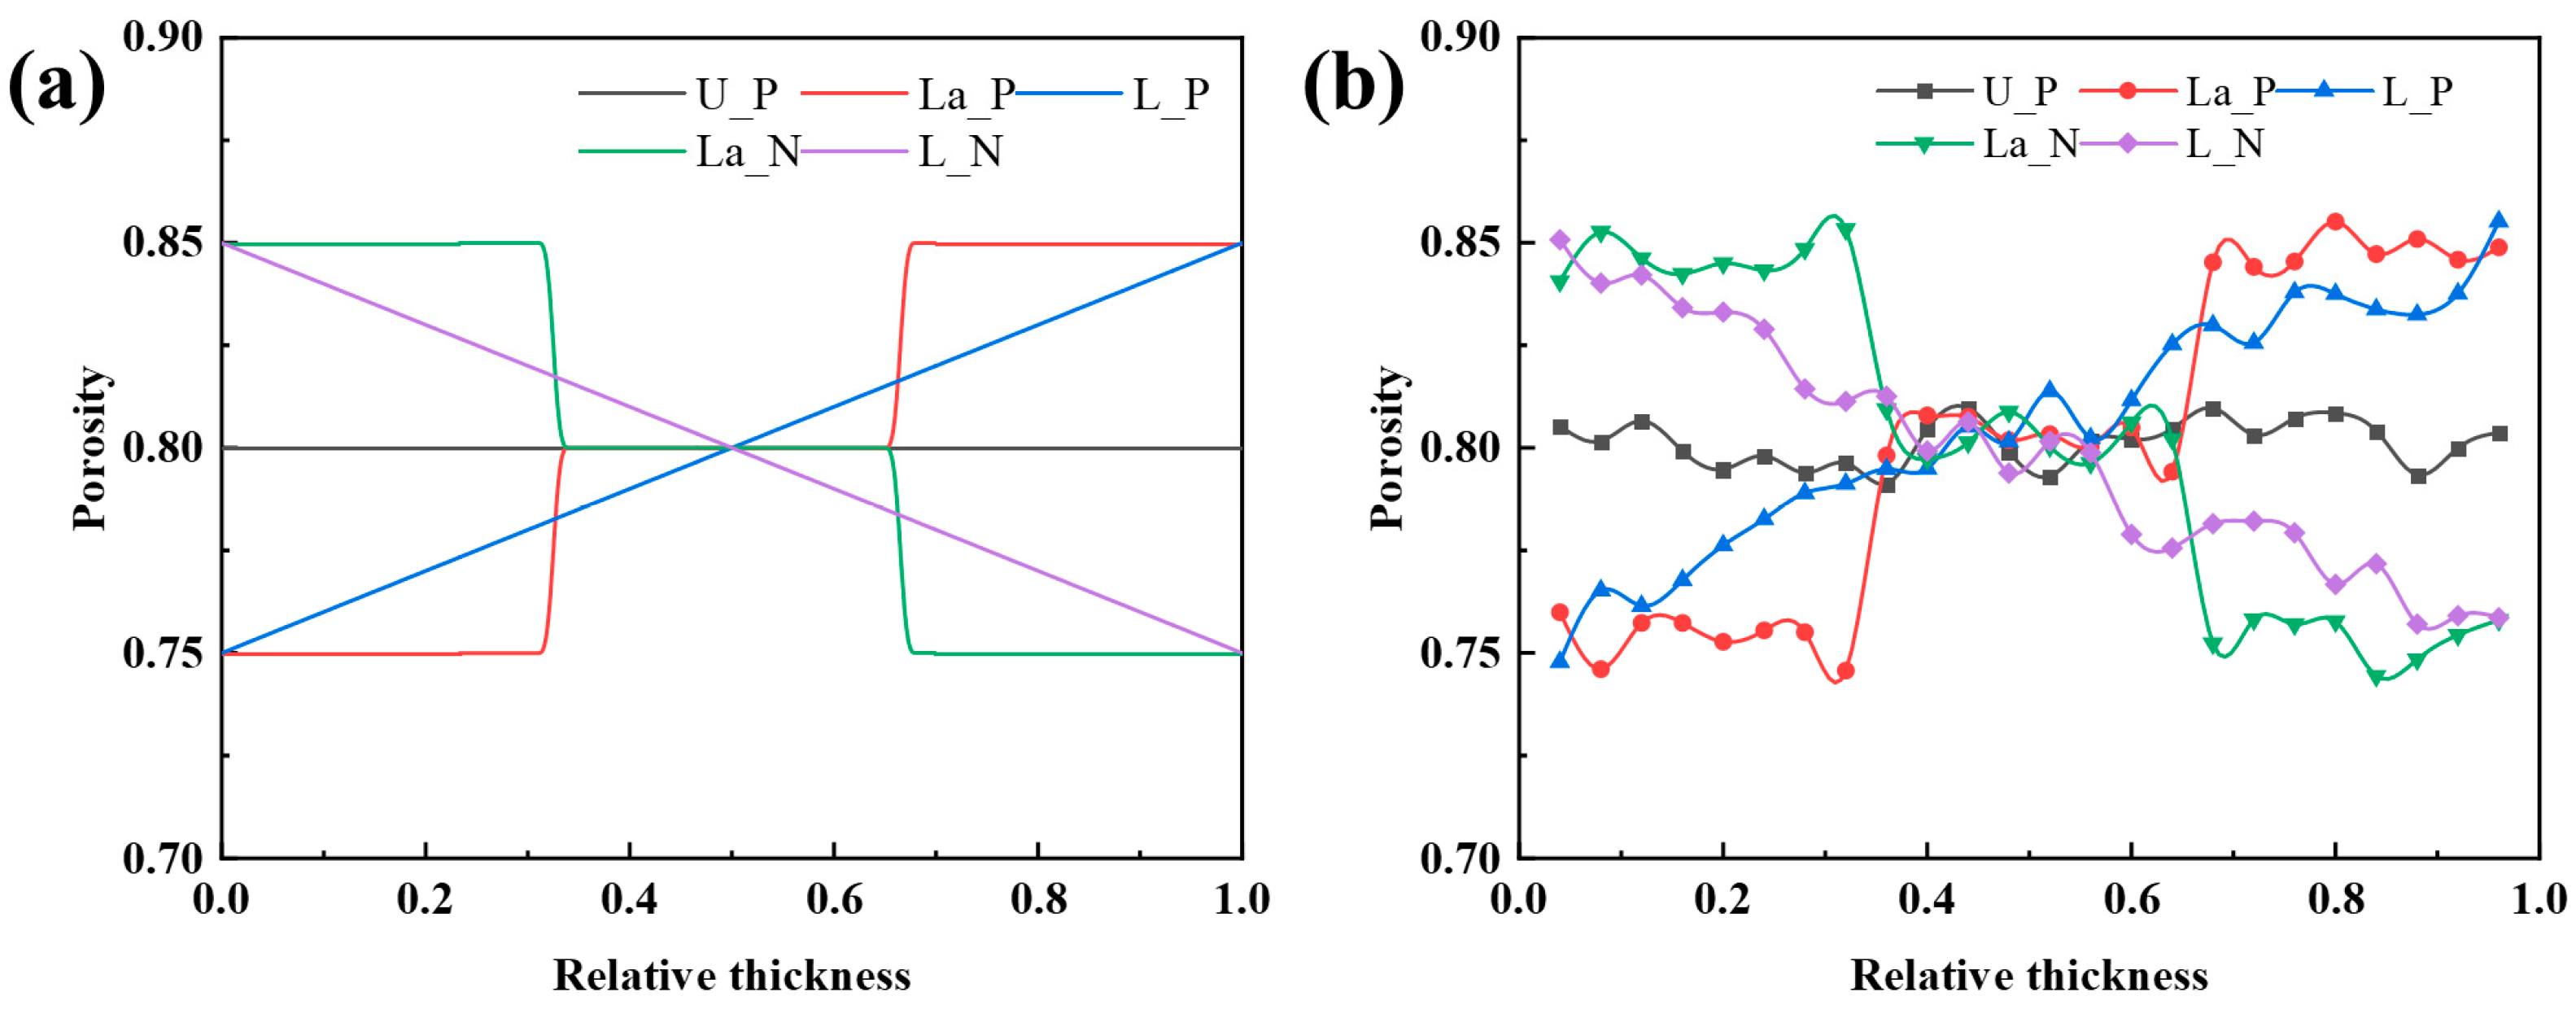
3.2. Effects of Porosity Distribution

In this section, effects of different porosity distributions on the liquid water dynamic behaviors and saturation are investigated. Five different porosity distribution structures were designed as illustrated in Figure 4a,b. The uniform porosity GDL (U_P) is defined as the porosity with respect to the TP direction that remains constant, while the gradient porosity is divided into layered and linear structures. The layered structure is composed of three parts with different porosity, which either increases or decreases along the TP direction, marked with La_P and La_N, respectively. Particularly, the linear structure increases or decreases continuously from the CL/GDL interface to that of the GDL/FC, denoted as L_P and L_N, respectively. In addition, for a better follow–up study, the uncompressed GDL model is used in this section, and the porosity distributions under the rib and under the flow channel are kept consistent. The total average porosity of all three structures was 0.8, and the contact angle was set to 120° in all subsequent studies.

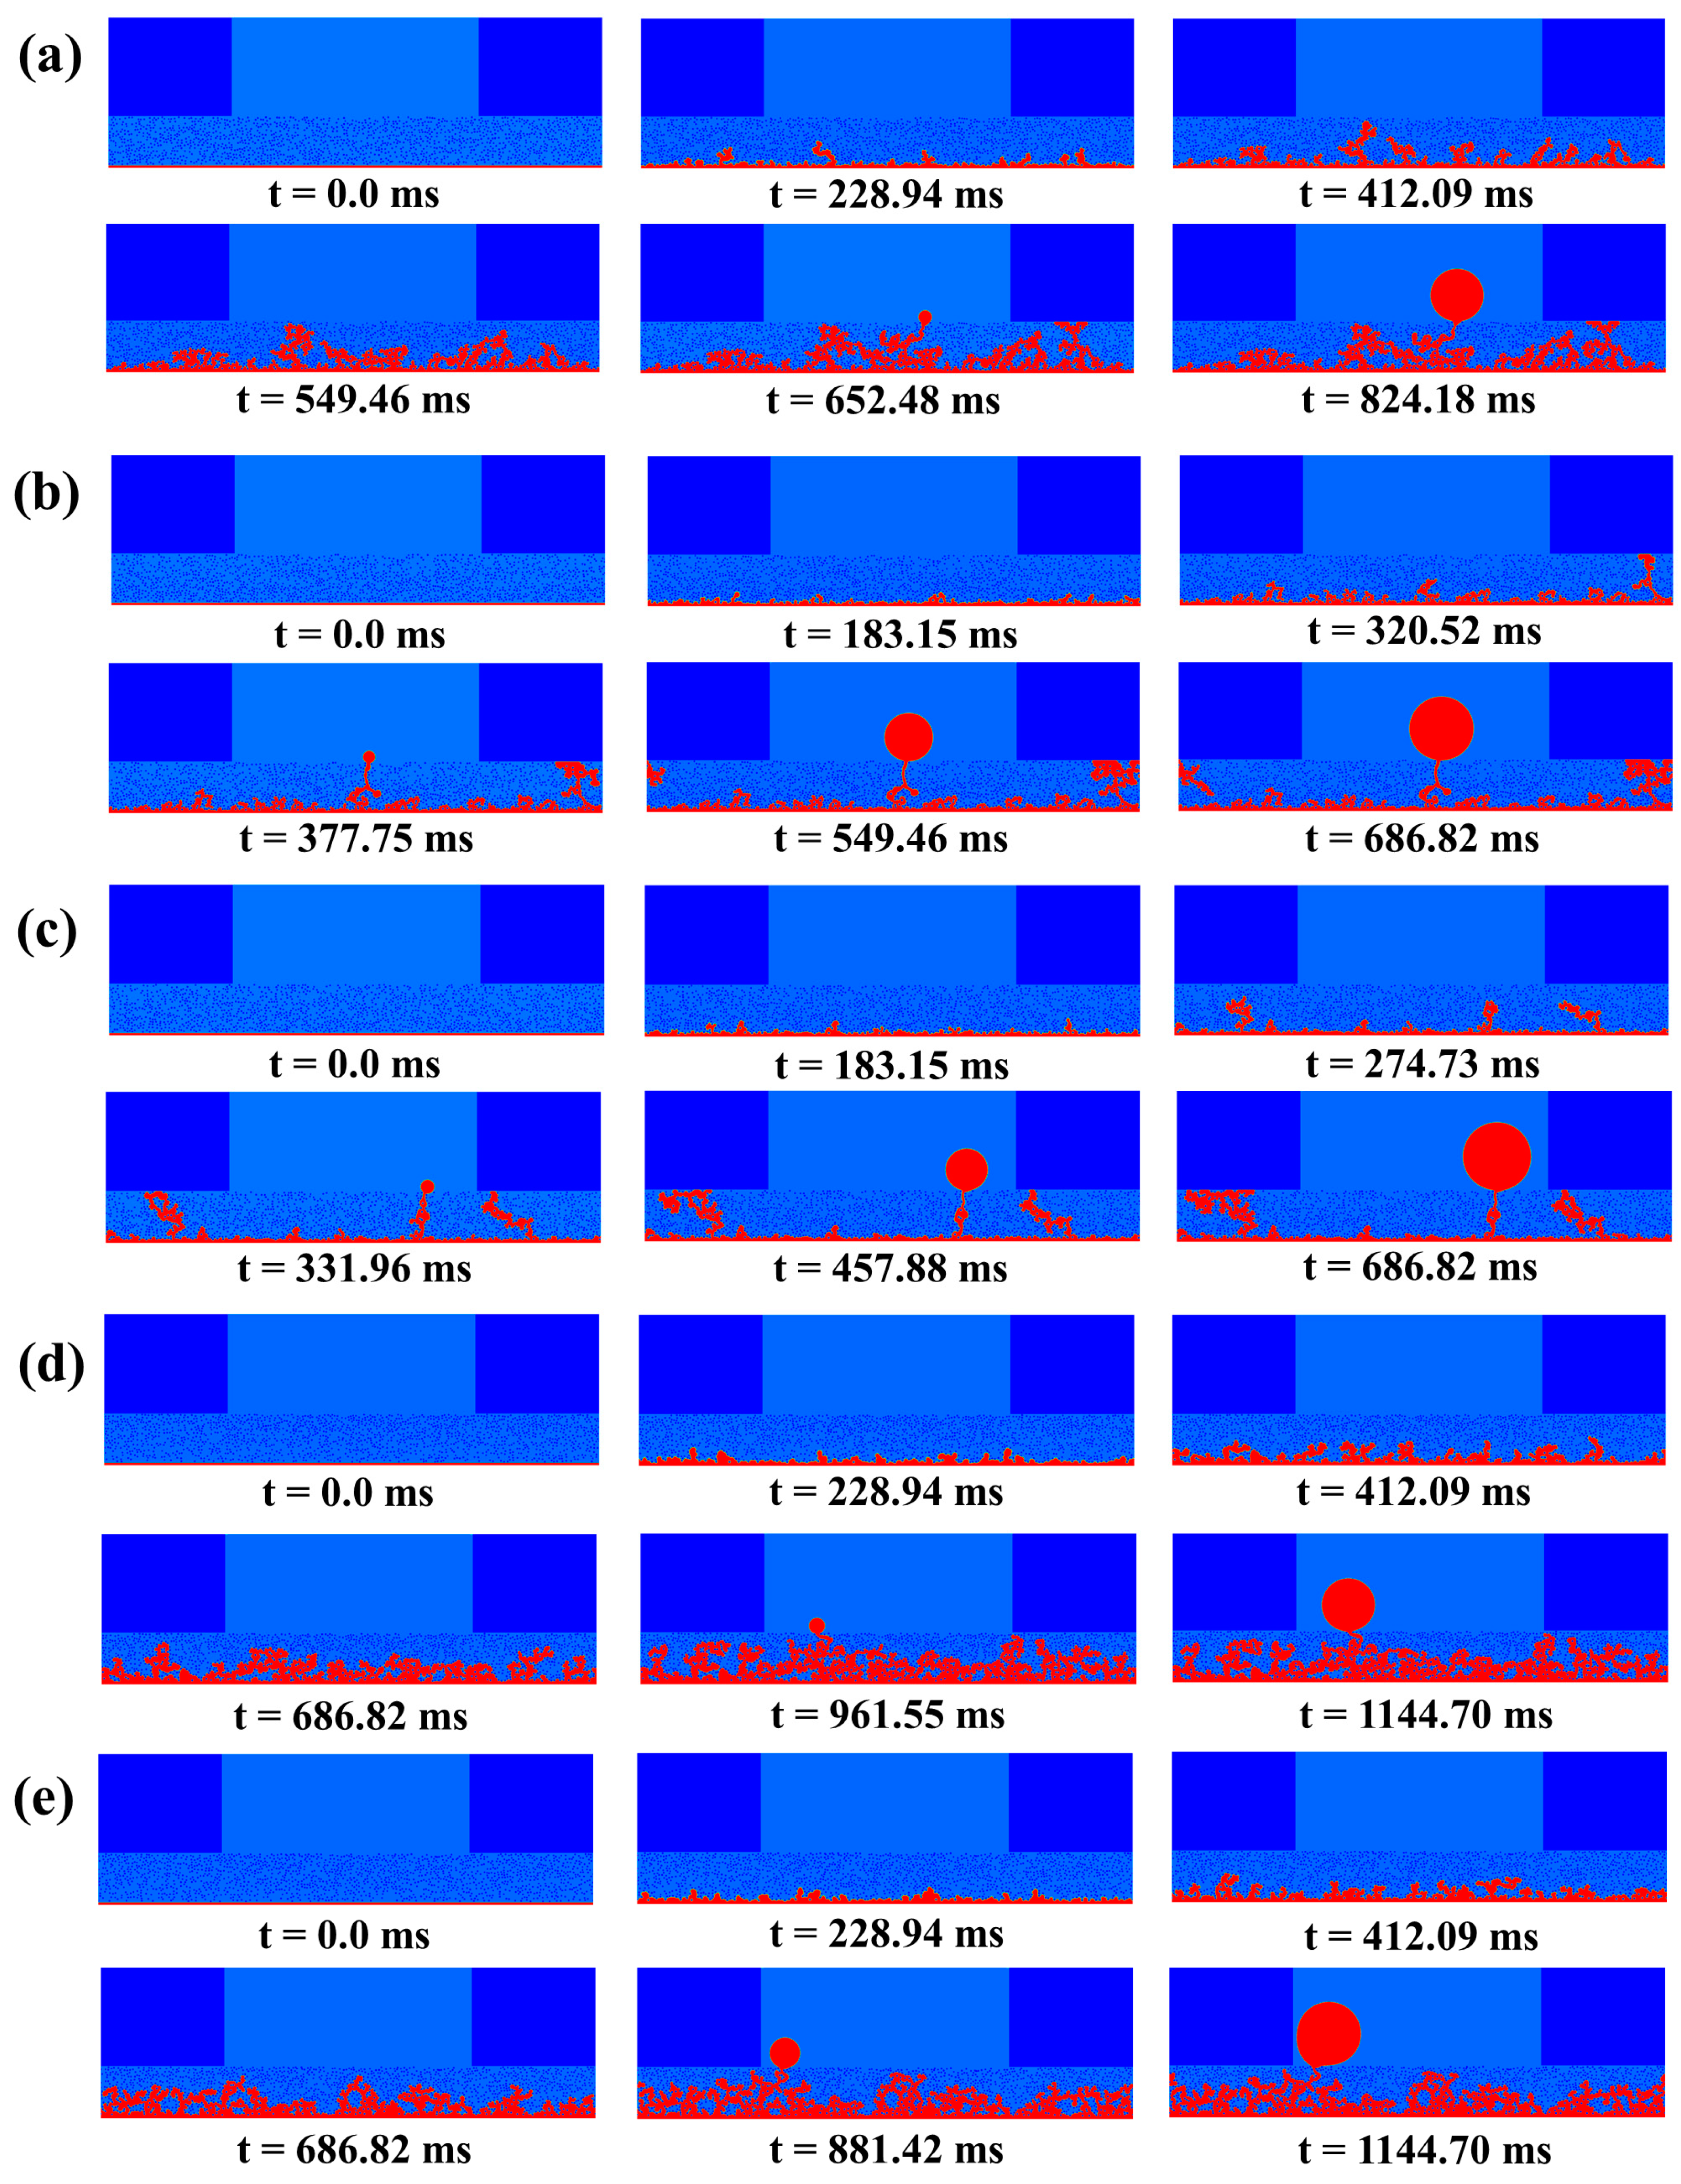
3.2.1. Liquid Water Dynamic Behaviors

Figure 5a–e illustrates the liquid water dynamic process corresponding to five different porosity distributions at a contact angle of 120°. To begin with, for the U_P case depicted in Figure 5a, as time advances, the liquid water in the buffer region gradually intrudes into the GDL, where a characteristic capillary fingering process can be observed [55]. Since the pores with low capillary resistance are easier to invade, the liquid will migrate along both through–plane (TP) and in–plane (IP) directions. Accordingly, as the picture shows, although there exists several water clusters that have nearly reached the top region of GDL, water breakthrough does not occur until a suitable path is found at 1,425,000 lattice steps (652.48 ms) after a large number of non–ideal movement of liquid. Thereafter, a droplet formed by liquid accumulation at the GDL/FC interface is identified and grows larger over time. Additionally, in uniform structure, as the effective flow path forms, water will preferentially invade through this path, and the water saturation and distribution inside GDL gradually stabilizes.
In contrast to the uniform porosity structure, the water dynamics in gradient structure shown in Figure 5b–e also exhibits an evident capillary fingering pattern, yet the corresponding water distribution differs significantly due to the capillary pressure gradient [41,56] induced by the variation of porosity in the TP direction, which could guide and accelerate the invasion of liquid water in positive gradient cases, and the opposite is true in the negative gradient structures. On the one hand, for the La_P case, as the bottom layer has a porosity of 0.75 and thus performs relatively higher capillary resistance, the number of water clusters including those in this region and penetrating to the middle region is notably less than that in the uniform structure. At 825,000 lattice steps (377.75 ms), water rapidly breaks through the GDL due to the reduction of capillary resistance in the upper region. Moreover, it is worth noting that due to the sudden increase in porosity at the interface between different parts of the La_P structure, as shown in Figure 5b, once entering the higher part, the liquid water flowing out of the lower part in the GDL tends to move along the IP direction due to the sudden decrease in capillary resistance, which will become more severe when the liquid water penetrates GDL under the rib. On the other hand, for L_P structure, as discussed before, the decreasing capillary resistance in the thickness direction guides the liquid water and nearly intrudes along the TP direction. Moreover, compared to the layer–by–layer decrease in capillary pressure, the continuous decrease in capillary pressure induced by the continuous increase in porosity allows the liquid water to complete the breakthrough more quickly (331.96 ms) and the trapped water clusters are significantly reduced, as illustrated in Figure 5c. Moreover, when liquid water penetrates under the rib, not only will it migrate along the IP direction close to the rib, but also the water clusters at lower locations will slightly intrude along the IP direction because of the continuously decreasing capillary resistance along the TP direction. As for the negative gradient including La_N and L_N, since the porosity of the bottom layer is high, the liquid water fills almost the entire lower and middle parts of the GDL, and the water flooding phenomenon is obvious.

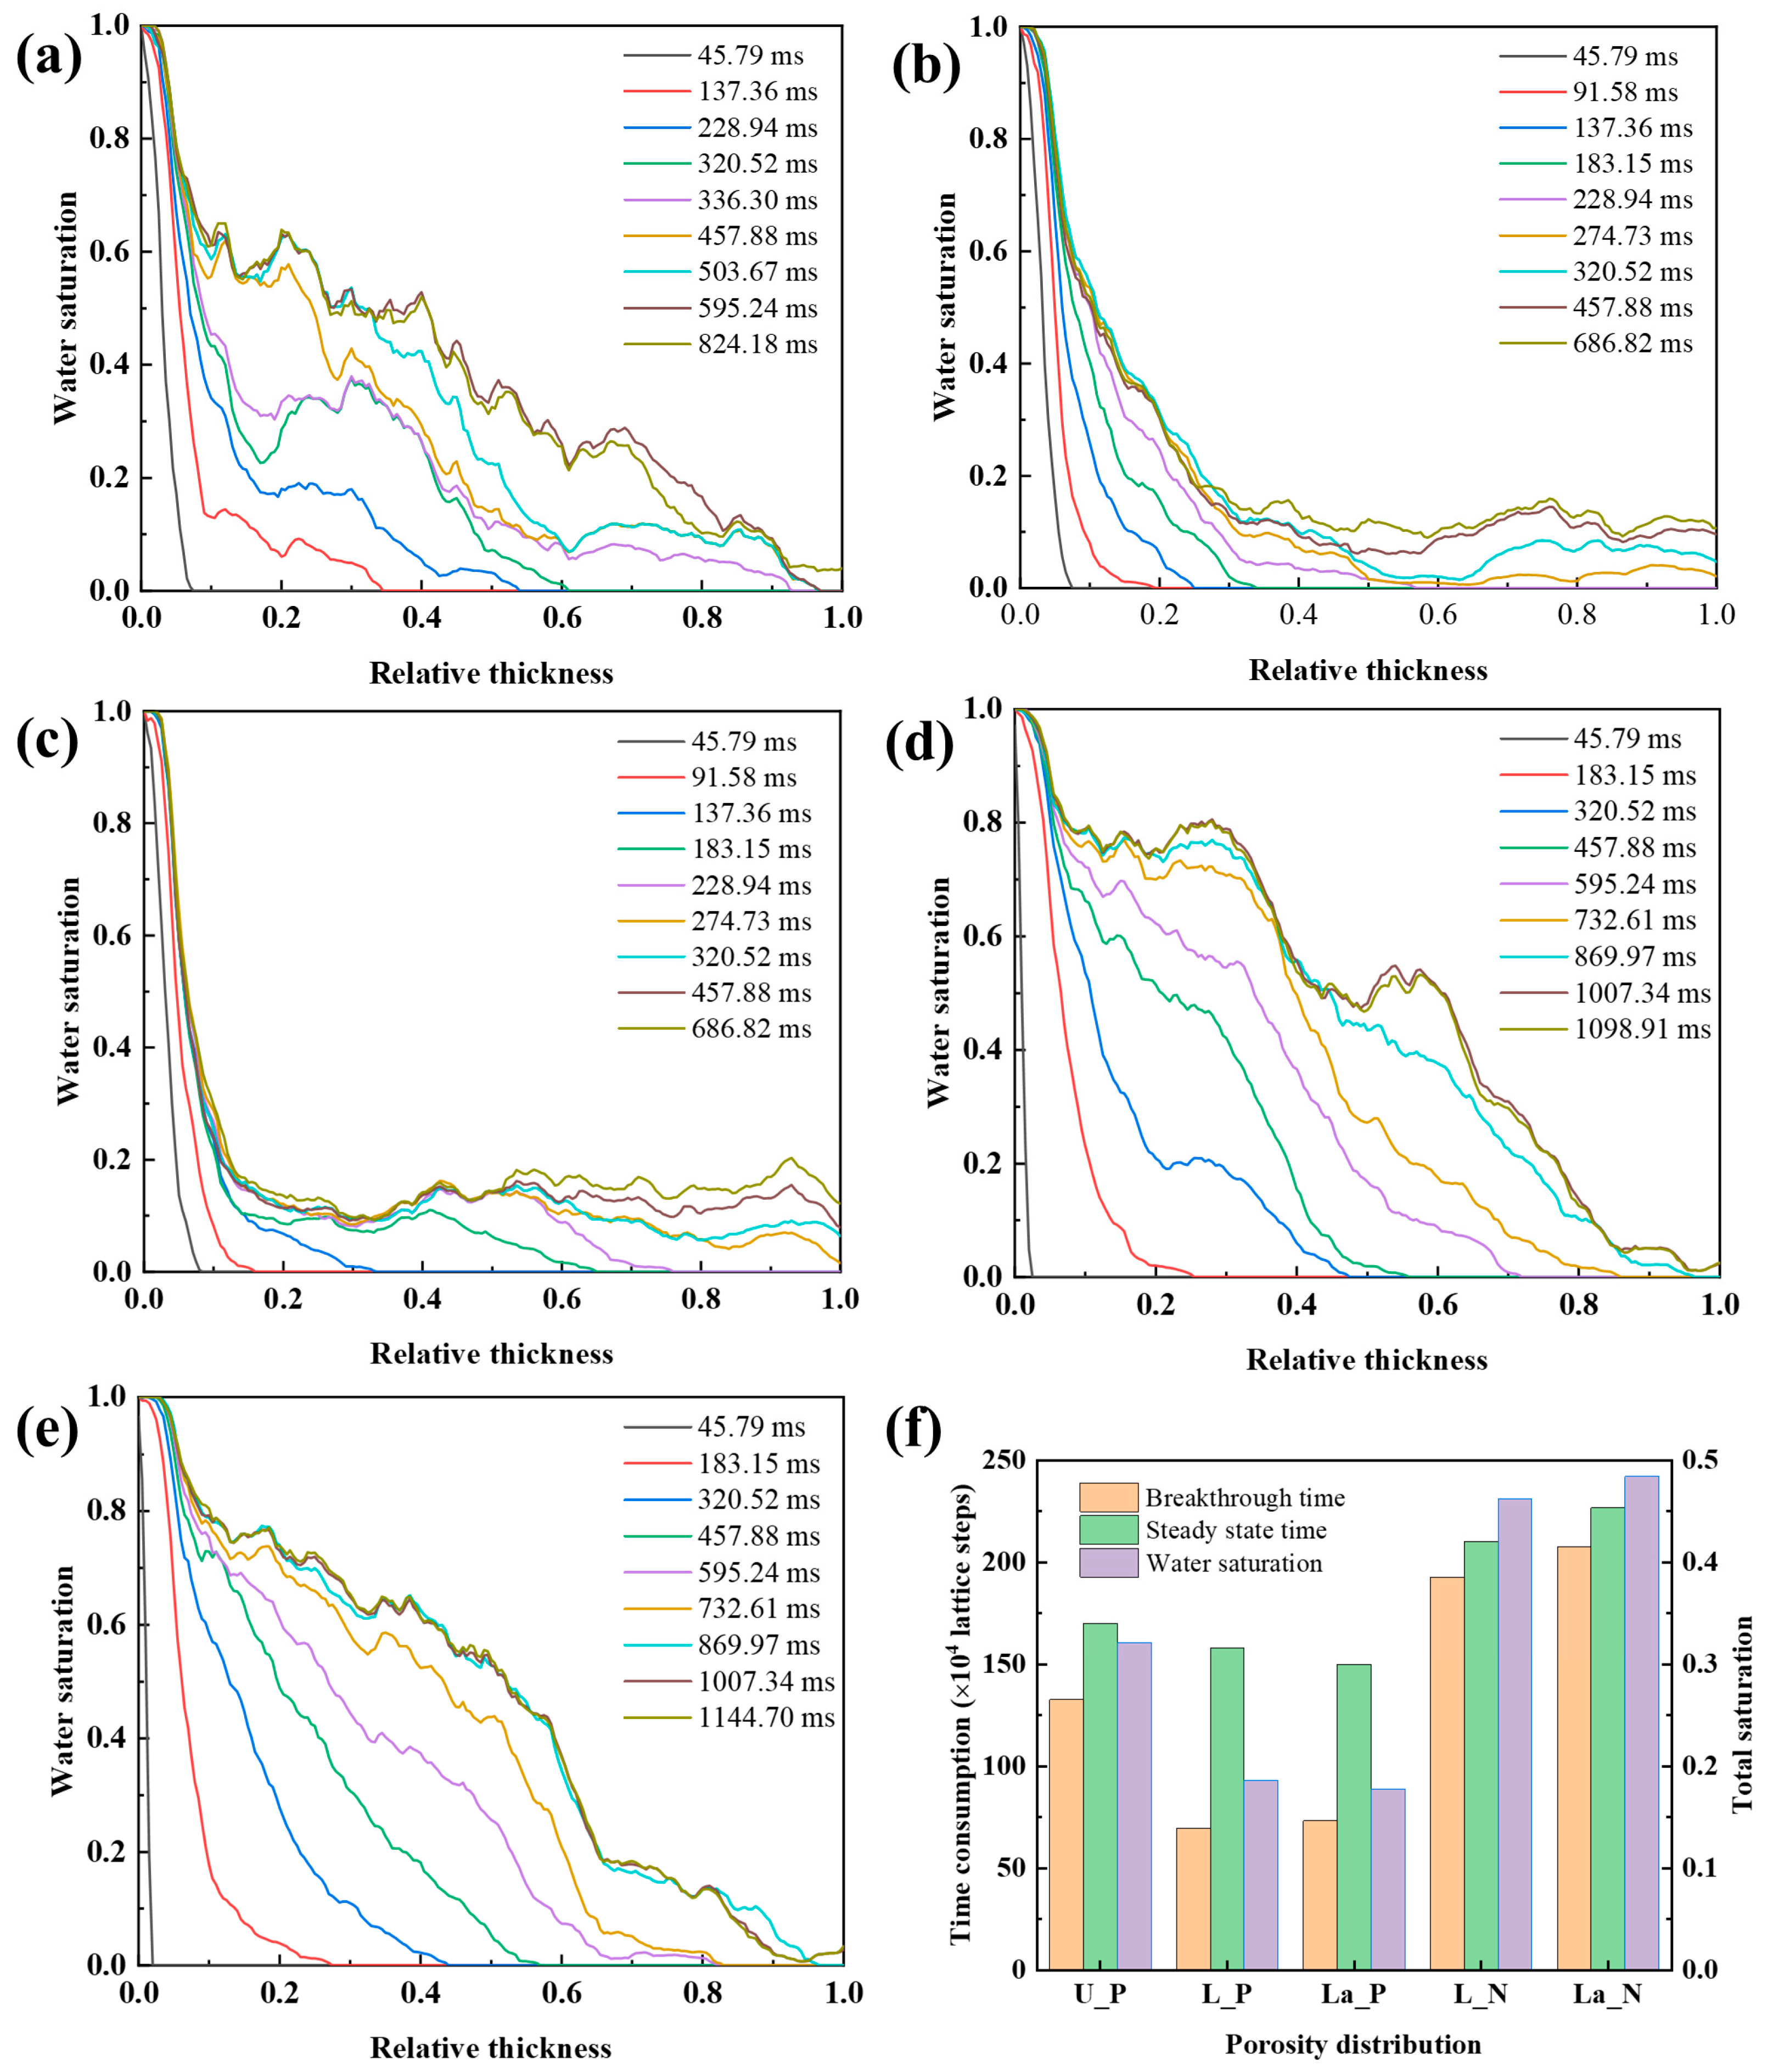
3.2.2. Liquid Saturation and Distribution

Figure 6a–e display the evolution curves of local saturation along the GDL thickness direction at different times, which is established as the ratio of water volume to the total pore volume at a specific thickness position. For the U_P distribution, as evidenced by Figure 6a, the liquid water saturation within the GDL gradually decreases along the TP direction, which is in agreement with previous investigation [48]. Moreover, it can be clearly derived that the liquid water saturation rises significantly with time advancing, which is mainly caused by the continuous intrusion of liquid water along the TP and IP directions, and a slight reduction in the water saturation curve is discernible after the breakthrough due to the occurrence of the retreat phenomenon [50], which is mainly attribute to the fact that the penetration path has the least resistance to flow and a large quantity of liquid water will suddenly flow out after the breakthrough. After that, the distribution of water saturation remains basically unchanged. Compared to the U_P structure, the distribution of water saturation in the positive gradient GDL structure is significantly different, as depicted in Figure 6b,c. The water saturation of those cases near the CL/GDL side is remarkably lower than that of the U_P structure; however, the saturation of La_P structure in that region is obviously higher than L_P structure, which is due to the low porosity of the bottom region in the layered structure, which makes it difficult for liquid water to break through directly, and thus forms a large deal of water clusters. Moreover, in the middle region of GDL, since water clusters inside the L_P structure are prone to migrate in the IP direction, the water saturation is higher than that in the La_P structure. Furthermore, the positive gradient structure is more water saturated in the top region of the GDL than the homogeneous structure due to the fact that liquid water flows more easily along the IP direction in the highly porous region under its ribs as discussed before. In addition, for the negative gradient illustrated in Figure 6d,e, the water saturation curve is significantly higher than other structures, which is related to its porosity distribution and will not be discussed further.
Figure 6f compares the liquid water breakthrough time, steady state time and total water saturation under steady state corresponding to the five different porosity distribution structures. Obviously, the values corresponding to the negative gradient structures are all higher than those of the other structures, demonstrating the failure of their water management; therefore, these distributions will not be discussed in detail. Considering the breakthrough time, the value of the positive gradient structure is less than the uniform structure, which is attributed to the acceleration of the capillary pressure gradient. More specifically, the breakthrough time consumed by L_P and La_P is reduced by 47.54% and 44.8%, respectively, compared to the uniform structure. Moreover, due to the bottom layer of the La_P structure being relatively difficult to penetrate, it consumes more time to break through than L_P structure. As for the steady state time consumption, the values, in descending order, are U_P, L_P and La_P structures. On the one hand, due to the reduction of capillary pressure gradient in the TP direction, liquid water flows out more easily, so the positive gradient structure is better than the uniform structure; however, the relatively small discrepancy between those three cases is due to the fact that the region of positive gradient structure under the rib will tend to have a large amount of water accumulation. On the other hand, the consumption time is relatively longer for the L_P structure as water clusters flow more easily along the IP direction under the ribs. As far as total saturation is concerned, the U_P case > the L_P case > the La_P case, the value was reduced by 42.02% and 44.66%, respectively. And the reasons are mentioned in the previous section and will not be repeated.

3.3. Effect of Compression

This section further investigates the effect of different compression ratios on liquid water transport and distribution under different porosity distributions including the U_P, L_P and La_P cases. Under standard operational circumstances of PEMFC, the compression ratio (CR) of the GDL could achieve an upper limit ranging from 25% to 30% [57,58]; Senthil Velan and Mahmoudi [59] have proved that the cell performance will decline sharply as the CR exceeds 30%. Thus, three compression ratios (CRs) 10%, 20% and 30% are adopted drawing from precedent investigations [37,60].
Figure 7a–c displays the water distribution of the three different porosity distribution structures after reaching the steady state at different CRs. It can be clearly seen that the intrusion of liquid water after compression still performs a typical capillary fingering mechanism, and the specific process will not be repeated; however, it can be observed that the increase of CR significantly affects the distribution of liquid water inside the GDL. As mentioned before, this paper considers that compression only changes the porosity distribution under the rib, while that under the FC remains unchanged; therefore, this section will focus on comparing the effects of compression under the flow channel and under the rib, respectively. Figure 8a–f represents the liquid water distribution curves along the thickness direction with varying porosity distributions under the FC and under the rib at different CRs.
As shown in Figure 8a, for the U_P structure, it can be observed that the local water saturation distribution curves at each compression ratio (CR) basically overlap near the entrance of the CL/GDL interface, while the deviation between the curves begins to appear as the distance increases. Due to the reduction in porosity after compression, the capillary resistance under the rib increases, so the liquid water pressure under the FC increases, while the porosity remains unchanged, which makes it relatively easier to break through from the region under the channel; thus, the water distribution under the channel after compression is evidently lower than uncompressed case. However, the corresponding water saturation curve under 20% CR is slightly higher in the middle region than the other two, and this phenomenon can be attributed to the following reasons. In the first place, as depicted in Figure 7a, as the CR increases, the water pressure under the flow channel will also increase to a certain level, which subsequently allows the liquid water to enter the local region with higher capillary pressure, so its water saturation increases instead. Afterward, since the water pressure is high enough when the CR continues to increase, the liquid water is more likely to complete the breakthrough along the TP direction, thus 30% CR corresponds to the lowest water saturation curve. Additionally, at the outlet region of the GDL, there are discrepancies in the water saturation curves because the different cases have distinct locations to complete breakthrough. Unlike under the FC, the water saturation curve beneath the rib shown in Figure 8b exhibits a substantial decline with the increase of CR, which is due to the increased capillary resistance and the difficulty of liquid water intrusion at the entrance, resulting from the decrease of the porosity under the rib by assembly force. Moreover, compared to cases of uncompressed and 10% CR, when the CR is 20% and 30%, the liquid water does not complete the penetration under the rib, thus significantly preventing flooding.
Similarly, for the positive gradient porosity distribution structure, as shown in Figure 8c–f, in the beginning, the liquid water also invades into the GDL by capillary fingering, and the water saturation curves at each CR mainly overlap and all decline rapidly. After that, the water distribution differs between the La_P and L_P structures at different CRs. In the first place, for L_P structure under the channel, it is evident that the differences between the water distribution curves at different CRs are comparatively small at the inlet as well as outlet of the GDL, while at the relative thickness between 0.15 and 0.4, there exists more obvious differences. Unexpectedly, the lowest water saturation curve arises in the uncompressed case, and the order of the other three is as follows: 10% CR > 20% CR > 30% CR; this is because, as illustrated in Figure 7b, on the one hand, the compression makes liquid water gather more under the channel, leading to the increased water pressure; thus, it is more liable to break through the high capillary barrier areas at the entrance under the channel, forming a number of water clusters. Therefore, the water saturation increased after compression; yet, on the other hand, due to the existence of capillary pressure gradient, liquid water can quickly break through the lowest region with the increasing pressure of liquid water, so the water saturation decreases at the entrance with further increase of CR. Thereafter, the water saturation curve at 30% CR is slightly higher when the relative thickness exceeds 0.4 since more liquid water clusters can penetrate to the middle of the GDL. As for the phenomenon under the rib, as shown in Figure 8d, it is obvious that the water saturation curve gradually decreases with the increase of the CR similar to the uniform cases. Moreover, as mentioned earlier, although the porosity decreases after compression, the capillary pressure gradient still exists; thus, except for 30% CR, liquid water completes penetration under the rib, but compared to the uncompressed model, a massive amount of water aggregation is not observed in the IP direction after compression. Secondly, for La_P distribution, the water saturation curves are substantially higher after compression, for the same reasons discussed in the L_P structure, as also shown in Figure 7c. More specifically, for the uncompressed and 10% CR models, the curve rises slightly at the 0.3 relative thickness position due to the lateral movement of liquid water in the middle region after penetrating from the bottom area and, after that, the curve will continue to fall slowly due to reduced capillary resistance. And for 20% CR and 30% CR, the water saturation ascends compared with the other two cases when the relative thickness is less than 0.3. This is because the water pressure under the flow channel is higher, and the water clusters in the bottom layer will increase substantially, in which the capillary pressure gradient does not exist yet. Moreover, the sufficiently high water pressure also allows the liquid water to move as far as possible in the TP direction, so the water saturation curve keeps descending along the TP direction under 20% CR and 30% CR. Moreover, the liquid water saturation curves under the rib decline in the central region with increasing CR, which is consistent with other distribution structures. However, when the relative thickness is greater than 0.6, the curves appear to rise at 10% and 20% CR, and at the top of the GDL, the local water saturation under 10% CR is nearly the same as that of the uncompressed model, which is due to the fact that the porosity of the upper layer in the GDL is still high even after compression. In addition, when the CR is 30%, the liquid water does not penetrate and the water saturation is the lowest because the porosity of the bottom layer is extremely low.
Figure 9a–c compares the breakthrough time, steady state time, and total water saturation at different CRs for different porosity distributions. Firstly, from Figure 9a, we can find that for the U_P structure, the time consumed for breakthrough satisfies uncompressed > 20% CR > 10% CR > 30% CR. However, for L_P structure, the value satisfies 10% CR > uncompressed > 20% CR > 30% CR. The reason can be attributed to the elevation in water pressure under the low CR, resulting in the increasing quantity of water clusters inside the GDL, and thus increase the breakthrough time, while the water readily breaks through with higher water pressure as the CR further increases. Moreover, the conclusions of the La_P structure are consistent with the L_P structure and will not be repeated. Secondly, considering the time to reach the steady state, as depicted in Figure 9b, among all the structures, the value decreases with the increase of the CR due to the fact that the water distribution under the flow channel is basically unchanged, and the liquid water under the rib declines with the increase of the CR; thus, the simpler the water distribution under the rib, the shorter the time is required to reach the steady state. In the end, considering the total water saturation under the steady state, which is defined as the ratio of the liquid water volume under the channel and the ribs to the total pore volume of the compressed GDL, as shown in Figure 9c. On the one hand, for U_P distribution, the value in descending order is uncompressed, 20% CR, 10% CR and 30% CR, the reason is related to the dynamic behaviors and distribution of liquid water described in the previous section. On the other hand, for positive gradient distribution, the value in descending order is 10% CR, uncompressed, 20% CR and 30% CR, which is also consistent with the previous analysis of water distribution.
Additionally, the positive gradient GDL structure significantly reduces the time required for liquid water breakthrough as well as the steady–state water saturation. Since the liquid water in the positive gradient structure at 20% CR still penetrates the GDL under the rib, the time required for the steady state in these structures is slightly higher than that of the uniform structure, while the consumption time in those structures is reduced at all other CRs. Consequently, it can be drawn that the breakthrough time, steady–state time and total saturation is the lowest under 30% CR with the La_P distribution.

4. Conclusions

In this study, a two–dimensional microstructure of a GDL with diverse porosity distribution is reconstructed. And the impact of porosity distribution and compression ratios on liquid water dynamic behaviors and saturation distribution is investigated using a 2D multiphase LBM model. The outcomes of the analysis led to the following conclusions:
  • The gradient structure characterized by an increase in porosity along the thickness direction results in a considerable reduction in both the breakthrough time of liquid water and the total water saturation within the GDL; compared to uniform distribution, the values are reduced by 47.54% and 42.02% for the linear structure, and 44.08% and 44.66% for layered structure, respectively. Moreover, although the overall water saturation of the layered structure is lower than that of the linear structure, it has higher water saturation at the entrance and longer breakthrough time; consequently, at the uncompressed condition, the linear structure instead has the best water management ability improvement;
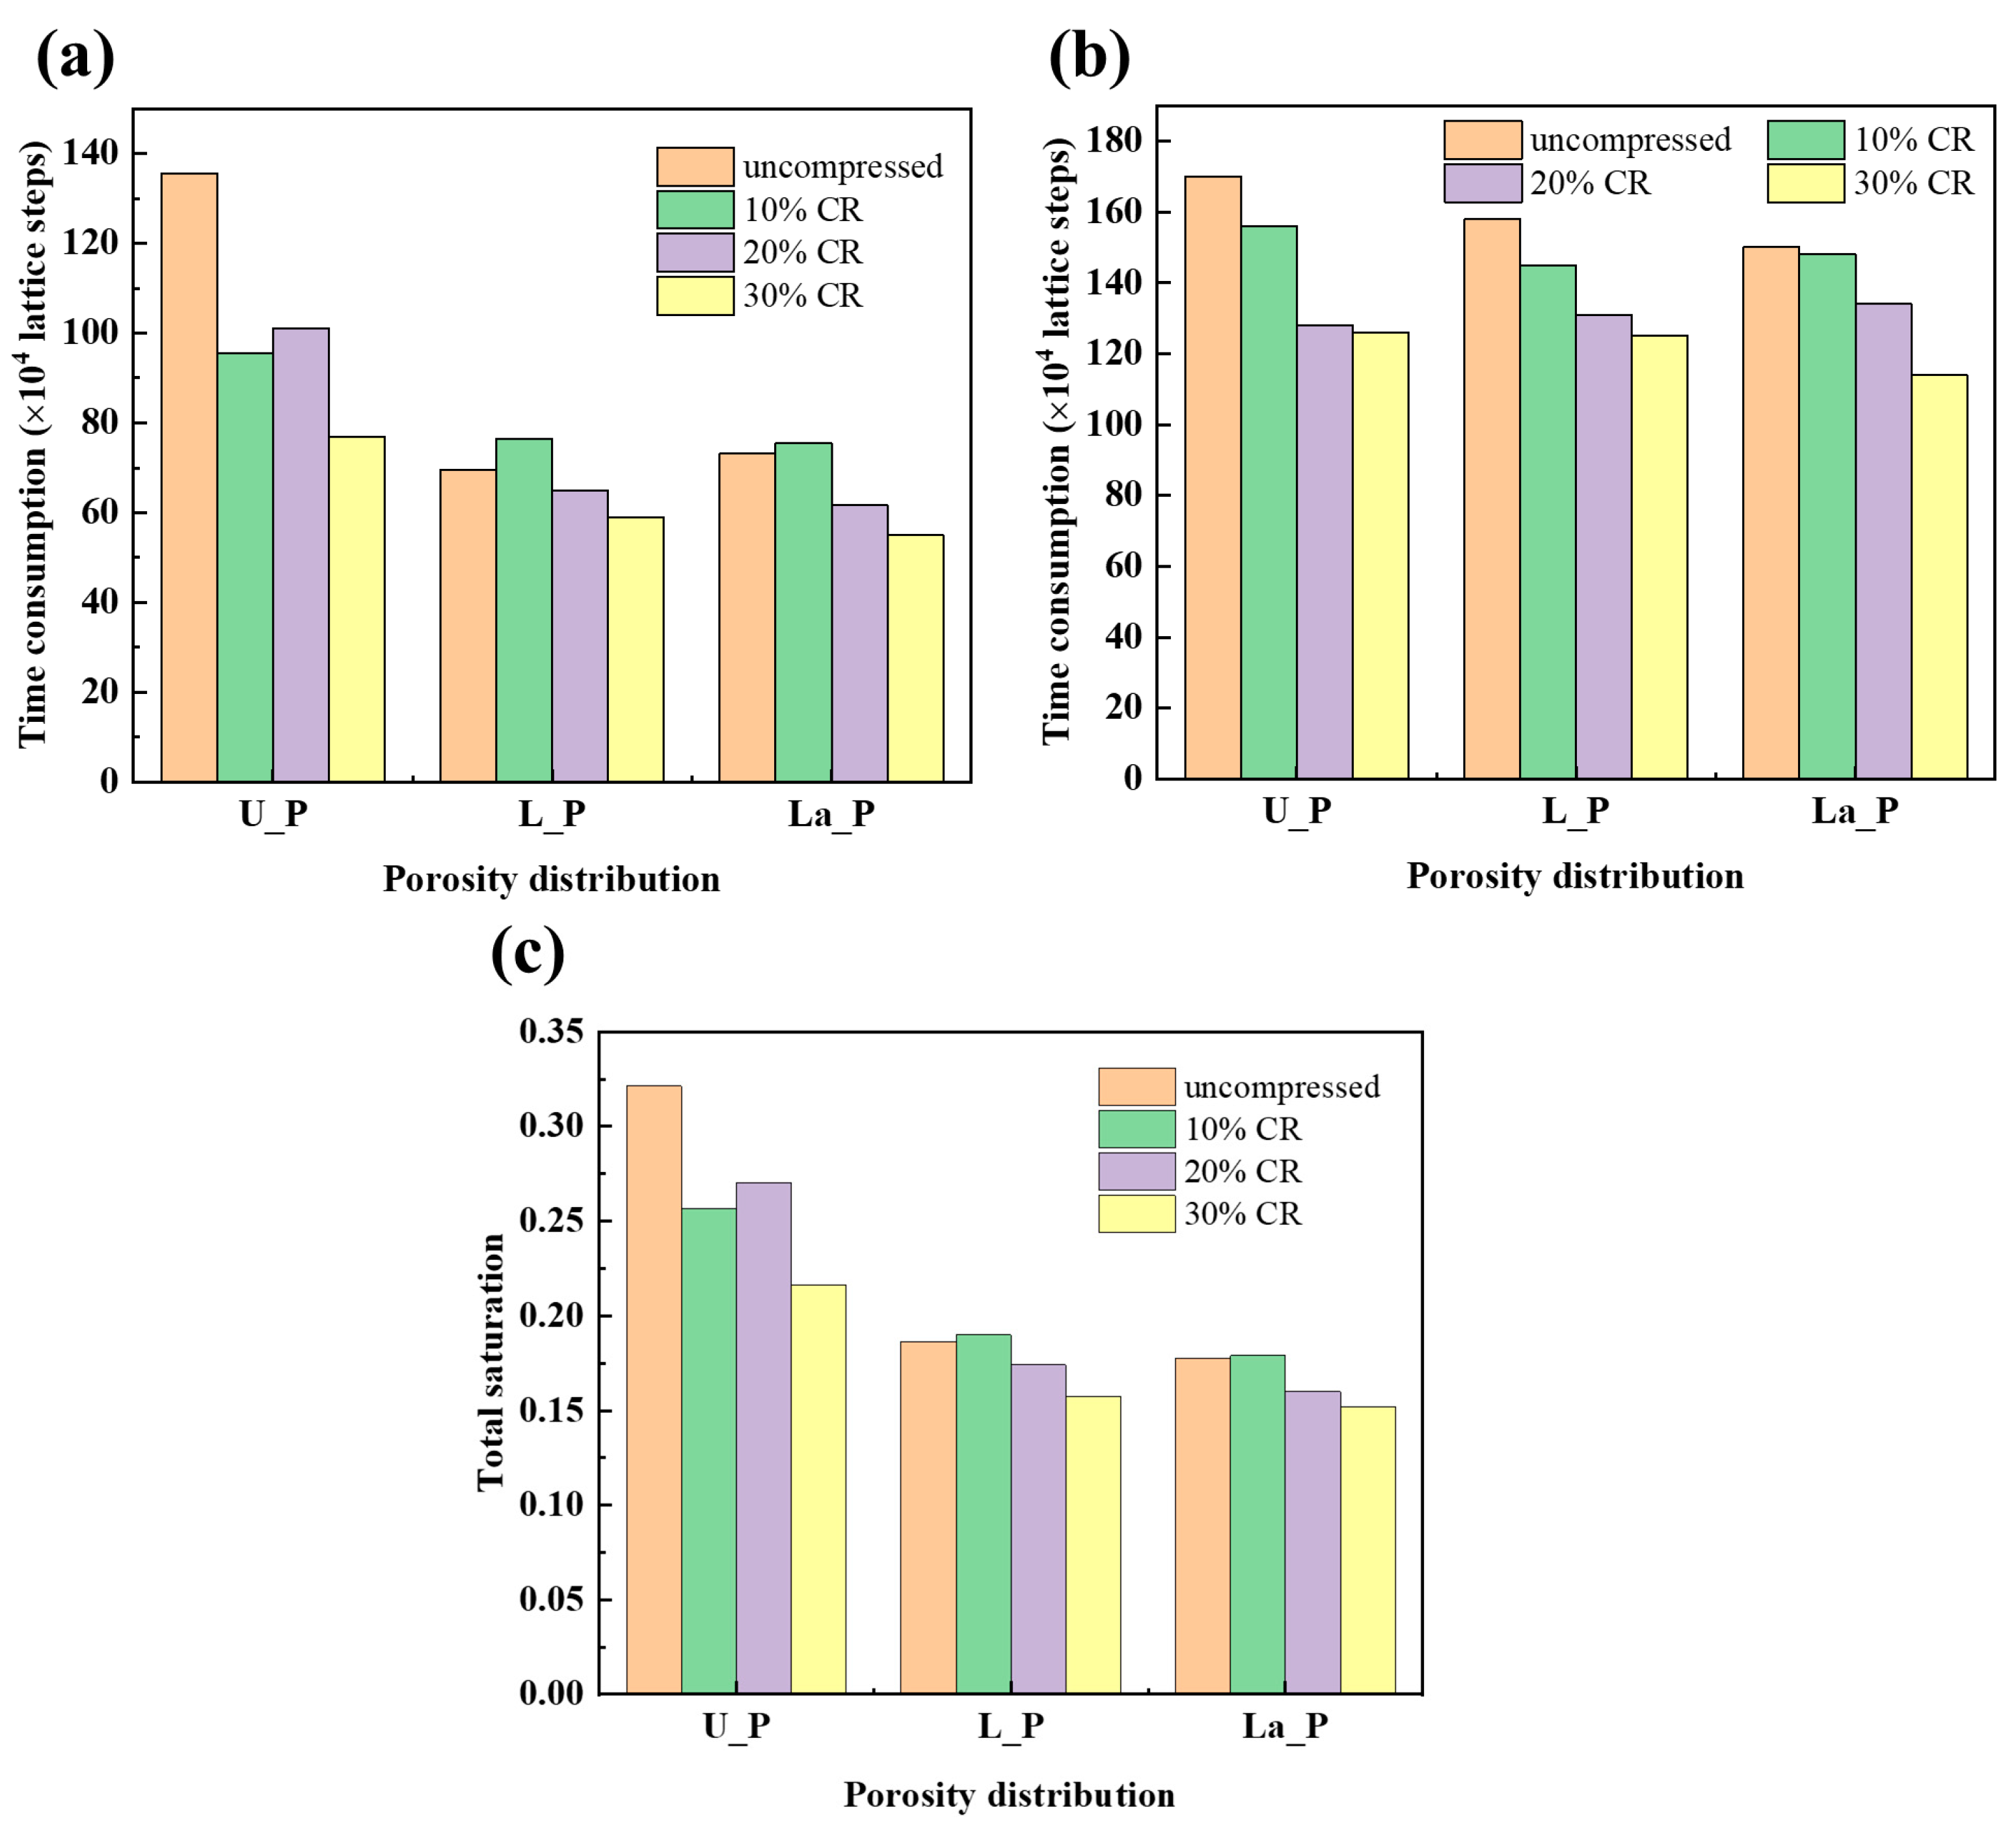
  • At high CR, the positive gradient structure can achieve dramatic liquid water transport improvements, especially under the ribs. Since the porosity under the rib decreases after compression, the water saturation under the rib is effectively reduced among all porosity distribution structures. But compared to the uniform structure, as the capillary pressure gradient still exists under the rib with the positive gradient, the water still penetrates the GDL under 20% CR, which is not conducive to water management, resulting in a higher CR for the positive gradient structure to successfully promote the water distribution under the rib. And under the flow channel, unlike the uniform distribution structure, the positive gradient structure has the highest breakthrough time and overall water saturation at 10% CR instead of the uncompressed case, while the corresponding values all decrease as the CR continues to increase. Consequently, for the positive gradient structure, better water management can be achieved at a relatively high CR;
  • As the CR increases, the linear positive gradient porosity structure provides better water management at the entrance of the GDL. When a GDL of such distribution is compressed, the water saturation under the flow channel increases first and then decreases, and because the capillary pressure gradient exists along the entire thickness direction, liquid water is prone to invade along the TP direction, and thus the water saturation at the entrance of the GDL is relatively low. Accordingly, despite the lower breakthrough time and total water saturation, layered positive porosity distribution is less efficient in improving water discharge under the channel after compression due to the fact that liquid water clusters prefer to gather in the bottom of it with the increase of CR.

Author Contributions

Conceptualization, S.Y. and M.Y.; methodology, S.Y.; software, S.Y. and M.Y.; validation, S.Y.; writing—original draft preparation, S.Y.; writing—review and editing, S.Y., M.Y. and C.S.; visualization, S.Y.; supervision, S.X. and C.S.; project administration, S.X.; funding acquisition, S.X. All authors have read and agreed to the published version of the manuscript.

Funding

This research was funded by National Key R&D Program of China, grant No.2017YFB0102802 and by the National Natural Science Foundation of China, grant No.21776221.

Data Availability Statement

Data sharing is not applicable to this article.

Acknowledgments

The authors wish to acknowledge for the financial support from the National Key R&D Program of China through Grant No.2017YFB0102802 and by the National Natural Science Foundation of China through Grant No.21776221, for the work reported in this paper.

Conflicts of Interest

The authors declare no conflict of interest.

References

  1. Haider, R.; Wen, Y.; Ma, Z.F.; Wilkinson, D.P.; Zhang, L.; Yuan, X.; Song, S.; Zhang, J. High temperature proton exchange membrane fuel cells: Progress in advanced materials and key technologies. Chem. Soc. Rev. 2021, 50, 1138–1187. [Google Scholar] [CrossRef]
  2. Tang, X.; Zhang, Y.; Xu, S. Temperature sensitivity characteristics of PEM fuel cell and output performance improvement based on optimal active temperature control. Int. J. Heat Mass Transf. 2023, 206, 123966. [Google Scholar] [CrossRef]
  3. Olabi, A.G.; Wilberforce, T.; Alanazi, A.; Vichare, P.; Sayed, E.T.; Maghrabie, H.M.; Elsaid, K.; Abdelkareem, M.A. Novel Trends in Proton Exchange Membrane Fuel Cells. Energies 2022, 15, 4949. [Google Scholar] [CrossRef]
  4. Tang, X.; Zhang, Y.; Xu, S. Experimental study of PEM fuel cell temperature characteristic and corresponding automated optimal temperature calibration model. Energy 2023, 283, 128456. [Google Scholar] [CrossRef]
  5. Ozden, A.; Shahgaldi, S.; Li, X.; Hamdullahpur, F. A review of gas diffusion layers for proton exchange membrane fuel cells—With a focus on characteristics, characterization techniques, materials and designs. Prog. Energy Combust. Sci. 2019, 74, 50–102. [Google Scholar] [CrossRef]
  6. Wang, Y.; Ruiz Diaz, D.F.; Chen, K.S.; Wang, Z.; Adroher, X.C. Materials, technological status, and fundamentals of PEM fuel cells—A review. Mater. Today 2020, 32, 178–203. [Google Scholar] [CrossRef]
  7. Chen, Q.; Niu, Z.; Li, H.; Jiao, K.; Wang, Y. Recent progress of gas diffusion layer in proton exchange membrane fuel cell: Two–phase flow and material properties. Int. J. Hydrog. Energy 2021, 46, 8640–8671. [Google Scholar] [CrossRef]
  8. Jiao, K.; Xuan, J.; Du, Q.; Bao, Z.; Xie, B.; Wang, B.; Zhao, Y.; Fan, L.; Wang, H.; Hou, Z.; et al. Designing the next generation of proton–exchange membrane fuel cells. Nature 2021, 595, 361–369. [Google Scholar] [CrossRef]
  9. Wang, G.; Yu, Y.; Liu, H.; Gong, C.; Wen, S.; Wang, X.; Tu, Z. Progress on design and development of polymer electrolyte membrane fuel cell systems for vehicle applications: A review. Fuel Process. Technol. 2018, 179, 203–228. [Google Scholar] [CrossRef]
  10. Pourrahmani, H.; Van Herle, J. Water management of the proton exchange membrane fuel cells: Optimizing the effect of microstructural properties on the gas diffusion layer liquid removal. Energy 2022, 256, 124712. [Google Scholar] [CrossRef]
  11. Ijaodola, O.S.; El–Hassan, Z.; Ogungbemi, E.; Khatib, F.N.; Wilberforce, T.; Thompson, J.; Olabi, A.G. Energy efficiency improvements by investigating the water flooding management on proton exchange membrane fuel cell (PEMFC). Energy 2019, 179, 246–267. [Google Scholar] [CrossRef]
  12. Markotter, H.; Manke, I.; Kruger, P.; Arlt, T.; Haussmann, J.; Klages, M.; Riesemeier, H.; Hartnig, C.; Scholta, J.; Banhart, J. Investigation of 3D water transport paths in gas diffusion layers by combined in–situ synchrotron X–ray radiography and tomography. Electrochem. Commun. 2011, 13, 1001–1004. [Google Scholar] [CrossRef]
  13. Deevanhxay, P.; Sasabe, T.; Tsushima, S.; Hirai, S. Observation of dynamic liquid water transport in the microporous layer and gas diffusion layer of an operating PEM fuel cell by high–resolution soft X–ray radiography. J. Power Sources 2013, 230, 38–43. [Google Scholar] [CrossRef]
  14. Flückiger, R.; Marone, F.; Stampanoni, M.; Wokaun, A.; Büchi, F.N. Investigation of liquid water in gas diffusion layers of polymer electrolyte fuel cells using X–ray tomographic microscopy. Electrochim. Acta 2011, 56, 2254–2262. [Google Scholar] [CrossRef]
  15. Ko, D.; Kwak, H.J.; Kim, M.H. The effects of water accumulation at the interface between gas diffusion layer and gas supplying channel on the water distribution in polymer electrolyte membrane fuel cells. Int. J. Hydrog. Energy 2019, 44, 24947–24953. [Google Scholar] [CrossRef]
  16. Kulkarni, N.; Cho, J.I.S.; Rasha, L.; Owen, R.E.; Wu, Y.; Ziesche, R.; Hack, J.; Neville, T.; Whiteley, M.; Kardjilov, N.; et al. Effect of cell compression on the water dynamics of a polymer electrolyte fuel cell using in–plane and through–plane in–operando neutron radiography. J. Power Sources 2019, 439, 227074. [Google Scholar] [CrossRef]
  17. Cooper, N.J.; Santamaria, A.D.; Becton, M.K.; Park, J.W. Neutron radiography measurements of in–situ PEMFC liquid water saturation in 2D & 3D morphology gas diffusion layers. Int. J. Hydrog. Energy 2017, 42, 16269–16278. [Google Scholar] [CrossRef]
  18. Zapardiel, D.; García–Salaberri, P.A. Modeling the interplay between water capillary transport and species diffusion in gas diffusion layers of proton exchange fuel cells using a hybrid computational fluid dynamics formulation. J. Power Sources 2021, 520, 230735. [Google Scholar] [CrossRef]
  19. Nanadegani, F.S.; Lay, E.N.; Sunden, B. Computational analysis of the impact of a micro porous layer (MPL) on the characteristics of a high temperature PEMFC. Electrochim. Acta 2020, 333, 135552. [Google Scholar] [CrossRef]
  20. Chen, L.; He, A.; Zhao, J.; Kang, Q.; Li, Z. –Y.; Carmeliet, J.; Shikazono, N.; Tao, W.–Q. Pore–scale modeling of complex transport phenomena in porous media. Prog. Energy Combust. Sci. 2022, 88, 100968. [Google Scholar] [CrossRef]
  21. Shahraeeni, M.; Hoorfar, M. Pore–network modeling of liquid water flow in gas diffusion layers of proton exchange membrane fuel cells. Int. J. Hydrog. Energy 2014, 39, 10697–10709. [Google Scholar] [CrossRef]
  22. Carrere, P.; Prat, M. Liquid water in cathode gas diffusion layers of PEM fuel cells: Identification of various pore filling regimes from pore network simulations. Int. J. Heat Mass Transf. 2019, 129, 1043–1056. [Google Scholar] [CrossRef]
  23. Niu, Z.; Wang, Y.; Jiao, K.; Wu, J. Two–Phase Flow Dynamics in the Gas Diffusion Layer of Proton Exchange Membrane Fuel Cells: Volume of Fluid Modeling and Comparison with Experiment. J. Electrochem. Soc. 2018, 165, F613–F620. [Google Scholar] [CrossRef]
  24. Zhou, X.; Wu, L.; Niu, Z.; Bao, Z.; Sun, X.; Liu, Z.; Li, Y.; Jiao, K.; Liu, Z.; Du, Q. Effects of surface wettability on two–phase flow in the compressed gas diffusion layer microstructures. Int. J. Heat Mass Transf. 2020, 151, 119370. [Google Scholar] [CrossRef]
  25. Zhou, X.; Niu, Z.; Bao, Z.; Wang, J.; Liu, Z.; Yin, Y.; Du, Q.; Jiao, K. Two–phase flow in compressed gas diffusion layer: Finite element and volume of fluid modeling. J. Power Sources 2019, 437, 226933. [Google Scholar] [CrossRef]
  26. Yang, M.; Yan, S.; Du, A.; Liu, J.; Xu, S. Effect of micro–cracks on the in–plane electronic conductivity of proton exchange membrane fuel cell catalyst layers based on lattice Boltzmann method. Int. J. Hydrog. Energy 2022, 47, 39961–39972. [Google Scholar] [CrossRef]
  27. Molaeimanesh, G.R.; Googarchin, H.S.; Moqaddam, A.Q. Lattice Boltzmann simulation of proton exchange membrane fuel cells—A review on opportunities and challenges. Int. J. Hydrog. Energy 2016, 41, 22221–22245. [Google Scholar] [CrossRef]
  28. D’Orazio, A.; Karimipour, A.; Ranjbarzadeh, R. Lattice Boltzmann Modelling of Fluid Flow through Porous Media: A Comparison between Pore–Structure and Representative Elementary Volume Methods. Energies 2023, 16, 5354. [Google Scholar] [CrossRef]
  29. Kim, K.N.; Kang, J.H.; Lee, S.G.; Nam, J.H.; Kim, C.-J. Lattice Boltzmann simulation of liquid water transport in microporous and gas diffusion layers of polymer electrolyte membrane fuel cells. J. Power Sources 2015, 278, 703–717. [Google Scholar] [CrossRef]
  30. Jinuntuya, F.; Whiteley, M.; Chen, R.; Fly, A. The effects of gas diffusion layers structure on water transportation using X–ray computed tomography based Lattice Boltzmann method. J. Power Sources 2018, 378, 53–65. [Google Scholar] [CrossRef]
  31. Deng, H.; Hou, Y.; Jiao, K. Lattice Boltzmann simulation of liquid water transport inside and at interface of gas diffusion and micro–porous layers of PEM fuel cells. Int. J. Heat Mass Transf. 2019, 140, 1074–1090. [Google Scholar] [CrossRef]
  32. Sepe, M.; Satjaritanun, P.; Hirano, S.; Zenyuk, I.V.; Tippayawong, N.; Shimpalee, S. Investigating Liquid Water Transport in Different Pore Structure of Gas Diffusion Layers for PEMFC Using Lattice Boltzmann Method. J. Electrochem. Soc. 2020, 167, 104516. [Google Scholar] [CrossRef]
  33. Zenyuk, I.V.; Parkinson, D.Y.; Connolly, L.G.; Weber, A.Z. Gas–diffusion–layer structural properties under compression via X–ray tomography. J. Power Sources 2016, 328, 364–376. [Google Scholar] [CrossRef]
  34. Wu, Y.; Cho, J.I.S.; Lu, X.; Rasha, L.; Neville, T.P.; Millichamp, J.; Ziesche, R.; Kardjilov, N.; Markötter, H.; Shearing, P.; et al. Effect of compression on the water management of polymer electrolyte fuel cells: An in–operando neutron radiography study. J. Power Sources 2019, 412, 597–605. [Google Scholar] [CrossRef]
  35. Bazylak, A.; Sinton, D.; Liu, Z.S.; Djilali, N. Effect of compression on liquid water transport and microstructure of PEMFC gas diffusion layers. J. Power Sources 2007, 163, 784–792. [Google Scholar] [CrossRef]
  36. Zenyuk, I.V.; Parkinson, D.Y.; Hwang, G.; Weber, A.Z. Probing water distribution in compressed fuel–cell gas–diffusion layers using X–ray computed tomography. Electrochem. Commun. 2015, 53, 24–28. [Google Scholar] [CrossRef]
  37. Jeon, D.H.; Kim, H. Effect of compression on water transport in gas diffusion layer of polymer electrolyte membrane fuel cell using lattice Boltzmann method. J. Power Sources 2015, 294, 393–405. [Google Scholar] [CrossRef]
  38. Moslemi, M.; Javaherdeh, K.; Ashorynejad, H.R. Effect of compression of microporous and gas diffusion layers on liquid water transport of PEMFC with interdigitated flow field by Lattice Boltzmann method. Colloids Surf. A Physicochem. Eng. Asp. 2022, 642, 128623. [Google Scholar] [CrossRef]
  39. Ira, Y.; Bakhshan, Y.; Khorshidimalahmadi, J. Effect of wettability heterogeneity and compression on liquid water transport in gas diffusion layer coated with microporous layer of PEMFC. Int. J. Hydrog. Energy 2021, 46, 17397–17413. [Google Scholar] [CrossRef]
  40. Shangguan, X.; Li, Y.; Qin, Y.; Cao, S.; Zhang, J.; Yin, Y. Effect of the porosity distribution on the liquid water transport in the gas diffusion layer of PEMFC. Electrochim. Acta 2021, 371, 137814. [Google Scholar] [CrossRef]
  41. Oh, H.; Park, J.; Min, K.; Lee, E.; Jyoung, J.-Y. Effects of pore size gradient in the substrate of a gas diffusion layer on the performance of a proton exchange membrane fuel cell. Appl. Energy 2015, 149, 186–193. [Google Scholar] [CrossRef]
  42. Park, J.; Oh, H.; Lee, Y.I.; Min, K.; Lee, E.; Jyoung, J.-Y. Effect of the pore size variation in the substrate of the gas diffusion layer on water management and fuel cell performance. Appl. Energy 2016, 171, 200–212. [Google Scholar] [CrossRef]
  43. Ko, D.; Doh, S.; Park, H.S.; Kim, M.H. The effect of through plane pore gradient GDL on the water distribution of PEMFC. Int. J. Hydrog. Energy 2018, 43, 2369–2380. [Google Scholar] [CrossRef]
  44. Zhang, Y.; Verma, A.; Pitchumani, R. Optimum design of polymer electrolyte membrane fuel cell with graded porosity gas diffusion layer. Int. J. Hydrog. Energy 2016, 41, 8412–8426. [Google Scholar] [CrossRef]
  45. Kong, I.M.; Jung, A.; Kim, Y.S.; Kim, M.S. Numerical investigation on double gas diffusion backing layer functionalized on water removal in a proton exchange membrane fuel cell. Energy 2017, 120, 478–487. [Google Scholar] [CrossRef]
  46. Kanchan, B.K.; Randive, P.; Pati, S. Numerical investigation of multi–layered porosity in the gas diffusion layer on the performance of a PEM fuel cell. Int. J. Hydrog. Energy 2020, 45, 21836–21847. [Google Scholar] [CrossRef]
  47. Wang, H.; Yang, G.; Shen, Q.; Li, S.; Su, F.; Jiang, Z.; Liao, J.; Zhang, G.; Sun, J. Effects of Compression and Porosity Gradients on Two–Phase Behavior in Gas Diffusion Layer of Proton Exchange Membrane Fuel Cells. Membranes 2023, 13, 303. [Google Scholar] [CrossRef]
  48. Yang, M.; Jiang, Y.; Liu, J.; Xu, S.; Du, A. Lattice Boltzmann method modeling and experimental study on liquid water characteristics in the gas diffusion layer of proton exchange membrane fuel cells. Int. J. Hydrog. Energy 2022, 47, 10366–10380. [Google Scholar] [CrossRef]
  49. Habiballahi, M.; Hassanzadeh, H.; Rahnama, M.; Ali Mirbozorgi, S.; Jahanshahi Javaran, E. Effect of porosity gradient in cathode gas diffusion layer of polymer electrolyte membrane fuel cells on the liquid water transport using lattice Boltzmann method. Proc. Inst. Mech. Eng. Part A J. Power Energy 2020, 235, 546–562. [Google Scholar] [CrossRef]
  50. Guo, L.; Chen, L.; Zhang, R.; Peng, M.; Tao, W.-Q. Pore–scale simulation of two–phase flow and oxygen reactive transport in gas diffusion layer of proton exchange membrane fuel cells: Effects of nonuniform wettability and porosity. Energy 2022, 253, 124101. [Google Scholar] [CrossRef]
  51. Hottinen, T.; Himanen, O.; Karvonen, S.; Nitta, I. Inhomogeneous compression of PEMFC gas diffusion layer. J. Power Sources 2007, 171, 113–121. [Google Scholar] [CrossRef]
  52. Carral, C.; Mélé, P. A numerical analysis of PEMFC stack assembly through a 3D finite element model. Int. J. Hydrog. Energy 2014, 39, 4516–4530. [Google Scholar] [CrossRef]
  53. Kleemann, J.; Finsterwalder, F.; Tillmetz, W. Characterisation of mechanical behaviour and coupled electrical properties of polymer electrolyte membrane fuel cell gas diffusion layers. J. Power Sources 2009, 190, 92–102. [Google Scholar] [CrossRef]
  54. Yoshimune, W.; Kato, S.; Yamaguchi, S. Multi–scale pore morphologies of a compressed gas diffusion layer for polymer electrolyte fuel cells. Int. J. Heat Mass Transf. 2020, 152, 119537. [Google Scholar] [CrossRef]
  55. Hao, L.; Cheng, P. Lattice Boltzmann simulations of water transport in gas diffusion layer of a polymer electrolyte membrane fuel cell. J. Power Sources 2010, 195, 3870–3881. [Google Scholar] [CrossRef]
  56. Sim, J.; Kang, M.; Min, K. Effects of basic gas diffusion layer components on PEMFC performance with capillary pressure gradient. Int. J. Hydrog. Energy 2021, 46, 27731–27748. [Google Scholar] [CrossRef]
  57. Satjaritanun, P.; Hirano, S.; Shum, A.D.; Zenyuk, I.V.; Weber, A.Z.; Weidner, J.W.; Shimpalee, S. Fundamental Understanding of Water Movement in Gas Diffusion Layer under Different Arrangements Using Combination of Direct Modeling and Experimental Visualization. J. Electrochem. Soc. 2018, 165, F1115–F1126. [Google Scholar] [CrossRef]
  58. Senthil Velan, V.; Velayutham, G.; Rajalakshmi, N.; Dhathathreyan, K.S. Influence of compressive stress on the pore structure of carbon cloth based gas diffusion layer investigated by capillary flow porometry. Int. J. Hydrog. Energy 2014, 39, 1752–1759. [Google Scholar] [CrossRef]
  59. Mahmoudi, A.H.; Ramiar, A.; Esmaili, Q. Effect of inhomogeneous compression of gas diffusion layer on the performance of PEMFC with interdigitated flow field. Energy Convers. Manag. 2016, 110, 78–89. [Google Scholar] [CrossRef]
  60. Zhou, X.; Niu, Z.; Li, Y.; Sun, X.; Du, Q.; Xuan, J.; Jiao, K. Investigation of two–phase flow in the compressed gas diffusion layer microstructures. Int. J. Hydrog. Energy 2019, 44, 26498–26516. [Google Scholar] [CrossRef]
Figure 1. Computational domain used in this work.
Energies 16 06010 g001
Figure 2. The correlation between pressure differential and 1/R.
Energies 16 06010 g002
Figure 3. The correlation between solid–fluid interaction Gs and contact angle θ.
Energies 16 06010 g003
Figure 4. The porosity distribution along thickness direction with (a) prospective and (b) actual structures.
Energies 16 06010 g004
Figure 5. Liquid water dynamic behavior inside GDL with (a) U_P, (b) La_P, (c) L_P, (d) La_N and (e) L_N porosity distribution, respectively.
Energies 16 06010 g005
Figure 6. Saturation evolution curves of liquid water in (a) U_P, (b) La_P, (c) L_P, (d) La_N and (e) L_N porosity distribution. (f) Comparison of time consumption of breakthrough as well as steady state and total saturation in different structures.
Energies 16 06010 g006
Figure 7. Liquid water distribution in the GDL under different compression ratios with (a) U_P, (b) L_P and (c) La_P porosity distribution.
Energies 16 06010 g007
Figure 8. Liquid water distribution along thickness direction under different compression ratio of (a) U_P under channel, (b) U_P under rib, (c) L_P under channel, (d) L_P under rib, (e) La_P under channel and (f) La_P under rib, respectively.
Energies 16 06010 g008
Figure 9. Comparison of (a) break–through time consumption, (b) steady–state time consumption and (c) total saturation under different compression ratios and porosity distribution.
Energies 16 06010 g009
Disclaimer/Publisher’s Note: The statements, opinions and data contained in all publications are solely those of the individual author(s) and contributor(s) and not of MDPI and/or the editor(s). MDPI and/or the editor(s) disclaim responsibility for any injury to people or property resulting from any ideas, methods, instructions or products referred to in the content.

