Article

Low-Cost Maximum Power Point Tracking Strategy and Protection Circuit Applied to an Ayanz Wind Turbine with Screw Blades

Computer and Electronics Department, Mondragon Unibertsitatea, 20500 Mondragon, Spain
*
Authors to whom correspondence should be addressed.
Energies 2023, 16(17), 6204; https://doi.org/10.3390/en16176204
Submission received: 30 July 2023 / Revised: 21 August 2023 / Accepted: 23 August 2023 / Published: 26 August 2023
(This article belongs to the Section A3: Wind, Wave and Tidal Energy)

Abstract

:
This paper provides three different research contributions applied to a Wind Turbine patented in 1606 by the inventor Jerónimo de Ayanz y Beaumont. The windmill under study is the Ayanz Wind Turbine with screw blades. The first contribution consists of an experimental characterization of the Ayanz Wind Turbine, incorporating the enclosure proposed at the patent and showing that the efficiency of the wind turbine is increased between 70% and 90% due to the enclosure being employed. As not many details about the shape of the screw blades are provided at the patent, in this article the nowadays well-studied and commercially available Archimedes Spiral Wind Turbine blade is utilized. It has been observed that by using an enclosure with a cylindrical shape, not only the efficiency of the wind turbine is increased, but the visual impact is reduced as seeing the blades rotating is avoided, which is a very important fact for many potential individual users of this wind turbine. In addition, it also enables the use of a protective mesh for birds, almost totally reducing the probability of bird deaths. The second contribution consists in a simple and low-cost Maximum Power Point Tracking (MPPT) strategy for the wind turbine, which only uses an AC three-phase impedance to capture the maximum energy from the wind, enabling to eliminate the DC-DC converter and microprocessor employed typically for this purpose. Due to this, the cost, complexity, failure rate, and power losses of the electronic power circuit are reduced which is very welcomed for small-scale wind turbines. Finally, the last contribution is a protection electronic circuit that fulfills several objectives: to brake the wind turbine under high winds and to disconnect and protect it when over-currents occur and when the voltage range of the batteries connected to the wind turbine is outside their safety range.

1. Introduction

Due to the well-established reality of global warming, humans are increasingly inclined to develop technology that enables the responsible and renewable generation of electricity. Much of this renewable generation is installed in large industrial areas or parks of big dimensions. In light of the imperative for self-sufficiency, this necessity has been further underscored by recent events that have threatened European energy security. This self-consumption increased by 2500 MW in Spain in 2022, reaching a total of 5249 MW installed [1]. However, this self-consumption is mostly solar, leaving aside wind self-consumption, also known as small wind power [2,3,4].
This small wind power could be of great use so that electricity generation does not depend exclusively on sunlight and can continue to be generated at night and on darker days. In addition, small wind turbines are not located in places where the wind is so constant and regular, as this is where big wind turbines are placed, so research is still underway to determine which morphology of small wind turbine will be the best [5,6]. Hence, there are many articles oriented to different research directions. Thus, for instance there are studies focusing on finding the best turbine in urbanized areas [7,8], and some other research directions are focused on analyzing innovative turbine designs [9,10,11].
Therefore, in order to contribute to the commercial deployment of the small wind turbine research topic, one of the patents granted in 1606 to the illustrious inventor Jerónimo de Ayanz y Beaumont from Spain has been taken as a design reference [12,13]. This patent claims the use of a wind turbine based on screw blades, with a structure around it to channel or enclosure the wind as can be seen in Figure 1a. Knowing this, and using a commercial wind turbine based on Archimedes screw blades (Liam F1 AMW-750D-150W, SC Respect, The Netherland, [14]), it has been decided to experimentally test whether his patent with the enclosure is better than without, in an application oriented to electric energy generation from the wind. In addition, it must be remarked that using the enclosure, reduces the visual impact of watching the blades rotating, which is a very important fact for many potential individual users of this wind turbine. In addition, it also enables to use a protective mesh for birds, considerably reducing the probability of bird deaths.
With regards to the Archimedes screw blades employed for the analysis, it must be said that this wind turbine configuration has been already well studied in literature, such as in [15,16,17,18,19,20], since in 2009, Timmer and Toet carried out fundamental research about it [21].
Most references call this turbine the Archimedes Spiral Wind Turbine, which is a horizontal-axis drag-force-based wind turbine oriented to urban utilization or remote locations, with relatively low wind speeds and generation powers below 300–500 kW. In fact, in reference [17], the theoretical and simulation-based performance of this turbine is studied when an enclosure or concentrator is used. In this reference, it has been shown that the efficiency of the turbine is improved with the concentrator, which is in good agreement with the experimental results presented in subsequent sections of this article. In [17], several geometries of enclosure or concentrators are studied; however, in our present article, a unique cylindrical tube-shaped enclosure will be employed for simplicity and in order to follow the original patent of Ayanz the inventor, published in year 1606. In relation to this, several research studies on diffusers and collectors have been carried out as well, with some significant ones [22,23].
In addition, knowing that a big challenge of small wind turbines is the cost compared to photovoltaic generation, it has been decided to design a MPPT strategy reducing the number of components and without power converter and microprocessor. As will be later shown in the article, although it cannot provide the theoretical maximum power available at the wind in a wide wind speeds range, it can be considered a versatile approach, reaching a good balance in terms of cost, simplicity, and energy captured from the wind, increasing also the reliability. Even though many articles focus on improving MPPT controls [24,25,26,27], as far as the authors know, there is absence of references that propose MPPT controls without DC-DC converter and microprocessors. Thus, there are many MPPT methods proposed based on the Perturb and Observe algorithms, such as for instance [28,29,30]. There are also advanced control algorithms based on model reference adaptive control [31], and many other innovative control methods have been proposed at the specialized literature, such as for instance [32,33,34]. Nevertheless, the only first basic approach known proposing low-cost and very simplified MPPT controls is [35].
Finally, about the last contribution of the paper, i.e., the protection circuit, it is also hard to find articles on this topic. However, according to the authors’ view, if a small wind turbine is going to be installed in a real location, protection circuits such as the one proposed here are indispensable for safety reasons.
Consequently, in summary, there are three novel contributions proposed in this article: First, the fact of including a specific geometry of enclosure to the Archimedes Spiral Wind Turbine and the experimental quantification of its efficiency improvement. Second, the proposal of an alternative simplified and low-cost MPPT strategy that reduces the number of electronic elements required for that purpose. Third, the proposal of a protection electronic circuit of several safety issues of the wind turbine, that although is completely necessary in real applications, is a topic that is almost impossible to be found in the specialized literature.

2. Wind Turbines under Study

In this section, both wind turbines studied in the subsequent sections are presented. As commented previously, the main objective is to experimentally characterize the Ayanz Wind Turbine with screw blades and the effectiveness of his proposed enclosure. For that purpose, the well-known Archimedes Spiral Wind Turbine is used as screw-bladed wind turbine. To a commercially available Liam F1 AMW-750D-150W model, a cylindrical enclosure or tube has been added as depicted in Figure 2.
Therefore, two wind turbine morphologies will be studied: one with a tube (Ayanz patented idea) and the other without a tube. As the only element that changes during testing is the incorporation of the tube, the experimental comparison will be fair, because a unique spiral wind turbine will be used with a unique electric generator, a unique wind maker, the same wind and electric sensors, the same mechanical and electrical losses, etc. Photographs of the experimentally tested wind turbines are provided in Figure 3.
The commercial Archimedes Spiral Wind Turbine presents the following geometrical characteristics depicted in Table 1. This spiral wind turbine is well studied in references such as [15,16,17,18,19,20,21]. It presents three blades connected one to each other with a geometrical offset of 120°. Each blade is symmetrically arranged to the shaft and its side-view shape is similar to a triangular pyramid. The thickness of blades is approximately 5 mm and the length-to-diameter ratio is 80%. Its net weight is 60 kg. A detailed shape parameter description is provided in [16]. The constructive materialization of the blades could be made of several strong plastic materials and also of several metals, such as for instance aluminum.

3. Experimental Comparison of Both Wind Turbines under Study

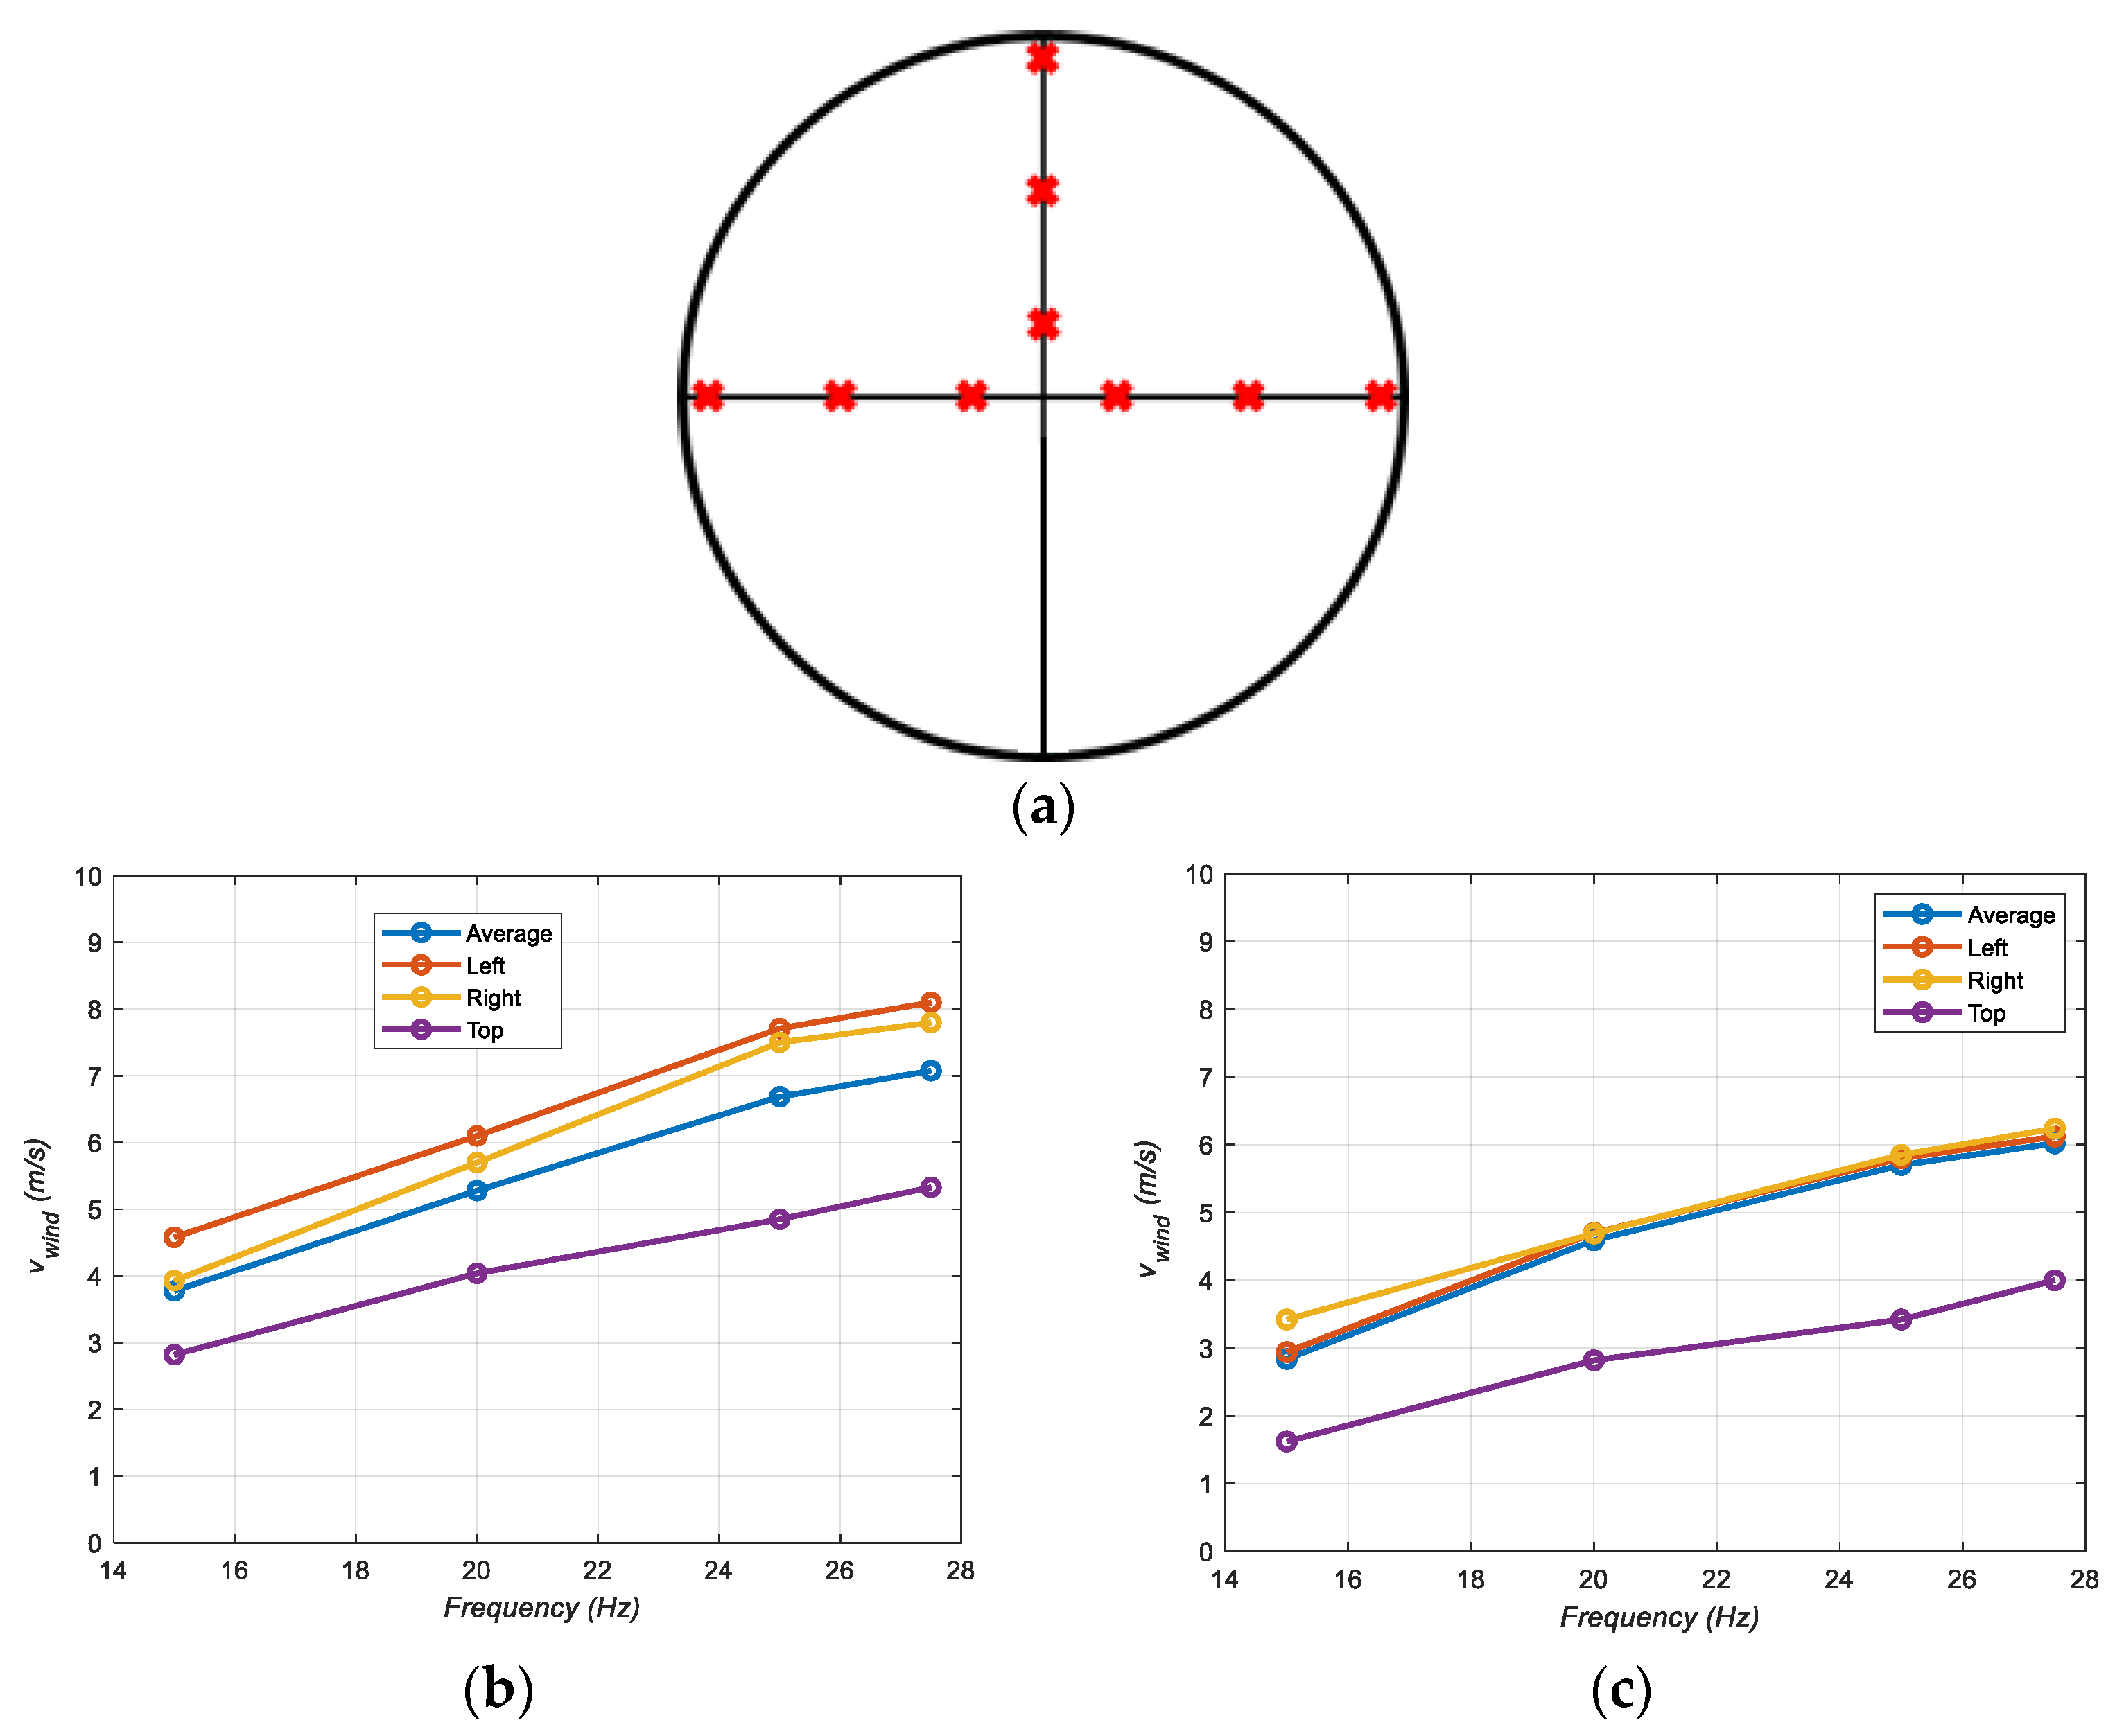
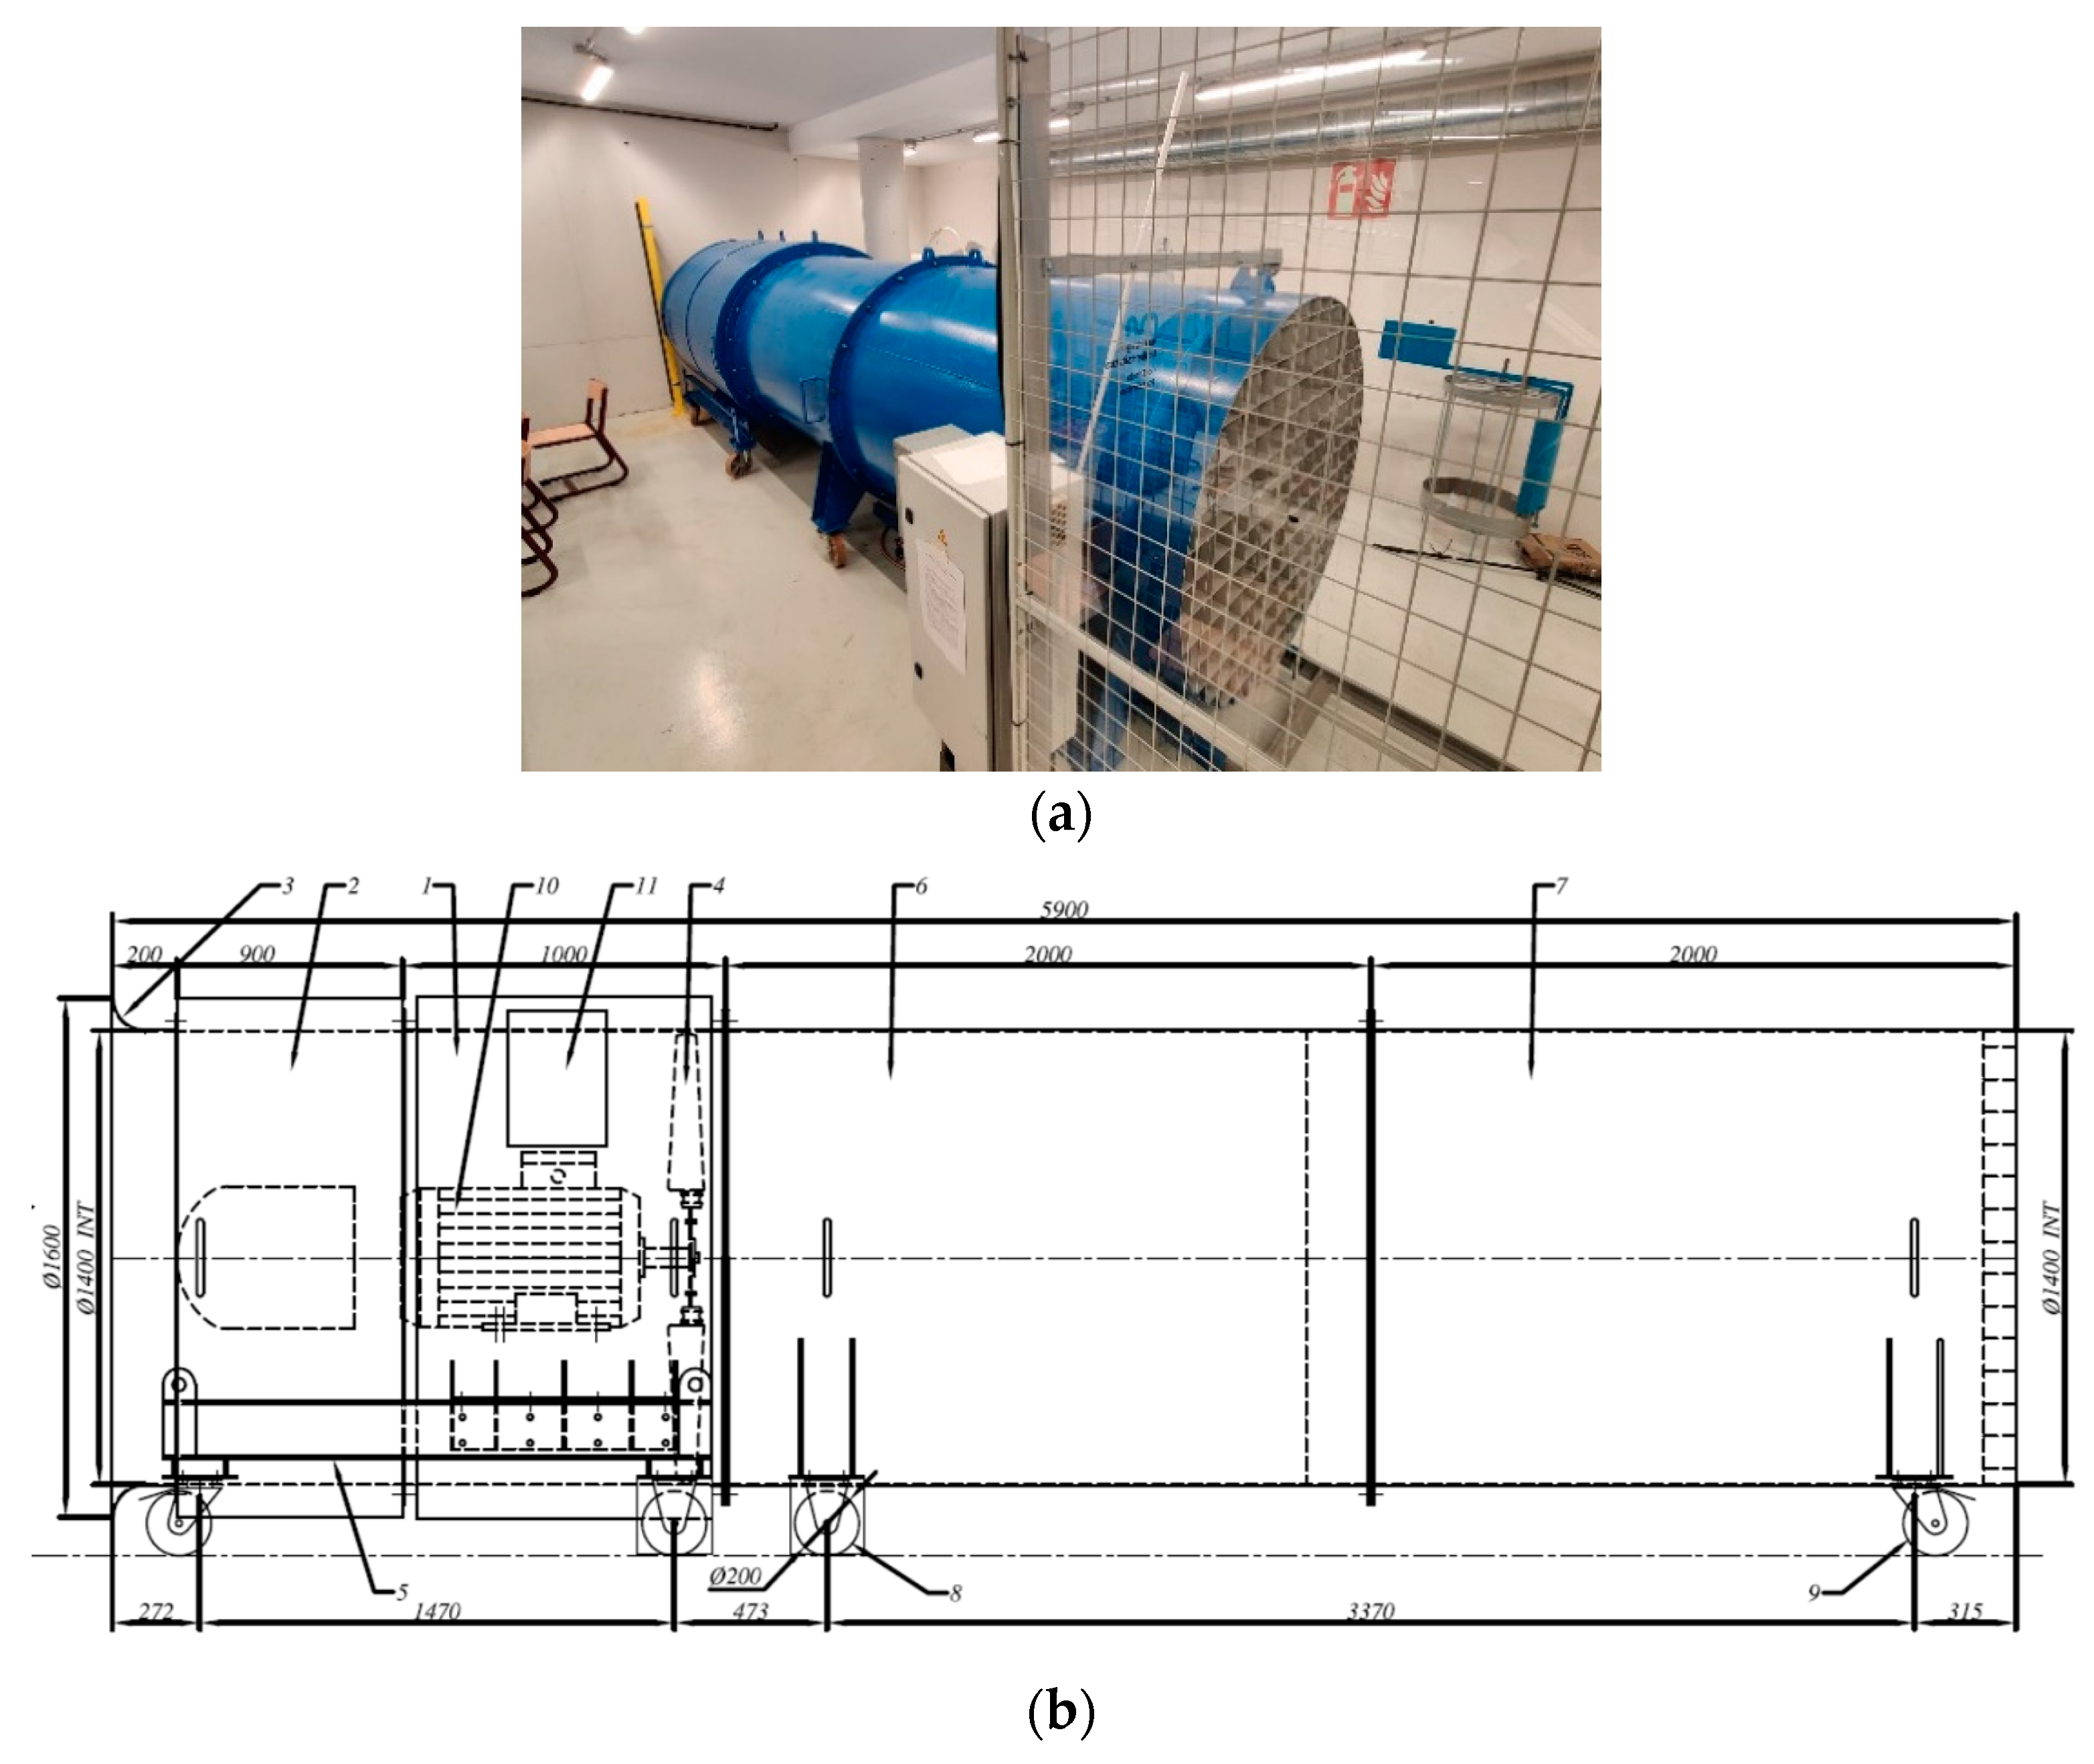
3.1. Wind Maker Characterization

In this section the wind maker characterization is described first. The wind turbine for turbine testing is located in the power electronics laboratories of Mondragon University. The model of the wind maker is the VPA 1400SP (NLH Industrie, France) of the manufacturer NLH Industrie and is shown in Figure 4. This is a wind maker consisting of a single fan, driven directly by a single 400 V, 50 Hz, 30 kW, four-pole induction motor. This motor is controlled by a commercial ABB ACS550 (ABB, Switzerland) electric drive. At rated motor speed, an airflow of 100,000 m3/h is obtained. Reducing the motor speed using the commercial electric drive results in a lower airflow and therefore a lower wind speed at the tunnel exit. Just behind the motor, the tunnel has a silencer, while at the outlet it has a metal grid to uniform the air flow. The wind turbines to be tested are placed outside the tunnel at a fixed distance from it.
The manufacturer itself indicates that the wind generated is not the same in the whole area of the circumference outlet, so to precisely know what wind is affecting the wind turbine, a series of exhaustive measurements have been carried out. Several measurements were taken along both the vertical and horizontal axes, as shown in Figure 5a. Note that no measurements have been made at the bottom line, since the holder obstacles the wind to the turbine. These measurements have been carried out using an XA1000 Lufft sensor (Gutenbergstr, Germany). This is a portable sensor, which is placed at different input points of the turbine (points marked in red in Figure 5a). The sensor used is a ‘hot-wire’ anemometer with an accuracy of 0.2 m/s and a full scale of 20 m/s. The test consists in imposing an operating frequency setpoint on the wind tunnel drive and measuring the wind speed at the aforementioned points. For each point and frequency setpoint, a measurement was taken in a time window of at least 25 s (sample time of 1 s) and the velocities obtained during this interval the arithmetic mean has been calculated as follows:
V w _ m e a n = V w 1 + V w 2 + V w 3 + V w n n
Thus, following this measurement method, wind measurements are taken at the wind turbine’s input without tube and with tube. Both cases are shown in Figure 5b,c, where the average of the nine wind speed measurements are calculated (nine red points) for each frequency reference for the wind maker. So, it is assumed that for each frequency reference for the wind maker, and averaged equivalent wind speed is seen by each wind turbine, which corresponds to the average value of the nine wind speed measurements at red points of Figure 5a. It is worth noting that the averaged wind speed measurement obtained is different for each case. This is due to the fact that the tube itself affects the wind tunnel performance. Note that the tube presents considerably large dimensions compared to the wind maker. Finally, the obtained averaged wind measurements for each wind turbine are later used for subsequent analyses.

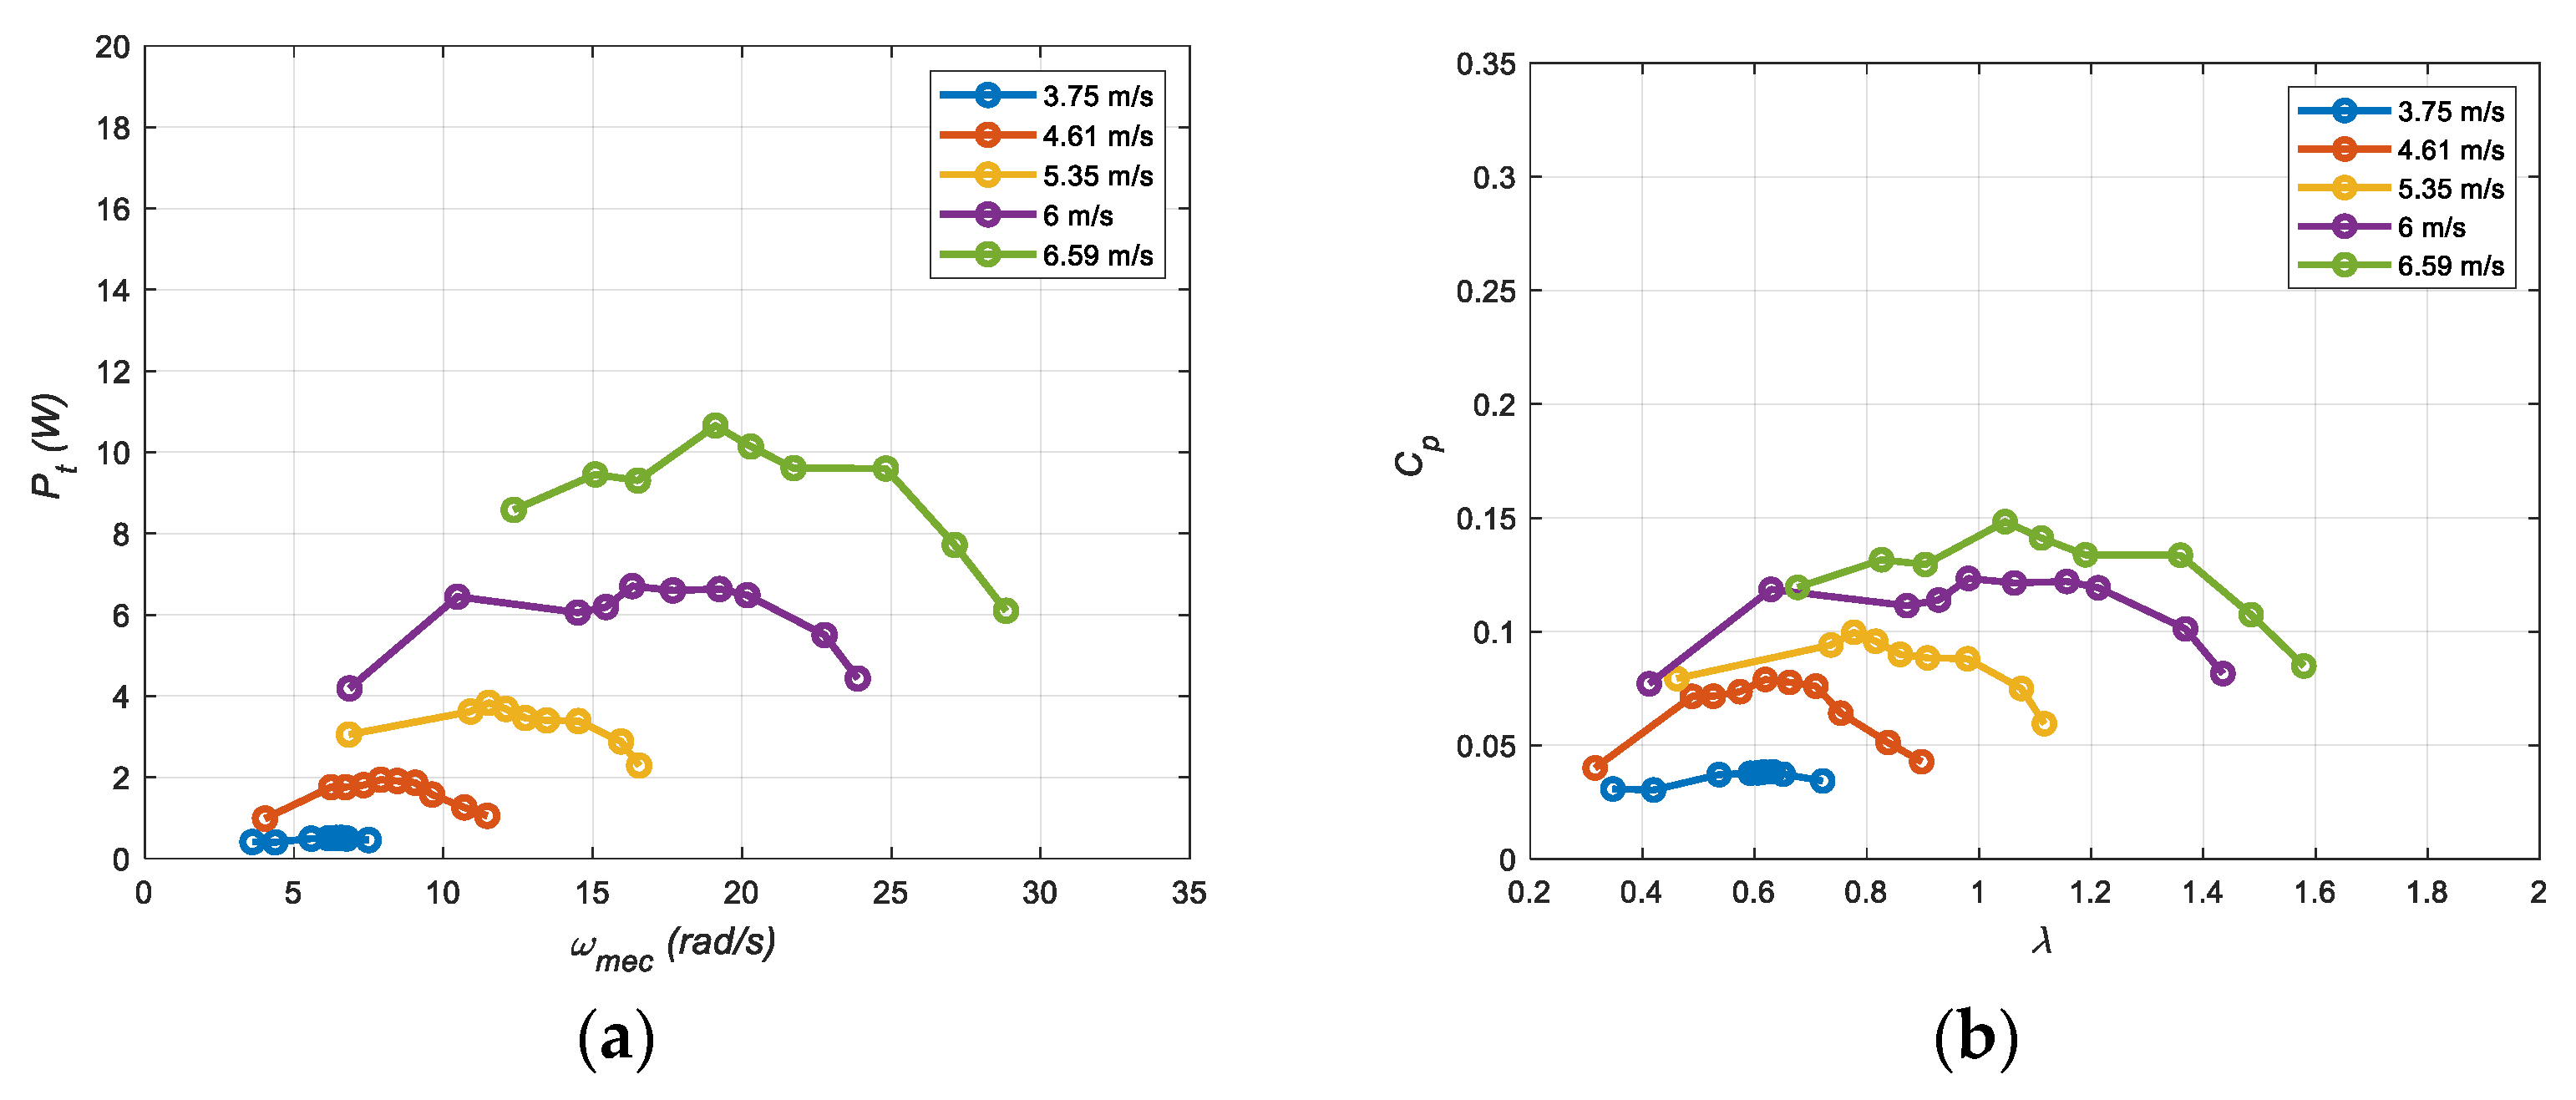
3.2. Wind Turbine Characterization without Tube

A permanent magnet synchronous generator is used as the mechanical to electrical energy converter. The characteristics of the generator are given in Table 2. The internal resistance of the generator is measured with a high precision Microhmeter CA6240, while the internal stator inductance is measured with an LCR meter Fluke PM6304. The flux created by the magnets is estimated by a stator open circuit test [36], measuring the voltages and frequencies at different operating points by means of Hameg TT-SI differential voltage probes with a 25 MHz bandwidth and a Tektronix MDO4000C series oscilloscope. The averaged and filtered voltages and frequencies are calculated with the internal oscilloscope functions.
At the experimental tests, the power provided by the wind turbine is going to be measured at different wind speeds. For that purpose, the power electric circuit shown in Figure 6 is implemented. A variable resistor has been placed at the end of the circuit and by varying its value, different operating points of the wind turbine can be achieved at a given wind speed. Then, the power at the resistance at each tested point is measured. In a previous calibration test, the variable resistor has been precisely measured with the Microhmeter CA6240 (Hameg, Frankfurt, Germany) in all its operating points. The voltages and currents at the variable resistance are measured by the previously mentioned differential voltage Hameg probes and by Chauvin Arnoux EN3 (Chauvin-Arnoux, Asnières-Sur-Seine, France) series current probes. The averaged and filtered voltages and currents are calculated by the internal function of the oscilloscope. Then, the averaged powers are calculated using all voltage, current, and resistance measurements, obtaining a unique averaged power at each operating point, synchronized with the winds measurement window of at least 25 s provided by the XA1000 Lufft sensor.
The measured DC power at the resistance is not the actual power produced by the wind turbine since there are electrical losses (mainly at the generator’s copper losses, R’ and at the diodes of the rectifier). Since the current at the AC side is also measured in each experiment, by adding the electric losses, the mechanical power at the shaft of the wind turbine is calculated. For this study, this mechanical power Pmech (DC power at the resistance plus the electrical losses) is considered as the power generated by the wind turbine Pt, which means that the mechanical losses at the shaft are neglected.
Then, once the wind turbine power is calculated (Pmech = Pt), the power coefficient Cp is calculated according to the following well-known equation [37]:
C P = P t 1 2 ρ A r e a V w 3
Both graphs obtained after repeating the experiments several times are shown in Figure 7a,b. At the tested wind speeds, the typical shaped power and Cp curves have been obtained. It is seen that the power captured from the wind by this wind turbine is considerably high.

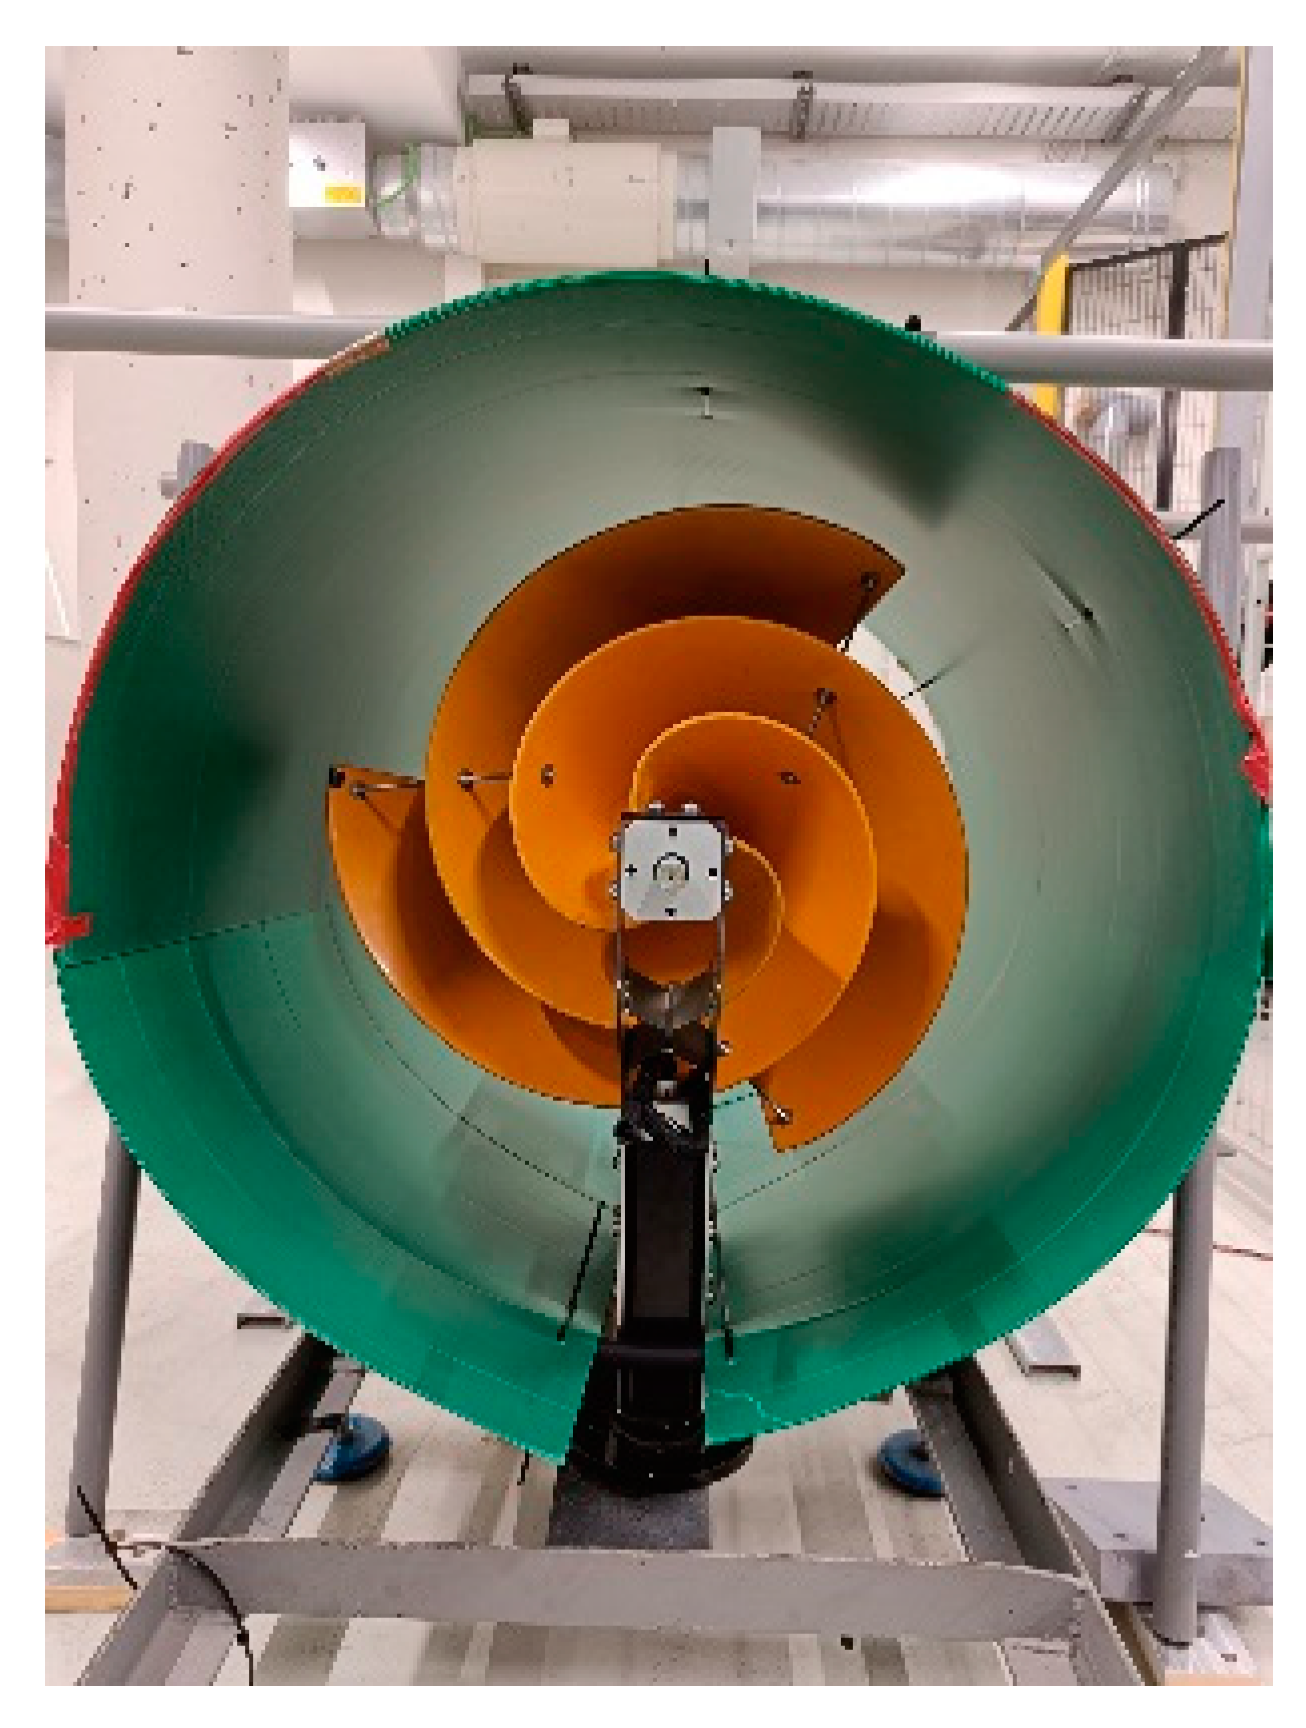
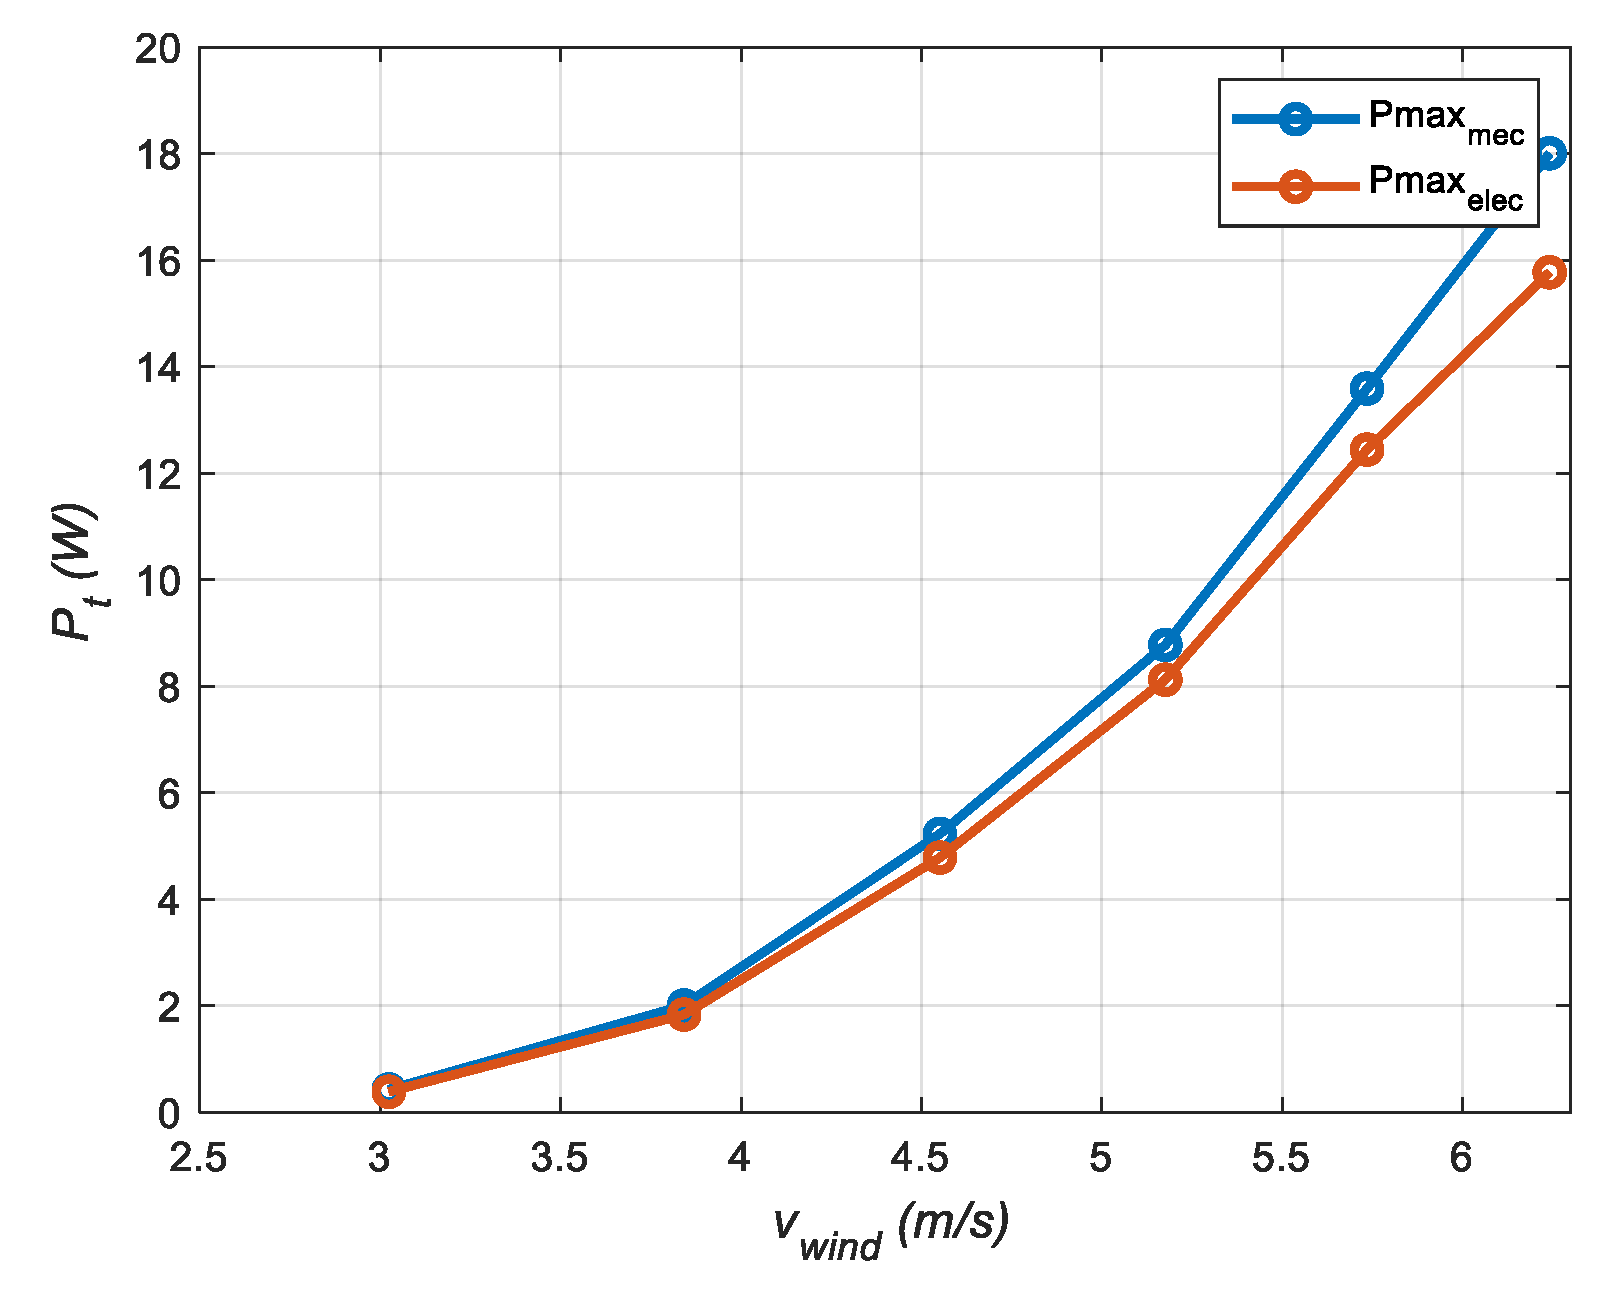
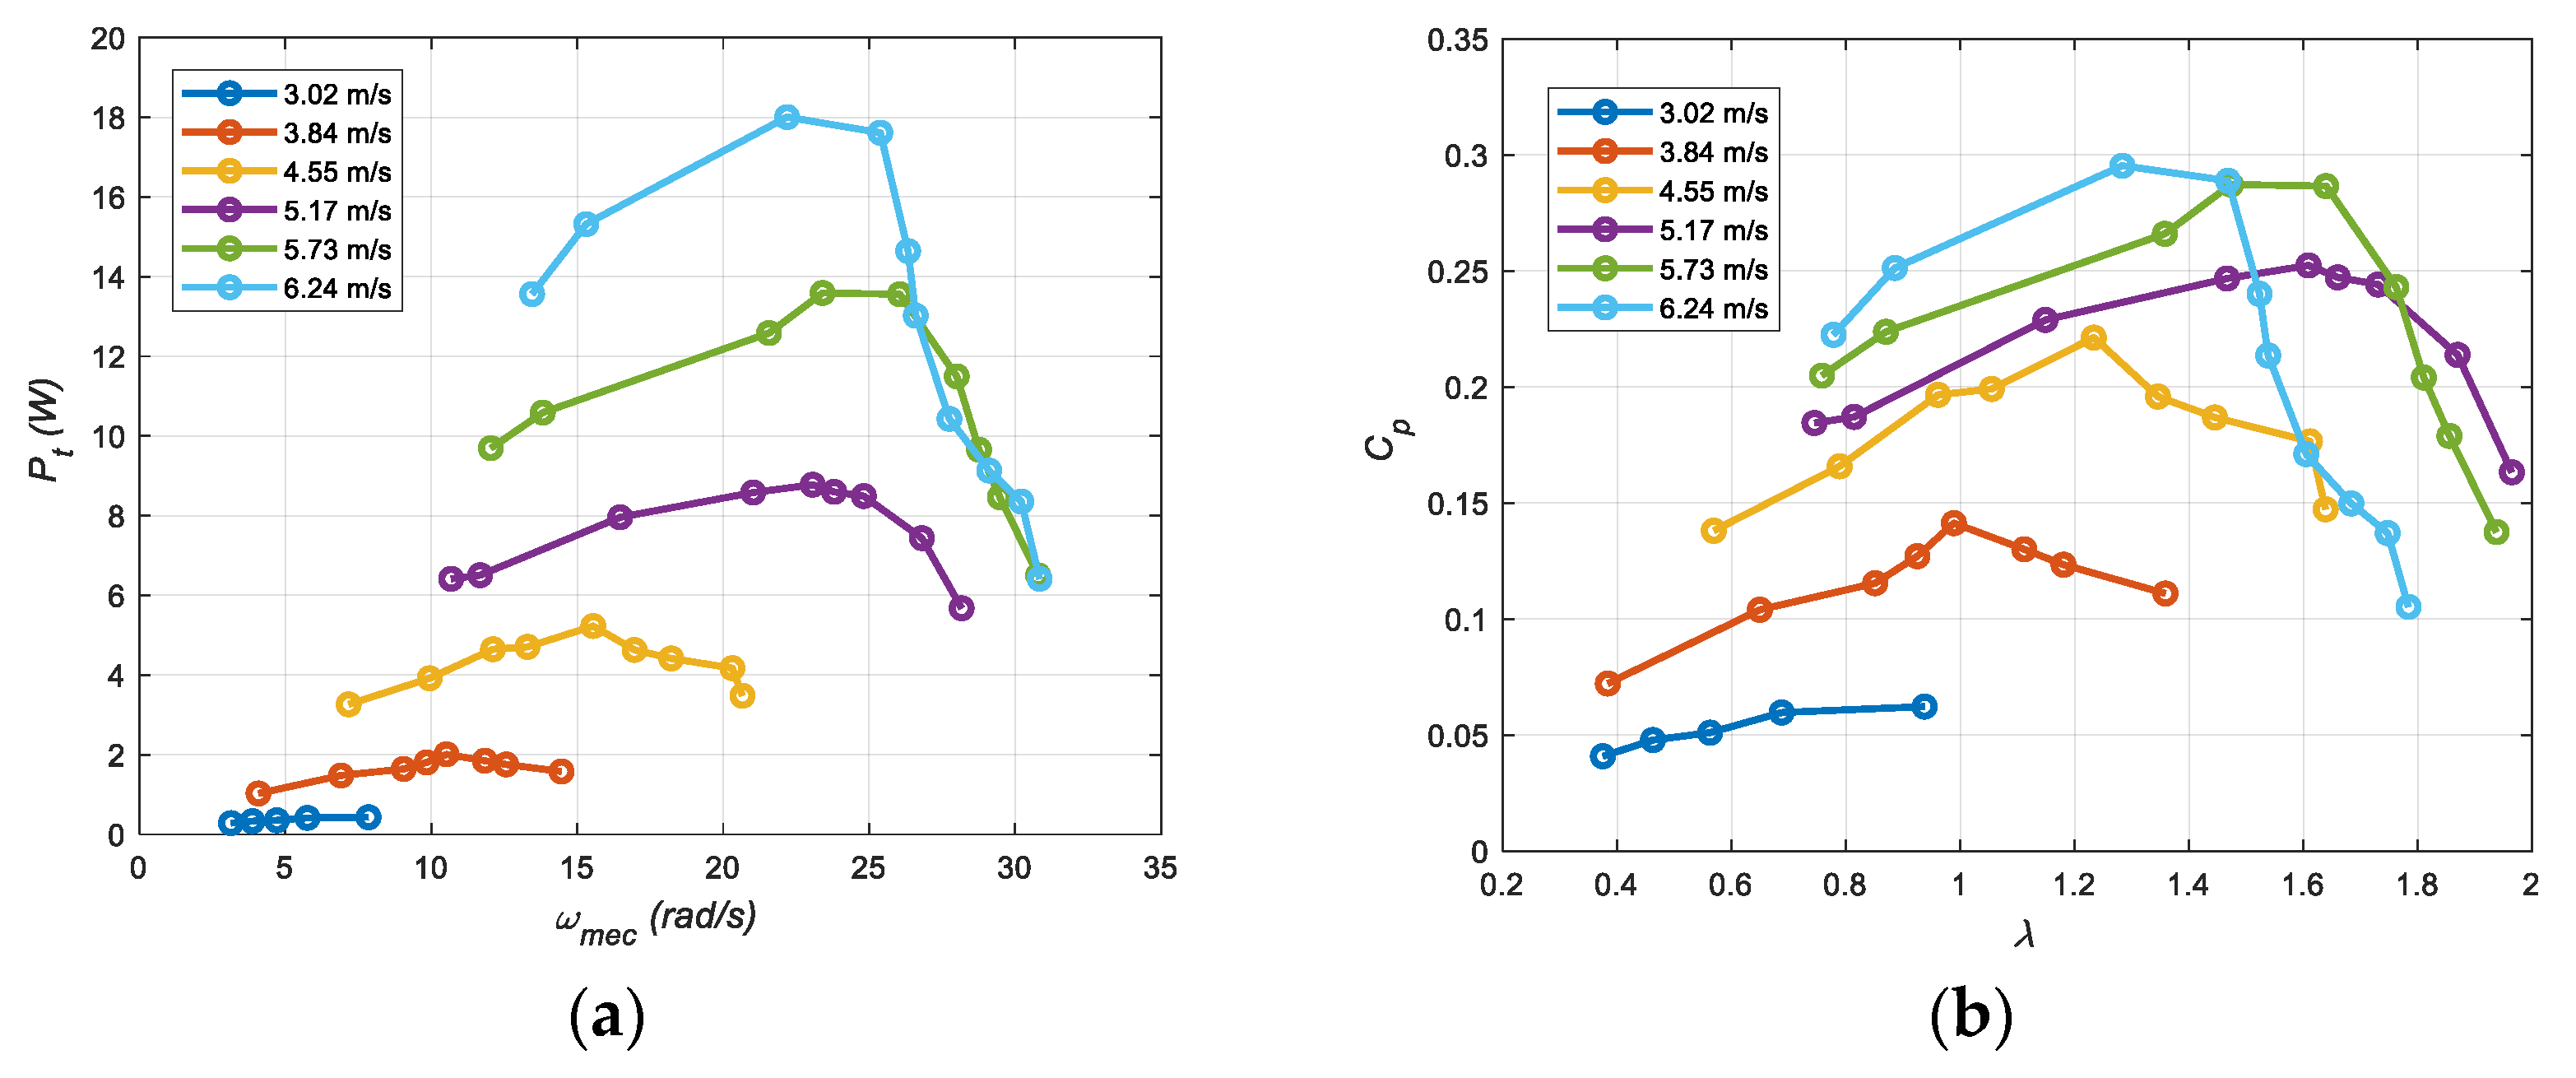
3.3. Wind Turbine Characterization with Tube

As commented before, the patent proposed by Ayanz more than 400 years ago incorporates an enclosure for the blades of the wind turbine. In this study, a tube (cylindrical shape) has been used for this purpose. There are also references such as for instance [17], studying the improvements that can be obtained by implementing an enclosure. Before building a definitive tube, the prototype has been assembled with a reconfigurable plastic green tube as shown in Figure 8, testing the performance of the wind turbine for different longitudes and diameters of the tube.
Hence, after this check, the dimensions of the chosen aluminum tube are shown in Table 3, which corresponds to the previously presented wind turbine of Figure 3b. Thus, the diameter of the tube selected is approximately 9% larger than the turbine’s diameter. After performing a successive approximation (parametric swept)-based experimental study, it has been seen that if the diameter of the tube and the diameter of the turbine are either very close or very different, the benefits of the enclosure are poorer, it even being possible to decrease the Cp when both diameters of tube and turbine are very close. Therefore, it has been observed that a relation of diameters around 10% provides good Cp improvements. This relation is in reasonably good agreement with the computer-based simulation study performed in [17].
Then, in relation to the length of the tube, a tube slightly larger than the turbine has been chosen (turbine: 0.6 m, tube: 0.625 m). Hence, the blades of the wind turbine have been totally covered by the tube, since the following objectives are sought to be met:
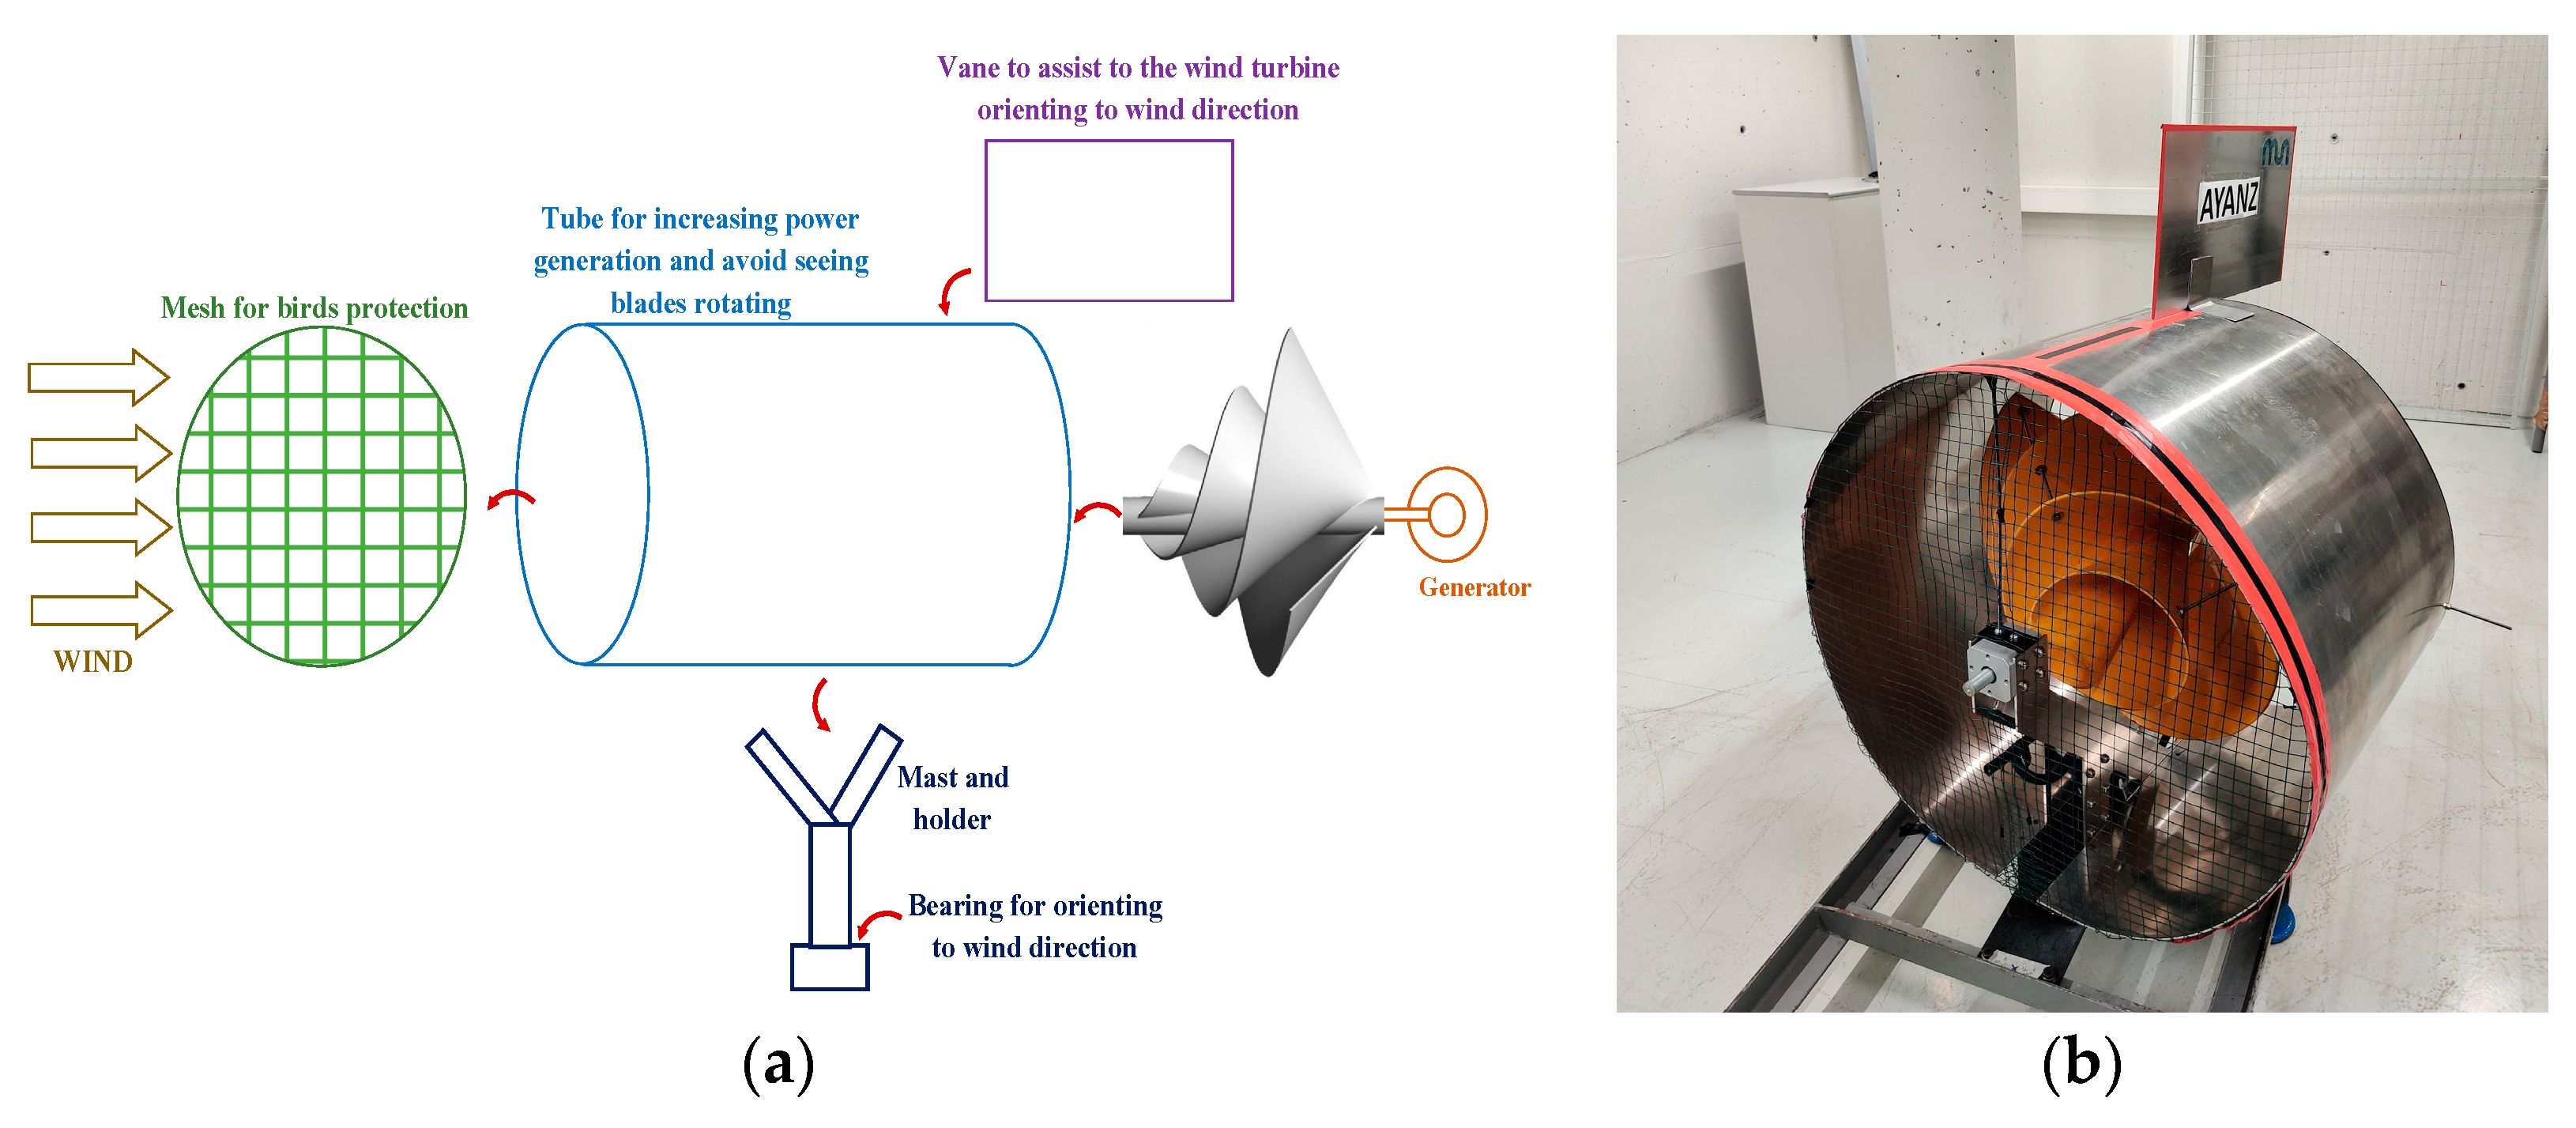
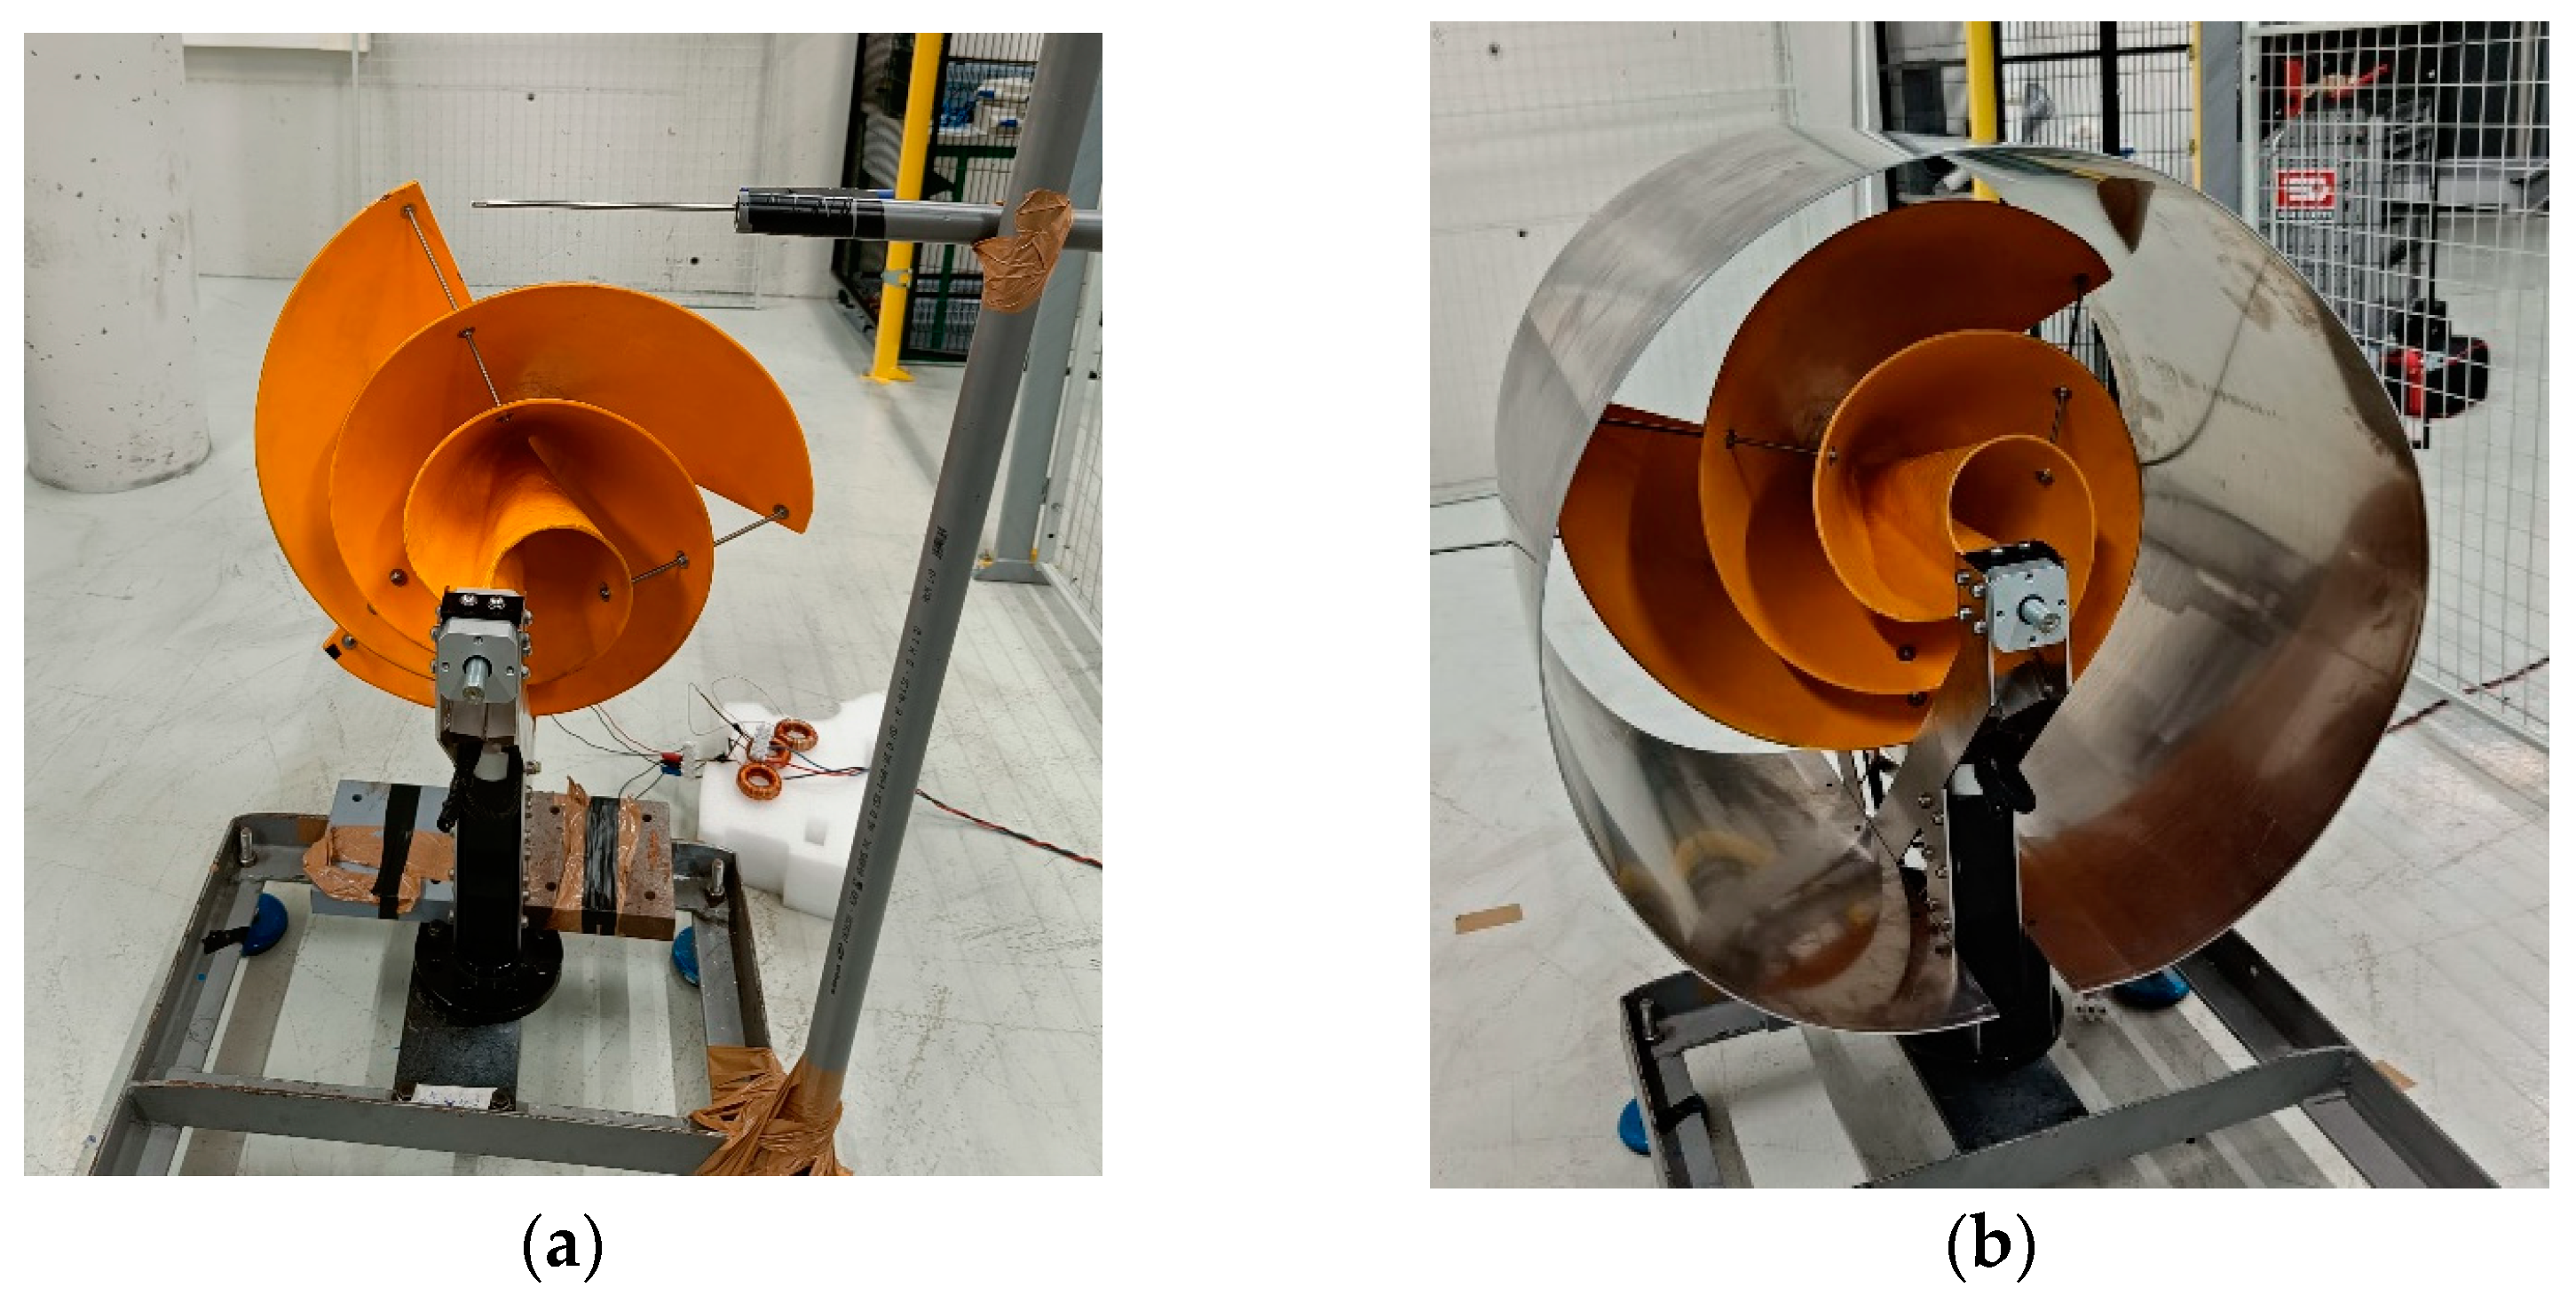
  • Follow the original patent of Ayanz (Figure 1a).
  • Cover the blades as much as possible with the tube, so the possibility to see and hear the blades rotating is minimized, which is demanded by many potential users of these types of small wind turbines.
  • Allow the possibility to include one or two (in front and behind if wanted) protective meshes at the tube in order to minimize bird deaths. This aspect is presented in the next sub-section.
Finally, it is worth mentioning that it is possible to use other different geometries to the cylindrical-shaped enclosure adopted in this article. Again, in this study a cylindrical tube has been used in order to follow the original Ayanz patent and mainly because this geometry is simpler to be materialized physically, and at the same time facilitates modifications of diameters or lengths. Further research and experiments can be carried out in future studies with different geometries of the enclosure. In fact, as commented previously, in reference [17], a computer-based simulation study has already been performed with a pseudo-conical geometry of enclosure (a tube with a slightly different diameter at input and output), showing that the performances of Cp can be further improved. However, empirical study of this fact is left for future research.
It is important to highlight that the same Archimedes Spiral Wind Turbine, generator, power electronic circuit, wind maker, and measurement system has been employed for characterizing this second wind turbine with a tube. All the conditions and elements are the same for both wind turbines. The only thing that changes is that the second tested wind turbine incorporates a tube with dimensions shown in Table 3.
Therefore, the measured power and Cp with the wind produced by the wind maker are shown in Figure 9. When comparing these results with the ones obtained from the wind turbine without a tube and shown in Figure 7, it is remarkable that the tube substantially increases the power generated. As described in Section 3.1, although the same frequency references are set at the wind maker in both experiments, the effective average wind speed obtained at the input of each wind turbine (with or without tube) is slightly different. Consequently, the assumed averaged wind speed at the input each turbine is also different (please carefully compare the wind speed values of Figure 7 and Figure 9). Thus, taking in mind this fact, it is concluded that at same wind conditions, the tube increases the power production of the spiral wind turbine, being able to extract more energy from the wind.
The physical reasons as to why this increase in power is achieved can be summarized as follows: First, the tube produces a Venturi effect, increasing the mass flow rate through the rotor plane of the wind turbine, therefore increasing its power coefficient [17]. Second, due to the effect of the tube, a suppression of the tip Vortex is produced, also shortly increasing the power coefficient [15,16,17]. This effect is nothing more than the result of the three-dimensional interaction that occurs at the tip between the two surfaces (intrados and extrados) of an airfoil. When effectively blocking the formation of that turbulent wake, the resulting torque (and therefore power) increases. In fact, being more precise, in [17] it is theoretically shown by means of computer-based simulations that the enclosure improves the pressure and velocity contours of the wind turbine. Basically, the effect of the enclosure generates a higher-pressure region upstream of the rotor blades and a lower-pressure region downstream of the blades, therefore increasing the pressure ratio across the wind turbine, which consequently increases the Cp coefficient [17]. Furthermore, analyzing the velocity contours, it is noticed that due to the effect of the enclosure, low-velocity regions are created behind the tube and downstream of the turbine’s rotor shaft. Accordingly, the enclosure captures more streamlines and directs them to the turbine rotor, also effectively increasing the Cp coefficient [17].
In contrast, it is important to highlight that with a certain yaw angle of the tube concerning the incoming flow, a decrease in the generated power is produced, not only because the air flow enters with a given inclination, but because the same collision with the walls of the tube will form turbulent structures that will affect how the turbine sees the incoming air. Consequently, the wind turbine must be well oriented to the actual wind flow direction to obtain the above-presented power and Cp coefficient performance (Figure 9). Thus, for guarantying a good orientation to the wind direction, a vane should be incorporated to the wind turbine that assist the orientation, as shown in Section 3.4.
On the other hand, the powers obtained in these experimental tests together with the achieved Cp values are in quite good agreement with references [15,16,17]. It must be highlighted that the wind speed measurement here is critical. Note that when the wind maker is employed when a constant speed reference is set, it produces a non-constant wind speed through the input cross-area of the wind turbine (see Figure 5). Then, an averaged wind speed is calculated from the measured nine points and adopted as the unique wind speed, Vwind. Then, this unique wind speed has been considered for calculating Cp, for instance according to Equation (1). Thus, the accuracy of facts such as the wind speed measurements, the number of points where these measurements are made, the wind maker behavior, etc., determine the accuracy and reliability of the experimental tests obtained. The authors have found very good repeatability in all the experimental tests that have been carried out for this article.
It is also worth mentioning again that the power in the above graphs is the mechanical power at the shaft (neglecting mechanical power losses), and that in reality the electrical power obtained at the output resistance is lower and depends on electrical losses. By way of example, the difference between the two can be seen in Figure 10.

3.4. Final Wind Turbine Proposal

Once seen that the incorporation of the tube can effectively increase the generated power of the spiral wind turbine, the final two modifications are made to the wind turbine as depicted in Figure 11. The first incorporated element is the metallic mesh at the input of the tube, in order to avoid birds entering to the inside of the wind turbine. This protection mesh prevents potential damages to the birds. In addition, it reduces the visual impact and noise produced by the wind turbine. Note that this enclosure considerably reduces the fact of continuously watching and hearing the blades rotating, which is quite an important benefit for many potential users that will install the wind turbines on the roofs of their houses. It is important to emphasize that in the test carried out with the fine mesh shown in Figure 11b, the power generated has not been altered; the effect of the mesh on the power generated is almost inappreciable. Therefore, it has been proven that it does not affect the power generated, being a significant improvement in terms of visual, noise, and bird protection without any technical drawbacks and practically no cost.

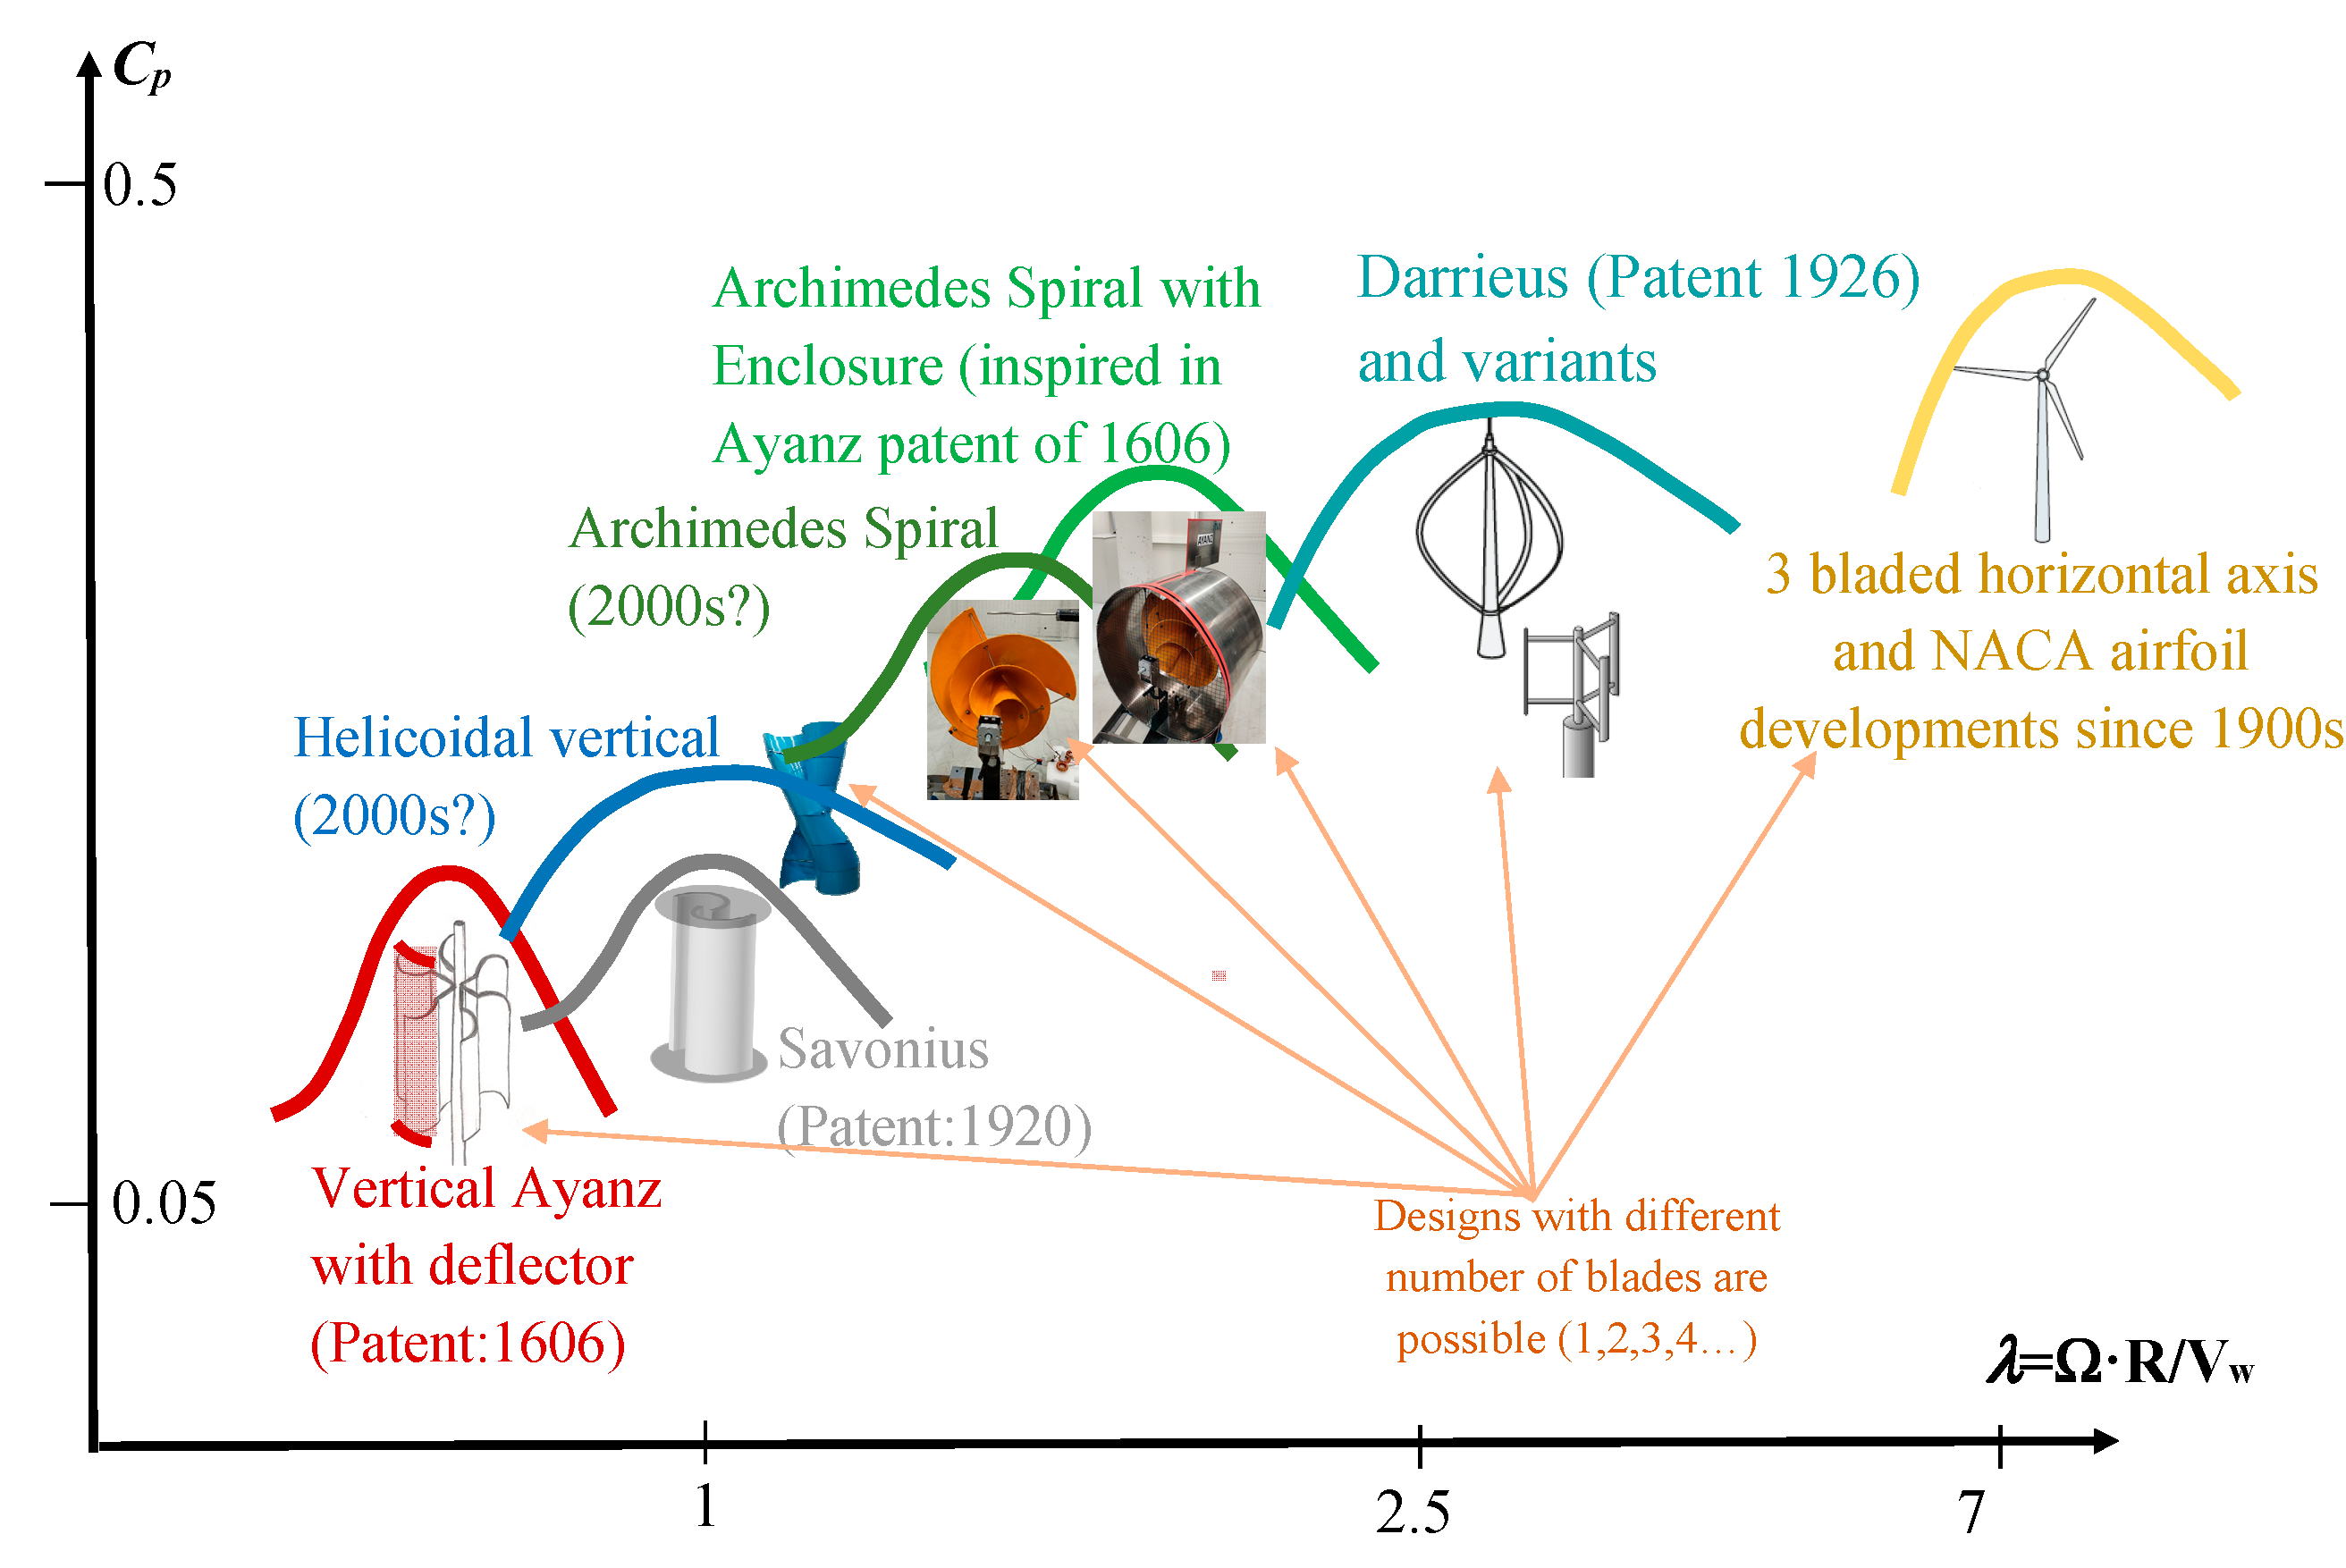
3.5. Comparison to Other Common Wind Turbines

Finally, in this sub-section, the studied Ayanz Wind Turbine with enclosure is qualitatively compared to other common small wind turbines. The comparison does not pretend to be exhaustive. Instead, a general or conceptual contextualization of the advantages and disadvantages of the studied wind turbine is provided. Thus, as depicted in Figure 12, the studied Ayanz Wind Turbine with the cylindrical enclosure presents a considerably good Cp, at relatively low λ optimum.
This fact potentially enables to this turbine to capture a reasonably good amount of energy from the wind, compared to other turbine morphologies, at relatively low rotation speeds.
In addition, in Table 4, qualitative advantages and disadvantages of the Archimedes Spiral Wind Turbine with enclosure are provided, in contrast to other popular small wind turbines. As can be seen, the studied wind turbine is well situated in many important aspects. For instance, it is very good in terms of noise, prevention of bird deaths, and avoidance of seeing the blades rotating, which are quite subjective advantages depending on the person who is going to install the wind turbine near his house for instance. On the other hand, it provides quite good performance in terms of energy generation capacity: good Cp, and capacity to operate and low and variable winds well.

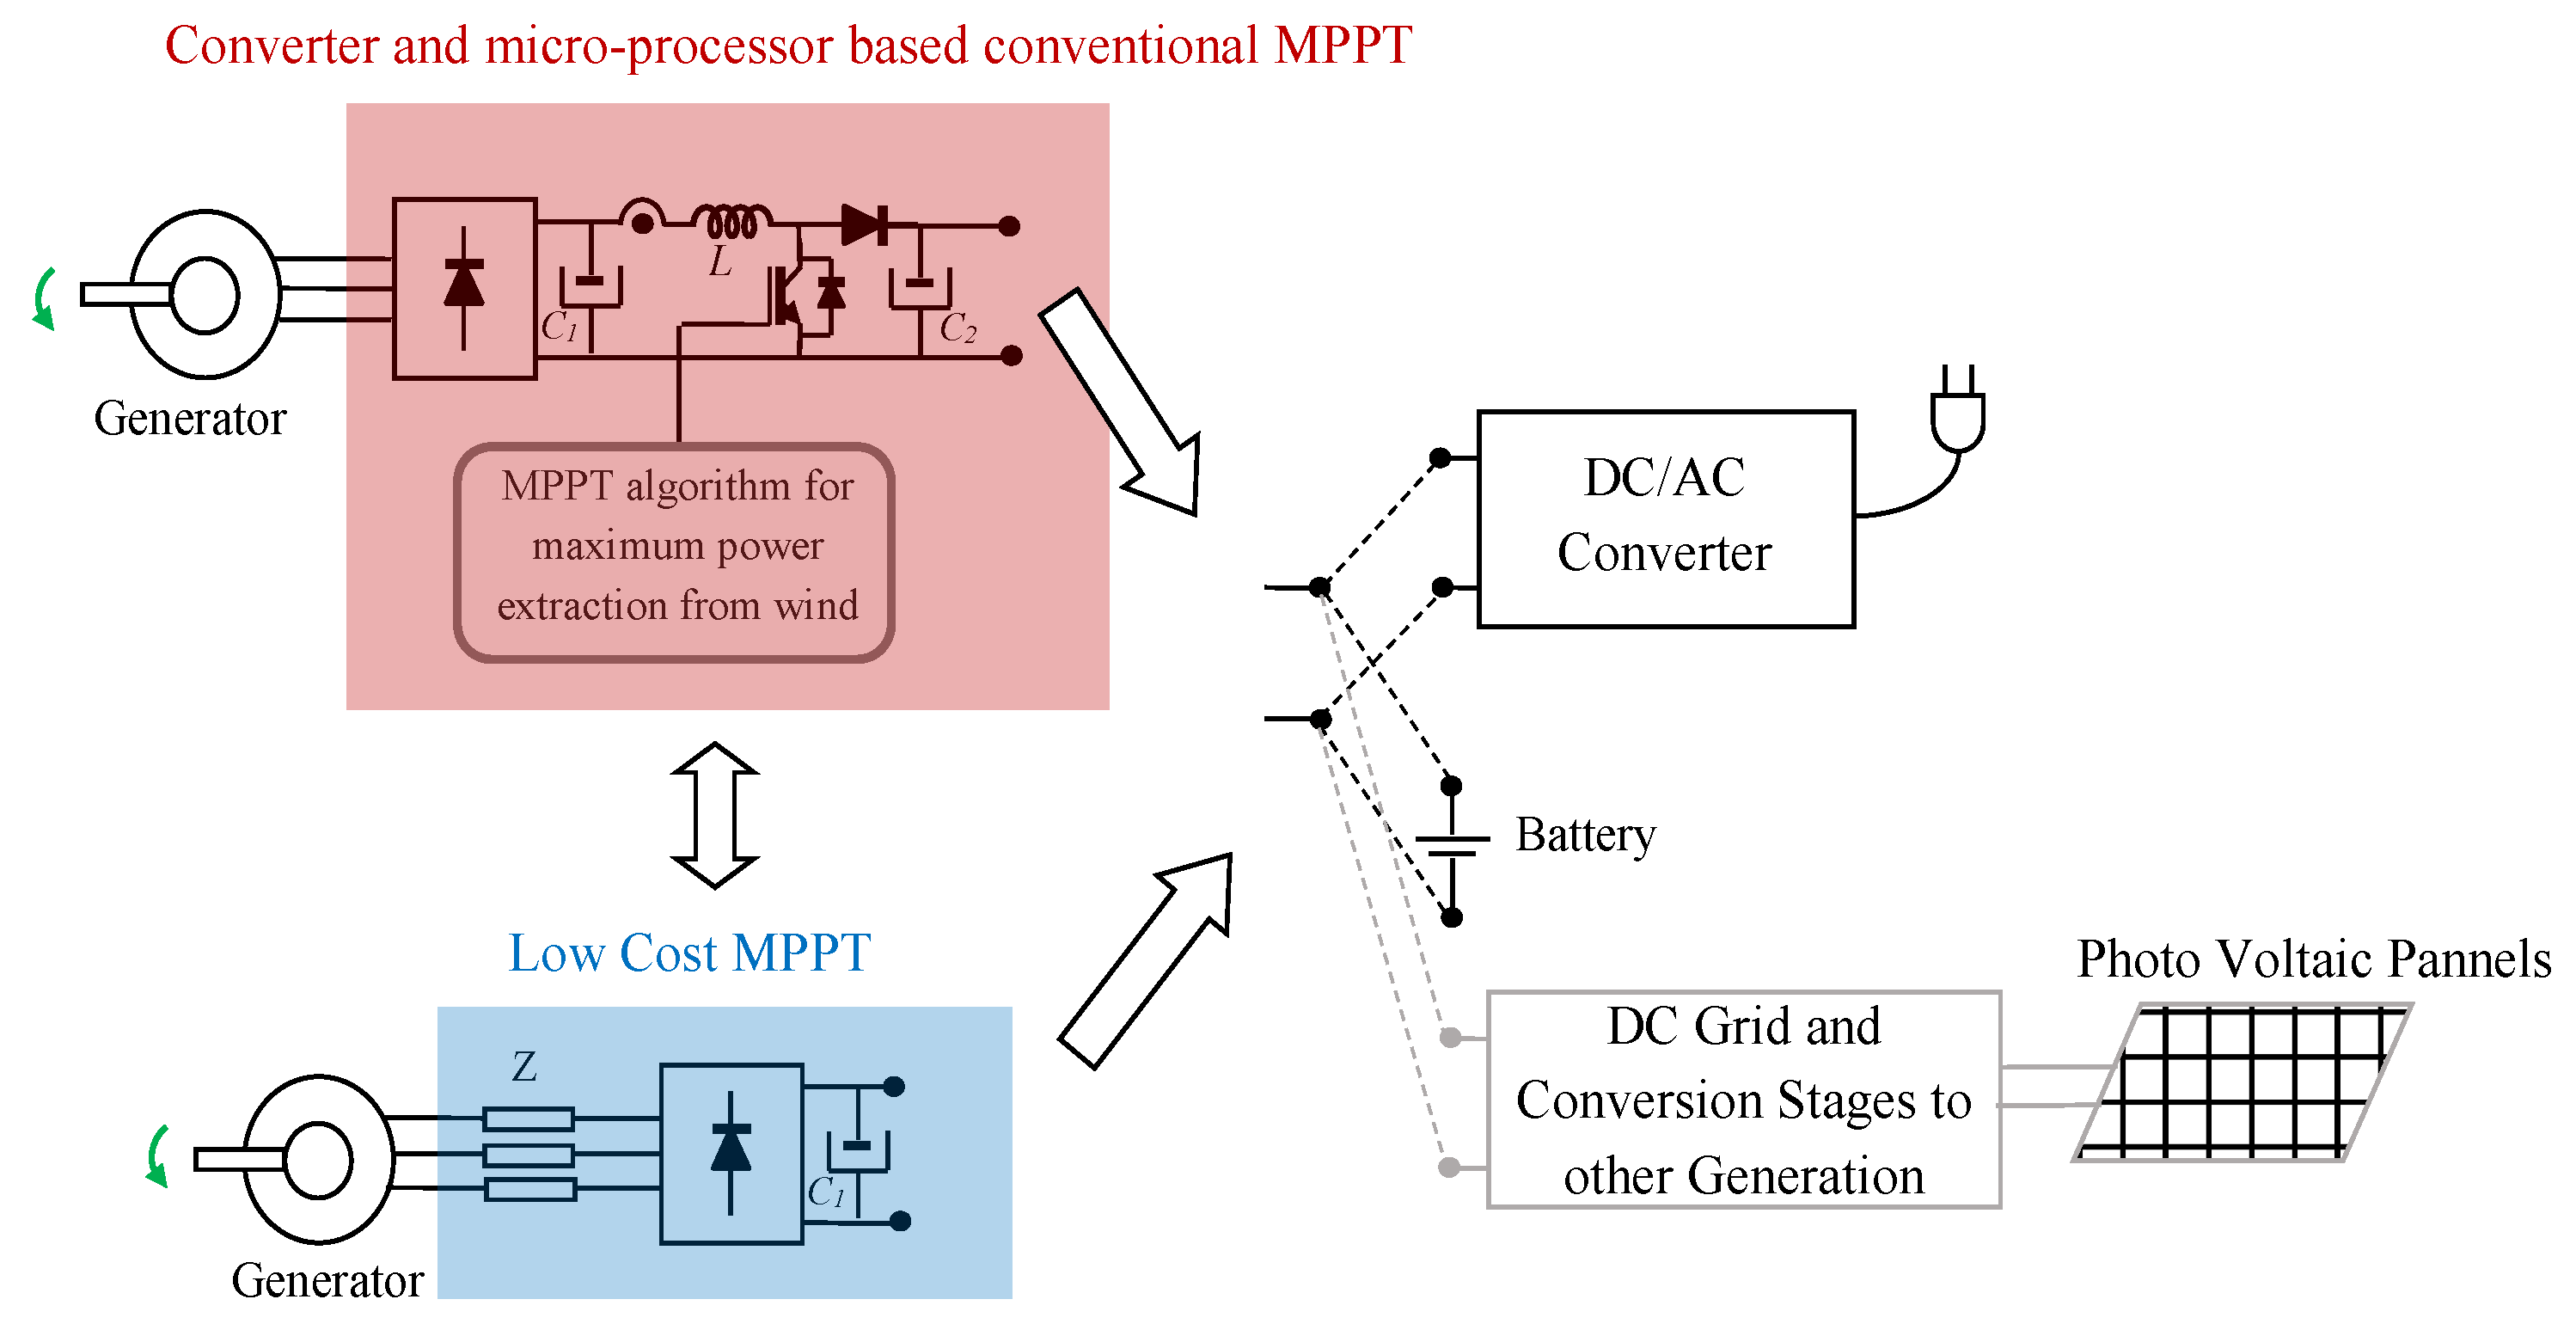
4. Low-Cost Maximum Power Point Tracking (MPPT) Strategy

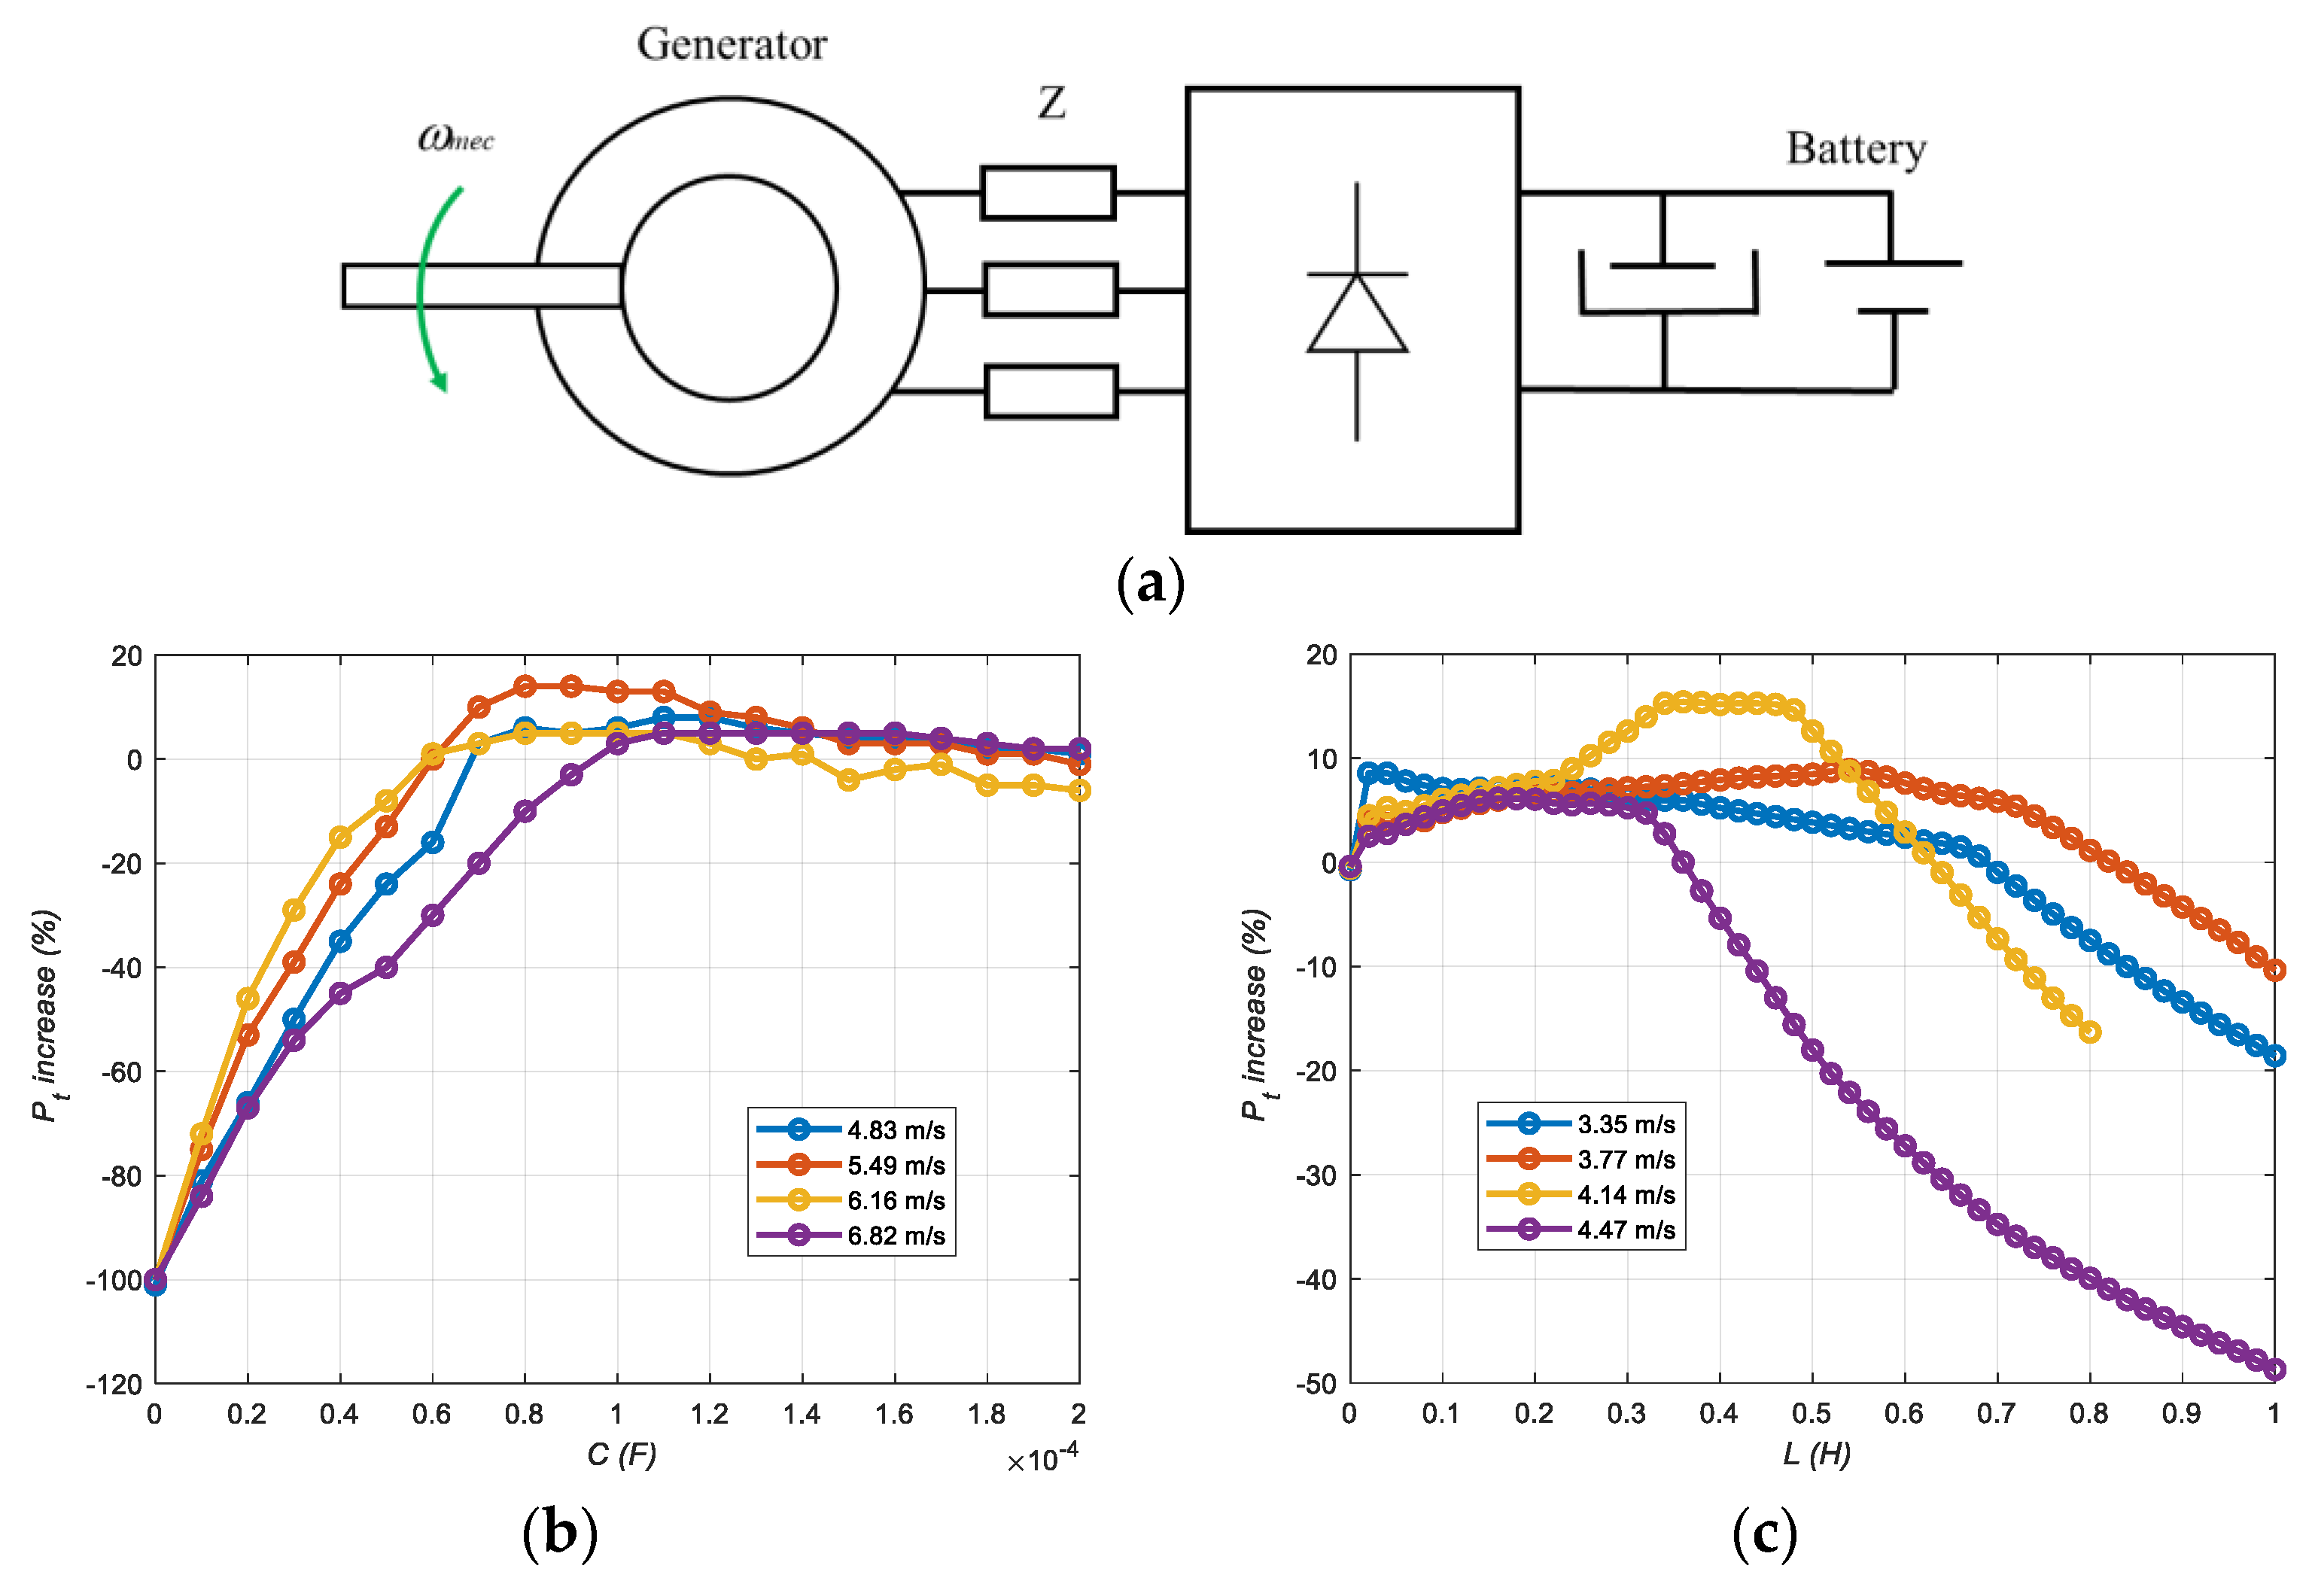
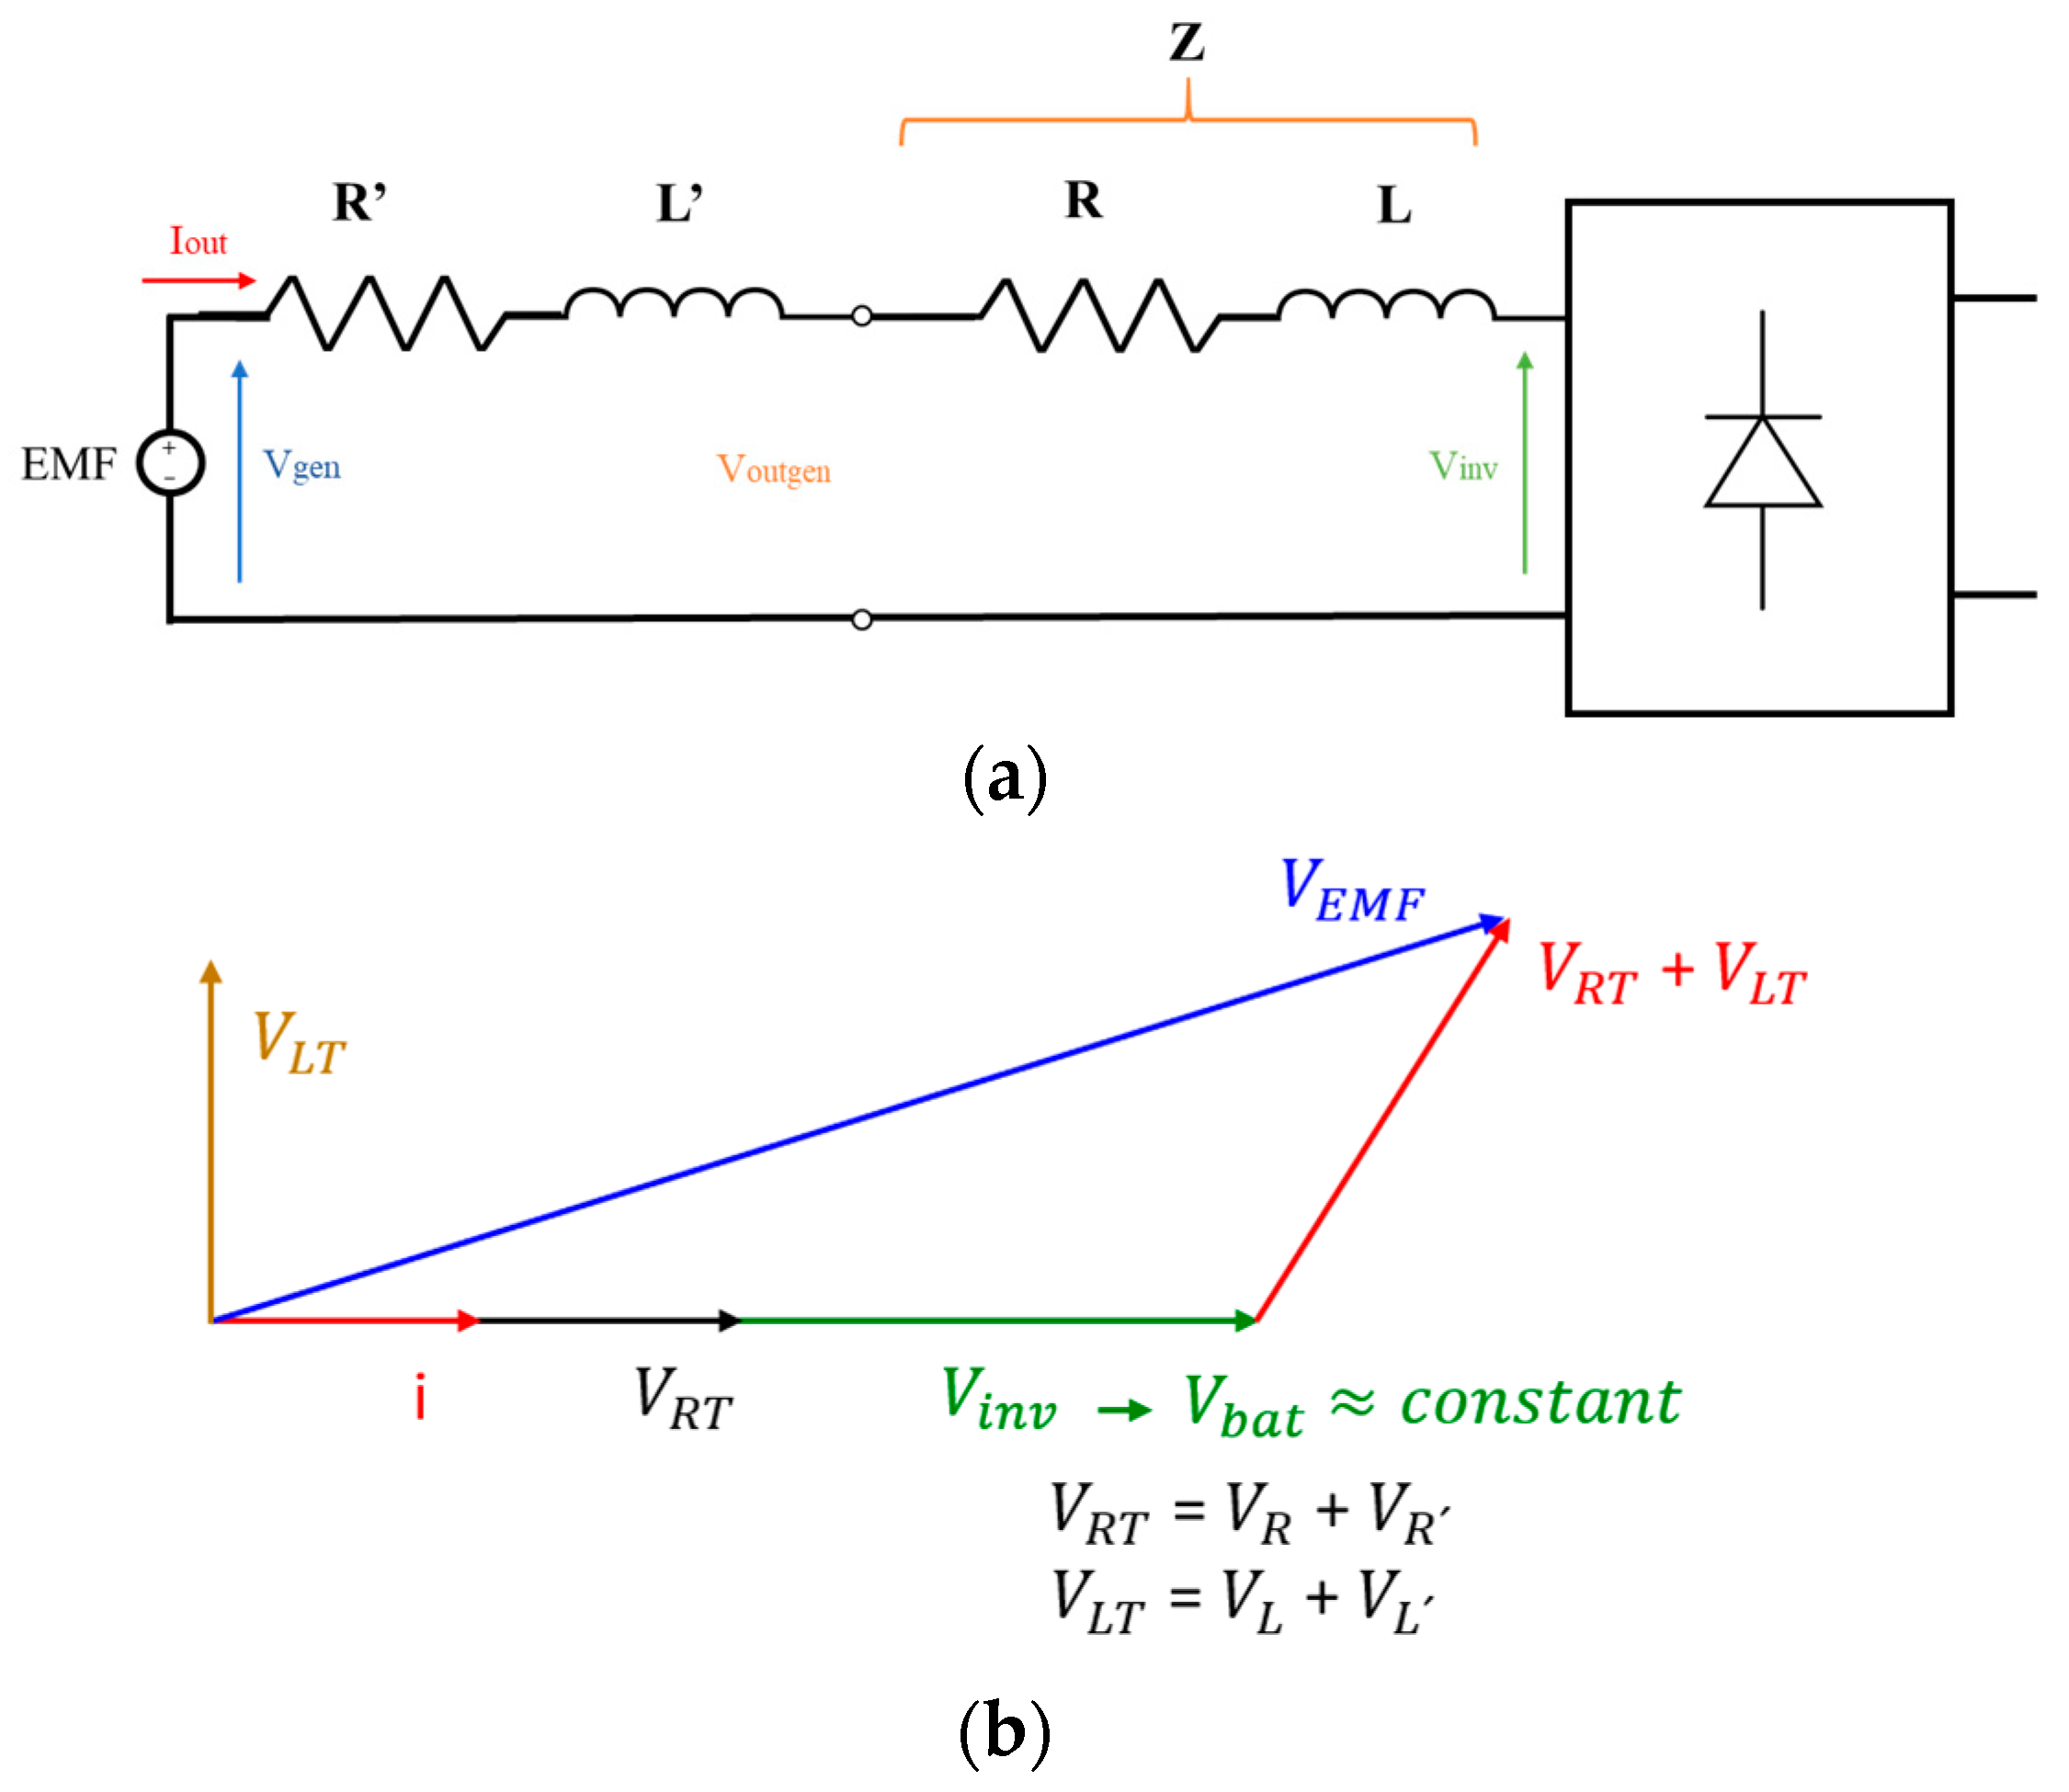
4.1. Substitution of the DC-DC Converter and Microprocessor by a Three-Phase Impedance at the AC Side

This section proposes a simplified power electronic conversion stage for small wind turbines. As graphically represented in Figure 13, typically, for maximum power extraction, a DC-DC controlled converter and microprocessor is used with its corresponding control algorithm [24]. However, in this article, a simplified conversion stage configuration is proposed that substitutes these two elements (DC-DC converter and microprocessor) by a three-phase impedance at the AC side. The wind turbine that will be employed for all this section is the Ayanz Wind Turbine with a tube, shown in Figure 11, since it has provided the best power generation performance.
The idea is to take advantage of the variable voltage droop of the AC side located at impedance Z, achieving an approximated curve of the MPPT as graphically represented in Figure 14. Note that this voltage droop is in function of the current that crosses the impedance, which is bigger at bigger currents. So, if the wind increases, the wind turbine tends to increase the generated power, also increasing the AC current amplitude since the DC side voltage is maintained constant by the battery. Therefore, is possible to reach quite a good approximation of the MPPT curve by considerably reducing the power circuit necessary and its complexity.

4.2. Analysis and Design of the AC Side Impedance for the Proposed Low-Cost MPPT

First, the most appropriate DC side voltage has been decided, using the following experimental-based test. Having a given AC generator for the wind turbine with the tube already, the power electric circuit presented in Figure 15a has been mounted and the generated power has been measured at different wind speeds. In Figure 15b, the previously obtained ideal MPPT curve (Figure 10) is compared with two voltages at the DC side of the circuit in Figure 15a; 24 V (two 12 V batteries in series) and 40 V (three different 12 V batteries in series, charged to 13.3 V). It can be seen that using three batteries in series (40 V) obtains generated powers closer to the ideal MPPT curve, rather than using lower DC voltages (less battery voltage).
Hence, once determined that three batteries in series (40 V) is a good initial point for this wind turbine generator, the next objective is to more closely approach the ideal MPPT curve by adding the AC side located at impedance Z. In order to achieve this, a computer-based simulation study has been carried out. Hence, by using the Electrical Engineering Specialized Library of Matlab-Simulink R2022a, the power circuit and wind turbine model of Figure 16a has been implemented including the AC side impedance Z. A capacitive or inductive impedance in series with the three phases of the generator has been considered, with the objective of increasing the generator voltage and, therefore, generating a little more power than without the AC side impedance. The impedances have been changed in several simulations and the generated power has been measured in all cases at different wind conditions.
For capacitive impedances, tests have been carried out with capacitances from 1 nF to 200 μF, obtaining little or no improvement as can be seen in Figure 16b. However, in the simulations with inductances from 0 to 1 H, it can be determined that there is a range of inductances in which the power is increased in all the wind speed range analyzed, as can be seen in Figure 16c. Thus, within all these obtained points, the 0.32 H inductance has been chosen.
Thus, in Figure 17, it is demonstrated that with a DC voltage of 40 V (three batteries in series at 13.3 V of charge) and a chosen impedance of 0.32 H at the AC side, a relevant improvement at the generated power is obtained at the studied wind speed range, becoming reasonably close to the ideal MPPT blue curve.

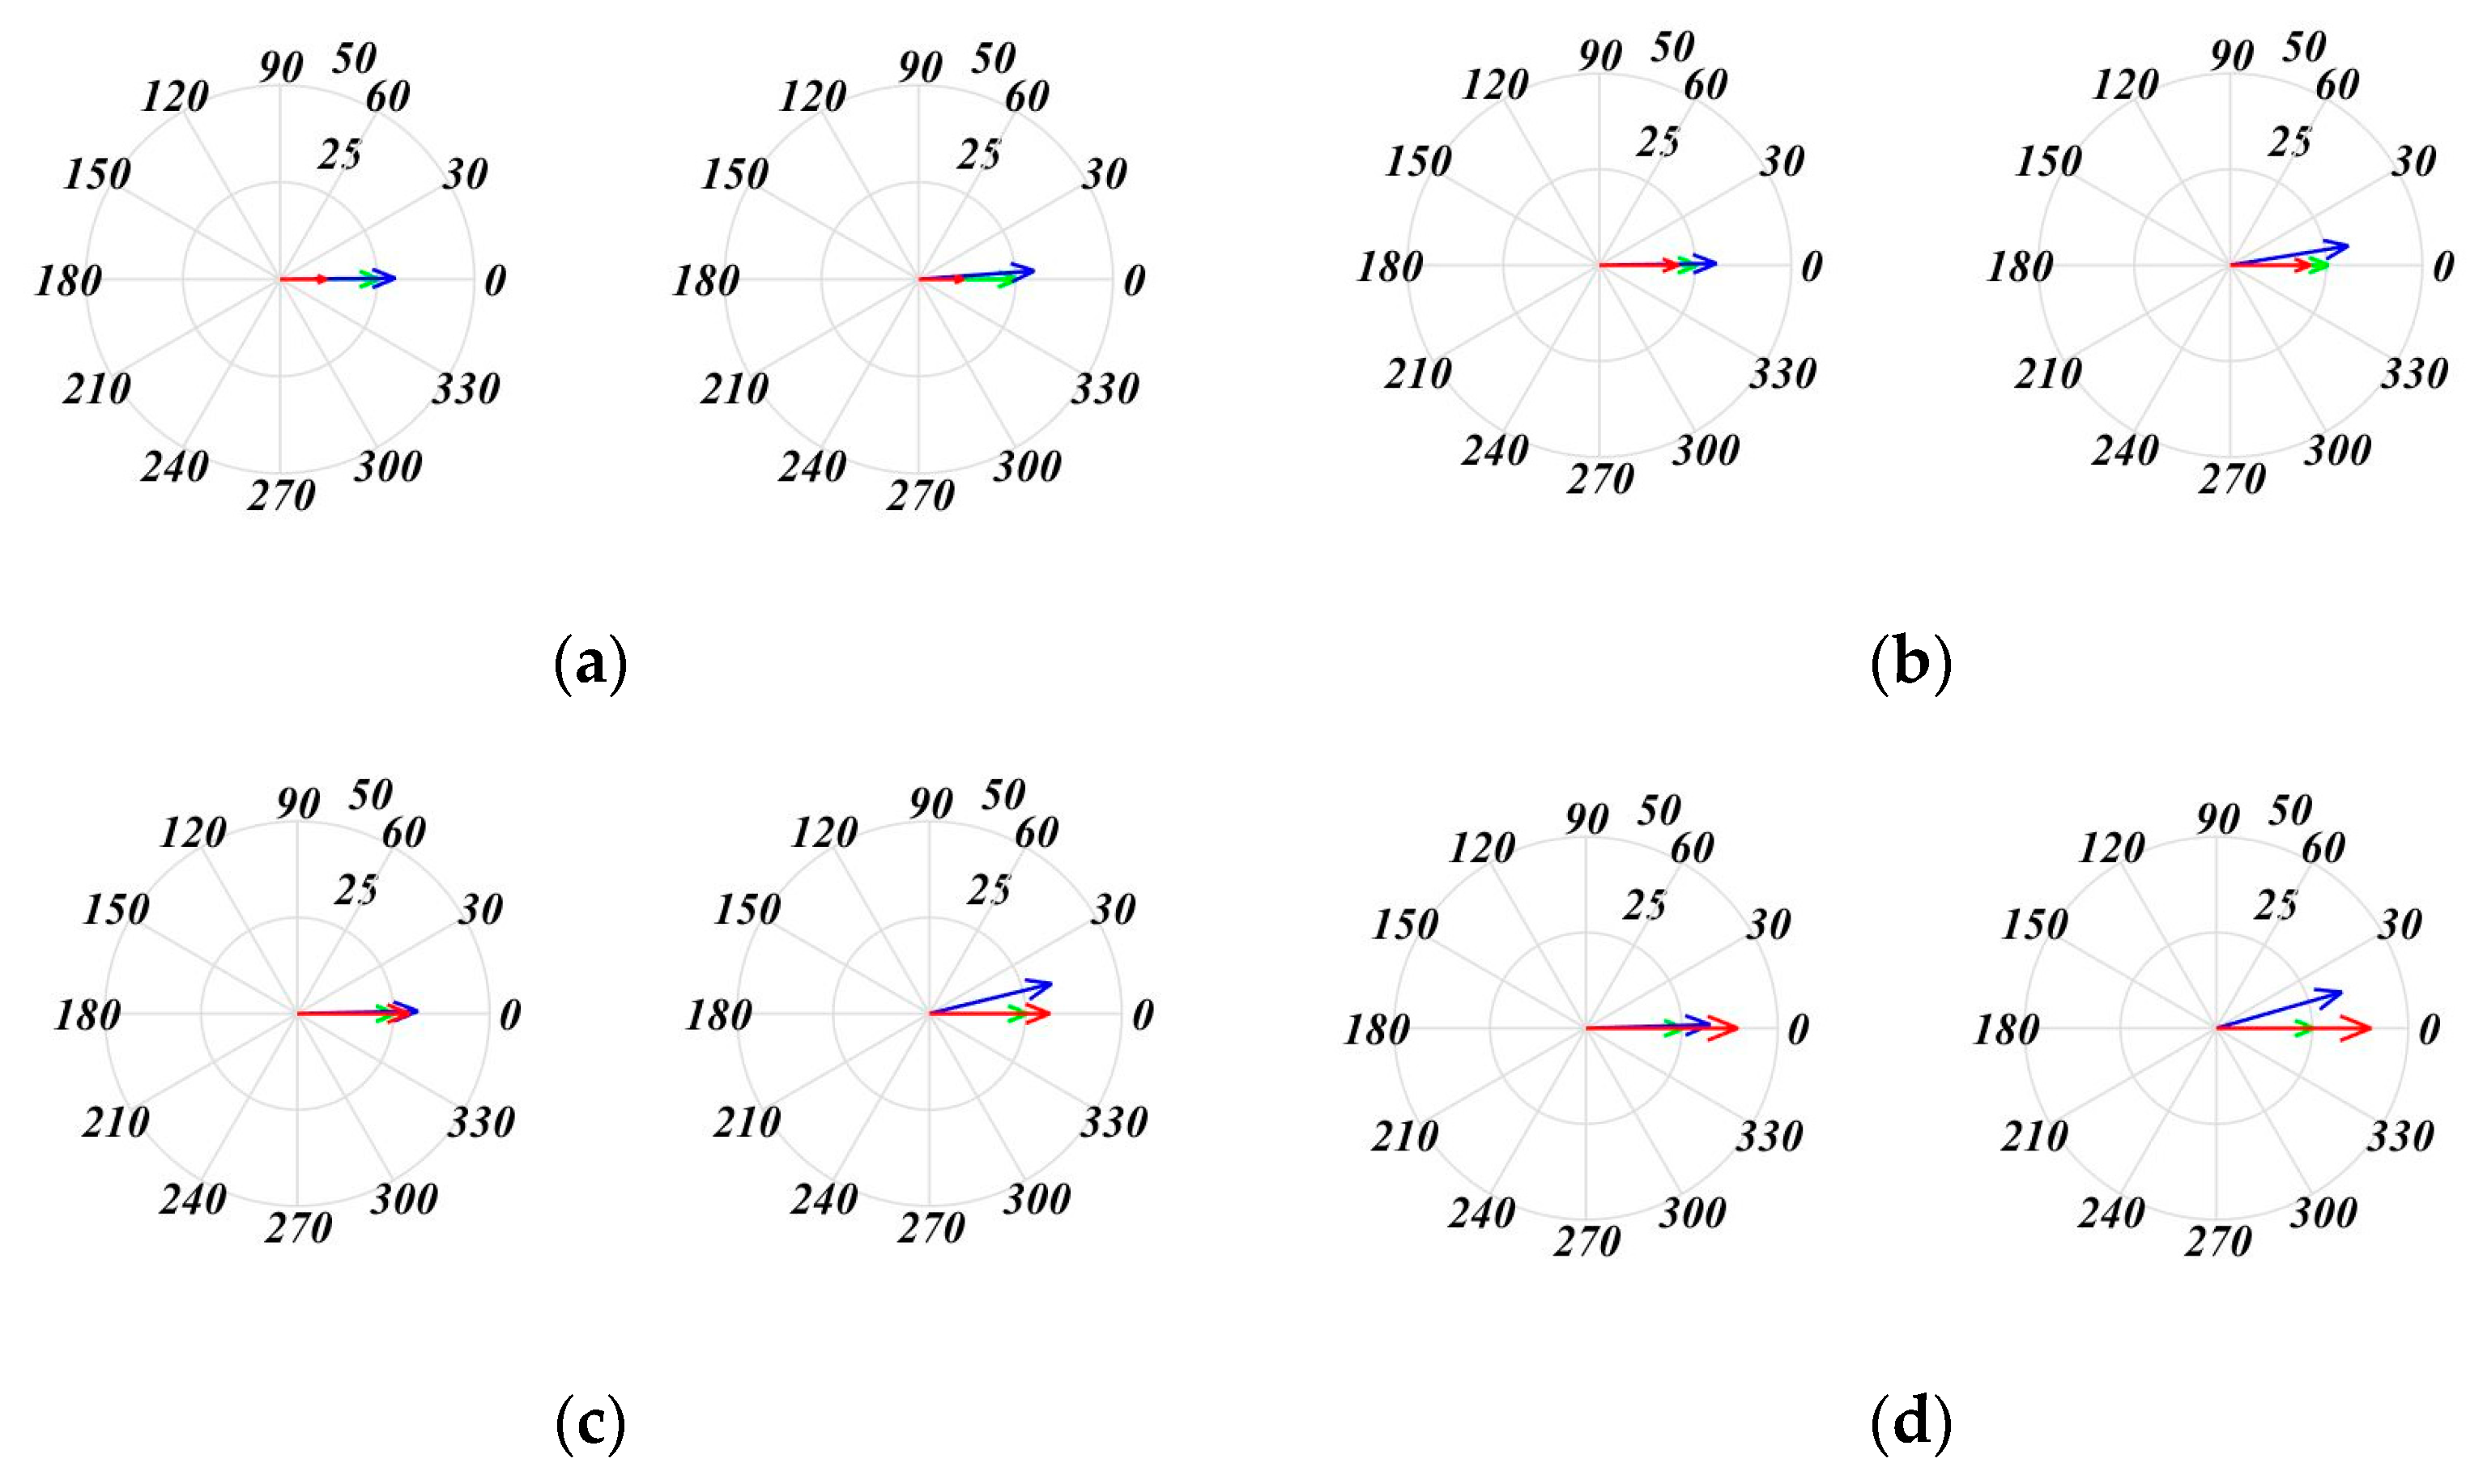
4.3. Physical Explanation of the Impedance Based Low-Cost MPPT and THD Performance of the Current

A physical explanation of these results can be based on the space vector diagrams obtained of the equivalent electric circuit of the generator and power conversion system. The simplified single phase, equivalent electric circuit, and its phasor diagram of the fundamental components of the voltages and currents is depicted in Figure 18a,b. The AC voltage Vinv at the input of the diode-based rectifier is fixed constant by the DC constant voltage of the batteries. Then, it has been observed that the current at the AC side is always more or less in phase with Vinv voltage, as represented in the space vector diagram. Thus, with these two facts in mind, the bigger the resistance and inductance values of the generator and the inserted inductance Z, the bigger the voltage VEMF at the generator will be, increasing the rotating speed of the generator and therefore getting closer to the ideal MPPT curve of Figure 16.
Thus, again by using the computer-based simulation model represented in Figure 16a, the simulated space vector diagrams are now shown at different wind conditions in Figure 19. Following the color notation used in Figure 18, the generator output current is shown in red, the generator voltage in blue, and the inverter voltage input in green. On the left of each sub-figure are the space vector diagrams corresponding to the circuit without AC side inductance. On the right, the space vector diagrams are represented with the AC side impedance. In all the cases, it can be seen how, thanks to the voltage drop at the inductance, the generator voltage is increased, slightly increasing the power supplied to the battery. The chosen inductance is the optimum inductance with which the maximum power is achieved at each wind speed (Figure 16b). The evaluated wind speeds are 4.82 m/s, 5.49 m/s, 6.15 m/s, and 6.82 m/s. In all cases, it can be seen that the fundamental component of Vinv is constant and fixed by the battery’s voltage. Then, the fundamental component of current i is basically at the same phase angle as voltage Vinv. Then, the stronger the wind, the bigger the amplitude of the current. Finally, at each wind speed, due to the effect of the inductance, an increase in generator voltage VEMF is obtained, resulting in a slight increase in generated power.
In addition to the space vector diagrams, the harmonic distortion values (THD) of the current on the AC side has been evaluated using the computer-based simulation model. The improvement effect caused by the inclusion of an inductance can be clearly seen here, considerably reducing the current distortion. Table 5 shows the variation in the harmonic distortion with and without inductance at different wind speeds. This THD improvement also brings as benefits a reduction in torque harmonics, also reducing the mechanical stress and possible mechanical and electrical resonance problems.

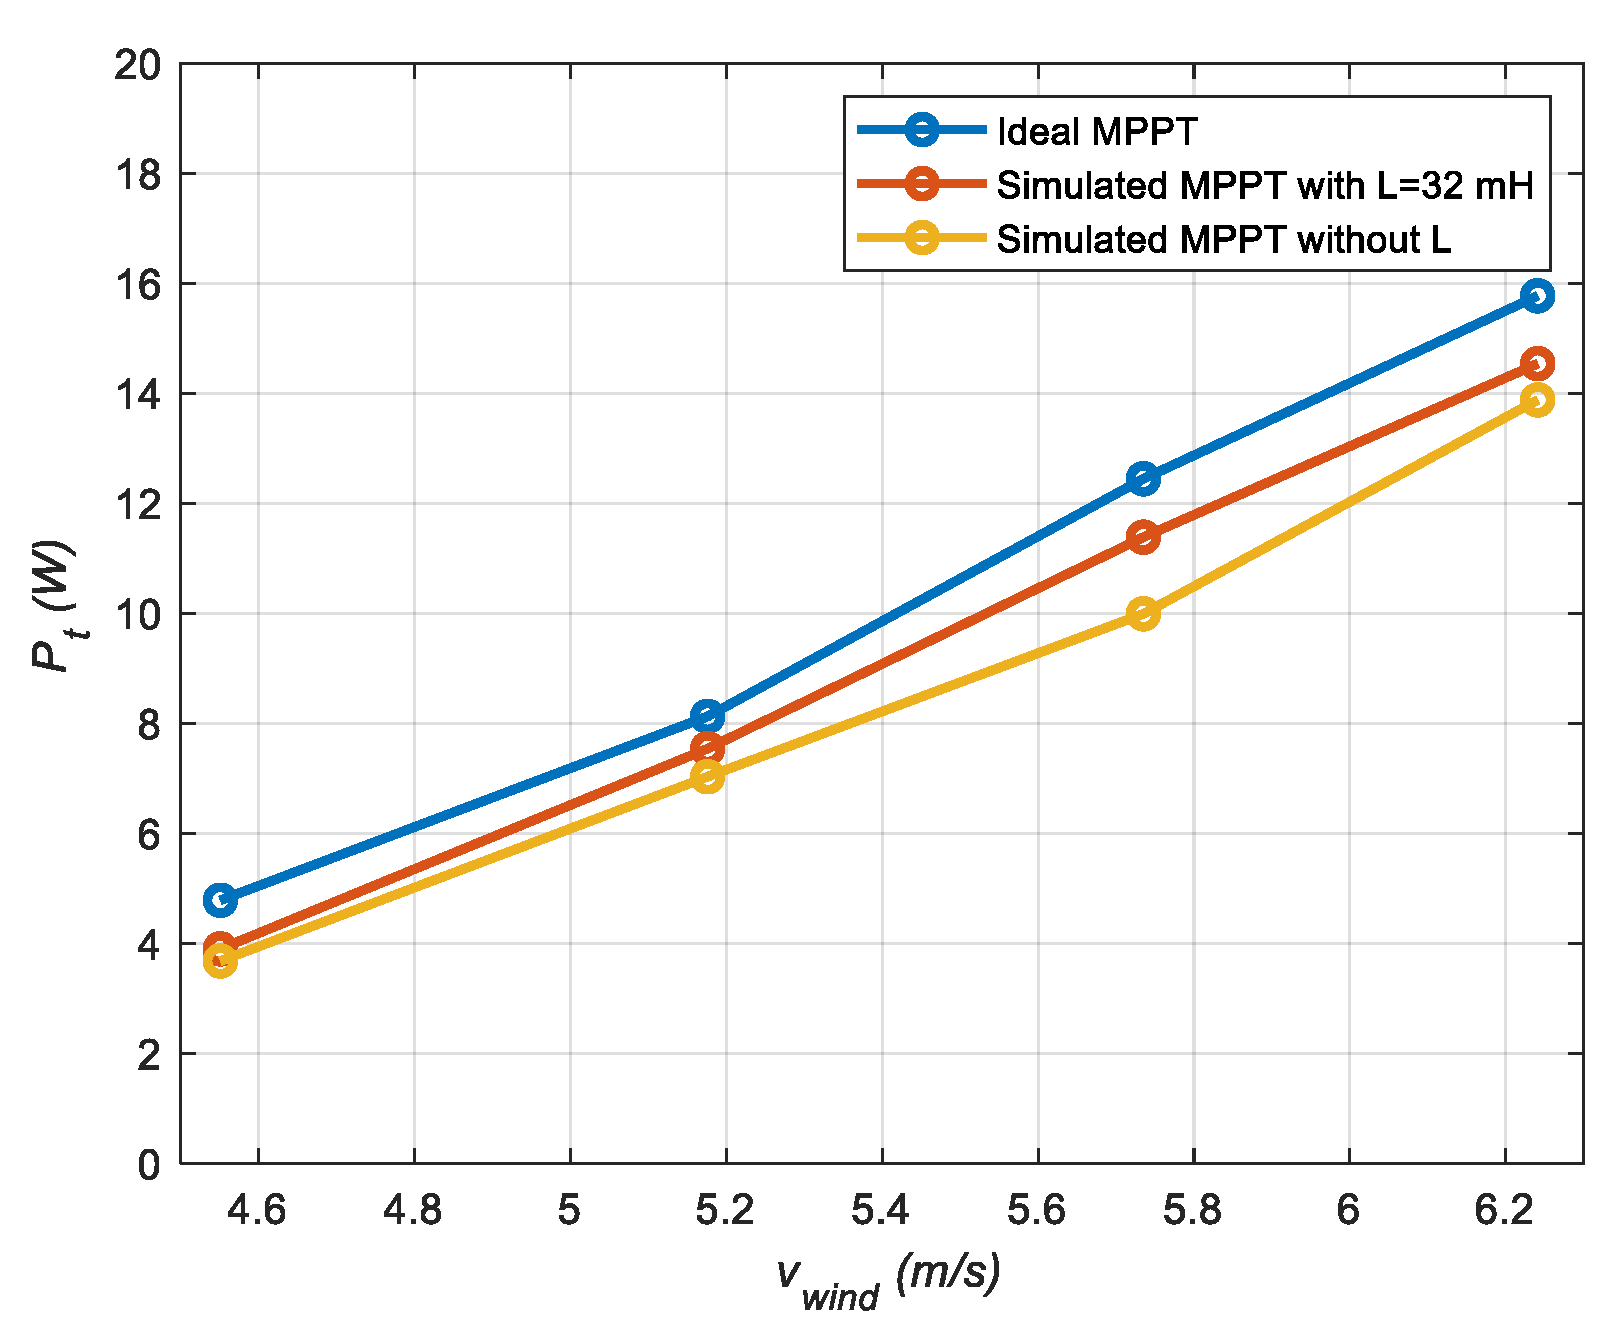
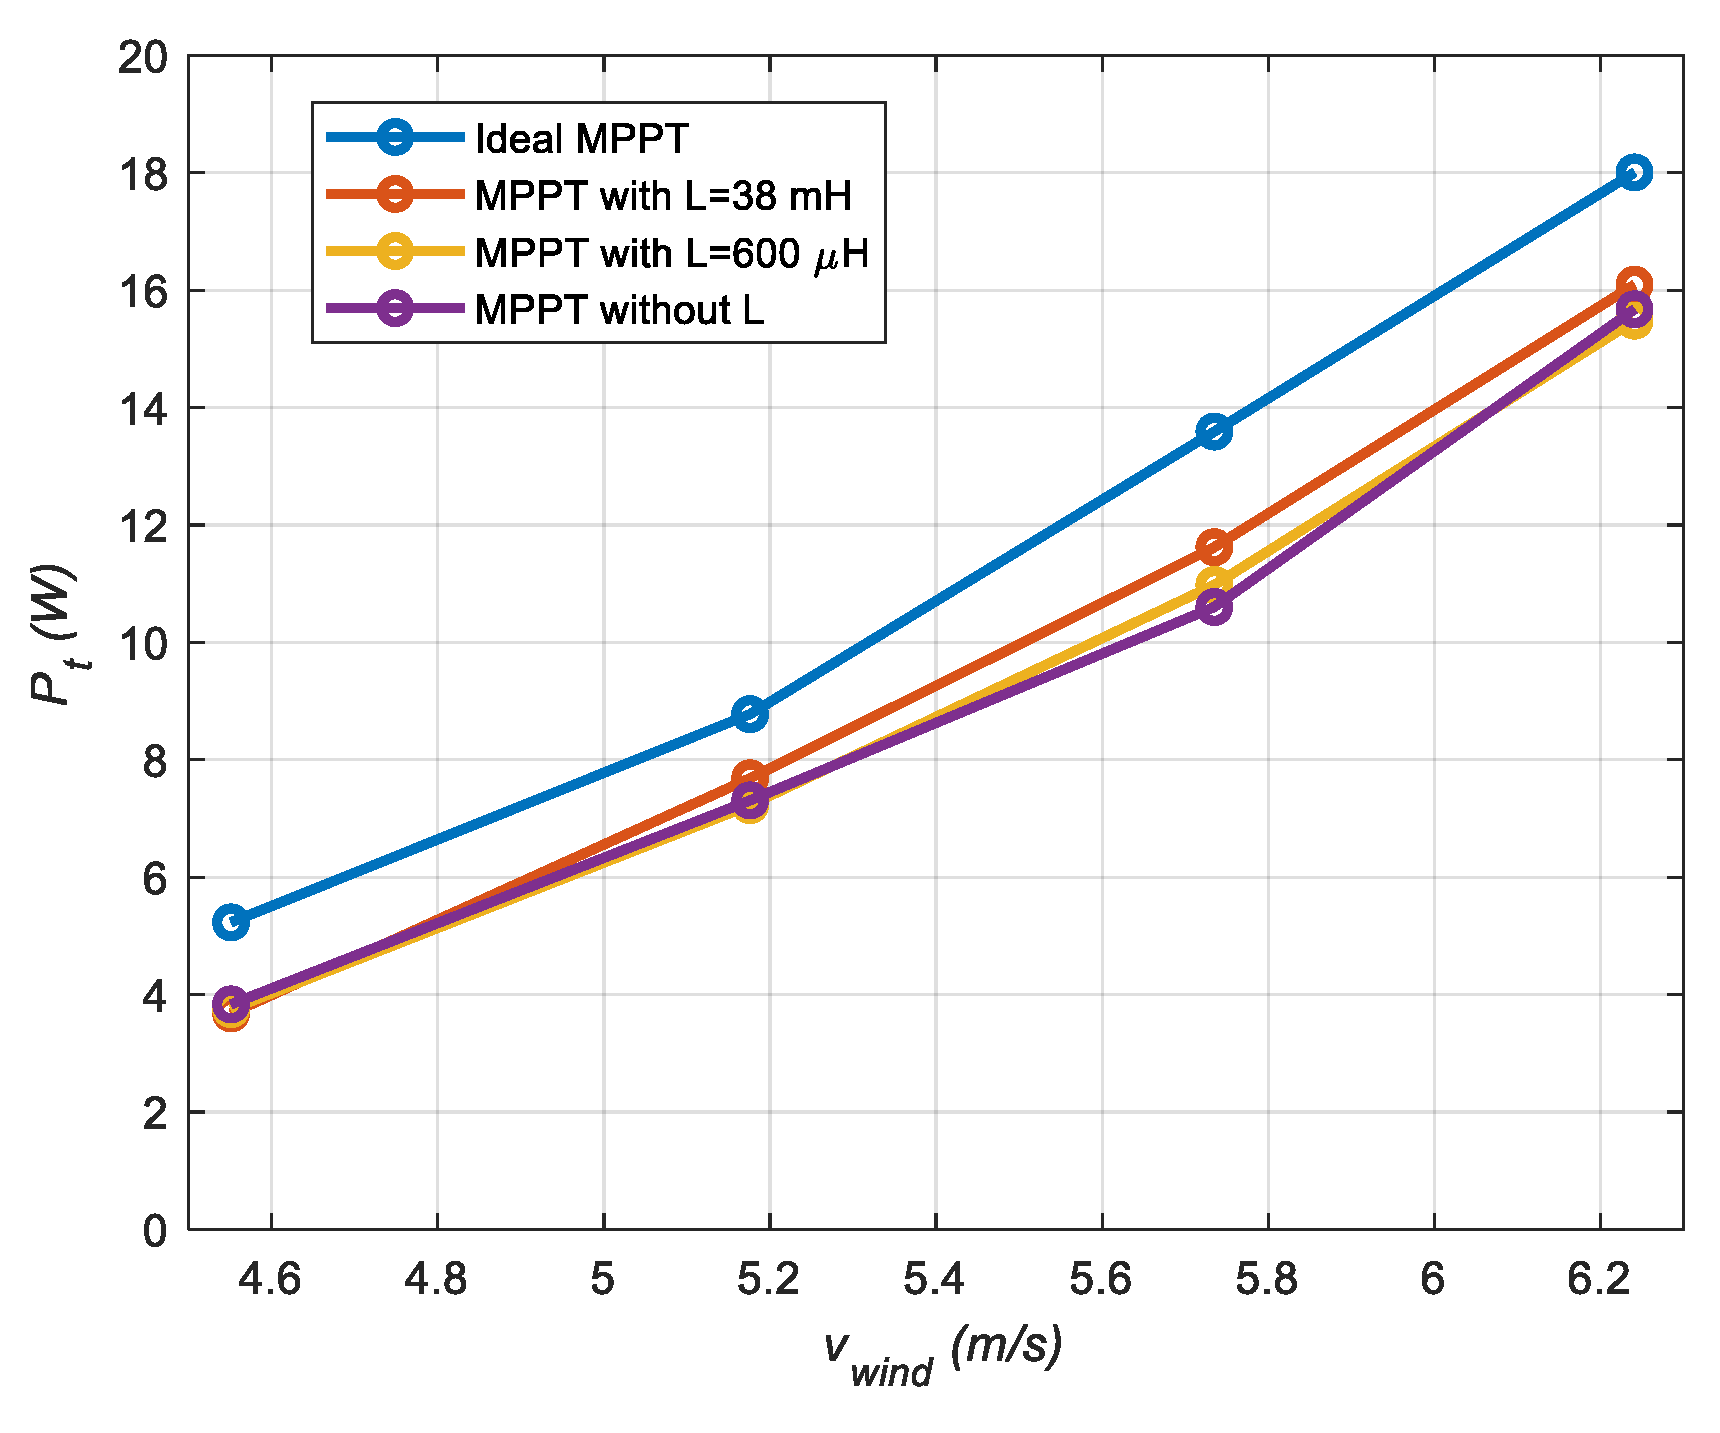
4.4. Experimental Validation

To conclude this section, experimental validation tests have been carried out with the available inductances in our laboratory of 600 μH (low value) and 38 mH (high value). The results obtained are provided in Figure 20, where it can be seen that the simulation-based inferences carried out in previous section agree with the experimental results, demonstrating that the employed inductances bring an improvement to the generated power. Note that the improvement can be achieved quite simply with this MPPT idea. If further increasing the L value, a corresponding increase in the generated power will be produced. Note that it is not actually necessary to find the optimum value of L to obtain a reasonably good improvement in generated power.

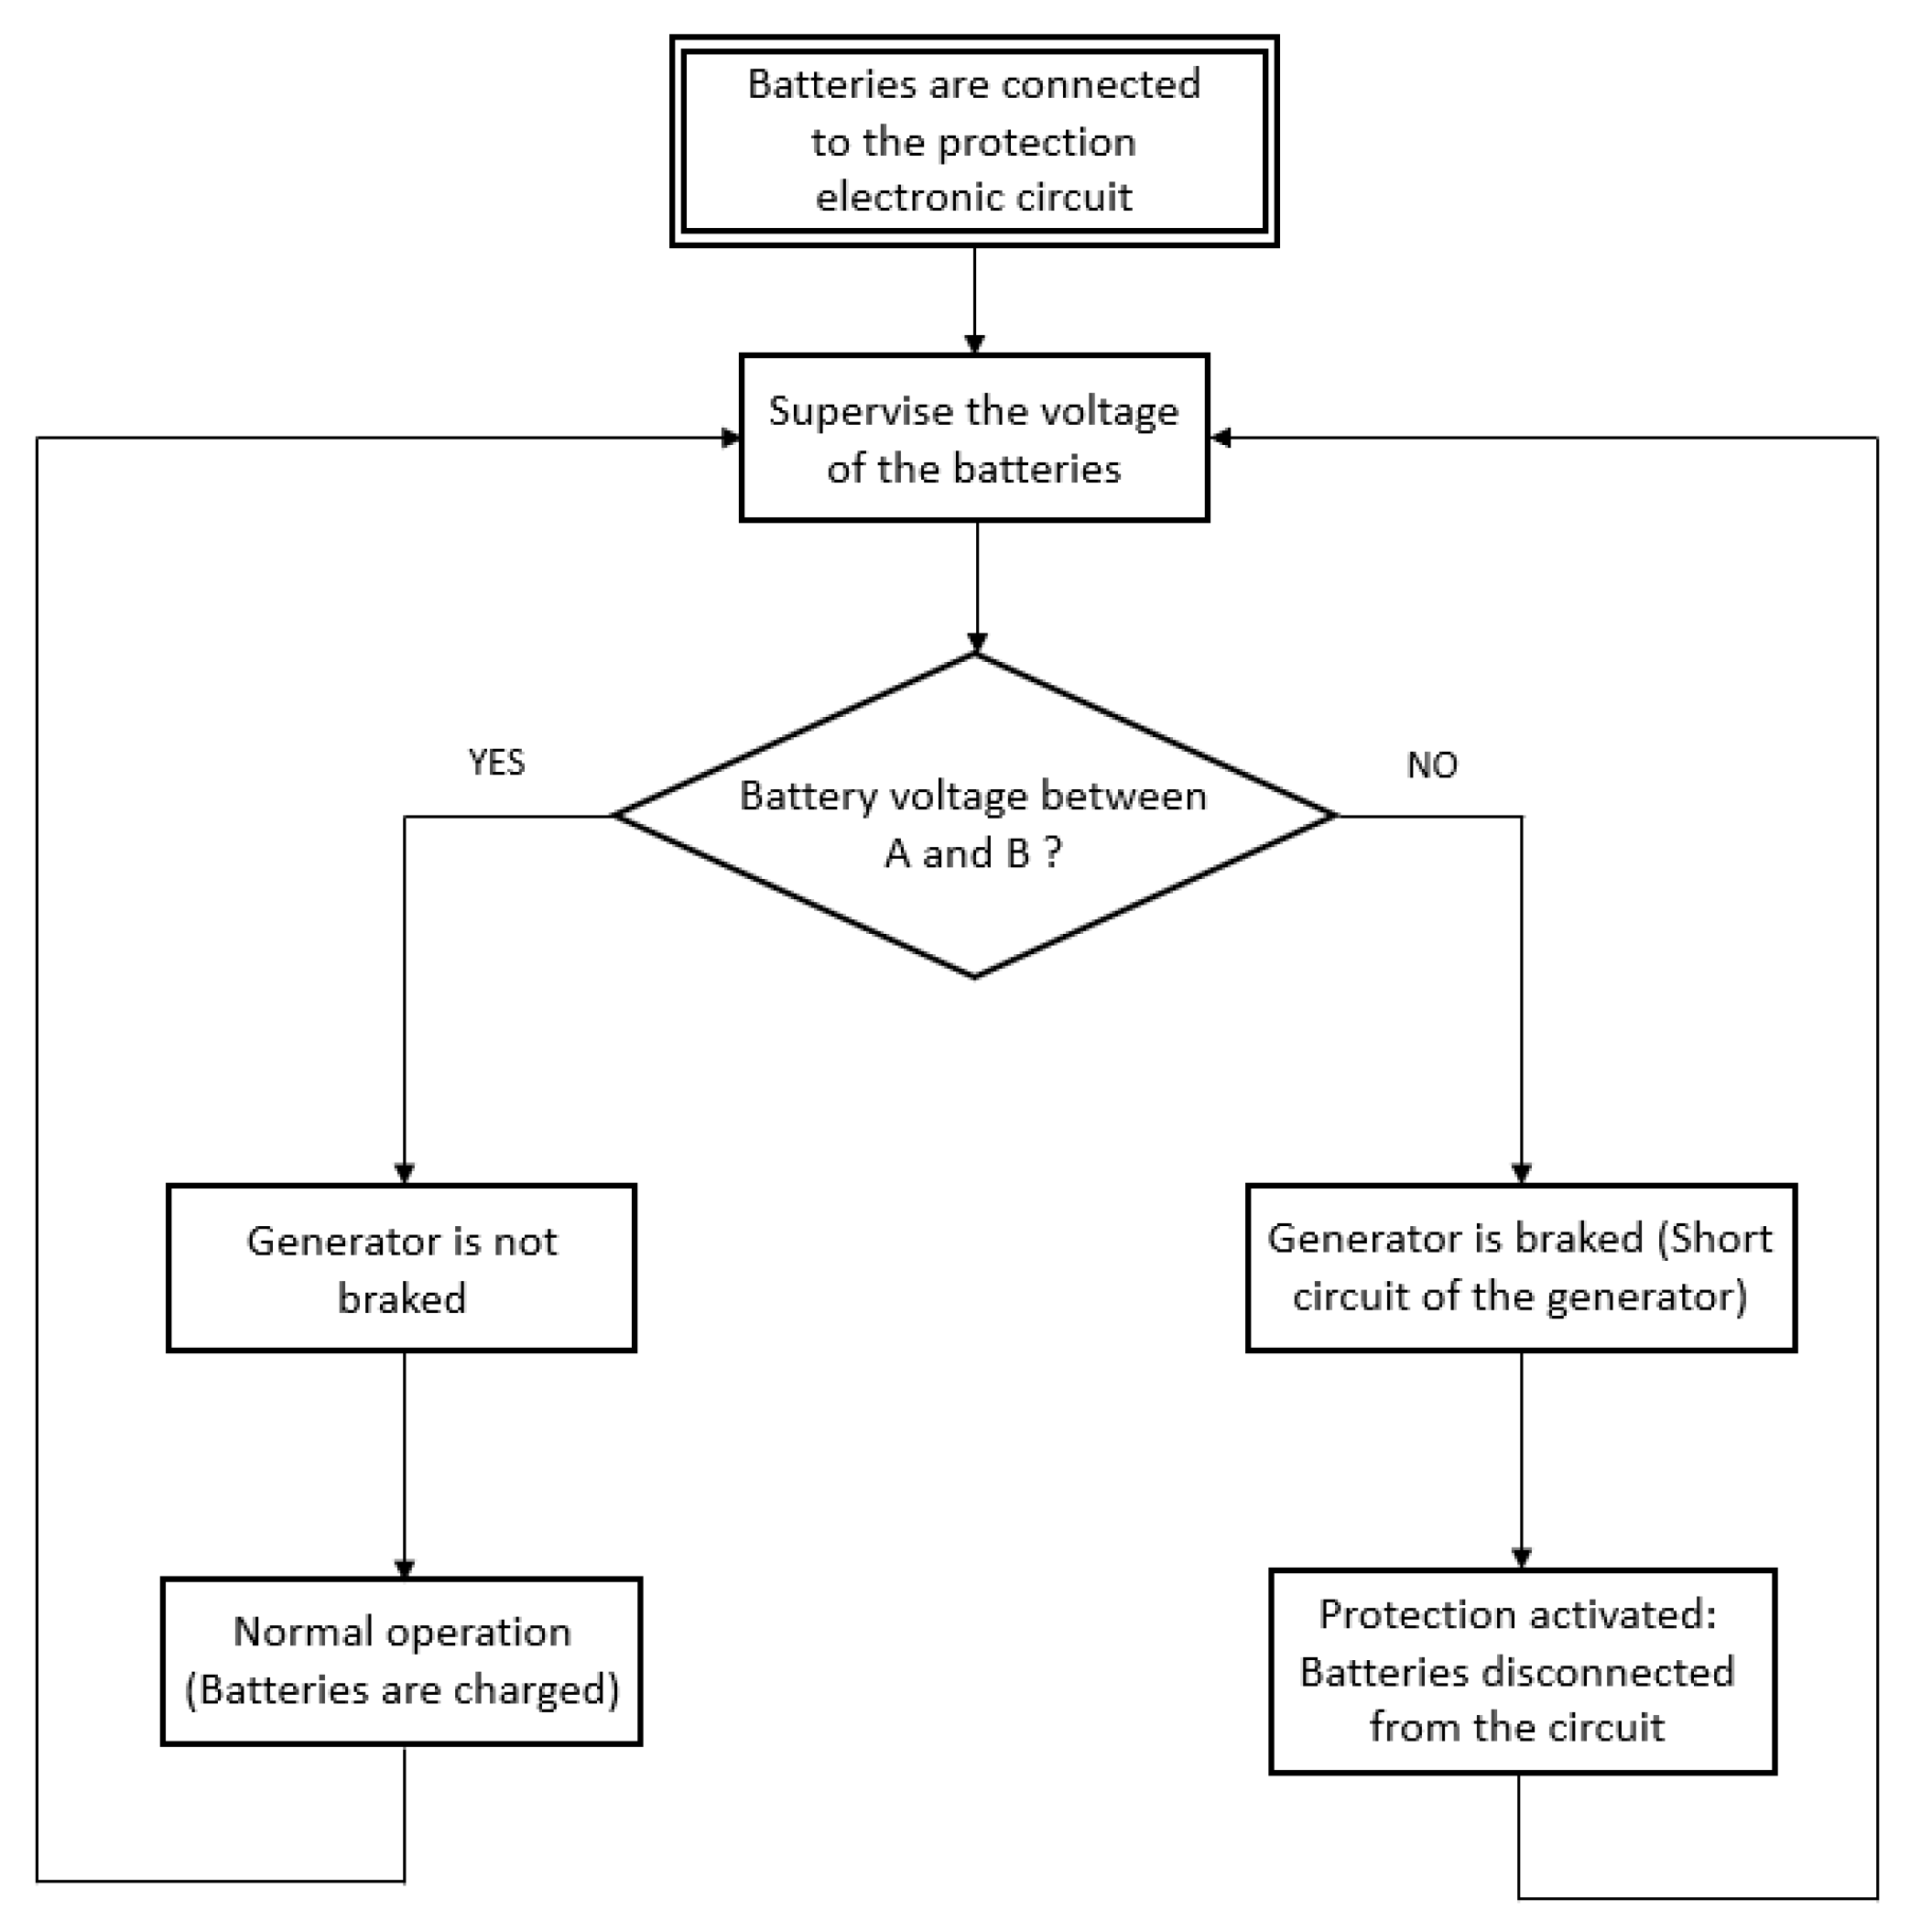
5. Protection Electronic Circuit

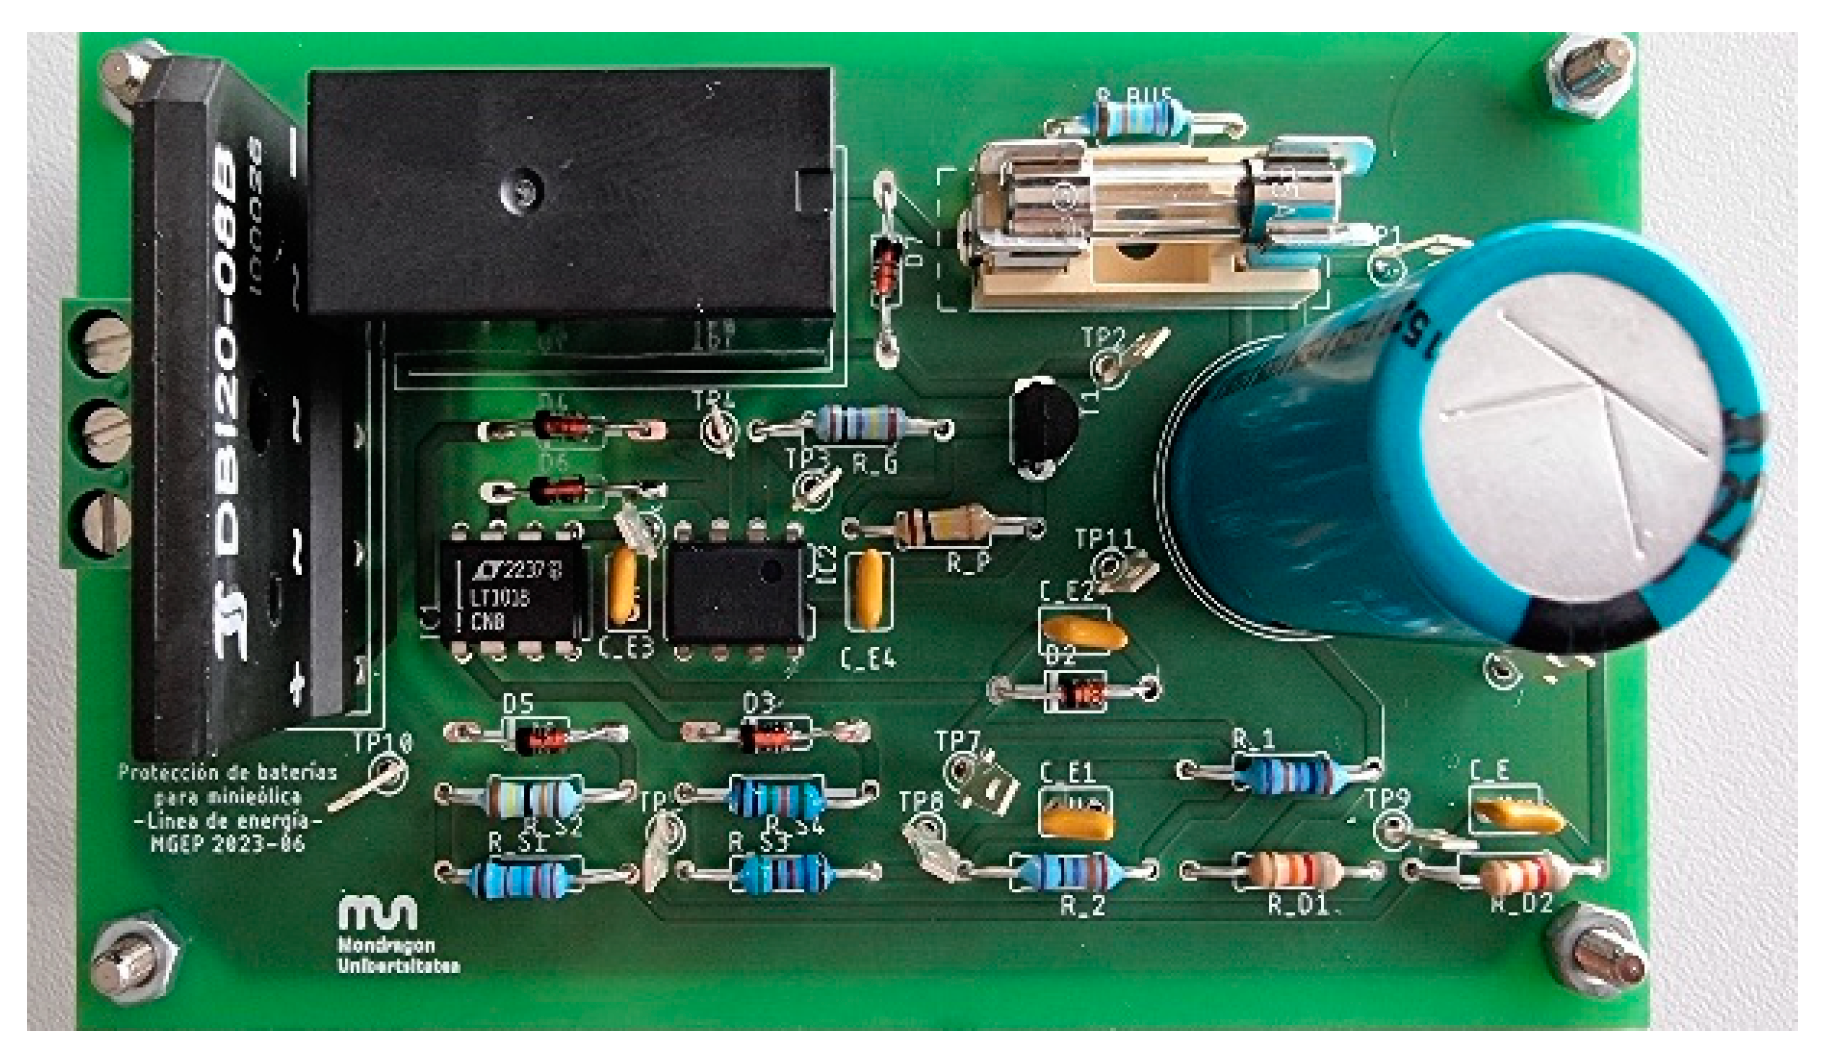
5.1. Description of the Circuit

This section presents the protection electronic circuit designed for the wind turbine. The state flow diagram showing the main functionalities of the protection electronic circuit is shown in Figure 21. Its main function consists of supervising the voltage level of the battery connected to the wind turbine. Thus, if this voltage level it outside the correct voltage range operation, the circuit disconnects the batteries from the wind turbine’s generator by means of a relay (the AC/DC rectifier is between the generator and the batteries). Once the generator is disconnected from the batteries, the generator is short-circuited in order to brake the wind turbine and avoid mechanical problems due to rotational over-speeds. This fact is schematically represented in the state flow diagram in Figure 21.
In order to obtain the above-mentioned functionalities, the electronic circuit shown in Figure 22 has been designed. It can be understood as a composition of several sub-electronic circuits: the comparator window, the Schmid trigger, the relay governance, the relay, and the bus capacitor. In the following, each sub-circuit is described.
It is worth noting that the circuit has been designed so that it is versatile, having the possibility to be connected to batteries of 12 V, 24 V, and 36 V. To adapt the board to each battery, some components must be changed. The values of the components are provided in Table 6. In the subsequent section, the board that works with a voltage of 12 V is shown.

5.1.1. Comparator Window

The comparator window (Figure 22) is the one that compares the actual voltage of the batteries with the pre-fixed voltage levels A and B. It determines whether the batteries must be disconnected or not. The voltage levels are defined by a resistive divider (Figure 22 elements; Rd1 and Rd2) and a Zener branch (Figure 22 elements; R1, R2, and Zener).
The resistive divider is set so that in its medium point, half of the bus voltage appears. The Zener branch has two resistors and one Zener. The Zener has half the minimum voltage value than the batteries (Figure 22 element; Batt) can withstand, which is going to be directly connected to the inverting input of the bottom operational amplifier (Figure 22, O2). As the Zener has a constant voltage (the other two resistors are set so that the Zener is polarized), it defines what is the minimum voltage the batteries can have. The voltage set in the non-inverting input is the one that the resistive divider has. The operational amplifier compares between these two voltages and swings its output to the bus voltage when the divider’s voltage is greater than that of the Zener (Figure 22, path Z). If the Zener voltage is greater than the divider´s voltage, the operational amplifier swings its output to the ground (Figure 22, path W).
The other operational amplifier works in a similar way (Figure 22, O1); it compares the voltage levels settled in the inverting and non-inverting inputs and swings its output to the bus voltage or to the ground depending on them (Figure 21, paths X and Y, being X for the bus voltage and Y for the ground). Through this operational amplifier, the maximum voltage level of the battery is defined. The voltage introduced to the inverting input is the one from the resistive divider (Figure 22 elements; Rd1 and Rd2) and the one introduced to the non-inverting input is the one between the two resistors of the Zener’s branch (Figure 22 elements; R1, R2, and Zener). These two resistors are dimensioned so that when the maximum battery voltage is achieved, the voltage between both resistors becomes smaller than the voltage in the resistive divider, making the operational amplifier swing to ground (Figure 22, path Y). If the bus voltage is smaller than the maximum battery voltage, the output of the operational amplifier swings to the voltage of the bus (Figure 22, path X).
Focusing on the output of both comparators, there are two bus diodes and a resistor (Figure 22 elements; Dbus1, Dbus2, and Rbus). These diodes are polarized when one of both operational amplifiers swings to ground (these swing to ground when the voltage of the battery is out of the desired range), so the output of the comparator window is nearly 0 V (Figure 22, Po), which is the voltage drop on the diode (it can be seen as a logic 0). When both operational amplifiers swing to the voltage bus (the battery voltage is in the charging range), none of the bus diodes (Figure 22 elements; Dbus1 and Dbus2) are polarized because there is a greater voltage in the cathode than in the anode of the diodes. In conclusion, there is no current flowing through the diodes nor the bus resistor (Figure 22 element; Rbus), so the output of the comparator window is the voltage bus (it can be seen as a logic 1). This voltage value is transmitted to the transistor (Figure 22 element; T1) via an operational amplifier used as a buffer (Figure 22 element; O3) in order to disengage impedances from the transistor (Figure 22 element; T1) and the comparator window, and thereby the comparator window´s performance is not affected by the transistor.

5.1.2. Schmitt Trigger

It is worth noting that the comparations are not perfect; a battery (Figure 22 element; Batt) is being charged (it is sinking current), so when it is disconnected from the generator (Figure 22 element; Generator), the voltage drop that was being added due to the ESR (equivalent series resistance) of the battery becomes 0 V. Therefore, the battery voltage falls. If no hysteresis is added, the circuit enters a loop where it switches on and off from charging and not charging which can cause damage to the electronic components of the board. To fix this problem, a Schmitt trigger is used to introduce a hysteresis to the comparations (Schmitt trigger 1 composed by elements; Rs1, Rs2, Dsc1, and O2. Schmitt trigger 2 is composed of elements; Rs3, Rs4, Dsc2, and O1). This hysteresis has a bigger value than the voltage drop in the ESR. To introduce this hysteresis, positive feedback is inserted in the operational amplifiers via two resistors and a diode in each comparator.

5.1.3. Relay Governance

The relay governance has been conducted by an NPN transistor (Figure 22 element; T1). The transistor is driven by the signal that comes from the output of the comparator window (Figure 22, Po). The relay governance has been conducted considering the resistance and current that pass through the coil (Figure 22 element; Coil). One of the main objectives of the board, apart from protecting the batteries, is to obtain minimized power losses. In order to be able to do so, the transistor has two states: saturation and off (open). The nominal current of the relay is going to be the saturation current for the transistor. From this current value, the current needed in the base has been calculated and the base resistance value (Figure 22 element; Rg) has been achieved. When off, the transistor is going to hold all the bus voltage. Consequently, the transistor is only going to have losses in saturation state, having minimum power losses.

5.1.4. Relay

The relay has two main functions: brake the generator when the voltage of the batteries is out of range, and disconnect the batteries from the generator when the voltage of the batteries is out of range. In order to achieve this purpose, a two-contact DPDT relay has been used. A normally closed contact (Figure 22 element of the relay; Contact 2 NC) has been used to short-circuit the output of the three-phase rectifier (Figure 22 element; 3phase-rect) in order to brake the generator (Figure 22 element; Generator) when the relay´s coil (Figure 22 element; Coil) is not energized. When the coil is energized, this contact opens and lets the generator spin freely. A normally open contact (Figure 22 element of the relay; Contact 1 NO) has been used to disconnect and connect the batteries (Figure 22 element; Batt) and the analogic circuit from the generator. The contact is located after the three-phase rectifier in series with all the analog circuits and the batteries. When the coil is energized (when a “logic 1” is sent to the transistor), the contact is closed and the batteries are charged until they exceed the voltage limit defined. When this happens, the coil is not energized and the contact is opened, thus not allowing the batteries to charge (they are fully charged or they have lower voltage than the minimum). It is important to mention that there is a diode in inverse polarization with the coil of the relay (Figure 22 element; Dcoil). The purpose of this diode is to conduct the current that was flowing through the coil when the coil switches its state to not energized. This way, the current is discharged through the diode and big voltage spikes are not produced due to the current extinction in the coil.

5.1.5. Bus Capacitor

The main function of the bus capacitor (Figure 22 element; Cdc) is to smooth the voltage ripple so that the voltage is as constant as possible. This is very important because the smoother the voltage, the better it is for the battery’s useful life. The rectified voltage is not as constant as desired, so the capacitor is the one which smoothens it. It must be highlighted that the internal capacitance of the battery also helps with making the voltage as constant as possible.

5.1.6. Over-Current Protection

The protection circuit also prevents damages to the system due to over-currents. When, for instance, the turbine is in normal operation and the wind becomes very high afterwards, the power generated and the current will become very high as well. If this DC current goes beyond the pre-defined limit, the fuse will be blown and the DC voltage of the board will go outside its upper limit (the rotation speed and therefore the DC voltage increases, since if the battery is disconnected, there is no torque in opposition to the wind created torque). Then, when this happens, the protection circuit will brake the generator.
The fuse can be replaced by a normally closed (NC) bimetallic thermal protector, coupled to the generator or to the rectifier. This bimetallic thermal protector (for instance model KSD301 from Sunshine manufacturer (Langir® Electric Co., Ltd., Shanghai, China) or KSD9700 from BE-TOOL manufacturer, BE-TOOL, Shenzhen, China) is normally more expensive than the fuses and can open the circuit when the wind speeds are very high (because the temperature of the generator is very high for instance, because its current is very high). Then, it will close the circuit again when the temperature is below the limit, after several seconds or minutes. Compared to the fuse, this thermal protector does not need to be replaced by the user, but as commented before, it is more expensive than the fuses.

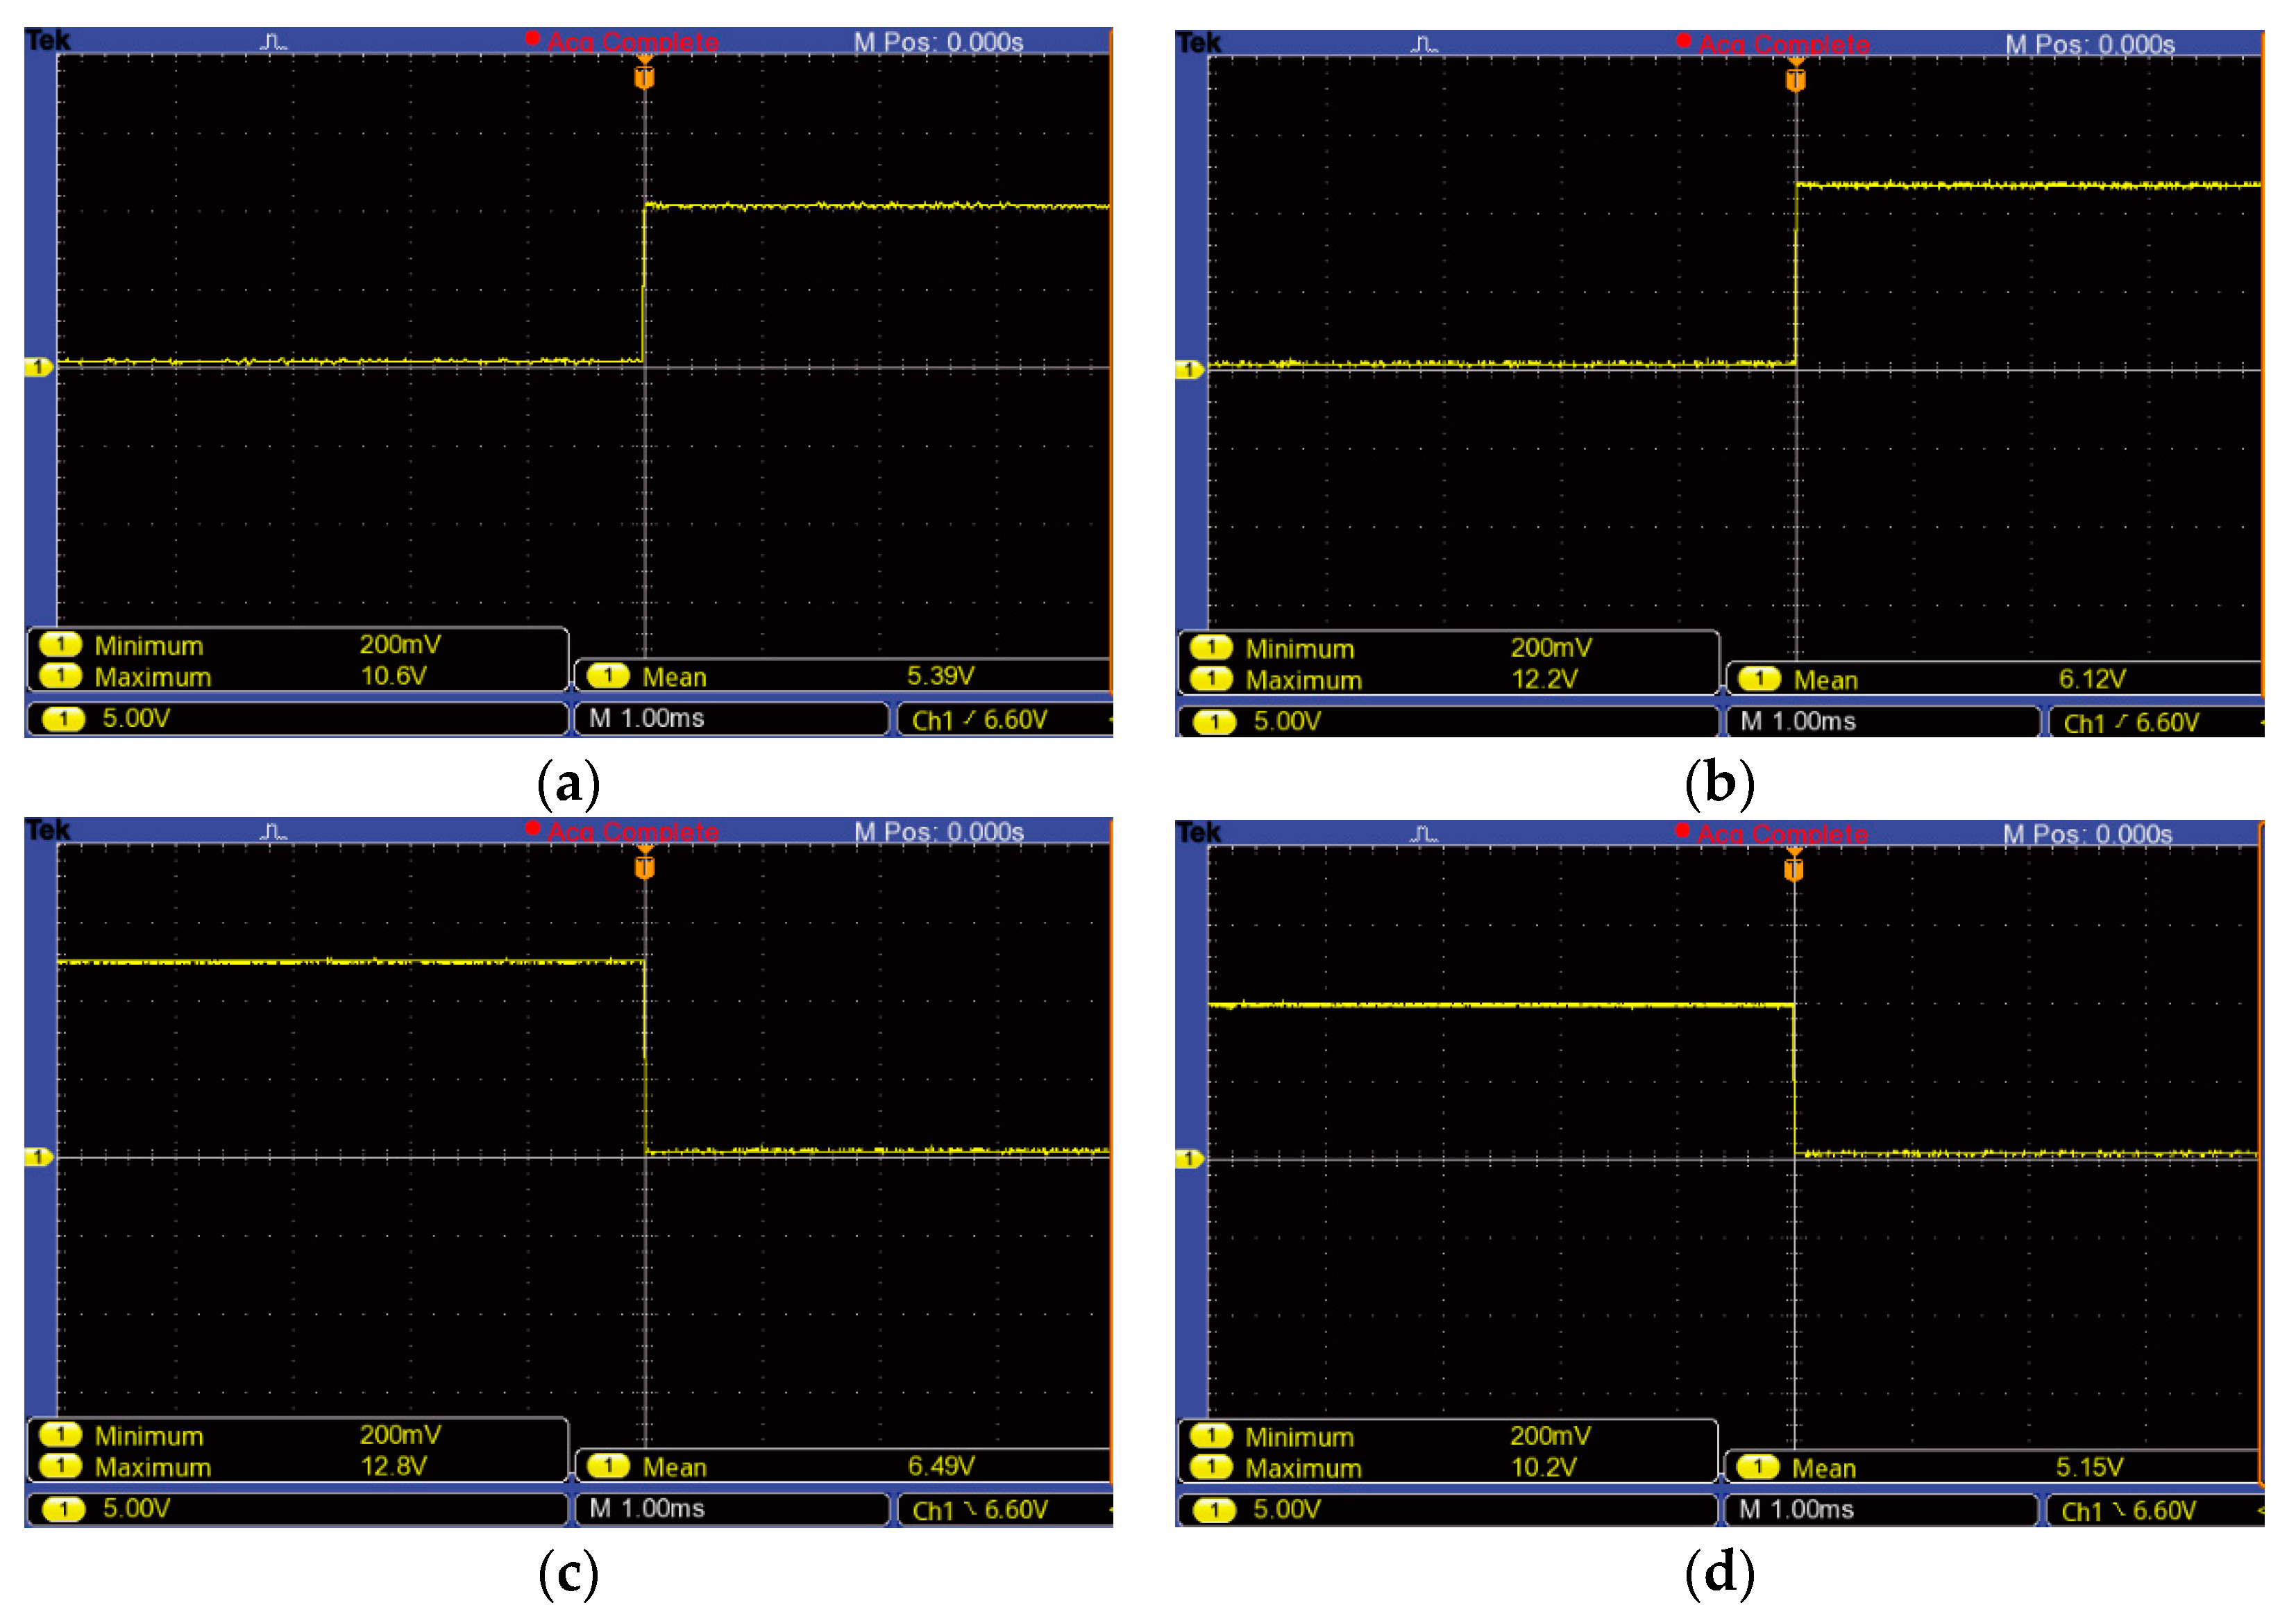
5.2. Experimental Validation

The PCB circuit designed for the validation of the proposed circuit is shown in Figure 23. The PCB has been designed with Eagle software 9.6.2. It contains two layers, and its dimensions are approximately 10.7 cm × 6.45 cm.
For validation of the proposed circuit, a programable DC source has been connected to the entrance of the three-phase rectifier, and batteries have been connected to the output of the PCB. Via the programmable DC source, the voltage created by the generator has been simulated to charge the battery. It is important to mention that as the DC source does not have three phases, it has been tested in different line inputs of the three-phase rectifier in order to ensure this works well. The voltage sent by the source has been changed while the validation was made so that different currents were injected to the batteries. During the validation, an estimation of the ESR (equivalent series resistance) of the battery has been obtained, making It easier to define what the hysteresis had to be in order for the PCB to work well. Despite being a versatile design, in this case it has been used to protect 12 V batteries. The tilt values (A = 10.2 V and B = 12.8 V) have been defined with the Zener branch, the resistive divider, and Schmitt triggers.
In Figure 24, all the tilt points are shown. It is noticeable that there are four tilt points due to the hysteresis introduced by the Schmitt triggers. Consequently, when changing from On to Off and vice versa, there would be noise that would contaminate the tilting. The two tilt points are related to passing from On state to Off state in different voltage levels, while the other two tilt points are related to passing from Off state to On state in different voltage levels.
Considering all that has been described, it can be said that the board works in a correct way. It protects the batteries from low voltage levels and from high voltage levels. It also protects the batteries from overcurrent due to the fuse that is used. It is very compact and reliable due to the number of passive components it presents.
Finally, Table 7 shows an approximated estimation of power losses and cost for each protection board. It is important to mention that the data about the power losses and the cost are approximated values. These are not measured values obtained at the boards.

6. Conclusions

In relation to the wind turbine characterization carried out in this article, the improvement obtained with the use of the tube inspired by the patent of Ayanz is more than remarkable. An increase between 70% and 90% in the power generated has been observed due to the use of the tube. In addition, it should be noted that the use of the tube reduces the visual impact, and the use of the bird protection mesh minimizes the possibility of bird deaths. It can also be seen that the mesh does not reduce the power generated, nor is it a drawback in the efficiency performance of the wind turbine. The power captured by this wind turbine is remarkably high, achieving quite high Cp values compared to common small wind turbines.
In relation to the low-cost maximum power point tracking (MPPT) strategy, it should be emphasized that the objective of improving the power given to the battery by using a simple passive element has been achieved. By adding an appropriate value of inductance to the AC side, the wind turbine can operate very close to the theoretical maximum power points of the curves. It is true that perhaps it is hard to find an exact inductance value that reaches exactly the maximum power points in all the wind speed ranges, but it could be an interesting solution for turbine designs in which the inversion cost must be minimized. Note that by eliminating the necessity of the DC-DC converter and the microprocessor, the cost and power losses of the electric circuit are considerably reduced. Moreover, less electronic components and simplicity also improves the robustness and reliability of the system, reducing the failure rates.
In relation to the protection electronic circuit proposed, it has been demonstrated that it is a versatile design that can be easily adapted to DC buses of one, two, or three batteries in series (voltages around; 12 V, 24 V, and 36 V). This fact is useful since it means it can be adapted to many wind turbine designs, with many generator designs in terms of voltages. It can be also adapted to many battery chemistries and their safety voltage ranges by changing few resistance values of the circuit. It has been especially designed to optimize the cost and power losses, having achieved an approximated cost of 20–30 euros (components bought one by one in standard providers) and losses around 1 W. Experimental validations have demonstrated its correct operation.

Author Contributions

Conceptualization, G.A.; Methodology, A.E.; Validation, A.A. and A.P.; Formal analysis, O.F.; Writing—original draft, K.G.; Writing—review & editing, D.C.R. All authors have read and agreed to the published version of the manuscript.

Funding

This research received no external funding.

Data Availability Statement

Data Availability Statements are available in section “MDPI Research Data Policies” at https://www.mdpi.com/ethics.

Conflicts of Interest

The authors declare no conflict of interest.

Nomenclature

λ:tip speed ratio
Vw:Wind speed [m/s]
Cp:Power coefficient
ρ:Density of air (1.225 kg/m2)
ωmec:Rotational speed of the wind turbine [rad/s]
R’:Internal phase resistance of the generator [Ω]
L’:Internal phase inductance of the generator [H]
ϕ p m :Flux created by the magnets at the rotor of the generator [Wb]
Z:Impedance for the low cost MPPT
R:Phase resistance of the impedance for the low cost MPPT [Ω]
L:Phase inductance of the impedance for the low cost MPPT [H]
C:Phase capacitance of the impedance for the low cost MPPT [H]
Vbus:DC voltage of the protection circuit [V]
Vbat: DC voltage of the battery [V]. When correct operation Vbat = Vbus.
A:Lower voltage limit for safe operation of the batteries [V].
B:Upper voltage limit for safe operation of the batteries [V].

References

  1. El Periódico de la Energía. España Duplica el Autoconsumo Solar: Instala más de 2.500 MW en 2022. 23 January 2023. Available online: https://elperiodicodelaenergia.com/espana-duplica-autoconsumo-solar-espana-instala-2-500-mw-2022/ (accessed on 22 August 2023).
  2. Cuenca, J.J.; Jamil, E.; Hayes, B. State of the Art in Energy Communities and Sharing Economy Concepts in the Electricity Sector. IEEE Trans. Ind. Appl. 2021, 57, 5737–5746. [Google Scholar] [CrossRef]
  3. Huang, S.; Wang, J.; Fu, Y.; Zuo, W.; Hinkelman, K.; Kaiser, R.M.; He, D.; Vrabie, D. An open-source virtual testbed for a real Net-Zero Energy Community. Sustain. Cities Soc. 2021, 75, 103255. [Google Scholar] [CrossRef]
  4. Salehi, N.; Martínez-García, H.; Velasco-Quesada, G.; Guerrero, J.M. A Comprehensive Review of Control Strategies and Optimization Methods for Individual and Community Microgrids. IEEE Access 2022, 10, 15935–15955. [Google Scholar] [CrossRef]
  5. Maldar, N.R.; Ng, C.Y.; Oguz, E. A review of the optimization studies for Savonius turbine considering hydrokinetic applications. Energy Convers. Manag. 2020, 226, 113495. [Google Scholar] [CrossRef]
  6. Tummala, A.; Velamati, R.K.; Sinha, D.K.; Indraja, V.; Krishna, V.H. A review on small scale wind turbines. Renew. Sustain. Energy Rev. 2016, 56, 1351–1371. [Google Scholar] [CrossRef]
  7. Zagubień, A.; Wolniewicz, K. Energy Efficiency of Small Wind Turbines in an Urbanized Area—Case Studies. Energies 2022, 15, 5287. [Google Scholar] [CrossRef]
  8. Tsichritzis, L.; Nikolopoulou, M. The effect of building height and façade area ratio on pedestrian wind comfort of London. J. Wind Eng. Ind. Aerodyn. 2019, 191, 63–75. [Google Scholar] [CrossRef]
  9. Heikal, H.A.; Abu-Elyazeed, O.S.; Nawar, M.A.; Attai, Y.A.; Mohamed, M.M. On the actual power coefficient by theoretical developing of the diffuser flange of wind-lens turbine. Renew Energy 2018, 125, 295–305. [Google Scholar] [CrossRef]
  10. Sakamoto, L.; Fukui, T.; Morinishi, K. Blade Dimension Optimization and Performance Analysis of the 2-D Ugrinsky Wind Turbine. Energies 2022, 15, 2478. [Google Scholar] [CrossRef]
  11. Rajpar, A.H.; Ali, I.; Eladwi, A.E.; Bashir, M.B.A. Recent Development in the Design of Wind Deflectors for Vertical Axis Wind Turbine: A Review. Energies 2021, 14, 5140. [Google Scholar] [CrossRef]
  12. Abad, G.; Zarketa-Astigarraga, M.P.Y.A. Molinos de Viento Patentados por Jerónimo de Ayanz y Beaumont en el año 1606; un Análisis Conceptual Desde una Perspectiva Ingenieril del Año 2021; Mondragon Unibertsitatea: Mondragón, Spain, 2021. [Google Scholar]
  13. Tapia, N.G. Jerónimo de Ayanz y Beaumont. Un Inventor Navarro (1553–1613); Universidad Pública de Navarra: Pamplona, Spain, 2010. [Google Scholar]
  14. Liam F1 Archimedes AWM-750D-150W Datasheet. (Liam F1 Archimedes). Available online: https://thearchimedes.com/products (accessed on 14 June 2023).
  15. Jang, H.; Kim, D.; Hwang, Y.; Paek, I.; Kim, S.; Baek, J. Analysis of Archimedes Spiral Wind Turbine Performance by Simulation and Field Test. Energies 2019, 12, 4624. [Google Scholar] [CrossRef]
  16. Kim, K.C.; Ji, H.S.; Kim, Y.K.; Lu, Q.; Baek, J.H.; Mieremet, R. Experimental and Numerical Study of the Aerodynamic Characteristics of an Archimedes Spiral Wind Turbine Blade. Energies 2014, 7, 7893–7914. [Google Scholar] [CrossRef]
  17. Refaie, A.G.; Hameed, H.A.; Nawar, M.A.; Attai, Y.A.; Mohamed, M.H. Qualitative and quantitative assessments of an Archimedes Spiral Wind Turbine performance augmented by a concentrator. Energy 2021, 231, 121128. [Google Scholar] [CrossRef]
  18. Mustafa, A.T.; Jaleel, H.A. A comparison study between Archimedes spiral turbine and propeller turbine with wind attack angle effect. In AIP Conference Proceedings; AIP Publishing LLC: Melville, NY, USA, 2020; Volume 2213, p. 25. [Google Scholar]
  19. Nepal, U.; Sapkota, S.; Bhattarai, A.; Bashyal, H.P. Design, CFD analysis and modelling of archimedean-spiral type wind turbine. In Proceedings of the IOE Graduate Conference 2019, Lalitpur, Nepal, 23 May 2019. [Google Scholar]
  20. Safdari, A.; Kim, K.C. Aerodynamic and structural evaluation of horizontal Archimedes spiral wind turbine. J. Clean Energy Technol. 2015, 3, 34–38. [Google Scholar] [CrossRef]
  21. Timmer, W.A.; Toet, S. Verslag van de Metingen aan de Archimedes in de Lage-Snelheids Windtunnel van DNW; TU Delft: Delft, The Netherlands, 2009. [Google Scholar]
  22. Phillips, D.G. An Investigation of Diffuser Augmented Wind Turbine Design. Ph.D. Thesis, The University of Auckland, Auckland, New Zealand, 2003. [Google Scholar]
  23. Ghajar, R.F.; Badr, E.A. An experimental study of a collector and diffuser system on a small demonstration wind turbine. Int. J. Mech. Eng. Educ. 2008, 36, 58–68. [Google Scholar] [CrossRef]
  24. Njiri, J.G.; Söffker, D. State-of-the-art in wind turbine control: Trends and challenges. Renew. Sustain. Energy Rev. 2016, 60, 377–393. [Google Scholar] [CrossRef]
  25. Pande, J.; Nasikkar, P.; Kotecha, K.; Varadarajan, V. A Review of Maximum Power Point Tracking Algorithms for Wind Energy Conversion Systems. J. Mar. Sci. Eng. 2021, 9, 1187. [Google Scholar] [CrossRef]
  26. Kumar, D.; Chatterjee, K. A review of conventional and advanced MPPT algorithms for wind energy systems. Renew. Sustain. Energy Rev. 2016, 55, 957–970. [Google Scholar] [CrossRef]
  27. Musunuri, S.; Ginn, H.L. Comprehensive review of wind energy maximum power extraction algorithms. In Proceedings of the 2011 IEEE Power and Energy Society General Meeting, Detroit, MI, USA, 24–28 July 2011. [Google Scholar]
  28. Mousa, H.H.H.; Youssef, A.R.; Mohamed, E.E.M. State of the art perturb and observe MPPT algorithms based wind energy conversion systems: A technology review. Int. J. Electr. Power Energy Syst. 2021, 126, 106598. [Google Scholar] [CrossRef]
  29. Mousa, H.H.; Youssef, A.R.; Mohamed, E.E. Variable step size P&O MPPT algorithm for optimal power extraction of multi-phase PMSG based wind generation system. Int. J. Electr. Power Energy Syst. 2019, 108, 218–231. [Google Scholar]
  30. Watil, A.; El Magri, A.; Raihani, A.; Lajouad, R.; Giri, F. Multi-objective output feedback control strategy for a variable speed wind energy conversion system. Int. J. Electr. Power Energy Syst. 2020, 121, 106081. [Google Scholar] [CrossRef]
  31. Ali, M.M.; Youssef, A.R.; Ali, A.S.; Abdel-Jaber, G.T. Variable step size PO MPPT algorithm using model reference adaptive control for optimal power extraction. Int. Trans. Electr. Energy Syst. 2020, 30, e12151. [Google Scholar] [CrossRef]
  32. Balasundar, C.; Sudharshanan, S.; Elakkiyavendan, R. Design of an Optimal Tip Speed Ratio Control MPPT Algorithm for Standalone WECS. Int. J. Res. Appl. Sci. Eng. Technol. 2015, 3, 5. [Google Scholar]
  33. Nagarajan, K. A Predictive hill climbing algorithm for real valued multi-variable optimization problem like PID tuning. Int. J. Mach. Learn. Comput. 2018, 8, 14–19. [Google Scholar] [CrossRef]
  34. Meghni, B.; Ouada, M.; Saad, S. A novel improved variable-step-size P&O MPPT method and effective supervisory controller to extend optimal energy management in hybrid wind turbine. Electr. Eng. 2020, 102, 763–778. [Google Scholar]
  35. Agirre, A.; Costa, J.J.; Ezkurdia, M.; Gezala, H.; Askasibar, O.; Agirre, X.; Cabezuelo, D.; Abad, G. Experimental characterization of the Ayanz vertical axis windmill in mini wind applications and contributions in the simplification of the associated electronics. Dyna 2023, 98, 240–246. [Google Scholar] [CrossRef]
  36. Bose, B.K. Power Electronics and Motor Drives; Elsevier: Amsterdam, The Netherlands, 2006. [Google Scholar]
  37. Rosato, M.A. Small Wind Turbines for Electricity and Irrigation; CRC Press/Taylor & Francis Group: Boca Raton, FL, USA, 2019. [Google Scholar]
  38. Hau, E. Wind Turbines: Fundamentals, Technologies, Applications, Economics; Springer: Berlin/Heidelberg, Germany, 2005. [Google Scholar]
Figure 1. (a) Drawing of the patent from year 1606 showing the Ayanz Wind Turbine with screw blades, including the enclosure to channel the wind and the mechanism to rotate to wind direction. (b) Liam F1 AMW-750D-150W commercial wind turbine model used as screw-blade-based wind turbine.
Energies 16 06204 g001
Figure 2. Modifications made to an Archimedes Spiral Wind Turbine by inclusion of a tube of aluminum, i.e., The Ayanz Wind Turbine based on screw blades.
Energies 16 06204 g002
Figure 3. (a) Archimedes Spiral Wind Turbine based on the commercial product Liam F1 AMW-750D-150W, (b) The same wind turbine to which a tube has been added, i.e., the Ayanz Wind Turbine based on screw blades.
Energies 16 06204 g003
Figure 4. (a) Wind Maker VPA 1400SP of the manufacturer NLH Industrie, (b) Geometrical characteristics of the wind maker.
Energies 16 06204 g004
Figure 5. (a) Wind measurement points taken just in the front area of the turbine (in red); (b) Wind measurements (in red points) at the wind turbine’s input without tube; (c) Wind measurements (in red points) at the wind turbine’s input with tube.
Energies 16 06204 g005
Figure 6. Electric power circuit implemented for characterization of the wind turbine.
Energies 16 06204 g006
Figure 7. Wind turbine without tube; (a) Measured power Pt, in function of ωmec, (b) Measured Cp, in function of λ (= Radio·ωmec/Vwind) based on Equation (1).
Energies 16 06204 g007
Figure 8. Assembling with a reconfigurable plastic green tube to test the most appropriate longitude and diameter of the tube in terms of power generation.
Energies 16 06204 g008
Figure 9. Wind turbine with tube: (a) Measured power Pt, in function of ωmec; (b) Measured Cp, in function of λ (= Radio·ωmec/Vwind) based on Equation (1).
Energies 16 06204 g009
Figure 10. A vision of the electrical power losses at the tested wind turbine with tube: Power measured at the DC side or resistance and the power at the shaft (Pmec) at the maximum power point of each curve presented in the previous Figure 9a.
Energies 16 06204 g010
Figure 11. (a) Modifications made to the Ayanz Wind Turbine based on the spiral wind turbine; (b) Final prototype (A second mesh can be also placed at the output of the tube).
Energies 16 06204 g011
Figure 12. Approximated Cp = f(λ) of the most common small wind turbines. The Cp and λ values do not pretend to be precise, since they strongly depend on how these turbines are manufactured. These values are extracted from [35,36,37,38] and experimental tests carried out by the authors of this article (all turbines tested).
Energies 16 06204 g012
Figure 13. Typical DC-DC controlled converter and microprocessor based MPPT for wind turbines and proposed simplified configuration (low-cost configuration).
Energies 16 06204 g013
Figure 14. Typical MPPT curve based on a DC-DC converter and microprocessor and the achieved approximated curve using the proposed simplified configuration (low-cost configuration).
Energies 16 06204 g014
Figure 15. (a) Power electronic circuit employed for choosing the most appropriate DC side voltage; (b) Obtained results with the Spiral Blades Wind turbine with the tube at different DC voltages.
Energies 16 06204 g015
Figure 16. Computer-simulation-based analysis of the Spiral Blades Wind turbine with a tube. (a) Power electronic circuit employed for choosing the most appropriate AC side impedance Z (three series-connected batteries are employed, providing 40 V of total voltage). (b) Obtained power increase with different capacitive impedances. (c) Obtained power increase with different inductive impedances.
Energies 16 06204 g016
Figure 17. Computer based simulation analysis (model of Figure 16a) showing the improvement obtained with a chosen AC side inductance of 0.32 H at 40 V of DC side voltage.
Energies 16 06204 g017
Figure 18. (a) Simplified single phase equivalent electric circuit. (b) Space vector diagram of the fundamental components of the voltage and currents.
Energies 16 06204 g018
Figure 19. Space vector diagrams at different wind conditions. In red i, in blue VEMF, and in green Vinv. On the left of each sub-figure are the space vector diagrams corresponding to the circuit without AC side inductance, while on the right, the circuit is with its optimum inductance at the given wind speed. (a) Vwind = 4.82 m/s and L = 0.04 H. (b) Vwind = 5.49 m/s and L = 0.54 H. (c) Vwind = 6.15 m/s and L = 0.36 H. (d) Vwind = 6.82 m/s and L = 0.16 H.
Energies 16 06204 g019
Figure 20. Experimental results with the proposed low-cost MPPT strategy for the spiral-blades-based wind turbine with the tube. Blue: Ideal MPPT. Red: Low-cost MPPT with L = 38 mH. Yellow: Low-cost MPPT with L = 600 μH. Purple: Without L.
Energies 16 06204 g020
Figure 21. State flow diagram showing the main functionalities of the protection electronic circuit. A and B voltage levels depend on the nature of the batteries employed. For 12 V batteries, A = 10.2 V and B = 12.8 V, for 24 V batteries, A = 23.8 V and B = 26.7 V, and for 36 V batteries, A = 35.4 V and B = 39.2 V.
Energies 16 06204 g021
Figure 22. Schematic of the electronic protection circuit.
Energies 16 06204 g022
Figure 23. Final circuit of the protection system.
Energies 16 06204 g023
Figure 24. Tilt points for the 12 V board: (a) Tilt from Off to On when the batteries pass from low voltage to charging range. (b) Tilt from Off to On when the batteries pass from high voltage to charging range. (c) Tilt from On to Off when the batteries pass from charging range to high voltage. (d) Tilt from On to Off when the batteries pass from charging range to low voltage.
Energies 16 06204 g024
Table 1. Geometrical parameters of the commercial wind turbine Liam F1 AMW-750D-150W.
Blades3
Radio37.5 cm
Effective Radio (after removing the central area of the turbine, not affected by the wind)36.2 cm
Longitude60 cm
Table 2. Electric parameters of the generator.
R’ (internal phase resistance of the generator)9.56 Ω
L’ (internal phase inductance of the generator)20.96 mH
ϕ p m (Flux created by the magnets at the rotor)0.2665 Wb
Pole-Pairs of the stator windings6
Table 3. Dimensions of the tube.
Length0.625 m
Diameter0.815 m
Thickness0.003 m
Table 4. Advantages and disadvantages of the Archimedes Spiral Wind Turbine with enclosure (Ayanz Wind Turbine based on screw blades), in contrast to other popular small wind turbines.
SavoniusArchimedes Spiral with Enclosure (Ayanz Wind Turbine Based on Screw Blades)Darrieus
(and Variants)
Tri-Bladed Horizontal Axis
Cp max−−+++
Start up and operation at low wind speeds++
Rotation speeds+++−−
Noise reduction (due to rotation speeds)++−−
Mechanical stress reduction
(due to rotation speeds)
++−−
Capacity to operate at variable winds
(gusty winds)
+++
Capacity to orientate to winds that change directions regularly (stormy days)++++
Easy to construct+
Prevention of bird deaths and safety in case of destructive failure++
Minimizes the fact of watching the blades rotating++
Table 5. Harmonic current distortion with and without inductance at different wind speeds (see Figure 5a,b to correlate with rotation speed in Hz of the wind maker).
Speed Reference to the Wind MakerTHD (Total Harmonic Distortion)
20 Hz22.5 Hz25 Hz27.5 Hz
With L20.85%13.73%9%6.55%
Without L69.10%47.67%39.23%33.74%
Table 6. References and component values for all three protecting boards (this is only an illustrative example since there can be many options for each component’s reference and numerical values).
COMPONENTS12 V Board24 V Board36 V Board
Rd156 KΩ56 KΩ82 KΩ
Rd256 KΩ56 KΩ82 KΩ
Three-phase rectifier DBI20-08BDBI20-08BDBI20-08B
Cest1, Cest2, and Cest3100 nF100 nF100 nF
R1600 Ω1.8 KΩ2.67 KΩ
R2120 Ω18 2Ω237 Ω
Zener5.1 V12 V18 V
Rs16.8 KΩ22 KΩ22.6 K Ω
Rs2390 KΩ × 2
(2 in series configuration)
820 KΩ1.3 MΩ
Rs31 KΩ1.5 KΩ1.62 KΩ
Rs42.7 KΩ × 2
(2 in parallel
configuration)
62 KΩ105 KΩ
Dsc1, Dsc21N41481N41481N4148
Dbus1 and Dbus21N41481N41481N4148
Rbus56 KΩ120 KΩ174 KΩ
O1 and 02 (same chip with both comparators)TLC3702CPLM393PLT1018CN8#PBF
O3TLC271CpTL082IPTL082IP
Rg120 KΩ470 KΩ1.07 MΩ
Rp100 KΩ100 KΩ100 KΩ
T1BC 337-40BC 337-40BC 337-40
Dcoil1N41481N41481N4148
Fuse0217005.MXP0217005.MXP0217005.MXP
Fuse holderMC000827MC000827MC000827
Relay12 V
HF140FF/012-2ZTF
24 V
800-4454
36 V
653-G2R-24-DC3
Cdc2200 µF2200 µF2200 µF
Table 7. Approximated power losses and cost for each protection board.
12 V Board24 V Board36 V Board
b1.0339 W0.8055 W0.866 W
Approximated cost18.873 €20.022 €30.2231 €
Disclaimer/Publisher’s Note: The statements, opinions and data contained in all publications are solely those of the individual author(s) and contributor(s) and not of MDPI and/or the editor(s). MDPI and/or the editor(s) disclaim responsibility for any injury to people or property resulting from any ideas, methods, instructions or products referred to in the content.

